ecosystem-based fisheries resources assessment and
TRANSCRIPT

Ecosystem-based fisheries resources
assessment and management system
in Jeonnam marine ranching in Korea
Hee Won Park and Chang-Ik Zhang
Pukyong National University
29.Oct.2008 PICES 17th annual meeting, Dalian, China

Current fisheries management in Korea waters
TAC-based management for 10 species
Resource rebuilding activities by artificial reefs
Releasing fries and juveniles, seaweed beds
Buy-back program to reduce fishing vessels
MPAs
Marine ranching program
Self-regulatory fisheries management

- Apply to marine ranching ecosystems (Lee, 2007)- Apply to Korean waters (East/Japan sea, Yellow sea)
Ecosystem based fisheries approach in Korea
Ecosystem modeling
Ecosystem-based integrated fisheries assessment approach
• Ecological Risk Assessment
- Analysis for Large purse seine fishery (Park, 2007; Kwon,2007)
• Ecosystem-based fisheries assessment and management
- Marine ranching
- Stock rebuilding
- TAC fisheries
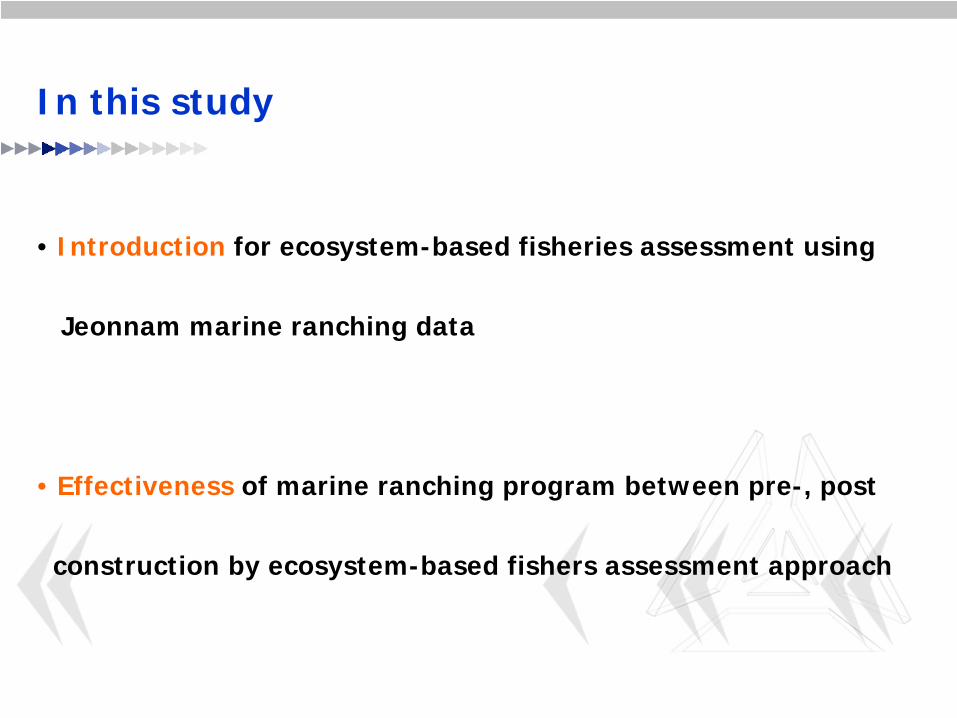
• Introduction for ecosystem-based fisheries assessment using
Jeonnam marine ranching data
• Effectiveness of marine ranching program between pre-, post
construction by ecosystem-based fishers assessment approach
In this study

Jeonnam Marine ranching program
• Location
- Western part of East-China Sea
• Study periods
- 2002~2008 (7 years)
• Areas
- Total area : 203Km2
- Marine ranching area : 151km2
• Target species
- Black seabream, Rock bream, Black rockfish

Data and Methods
• Using data
- MOMAF, Study on the foundation-laying of Jeonnam archipelago
marine ranching program in Korea (2003-2007)
• Comparing Periods
- 2003 : Pre-construction of Jeonnam marine ranching
- 2007 : Post-construction of Jeonnam marine ranching
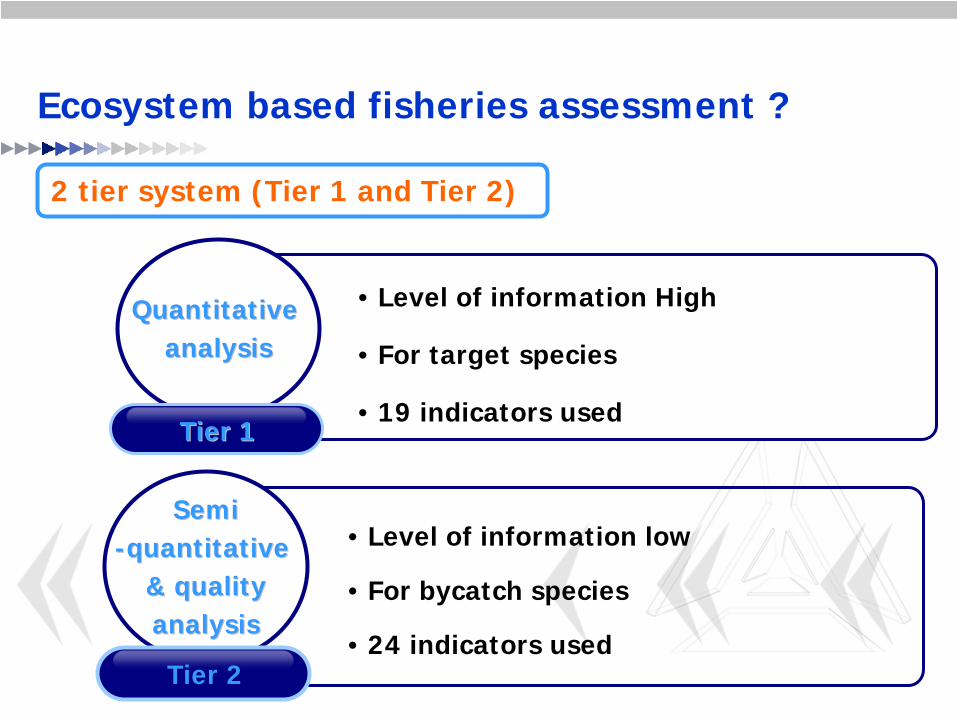
Quantitative Quantitative analysisanalysis
• Level of information High
• For target species
• 19 indicators usedTier 1Tier 1
SemiSemi--quantitative quantitative
& quality& qualityanalysisanalysis
• Level of information low
• For bycatch species
• 24 indicators used Tier 2
2 tier system (Tier 1 and Tier 2)
Ecosystem based fisheries assessment ?

Risk Indices
Ii : Score of indicator i Wi : Weighting factor of indicator in : Number of indicators
HHBBSS ORIORIORISRI λ+λ+λ=
Bi : Biomass or biomass index of species i∑∑=
i
ii
BSRIB
FRI
∑
∑
=
== n
ii
n
iii
W
WIORI
1
0
ORI (Objectives risk index)
SRI (Species risk index)
FRI (Fisheries risk index)

100×−
= +
t
ittF FRI
FRIFRIMI
100×−
= +
t
ittS SRI
SRISRIMI100×−
= +
t
ittO ORI
ORIORIMI
MI (Management status improvement Index)
Risk Indices

Limit RPTarget RP0 0~2 2
Green zone Yellow zone Red zone
Calculation for risk scores
Reference points (RP), Risk, Management
1. Xtarget > Xlimit case (e.g., biomass)
- If Xlimit ≤
X <
Xtarget ,
, where RSmax = 2 )XX
XX(RSRS
limittarget
targetmaxx −
−=

IndicatorReference points
Target (0) Limit (0~2) Beyond limit (2)
Biomass (B) B≥
B40% B40% >B≥B35% B <B35%
or CPUE (U) U≥
UABC UABC >U≥Ulimit1 U <Ulimit
Fishing mortality (F) F ≤
F40% (or F0.1 ) F40% (or F0.1 ) < F ≤
FMSY F>FMSY
or Catch (C) C ≤
ABC ABC < C ≤
MSY C>MSY
Age at first capture (t) t≥
ttarget ttarget >t≥tlimit2 t <tlimit
Habitat size (H) H≥
Htarget Htarget >H≥Hlimit3 H <Hlimit
FIB index FIB≥
FIBtarget FIBtarget >FIB≥FIBlimit4 FIB <FIBlimit
FRP index FRP≥
FRPtarget FRPtarget >FRP≥FRPlimit5 FRP<FRPlimit
Total production of ecosystem (P) P≥
Ptarget Ptarget >P≥Plimit6 P<Plimit
Indicator and reference points
Tier 1_ Sustainability
))/1(log())/1(log( 00TLTL
i TEYTEYFIB i ⋅−⋅=FIB (Fish is balance) (Pauly et al., 2000)
)fq
MRY()
ifqiMRiY
(FRP0
00loglog⋅
⋅−
⋅
⋅=FRP (Fish Reproduction Potential) (Lee et al,, 2007)
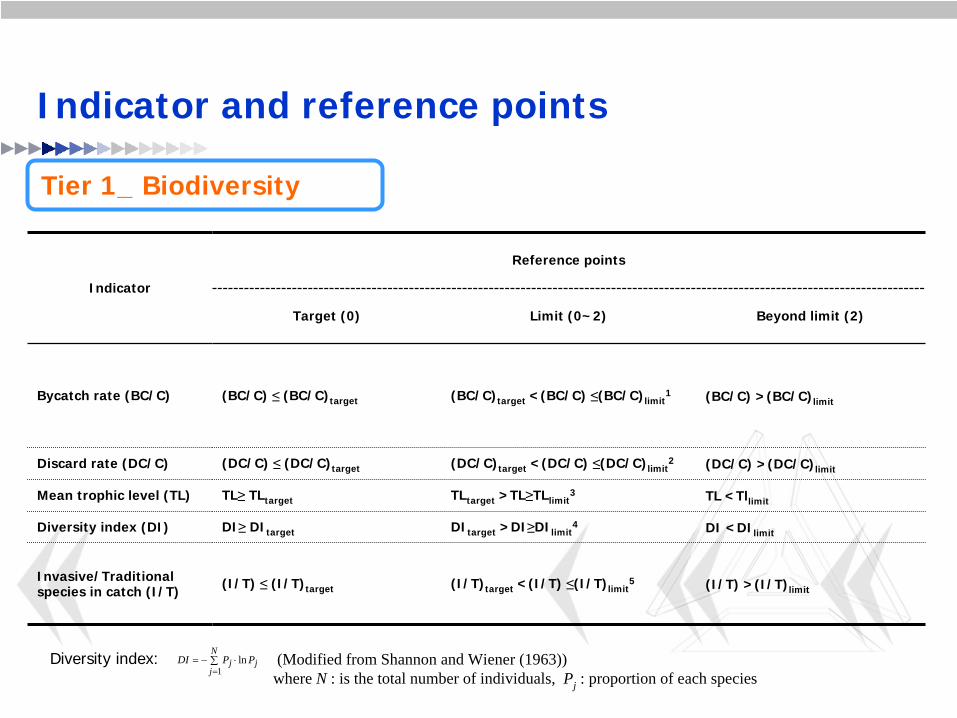
Indicator
Reference points
Target (0) Limit (0~2) Beyond limit (2)
Bycatch rate (BC/C) (BC/C) ≤
(BC/C)target (BC/C)target <(BC/C) ≤(BC/C)limit1 (BC/C) >(BC/C)limit
Discard rate (DC/C) (DC/C) ≤
(DC/C)target (DC/C)target <(DC/C) ≤(DC/C)limit2 (DC/C) >(DC/C)limit
Mean trophic level (TL) TL≥
TLtarget TLtarget >TL≥TLlimit3 TL <Tllimit
Diversity index (DI) DI≥
DItarget DItarget >DI≥DIlimit4 DI <DIlimit
Invasive/Traditional species in catch (I/T) (I/T) ≤
(I/T)target (I/T)target <(I/T) ≤(I/T)limit5 (I/T) >(I/T)limit
Tier 1_ Biodiversity
Indicator and reference points
Diversity index: ∑ ⋅−==
N
jjj PPDI
1ln (Modified from Shannon and Wiener (1963))
where N : is the total number of individuals, Pj : proportion of each species

IndicatorReference points
Target (0) Limit (0~2) Beyond limit (2)
Critical habitat damage rate (DH/H) (DH/H) ≤
(DH/H)target(DH/H)target <(DH/H) ≤(DH/H)limit
1 (DH/H) >(DH/H)limit
Pollution rate of spawning and nursery ground (PG/G) (PG/G) ≤
(PG/G)target(PG/G)target <(PG/G) ≤(PG/G)limit
2 (PG/G) >(PG/G)limit
Lost fishing gear (Frequency, FR) FR ≤
FRtarget FR target < FR ≤
FRlimit3 FR > FR limit
Discarded wastes (DW) DW ≤
DWtarget DW target < DW ≤
DWlimit4 DW > DW limit
Prohibited area from fishing (PA) PA≥
PAtarget PAtarget >PA≥PAlimit5 PA <PAlimit
No. of artificial reefs (N) │N-Ntarget │≤
0.2Ntarget
0.2Ntarget < │N-Ntarget │ ≤0.4Ntarget
│N-Ntarget │>0.4Ntarget
Area of artificial seaweed bed (A)
│A-Atarget │≤
0.2Atarget0.2Atarget < │A-Atarget │ ≤0.4Atarget
│A-Atarget │>0.4Atarget
Tier 1_ Habitats
Indicator and reference points

IndicatorReference points
Target (0) Limit (1) Beyond limit (2)
CPUE CPUE data are available and not declining
CPUE data are available, but declining CPUE data are not available
Precautionary approach and sensitivity of stock assessment
Adequate stock assessment is provided and precautionary approach is adopted
Inadequate stock assessment is provided, but precautionary approach is adopted
Inadequate stock assessment, and precautionary approach is not adopted
Restricted access Fixed access, little latent effort exists (≤30% of licenses inactive)
New entrants can be licensed >30% latent effort in fishery
Open access
Fishery monitoring and sampling Observer program in place, sampling for all fishery data
Monitoring and sampling for a limited number of fisheries Negligible monitoring or sampling
Fishing methodAll fishing methods and patterns are evaluated and changes monitored
Fishing methods and patterns are evaluated for main methods and some geographical areas
Main fishing methods and patterns are not evaluated
Size at entry ≥Size at maturity <Size at maturity, but less than 20% of catch immature
Greater than 20% of the catch immature or size at maturity unknown
Tier 2_ Sustainability
Indicator and reference points

• Target Area
- Jeonnam marine ranching (151Km2)
• Target fishery
- Pole and line fishery
• Target species
- Black sea bream
• Bycatch species (6 species)
- Jacopever rockfish, Black rockfish, Red sea bream, Sea bass,
Yellow tail, Common eel
Application for Jeonnam marine ranching

Results _ Risk score in Jeonnam marine ranchingObjectives Indicator 2003 2007
Sustainability
1. CPUE 2 0
2. Catch 2 0
3. Age at first capture 0 2
4. Habitat size 0 0
5. FIB index 2 0
6. FRP index 2 0
7. Total production of ecosystem 1 0.53
Biodiversity
1. Bycatch rate 1.62 0
2. Discard rate 2 0.09
3. Mean trophic level 0.72 0
4. Diversity index 0.67 0
5. Invasive/Traditional species catch 0 0.55
Habitat
1. Critical habitat damage rate 0 0
2. Pollution rate of spawning and nursery ground 0 0
3. Lost fishing gear 0 0
4. Discarded wastes 0 0
5. Prohibited area from fishing 2 1.22
6. No. of artificial reefs 2 0
7. Area of artificial seaweed bed 2 0

ObjectivesORI (Zone)
MI Significance2003 2007
Sustainability 1.444 0.281 80.58 ***
Biodiversity 1.233 0.105 91.49 *
Habitat 0.667 0.136 79.60 **
SRI 1.114 0.174 84.41 ***
FRI 1.541 0.566 63.23 -
*** denotes a significant difference at α
< 0.001 level
** denotes a significant difference at α
< 0.01 level
* denotes a significant difference at α
< 0.05 level
Results
Tier 1 _ Black sea bream (AcanthopagrusAcanthopagrus schlegeliischlegelii))

Results
Pre-construction (2003) Post-construction (2007)
ORI diagrams_ Tier 1

SpeciesSRI
MI2003 2007
Black rockfish 1.246 0.486 61.01
Red sea bream 1.566 0.803 48.73
Common seabass 1.762 0.877 50.22
Jacoveper rockfish 1.430 0.662 53.68
Yellow tail 1.548 0.818 47.16
Common eel 1.688 0.934 44.68
Result
Tier 2 _ Bycatch species

Results
Pre-construction (2003) Post-construction (2007)
ORI diagrams_ Tier 2

Result of Tier 1(Black seabream)
- Improved sustainability, and SRI at 0.001 critical level
- Improved habitat at 0.01 critical level
- Improved biodiversity at 0.05 critical level
Conclusion
Effectiveness of Jeonnam marine ranching area

Assessment methodology hasn’t verified
- More considering of reference points
- Need to basic study to get information of reference points
Develop the social economic effort
Conclusion