ecosystem dynamics of a microbial biofloc community used...
TRANSCRIPT

Ecosystem Dynamics of a Microbial Biofloc Community Usedto Culture Pacific White Shrimp (Litopenaeus vannamei)
Item Type text; Thesis-Reproduction (electronic)
Authors Holstein, Traci Elizabeth
Publisher The University of Arizona.
Rights Copyright © is held by the author. Digital access to this materialis made possible by the University Libraries, University of Arizona.Further transmission, reproduction or presentation (such aspublic display or performance) of protected items is prohibitedexcept with permission of the author.
Download date 22/05/2018 03:04:40
Link to Item http://hdl.handle.net/10150/620702

ECOSYSTEM DYNAMICS OF A MICROBIAL BIOFLOC COMMUNITY USED TO CULTURE PACIFIC WHITE SHRIMP (Litopenaeus vannamei)
by
Traci Elizabeth Holstein
A Thesis for Dissertation Submitted to the Faculty of the
DEPARTMENT OF BIOCHEMISTRY
In Partial Fulfillment of the Requirements For the Degree of
MASTERS IN SCIENCE WITH A MAJOR IN GENERAL BIOLOGY
In the Graduate College
THE UNIVERSITY OF ARIZONA
2008

STATEMENT BY AUTHOR
This thesis has been submitted in partial fulfillment of requirements for an advanced degree at The University of Arizona and is deposited in the University Library to be made available to borrowers under rules of the Library.
Brief quotations from this thesis are allowable without special permission, provided that accurate acknowledgment of source is made. Requests for permission for extended quotation from or reproduction of this manuscript in whole or in part may be granted by the head of the major department or the Dean of the Graduate College when in his or her judgment the proposed use of the material is in the interests of scholarship. In all other instances, however, permission must be obtained from the author.
SIGNED: 9:2
APPROVAL BY THESIS DIRECTOR
This thesis has been approved
~ z_- / 4 ,-- >
on the date shown below:
Kevin Fitzsimm&ns Professor of Soil, Water, and Environmental Science
Date
2

ACKNOWLEDGMENTS
If it were not for the support of the talented
scientists and staff at the Waddell Mariculture Center in
Bluffton, South Carolina, this research would not have been
possible. I especially would like to thank Dr. Heidi
Atwood for giving me the opportunity to intern at such a
fine facility. Dr. John Leffler and Dr. Craig Brawdy both
were wonderful mentors to whom I owe a great debt. Brad
McAbee and Alisha Lawson worked hard by my side on a daily
basis. Thank you.
Thank you also to my advisor, Dr. Kevin Fitzsinunons
who always allowed me to follow my own path yet faithfully
guided me when needed.
3

DEDICATION
This thesis is dedicated to
Magda Hope Burczynski.
4
5
TABLE OF CONTENTS
LIST OF FIGURES .••..•••••••.•... 6
LIST OF TABLES •• • • • 7
ABSTRACT • . • . .8
INTRODUCTION. • • 9
MATERIALS AND METHODS. • 16
RESULTS. • • 23
DISCUSSION •.•••••.••.•••• • •• 33
APPENDIX A: WADDELL MARICULTURE CENTER .36
APPENDIX B: CALCULATIONS FOR RESPIRATION AND GROSS PRIMARY PRODUCTIVITY. • •••.•••• 37
APPENDIX C: SHRIMP FEED PER WEEK SUMMARY. • • 39
REFERENCES. 40

LIST OF FIGURES
Figure 1.1, The Tank Pad ••.•.••••••.••.• 16 Figure 1.2, YSI Sonde in a tank containing L. vannamei .18 Figure 1.3, YSI Sonde uploading to Ecowatch ..••.• 18 Figure 2.1, Light/Dark bottle "Rotisserie" ..••.•• 20 Figure 3.1, Total RESP of 300/m2 density tanks versus 100/m2 density tanks •.•.••.•.. Figure 3.2, Gross primary productivity over
. .• 24
time in cropped versus uncropped tanks. • . . . •• 25 Figure 3.3, Respiration in 300/m2 and 100/m2 via dark bottles without the presence of L. vannamei • .• Figure 3.4, Shrimp RESP in clean water system .• Figure 3.5, Mean shrimp biomass comparing 300/m2 and 100/m2 treatments. . • .. • • • . . • • Figure 3.6, Box and Whisker Plot of final weight of shrimp in 300/m2 and 100/m2 tanks .•.•••••
• .26 . .27
.. 31
32
6

LIST OF TABLES
Table 1.1, Analysis of Variance Table for RESP .•••• 23 Table 1.2, Analysis of Variance Table for GPP .••••. 24 Table 1.3, Dark bottle respiration data. • • •••• 26 Table 1.4, Shrimp RESP and oxygen demand from clean water system. • • • • • • • • • • •• 28 Table 1.5, Analysis of Variance Table for weight •••• 31
7

ABSTRACT
Microbial biofloc systems are increasingly important to
raising Pacific white shrimp (Litopenaeus vannamei),
because they efficiently remove wastes produced by high
density cultivation and have the potential to provide
supplemental nutrition and oxygen to the shrimp population.
Gross primary productivity (GPP) and community respiration
(RESP) can easily be measured and used to characterize the
dominant processes in a system and how they relate to
shrimp growth, microbial productivity, and survival.
Photoautotrophic, "green water", systems are algal
dominated as evidenced by high daytime GPP. By contrast in
heterotrophic or chemoautotrophic, "brown water", systems,
the respiratory costs exceed the photosynthetic rate even
during daylight hours. RESP can also be used to better
understand the relative contribution of the microbes and
the shrimp to the total oxygen demand of the system.
Finally, clarifiers allow cropping of sludge in hopes of
promoting algal growth and a "green", photoautotrophic
system.
8

INTRODUCTION
Since 1970, aquaculture as a food- producing sector
has grown at an average rate of 8.9% per year. This is
compared to the 1.2% per year growth in the capture
fisheries industry and the 2.8% per year growth in the
terrestrial farmed meat industries (Crab et al. 2007). It
is clear that the aquaculture and mariculture industries
will grow as sources of protein and will continue to do so
as long as technologies improve and farmers' skills
increase. This research specifically targets the
usefulness of the Pacific white shrimp (Litopenaeus
vannamei) as a sustainable mariculture species.
There are many environmental issues associated with
the mariculture industry. Pollutants that may enter the
environment include, and are not limited to uneaten feed,
feces, anunonium, phosphorous, and organic carbon. In fact,
up to 75% of the feed's nitrogen and phosphorous may be
unutilized and in the effluent (Crab et al. 2007). Water
exchange systems can be linked to contributing to several
disease epizootics in shrimp growing areas (Hargreaves,
2006). Because intensive systems accumulate feed residues,
organic matter, and toxic inorganic nitrogen species,
9

biofloc technology has been developed to solve water
quality problems.
The technology of no-water discharge shrimp culture
systems developed at the experimental scale in the 1980's,
and in the 1990's, a commercial farm in Belize was designed
and constructed (Burford et al. 2003). In Belize, lower
protein feed was used because L. vannamei possibly would
obtain supplemental protein from the natural biota or
biofloc. However, little was and still is known about the
role of the natural biota supplying lipids, amino acids,
minerals and vitamins to the shrimp. Uptake by the fish or
invertebrate species depends on the species and its feeding
habits, the species size, the biofloc density and size, and
the presence and rate of the added commercial feed
(Avnimelech, 2007).
The advantages of the zero-water-exchange system with
a healthy microbial community are many. There is a
reduction in pollutant discharge due to a recycling of
waste. The microbe community is thought to increase
competition with pathogens as well as lessening the
introduction of the pathogens. Developing and controlling
a dense heterotrophic microbial floe community can
accelerate the removal of wastes with the resulting biofloc
10
being a source of feed (Leffler, 2007). Consumption of the
flocculated matter can increase nitrogen retention from the
feed by 7%. Solar Aquafarms Inc developed a dense
suspension of phytoplankton, algal detritus, and waste
solids, calling it norganic detrital algae soup" with a
crude protein content of 35-42% in their tilapia ponds
(Hargreaves, 2006). A zero-exchange system biofloc study
found the proportion of daily nitrogen retention of L.
vannamei contributed by the natural biota was 18-29% for 1-
9 gram animals (Burford et al. 2003).
Aeration is extremely important to these systems as
11
the biofloc forms aggregates and should not settle to the
bottom of a pond or tank. The microbial community can
reach a density of 107 colony forming units, CFU, mL-1 forming
bioflocs that contain bacteria, protozoa, and zooplankton
(Avnimelech, 2007). By mixing the water column, removing
sludge, and adding aeration, shrimp biomass in ponds can
increase to 2-3 kg/m3 (Ebeling et al. 2006). Water movement
is also critical in increasing the air-water oxygen
transfer, thereby enhancing oxygen and carbon dioxide
diffusion. Mixing the water column overcomes light
limitation of phytoplankton growth in "thick" ponds with
dense stratification by bringing it to the surface.

Increasing aeration in outdoor lined ponds is
important for culturing species with a benthic orientation,
such as L. vannamei. Flocculated growth in the ponds
consists of phytoplankton, bacteria, living and dead
organic matter, and grazers of the bacteria. The cycle
will begin with a "greenwater" state as suspended organic
particles, consisting mostly of green phytoplankton, serve
as attachment sites for microbes (Hargreaves, 2006). Once
the biofloc develop, bacterial oxidation of ammonia by
fixation in the microbial biomass is promoted. If carbon
and nitrogen are balanced, ammonium and organic nitrogen
will be converted into the bacterial biomass; a high C/N
ratio must be maintained in the biofloc system (Avnimelech,
2007).
Nitrification is an important component of microbial
activity as it controls ammonia and nitrite levels. There
are three nitrogen conversion pathways for the removal of
ammonia-N. The first is the photoautotrophic removal by
algae, the second is autotrophic bacterial (Nitrosomonas
nitrobacter) conversion of ammonia-N to nitrite to nitrate
N, and the third is heterotrophic bacterial conversion of
ammonia-N directly to the microbial biomass (Crab et al.
2007). The heterotrophic bacteria take care of ammonium
12

more rapidly than nitrifying bacteria because their growth
rate and the microbial biomass yield are higher. In fact,
in high C/N ratios, heterotrophic bacteria outcompete
nitrifiers for oxygen and space in biofilters as
nitrification requires a lower C/N ratio. Heterotrophic
bacterial growth can be stimulated through the addition of
organic carbonaceous substrates such as molasses (Ebeling
et al. 2006). Of course, there are several factors
affecting the rate of nitrification, including ammonia-N
and nitrite-N concentrations, C/N ratios, dissolved oxygen
levels (optimum is above 2mg/L), pH, temperature, and
alkalinity (Hargreaves, 2006).
Five high-intensity shrimp ponds with zero-exchange
systems at Belize Aquaculture Ltd. (BAL) in Central America
were examined to study microbial and phytoplankton
processes. They grew bacteria, which were associated with
the flocculated matter, autotrophic flagellates, and
protozoa. Bacterial numbers and oxygen consumption did not
change over the course of the study. Both the bacteria and
the phytoplankton took up ammonium, and the phytoplankton
productivity was always high. However, the ponds
fluctuated between being predominantly heterotrophic and
autotrophic on almost a daily basis; there was no obvious
13

trend (Burford et al. 2003). This is contrary to the
thought that increasing the carbon feed input would shift
the pond to being a heterotrophic system; this only held
true in one pond. A noted complication is that some
phytoplankton are capable of mixotrophic or heterotrophic
growth. Also, phytoplankton remove anunonia but eventually
the cells die, the nitrogen in the cells are mineralized by
heterotrophic bacteria, and the nitrogen is recycled to the
water as anunonia. Thus, phytoplankton remove anunonia but
the water quality fluctuates more than in bacterial
dominated ponds (Hargreaves, 2006). In Belize, the
bacteria may have been limited by the availability of
carbon as the shrimp biomass increased over time (Burford
et al. 2003). However, despite what is considered poor
water quality, shrimp production was high and leads to
questions about the utility of biofloc technology.
Intensive pond culture systems for Litopenaeus
vannamei have been studied at the Waddell Mariculture
center since the mid 1980's. The dynamics of the microbial
communities of these systems have been studied at the
facility since the late 1990's. Scientists at Waddell have
found the ponds typically undergo an algal bloom and then
crash. Biofloc and microbial activity follows the crash
14

and then the community stabilizes with a heterotrophic
community and various levels of photoautotrophic activities
(Leffler, 2007). Of course, as stated above, the mix of
bacteria and algae depends on the C/N ratios which may be
controlled by feed or sugar introductions. The goal for
this thesis was to understand the complicated dynamics of
the zero-water exchange, high-intensity tank system and
microbial floe culture of Litopenaeus vannamei by studying
total system gross primary productivity and respiration.
15

MATERIALS AND METHODS
Shrimp were raised in 32, 6.3 m3 (8.55 m2) outdoor
tanks at the Waddell Mariculture Center in Bluffton, SC for
two months (Appendix A). Eight treatments, four replicates
each, were created by the use of 36% and 24% protein feeds,
stocking densities of 300/m2 and 100/m2, and the use of
settling chambers (clarifiers) to crop organic matter from
half of the tanks (Figure 1.1, Appendix C). All tanks were
heavily aerated to keep the system well mixed and to meet
the respiratory demands of the system.
not in study
Llcp tank24
L3cp tank18
H3cp tank12
not in study
L3cp tank29
H3cp tank17
H3cp tank34
L3cp tank28
Hlcp tanklO
Hlcp tank33
L3cp tank32
not in study
~~ Hlcp ~ ~ tank25
~!~~21 B~ Hlcp tanklS
Llcp tank9
Llcp tank14
H3cp tank13
not in study
Figure 1.1: The Tank Pad- H (36%-high protein feed); L (24%-low protein feed); 1 (100/m2
); 3 (300/m2); cp (sludge
was cropped); the 4 corner tanks were not included in the study but shrimp were used to restock tanks that crashed.
16

Part One:
Seven YSI Sondes from Yellow Springs Inc., Ohio with
oxygen probes were used to measure and electronically
record dissolved oxygen (DO) levels every 10-15 minutes all
day, every day for a two- month period. Day length in
South Carolina was 6 a.m. to 8:30 p.m; ambient light fell
on all tanks through a 65% shade cloth. Temperatures were
recorded twice daily. The Sondes were rotated over four
days to 7 different tanks in order to record DO data from
28 of the tanks every week (Figure 1.2). During a peak
daylight hour, the supplemental airflow was terminated to
each tank that contained a Sonde. Pumps provided water
movement to prevent the biofloc from settling. The Sondes
continued to record the dissolved oxygen levels for those
tanks; this resulted in the net ecosystem production (NEP)
for that time period as shown in the following equation.
NEP = [DO]final - [DO]initial time
On subsequent evenings, airflow was terminated to the
same tanks in order to determine total respiration, as
shown in the following equation.
RESP= [DO]initial - [DO]final time
17
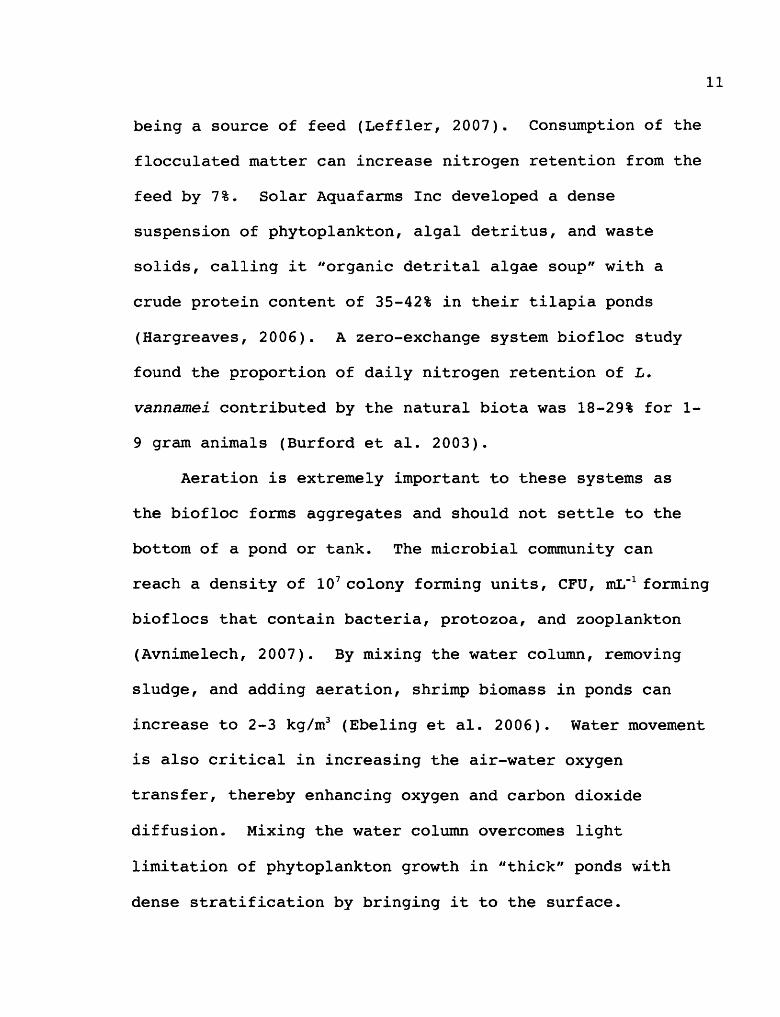
Finally, total gross primary production (GPP) can be
found using the following equation for each 24-hour period:
GPP = NEP + RESP
Figure 1.2: YSI Sonde in a tank containing L. vannamei
YSI Sonde data were uploaded on a weekly basis to
retrieve the DO readings. The program Ecowatch recorded
and stored each week's data on the shared computer at the
facility in South Carolina (Figure 1.3). From the Ecowatch
spreadsheet, the necessary dates and times were found in
order to calculate NEP, RESP and then GPP for each tank.
Figure 1.3: YSI Sonde uploading to Ecowatch
18

YSI Sondes were calibrated for DO on a weekly basis to
ensure quality data; DO membranes were changed as needed.
In addition, twice a day throughout the study, DO readings
were recorded on the handheld YSI 556 DO meter in order to
compare data with the Sondes. The YSI 556 was calibrated
every morning.
Part Two:
Net ecosystem production, respiration, and gross
primary productivity were also determined with standard one
liter BOD light and dark bottles to determine the
parameters without the presence of shrimp. The dark
bottles had a black neoprene cover. Tank water was
collected in 3 light bottles and 3 dark bottles from one
tank and the process was replicated to cover all of the 8
treatments. The bottles were then placed in what was
called the rotisserie or incubator in order to keep the
biofloc in the bottles from settling. The rotisserie
rotated the bottles steadily and slowly while the DO levels
changed (Figure 2.1). Light bottle DO levels were not
permitted to exceed 11 mg02 /L; dark bottle DO levels were
not permitted to drop below 4 mg02 /L. Bottles were removed
periodically to quickly measure the DO in order to ensure
19

these levels were not exceeded. The bottles were bathed in
tank water to duplicate the light intensity a Sonde would
experience. We used a YSI 5000 DO meter and a YSI 5010 BOD
probe; DO readings were taken before the bottles were
placed in the rotisserie and immediately upon being
removed. The YSI DO meter has an auto-calibration button;
the meter was calibrated between each new tank's set of BOD
bottles.
Figure 2.1: Light/Dark bottle "Rotisserie"
Tanks 2,3,4,8,9,12,and 18 were used for the light and
dark bottle experiment as they represented each of the 8
different treatments (Figure 1.1). DO readings were
recorded on a data sheet and the formulas for NEP, RESP,
and GPP as explained in part one of this experiment were
used to determine the results.
20

Part Three:
Shrimp respiration was determined by placing
individual L. vannamei in a clean, sealed saltwater chamber
and measuring the change in the dissolved oxygen level over
time. Ten shrimp were obtained from tank 1 (28°C),
individually weighed, and placed in a clean, sealed
saltwater chamber with a volume of a 1.2 liters for 30
minutes each without supplemental oxygen. The shrimp had
been fed 5 hours prior to being removed for this
experiment. DO readings were measured with the YSI 5000 DO
meter and YSI 5010 BOD probe and recorded every 10 minutes.
The meter was auto-calibrated between individual shrimp.
To ensure the system was not gaining or losing oxygen and
that it was a sealed environment, the test was run without
the presence of shrimp; the DO did not drop.
Once all ten shrimp were tested, the oxygen demand of
a gram of shrimp could be determined:
RESP(mgOi/L)/ [WEIGHT(in g) * 1.2L] TIME
21

Part Four:
Combining parts one and two can further lead to the
oxygen demand of L. vannamei. By averaging the means of
respiration of the 100/m2 density and 300/m2 density tanks,
both from the Sondes and the dark bottles of two separate
weeks, and by determining the mean weight of the shrimp
from those weeks, one can determine the oxygen demand.
This can be compared to the clean water chamber results of
this experiment and with results from other scientists.
Part Five:
The team at Waddell sampled the shrimp from each tank
on a weekly basis to determine biomass changes and to
assess the health of the shrimp. 100 shrimp from each of
the 36 tanks were weighed in grams and the average was
calculated and recorded. 30 shrimp from each tank were
scrutinized for gut capacity, antennae health and for the
presence of abrasions on the carapace.
22

23
RESULTS
Part One:
YSI Sondes were used to determine the total gross
primary productivity and total respiration for zero-
exchange microbial floe systems containing L. vannamei.
Total gross primary productivity and total respiration were
determined for every tank in the experiment every week
(Appendix B). Clarifiers removed sludge from 50% of the
tanks on a weekly basis; this was called cropping (Figure
1.1). From June 5 to August 6, temperatures ranged from
22.8°c (June 14) to 28.9°c (July 19) in the morning (0700h)
and from 23.7°C (June 14) to 30.4°c (July 19) in the
afternoon (1600h).
Tanks containing 300/m2 of L. vannamei had
statistically significant higher respiration rates than
those of the 100/m2 treatments (Table 1.1, Figure 3.1).
Table 1.1: Analysis of Variance Table for RESP
Source ~ !! ~ F p
Density 1 35.9288 35.9288 45.84 0.0000 Protein 1 0.0283 0.0283 0.04 0. 84 96 Crop 1 1. 0655 1. 0655 1. 36 0.2463 Week 1 0.6819 0.6819 0.87 0.3531 Error 104 81.5059 0.7837 Total 108 (Statistix 9 User's Manual- 2008- Florida)

s-
4 p s E R 2-
0
Scatter Plot of RESP vs Week
0 <)
0 <) <)
<> ~ <>
0 0 <> <) Density 0
<) 0 <)
<> <> 0
0 0 i <) 0 1 <> € <> 0 <> <)
0 <) 0 0
0 8 <> 0 0 <> 3 0 0 0 0 D D
0 % D D 0 D D B t 0 0 B @, 8 ~ 8 ~ 0
0 O> 0 0 ~ 0 D 0 D 0
~ D <)
0 <)
<)
0 s
0 5 10 15
Week
Figure 3.1: Total RESP of 300/m2 density tank versus 100/m2 density tank treatments over time.
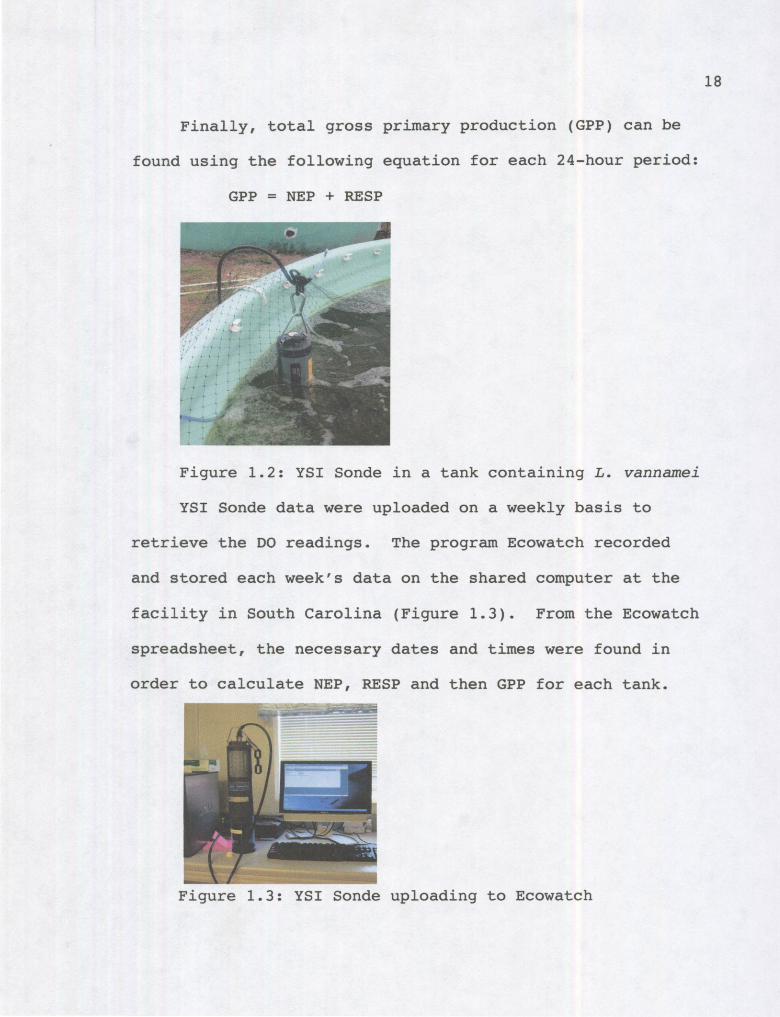
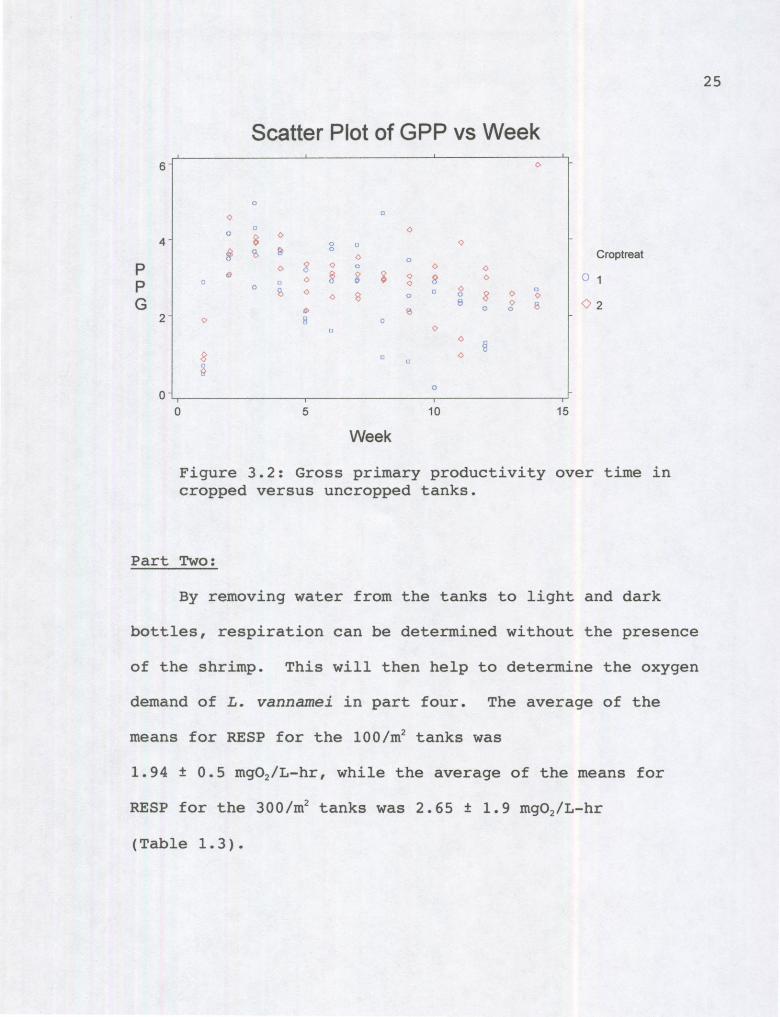
There was no statistical significance regarding
cropping leading to a change in gross primary productivity
over time (Table 1.2, Figure 3.2).
Table 1.2: Analysis of Variance Table for GPP
Source DF ~ MS F p
Density 1 4.3461 4.34609 4.17 0.0439 Protein 1 0.1845 0.18445 0.18 0.6749 Crop 1 2.1622 2.16216 2.07 0.1531 Week 1 3.2788 3.27878 3.15 0.0793 Error 95 99.0134 1.04225 Total 99 (Statistix 9 User's Manual- 2008- Florida)
24
25
Scatter Plot of GPP vs Week I I
a- ()
0
<> 0
0 <) 0
8 ()
4 - 0 <> § ~ ~ 0
Croptreat <)
p () g <> 0 () <) ~ § <> i <> 8 <> 0 1 p 0 0
<) 0 <> 0 ~ <) 0
<) 0 <) s 0 0 8 <> <>
G 8 <> 6 0 2 iB> ~ 0 0
2- <> B 0 0
<)
§ 8 0 <)
0 0
9 0 o-
I I I
0 5 10 15
Week
Figure 3.2: Gross primary productivity over time in cropped versus uncropped tanks.
Part Two:
By removing water from the tanks to light and dark
bottles, respiration can be determined without the presence
of the shrimp. This will then help to determine the oxygen
demand of L. vannamei in part four. The average of the
means for RESP for the 100/m2 tanks was
1.94: ± 0.5 mg02/L-hr, while the average of the means for
RESP for the 300/m2 tanks was 2.65 ± 1.9 mg02/L-hr
( Tab le 1. 3 ) •

Table 1.3: Dark bottle respiration (mg02/L-hr) data
Density/m2
100 300
begin RESP 2.1 3.1
end RESP 2 2.9
Mean 1. 94 2.65
SD ±0.5 ±1. 9
Respiration decreased slightly over time in 100/m2 and
300/m2 tanks. The bottle data confirms that 300/m2 tanks
have higher overall respiratory rates than 100/m2 tanks
(Figure 3.3).
3 .5
3
2.5
.. ~ 2 ...... N
'6 E 81.5
0.5
0
-
RESP via Dark Bottles
y -0.0057x + 221.26
-y = -0.0029x + 111.18
8-Jul 13-Jul 18-Jul 23-Jul 28-Jul 2-Aug 7-Aug 12-Aug 17-Aug
DATES
--- 100 density --300 density -Unear (100 density) -linear (300 density)
Figure 3.3: Respiration in 300/m2 and 100/m2 via dark bottles without the presence of L. vannamei. n = 2
26

Part Three:
The respiration of L. vannamei was determined by
placing the 10 different shrimp in a clean, sealed
saltwater 1.2L chamber for 30 minutes each at 30.0°C and
measuring the dissolved oxygen levels over time (Figure
3. 4) •
.... f4
.J
....... N 0 0
Clean Water Shrimp Respiration
•
53 +-~~~~~~~~~~---~~~~~~~~---< C
~ I? 'ii f2 +-~~~~~~---~~~~~~~~~~~~---<
•
0 2 3 4 5 6 7
shrimp weight (g)
y = 0.7541X + 0.1947
R2 = 0.7918
• RESP (mg/L/hr) -Linear (RESP (mg/L/hr))
Figure 3.4: Shrimp respiration in clean water system
Each shrimp was weighed in grams. Respiration was
calculated as follows:
RESP= [DO]initial [DO]final time
27
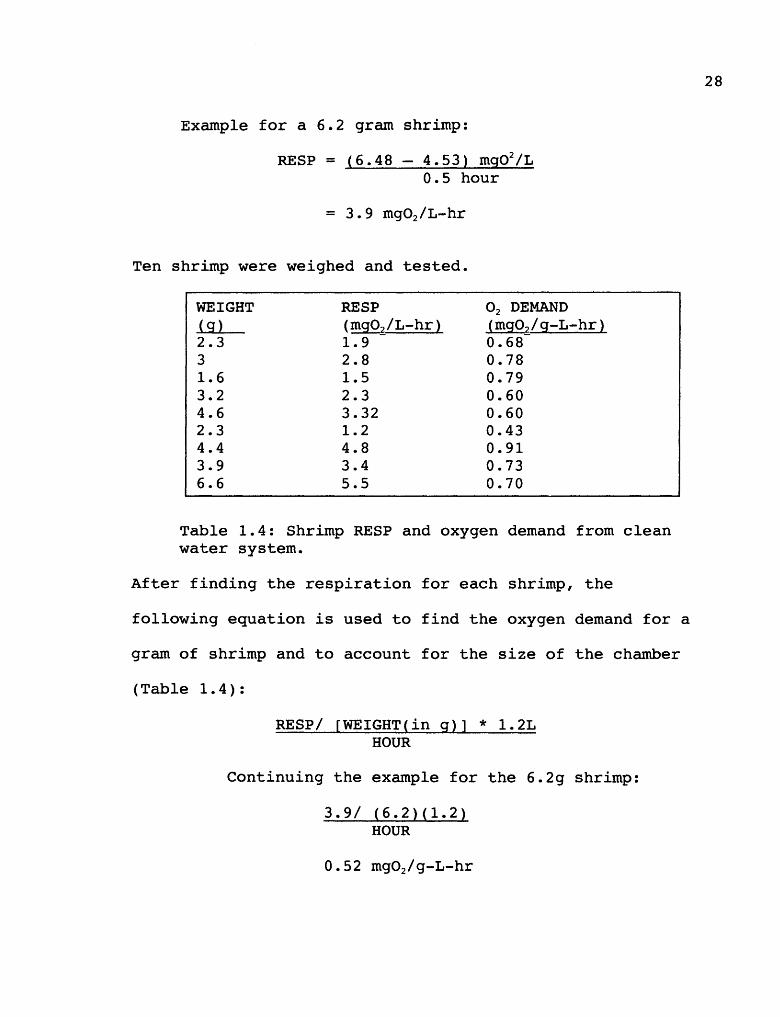
Example for a 6.2 gram shrimp:
RESP= ~<_6_.4_8 ____ 4_._5_3_)_m_g_0_2_/L_ 0.5 hour
Ten shrimp were weighed and tested.
WEIGHT ( g) 2.3 3 1.6 3.2 4.6 2.3 4.4 3.9 6.6
RESP (mg02 /L-hr) 1. 9 2.8 1.5 2.3 3.32 1.2 4.8 3.4 5.5
0 2 DEMAND ~ 2 /9-L-hr) 0.68 0.78 0.79 0.60 0.60 0.43 0.91 0.73 0.70
Table 1.4: Shrimp RESP and oxygen demand from clean water system.
After finding the respiration for each shrimp, the
following equation is used to find the oxygen demand for a
gram of shrimp and to account for the size of the chamber
(Table 1. 4):
RESP/ [WEIGHT(in g)] * 1.2L HOUR
Continuing the example for the 6.2g shrimp:
3.9/ (6.2)(1.2) HOUR
O. 52 mg02 /g-L-hr
28

The mean for oxygen demand from the ten shrimp was found to
be 0.7 ± 0.14 mg02 /g-L-hr. This will be compared to the
oxygen demand as found by the use of the Sondes and dark
bottles in part four.
Part Four:
The respiration of a gram of shrimp can be determined
and approximated by comparing the dissolved oxygen levels
measured by the YSI Sondes in the entire tank with the
levels measured by the YSI probe in the dark bottles during
the same length of time. The RESP from the 100/m2
treatments via YSI Sondes was 2.44 mg02 /L-hr; RESP from the
300/m2 treatments via YSI Sondes was 3.67 mg02/L-hr. The
RESP via the dark bottles from the 100/m2 treatments was
1.94 mg02/L-hr; RESP from the 300/m2 treatments was 2.65
mg02/L-hr. The mean weight of the shrimp from the 100/m2
treatment was 3.6 grams, while it was 2.9 grams from the
300/m2 treatments during the week prior to 19 July (Figure
3.5). This information, along with the size of the tank,
will result in the oxygen demand of a gram of shrimp. The
tank densities are different in the equations; at harvest,
it was found the densities were actually 135/m2 and 415/m2•
(gram) * (135shrimp) * (8.55meter2) * (meter3
)
(shrimp) * (meter2) * (6.3meter3
) * (lOOOL)
29

30
STEP 1- Density of shrimp- For the 100/m2 treatments:
3.6g * 135s * 8.55m2 * m3 = 0.66g/L s * m2 * 6.3m3 * lOOOL
STEP 2- This number is placed in an equation with the RESP results from the Sondes and the dark bottles from the lOO/m2
treatments:
0.66g/L (s) + 1.94 mg02 /L-hr= 2.44mg02 /L-hr oxygen demand from 100/m2 treatment= 0.7 mg02/g-L-hr**
STEP 1- Density of shrimp- For the 300/m2 treatments:
2.9g * 415s * 8.55m2 * m3 = 1.6g/L s * m2 * 6. 3m3 * lOOOL
STEP 2- This number is placed in an equation with the RESP results from the Sondes and the dark bottles from the 300/m2
treatments:
1.6g/L (s) + 2.65 mg02/L-hr= 3.67mg02/L-hr oxygen demand from 300/m2 treatment= 0.6 mg02 /g-L-hr**
**Recall that oxygen demand for the ten shrimp in the clean saltwater
chamber was 0.7 mg02/g-L-hr.
Part Five:
Finally, over the course of the study, the mean shrimp
biomass was monitored and recorded on a weekly basis. The
100/m2 treatments showed the greatest increase in biomass
compared with the 300/m2 treatments. The treatment
demonstrating the greatest growth over time was given a low
protein diet, had a low stocking density, and was cropped
with the clarifier. The treatment demonstrating the least

growth over time was given the high protein diet, had a
high stocking density, and was not cropped (Figure 3.5).
Mean Shrimp Biomass
10
Ill --HlOOcrop
E --HlOO cu (3 LlOO
.E 6 LlOOcrop
Ill --H300 Ill cu --H300crop E 0 -+-L300 ia
4 - L300crop
O+--~~~~~~-r-~~~-.--~~---,~~~---r-~~----,
9-Jun 29-Jun 19-Jul 8-Aug
Dates
28-Aug 17-Sep 7-0ct
Figure 3.5: Mean shrimp biomass comparing 300/m2 and 100/m2 treatments. (n = 4 tanks per treatment)
There is a statistically significant difference
between the final weights of shrimp in the tanks from
different densities but not for cropping treatments. (Table
1.5, Figure 3.6).
Table 1.5: Analysis of Variance Table for weight
Source OF ss MS F p
density 1 13 . 6503 13 . 6503 63.56 0.0000 croptreat 1 0.2520 0 . 2520 1.17 0.2879 density*croptreat 1 0 . 0578 0.0578 0 . 27 0.6080 Error 28 6 . 0132 0 . 2148 Total 31 (Statistix 9 User ' s Manual- 2008- Florida)
31

t h 6.7
g i
6.1 e w
5.5
a n 4.9
i F 4 .3
3.7
Box and Whisker Plot
I
~ *
0
I y * 3
Stocking Density ( 1 OOs) 32 cases
Figure 3.6: Box and Whisker Plot of final weight of shrimp in 300/m2 and 100/m2 tanks.
The shrimp feed rate is given in Appendix C. What is
particularly noteworthy is on week 6 (26 July), the amount
of the Zeigler organic feed was reduced substantially to
force the shrimp to feed on the biofloc. This continued to
be the case for the remainder of the study. The shrimp
continued to grow at a steady rate despite the reduction in
the Zeigler feed (Figure 3.5). Feed conversion ratios
(FCR) were 2.47 and 2.33 for the high protein and low
protein treatments respectively.
32
DISCUSSION
The dynamics of flocculated matter in a zero-exchange
system used to raise the Pacific white shrimp, Litopenaeus
vannamei is complicated yet important to understand.
Cropping sludge from the tanks over a two-month period at
Waddell did not lead to autotrophic, or "greenwater",
systems. This is significant as a mariculture manager may
spend many hours per week cropping when this study found it
is not necessary to promote autotrophy.
Data regarding the composition of the flocculated
matter such as rotifer counts, phytoplankton, heterotrophic
bacteria, and photoautotrophic bacteria helps to confirm
the heterotrophic and autotrophic nature of the tank
systems. Andrew Ray, as reported at Aquaculture America in
2008, did not find a statistically significant difference
between the cropped and uncropped treatments at Waddell
regarding chlorophyte, diatom, dinoflagellate, and
cyanobacteria counts.
As a whole system, the 300/m2 treatments had higher
respiratory rates than the 100/m2 treatments. This was
confirmed by obtaining data with the use of YSI Sondes for
the entire tank, including L. vannamei and the flocculated
matter, and with the use of dark bottles that omitted the
33

presence of the shrimp. The dark bottle data lead to the
conclusion that the microbial community was either
respiring more or was denser in the 300/m2 treatments.
The shrimp in the 100/m2 treatments grew better than
those in the 300/m2 treatments. Although previous studies
have shown that shrimp feed on the flocculated matter, the
shrimp in this study may have been at too high a density at
300/m2 and therefore were competing for the feed and the
flocculated matter. By looking at their gut contents, we
could not confirm that L. vannamei were feeding on the bio
floc at Waddell.
The respiratory rate of a gram of shrimp was obtained
by using the dissolved oxygen levels from the YSI Sondes
and the YSI probe in dark bottles. A YSI probe in a clean,
sealed saltwater system containing L. vannamei was also
used to obtain respiratory rates. Using the two methods,
this researcher obtained similar respiratory rates for
shrimp.
In conclusion, the portion of this experiment
involving the two densities proved to be extremely
interesting. Both shrimp growth rates and respiratory
rates were statistically significant in the density study.
The cropping study showed no effect on promoting
34

autotrophy, but demands further experimentation to rule out
its usefulness. It is also important to note that while we
cannot prove physically that the shrimp were ingesting the
biofloc, they did continue to grow steadily when the
Zeigler Brand feed was reduced.
35

36
APPENDIX A
""---=-- -
'
...; J,.T. -- ,-_ -
Figure Al:
The Waddell Mariculture Center, Bluffton, South Carolina
.Figure A2:
The Tank Pad at Waddell for Litopenaeus vannamei

APPENDIX B
Calculations for 19 July 2007, tank 29 (Low protein, 300/m2 cropped):
Net ecosystem production:
NEP = [DO]final - [DO]initial time
Respiration:
= (7.06 - 6.7) mg02 /L 0.5 hour
= O. 72 mg02 /L-hr
RESP= [DO]initial - [DO]final time
= (5.67 4.82) mg02 /L 0.5 hour
= 1. 7 mg02 /L-hr
Gross primary production:
GPP =RESP+ NEP
= (1.7 + 0.72) mg02 /L-hr
= 2. 42 mg02 /L-hr
37

APPENDIX B- Continued
Calculations for 19 July 2007, tank 30 (Low protein, 100/m2 uncropped):
Net ecosystem production:
NEP = [DO]final time
[DO]initial
Respiration:
= (8.4 - 8.08) mg02 /L 0.83 hour
= 0. 39 mg02 /L-hr
RESP= [DO]initial - [DO]final time
= ( 6. 61 5. 91) mg02/L 0.67 hour -
= 1. 04 mg02 /L-hr
Gross primary production:
GPP =RESP+ NEP
= (1.04 + 0.39) mg02 /L-hr
= 1. 4 3 mg02 /L-hr
38

39
APPENDIX C
Shrimp Feed per Week Summary (g/day)
FEED*
530 562 415 409
177 188 138 136
418 450 530 562 562 421 415 409 402
418 450 530 562 562 421 415 409 402
139 150 177 188 188 140 138 136 134
139 150 177 188 188 140 138 136 134
139 150 177 188 188 140 138 136 134
139 150 177 188 188 140 138 136 134 418 450 530 562 562 421 415 409 402
418 450 530 562 562 421 415 409 402
139 150 177 188 188 140 138 136 134
139 150 177 188 188 140 138 136 134
418 450 530 562 562 421 415 409 402 418 450 530 562 562 421 415 409 402 418 450 530 562 562 421 415 409 402
139 150 177 188 188 140 138 136 134 418 450 530 562 562 421 415 409 402
139 150 177 188 188 140 138 136 134
139 150 177 188 188 140 138 136 134
418 450 530 562 562 421 415 409 402 139 150 177 188 188 140 138 136 134 139 150 177 188 188 140 138 136 134
139 150 177 188 188 140 138 136 134 418 450 530 562 562 421 415 409 402 418 450 530 562 562 421 415 409 402 418 450 530 562 562 421 415 409 402 139 150 177 188 188 140 138 136 134 418 450 530 562 562 421 415 409 402 139 150 177 188 188 140 138 136 134 386 450 530 562 562 421 415 409 402 139 150 177 188 188 140 138 136 134
*Zeigler Brand (organic) Feed

REFERENCES
Avnimelech, Y. 2007. Feeding with microbial floes by tilapia in minimal discharge bio-flocs technology ponds. Aquaculture 264(1-4): 140-147.
Burford, M.A., P.J. Thompson, R.P. McIntosh, R.H. Bauman, and D.C. Pearson. 2004. The contribution of flocculated material to shrimp (Litopenaeus vannamei) nutrition in a high-intensity, zero-exchange system. Aquaculture 232(1-4): 525-537.
Burford, M.A., P.J. Thompson, R.P. McIntosh, R.H. Bauman, and D.C. Pearson. 2003. Nutrient and microbial dynamics in high-intensity, zero-exchange shrimp ponds in Belize. Aquaculture 219(1-4): 393-411.
Crab, R., Y. Avnimelech, T. Defoirdt, P. Bossier, and w. Verstraete. 2007. Nitrogen removal techniques in aquaculture for a sustainable production. Aquaculture 270(1-4): 1-14.
Ebeling, J.M., M.B. Tinunons, and J.J. Bisogni. 2006. Engineering analysis of the stoichiometry of photoautotrophic, autotrophic, and heterotrophic removal of anunonia-nitrogen in aquaculture systems. Aquaculture 257(1-4): 346-358.
Hargreaves, J.A. 2006. Photosynthetic suspended-growth systems in aquaculture. Aquacultural Engineering 34(3): 344-363.
Leffler, J. 2007. Biofloc research at the Waddell Mariculture Center. Biofloc Workgroup [On-line]. Available: http://floc.aesweb.org/content.asp?Contentid=379
40