ecosystem spaceborne thermal radiometer …jpl d-103137 ecosystem spaceborne thermal radiometer...
TRANSCRIPT
JPL D-103137
ECOsystem Spaceborne Thermal Radiometer
Experiment on Space Station (ECOSTRESS) Mission
Level 2 Product User Guide
Version 2
18 June, 2019
Glynn Hulley, Robert Freepartner
ECOSTRESS Algorithm Development Team
Jet Propulsion Laboratory
California Institute of Technology
© 2019 California Institute of Technology. Government sponsorship acknowledged.
Paper copies of this document may not be current and should not be relied on for official
purposes. The current version is in the ECOSTRESS DocuShare Library (*) at https://bravo-
lib.jpl.nasa.gov/docushare/dsweb/View/Library-509
(*) Access limited to user group
National Aeronautics and
Space Administration
Jet Propulsion Laboratory
4800 Oak Grove Drive
Pasadena, California 91109-8099
California Institute of Technology
2
This research was carried out at the Jet Propulsion Laboratory, California Institute of Technology, under a
contract with the National Aeronautics and Space Administration.
Reference herein to any specific commercial product, process, or service by trade name, trademark,
manufacturer, or otherwise, does not constitute or imply its endorsement by the United States
Government or the Jet Propulsion Laboratory, California Institute of Technology.
© 2019. California Institute of Technology. Government sponsorship acknowledged.
Note:
The users' guide is designed to be a living document that describes the ECOSTRESS Land
Surface Temperature and Emissivity (LST&E) product. The document describes the current state
of the art, and is revised as progress is made in the development and assessment of the LST
product. The primary purpose of the document is to present an overview of the ECOSTRESS L2
data product to the potential user. For more detailed information on the physical basis and
algorithm details please see the Algorithm Theoretical Basis Document (ATBD).
3
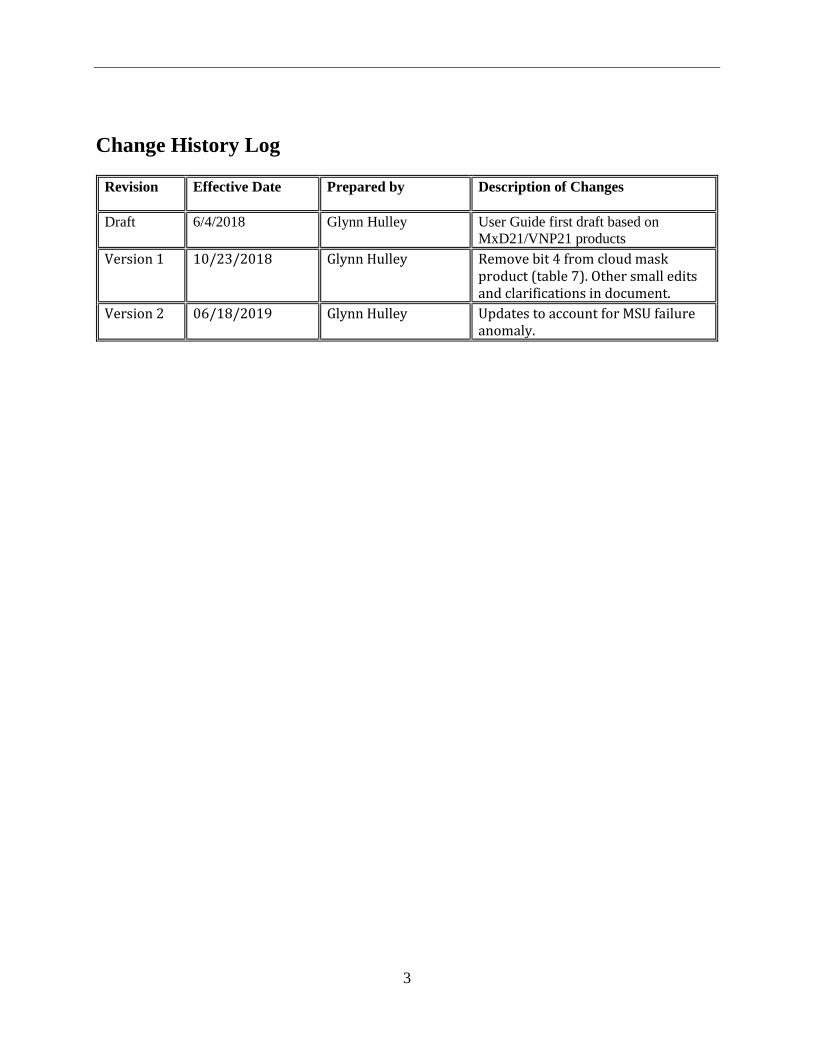
Change History Log
Revision Effective Date Prepared by Description of Changes
Draft 6/4/2018 Glynn Hulley User Guide first draft based on
MxD21/VNP21 products
Version 1 10/23/2018 Glynn Hulley Remove bit 4 from cloud mask product (table 7). Other small edits and clarifications in document.
Version 2 06/18/2019 Glynn Hulley Updates to account for MSU failure anomaly.
4
Contacts
Readers seeking additional information about this product may contact the following:
Glynn C. Hulley (PI)
MS 183-509
Jet Propulsion Laboratory
4800 Oak Grove Dr.
Pasadena, CA 91109
Email: [email protected]
Office: (818) 354-2979
5
Contents Figures ............................................................................................................................................ 6 Tables ............................................................................................................................................. 6 1 Introduction .......................................................................................................................... 7
1.1 File format for L2 products ........................................................................................... 7 1.2 LST&E and Cloud Product ........................................................................................... 8
1.3 Product Availability ...................................................................................................... 9
2 ECOSTRESS_L2_LSTE Product ...................................................................................... 9 2.1 Algorithm Description .................................................................................................. 9 2.2 Scientific Data Sets (SDS) .......................................................................................... 12 2.3 Attributes..................................................................................................................... 13
2.4 Quality Assurance (QA) ............................................................................................. 15
3 ECOSTRESS_L2_Cloud Product .................................................................................... 17 3.1 Algorithm Description and Bit Mask Interpretation ................................................... 17
3.2 Scientific Data Sets (SDS) .......................................................................................... 18
3.3 Attributes..................................................................................................................... 18
4 References ........................................................................................................................... 19
6
Figures Figure 1. Example ECOSTRESS L2 Land Surface Temperature (LST) scene over the southwestern USA generated from
simulated data. ............................................................................................................................................. 9 Figure 2. Schematic detailing the flow of the ECOSTRESS LST PGE within the JPL Science Data System. ............... 11
Tables Table 1: Summary of the ECOSTRESS LST&E product. ............................................................................................... 8 Table 2: ECOSTRESS input products and ancillary data required to produce the L2 LST&E product. ......................... 11 Table 3. The Scientific Data Sets (SDS) in the ECOSTRESS L2 product. ..................................................................... 12 Table 4. Standard product metadata included in all ECOSTRESS products. .................................................................. 13 Table 5.Product specific metadata for the ECOSTRESS L2 product. ............................................................................. 14 Table 6. Bit flags defined in the QC SDS in the MxD21_L2 product. (Note: Bit 0 is the least significant bit). ............. 15 Table 7. The SDSs in the ECOSTRESS L2 Cloud product. ............................................................................................ 18 Table 8. The metadata definition in the ECOSTRESS L2 Cloud product. ...................................................................... 18
7
1 Introduction
This is the user guide for the ECOSTRESS Level-2 Land Surface Temperature and Emissivity
(LST&E) products.. The L2 product uses a physics-based algorithm to dynamically retrieve both
the LST&E simultaneously for the five ECOSTRESS thermal infrared bands at a spatial
resolution of ~70×70 m. The algorithm is based on the ASTER Temperature Emissivity
Separation (TES) algorithm, which uses full radiative transfer simulations for the atmospheric
correction, and an emissivity model based on the variability in the surface radiance data to
dynamically retrieve both LST and spectral emissivity. The TES algorithm is combined with an
improved Water Vapor Scaling (WVS) atmospheric correction scheme to stabilize the retrieval
and improve accuracy in hot and humid conditions. Simulations and validation results available
in the ATBD have shown consistent accuracies at the 1 K level over all land surface types
including vegetation, water, and deserts.
The ECOSTRESS L2 product will include a swath product in standard geographic (lat, lon
tagged) format. The algorithms and data content of the LST&E and cloud products are briefly
described in this guide, with the purpose of providing a user with sufficient information about the
content and structure of the data files to enable the user to access and use the data, in addition to
understanding the uncertainties involved with the product and how to interpret the cloud mask
information. Overviews of the file formats and provided first followed by descriptions of the
algorithm and product contents including all metadata. Publications and documents related to the
ECOSTRESS LST&E and cloud products are listed in the final section.
On September 29th 2018, ECOSTRESS experienced an anomaly with its primary mass storage
unit (MSU). ECOSTRESS has a primary and secondary MSU (A and B). On December 5th, the
instrument was switched to the secondary MSU and operations resumed with initial acquisitions
over Australia and wider coverage resumed on January 9th 2019. The initial anomaly was
attributed to exposure to high radiation regions, primarily over the Southern Atlantic Anomaly,
and the acquisition strategy was revised to exclude these regions from future acquisitions. On
March 14th 2019, the secondary MSU experienced an anomaly, and acquisitions are temporarily
on hold. Work is underway to implement a direct streaming option, which will bypass the need for
mass storage units. The streaming acquisition mode will change the format of the data being
collected. Specifically, the new collection mode will eliminate the 1.6 m (SWIR), 8.2 m (TIR),
and 9.0 m (TIR) bands. To simplify product formats, the L1 and L2 products will continue to
contain the datasets for these bands, but the datasets will contain fill values. This will be seen in
products generated after May 15th 2019, when the instrument resumes operations. These changes
are described in the detailed product specifications.
A description of the major components of the ECOSTRESS algorithm implemented in version 1
of the LST&E Product Generation Executive (PGE) code are shown in Table 1 and described in
depth in the ATBD available at https://ecostress.jpl.nasa.gov/products. The primary purpose of
this document is to supply a user with sufficient information about the content and structure of
the data files so that the users will be able to access and use the data with confidence.
1.1 File format for L2 products
The ECOSTRESS LST&E and cloud products are distributed in HDF5 format and can be read in
by HDF5 software. Information on Hierarchical Data Format 5 (HDF5) may be found at
8
https://www.hdfgroup.org/HDF5/. The HDF format was developed by NCSA, and has been
widely used in the scientific domain. HDF5 can store two primary types of objects: datasets and
groups. A dataset is essentially a multidimensional array of data elements, and a group is a
structure for organizing objects in an HDF5 file. HDF5 was designed to address some of the
limitations of the HDF4. Using these two basic objects, one can create and store almost any kind
of scientific data structure, such as images, arrays of vectors, and structured and unstructured
grids. They can be mixed and matched in HDF5 files according to user needs. HDF5 does not
limit the size of files or the size or number of objects in a file. The scientific data results are
delivered as SDSs with local attributes including summary statistics and other information about
the data. More detailed information on HDF5 data types may be found in the L2 Product
Specification Document (PSD) available at https://ecostress.jpl.nasa.gov/products.
The ECOSTRESS LST&E and cloud data product files contain one set of Attributes (metadata)
describing information relevant to production, archiving, user services, input products,
geolocation and analysis of data, as well as provenance and Digital Object Identifier (DOI) of the
product attached to the root group (the file). The attributes listed in Table 4 are not described
further in this user guide.
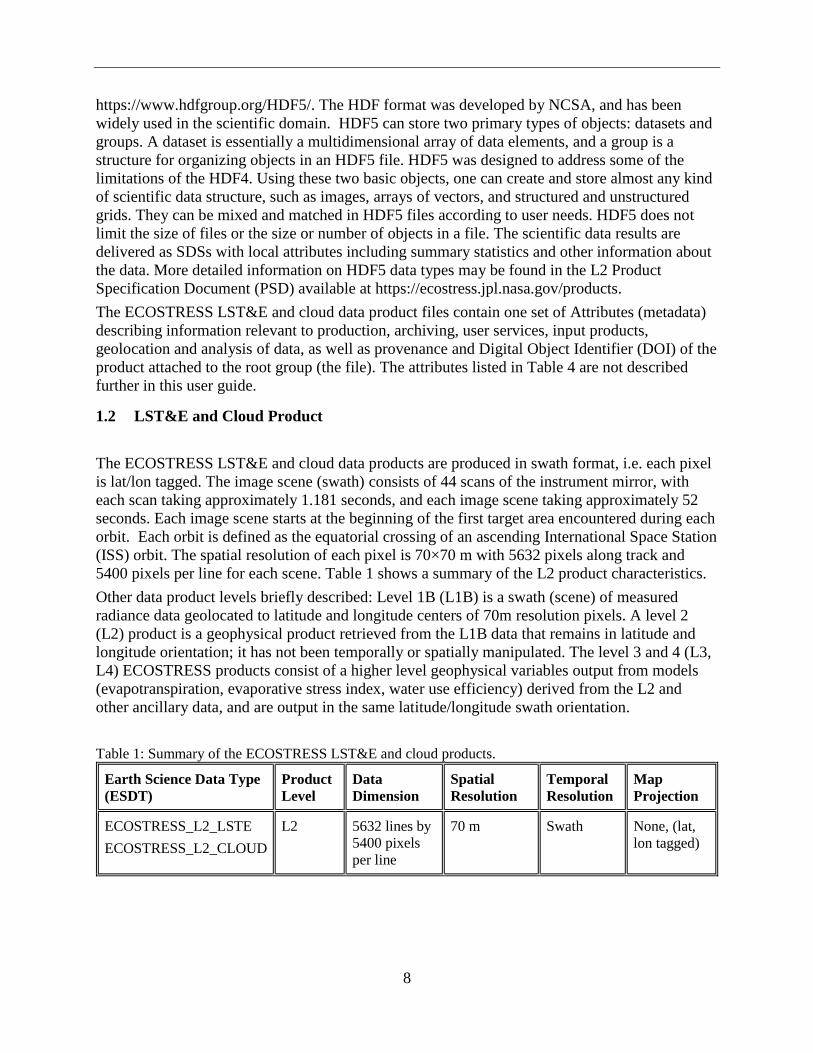
1.2 LST&E and Cloud Product
The ECOSTRESS LST&E and cloud data products are produced in swath format, i.e. each pixel
is lat/lon tagged. The image scene (swath) consists of 44 scans of the instrument mirror, with
each scan taking approximately 1.181 seconds, and each image scene taking approximately 52
seconds. Each image scene starts at the beginning of the first target area encountered during each
orbit. Each orbit is defined as the equatorial crossing of an ascending International Space Station
(ISS) orbit. The spatial resolution of each pixel is 70×70 m with 5632 pixels along track and
5400 pixels per line for each scene. Table 1 shows a summary of the L2 product characteristics.
Other data product levels briefly described: Level 1B (L1B) is a swath (scene) of measured
radiance data geolocated to latitude and longitude centers of 70m resolution pixels. A level 2
(L2) product is a geophysical product retrieved from the L1B data that remains in latitude and
longitude orientation; it has not been temporally or spatially manipulated. The level 3 and 4 (L3,
L4) ECOSTRESS products consist of a higher level geophysical variables output from models
(evapotranspiration, evaporative stress index, water use efficiency) derived from the L2 and
other ancillary data, and are output in the same latitude/longitude swath orientation.
Table 1: Summary of the ECOSTRESS LST&E and cloud products.
Earth Science Data Type
(ESDT)
Product
Level
Data
Dimension
Spatial
Resolution
Temporal
Resolution
Map
Projection
ECOSTRESS_L2_LSTE
ECOSTRESS_L2_CLOUD
L2 5632 lines by
5400 pixels
per line
70 m Swath None, (lat,
lon tagged)
9
1.3 Product Availability
The ECOSTRESS L2 product will be made available at the NASA Land Processes Distribution
Active Archive Center (LPDAAC)(https://lpdaac.usgs.gov/dataset_discovery/ECOSTRESS),
accessed via the Earthdata search engine (https://search.earthdata.nasa.gov/), or in the Data Pool.
2 ECOSTRESS_L2_LSTE Product
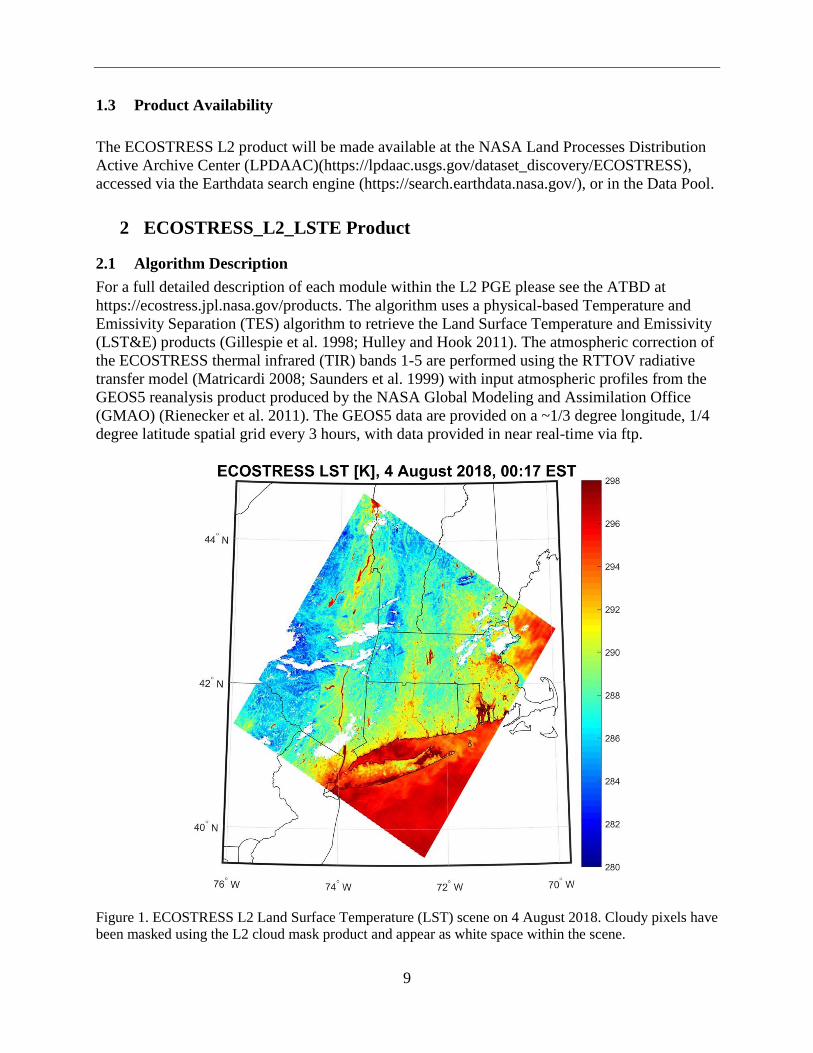
2.1 Algorithm Description
For a full detailed description of each module within the L2 PGE please see the ATBD at
https://ecostress.jpl.nasa.gov/products. The algorithm uses a physical-based Temperature and
Emissivity Separation (TES) algorithm to retrieve the Land Surface Temperature and Emissivity
(LST&E) products (Gillespie et al. 1998; Hulley and Hook 2011). The atmospheric correction of
the ECOSTRESS thermal infrared (TIR) bands 1-5 are performed using the RTTOV radiative
transfer model (Matricardi 2008; Saunders et al. 1999) with input atmospheric profiles from the
GEOS5 reanalysis product produced by the NASA Global Modeling and Assimilation Office
(GMAO) (Rienecker et al. 2011). The GEOS5 data are provided on a ~1/3 degree longitude, 1/4
degree latitude spatial grid every 3 hours, with data provided in near real-time via ftp.
Figure 1. ECOSTRESS L2 Land Surface Temperature (LST) scene on 4 August 2018. Cloudy pixels have
been masked using the L2 cloud mask product and appear as white space within the scene.

10
A Water Vapor Scaling (WVS) model is further employed to improve the atmospheric correction
accuracy under conditions of heavy water vapor loadings on a pixel-by-pixel basis (Malakar and
Hulley 2016; Tonooka 2005). The ECOSTRESS LST&E product will be produced for all
acquired ECOSTRESS scenes and for every pixel of data regardless of cloud. The L2 product
also includes a full set of error estimates for both the LST and all five emissivity bands generated
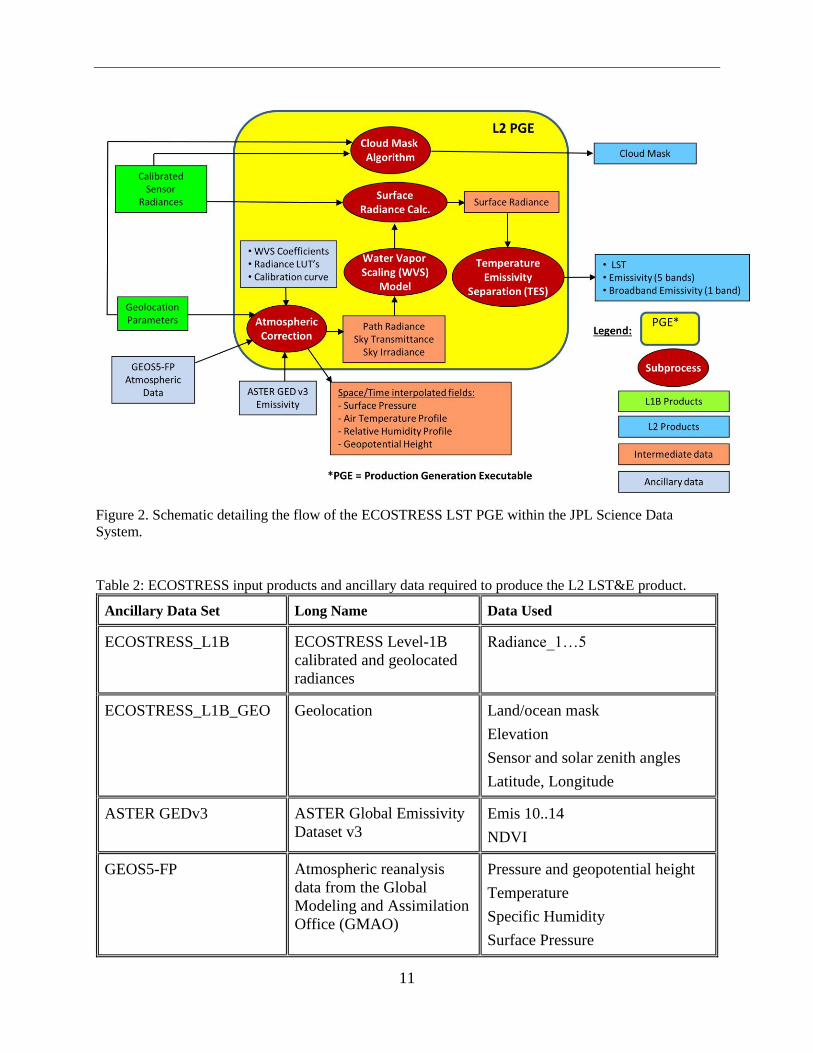
from an uncertainty model (Hulley et al. 2012). Figure 2 shows a schematic detailing the flow of
the ECOSTRESS PGE within the JPL Science Data System (SDS) including the primary input
datasets, and subprocesses.
Due to the MSU failure anomalies, L2 products generated after May 15th 2019 will use a 3-band
version of the TES algorithm with bands 2, 4 and 5. This will result in emissivity only being
produced in those bands and the remaining bands will have fill values. The dropped bands will
have no effect on the cloud mask algorithm that only uses bands 4 and 5. The retrieved LST with
a 3-band approach will also result in degraded accuracy when compared to the 5-band approach.
Simulations show that total RMS errors will increase from approximately 1 K to near 1.5 K. More
details on these changes and uncertainty estimates are available by the science team.
Data inputs to the ECOSTRESS L2 algorithm are listed in Table 2. An additional L2 cloud mask
will be provided and details of this product are shown in Table 3. Note that the L2 algorithm will
run on all pixels regardless of cloud, primarily due to the limitations of having only thermal
bands available for the cloud mask detection algorithm. The result is that for certain difficult case
scenarios (e.g. low warm clouds at night, cold clouds over cold surfaces such as ice/snow), the
cloud mask could potentially overestimate/underestimate the clouds present in a scene. For cases
such as this the user would need to further explore the outputs from different cloud tests from the
cloud mask 8-bit product detailed in section 3, and/or adapt and modify the cloud mask
thresholds for their particular use case. In addition, longwave retrieved emissivity bands (e.g. 4
and 5) are usually good indicators of cloud contamination. e.g. band 4 emissivity values less than
0.9 should be regarded as suspect and possibly cloud contaminated in the presence of nearby
cloud.
The ASTER GED v3 emissivity product (Hulley et al. 2015) is used to assign the correct
emissivity-dependent coefficients in the WVS model on a scene-by-scene basis. Details of this
procedure are available in the ECOSTRESS ATBD.
11
Figure 2. Schematic detailing the flow of the ECOSTRESS LST PGE within the JPL Science Data
System.
Table 2: ECOSTRESS input products and ancillary data required to produce the L2 LST&E product.
Ancillary Data Set Long Name Data Used
ECOSTRESS_L1B ECOSTRESS Level-1B
calibrated and geolocated
radiances
Radiance_1…5
ECOSTRESS_L1B_GEO Geolocation Land/ocean mask
Elevation
Sensor and solar zenith angles
Latitude, Longitude
ASTER GEDv3 ASTER Global Emissivity
Dataset v3
Emis 10..14
NDVI
GEOS5-FP Atmospheric reanalysis
data from the Global
Modeling and Assimilation
Office (GMAO)
Pressure and geopotential height
Temperature
Specific Humidity
Surface Pressure
12
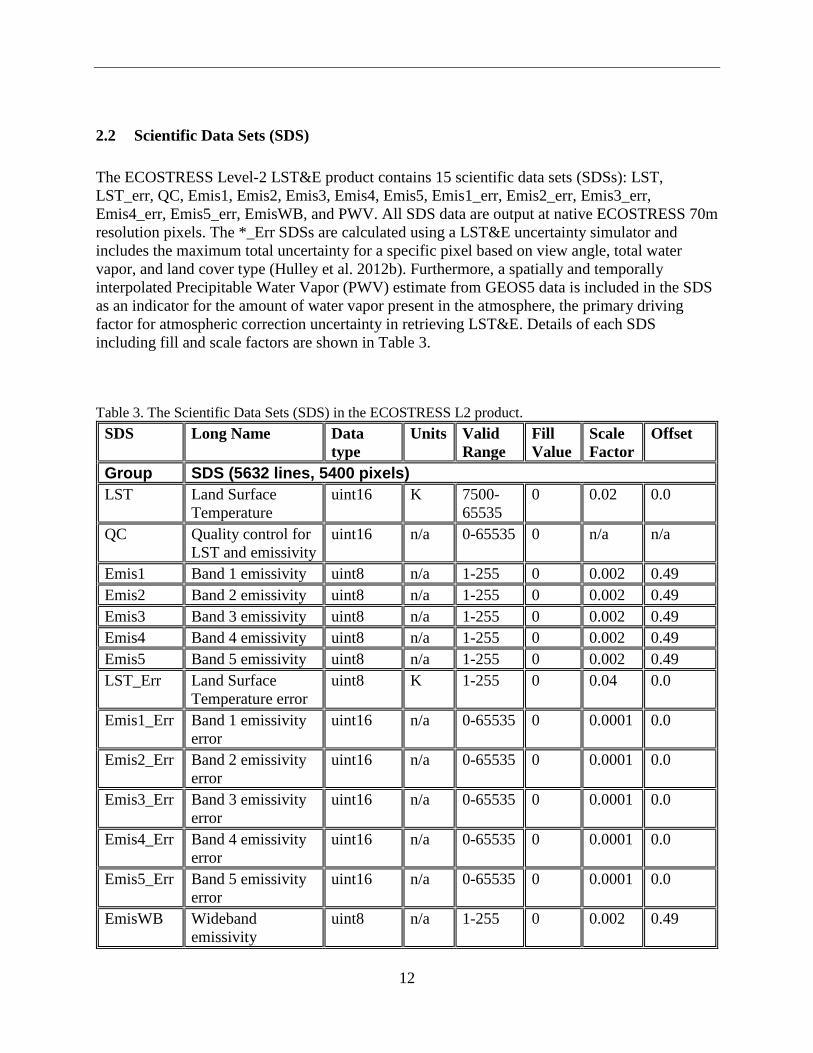
2.2 Scientific Data Sets (SDS)
The ECOSTRESS Level-2 LST&E product contains 15 scientific data sets (SDSs): LST,
LST_err, QC, Emis1, Emis2, Emis3, Emis4, Emis5, Emis1_err, Emis2_err, Emis3_err,
Emis4_err, Emis5_err, EmisWB, and PWV. All SDS data are output at native ECOSTRESS 70m
resolution pixels. The *_Err SDSs are calculated using a LST&E uncertainty simulator and
includes the maximum total uncertainty for a specific pixel based on view angle, total water
vapor, and land cover type (Hulley et al. 2012b). Furthermore, a spatially and temporally
interpolated Precipitable Water Vapor (PWV) estimate from GEOS5 data is included in the SDS
as an indicator for the amount of water vapor present in the atmosphere, the primary driving
factor for atmospheric correction uncertainty in retrieving LST&E. Details of each SDS
including fill and scale factors are shown in Table 3.
Table 3. The Scientific Data Sets (SDS) in the ECOSTRESS L2 product.
SDS Long Name Data
type
Units Valid
Range
Fill
Value
Scale
Factor
Offset
Group SDS (5632 lines, 5400 pixels)
LST Land Surface
Temperature
uint16 K 7500-
65535
0 0.02 0.0
QC Quality control for
LST and emissivity
uint16 n/a 0-65535 0 n/a n/a
Emis1 Band 1 emissivity uint8 n/a 1-255 0 0.002 0.49
Emis2 Band 2 emissivity uint8 n/a 1-255 0 0.002 0.49
Emis3 Band 3 emissivity uint8 n/a 1-255 0 0.002 0.49
Emis4 Band 4 emissivity uint8 n/a 1-255 0 0.002 0.49
Emis5 Band 5 emissivity uint8 n/a 1-255 0 0.002 0.49
LST_Err Land Surface
Temperature error
uint8 K 1-255 0 0.04 0.0
Emis1_Err Band 1 emissivity
error
uint16 n/a 0-65535 0 0.0001 0.0
Emis2_Err Band 2 emissivity
error
uint16 n/a 0-65535 0 0.0001 0.0
Emis3_Err Band 3 emissivity
error
uint16 n/a 0-65535 0 0.0001 0.0
Emis4_Err Band 4 emissivity
error
uint16 n/a 0-65535 0 0.0001 0.0
Emis5_Err Band 5 emissivity
error
uint16 n/a 0-65535 0 0.0001 0.0
EmisWB Wideband
emissivity
uint8 n/a 1-255 0 0.002 0.49
13
PWV Precipitable Water Vapor
uint16 cm 0-65535 0 0.001 0.0
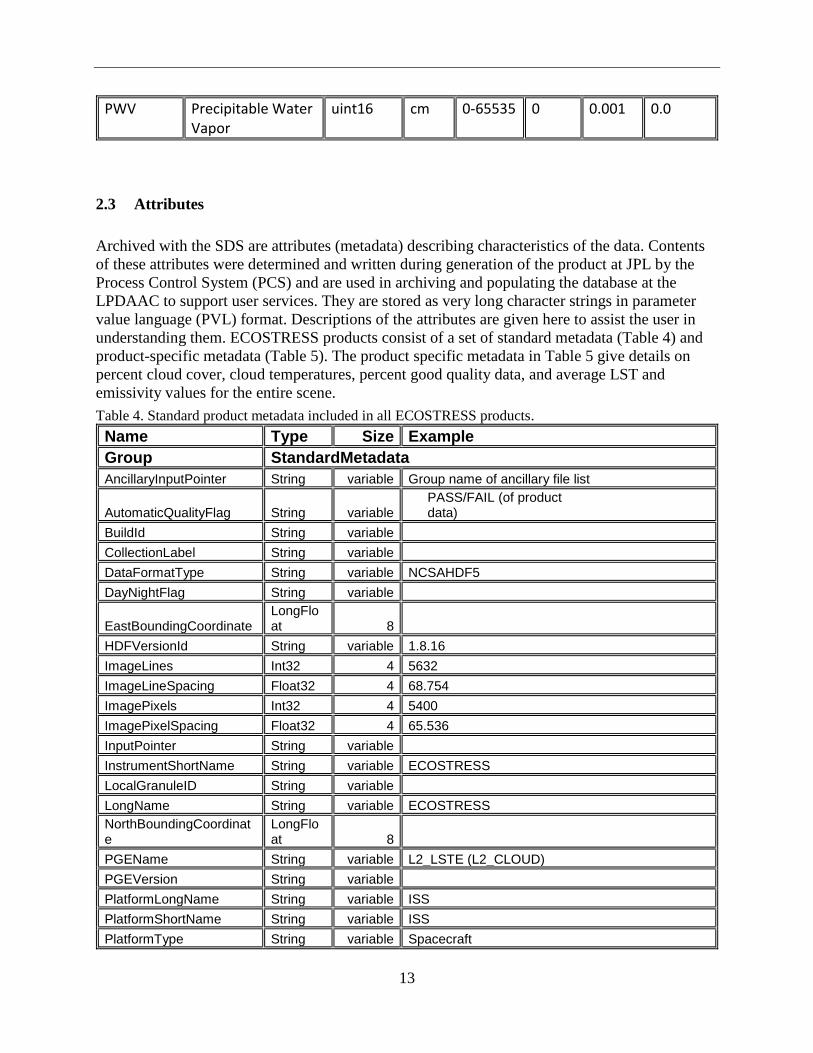
2.3 Attributes
Archived with the SDS are attributes (metadata) describing characteristics of the data. Contents
of these attributes were determined and written during generation of the product at JPL by the
Process Control System (PCS) and are used in archiving and populating the database at the
LPDAAC to support user services. They are stored as very long character strings in parameter
value language (PVL) format. Descriptions of the attributes are given here to assist the user in
understanding them. ECOSTRESS products consist of a set of standard metadata (Table 4) and
product-specific metadata (Table 5). The product specific metadata in Table 5 give details on
percent cloud cover, cloud temperatures, percent good quality data, and average LST and
emissivity values for the entire scene.
Table 4. Standard product metadata included in all ECOSTRESS products.
Name Type Size Example
Group StandardMetadata
AncillaryInputPointer String variable Group name of ancillary file list
AutomaticQualityFlag String variable PASS/FAIL (of product data)
BuildId String variable
CollectionLabel String variable
DataFormatType String variable NCSAHDF5
DayNightFlag String variable
EastBoundingCoordinate LongFloat 8
HDFVersionId String variable 1.8.16
ImageLines Int32 4 5632
ImageLineSpacing Float32 4 68.754
ImagePixels Int32 4 5400
ImagePixelSpacing Float32 4 65.536
InputPointer String variable
InstrumentShortName String variable ECOSTRESS
LocalGranuleID String variable
LongName String variable ECOSTRESS
NorthBoundingCoordinate
LongFloat 8
PGEName String variable L2_LSTE (L2_CLOUD)
PGEVersion String variable
PlatformLongName String variable ISS
PlatformShortName String variable ISS
PlatformType String variable Spacecraft
14
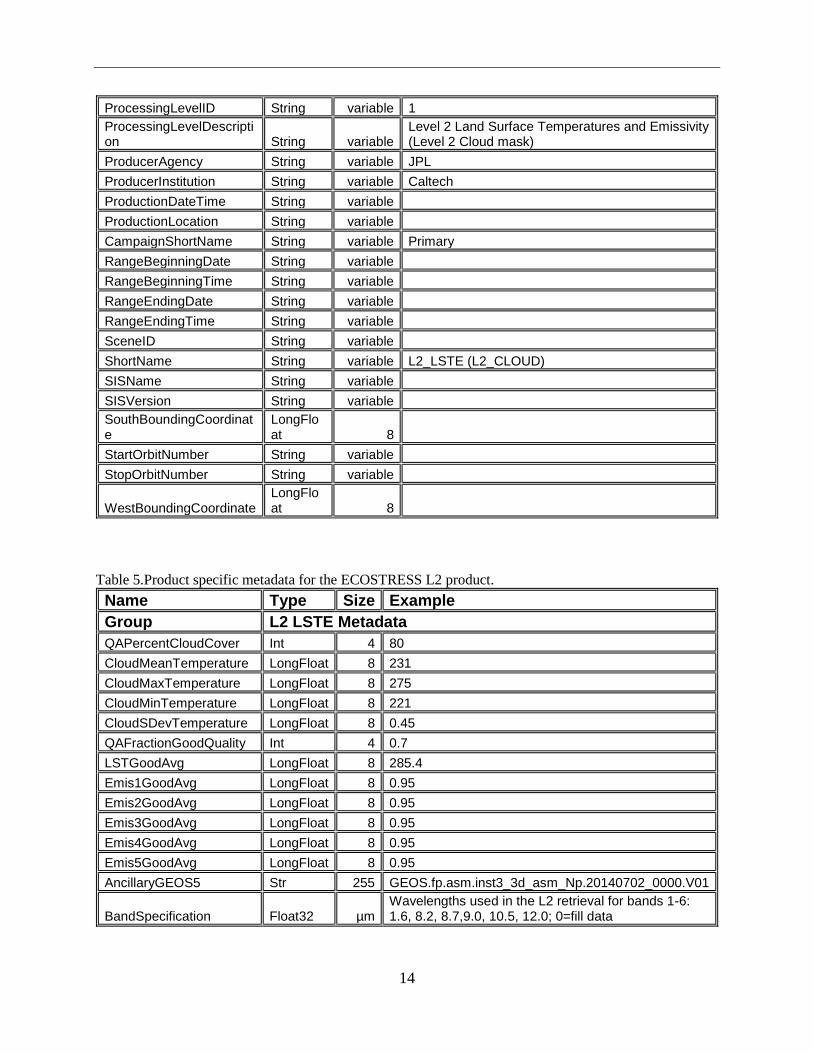
ProcessingLevelID String variable 1
ProcessingLevelDescription String variable
Level 2 Land Surface Temperatures and Emissivity (Level 2 Cloud mask)
ProducerAgency String variable JPL
ProducerInstitution String variable Caltech
ProductionDateTime String variable
ProductionLocation String variable
CampaignShortName String variable Primary
RangeBeginningDate String variable
RangeBeginningTime String variable
RangeEndingDate String variable
RangeEndingTime String variable
SceneID String variable
ShortName String variable L2_LSTE (L2_CLOUD)
SISName String variable
SISVersion String variable
SouthBoundingCoordinate
LongFloat 8
StartOrbitNumber String variable
StopOrbitNumber String variable
WestBoundingCoordinate LongFloat 8
Table 5.Product specific metadata for the ECOSTRESS L2 product.
Name Type Size Example
Group L2 LSTE Metadata
QAPercentCloudCover Int 4 80
CloudMeanTemperature LongFloat 8 231
CloudMaxTemperature LongFloat 8 275
CloudMinTemperature LongFloat 8 221
CloudSDevTemperature LongFloat 8 0.45
QAFractionGoodQuality Int 4 0.7
LSTGoodAvg LongFloat 8 285.4
Emis1GoodAvg LongFloat 8 0.95
Emis2GoodAvg LongFloat 8 0.95
Emis3GoodAvg LongFloat 8 0.95
Emis4GoodAvg LongFloat 8 0.95
Emis5GoodAvg LongFloat 8 0.95
AncillaryGEOS5 Str 255 GEOS.fp.asm.inst3_3d_asm_Np.20140702_0000.V01
BandSpecification Float32 µm Wavelengths used in the L2 retrieval for bands 1-6: 1.6, 8.2, 8.7,9.0, 10.5, 12.0; 0=fill data
15
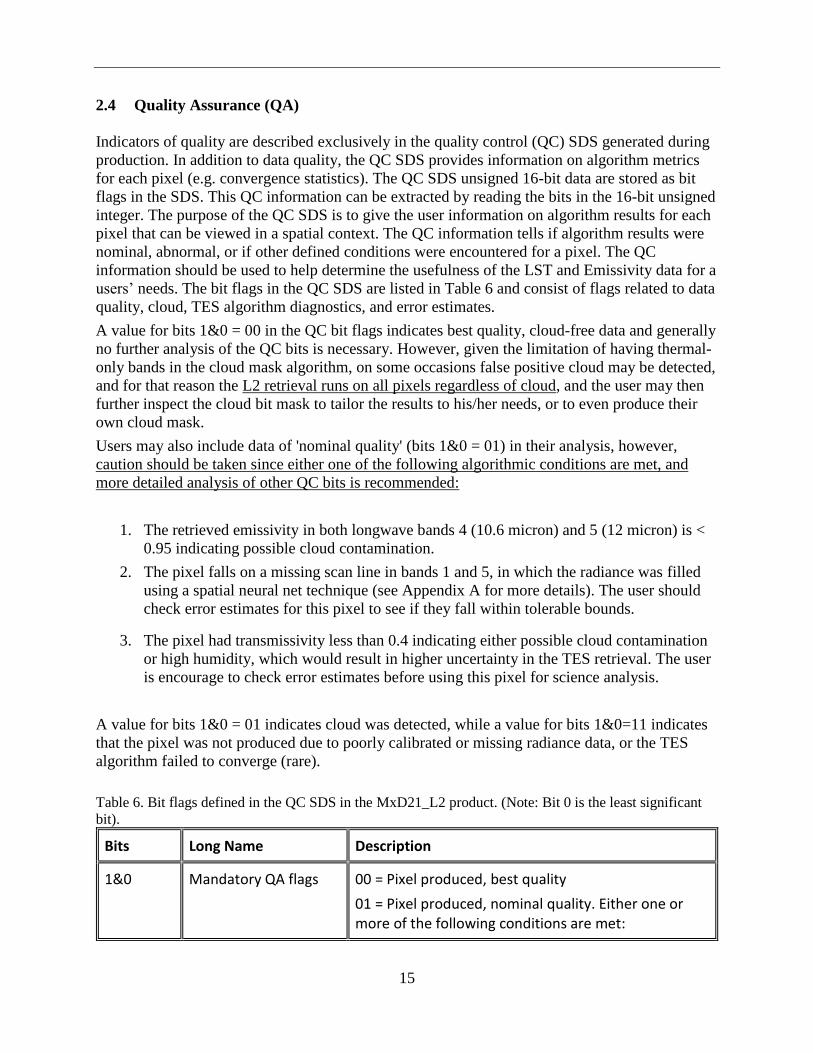
2.4 Quality Assurance (QA)
Indicators of quality are described exclusively in the quality control (QC) SDS generated during
production. In addition to data quality, the QC SDS provides information on algorithm metrics
for each pixel (e.g. convergence statistics). The QC SDS unsigned 16-bit data are stored as bit
flags in the SDS. This QC information can be extracted by reading the bits in the 16-bit unsigned
integer. The purpose of the QC SDS is to give the user information on algorithm results for each
pixel that can be viewed in a spatial context. The QC information tells if algorithm results were
nominal, abnormal, or if other defined conditions were encountered for a pixel. The QC
information should be used to help determine the usefulness of the LST and Emissivity data for a
users’ needs. The bit flags in the QC SDS are listed in Table 6 and consist of flags related to data
quality, cloud, TES algorithm diagnostics, and error estimates.
A value for bits 1&0 = 00 in the QC bit flags indicates best quality, cloud-free data and generally
no further analysis of the QC bits is necessary. However, given the limitation of having thermal-
only bands in the cloud mask algorithm, on some occasions false positive cloud may be detected,
and for that reason the L2 retrieval runs on all pixels regardless of cloud, and the user may then
further inspect the cloud bit mask to tailor the results to his/her needs, or to even produce their
own cloud mask.
Users may also include data of 'nominal quality' (bits 1&0 = 01) in their analysis, however,
caution should be taken since either one of the following algorithmic conditions are met, and
more detailed analysis of other QC bits is recommended:
1. The retrieved emissivity in both longwave bands 4 (10.6 micron) and 5 (12 micron) is <
0.95 indicating possible cloud contamination.
2. The pixel falls on a missing scan line in bands 1 and 5, in which the radiance was filled
using a spatial neural net technique (see Appendix A for more details). The user should
check error estimates for this pixel to see if they fall within tolerable bounds.
3. The pixel had transmissivity less than 0.4 indicating either possible cloud contamination
or high humidity, which would result in higher uncertainty in the TES retrieval. The user
is encourage to check error estimates before using this pixel for science analysis.
A value for bits 1&0 = 01 indicates cloud was detected, while a value for bits 1&0=11 indicates
that the pixel was not produced due to poorly calibrated or missing radiance data, or the TES
algorithm failed to converge (rare).
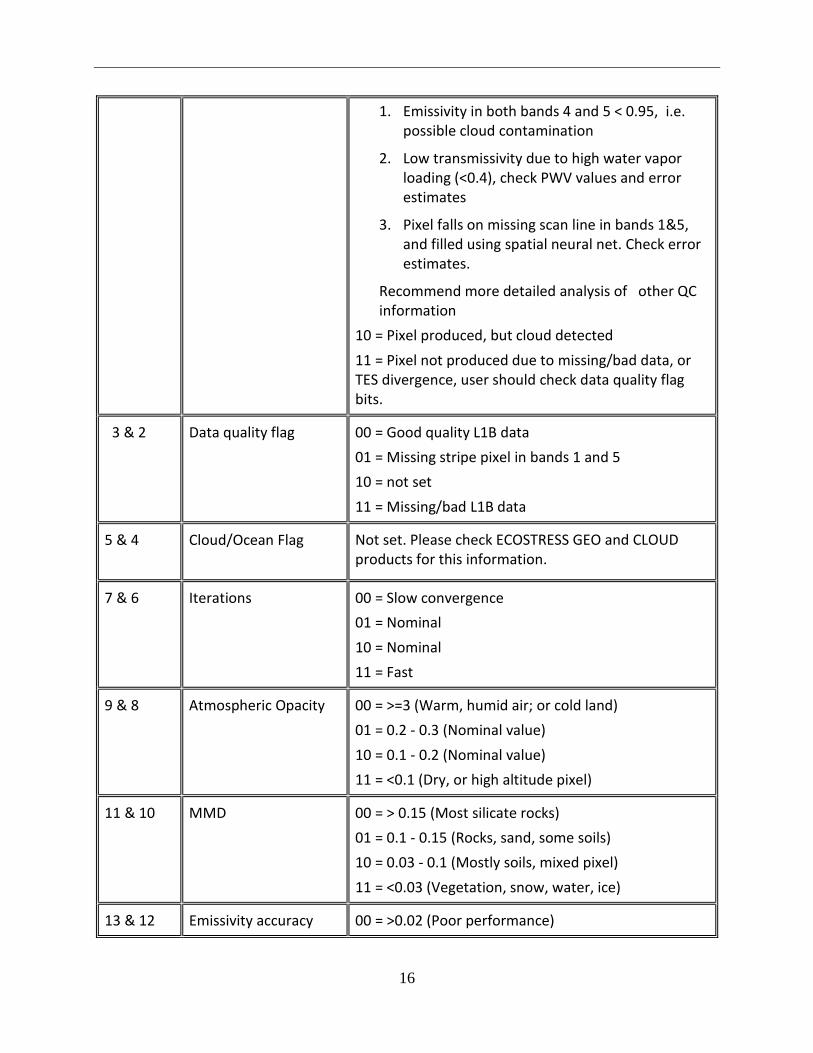
Table 6. Bit flags defined in the QC SDS in the MxD21_L2 product. (Note: Bit 0 is the least significant
bit).
Bits Long Name Description
1&0 Mandatory QA flags 00 = Pixel produced, best quality
01 = Pixel produced, nominal quality. Either one or more of the following conditions are met:
16
1. Emissivity in both bands 4 and 5 < 0.95, i.e. possible cloud contamination
2. Low transmissivity due to high water vapor loading (<0.4), check PWV values and error estimates
3. Pixel falls on missing scan line in bands 1&5, and filled using spatial neural net. Check error estimates.
Recommend more detailed analysis of other QC information
10 = Pixel produced, but cloud detected
11 = Pixel not produced due to missing/bad data, or TES divergence, user should check data quality flag bits.
3 & 2 Data quality flag 00 = Good quality L1B data
01 = Missing stripe pixel in bands 1 and 5
10 = not set
11 = Missing/bad L1B data
5 & 4 Cloud/Ocean Flag
Not set. Please check ECOSTRESS GEO and CLOUD products for this information.
7 & 6 Iterations 00 = Slow convergence
01 = Nominal
10 = Nominal
11 = Fast
9 & 8 Atmospheric Opacity 00 = >=3 (Warm, humid air; or cold land)
01 = 0.2 - 0.3 (Nominal value)
10 = 0.1 - 0.2 (Nominal value)
11 = <0.1 (Dry, or high altitude pixel)
11 & 10 MMD 00 = > 0.15 (Most silicate rocks)
01 = 0.1 - 0.15 (Rocks, sand, some soils)
10 = 0.03 - 0.1 (Mostly soils, mixed pixel)
11 = <0.03 (Vegetation, snow, water, ice)
13 & 12 Emissivity accuracy 00 = >0.02 (Poor performance)
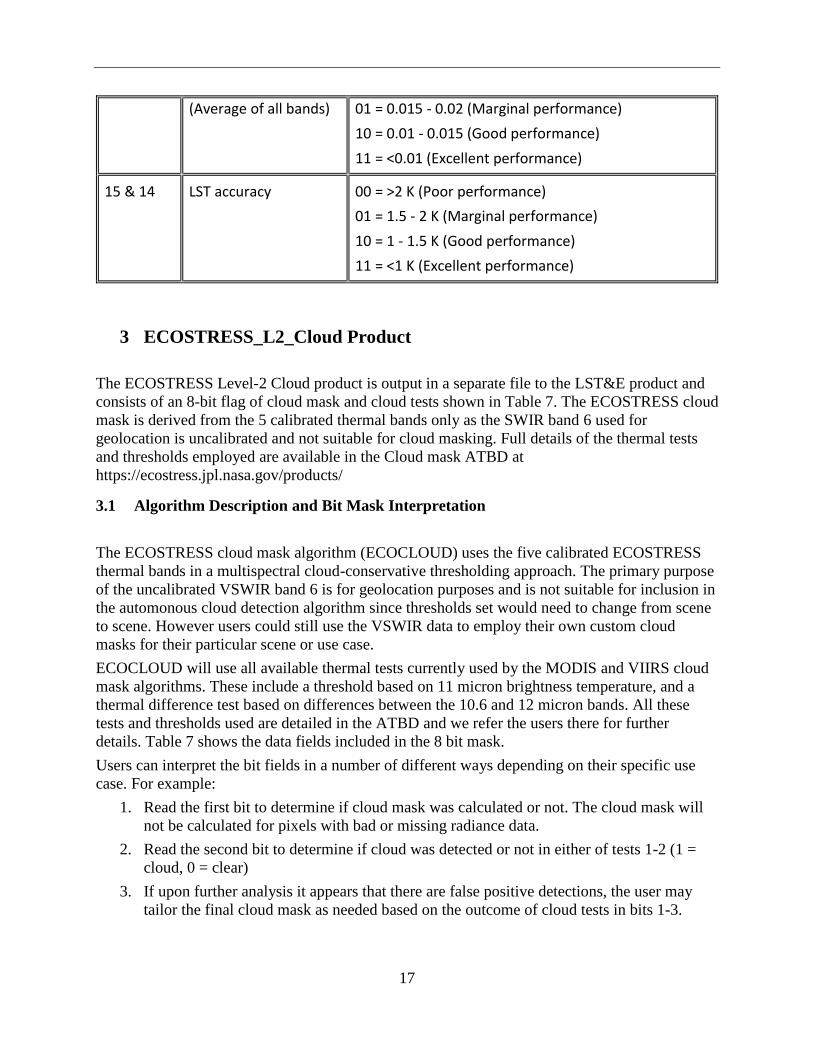
17
(Average of all bands)
01 = 0.015 - 0.02 (Marginal performance)
10 = 0.01 - 0.015 (Good performance)
11 = <0.01 (Excellent performance)
15 & 14 LST accuracy 00 = >2 K (Poor performance)
01 = 1.5 - 2 K (Marginal performance)
10 = 1 - 1.5 K (Good performance)
11 = <1 K (Excellent performance)
3 ECOSTRESS_L2_Cloud Product
The ECOSTRESS Level-2 Cloud product is output in a separate file to the LST&E product and
consists of an 8-bit flag of cloud mask and cloud tests shown in Table 7. The ECOSTRESS cloud
mask is derived from the 5 calibrated thermal bands only as the SWIR band 6 used for
geolocation is uncalibrated and not suitable for cloud masking. Full details of the thermal tests
and thresholds employed are available in the Cloud mask ATBD at
https://ecostress.jpl.nasa.gov/products/
3.1 Algorithm Description and Bit Mask Interpretation
The ECOSTRESS cloud mask algorithm (ECOCLOUD) uses the five calibrated ECOSTRESS
thermal bands in a multispectral cloud-conservative thresholding approach. The primary purpose
of the uncalibrated VSWIR band 6 is for geolocation purposes and is not suitable for inclusion in
the automonous cloud detection algorithm since thresholds set would need to change from scene
to scene. However users could still use the VSWIR data to employ their own custom cloud
masks for their particular scene or use case.
ECOCLOUD will use all available thermal tests currently used by the MODIS and VIIRS cloud
mask algorithms. These include a threshold based on 11 micron brightness temperature, and a
thermal difference test based on differences between the 10.6 and 12 micron bands. All these
tests and thresholds used are detailed in the ATBD and we refer the users there for further
details. Table 7 shows the data fields included in the 8 bit mask.
Users can interpret the bit fields in a number of different ways depending on their specific use
case. For example:
1. Read the first bit to determine if cloud mask was calculated or not. The cloud mask will
not be calculated for pixels with bad or missing radiance data.
2. Read the second bit to determine if cloud was detected or not in either of tests 1-2 (1 =
cloud, 0 = clear)
3. If upon further analysis it appears that there are false positive detections, the user may
tailor the final cloud mask as needed based on the outcome of cloud tests in bits 1-3.
18
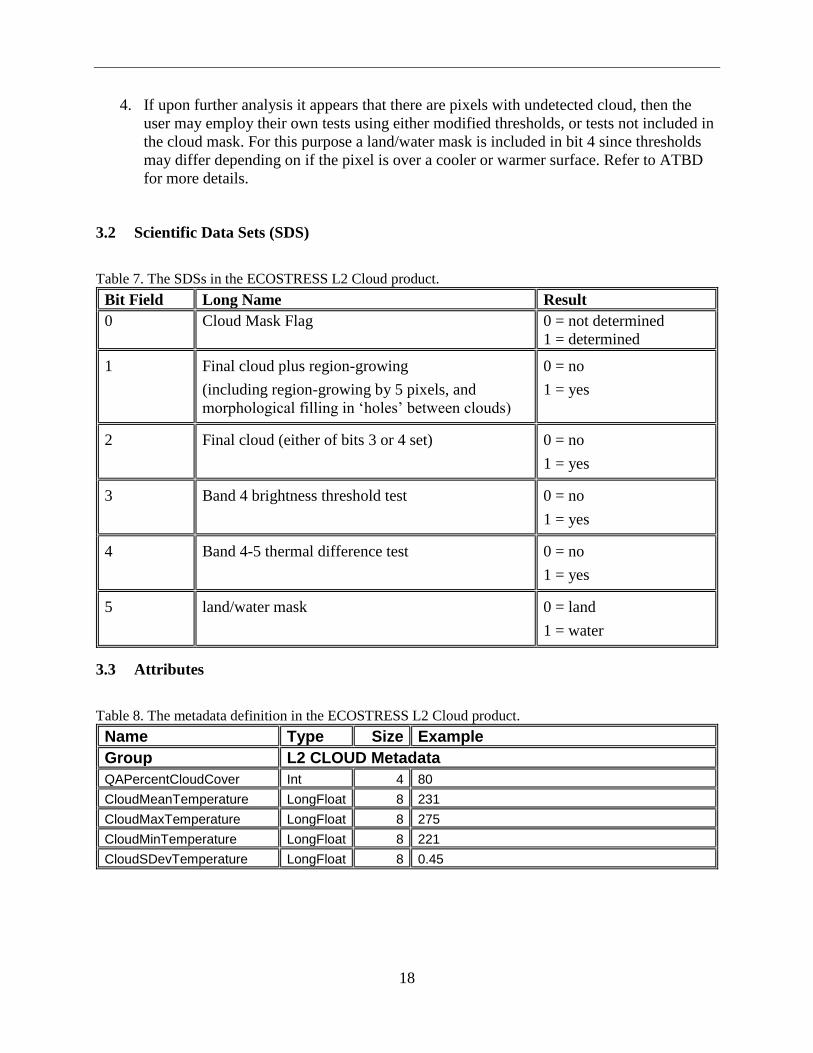
4. If upon further analysis it appears that there are pixels with undetected cloud, then the
user may employ their own tests using either modified thresholds, or tests not included in
the cloud mask. For this purpose a land/water mask is included in bit 4 since thresholds
may differ depending on if the pixel is over a cooler or warmer surface. Refer to ATBD
for more details.
3.2 Scientific Data Sets (SDS)
Table 7. The SDSs in the ECOSTRESS L2 Cloud product.
Bit Field Long Name Result
0 Cloud Mask Flag 0 = not determined
1 = determined
1 Final cloud plus region-growing
(including region-growing by 5 pixels, and
morphological filling in ‘holes’ between clouds)
0 = no
1 = yes
2 Final cloud (either of bits 3 or 4 set)
0 = no
1 = yes
3 Band 4 brightness threshold test 0 = no
1 = yes
4 Band 4-5 thermal difference test 0 = no
1 = yes
5 land/water mask 0 = land
1 = water
3.3 Attributes
Table 8. The metadata definition in the ECOSTRESS L2 Cloud product.
Name Type Size Example
Group L2 CLOUD Metadata
QAPercentCloudCover Int 4 80
CloudMeanTemperature LongFloat 8 231
CloudMaxTemperature LongFloat 8 275
CloudMinTemperature LongFloat 8 221
CloudSDevTemperature LongFloat 8 0.45
19
4 References
Gillespie, A., Rokugawa, S., Matsunaga, T., Cothern, J.S., Hook, S., & Kahle, A.B. (1998). A
temperature and emissivity separation algorithm for Advanced Spaceborne Thermal Emission
and Reflection Radiometer (ASTER) images. Ieee Transactions on Geoscience and Remote
Sensing, 36, 1113-1126
Hulley, G.C., & Hook, S.J. (2011). Generating Consistent Land Surface Temperature and
Emissivity Products Between ASTER and MODIS Data for Earth Science Research. Ieee
Transactions on Geoscience and Remote Sensing, 49, 1304-1315
Hulley, G.C., Hook, S.J., Abbott, E., Malakar, N., Islam, T., & Abrams, M. (2015). The ASTER
Global Emissivity Dataset (ASTER GED): Mapping Earth's emissivity at 100 meter spatial scale.
Geophysical Research Letters, 42, 7966-7976
Hulley, G.C., Hughes, C.G., & Hook, S.J. (2012). Quantifying uncertainties in land surface
temperature and emissivity retrievals from ASTER and MODIS thermal infrared data. Journal of
Geophysical Research-Atmospheres, 117
Malakar, N., & Hulley, G.C. (2016). A water vapor scaling model for improved land surface
temperature and emissivity separation of MODIS thermal infrared data. Remote Sensing of
Environment, 182, 252-264
Matricardi, M. (2008). The generation of RTTOV regression coefficients for IASI and AIRS
using a new profile training set and a new line-by-line database. In: ECMWF Research Dept.
Tech. Memo.
Rienecker, M.M., Suarez, M.J., Gelaro, R., Todling, R., Bacmeister, J., Liu, E., Bosilovich,
M.G., Schubert, S.D., Takacs, L., Kim, G.K., Bloom, S., Chen, J.Y., Collins, D., Conaty, A., Da
Silva, A., Gu, W., Joiner, J., Koster, R.D., Lucchesi, R., Molod, A., Owens, T., Pawson, S.,
Pegion, P., Redder, C.R., Reichle, R., Robertson, F.R., Ruddick, A.G., Sienkiewicz, M., &
Woollen, J. (2011). MERRA: NASA's Modern-Era Retrospective Analysis for Research and
Applications. Journal of Climate, 24, 3624-3648
Saunders, R., Matricardi, M., & Brunel, P. (1999). An improved fast radiative transfer model for
assimilation of satellite radiance observations. Quarterly Journal of the Royal Meteorological
Society, 125, 1407-1425
Tonooka, H. (2005). Accurate atmospheric correction of ASTER thermal infrared imagery using
the WVS method. Ieee Transactions on Geoscience and Remote Sensing, 43, 2778-2792