ecovision annual report 2009 - edmonton.ca
TRANSCRIPT

Ecovision AnnuAl REpoRt
2009The way we Green

Ecovision Annual Report: city of Edmonton 2009
i
puRposE of REpoRt ecoVision edmonton® is Edmonton City Council’s vision for an environmentally sustainable city. This vision is expressed through the City’s Environmental Policy C512 and its Environmental Strategic Plan. The City’s Environmental Strategic Plan was last updated in 2006 and is currently being used as the foundation for The Way We Green, the City of Edmonton’s environmental sustainability plan, which is being developed over 2010. EcoVision Annual Report 2009 presents the results of the implementation of action plans that have been developed within 17 priority environmental objectives and provides comment on the current state of each of the objectives in relation to Edmonton’s long-term environmental sustainability. All of the objectives contribute to the goal of Preserving and Sustaining Edmonton’s Environment outlined in The Way Ahead: City of Edmonton Strategic Plan (2009 to 2018).
Ecovision At-A-GlAncEEcoVision at-a-glance summarizes the environmental performance within each of the environmental strategic objectives in an easy-to-read chart format. Relevant targets, and the corresponding 2009 results, are presented followed by brief comments on the key challenges that are faced relative to Edmonton’s long-term environmental sustainability. Challenges to sustainability will be more thoroughly explored in The Way We Green, the City’s environmental sustainability plan. As the chart provides only a high level summary, the reader is directed to the body of the text for more in-depth analysis of trends and the balance of the 2009 achievements.

Ecovision Annual Report: city of Edmonton 2009
ii
Ecovision-At-A-GlAncEPrioriTy STraTeGic objecTiVeS 2009 TarGeTS 2009 MeaSureS /ouTcoMe Key SuSTainabiliTy challenGeS
AiRCity OperatiOnsContinually reduce total air pollutant emission levels from City of Edmonton operations (vehicles, buildings, other).
Reduction of 80% Oxides of Nitrogen and 95% PM2.5 by 2025 in Fleet Operations (this is an expectation but not a formal target at this time).
MuniCipal6% increase in Oxides of Nitrogen and 5% increase in PM2.5 (Emissions data from the municipal fleet are still preliminary and future reductions may still be realized as vehicle emissions regulations becomes more stringent)
transitEstimated reduction of 1.8 tonnes of Oxides of Nitrogen and 0.43 tonnes of PM.
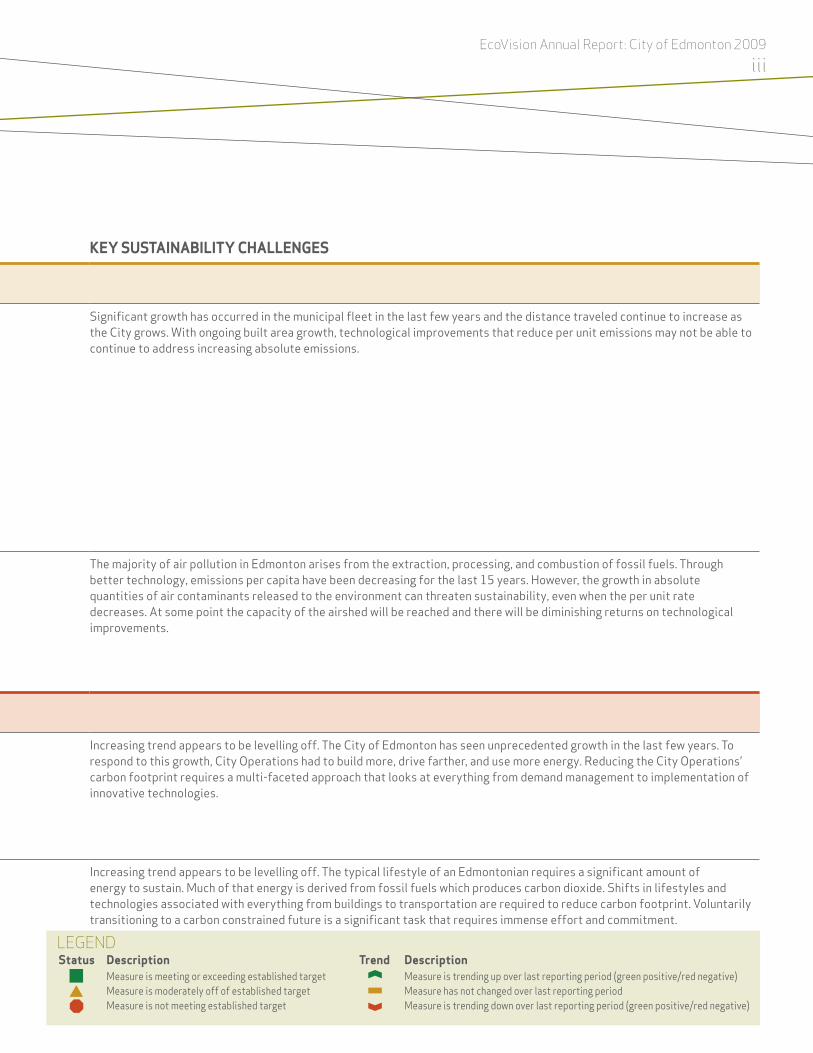
status trend Significant growth has occurred in the municipal fleet in the last few years and the distance traveled continue to increase as the City grows. With ongoing built area growth, technological improvements that reduce per unit emissions may not be able to continue to address increasing absolute emissions.
status trend
COMMunityStrive to ensure that Edmonton’s ambient air quality meets or surpasses national and provincial air quality standards and guidelines by encouraging community action
Air Quality Index of 97% or better of good air quality hours
Zero exceed ances of ambient air quality objectives of select parameters
96% in good air quality hours
Ozone objectives exceeded 2 times and PM excee ded 13 times
status trend The majority of air pollution in Edmonton arises from the extraction, processing, and combustion of fossil fuels. Through better technology, emissions per capita have been decreasing for the last 15 years. However, the growth in absolute quantities of air contaminants released to the environment can threaten sustainability, even when the per unit rate decreases. At some point the capacity of the airshed will be reached and there will be diminishing returns on technological improvements. status trend
cliMAtECity OperatiOnsReduce total greenhouse gas emissions from City operations and facilities to achieve the Partners for Climate Protection goal of annual emissions being 20% below 1990 levels by 2008 (in 2009, this was updated to reduce to 1990 levels by 2011).
20% below 2008 levels by 2011 (return to 1990 levels)
17% above 1990 levels in 2007 (last year data is available)
status trend Increasing trend appears to be levelling off. The City of Edmonton has seen unprecedented growth in the last few years. To respond to this growth, City Operations had to build more, drive farther, and use more energy. Reducing the City Operations’ carbon footprint requires a multi-faceted approach that looks at everything from demand management to implementation of innovative technologies.
COMMunityReduce greenhouse gas emissions from the broader Edmonton community.
6% below 1990 levels by 2010
38% above 1990 levels in 2008 (last year data is available)
status trend Increasing trend appears to be levelling off. The typical lifestyle of an Edmontonian requires a significant amount of energy to sustain. Much of that energy is derived from fossil fuels which produces carbon dioxide. Shifts in lifestyles and technologies associated with everything from buildings to transportation are required to reduce carbon footprint. Voluntarily transitioning to a carbon constrained future is a significant task that requires immense effort and commitment.
Ecovision Annual Report: city of Edmonton 2009
iii
Ecovision-At-A-GlAncEPrioriTy STraTeGic objecTiVeS 2009 TarGeTS 2009 MeaSureS /ouTcoMe Key SuSTainabiliTy challenGeS
AiRCity OperatiOnsContinually reduce total air pollutant emission levels from City of Edmonton operations (vehicles, buildings, other).
Reduction of 80% Oxides of Nitrogen and 95% PM2.5 by 2025 in Fleet Operations (this is an expectation but not a formal target at this time).
MuniCipal6% increase in Oxides of Nitrogen and 5% increase in PM2.5 (Emissions data from the municipal fleet are still preliminary and future reductions may still be realized as vehicle emissions regulations becomes more stringent)
transitEstimated reduction of 1.8 tonnes of Oxides of Nitrogen and 0.43 tonnes of PM.
status trend Significant growth has occurred in the municipal fleet in the last few years and the distance traveled continue to increase as the City grows. With ongoing built area growth, technological improvements that reduce per unit emissions may not be able to continue to address increasing absolute emissions.
status trend
COMMunityStrive to ensure that Edmonton’s ambient air quality meets or surpasses national and provincial air quality standards and guidelines by encouraging community action
Air Quality Index of 97% or better of good air quality hours
Zero exceed ances of ambient air quality objectives of select parameters
96% in good air quality hours
Ozone objectives exceeded 2 times and PM excee ded 13 times
status trend The majority of air pollution in Edmonton arises from the extraction, processing, and combustion of fossil fuels. Through better technology, emissions per capita have been decreasing for the last 15 years. However, the growth in absolute quantities of air contaminants released to the environment can threaten sustainability, even when the per unit rate decreases. At some point the capacity of the airshed will be reached and there will be diminishing returns on technological improvements. status trend
cliMAtECity OperatiOnsReduce total greenhouse gas emissions from City operations and facilities to achieve the Partners for Climate Protection goal of annual emissions being 20% below 1990 levels by 2008 (in 2009, this was updated to reduce to 1990 levels by 2011).
20% below 2008 levels by 2011 (return to 1990 levels)
17% above 1990 levels in 2007 (last year data is available)
status trend Increasing trend appears to be levelling off. The City of Edmonton has seen unprecedented growth in the last few years. To respond to this growth, City Operations had to build more, drive farther, and use more energy. Reducing the City Operations’ carbon footprint requires a multi-faceted approach that looks at everything from demand management to implementation of innovative technologies.
COMMunityReduce greenhouse gas emissions from the broader Edmonton community.
6% below 1990 levels by 2010
38% above 1990 levels in 2008 (last year data is available)
status trend Increasing trend appears to be levelling off. The typical lifestyle of an Edmontonian requires a significant amount of energy to sustain. Much of that energy is derived from fossil fuels which produces carbon dioxide. Shifts in lifestyles and technologies associated with everything from buildings to transportation are required to reduce carbon footprint. Voluntarily transitioning to a carbon constrained future is a significant task that requires immense effort and commitment.
lEGEnd Status Description Trend Description Measure is meeting or exceeding established target Measure is trending up over last reporting period (green positive/red negative) Measure is moderately off of established target Measure has not changed over last reporting period Measure is not meeting established target Measure is trending down over last reporting period (green positive/red negative)

Ecovision Annual Report: city of Edmonton 2009
iv
PrioriTy STraTeGic objecTiVeS 2009 TarGeTS 2009 MeaSureS /ouTcoMe Key SuSTainabiliTy challenGeS
lAndspills/releasesPrevent environmental harm and risk to human health and safety from accidental releases or spills associated with the City’s operations and facilities and meet or exceed provincial or federal spill reporting and response obligations.
Zero warning letters, protection orders, or penalties for environmental violations
No warning letters, protection orders, or penalties for environmental violations
status trend Although reportable releases were up in 2009 compared to 2008, the releases were contained through the deployment of spill kits and absorbent materials by trained staff, and did not cause serious environmental impacts. The sustainability challenge will be to ensure City employees continue to report releases and response measures are appropriate with an overall strategy to transition from the use of toxic and or environmentally hazardous substances to more environmentally preferred products over time.
Waste ManageMentMinimize the landfilling of municipal solid waste through reduction, reuse, recycling and recovery.
Downward trend in residential waste generated per capita
Diversion rate of 60% to 2012 (90% post 2012).
7.5% decrease in per capita residential waste compared to 2008
41% (2009 was not a typical year because of the composting facility beingshutdown to construct tie-in to the new Integrated Processing and Transfer Facility)
status trend Edmonton’s system for addressing residential waste incorporates the most leading environmental technology and management systems available. Key challenges include increasing opportunities for recycling and recovery of value from waste generated by the institutional, commercial and industrial sectors. Decreasing the consumption of disposable products is another key challenge for the Edmonton community.
status trend
urban develOpMentSteer urban development in a more environmentally, socially and financially sustainable direction by guiding the type and form of Edmonton’s development to reduce outward urban growth, increase density and facilitate greater use of public transit, cycling, and walking
Increase in Housing Stock Density
Increase in Population Density
25% of new housing built in mature areas, downtown and premium transit locations (proposed and pending approval)
8.1 units/ha (increase from 7.9 in 2008)
18.57 persons/ha (dropped from 18.59 in 2003)
5% (down from an average of 18%)
status trend Through aggressive implementation of the land development strategies proposed in Edmonton’s municipal development plan The Way We Grow and its transportation master plan The Way We Move, Edmonton will strive to improve its sustainability. However, for Edmonton to be truly environmentally sustainable in the longterm, large paradigm shifts will likely be required which will be explored further in The Way We Green. Some key challenges include managing growth and integrating transit and land use.
status trend
status trend

Ecovision Annual Report: city of Edmonton 2009
v
PrioriTy STraTeGic objecTiVeS 2009 TarGeTS 2009 MeaSureS /ouTcoMe Key SuSTainabiliTy challenGeS
lAndspills/releasesPrevent environmental harm and risk to human health and safety from accidental releases or spills associated with the City’s operations and facilities and meet or exceed provincial or federal spill reporting and response obligations.
Zero warning letters, protection orders, or penalties for environmental violations
No warning letters, protection orders, or penalties for environmental violations
status trend Although reportable releases were up in 2009 compared to 2008, the releases were contained through the deployment of spill kits and absorbent materials by trained staff, and did not cause serious environmental impacts. The sustainability challenge will be to ensure City employees continue to report releases and response measures are appropriate with an overall strategy to transition from the use of toxic and or environmentally hazardous substances to more environmentally preferred products over time.
Waste ManageMentMinimize the landfilling of municipal solid waste through reduction, reuse, recycling and recovery.
Downward trend in residential waste generated per capita
Diversion rate of 60% to 2012 (90% post 2012).
7.5% decrease in per capita residential waste compared to 2008
41% (2009 was not a typical year because of the composting facility beingshutdown to construct tie-in to the new Integrated Processing and Transfer Facility)
status trend Edmonton’s system for addressing residential waste incorporates the most leading environmental technology and management systems available. Key challenges include increasing opportunities for recycling and recovery of value from waste generated by the institutional, commercial and industrial sectors. Decreasing the consumption of disposable products is another key challenge for the Edmonton community.
status trend
urban develOpMentSteer urban development in a more environmentally, socially and financially sustainable direction by guiding the type and form of Edmonton’s development to reduce outward urban growth, increase density and facilitate greater use of public transit, cycling, and walking
Increase in Housing Stock Density
Increase in Population Density
25% of new housing built in mature areas, downtown and premium transit locations (proposed and pending approval)
8.1 units/ha (increase from 7.9 in 2008)
18.57 persons/ha (dropped from 18.59 in 2003)
5% (down from an average of 18%)
status trend Through aggressive implementation of the land development strategies proposed in Edmonton’s municipal development plan The Way We Grow and its transportation master plan The Way We Move, Edmonton will strive to improve its sustainability. However, for Edmonton to be truly environmentally sustainable in the longterm, large paradigm shifts will likely be required which will be explored further in The Way We Green. Some key challenges include managing growth and integrating transit and land use.
status trend
status trend
lEGEnd Status Description Trend Description Measure is meeting or exceeding established target Measure is trending up over last reporting period (green positive/red negative) Measure is moderately off of established target Measure has not changed over last reporting period Measure is not meeting established target Measure is trending down over last reporting period (green positive/red negative)

Ecovision Annual Report: city of Edmonton 2009
vi
PrioriTy STraTeGic objecTiVeS 2009 TarGeTS 2009 MeaSureS /ouTcoMe Key SuSTainabiliTy challenGeS
transpOrtatiOnContinuously improve Edmonton’s transportation system by expanding and upgrading public transit, facilitating safe and convenient pedestrian and bicycle transportation, and proactively managing demand for private vehicle transportation.
Mode split: Decrease in car driver share
Increase transit ridership per capita
Decrease vehicle registrations per capita
77% of trips were taken by car (2005).
87.54 rides per capita (decrease from 87.85 in 2008).
Decrease from 0.60 per capita in 2008 to 0.59 per capita
status trend Through aggressive implementation of the land development strategies proposed in Edmonton’s municipal development plan: The Way We Grow and its transportation master plan: The Way We Move, Edmonton will strive to improve its sustainability. However, for Edmonton to be truly environmentally sustainable in the long-term, large paradigm shifts will likely be required which will be explored further in The Way We Green. Some key challenges include reducing dependence on the single occupancy vehicle, promoting mass transit and maximizing active transportation modes in a winter city. status trend
status trend
natural areasIncrease the City’s capacity for the management of natural areas and expand Edmonton’s ecological network through securement and restoration
82 ha/year of Priority Natural Areas secured
110 ha secured in 2009 status trend Although progress is being made, Edmonton continues to experience significant losses of natural areas as population grows (50 ha of priority natural areas lost in 2009). In addition, Edmonton is experiencing record local drought conditions and more severe conditions than any other area on the Prairies. These extreme drought conditions are resulting in losses of trees, drying of wetland habitat, and if this trend continues, greater losses to biodiversity. For a number of reasons, Edmonton has fewer wetlands and as a result there is a loss of the ecological services that they provide.
COntaMinated landsProtect public health, the environment and community quality of life from negative impacts related to contaminated land, and maximize opportunities to reclaim and subsequently redevelop currently contaminated land.
Disburse a minimum of $100,000 through the Pilot Brownfield Redevelopment Grant
As of 2009, no funds have been disbursed.
status trend Redevelopment of brownfields is a component of community revitalization. When these sites remain vacant or underutilized, they are a lost economic opportunity and an impediment to the ongoing viability of the community. In late 2009, City Council initiated the formation of a Contaminated Gas Station Task Force. The task force is exploring the challenges associated with contaminated lands with the intent to put forward recommended solutions that will promote redevelopment of brownfield sites that were historically operating as gas stations.
tOxiC substanCesReduce City use of household, commercial and industrial hazardous or toxic materials from all aspects of office, recreational facility, transit and public works in order to minimize dispersion of these substances into the environment.
Reduction in products used by the City with toxic or hazardous constituents. In 2010, the Sustainable Purchasing Policy set a target of evaluating nine ‘spend categories’ where green criteria can be implemented.
42 products were replaced across the City with less toxic alternatives.
status trend They key challenge with green procurement in a complex organization is to apply effort across all ‘spend categories’ in a systematic manner. Aggressive implementation of the Sustainable Purchasing Policy will help to ensure environmental criteria and sustainability principles are applied consistently across the corporation.
pestiCidesContinuously reduce the amounts of toxic pesticides used by the City of Edmonton and minimize the potential for chemical pesticides to be dispersed into the environment.
Continuously reduce toxic pesticide use
Treat<10% of Parks turf with herbicides
Conduct seven integrated pest management studies
Lowest pesticide use in 17 years
5.5% of turf treated with herbicides
Two completed in 2009
status trend The City’s policy for Integrated Pest Management is founded on the need for a deeper understanding of issues in natural systems and a scientific approach to investigation and problem solving which can be a barrier to implementation. Ecologically-based solutions are typically more complex but once achieved provide longer lasting solutions that can benefit the whole community.
status trend
status trend
lAnd continued

Ecovision Annual Report: city of Edmonton 2009
vii
PrioriTy STraTeGic objecTiVeS 2009 TarGeTS 2009 MeaSureS /ouTcoMe Key SuSTainabiliTy challenGeS
transpOrtatiOnContinuously improve Edmonton’s transportation system by expanding and upgrading public transit, facilitating safe and convenient pedestrian and bicycle transportation, and proactively managing demand for private vehicle transportation.
Mode split: Decrease in car driver share
Increase transit ridership per capita
Decrease vehicle registrations per capita
77% of trips were taken by car (2005).
87.54 rides per capita (decrease from 87.85 in 2008).
Decrease from 0.60 per capita in 2008 to 0.59 per capita
status trend Through aggressive implementation of the land development strategies proposed in Edmonton’s municipal development plan: The Way We Grow and its transportation master plan: The Way We Move, Edmonton will strive to improve its sustainability. However, for Edmonton to be truly environmentally sustainable in the long-term, large paradigm shifts will likely be required which will be explored further in The Way We Green. Some key challenges include reducing dependence on the single occupancy vehicle, promoting mass transit and maximizing active transportation modes in a winter city. status trend
status trend
natural areasIncrease the City’s capacity for the management of natural areas and expand Edmonton’s ecological network through securement and restoration
82 ha/year of Priority Natural Areas secured
110 ha secured in 2009 status trend Although progress is being made, Edmonton continues to experience significant losses of natural areas as population grows (50 ha of priority natural areas lost in 2009). In addition, Edmonton is experiencing record local drought conditions and more severe conditions than any other area on the Prairies. These extreme drought conditions are resulting in losses of trees, drying of wetland habitat, and if this trend continues, greater losses to biodiversity. For a number of reasons, Edmonton has fewer wetlands and as a result there is a loss of the ecological services that they provide.
COntaMinated landsProtect public health, the environment and community quality of life from negative impacts related to contaminated land, and maximize opportunities to reclaim and subsequently redevelop currently contaminated land.
Disburse a minimum of $100,000 through the Pilot Brownfield Redevelopment Grant
As of 2009, no funds have been disbursed.
status trend Redevelopment of brownfields is a component of community revitalization. When these sites remain vacant or underutilized, they are a lost economic opportunity and an impediment to the ongoing viability of the community. In late 2009, City Council initiated the formation of a Contaminated Gas Station Task Force. The task force is exploring the challenges associated with contaminated lands with the intent to put forward recommended solutions that will promote redevelopment of brownfield sites that were historically operating as gas stations.
tOxiC substanCesReduce City use of household, commercial and industrial hazardous or toxic materials from all aspects of office, recreational facility, transit and public works in order to minimize dispersion of these substances into the environment.
Reduction in products used by the City with toxic or hazardous constituents. In 2010, the Sustainable Purchasing Policy set a target of evaluating nine ‘spend categories’ where green criteria can be implemented.
42 products were replaced across the City with less toxic alternatives.
status trend They key challenge with green procurement in a complex organization is to apply effort across all ‘spend categories’ in a systematic manner. Aggressive implementation of the Sustainable Purchasing Policy will help to ensure environmental criteria and sustainability principles are applied consistently across the corporation.
pestiCidesContinuously reduce the amounts of toxic pesticides used by the City of Edmonton and minimize the potential for chemical pesticides to be dispersed into the environment.
Continuously reduce toxic pesticide use
Treat<10% of Parks turf with herbicides
Conduct seven integrated pest management studies
Lowest pesticide use in 17 years
5.5% of turf treated with herbicides
Two completed in 2009
status trend The City’s policy for Integrated Pest Management is founded on the need for a deeper understanding of issues in natural systems and a scientific approach to investigation and problem solving which can be a barrier to implementation. Ecologically-based solutions are typically more complex but once achieved provide longer lasting solutions that can benefit the whole community.
status trend
status trend
lEGEnd Status Description Trend Description Measure is meeting or exceeding established target Measure is trending up over last reporting period (green positive/red negative) Measure is moderately off of established target Measure has not changed over last reporting period Measure is not meeting established target Measure is trending down over last reporting period (green positive/red negative)
lAnd continued

Ecovision Annual Report: city of Edmonton 2009
viii
PrioriTy STraTeGic objecTiVeS 2009 TarGeTS 2009 MeaSureS /ouTcoMe Key SuSTainabiliTy challenGeS
WAtERWater COnservatiOn COMMunityConserve water and improve residential and commercial water use efficiency in Edmonton
250 L/person/day 223 L/person/day status trend Obtaining a complete understanding of how water is allocated between domestic, industrial and commercial users is required to ensure Edmonton is moving towards long-term environmental sustainability. The Way We Green will explore available information on this subject and look for a better understanding of the relative risk to Edmonton’s sustainability.
Water COnservatiOn-City OperatiOnsConserve water and improve water use efficiency in City Operations
3,000 cubic meters of water reused from swimming pools
3,254 cubic meters reused status trend Some great successes have been shown in areas such as swimming pool water recycling; however, the principles of conservation must be more systematically applied across the corporation if the intent of the strategic objective is to be met.
Water Quality – drainageProtect the quality of water entering the North Saskatchewan River so it can support a diversity of uses.
Continual improvement of Edmonton Watershed Contaminant Reduction Index (>7.45 is Good) and Downstream River Water Quality Index (>81 is Good, > 96 is Excellent).
EWCRI: 7.9 in 2009 (Good) – Improvement from 6.9 in 2008
RWQI: 85 in 2008 (Good) – Improvement from 83 in 2007. 2008 is last year data is available.
status trend Edmonton’s collection system and wastewater treatment are well-developed core municipal services that use advanced management, monitoring and environmental technologies to protect public health and the environment. However, the 2006 Environmental Strategic Plan indicates one of the key challenges for long-term environmental sustainability with respect to this category will be to reduce the volume of wastewater/stormwater that ultimately needs to be collected and managed through this centralized system. This will require community water conservation measures and greater use of Low Impact Development concepts that promote on-site management of stormwater and reduction/recycling of wastewater at the source. These ideas will be further explored in The Way We Green.
status trend
Water Quality – epCOr gOldbarEnsure that wastewater from Edmonton’s sanitary and combined sewer systems is treated in accordance with best practical technology and is returned to the North Saskatchewan River System so as to minimize negative impacts on downstream water quality.
100% Compliance with discharge limits as per Approval to Operate
100% Compliance status trend
EnviRonMEntAl MAnAGEMEntisO14001 iMpleMentatiOn/MaintenanCeDevelop, implement and maintain ISO14001 Environmental Management Systems in operating areas of the City
Continue to establish, implement and maintain the ISO14001 Environmental Management Systems. Community Facility Services and Corporate Properties register to ISO14001.
All current registrations maintained and one additional branch, Community Facility Services, recommended to proceed with certification in 2010.
status trend Key challenges include the integration of the ISO14001 system with core business that the City is conducting. Using the framework to move from incremental environmental management to long-term environmental sustainability will also be a challenge.

Ecovision Annual Report: city of Edmonton 2009
ix
PrioriTy STraTeGic objecTiVeS 2009 TarGeTS 2009 MeaSureS /ouTcoMe Key SuSTainabiliTy challenGeS
WAtERWater COnservatiOn COMMunityConserve water and improve residential and commercial water use efficiency in Edmonton
250 L/person/day 223 L/person/day status trend Obtaining a complete understanding of how water is allocated between domestic, industrial and commercial users is required to ensure Edmonton is moving towards long-term environmental sustainability. The Way We Green will explore available information on this subject and look for a better understanding of the relative risk to Edmonton’s sustainability.
Water COnservatiOn-City OperatiOnsConserve water and improve water use efficiency in City Operations
3,000 cubic meters of water reused from swimming pools
3,254 cubic meters reused status trend Some great successes have been shown in areas such as swimming pool water recycling; however, the principles of conservation must be more systematically applied across the corporation if the intent of the strategic objective is to be met.
Water Quality – drainageProtect the quality of water entering the North Saskatchewan River so it can support a diversity of uses.
Continual improvement of Edmonton Watershed Contaminant Reduction Index (>7.45 is Good) and Downstream River Water Quality Index (>81 is Good, > 96 is Excellent).
EWCRI: 7.9 in 2009 (Good) – Improvement from 6.9 in 2008
RWQI: 85 in 2008 (Good) – Improvement from 83 in 2007. 2008 is last year data is available.
status trend Edmonton’s collection system and wastewater treatment are well-developed core municipal services that use advanced management, monitoring and environmental technologies to protect public health and the environment. However, the 2006 Environmental Strategic Plan indicates one of the key challenges for long-term environmental sustainability with respect to this category will be to reduce the volume of wastewater/stormwater that ultimately needs to be collected and managed through this centralized system. This will require community water conservation measures and greater use of Low Impact Development concepts that promote on-site management of stormwater and reduction/recycling of wastewater at the source. These ideas will be further explored in The Way We Green.
status trend
Water Quality – epCOr gOldbarEnsure that wastewater from Edmonton’s sanitary and combined sewer systems is treated in accordance with best practical technology and is returned to the North Saskatchewan River System so as to minimize negative impacts on downstream water quality.
100% Compliance with discharge limits as per Approval to Operate
100% Compliance status trend
EnviRonMEntAl MAnAGEMEntisO14001 iMpleMentatiOn/MaintenanCeDevelop, implement and maintain ISO14001 Environmental Management Systems in operating areas of the City
Continue to establish, implement and maintain the ISO14001 Environmental Management Systems. Community Facility Services and Corporate Properties register to ISO14001.
All current registrations maintained and one additional branch, Community Facility Services, recommended to proceed with certification in 2010.
status trend Key challenges include the integration of the ISO14001 system with core business that the City is conducting. Using the framework to move from incremental environmental management to long-term environmental sustainability will also be a challenge.
lEGEnd Status Description Trend Description Measure is meeting or exceeding established target Measure is trending up over last reporting period (green positive/red negative) Measure is moderately off of established target Measure has not changed over last reporting period Measure is not meeting established target Measure is trending down over last reporting period (green positive/red negative)

Ecovision Annual Report: city of Edmonton 2009
x
EnviRonMEntAl policy lEAdERship coMMittEEharvey crone, Deputy City Manager’s OfficeMary Pat barry, Corporate CommunicationsKen block, Fire Rescue Serviceslyall brenneis, Parksrick Daviss, Corporate PropertiesDavid Faber, Corporate Business Strategy and
Performance Planningjohn hodgson, Drainageroy neehall, Waste ManagementPeter ohm, Planning and PolicySteven Phipps, LawSteve rapanos, Fleet Servicesrobert raimondo, EPCORbrian latte, Transportation Planningchris ward, Capital Construction Departmentrob Smyth, Community Facility Services
EnviRonMEnt AdvisoRy coMMittEElina cosentino, Citizen-at-largeMargaret Fairbairn, Environment Canadajoy Fraser, Citizen-at-largecatherine Garvey, Citizen-at-largelori hanson, Citizen-at-largerasel hossain, Citizen-at-largerick Pelletier, University of Albertalarry loven, Citizen-at-largeGeorge watts, King’s University Collegeansar Qureshi, Citizen-at-largeludmilla rodriguez, Capital HealthPaul wyminga, Citizen-at-large
MEMbERs of thE nAtuRAl AREAs AdvisoRy coMMittEEDr. colleen cassady St. clair, U. of Albertabrian charanduk, Urban Development Institutecheryl Feldstein, Wildlife Rehabilitation SocietyGerry haekel, Alberta SRDirl Miller, Citizen-at-largelara Pinchbeck, Citizen-at-largebarbara Sander, Citizen-at-largeDr. Guy Swinnerton, Citizen-at-largeDr. Paul Tiege, Citizen-at-largeDr. Peter Vogels, Citizen-at-largeben willson, Citizen-at-large
Enviso EnviRonMEntAl MAnAGERsKevin bokenfohr, Community Facility Serviceswendy laskosky, DrainageDawn Dixon, Fire Rescue ServicesDan lawrysyn, Edmonton Transitchristian Felske, Waste ManagementSteve reynolds, Roads Design & Constructionchris Saunders, ParksScott Sembaluk, Corporate Propertieshuong Trac, Fleet ServicesKathy wiseman, Transportation Operationsangella Vertzaya, Office of Environment
othER KEy contRibutoRsconnie boyce, Waste ManagementGord jackson, Planning and PolicyStephanie Mccabe, Transportation Planningjanet omelchuk, Planning and PolicyGrant Pearsell, Office of Natural AreasGary woloshyniuk, Office of EnvironmentDoug costigan, Parksleah Girhiny, DrainageGreg heaton, Deputy City Manager’s Officecolin beddoes, Office of EnvironmentKaren yeung, Office of Environmentliliana Malesevic, DrainageTai Munro, Office of Environment
AnnuAl REpoRt contActsMark brostromDirector of Office of EnvironmentPhone: 780.496.5992,email: [email protected]
jim andraisProgram Manager – Corporate Environmental Management SystemsOffice of EnvironmentPhone: 780.944.7520,email: [email protected]
This report was compiled by:Mike MellrossSenior Environmental Project ManagerOffice of Environment
AcKnoWlEdGMEnts

Ecovision Annual Report: city of Edmonton 2009
Ecovision Annual Report: city of Edmonton 2009
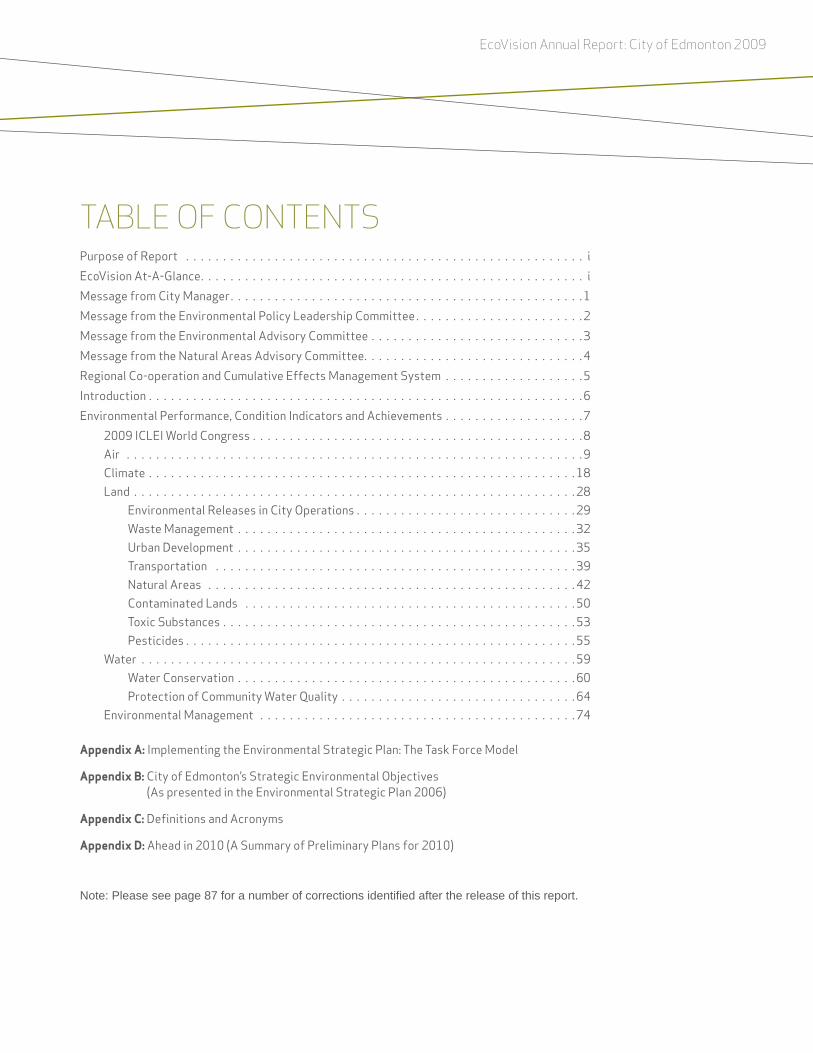
tAblE of contEntsPurpose of Report . . . . . . . . . . . . . . . . . . . . . . . . . . . . . . . . . . . . . . . . . . . . . . . . . . . . . . iEcoVision At-A-Glance. . . . . . . . . . . . . . . . . . . . . . . . . . . . . . . . . . . . . . . . . . . . . . . . . . . . iMessage from City Manager. . . . . . . . . . . . . . . . . . . . . . . . . . . . . . . . . . . . . . . . . . . . . . . . 1Message from the Environmental Policy Leadership Committee . . . . . . . . . . . . . . . . . . . . . . . 2Message from the Environmental Advisory Committee . . . . . . . . . . . . . . . . . . . . . . . . . . . . . 3Message from the Natural Areas Advisory Committee. . . . . . . . . . . . . . . . . . . . . . . . . . . . . . 4Regional Co-operation and Cumulative Effects Management System . . . . . . . . . . . . . . . . . . . 5Introduction . . . . . . . . . . . . . . . . . . . . . . . . . . . . . . . . . . . . . . . . . . . . . . . . . . . . . . . . . . . 6Environmental Performance, Condition Indicators and Achievements . . . . . . . . . . . . . . . . . . . 7
2009 ICLEI World Congress . . . . . . . . . . . . . . . . . . . . . . . . . . . . . . . . . . . . . . . . . . . . . 8Air . . . . . . . . . . . . . . . . . . . . . . . . . . . . . . . . . . . . . . . . . . . . . . . . . . . . . . . . . . . . . . 9Climate . . . . . . . . . . . . . . . . . . . . . . . . . . . . . . . . . . . . . . . . . . . . . . . . . . . . . . . . . . 18Land . . . . . . . . . . . . . . . . . . . . . . . . . . . . . . . . . . . . . . . . . . . . . . . . . . . . . . . . . . . . 28
Environmental Releases in City Operations . . . . . . . . . . . . . . . . . . . . . . . . . . . . . . 29Waste Management . . . . . . . . . . . . . . . . . . . . . . . . . . . . . . . . . . . . . . . . . . . . . . 32Urban Development . . . . . . . . . . . . . . . . . . . . . . . . . . . . . . . . . . . . . . . . . . . . . . 35Transportation . . . . . . . . . . . . . . . . . . . . . . . . . . . . . . . . . . . . . . . . . . . . . . . . . 39Natural Areas . . . . . . . . . . . . . . . . . . . . . . . . . . . . . . . . . . . . . . . . . . . . . . . . . . 42Contaminated Lands . . . . . . . . . . . . . . . . . . . . . . . . . . . . . . . . . . . . . . . . . . . . . 50Toxic Substances . . . . . . . . . . . . . . . . . . . . . . . . . . . . . . . . . . . . . . . . . . . . . . . . 53Pesticides . . . . . . . . . . . . . . . . . . . . . . . . . . . . . . . . . . . . . . . . . . . . . . . . . . . . . 55
Water . . . . . . . . . . . . . . . . . . . . . . . . . . . . . . . . . . . . . . . . . . . . . . . . . . . . . . . . . . . 59Water Conservation . . . . . . . . . . . . . . . . . . . . . . . . . . . . . . . . . . . . . . . . . . . . . . 60Protection of Community Water Quality . . . . . . . . . . . . . . . . . . . . . . . . . . . . . . . . 64
Environmental Management . . . . . . . . . . . . . . . . . . . . . . . . . . . . . . . . . . . . . . . . . . . 74
appendix a: Implementing the Environmental Strategic Plan: The Task Force Model
appendix b: City of Edmonton’s Strategic Environmental Objectives (As presented in the Environmental Strategic Plan 2006)
appendix c: Definitions and Acronyms
appendix D: Ahead in 2010 (A Summary of Preliminary Plans for 2010) Note: Please see page 87 for a number of corrections identified after the release of this report.

1Ecovision Annual Report: city of Edmonton 2009
MEssAGE fRoM city MAnAGERCity Council recognizes that Edmonton’s ongoing viability is intimately connected to the health of the local environment. This is why one of the six 10-year goals in the City’s Strategic Plan: The Way Ahead focuses on the environment. As evidenced in this year’s EcoVision® Annual Report, the City of Edmonton continues to advance the strategic goal of Preserving and Sustaining Edmonton’s Environment while contributing to the approved corporate outcomes including:
• Leveraging partnerships with citizens, communities and organizations to improve Edmonton’s environmental health;
• Minimizing the impact of City operations on air, land, and water systems using leading edge practices;
• Striving to be a leader in environmental advocacy, stewardship, preservation, and conservation; and,
• Integrating life cycle analysis, ecological footprint, environmental assessments, and remediation of contaminated soils and water in decisions around infrastructure.
As the world continues to change it is clear we will need to do much more in the future if we are to become a resilient, sustainable city. We need to be looking strategically forward, ensuring that we fully understand existing and emerging environmental trends and the best ways to respond to them. A resilient city that can weather environmental stressors and continue to provide for the needs of its citizens is a foundational component of sustainability. This year, through the development of The Way We Green, the City of Edmonton will identify the key sustainability factors that pertain to Edmonton and develop a set of place-based strategies that will ensure our resiliency. I look forward to working with all of the dedicated City employees and passionate citizens as we continue to collaborate on building a sustainable Edmonton!
Simon FarbrotherCity Manager, City of Edmonton

2Ecovision Annual Report: city of Edmonton 2009
MEssAGE fRoM thE EnviRonMEntAl policy lEAdERship coMMittEEThe Ecovision Annual Report 2009 presents the progress we have made as a City on the City’s environmental action plans. As the report shows, there have been some great successes in areas such as:
• Pesticide use, where we have seen the lowest pesticide use by City -Operations in the last 17 years;
• Natural areas, where we have secured another 110 ha of land for conservation; and,
• Water quality, where we have seen the continued improvement of water quality downstream of Edmonton.
At the same time it is clear that additional effort is required on other fronts such as:
• Greenhouse gas management, where we observed community carbon dioxide emissions that were 38% above 1990 levels when the target was a reduction of 6%;
• Developing a compact urban form, where we need to continue to increase the amount of housing built in mature areas, downtown and premium transit locations.
With the successes we have seen in 2009, and despite the challenges still facing us as an organization, the intent is still to achieve City Council’s vision for Edmonton to be “the nation’s leader in setting and achieving the highest standards of environmental preservation and sustainability both in its own practices, and by encouraging and enabling the practices of others” and move Edmonton towards a sustainable state in the most efficient possible manner. This will continue to take significant effort and commitment on the part of the entire organization to achieve this vision.
In 2010, the Environmental Policy Leadership Committee will continue to oversee the implementation of the action plans as well as guide the development of The Way We Green. As the year progresses, the Environmental Policy Leadership Committee will make every effort to ensure The Way We Green is aligned with Council’s vision and it is integrated with other strategic plans (e.g. The Way We Grow). The Environmental Policy Leadership Committee looks forward to continuing to work with both City employees and citizens of Edmonton to realize goals outlined in the current environmental strategic plan and help define future practical actions that will continue to move Edmonton towards long-term environmental sustainability.
3Ecovision Annual Report: city of Edmonton 2009
MEssAGE fRoM thE EnviRonMEntAl AdvisoRy coMMittEEThe Environmental Advisory Committee (EAC), in place since 1995, meets regularly on a variety of initiatives and issues surrounding environmental management and provide insight and advice to the senior management team. The committee understands that the rich and spectacular environmental characteristics of the City of Edmonton are more than an addition to the city’s economic and social aspects. We endorse a model which demonstrates that all economic and social aspects of the City of Edmonton fundamentally reside in, and are sustained by, our environment, and we are pleased to contribute in this context.
The past year has seen strategic activity which will have lasting impacts on the City’s management of all aspects of our environment. Activities of the EAC Committee included providing feedback on:
• The Sustainable Fleet Management Plan
• Contaminated Sites Management Strategy – City Properties
• The City Operation’s Greenhouse Gas Reduction Strategy
• The Environmental Strategic Plan Implementation
• Providing feedback on The Way We Move and The Way We Grow
In the coming year the EAC areas of focus will include:
• Reviewing and discussing The Way We Green in the context of developing a ‘sustainability lens’ that can be systematically applied to all decisions the City makes.
• Providing ongoing involvement in the development and implementation of the Environmental Strategic Plan, including being involved as key stakeholders in producing The Way We Green.
• Identifying strategies to engage the community and inspire community organizers and environmental leaders to contribute to Edmonton’s environmental sustainability plan.
• Building on the work completed to date on Food Security and creating linkages to other strategic plans as a segway to The Way We Green.
The EAC applauds the significant work and commitment demonstrated by the leadership team of the City of Edmonton in impacting our environmental landscape. As an advisory committee, we value the opportunity to assist the City of Edmonton in creating and managing a sustainable community.
4Ecovision Annual Report: city of Edmonton 2009
MEssAGE fRoM thE nAtuRAl AREAs AdvisoRy coMMittEEThe Natural Areas Advisory Committee (NAAC) is delighted to see this newest edition of the EcoVision Report. What a wonderful read awaits you! In this document you’ll see factual information about the quality of air, land, and water in Edmonton. Evidence is provided that shows the ways in which Edmonton is changing in response to global trends in climate, environmental policy, and citizen-based initiatives. You’ll see that Edmonton continues to recognize the value of securing and preserving natural areas despite the pressures of development.
The City of Edmonton supported the recently formed “Edmonton and Area Land Trust in order to create an Edmonton region where natural area systems are valued, preserved for future generations and play a key role in the social, economic and environmental life of the residents of the area.” In the past year, the city has secured an additional 110 ha of natural areas within the city. Unfortunately, another 50 ha of key natural areas were lost to conversion to other uses putting at risk the city’s long-term goal to preserve 8% of the city’s total area in a natural state. This risk is especially acute in the tablelands where the loss-to-gain ratio for priority natural areas is currently 3:2. NAAC was pleased to be involved in the organization of the ICLEI Congress [Local Governments for Sustainability] that demonstrated Edmonton’s awareness and commitment to the importance of sustainability at both the local and global levels.
The NAAC is hopeful that as Edmonton continues to grow, planning and development of the city will align with the Natural Areas Systems Policy and the Natural Connections Integrated Conservation Plan, both of which were approved by the City in 2007, and that their guiding principles will be incorporated in the forthcoming The Way We Green plan. These documents lay the foundation for securing the remaining natural areas in the city and managing them ecologically to maintain biodiversity for the health, enjoyment, and engagement of future Edmontonians.
This report contains the vision of those documents as one of the Priority Strategic Objectives and highlights the challenge of expanding our ecological network while we still have the opportunity. The time to act is now to protect our remaining natural areas! By choosing to do so, Edmontonians will be giving support to every one of the objectives in this report. Each of these objectives ultimately addresses the healthfulness of the air, land, and water on which the quality of our own lives depend, but also those of other species and future generations. This quality of life is utterly dependent on the aesthetic qualities and ecosystem services provided by natural areas in the river valleys, ravines and tablelands of Edmonton. Please take the time to read this report, absorb the excellent information contained within it, and think about the changes you can make to support a healthy environment in our city.

5Ecovision Annual Report: city of Edmonton 2009
REGionAl co-opERAtion And cuMulAtivE EffEcts MAnAGEMEnt systEMOn October 1, 2009, the Alberta Land Stewardship Act (ALSA) was proclaimed. The ALSA sets out a regional planning process developed to improve the management of land and natural resources. ALSA provides direction for the development of regional plans, including strategies that will need to be implemented as part of regional plans. ALSA requires that these plans account for the cumulative environmental effects that planned activities have on the land. Although municipalities have the same decision-making authority as they did before the ALSA, they will have to align their plans, bylaws and decisions with regional plans.
Prior to the ALSA being proclaimed, the province developed the Land-use Framework (LUF). The LUF “is a comprehensive approach to planning to better manage public and private lands and natural resources to achieve Alberta’s long-term economic, environmental and social goals.” There are seven regions defined under the LUF based on major watersheds; Edmonton resides in the North Saskatchewan region. LUF and the Water for Life Action Plan call for the completion of a management plan for the North Saskatchewan River focusing on cumulative effects.
Each region will eventually need to develop a regional plan as well as sub plans. In April 2008, the Province of Alberta passed legislation creating the Capital Region Board (CRB), a body made up of the City of Edmonton and 24 surrounding municipalities. The CRB was tasked to create one of the first of the aforementioned sub plans. The Capital Region Growth Plan: Growing Forward, was submitted to the Minister of Municipal Affairs
in stages beginning on April 2, 2009 and ending on December 31, 2009. The CRB was required to include four component plans in the Capital Region Growth Plan:
• A comprehensive, integrated regional land use plan that identifies priority growth areas and sets density targets
• A regional intermunicipal network transit plan
• A plan to coordinate geographic information services
• A plan for social and market affordable housing
The Province adopted the Capital Region Growth Plan by regulation effective March 31, 2010. The Capital Region Growth Plan sets the stage for growth in and around Edmonton and will have a direct link to Edmonton’s long term environmental sustainability. One of the six principles in the plan is protection of the environment and resources and the plan indicates that implementation will require “significant information and data on the environment including the cumulative environmental effects of development.”
The Cumulative Effects Management System (CEMS) has been developed by the province to assist in implementing the regional and sub-regional plans. The CEMS defines a formal process that considers place-based environmental outcomes in the context of continued economic prosperity and promotion and development of liveable communities. The CEMS is intended to acknowledge the limits of local ecosystem capacity and shift away from single medium, incremental environmental management to multi-media, cumulative effects management.

6Ecovision Annual Report: city of Edmonton 2009
intRoductionEcovision Annual Report 2009 presents the results of the implementation of action plans that have been developed within 17 priority environmental objectives and provides comment on the current state of each of the objectives in relation to Edmonton’s long-term environmental sustainability. The priority environmental objectives advance the goal of Preserving and Sustaining Edmonton’s Environment1 while contributing to City Council-approved corporate outcomes.
what is environmental sustainability? It has been stated in frameworks such as the Natural Step that the best way to define sustainability is to model the ideal sustainable state based on an area’s specific local circumstances. This idea of Place-Based Sustainability is a foundational construct driving the City of Edmonton’s evolving approach to environmental management. As The Way We Green, the City of Edmonton’s environmental sustainability plan is developed in 2010, a positive end-state of what a sustainable Edmonton will look like will be fully defined and the principles (or axioms) of sustainability clarified. However, for the purposes of this report the following generalized definition of a sustainable city has been adopted2:
“An environmentally sustainable city is a city that can be sustained indefinitely by the environment. The environment is able to provide all the resources it needs and absorb all the waste/pollution it generates in perpetuity”.
where are we today? EcoVision Annual Report 2009 continues to report progress on the City’s Environmental Strategic Plan by evaluating condition indicators, program status and, whenever possible, quantifiable performance measures. This reporting framework measures the progress of the environmental objectives of the City. This year’s report also includes sustainability context around each of the objectives. The intent is for this year’s report to serve as a snapshot of sustainability as input into the development of The Way We Green.
report organization: This report is organized by focus area – Air, Climate, Land, Water and Environmental Management – leading off with a summary of the 2009 ICLEI World Congress. Sustainability context is provided for each of the focus areas followed by performance reporting for the 17 priority environmental objectives that the City has adopted from the 2006 Environmental Strategic Plan. Appendix A outlines the process that was used in 2008 to arrive at these priority objectives. Appendix B summarizes all 52 strategic objectives outlined in the City’s 2006 Environmental Strategic Plan. Definitions and acronyms are found in Appendix C. Appendix D summarizes some key actions and programs that are being pursued in 2010.
1 The Way Ahead: City of Edmonton Strategic Plan (2009 – 2018).2 This definition originally appeared in the City’s Ecovision Annual
Report 2007

7Ecovision Annual Report: city of Edmonton 2009
EnviRonMEntAl pERfoRMAncE, condition indicAtoRs And AchiEvEMEnts

8Ecovision Annual Report: city of Edmonton 2009
The ICLEI World Congress takes place every three years and provides Mayors, local government elected officials and staff, representatives from international agencies, national governments, donors and other partners with the opportunity for peer exchanges, knowledge-sharing, capacity building and on-site visits and exhibits.
More than 600 delegates worldwide came to Edmonton for the ICLEI World Congress from June 14 to June 18, 2009. The purpose of the event was to foster the exchange of ideas among innovative and leading local governments and to help them in forming their strategies.
The message taken away from the ICLEI Congress was that there is a “need for Faster and Pervasive action” The results of the Congress were synthesized by the ICLEI Deputy Secretary General and Regional Director for Europe, into five strategic directions:
1. radiCal Change reQuires radiCal deCisiOn Makers!
Radical means faster, deeper, and more far-reaching than anything we have done thus far!
2. understand it, lOCalize it, CustOMize it and huManize it!
Understanding the global challenges requires a more effective link between research and action. Mechanisms must be found which work locally to address global problems. Citizens must “feel” that they can change global problems. Global problems must be brought or broken down to an individual level.
3. integrated aCtiOn – peak everything!The global crisis requires us to look at all issues in an integrated way – water, energy, biodiversity, planning, land-use, waste, and governance. The biggest challenge is to take sustainability action while addressing simultaneously the economic, financial and social crises.
4. Make the business Case – Make the pOlitiCal/eleCtiOn Case!
Money talks: figures must underpin facts and strategic directions. For example, carbon mitigation programs will often pay for themselves through energy savings.
5. behaviOural Changes and prOduCtiOn patterns: Change theM!
Balance democratic access to goods and services with energy and resource efficiency. Specifically, in developed countries, there is a particular need to induce lifestyle changes among young people.
The 2009 ICLEI Congress was a call to action for local governments to take the lead on environmental sustainability.
About iclEiICLEI was founded in 1990 and is officially called ‘ICLEI-Local Governments for Sustainability’. Over 1000 cities, towns, counties, and their associations worldwide comprise ICLEI’s growing membership. ICLEI works with these and hundreds of other local governments through international performance-based, results-oriented campaigns and programs.
2009 iclEi WoRld conGREss

9Ecovision Annual Report: city of Edmonton 2009
About cAsAThe Clean Air Strategic Alliance (CASA) was established in March 1994 through ministerial order as a new way to manage air quality issues in Alberta. CASA is a multi-stakeholder partnership, composed of representatives selected by industry, government and non-government organizations, which recommends strategies to assess and improve air quality in Alberta.
AiRThe majority of air quality concerns in the Edmonton region are a result of the refinement and/or combustion of carbon-based energy sources either at a point source (i.e. industrial emissions) or through diffuse sources (i.e. on-road transportation). The interconnectedness of the quality of the air with other key sustainability factors is readily apparent. The issue of maintaining good air quality is complex but the desirable outcome can be stated clearly as it has been in the Clean Air Strategic Alliance’s (CASA’s) vision:
The air will have no adverse odour, taste or visual impact and have no measurable short- or long-term adverse effects on people, animals or the environment.
Historically, the environmental management of emissions has focused on continual improvement of emissions control technologies both for industrial facilities and vehicles. As a result of improving pollution control technologies, we have seen generally good air quality in the Edmonton region for the past 15 years. This improvement has occurred even though the number of cars on the road has increased and additional industrial facilities have been constructed.
This being said, as indicated in the 2009 CASA report entitled Recommendations for a Clean Air Strategy, there are significant and growing pressures on Alberta’s air including continued industrial growth, increased development in the oilsands, the ongoing development of Alberta’s conventional energy reserves, an influx of people to the province, and strong urban growth. All have the potential to affect air quality. It begs the question, at what point will these cumulative impacts begin to exceed the capacity of the region’s environment to deal with them?
The Edmonton region is already seeing some indications of adverse impacts to its air quality. Increasing levels of ozone in the Edmonton Census Metropolitan Area (CMA) between 2002 and 2004 triggered the “action” threshold when compared to the Canada Wide Standards. In response, Alberta Environment called for an Ozone Management Plan to be developed. The Ozone Management Plan was developed jointly by the three airsheds in the CMA and accepted by the province in early 2009. The Ozone Management Plan outlines 19 recommendations with 32 activities to be undertaken in the near and long term. Implementation is being undertaken jointly by the Alberta Capital Airshed Alliance (ACAA), Fort Air Partnership, West Central Airshed Society, Alberta Environment and the various municipal and industrial partners.
10Ecovision Annual Report: city of Edmonton 2009
air suMMARy of pERfoRMAncE MEAsuREs And condition indicAtoRsobjective: Continually reduce total air pollutant emission levels from City of Edmonton operations (vehicles, buildings, other). indicator Target 2009 resultsOxides of Nitrogen (Municipal Fleet including DATs1) Reduction of 80% NOx and
95% PM2.5 by 202526% increase from 2008
Particulate Matter 2.5 (Municipal Fleet including DATs) 5% Increase from 2008Oxides of Nitrogen (Transit Fleet) Reduced 1.8 tonnes of NOxParticulate Matter 2.5 (Transit Fleet) Reduced 0.43 tonnes of PM2.5
objective: Strive to ensure that Edmonton ambient air quality meets or surpasses national and provincial air quality standards and guidelines by encouraging community action.indicator Target 2009 resultsAir Quality Index 97% or better In 2009 there was a slight
increase in percentage of ‘good’ air quality hours from 96.19% in 2008 to 96.51% in 2009
Ozone Exceedances3 0 Central 00 East 00 South 2
Particulate Matter 2.5 Exceedances4 0 Central 10 East 2 0 South 2 0 McIntyre5 8
Nitrogen Dioxide Exceedances6 0 Central 00 East 00 South 0
NOTES:1. DATS – Disabled Adult Transit Service2. Derived from an analysis of normal fleet turnover (COE Sustainable Fleet Management Plan, 2009). This is an expected
outcome but it has yet to be formally adopted as a target for the corporation.3. Ozone hourly Alberta Ambient Air Quality Objectives of 0.082 ppm is exceeded4. A Particulate Matter (PM2.5) event occurs when the daily Alberta Ambient Air Quality Objectives of 30 ugm-3 is exceeded5. Edmonton McIntyre is an Alberta Environment monitoring station that only collects data on particulate matter.6. A Nitrogen Dioxide event occurs when the hourly Alberta Ambient Air Quality Objectives of 400 ugm-3 is^sexceeded

11Ecovision Annual Report: city of Edmonton 2009
bAcKGRoundThe monitoring and management of air quality in the Edmonton region is the shared responsibility of multiple parties including Alberta Environment, various industrial approval holders, and the provincially endorsed Alberta Capital Airshed Alliance (ACAA), which is a multi-stakeholder group that provides a forum for local stakeholders to design solutions to local air quality issues. The City of Edmonton participates in various air quality management programs as an active member of the ACAA.
AiR QuAlity MonitoRinGCurrently, the ambient air quality monitoring network in Edmonton is operated jointly by the provincial government and various industrial approval holders. There are three ambient air quality monitoring stations that are configured to measure air contaminants and calculate the provincial air quality index (AQI). These three stations are directly managed by Alberta Environment. Alberta Environment also operates a fourth station that measures only particulate matter (Edmonton McIntyre). In addition to the Province’s stations, there are six industry-operated stations that are situated around industrial areas in the east and west areas of the City. These six stations monitor air quality contaminant concentrations that are specific to the provincial approvals that relate to each of the industrial operators.
AiR QuAlity MAnAGEMEntThrough the industrial approval process, there are specific requirements for many industrial facilities in Edmonton to control their air quality emissions and continually improve the management of their emissions. However, these approved industrial facilities, referred to as point sources, are only part of the air quality picture in Edmonton as not all industrial facilities and commercial businesses with the potential to produce air emissions are subjected to the provincial approvals process. In addition, many emissions originate from diffuse, or non-point sources, such as personal vehicles, agriculture or home heating. All of the sources of air emissions must be viewed cumulatively in the region and managed as a whole to maintain good air quality. This level of management in Edmonton is the purview of the ACAA which derives its mandate from the provincial government through the Clean Air Strategy. With input from its members, the ACAA undertakes the development and implementation of management strategies to address specific air quality issues in Edmonton.
tREnds And AnAlysis
Air Quality index
Table 1: Air Quality Index Summary (Edmonton)
aQi Summary report january 1, 2009 to December 31, 2009
Good (0 – 25) Fair (26 – 50) Poor (51 – 100) Very Poor (>100)Station name % % % %
Edmonton Central 98.49 1.46 0.05 0Edmonton East 95.99 3.91 0.10 0Edmonton South 95.07 4.87 0.06 0All of Edmonton 96.46 3.47 0.07 0
12Ecovision Annual Report: city of Edmonton 2009
% o
f Tim
e
Edmonton CentralEdmonton EastEdmonton NorthwestEdmonton South
100.00
90.00
80.00
70.00
60.00
50.00
40.00
30.00
20.00
10.00
0.001997 1998 1999 2000 2001 2002 2003 2004 2005 2006 2007 2008 2009
1997 1998 1999 2000 2001 2002 2003 2004 2005 2006 2007 2008 200999.75 98.93 97.11 98.11 98.34 99.51 98.68 99.08 98.46 98.4998.06 93.92 94.09 94.99 95.96 98.98 96.26 96.26 95.61 95.99
86.71 96.15 96.19 93.37 96.64 94.26 97.49 99.0699.69 95.39 96.47 94.50 95.07
Figure 1: Air Quality Index Trend (Edmonton)
Long Term trend of Good Air Quality (AQI) in Edmonton
Edmonton’s air quality has improved significantly since the 1970s (this long term trend is not shown in Figure 1). The number of “Good” air quality hours in 2009 slightly increased over 2008 from 96.19% to 96.51% but remains slightly below the provincial target of 97%. In general, the majority of days with poor air quality involved particulate matter and can largely be attributed to temperature inversions during the winter months. However, the September grass fire in Lamont also contributed particulate matter-induced poor air quality in Edmonton in 2009.
WhERE ARE thE AlbERtA EnviRonMEnt AiR QuAlity MonitoRinG stAtions locAtEd?Edmonton Central: 10255 – 104 Street
Edmonton East: 105 Avenue and 17 Street
Edmonton South: 6240 – 113 Street
Edmonton McIntyre: 4946 – 89 Street

13Ecovision Annual Report: city of Edmonton 2009
Alberta Ambient Air Quality objectives (AAAQo)
The Alberta Ambient Air Quality Objectives (AAAQO) provides values that represent acceptable hourly and daily concentrations for select criteria air contaminants (CACs) including ozone and PM2.5. Comparisons are used:
• for airshed planning and management
• as a general performance indicator
• to assess local concerns
The summary of performance measures outlines the number of times the AAAQOs were exceeded in 2009 for each of the Alberta Environment-operated monitoring stations in Edmonton. Although the AAAQOs were exceeded for some parameters in 2009, they only represent isolated events and trending information does not suggest these are becoming chronic issues.
Alberta Environment has reported that an emerging, statistically significant trend was identified at the Edmonton east station. Benzene concentrations in Edmonton have generally decreased from 1991 to 2001, however, peak concentrations at Edmonton East have been increasing since 2002. In general, vehicle emissions are the main source of benzene in Alberta, however, benzene can also be formed during oil refining processes or enter the air through evaporation from handling and storing fuels. The Edmonton east station is located in the vicinity of several petrochemical refineries and storage facilities. Although these facilities are a possible source of the benzene identified at the Edmonton east location, Alberta Environment has indicated that investigations into this trend are ongoing and firm conclusions have not yet been made.
city operations
Environment Canada has set stringent emission regulations to control criteria pollutants from motor vehicles. The effect of these regulations on emissions from City vehicles will be dramatic in coming years. According to information within the City’s Sustainable Fleet Management Plan, NOx and PM emissions are expected to decline by approximately 80% and 95% respectively in the next 15 years through normal fleet turnover, even in the absence of programs related to alternative technology or fuels. In 2009, the NOx and PM2.5 emissions from
the municipal fleet were calculated beginning with the baseline year of 2008. This information, combined with the fleet retirement monitoring, will allow the evaluation of emissions reductions over time to ensure we are meeting the expected outcome outlined in the Sustainable Fleet Management Plan.
Figure 2: Light Duty Gasoline Vehicles Retired
Pre 1981 1981 – 1993 1994 – 2003 2004 – 20080
1
2
3
4
5
3
5
00
Year Range
Figure 3: Heavy Duty Gasoline Vehicles Retired
0
5
10
15
20
0 0 1
9
20
2
Pre 1979
1979 - 1986
1987 - 1990
1991 – 1997
1998 - 2004
2005 - 2008
Year Range

14Ecovision Annual Report: city of Edmonton 2009
Figure 4: Heavy Duty Diesel Vehicles Retired
0 0 0 0
3
1 1 1 1
Pre 1979
1979 - 1987
1988 - 1989
19901991 - 1
9931994– 1
9971998 – 2
0032004 – 2
0062007 - 2
008
0
1
2
3
Municipal fleet
In 2009, 47 municipal fleet vehicles were replaced with newer models (Figures 2, 3 and 4 show the replacement by age class). Monitoring fleet turnover by age and engine class can provide valuable information on how quickly emissions reductions are being realized and if projections of reductions in emissions are on track. The above graphs report vehicle retirements by age of vehicle. In the absence of growth in the fleet or an increase in kilometres traveled, the NOx emissions would have decreased by an estimated 1.5 tonnes and PM2.5 would have been reduced by approximately 0.034 tonnes. However, total NOx and PM emissions from the municipal fleet (which includes the DATS buses) in 2009 were 46.5 tonnes and 1.5 tonnes, respectively. This represents an increase from the baseline year of 2008 of 2.6 tonnes of NOx (or 6%) and 0.075 tonnes of PM (or 5%)3. During the last year, the average distance traveled for the municipal fleet increased
from 21,711,655 km to 24,835,639 km or 14%. As the municipal fleet continues to expand with the growing City, the number of units required and kilometres traveled will continue to increase making absolute emissions reductions more of a challenge.
transit fleet
Over 2009, 48 older General Motors (GMC) buses were retired and replaced with low-emission New Flyer clean diesel buses. The staged retirement of the older GMC buses in 2009 resulted in an estimated reduction of 1.8 tonnes of NOx and 0.43 tonnes of PM. The development of a more detailed model similar to the municipal fleet model to track changes in the emissions profile of the Transit fleet is being considered in 2010. Integrating these two measures will better reflect the reductions in emissions on the entire City fleet.
3 Emissions data from the municipal fleet are still preliminary and future reductions may still be realized as vehicle emissions regulations become more stringent. In 2010, the federal government introduced mandatory emission rules for cars and trucks. The new measures will force each automaker to achieve a combined average fuel economy of 6.6 litres of gasoline usage for every 100 kilometres driven.

15Ecovision Annual Report: city of Edmonton 2009
AchiEvEMEntsinitiative/Program/action Description 2009 results/achievementsAmbient Air Quality Network Rationalization In 2009, the ACAA initiated an evaluation of the existing ambient
air monitoring network within the airshed with the intent to make recommendations for any necessary improvements. Currently, the network consists of ten continuous air monitoring stations including four operated by Alberta Environment, one by Lehigh Inland Cement, and five by Strathcona Industrial Association. The network evaluation report will describe current emission inventories, current continuous and passive monitoring programs, and any shortcomings in air quality information or technical requirements. The goal is to develop a plan for a state-of-the-art air monitoring network that provides comprehensive, accurate and reliable information to decision-makers for air quality management and control. Results of the review are expected in late 2010.
Fuel Sense Program and Idle Control Directive/Procedure
City of Edmonton drivers are trained to drive fuel efficiently and avoid unnecessary idling. In 2009, 94 municipal fleet drivers and 226 bus drivers received Fuel Sense training. This training is now mandatory for all employees that drive on a regular basis for the City. In 2009, Transit Inspectors conducted checks throughout the city to monitor bus operator compliance to the Idle Control Work Procedure. A total of 2141 buses were monitored citywide. Overall, 81.9% of buses met the idle control criteria. This is an improvement from 2008 numbers which indicated a compliance rate of 47%.
Opacity Testing As part of its preventative maintenance program, Edmonton Transit performed opacity testing on its conventional bus fleet. It is Edmonton Transit’s expectation that no bus exhaust should exceed a set opacity reading of 15%, and that the average of all the buses tested should not exceed 10%. If a bus should exceed the 15% threshold, it is removed from service and maintenance is performed to reduce emissions. In 2009, one bus out of 211 buses tested exceeded the 15% criterion, and the average for all the buses tested was 2.2%. With over 900 buses in the City Fleet, this proactive initiative helps to maintain good air quality in the region.
Idle Free Education Campaign Be Idle Free: A Minute or Less is Best is a new City program encouraging Edmonton motorists to turn off their car’s engine if they sit idle for more than one minute, except in traffic. Messaging and graphics were developed based on the Province of Alberta’s Idle Free Schools educational program; downloadable posters and brochures were created and made available on the City website; and messaging and information were distributed to the Community Services department to include in various community newsletters.

16Ecovision Annual Report: city of Edmonton 2009
initiative/Program/action Description 2009 results/achievementsOzone Management Plan (OMP) Implementation Status
The following provides an update on municipal actions in the OMP:action: Municipalities throughout the Edmonton CMA should consider the implementation of consistent anti-idling legislation.
Progress: Edmonton has developed an education campaign that has consistent messaging with partners around the region including Alberta Environment, the Alberta Capital Airshed Alliance, and other municipalities such as St. Albert. In addition, the City participated in a collaboration workshop to focus Idle free messaging and ensure maximum efficiency of overlapping programs. An Idle Free By-law will return for City Council consideration in late 2010.
action: Improvements to the ambient monitoring networks should be initiated to:
i. ensure that management plan initiatives are achieving the expected air quality outcomes.
ii. ensure ambient monitoring networks are providing the necessary information.
iii. to better understand reasons for exceedances.
Progress: The City of Edmonton is participating, through the Alberta Capital Airshed Alliance, in an exercise to evaluate the ambient air quality network. The work is expected to be completed by the end of 2010.
action: Regional planning should be encouraged to choose designs that promote a denser, more sustainable urban form.
Progress: The City of Edmonton has considered both compact urban form and sustainable transportation planning in its Municipal Development Plan and Transportation Master Plan. The Capital Region Plan has density targets and defined priority growth areas.
Odour Monitoring Program The City of Edmonton’s Ambient Air Odour Monitoring Program provides detailed analysis of calls originating in the Gold Bar Industrial Area (GBIA) and the Northeast Industrial Area (NEIA), or those calls potentially related to industrial operations in these areas. In 2009, the total number of odour calls registered at the 311 call centre was 278. Of these, only 31 calls were from the GBIA and NEIA areas. Results of the investigations into the calls were largely indeterminate.
Volatile Organic Compound Replacement As of 2010, the Transportation Operations Branch uses water-borne paint for traffic line striping to comply with new Federal Regulations on maximum Volatile Organic Compounds (VOC).
17Ecovision Annual Report: city of Edmonton 2009
the urban forest and Air Quality
The Urban Forest Effects Model (UFORE) is a computer program that combines field observations, meteorological information and pollution data to calculate environmental effects, values and structures in the urban forest. In 2009, the City used this model to determine how effective the urban forest is in cleansing the air, carbon storage and reducing stormwater run off. Edmonton is the fifth city in Canada to complete a UFORE analyses. The model suggested that in a 12 month period, the value of air pollution reduction derived from the urban forest plots was in the range of $3,000,000. The urban forest plots removed over 530 metric tonnes of air contaminants including approximately 76 tonnes of NO2 and 180 tonnes of particulate matter.
transportation planning and Air Quality Monitoring
Transportation Planning is utilizing an on-road vehicle emissions inventory simulation (CALMOB6) that allows them to estimate the fuel consumption and criteria pollutant emissions of vehicle traffic on a city-wide scale. The use of sophisticated modeling of air quality impacts as an input into transportation planning is an innovative method that assists the City in meeting both its environmental goals and its transportation objectives. Since 2006, Transportation Planning has improved the accuracy of the simulation and added new features to make the program faster and easier to use. These changes, and others, have developed CALMOB6 into a tool which transportation planners can use to provide quantitative answers to the many “What if ….” questions surrounding transportation infrastructure development and traffic management.
hiGhliGhtinG innovAtion And lEAdERship

18Ecovision Annual Report: city of Edmonton 2009
cliMAtEIn December 2009, delegates from around the world met in Copenhagen to come to an agreement on measures that need to be taken to mitigate the adverse effects of climate destabilization. The result was an agreement on the Copenhagen Accord (‘the Accord’) which states twelve principles and provisions that the signatories have committed to operationalizing beginning in 2010. Canada was one of the signatories.
The Accord affirms the view that anthropogenic emissions have contributed to climate destabilization and confirms the objective to stabilize greenhouse gas concentrations in the atmosphere at a level that would limit the global temperature increase to below 2 degrees celsius. The Accord committed countries, like Canada, to inventory their greenhouse gas emissions and submit mitigation actions to the secretariat of the United Nations by January 31, 2010. At the end of January 2010, Canada announced its target to reduce greenhouse gas emissions by 17% below 2005 levels by 2020.
A report by the Federation of Canadian Municipalities in 20094, indicated that municipalities are leading the “fight against climate change by providing real solutions that have resulted in GHG reductions of over 1.4 million
4 Demonstrating Results: Municipal Initiatives for Reducing GHGs: National Measures Report 2009, Federation of Canadian Municipalities
tonnes since the Partnership in Climate Change Protection program was introduced in the mid 1990s.” It was also reported that municipalities are “proving that their influence goes far beyond their own operations as they have reported reducing GHGs by 308,100 tonnes within the industrial, commercial, institutional (ICI), residential and transportation sectors in their communities.” It is clear that municipalities are well positioned with respect to climate change mitigation. However, there is a significant need for supportive policy and programs from the Provincial and Federal government for the City to make progress towards targets.
Understanding the opportunities and limits of low-carbon energy systems that can meet the needs of Edmontonians while mitigating anthropogenic emissions that contribute to climate change is important to Edmonton’s sustainability. The future supply and distribution of fossil fuels as well as the commitments to reduce CO2 both suggest the future will be carbon constrained. The connections between energy and climate change are undeniable and gaining an understanding of the future sources and availability of energy is extremely important. Both concepts will be explored further in The Way We Green.

19Ecovision Annual Report: city of Edmonton 2009
CLIMATEsuMMARy of pERfoRMAncE MEAsuREs And condition indicAtoRsobjective: Reduce total greenhouse gas emissions from City operations and facilities to achieve the Partners for Climate Protection goal of annual emissions being 20% below 1990 levels by 2008 (in 2009, this was updated to reduce to 1990 levels by 2011). indicator Target 2007 results
Most current year data is availableTonnes of greenhouse gas emissions 20% below 2008 levels by 2011
(return to 1990 levels)17% above 1990 (adjusted in 2010)
objective: Reduce greenhouse gas emissions from the broader Edmonton community.indicator Target 2008 results
Most current year data is availableTonnes of greenhouse gas emissions in Edmonton 6% below 1990 levels by 2010
(12,391,000 TCO2e)
20% below 1990 by 2020 (10,546,000 TCO2e)
18,255,000 TCO2e (38% over 1990)
24.3 tonnes per Edmontonian
indicator Target 2009 resultsNumber of measurable GHG emissions (tonnes) reduced as a direct result of CO2RE rebates and initiatives
Reduction of 5,900 Tonnes Reduction of 5,169 Tonnes
Number of CO2RE members/percentage increase 16,200/20% increase over 2008 15,030/11% increase
bAcKGRoundThe Intergovernmental Panel on Climate Change (IPCC) reports that climate change is one of the most pressing matters in the world today. Much has been written about the changes that are occurring to the Earth’s climate, their likely causes and implications for the future. The world’s climate is changing; data also suggest that Edmonton’s climate is changing. An increase of 0.9°C in normal annual temperature has occurred in the Edmonton region over the past 59 years5.
The City is approaching the challenge of climate change by implementing strategies in both City operations and the community that focus on the mitigation and management of carbon dioxide emissions. In 1999, the city committed to the Federation of Canadian Municipalities Partners for climate Protection (PcP) goal of reducing greenhouse gas
5 The reader is referred to 2007 and 2008 EcoVision Annual Reports for additional information on climate change
emissions to 20% below 1990 levels by 2008. The City of Edmonton is one of the few municipalities in Canada that has met all five milestones outlined in the PcP and it continues to monitor and report its GHG emissions on an annual basis.
To address the community emissions, the CO2RE (Carbon Dioxide Reduction Edmonton) program was initiated. CO2RE was developed by a coalition of more than 20 local companies, non-profit organizations, institutions and government agencies. While the City of Edmonton played a lead role in bringing these diverse groups together, the plan was developed by the community, for the community. CO2RE continues to be an example of municipal leadership.
20Ecovision Annual Report: city of Edmonton 2009
tREnds And AnAlysiscity operations
The City of Edmonton is one of the few municipalities in Canada that monitors and reports its GHG emissions. In 1999, the City committed to the goal of reducing greenhouse gas emissions to 20% below 1990 levels by 2008. In 2008, as it was being projected that this target had not been reached, an adjusted target was put forward as part of the corporate business planning process. The 2008 target was updated in 2009 as part of the corporate
At the end of 2007 (most current data available), the GHG emission levels from City Operations were 17% greater than the level in 1990, with similar levels expected in 2008. Table 2 shows that the City of Edmonton’s GHG emissions have grown from 334,000 tonnes in 1990 to 391,000 tonnes in 2007, a 17% increase. At this level, the City of Edmonton’s GHG emissions are approximately 46% higher than the original target set for 2008.
It would appear that the City of Edmonton’s GHG emissions are not directly correlated to population growth. When divided by population, the City’s operational GHG emissions to service each of 1,000 citizens in 2007 (0.5276) are lower than those of 1990 (0.5520). This ratio reduction could suggest that the efficiency level of the services provided to the population has improved. Also operating in the back of this data is the electricity grid conversion factor. In more recent years the electricity provided to the City of Edmonton has come from sources that produce less carbon dioxide per unit of electrical output. In 1990, 0.984 TCO2e was emitted in the production of one megaWatt hour of electricity. In 2007 only 0.882 TCO2e are emitted in the
production of one megaWatt hour of electricity. It is quite likely that the lower emissions factor plays a significant role in keeping the City’s emissions less than they would otherwise be if the factor had not changed over time.
Figure 5 presents the percentage of the City of Edmonton’s GHG emissions that result from various energy sources. The majority of the City of Edmonton’s emissions are a result of electricity use; this is often referred to as an organization’s indirect emissions. In general, as more renewables are added to the Alberta electricity grid, the carbon intensity of the City of Edmonton’s electricity use will decrease. Electricity use can also decrease through demand reduction programs and efficiency improvements.
Figure 6 shows the GHG breakdown by corporate sector (a term used in the FCM PcP program). The majority of GHG emissions are related to buildings followed by the transit fleet and streetlights. This breakdown is typical of a municipality the size of Edmonton.
Table 2: City Operations – Greenhouse Gas Emissions Trends (adjusted 2010)
1990 2002 2003 2004 2005 2006 2007GHG (TCO2e/yr) 334,274 360,205 386,109 375,743 374,703 382,240 391,194% over/under 1990 0% +7.76% +15.51% +12.41% +12.09% +14.35% +17.03%Per capita* 0.5520 0.5315 0.5602 0.5361 0.5260 0.5234 0.5276
*Representative tonnes of Carbon Dioxide emitted per person in metro Edmonton (i.e., TCO2e/person/yr) due to City Operations and services provided to the population.
Note: All figures have been updated since last year using emissions conversion factors that are considered to be more robust in their derivation than those used previously. This includes an adjustment for lower carbon intensities on the electricity grid.
business planning process to 20% below 2008 levels by 2011 essentially returning to 1990 levels. Targets beyond this time frame are being established within the updated City Operations Greenhouse Gas Management Strategy which is being developed over 2010.

21Ecovision Annual Report: city of Edmonton 2009
Figure 5: City Operations Energy Use (2007)GHG from ContractorsTCO2e/yr, 20,0005%
GHG from Natural GasTCO2e/yr, 58,34615%
GHG from ElectricityTCO2e/yr, 227,88858%
GHG from TransportationFuel TCO23/yr, 84,96022%
Figure 6 City Operations GHG Emissions (2007)COS and Greenspace20,0005%
Buildings169,54943%
Municipal Fleet27,8907%
Transit69,42418%
Streetlights66,52417%
Wastewater37,80710%

22Ecovision Annual Report: city of Edmonton 2009
community
Figure 7: Edmonton’s Community GHG Emissions by Source
1990 2001 2006 2007 20080
5,000,000
10,000,000
15,000,000
20,000,000
Buildings – TCO2e/yrTransportation – TCO2e/yrOther – TCO2e/yr
Year
Figure 8: Annual GHG Emissions per Person
1990 2001 2006 2007 2008Year
0
5.0
10.0
15.0
20.0
25.0
30.0
Tonn
es o
f CO 2
Edmonton’s GHG emissions have increased from 13.2 million tonnes in 1990 to 18.3 million tonnes in 2008, an increase of approximately 38%. Much of this increase can be attributed to Edmonton’s 24% population growth during this period plus significant economic growth6. However, the increasing trend appears to be slowing or even reversing as there was a 3% decrease from 2006 to 2007 followed by only a slight increase of 0.13% in 2008.
Figure 8 shows that per capita GHG emissions have also increased from approximately 22 tonnes per person in 1990 to 24.3 tonnes in 2008 , an increase of 11.5%. The peak of this trend appears to have occurred in 2001 at 28.4 tonnes of CO2 per person per year. Since then, the per capita emissions have been falling. On a sector basis, the most obvious trends are that buildings emissions are falling and transportation is rising.
6 When comparing the numbers to previously published numbers, it is important to note that adjustments have been made to reflect the carbon reductions that have occurred as a result of changes in the electricity grid. As more renewable energy sources have come on line, the carbon dioxide associated with electricity use has reduced in Alberta.

23Ecovision Annual Report: city of Edmonton 2009
AchiEvEMEntsinitiative/Program/action Description 2009 results/achievementscity operationsupdating the city operations GhG emissions Management Strategy
In late 2008, an interdepartmental GHG Management Committee (GMC) was created with a mandate to develop a strategy for reducing greenhouse gas emissions from City operations. Coordinated by Office of Environment, members included representatives from branches most responsible for urban forest development, fleet vehicles, transit vehicles, street lighting and buildings. In 2010 the GHG Management committee will present its new strategy along with accompanying target for GHG emissions management in City operations. A model will be developed to evaluate GHG mitigation options for overall effectiveness.
Sustainable Fleet Management Plan Fleet Services developed a Sustainable Fleet Management Plan in early 2009. The content was reviewed by the Senior Management Team in 2009 and a Light Duty Vehicle Administrative Directive was established to consider right sizing factors and more fuel efficient vehicles such as hybrids as part of the procurement process. It is estimated that a reduction of 54 TCO2e are attributable to these efforts in 2009.
The urban Forest effects Model (uFore) UFORE is a computer program that combines field observations, meteorological information and pollution data to calculate the environmental effects and pollution removal value of the urban forest. In 2009, the City used this model to determine how effective the urban forest is for carbon storage.
energy efficient buildings Effective January 1, 2008, all new City-owned buildings and major renovations will be designed and constructed to meet LEED Silver Standard as a minimum, and be formally LEED certified. The LEED commissioning process involves steps that are integrated in all phases of the project: pre-design, design, construction, and occupancy & operations. The construction of Fire Station #11 was completed in 2009. The following projects have completed the LEED predesign and/or design phase in 2009:
• Animal Services Building
• North Central Recreation Centre and Field House
• Southwest Police Station
• Terwillegar Recreation Community Centre
• Fort Edmonton Park Administration Office energy from landfill Gas An ongoing initiative; EPCOR has been capturing and flaring landfill gas
from the Clover Bar Landfill, and as of 2005 began using the gas to instead generate electricity at the Edmonton Waste Management Centre (EWMC) Roughly 37,000 MWH are generated each year reducing greenhouse gas emissions from the landfill by 146,000 TCO2e. The power generating facility is expected to remain in full operation until 2020.

24Ecovision Annual Report: city of Edmonton 2009
initiative/Program/action Description 2009 results/achievementscity operationsenergy retrofit Program (formerly energy Management revolving Fund (eMrF))
Retrofit projects are part of an ongoing program designed to reduce energy consumption and greenhouse gas emissions volumes from the City’s various facilities. Buildings will continue to be upgraded with respect to energy use through capital funding programs.
In 2009 energy assessments were completed on the DL MacDonald LRT Garage, Donnan/Glengarry/Londonderry Arenas, Kennedale Fleet Services/East Parks Operations/Waste Administration/Drainage Offices, Northgate Lions, and Prince of Wales Armoury. Muttart Conservatory has been approved to receive an Energy Assessment in 2010. Potential exists for the Muttart to be eligible to receive funding for a capital project to retrofit roof storm water harvesting.
Energy retrofits in construction or completed in 2009 include Callingwood/Clareview/Castledowns Twin Arenas, Millwoods Leisure Centre, O’Leary Leisure Centre, and Fire Station #1.
Also, in 2009 the 1 kW photovoltaic solar array on the roof of the Meadows Fire Station was activated. The array is on track to generate roughly 1500 kWh of electricity per year (roughly the equivalent of displacing 1.3 TCO2e).
leD lighting Systems Power used for street lighting and signals accounted for about 17% of the GHG in City Operations in 2009. The Transportation Department is currently operating several LED Street Light Pilot Projects with the intent of reviewing the technology with respect to power consumption, maintenance requirements and ability to meet design guidelines. As part of this review, a detailed assessment is being conducted which will include light level measurements and design simulations along with a cost/benefit analysis for the conversion and operation of an LED System.
Fuel Sense Program Fuel Sense driver education programs will continue for municipal fleet and transit drivers. In 2009, 94 municipal fleet drivers and 226 bus drivers received Fuel Sense training. This training is now mandatory for all employees that drive on a regular basis for the City. Historically, drivers who have received this training were able to reduce their fuel consumption by up to 10%.
lrT expansion Edmonton Transit LRT opened the Belgravia/McKernan and South Campus stations in 2009, contributing to an increase of 20,000 passengers per day on the LRT system. The continued LRT expansion south to Southgate and Century Park stations in 2010 will provide further incentive for people in the newly-serviced areas to consider transit as a viable alternative to driving during rush hour
communityMeasurable Community GHG Emissions Reductions
Community GHG emissions were reduced by 5,169 tonnes in 2009 through CO2RE initiatives including: (a) high-efficiency furnace rebates (3,669 tonnes) (b) New Home Builders rebates for Built Green™ Gold certified homes (1,400 tonnes); and (c) low-income households’ high-efficiency furnace rebates (70 tonnes).

25Ecovision Annual Report: city of Edmonton 2009
initiative/Program/action Description 2009 results/achievementscommunityHigh-Efficiency Gas Furnace Rebates The number of CO2RE furnace rebates issued to Edmontonians significantly
increased in 2009, the final year of the program. CO2RE provided 1,761 households a $500 rebate (matching the federal ecoENERGY Retrofit – Homes program rebate) and 33 low-income households a $2,000 high-efficiency furnace rebate (distributed in conjunction with the federal Residential Rehabilitation Assistance Program (RRAP)). In 2008, these numbers were 648 and 25 respectively
New Home Builders Built Green™ Rebates The number of new home builders, rebates increased significantly in the third year of the program with 35 in 2007, 158 in 2008 and 381 in 2009.
CO2RE Membership Through a variety of membership drives, the number of CO2RE members was increased by 11% to 15,030.
Community Partnerships CO2RE established two new community partnerships to increase its program delivery to Edmontonians including Greening the Avenue and Sustainable Works. CO2RE continued to work with the Edmonton Federation of Community Leagues to complete the first year of the Green Challenge. CO2RE contributed information and resources to the community league starter kits, received by 14 leagues, and awarded the $5,000 prize towards an ecoEnergy retrofit to Ottewell Community League, the Green Challenge winner. CO2RE is also sponsoring the challenge in 2009/2010, offering another $5,000 prize.
Expanded Outreach CO2RE hosted 14 displays and presentations through a combination of tradeshows, lunch-and-learn workshops and special event activities directly reaching an estimated 2,500 residents and business owners.
School Program The CO2RE school presentation was delivered to nine classes through School in the Hall. As well, CO2RE established a collaborative working group with Evergreen Sports Programming and the Government of Alberta’s One Simple Act to deliver CO2RE/EcoVision messaging through GreenZone Blitz Speaker Series. A new Energy Detective program was developed in partnership with Evergreen Sports Programming and the City of Calgary; it will be piloted in 2010.
CO2RE Website The CO2RE website moved to the City of Edmonton website(www.edmonton.ca/co2re). In 2009, it received approximately 43,000 visits
HomeSavers Booklets Approximately 14,500 Home$avers booklets providing “how-to” advice on energy efficiency were distributed.
Advertising and Promotion/Media Relations Media coverage included Christmas “green” tips, coverage of the end of the CO2RE furnace rebate program, coverage of the ICLEI Congress and its community events and coverage of the LocalMotion project in Parkallen. The media also highlighted an environmental award the City received in Copenhagen as well as Edmonton being ranked as the number one most sustainable city in Canada for 2009.
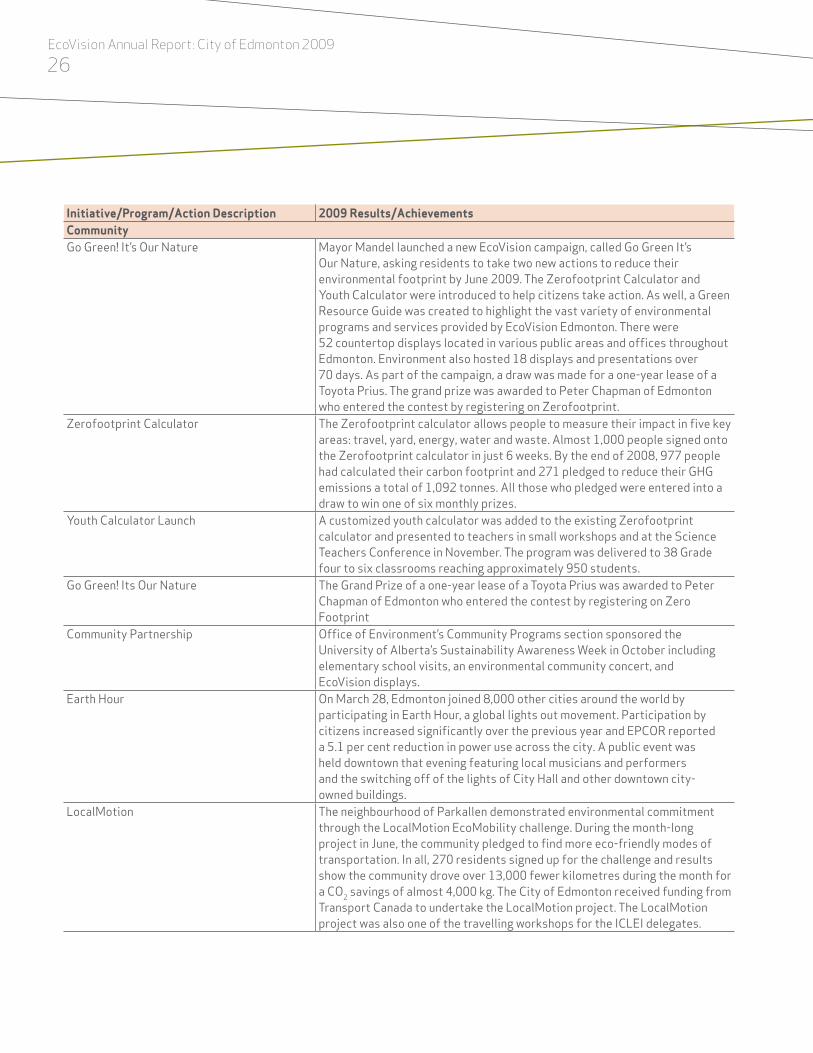
26Ecovision Annual Report: city of Edmonton 2009
initiative/Program/action Description 2009 results/achievementscommunityGo Green! It’s Our Nature Mayor Mandel launched a new EcoVision campaign, called Go Green It’s
Our Nature, asking residents to take two new actions to reduce their environmental footprint by June 2009. The Zerofootprint Calculator and Youth Calculator were introduced to help citizens take action. As well, a Green Resource Guide was created to highlight the vast variety of environmental programs and services provided by EcoVision Edmonton. There were 52 countertop displays located in various public areas and offices throughout Edmonton. Environment also hosted 18 displays and presentations over 70 days. As part of the campaign, a draw was made for a one-year lease of a Toyota Prius. The grand prize was awarded to Peter Chapman of Edmonton who entered the contest by registering on Zerofootprint.
Zerofootprint Calculator The Zerofootprint calculator allows people to measure their impact in five key areas: travel, yard, energy, water and waste. Almost 1,000 people signed onto the Zerofootprint calculator in just 6 weeks. By the end of 2008, 977 people had calculated their carbon footprint and 271 pledged to reduce their GHG emissions a total of 1,092 tonnes. All those who pledged were entered into a draw to win one of six monthly prizes.
Youth Calculator Launch A customized youth calculator was added to the existing Zerofootprint calculator and presented to teachers in small workshops and at the Science Teachers Conference in November. The program was delivered to 38 Grade four to six classrooms reaching approximately 950 students.
Go Green! Its Our Nature The Grand Prize of a one-year lease of a Toyota Prius was awarded to Peter Chapman of Edmonton who entered the contest by registering on Zero Footprint
Community Partnership Office of Environment’s Community Programs section sponsored the University of Alberta’s Sustainability Awareness Week in October including elementary school visits, an environmental community concert, and EcoVision displays.
Earth Hour On March 28, Edmonton joined 8,000 other cities around the world by participating in Earth Hour, a global lights out movement. Participation by citizens increased significantly over the previous year and EPCOR reported a 5.1 per cent reduction in power use across the city. A public event was held downtown that evening featuring local musicians and performers and the switching off of the lights of City Hall and other downtown city-owned buildings.
LocalMotion The neighbourhood of Parkallen demonstrated environmental commitment through the LocalMotion EcoMobility challenge. During the month-long project in June, the community pledged to find more eco-friendly modes of transportation. In all, 270 residents signed up for the challenge and results show the community drove over 13,000 fewer kilometres during the month for a CO2 savings of almost 4,000 kg. The City of Edmonton received funding from Transport Canada to undertake the LocalMotion project. The LocalMotion project was also one of the travelling workshops for the ICLEI delegates.

27Ecovision Annual Report: city of Edmonton 2009
initiative/Program/action Description 2009 results/achievementscommunityICLEI Community Programs Four community programs took place during ICLEI, each highlighting the
importance of environmental awareness. The programs were: Voices of Nature, a musical performance by local school children; Gone Green, an art exhibit featuring works made using reclaimed and recycled materials; Lights Down Stars Up photography exhibit highlighting Edmonton’s night sky; and That’s Edmonton For You, a concert in Louise McKinney Park featuring original music on the subject of community sustainability performed by local musicians.
New Home Builders Rebates The number of new home builders’ rebates increased significantly in the third year of the program with 35 in 2007, 158 in 2008 and 381 in 2009.
Renewable Energy Guide A new, on-line CO2RE Home$avers Guide was published in 2009 entitled “Renewable Energy.” This booklet, available on the CO2RE web page, gives Edmontonians an overview of renewable energy systems available, approximate costs, energy savings, and CO2 savings. Regulatory steps required to install these systems will be reviewed and a City of Edmonton Renewable Energy Task Force has been established to examine potential opportunities for the expansion of renewable energy within the city.
hiGhliGhtinG innovAtion And lEAdERshipThe CO2RE strategy is one of the most comprehensive, stakeholder developed, community-wide GHG emission reduction plans in North America. The original CO2RE initiative was envisioned in October 1999 as Edmonton City Council approved a greenhouse gas emissions reduction plan for City operations. City Council realized that an overall, permanent reduction of Edmonton’s greenhouse gas emissions could only happen if all sectors
of the community worked together on one coordinated plan. A cross-section of more than 30 people representing residential, business, industrial and institutional sectors worked with the City for more than two years to develop a single, coordinated plan. The team completed the initial strategy in December 2001 and the plan was officially launched, with full City Council support, to City employees in 2002 for further refinement, and to the public in 2004.

28Ecovision Annual Report: city of Edmonton 2009
lAndIn 2009, the City developed its Municipal Development Plan (MDP) The Way We Grow and its Transportation Master Plan (TMP) The Way We Move. Rooted in these plans is an understanding that the natural environment is one of the most important determinants of city size, growth, wealth and quality of life. Also expressed in these plans is an understanding that there are limits to the capacity of the environment to support a growing city. The MDP and the TMP both tells us that we must grow and move differently if we are to exist in equilibrium with the natural environment.
The Way We Move marks a shift in Edmonton’s priorities towards sustainable transportation; from single passenger vehicles to more public transit, cycling, and walking; from an auto-oriented transportation system to a more interconnected, multi-modal transportation system.
Strategies contained in The Way We Grow are designed to move Edmonton towards a sustainable state by promoting compact urban form. It recognizes the importance of integrating land use and transportation and was developed in conjunction with The Way We Move.
The Way We Grow directs the development of a City-wide Agriculture and Food Strategy. Although how the City of Edmonton will address urban and peri-urban agriculture has not yet been decided, food is a foundational piece to building a resilient, sustainable city.
Building a sustainable city is not just about built area. Biodiversity and natural habitats are important for everyone’s well-being, and contribute positively to quality of life.
Nature is intrinsically connected to a healthy urban environment as it provides ecological services such as flood control, climate moderation, and pollination. However, many of our citizens are not aware of this connection. The City and its partners are finding new ways to engage the community to understand the importance of biodiversity and ways to integrate biodiversity considerations into decision-making processes.
Although the City of Edmonton is contributing significant resources to secure Edmonton’s last remaining important natural areas (perhaps more than any city in Canada), it continues to experience significant losses of natural areas as new residents move to Edmonton in unprecedented numbers. These growth pressures cannot be underestimated when managing urban natural areas. More sustainable land management practices means working hand-in-hand with natural system processes to protect the services they provide. It also means integrating natural areas and food systems into planning decisions to help maintain healthy, resilient urban environments.
Preventing adverse effects to land as a result of our industrial society is also a key factor in achieving sustainability. Edmonton has seen great success in a waste management system that is becoming less and less dependent on landfill. However, progress needs to be made in other areas such as cleaning up contaminated land to promote infill. The City will also need to continue to reduce its dependence on pesticides and products containing toxic substances if it is to be more sustainable..

29Ecovision Annual Report: city of Edmonton 2009
objective: Prevent environmental harm and risk to human health and safety from accidental releases or spills associated with the City’s operations and facilities and meet or exceed provincial or federal spill reporting and response obligations.indicator Target 2009 resultsNumber of warning letters, protection orders, or penalties for environmental violations
0 0
Number of significant environmental releases in the Community responded to by Fire Rescue Services
2079
bAcKGRoundAn environmental release is the release of a substance into the environment through actions such as spills, discharges, disposal, spraying, injections, abandonment, leaks, dumping, exhausting, etc. In accordance with federal and provincial regulations, the City reports any release it discovers, causes or is informed of that has caused, is causing or may cause damage to (a) the environment (b) human health and safety or (c) property (public or private).
Three environmental commitments provide the foundation for the City of Edmonton’s Environmental Policy C512, one of which is to “meet or exceed applicable environmental legal requirements and other requirements to which it subscribes.” In keeping with this commitment, the City of Edmonton has developed and implemented a comprehensive spill identification and reporting system that covers all City Departments. A centralized reporting line allows for quick and accurate reports to be generated and the appropriate regulatory agencies to be informed. As a result of the effectiveness of this system, the City did not receive any warning letters, environmental protection orders, administrative penalties or prosecutions from either Alberta Environment or Environment Canada in 2009.
tREnds And AnAlysisFigure 9: Types and Number of Environmental Releases Reported by the City of Edmonton in 2009
Refrigerant R-2228
Other38
Diesel andGasoline17
Sewage and Partially Treated Wastewater8
Hydraulic Fluid84
Oil and Antifreeze40
Figure 10: Number of Releases Reported to Regulators (2003 – 2009)
0
50
100
150
200
250
Num
ber o
f Rel
ease
s
Year2003 2004 2005 2006 2007 2008 2009
ENVIRONMENTAL RELEASES IN CITY OPERATIONSsuMMARy of pERfoRMAncE MEAsuREs And condition indicAtoRs

30Ecovision Annual Report: city of Edmonton 2009
In 2009, the City reported 215 environmental releases to Alberta Environment7. Of the 215 reports, 141 were attributable to City Operations while 74 were attributable to
contractor’s working on behalf of the City. The majority of reported environmental releases continue to involve hydraulic fluid which is largely from the hydraulic
systems of City vehicles and heavy equipment. A review of the data from 2003 to 2009 indicates that the majority (>95%) of hydraulic fluid releases are less than
25 L. In all cases of reportable releases to the land, the releases were contained through the deployment of spill kits and absorbent materials by trained staff
and did not cause serious environmental impacts.
Although 2009 release reports increased by approximately 20% compared to 2008, it is not thought to be indicative of a negative trend. Increased
reporting of spills is generally considered good practice, allowing the release to be addressed in a coordinated manner. Since 2005, the
number of release reports has fluctuated between 170 at its low (in 2008) and 217 at its high (in 2007). In general, the increased
reporting coincided with the City’s wide-spread implementation of its ISO14001 Environmental Management Systems (Enviso) which
has provided a corporate framework for more systematic training methods and recording of release reports.
8 This total does not include releases the City reported that were not related to City operations.

31Ecovision Annual Report: city of Edmonton 2009
AchiEvEMEntsinitiative/Program/action Description 2009 results/achievementsTraining to identify and report releases Over 1,200 City staff received training to understand the impacts of
environmental releases and their responsibility to report releases in accordance with City and regulatory requirements. This included approximately 450 City staff in Roadway Maintenance, Transportation Operations; approximately 670 people in Community Facility Services, over 80 in Fleet Services and almost 100 individuals in the Parks area. Parks also incorporated spill kit use and maintenance into its training.
emergency Preparedness and response Training
Parks worked with Shield Specialized Emergency Services to deliver classroom training and hands-on simulated fuel release response exercises for 15 Parks staff. Besides the experience gained by the participants, the exercise resulted in two main outcomes, 1) a much-improved mobile spill kit at each of Parks main refuelling sites and 2) Stimulant Strategies, who filmed the exercise, created a 9 minute training video to increase awareness for other City workers.
Community Facility Services had 8 mock environmental emergencies at 9 sites. Five mock emergencies were specific to fuel spills and 2 mock emergencies specific to chlorine gas and freon releases.
Community Facility Services and Parks conducted Fuel Site Management Training with expert assistance from Fleet Services certified Maintenance Repairmen. Community Facility Services conducted 3 sessions that were facility specific with 3 distinct fuelling systems.
office of emergency Preparedness In 2009, the City of Edmonton Office of Emergency Preparedness trained approximately 500 city staff and partners to enact the City’s Municipal Emergency Plan. In addition, another 200 staff and partners practiced their roles and responsibilities during a site Transit exercise, an Emergency Operations Centre exercise, and a Chemical, Biological, Radiological, Nuclear, Explosive (CBRNE) exercise. As staff are trained and practice their roles, they consider the impact that their responses have on the environment and the issues that might develop that would impact recovery.
Fire rescue Services Programs in 2009, Fire rescue Services:
• Reviewed permit requests and issued 205 permits for vehicles transporting dangerous goods within and through the City
• Trained 13 captains in Pipeline Awareness, preparing them to deal with environmental releases and other emergencies arising from pipelines
• Inspected 183 F1 type industrial facilities, 1527 F2 facilities, and 2889 F3 facilities
• Responded to 2079 Dangerous Goods events and contacted Alberta Environment regarding 494 events of an environmental nature

32Ecovision Annual Report: city of Edmonton 2009
hiGhliGhtinG innovAtion And lEAdERshipFor many years the City has had a comprehensive and effective release reporting system. In 2005, with the development of the ISO14001 Environmental Management System, the City critically reviewed its reporting system and made the decision to centralize the service in an attempt to improve consistency of reporting and solidify communication pathways between the City and the regulators. In 2009, the City took another step forward with its spill reporting system by integrating the Intelex software package into its operations. Intelex is an environmental management software package that will maintain a database of the releases as well as automatically route e-mail notifications to those involved in the management of the release. This functionality allows for quicker notifications and more efficient reporting and management.
WASTE MANAGEMENT suMMARy of pERfoRMAncE MEAsuREs And condition indicAtoRsobjective: Minimize the landfilling of municipal solid waste through reduction, reuse, recycling and recovery.indicator Target 2009 resultsAverage tonnes of residential waste generated (total and per capita) – Includes waste and recyclables
Downward trend in residential waste generated per capita
274,074 tonnes (7% decrease from 2008)
350 kg per person (7.5% decrease from 2008 )
Proportion of residential waste diverted from landfill 60% (until 2012)
90% (post 2012)
41%*
*2009 was not a typical year because the composting facility was shut down to construct the tie-in to the new Integrated Processing and Transfer Facility.

33Ecovision Annual Report: city of Edmonton 2009
bAcKGRoundThe City’s Waste Management Strategy serves to protect human health, property and the environment and conserve valuable natural resources. Sustainable waste management includes reduction of waste at the source, efficient collection, diversion of waste from landfill through reuse, recycling and composting, and recovery of value from waste. The city’s solid waste management strategy includes the following:
• residential waste management
• industrial, commercial and institutional waste management
• City operations
tREnds And AnAlysis
Figure 11: Tonnes of Residential Waste Collected 2009
0
50,000
100,000
150,000
200,000
250,000
300,000
350,000
400,000
Total Residential WasteRecycling Collected
Tonn
es
Year20031997 2004 2005 2006 2007 2008 2009
Figure 12: Percentage Diversion of Waste from Landfill
2003 20052004 2006 20082007 2009Year
0
10%
20%
30%
40%
50%
70%
60%
Perc
enta
ge
Figure 13: Citizens Visits to Ecostations
20031997 20052004 2006 20082007 2009Year
0
20,000
40,000
60,000
80,000
100,000
140,000
160,000
180,000
200,000
120,000
Num
ber o
f Vis
its
Figure 14: Percentage Waste Collected Through Recycling Programs
20031997 20052004 2006 20082007 2009Year
0
Perc
enta
ge
5%
10%
15%
20%
25%

34Ecovision Annual Report: city of Edmonton 2009
Figure 11 shows that Edmonton’s total annual residential waste grew from 227.6 thousand tonnes in 1997 to 274.0 thousand tonnes in 2009. Figure 12 shows the trend in the percentage of waste diverted from the landfill since 2003. It should be noted that 2009 was not a typical year because the composting facility was shut down to construct the tie-in to the new Integrated Processing and Transfer Facility. Edmonton’s per capita residential waste production (including recyclable waste) has decreased from 363 kg per person per year in 1997, to 350 kg per person per year in 2009. This includes both recyclable materials (collected in blue bags, bins and depots) and garbage (destined for the city’s compost facility or landfill).
In 2009, a per person decrease of 7.5% and a 7.0% in total residential waste collected was seen compared to 2008. The decreases continued a trend that began in 2008 which saw a 7% per capita decrease and 2% reduction in the total residential waste collected when compared to 2007. The decreases in waste collected may be attributed to the reduction in economic activity in the Edmonton region that has resulted in lower levels of consumption. However, there
are likely many contributing factors. For example, 2009 saw an increase of citizen visits to the Eco Stations (Figure 13). A third Eco Station was opened in November 2009. The three Eco Stations received 183,359 visits in 2009, a 4 % increase over 2008. Also, the City of Edmonton Reuse Centre received 119,064 kg of items by 8,285 Edmonton residents in 2009. Approximately 95% of the material was reused or recycled. This represents a 6% increase in total weight of items collected. Finally, public education efforts, such as the Master Composter Recycler Program, have seen over 600 volunteers trained since program inception. All of these efforts combined, would contribute to reducing the amount of residential waste collected.
Another positive trend over the past decade has been the increase in recycling as a proportion of the total residential waste stream, as shown in chart Figure 14. In 1997, 11.9% of residential waste collected was recyclable material. In 2009, 19% of the residential waste stream was recycled through the use of blue bags, blue bins, and recycling depots.
AchiEvEMEntsinitiative/Program/action Description 2009 results/achievementsRecycled Christmas Trees In January 2009, 179 tonnes of discarded Christmas trees were collected and
transported to the Edmonton Waste Management Centre (EWMC) where they were chipped and used for composting.
Biofuels Facility This facility will process waste that cannot be recycled or composted into methanol and ethanol. Environmental permits were received in 2009 and construction will begin in 2010. The facility will be built by Enerkem Greenfield Alberta Biofuels.
Construction & Demolition Waste Recycling In 2009, 36,376 tonnes of construction & demolition waste was recycled at the EWMC.
Electronic Waste Recycling All electronic waste collected at Edmonton’s Eco Stations and the EWMC is processed at Global Electric and Electronic Processing (GEEP). In 2009, 12,250 tonnes of e-waste was recycled at this facility, located at the EWMC.
Public Education Efforts • More than 17,000 students and adults attended Waste Management tours, workshops and presentations.
• 33 new volunteers were trained in the Master Composter Recycler Program. To date, 606 community volunteers have been trained.,
• Twenty Recycling Opportunities presentations and 3 Vermicomposting Lunch n’ Learn sessions were offered to businesses and other groups.
Big Bin Events These 12 community events for large items collected 2,102 tonnes of old furniture, yard waste and other materials too large for regular collection.
Sand Recycling During winter 2008/09, Transportation Operations Branch spread 160,000 tonnes of sand on city streets. Approximately 85,000 tonnes were recovered for reuse.

35Ecovision Annual Report: city of Edmonton 2009
initiative/Program/action Description 2009 results/achievementsLimestone Chip Program The Transportation Operations Branch introduced 20% limestone chip to the
sand mix for the 2009/2010 winter road maintenance program. As well as increasing the amount of material that is suitable for reuse (and decreasing material that may be landfilled), the addition of limestone chip has safety benefits by increasing road traction.
Aggregate Recycling The City runs a large-scale concrete and asphalt recycling operation that processed 210,000 tonnes in 2009. This material is diverted from landfill and used for City roadway construction.
Minimizing Waste from City Operations Co-mingle recycling has been implemented at 18 sites for Community Facility Services in 2009. Also, in collaboration with Alberta Beverage Container Recycling Corporation, receptacles were implemented to collect beverage containers at 30 sites throughout Community Facility Services in 2009.
hiGhliGhtinG innovAtion And lEAdERshipEdmonton is recognized as a national and international leader in sustainable waste management. All waste reduction and recycling programs are voluntary and Edmonton has some of North America’s highest participation rates, including 89% participation in curbside recycling. The Edmonton Waste Management Centre is one of the world’s most comprehensive sites, with more
than 20 modern city-owned and privately owned waste processing facilities. In 2010, the Greys Paper Recycling Inc. paper products and glass brick production facilities will close the loop using recyclable material, and the construction of the Waste-to-Biofuels facility will enable Edmonton to divert close to 90% of residential waste from landfill by 2013.
URBAN DEVELOPMENT suMMARy of pERfoRMAncE MEAsuREs And condition indicAtoRsobjective: Steer urban development in a more environmentally, socially and financially sustainable direction by guiding the type and form of Edmonton’s development to reduce outward urban growth, increase density and facilitate greater use of public transit, cycling, and walkingindicator Target 2009 resultsHousing Stock Density – number of units versus land within urban zones
Increase density 8.1 units per hectare (increased from 7.9 in 2008)
Population Density – number of people versus land within urban zones
Increase density 18.57 people per hectare (decreased from 18.59 in 2003)
Per cent of new housing built in mature areas, downtown and premium transit locations (versus new suburbs)
25% proposed 5.1%

36Ecovision Annual Report: city of Edmonton 2009
bAcKGRoundStrategic goals of The Way We Grow include Sustainable Urban Form and Integrated Land Use and Transportation, and Complete, Healthy and Liveable Communities. Edmonton manages growth to move the City toward an environmentally, culturally, financially and socially sustainable state. Land use and design complement and support the transportation system, while the transportation network supports areas of increased density and employment. Communities are designed to encourage healthy lifestyles and social interaction for people, which provide the services necessary for liveability. Density targets for priority growth areas set by the Capital Region Plan will be adhered to, contributing to increased densities in developing neighbourhoods.
tREnds And AnAlysis
Figure 15: Land Use By Zoning 2009
Residential (ha)29%
Industrial (ha)11%
Parks (ha)9%
Institutional (ha)6%
Direct Control (ha)4%
Commercial (ha)2%
Agriculture (ha)39%
Figure 16: Edmonton Population 2003 to 2009
2003 20052004 2006 20082007 2009Year
Popu
latio
n
400,000
300,000
500,000
600,000
700,000
800,000
900,000
1,000,000
Figure 17: People Per Hectare (Urban Zone)
2003 20052004 2006 20082007 2009Year
Dens
ity (p
erso
n/ha
)
17.4
17.6
17.8
18.0
18.2
18.4
18.6
18.8
Figure 18: Housing Units (Mature vs. Suburban)
0
2,000
4,000
6,000
8,000
10,000
12,000
MatureSuburban
Num
ber o
f Hou
sing
Uni
ts
Year2003
20022001
20002004
20052006
20072008
2009
The municipality of Edmonton covers 69,980 hectares. In 2009, this area included seven zoning classes shown in Figure 15. Edmonton’s population grew 11.9% in the years 2003 – 2009 from 688,940 to 782,439 (Figure 16). To help accommodate this growth, over 5,050 hectares of agricultural and reserve land were rezoned for urban uses. As Figure 17 suggests, Edmonton’s population density dropped slightly from 18.59 persons per hectare in 2003 to 18.57 persons per hectare in 2009 in the city’s built area (which includes urban zones such as residential, industrial, commercial, direct control, parks and institutional zoning, but does not include agricultural and reserve). From 2003

37Ecovision Annual Report: city of Edmonton 2009
to 2009, the city’s built area increased 13.6% in size, while its population increased 11.9%. Looking solely at the density of residential land (i.e., city population divided by the sum of residential zoned hectares and direct control hectares), density decreased from 35.6 persons per hectare in 2003 to 34.2 persons per hectare in 2009. Given these figures, the objective of intensification of residential development was not met during this period. Through aggressive implementation of the land development strategies proposed in Edmonton’s municipal development plan, The Way We Grow, and its transportation master plan, The Way We Move, Edmonton will strive to improve its sustainability. The Capital Region Growth Plan also sets density targets for its priority growth areas. The
City of Edmonton is required to conform to the Capital Region Growth Plan and its density targets (see Section on Regional Cooperation).
In 2009, redevelopment and intensification projects in Edmonton’s mature areas accounted for 212 new housing units or 5% of all new units city-wide, none of which were in the downtown. This was an uncharacteristically low number, down from an average of 18% of new units in the downtown and mature neighbourhoods between 2000 – 2008. The proposed MDP sets a target for a minimum of 25% of new residential units to be located in the downtown, mature neighbourhoods and near LRT stations and transit centres.
AchiEvEMEntsinitiative/Program/action Description 2009 results/achievementsSmart Choices In 2009, implementation of the Smart Choices policy initiative continued.
Council approved the Large Site Rezoning Process and the Residential Infill Guidelines for residential infill in mature neighbourhoods.
New Municipal Development Plan – The Way We Grow
Council’s public hearing on The Way We Grow, Edmonton’s municipal development plan, continued through 2009 and the plan is expected to be approved in 2010. The Plan contains principles for sustainable land use and development and a growth coordination strategy, as well as integration of land use and transportation. It was developed concurrently with The Way We Move.
Environmental Reviews In 2009, 51 construction and development projects within the boundaries of the North Saskatchewan River Valley and Ravine System Bylaw (the River Valley Bylaw) were subjected to environmental reviews prior to approval to ensure mitigation of potential impacts on the natural environment.
Controlling Separation Distances The City of Edmonton continued to apply a risk management approach to maintain adequate separation distances between heavy industry and areas such as residential, hospitals and schools. In 2009, work continued on a City of Edmonton and Strathcona County joint planning study to address risk management, drainage and transportation issues in the boundary areas of the two municipalities. This joint planning study is expected to be completed in 2010.
Eco Industrial Additional research into incorporating eco-industrial principles in Edmonton was conducted in 2009 and formed the basis of a draft Terms of Reference that will progress eco-industrial principles in 2010.
Growth Coordination Strategy As a key implementation tool of the new MDP, the growth coordination strategy will manage future public obligations and growth opportunities by aligning all corporate decisions related to future land development at the neighbourhood planning stage and assist Council in its decision making process for authorization of new neighbourhood plan development. Work on the strategy started in 2009 and is expected to be completed in 2010.

38Ecovision Annual Report: city of Edmonton 2009
Mature Neighbourhood Redevelopment Planning Strategy
Area-specific land use planning is done where required to implement city policy or address impacts of redevelopment. In 2009 a rezoning concept was prepared for 109 Street and an area redevelopment plan (ARP) was drafted for the Strathcona Junction area. In 2010 these will be taken to City Council for approval and work will commence on LRT concept planning and transit oriented development planning.
Integrated Transit and Land Use Framework In 2009 the draft Integrated Transit and Land Use Framework (ITLU) was developed to provide tools to ensure that transit and land use are integrated in Edmonton’s LRT station areas through transit oriented development standards and station area plans. Implementation work will continue in 2010.
Stadium Station Transit Oriented Design Project
This was initiated as a Smart Choices policy initiative and is scheduled for completion in 2010.
Neighbourhood Commercial Revitalization Program
Under the Smart Choices umbrella, this program will be initiated in 2010 to explore further actions to revitalize Edmonton’s older neighbourhood commercial centres.
Implementation of the Quarters Downtown Project
On April 15, 2009, City Council approved the statutory planning documents necessary to proceed with the redevelopment of The Quarters downtown. Subsequent to those approvals, work was undertaken to develop many of the proposed improvements including a review of the design for the Five Corners intersection and a Master Planning process for The Armature, both significant components of the overall redevelopment plan.
By mid 2010, the Community Revitalization Levy Plan and Bylaw will be presented to Council for their review and approval in anticipation of submitting that plan to the Province for final approval. Work will commence on the first phase of infrastructure development upon receipt of both approvals.

39Ecovision Annual Report: city of Edmonton 2009
hiGhliGhtinG innovAtion And lEAdERshipEdmonton’s new municipal development plan, The Way We Grow, is expected to be approved by Council in 2010. Strategies contained in The Way We Grow are designed to move Edmonton towards a sustainable state. It recognizes the importance of integrating land use and transportation and was developed in conjunction with The Way We Move, Edmonton’s new transportation master plan. Implementation of these two plans and ongoing initiatives such as those mentioned above will help to steer urban development in a more environmental, social and financially sustainable direction.
In 2009, City Council directed Planning and Development to prepare a City-wide Food and Agricultural Strategy. This aligns with policy contained in the draft MDP to plan for a resilient food and agricultural system that contributes to the local economy and the overall cultural, financial, social and environmental sustainability of the City. In 2010 the strategy will be developed with a progress report being made to Council in June. This approach to land use, and how it contributes to foundational resiliency, is an innovative move towards long term sustainability.
TRANSPORTATION suMMARy of pERfoRMAncE MEAsuREs And condition indicAtoRsobjective: Continuously improve Edmonton’s transportation system by expanding and upgrading public transit, facilitating safe and convenient pedestrian and bicycle transportation, and proactively managing demand for private vehicle transportation.indicator Target 2009 resultsMode Split (Overall) Decrease in car driver share Most recent data from 2005:
57% car driver
20% car passenger
11% walk
9% transit
1% bicycle
2% otherTransit ridership per capita Annual Increase 87.84 in 2008 to 87.54 in 2009Vehicle registrations per Capita Annual Decrease 0.60 in 2008 to 0.59 in 2009Proportion of missing links of sidewalk and shared-use pathways constructed in existing areas of the city
Annual Increase 10 km constructed in 2009 (base year)
Proportion of total planned kilometres of On-street cycling facilities implemented
Annual Increase New Program

40Ecovision Annual Report: city of Edmonton 2009
bAcKGRoundThe City recognizes the importance of mobility shifts in contributing to the achievement of environmentally-related goals. The Way We Move, Edmonton’s Transportation Master Plan, marks a shift in Edmonton’s priorities towards sustainable transportation from single passenger vehicles to more public transit, cycling, and walking; from building outward to building a compact urban form; from an auto-oriented transportation system to a more interconnected, multi-modal transportation system. Promoting this shift contributes to reductions in greenhouse gases and conservation of non-renewable resources.
tREnds And AnAlysis
Figure 19: 2005 Transportation Mode Split
Car Driver57%
Car Passenger20%
Transit9%
Walk11%
Cycle1%Other
2%
Figure 20: Transit Ridership Per Capita
70
80
90
100
Ride
rshi
p pe
r Cap
ita
Year2005 2006 2007 2008 2009
Figure 21: Vehicle Registrations Per Capita
.400
.450
.500
.550
.600
.650
.700
.750
.800
.850
.900
Num
ber o
f Veh
icle
s
Year2005 2006 2007 2008 2009
per Licensed Driversper Capita
Over the course of 2009, the City of Edmonton completed a number of major policy initiatives that set the direction for Edmonton to become a sustainable, urban city. As a result, over the next few years Edmonton will begin to see significant infrastructure investments targeted toward providing more travel options to citizens. These investments will include an expanded LRT system as well as an expanded and better connected network of walking and cycling facilities. These investments will provide the support necessary to enable a change in the mode split.
In 2009, Edmonton transit maintained ridership levels, with ridership per capita changing only slightly from 87.85 rides per capita in 2008 to 87.54 rides per capita in 2009. Further expansion of the LRT from South Campus to Century Park is likely to contribute to an increase in 2010. In addition, for the first time in more than five years, in 2009 vehicle registrations per capita stayed constant as the rate of vehicle purchase was less than the rate of population growth.
Both the Bicycle Transportation Plan Update and the Sidewalk Strategy were completed and presented to City Council leading to the approval of the Active Transportation Policy by City Council in 2009. Significant investment in walking and cycling facilities is planned for the next ten years which will enable more and more Edmontonians to choose healthy, environmentally-friendly transportation modes for their day-to-day trips.

41Ecovision Annual Report: city of Edmonton 2009
AchiEvEMEntsinitiative/Program/action Description 2009 results/achievementsThe way we Move The new Transportation Master Plan, The Way We Move, was approved by
Council in September 2009 and establishes a framework for how the City of Edmonton will address its future transportation needs. The TMP emphasizes the use of roads for goods movement and the use of transit for moving people. It was developed concurrently with The Way We Grow.
lrT network Plan One of the key supporting elements of the Transportation Master Plan is the expansion of Edmonton’s Light Rail Transit (LRT) system. According to the LRT Network Plan, LRT service would expand into a network of multiple lines radiating from the city core to all sectors of Edmonton, with potential for connections into the Capital Region. A network plan for LRT was approved by Edmonton City Council in June 2009, and specific alignments for the west and southeast lines were approved in December 2009. In addition, the new Belgravia/McKernan and South Campus stations on the south LRT line opened in April 2009.
active Transportation Policy Over the past several years, the City has been developing three separate strategies related to active transportation in Edmonton. The active transportation policy combines these strategies into one coherent policy to address sidewalk infrastructure, walkability, and cycling, and was approved by City Council in November 2009. The purpose of the Active Transportation Policy is “to optimize Edmontonians’ opportunities to walk, roll, and cycle, regardless of age, ability, or socio-economic status; to enhance the safety, inclusivity and diversity of our communities; and to minimize the impact of transportation activities on the City of Edmonton’s ecosystem.”
hiGhliGhtinG innovAtion And lEAdERshipThe Transportation Master Plan, The Way We Move, was developed in conjunction with Edmonton’s Municipal Development Plan, The Way We Grow, and their goals were carefully aligned. Both plans have a chapter acknowledging the importance of transportation and land use integration in creating a sustainable and efficient city that maximizes the effectiveness of its infrastructure investment. To ensure that the goals of the TMP are achieved, a ten-year Implementation Plan and a Progress Measures report are under development to track actions and progress towards achieving the goals.
integrated transit and land use framework
The integration of the transportation plan with the land use plan allows the City to construct mutually supportive goals, objectives, actions, and policies that will allow Edmonton to become a sustainable, liveable, walkable, and healthy city. Land use and transportation decisions are becoming more integrated. There is no better example of this than the joint plan being led by the Planning and Transportation Department’s Integrated Transit and Land Use (ITLU) Framework. The plan outlines urban design and transportation network standards that are based on the type of transit service that is being provided, the existing land uses, and the vision for the area. Stakeholder involvement will continue in 2010.

42Ecovision Annual Report: city of Edmonton 2009
lRt network plan
After a comprehensive review of its approach to LRT planning and operation, the City of Edmonton has developed an LRT Network Plan for the city. LRT lines not tying in to the existing LRT system will feature surface operation and will provide convenient connections to the existing LRT system in multiple locations. For both the existing system and for new lines, an urban-style, frequent-stop system design will be pursued. New lines will adopt low-floor LRT technology, enabling better integration with the urban fabric. An urban-style system
balances accessibility and mobility while encouraging more compact urban communities by providing smaller scale stations closer together and enhancing connectivity to a greater number of destinations. The LRT Network Plan was nominated in the ‘Worldwide Project of the Year’ category at the Light Rail Awards in London, England. The plan received a ‘Highly Commended’ honour in the category based on the plan’s vision for transit oriented development, compact urban form, and a shift in transportation modes.
NATURAL AREAS suMMARy of pERfoRMAncE MEAsuREs And condition indicAtoRsobjective: Using the means available to it, the City will increase capacity for ecological stewardship by implementing programs and practices that establish clear management roles and responsibilities, support the efforts of conservation organizations and private corporations and reflect a watershed approach to the management of Edmonton’s natural areas.objective: Using the means available to it, the City will expand Edmonton’s ecological network by securing and restoring natural systems, and by supporting and partnering with others in this work in the areas where it is appropriate to do so.indicator Target 2009 resultsTotal Priority Natural Areas – Secured and Unsecured 8.3% (5783 ha)
Total Priority Natural Areas Secured (Total) 8% of the city area (5600 ha) 5.3% (3715 ha)North Saskatchewan River Valley 6.9% of the city area (4800 ha) 4.8% (3336 ha)Tablelands 1.1% of the city area (800 ha) 0.5% (379 ha)Total Priority Natural Areas Secured in 2009 82 ha/yr 110 ha
bAcKGRoundThe City of Edmonton was founded with a strong ethic for the conservation of nature. Without the commitment and effort to conserve nature by past generations of Edmontonians over the previous 100 years, Edmonton would not have the beautiful natural areas within the river valley park system that it has today. However, with the city quickly approaching one million inhabitants, the need to protect biodiversity and conserve nature is as important as ever so that all citizens have ready access to nature.
As the City pushes well beyond the river valley and ravines, it must find ways to conserve nature in ways not imagined even 15 years ago. Natural areas are being converted to other land uses at an increasing pace. In 2009 alone, 50 ha of Edmonton’s most important natural areas were
lost forever. In recognition of the importance and urgency to accelerate the conservation of nature, City Council passed a $20 million borrowing initiative in 2009 so that another 100 ha of higher biodiversity natural areas can be conserved before they are lost. This initiative is a strong step forward and probably larger than any municipality in Canada; however, there is more work to do. As the Edmonton and Area Land Trust matures, this new organization, whose creation was fostered and financed by the City of Edmonton, will play an increasingly important role to conserve nature in Edmonton.

43Ecovision Annual Report: city of Edmonton 2009
tREnds And AnAlysisTable 3: Natural Areas Management Measures
Total greenspace Green space as percentage of total space 19%Priority natural areas lost in 2009North Saskatchewan River Valley and Ravines 5 haTablelands 45 haCitywide 50 haTotal natural areas managed by the city of edmonton as of 2009North Saskatchewan River Valley and Ravines 1999 haTablelands 213 haTotal citywide 2212 hanatural area loss-to-gain ratio for Priority natural areas (2009)North Saskatchewan River Valley and Ravines 1:16Tablelands 3:2Citywide 5:11community engagement Number of natural areas in which Master Naturalist projects are underway/completed. 15Number of community groups engaged, through City projects, in support of securement and management of natural areas, or ecological education
19
Number of international partnership projects contributed to 5
Figure 22: Natural Areas Securement Status – 2009
Secured Natural Areas
Unsecured Priority Natural Areas
Unsecured Natural Areas
Transportation Utility Corridor
City Boundary
Arterial Roadways
River Valley Boundary

44Ecovision Annual Report: city of Edmonton 2009
Figure 23: Priority Natural Areas: Securement Status – 2009 (ha)
River ValleySecured3,336
River ValleyUnsecured1,517
TablelandUnsecured679
TablelandSecured378
Figure 24: Secured Natural Areas in Edmonton’s Tablelands – Cumulative Area Total
Area
Sec
ured
(ha)
400
300
200
100
0
19771978
19791980
19811982
19831984
19851986
19871988
19891990
19911992
19931994
19951996
19972000
19991998
20012002
20032004
20052006
20072008
2009
Year

45Ecovision Annual Report: city of Edmonton 2009
Figure 25: Designing New Neighbourhoods Using the Ecological Network Approach Example – Big Lake Area Structure Plan
Natural Areas/Ravines Other parks and Geen Space Major Connection
BIG LAKE Ecological Network
*NB: Big Lake Neighbourhoods Two, Three and Four not yet approved
July 2009
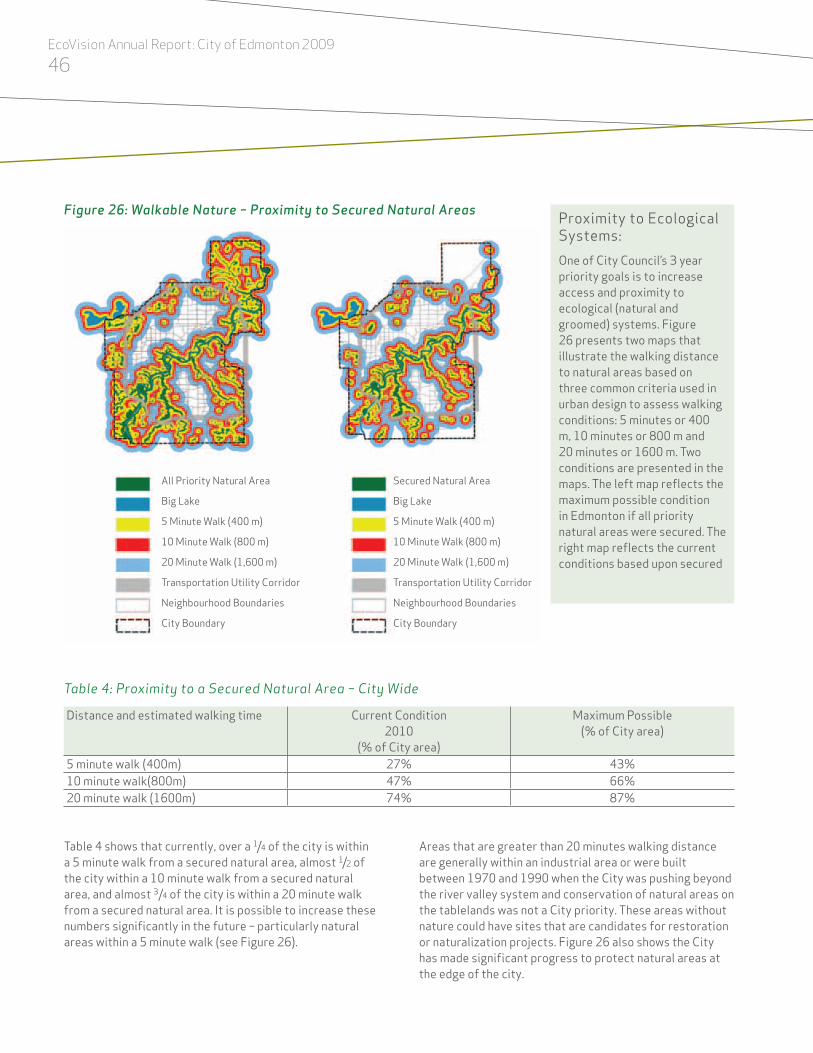
46Ecovision Annual Report: city of Edmonton 2009
Figure 26: Walkable Nature – Proximity to Secured Natural Areas
All Priority Natural Area
Big Lake
5 Minute Walk (400 m)
10 Minute Walk (800 m)
20 Minute Walk (1,600 m)
Transportation Utility Corridor
Neighbourhood Boundaries
City Boundary
Secured Natural Area
Big Lake
5 Minute Walk (400 m)
10 Minute Walk (800 m)
20 Minute Walk (1,600 m)
Transportation Utility Corridor
Neighbourhood Boundaries
City Boundary
Table 4: Proximity to a Secured Natural Area – City Wide
Distance and estimated walking time Current Condition2010
(% of City area)
Maximum Possible(% of City area)
5 minute walk (400m) 27% 43%10 minute walk(800m) 47% 66%20 minute walk (1600m) 74% 87%
Proximity to Ecological Systems:One of City Council’s 3 year priority goals is to increase access and proximity to ecological (natural and groomed) systems. Figure 26 presents two maps that illustrate the walking distance to natural areas based on three common criteria used in urban design to assess walking conditions: 5 minutes or 400 m, 10 minutes or 800 m and 20 minutes or 1600 m. Two conditions are presented in the maps. The left map reflects the maximum possible condition in Edmonton if all priority natural areas were secured. The right map reflects the current conditions based upon secured
Table 4 shows that currently, over a 1/4 of the city is within a 5 minute walk from a secured natural area, almost 1/2 of the city within a 10 minute walk from a secured natural area, and almost 3/4 of the city is within a 20 minute walk from a secured natural area. It is possible to increase these numbers significantly in the future – particularly natural areas within a 5 minute walk (see Figure 26).
Areas that are greater than 20 minutes walking distance are generally within an industrial area or were built between 1970 and 1990 when the City was pushing beyond the river valley system and conservation of natural areas on the tablelands was not a City priority. These areas without nature could have sites that are candidates for restoration or naturalization projects. Figure 26 also shows the City has made significant progress to protect natural areas at the edge of the city.

47Ecovision Annual Report: city of Edmonton 2009
Natural Areas System Policy…Since the Natural Areas System Policy and the Natural Connections Strategic Plan was approved in 2007, the City is designing its new neighbourhoods using an ecological network approach. This design approach groups adjacent neighbourhoods by aligning open space land uses such as parks, school sites, stormwater management facilities, powerline and pipeline rights of way, as well as natural areas such as creeks, wetlands and tree stands into a connected network of open space. This configuration provides more walkable communities and superior biodiversity conservation benefits.
securement and loss of natural Areas:
The City of Edmonton continues to make significant advances in securing natural areas. In 2009, 110 ha were secured for a total of 3715 ha. This area represents 5.3% of Edmonton area that is secured in a natural state and brings us closer to achieving our target of 8%. This accomplishment is tempered by the loss of 50 ha of Priority Natural Areas for conversion to other uses due to the rapid growth of the City. Although City Council decided in 2009 to borrow $20 million to secure three or four large natural areas, far more than any other Canadian city, our target of 8% is at risk of not being achieved, largely because of the limited tools that are available to local authorities in the Municipal Government Act. The Province is presently reviewing the planning section of the Municipal Government Act and will likely introduce a new Provincial Wetland Policy in 2010. Positive changes will grant municipalities broader authority to protect nature.
proximity and Access to Ecological (natural and Groomed) systems:
In new neighbourhoods at least one natural area is conserved as part of the City park system. Since the Natural Areas Systems Policy (City Policy 531) and the Natural Connections Strategic Plan were approved in 2007, the introduction of the ecological network model has been widely accepted in the design of new neighbourhoods and is now the model favoured by the development industry. The application of the ecological network model in new neighbourhoods results in linking open spaces such as natural areas, constructed wetlands, park sites, schools sites, and linear rights of way into an ecologically stronger configuration than found in conventional neighbourhoods. This innovation has led to more walkable neighbourhoods with higher biodiversity values. Citywide, almost 1/2 of the city’s area is within a 10 minute walk of a natural area.
natural Area Management:
3,715 ha (9,180 acres) of natural areas have been secured in Edmonton to date and the City is responsible currently for the management of 2,212 ha (5,466 acres). The remaining 1,502 ha (3,712 acres) are lands that are privately managed, are under alternate jurisdictions (e.g., Provincial or Federal), or have agreements for future natural area parks for the City that eventually will be managed. In 2009, Parks added 45 ha (111 acres) to its inventory of managed lands.

48Ecovision Annual Report: city of Edmonton 2009
AchiEvEMEntsinitiative/Program/action Description 2009 results/achievementsiclei world congress Edmonton hosted the 2009 ICLEI World Congress which helped to raise public
awareness about the importance of conserving local biodiversity and led to biodiversity becoming a key initiative for ICLEI in their new strategic plan.
urban nature Forum Edmonton hosted the 2009 Urban Nature Forum which addressed the role for local governments in protecting biodiversity, and the importance of coordinated global action. The Forum gave Edmonton an opportunity to share its progress in biodiversity protection, and to connect with partners from around the world. Over 50 countries participated.
natural areas borrowing initiative and the natural areas acquisition Strategy
Council approved a $20 million natural areas borrowing initiative in 2009. Subsequently, the Office of Natural Areas completed a Natural Areas Acquisition Strategy which sets direction for the purchase of Priority Natural Areas before they are lost through development.
biodiversity action Plan (baP) The Office of Natural Areas completed a Biodiversity Action Plan which provides implementation direction for Natural Connections Strategic Plan. The BAP includes clear actions for achieving the protection and sound management of natural areas, and the engagement of the community in this effort. The BAP is a key initiative of Asset Management and Public Works.
Master naturalist Program The Office of Natural Areas, with support from other City staff and community experts, completed a pilot run of the Master Naturalist Program with 25 participants. The program provides 35 hours of stewardship training in exchange for 35 hours of volunteer service dedicated to the stewardship of local natural areas. The program will continue in 2010.
State of natural areas Monitoring The Office established a protocol and a set of indicators to monitor the city-wide loss and protection of natural areas, as well as citizens’ access to those areas.
community outreach The Office shared Edmonton’s conservation approach with local and global partners through presentations at events held across Canada, including:
Federation of Canadian Municipalities webinar
ICLEI World Congress
Urban Nature Forum
Alberta Recreation and Parks Association Annual Conference
Canadian Land Trust Alliance Annual Conference

49Ecovision Annual Report: city of Edmonton 2009
hiGhliGhtinG innovAtion And lEAdERship
natural Areas protection
In 2009, City Council authorized Administration to borrow $20 million to accelerate the purchase of natural areas before they are lost, as well as an ongoing commitment of $1 million per year to purchase significant wetlands. The City of Edmonton fostered the creation of the Edmonton and Area Land Trust (EALT). A community-based non-profit company, it is designed to conserve natural areas and is the main financial contributor to an operational endowment that allows the EALT to operate in perpetuity. An additional 110 ha (937 acres) of natural areas were secured in 2009 resulting in a total of 3,715 ha (9,180 acres) of aquatic and terrestrial habitat secured to date.
biodiversity
The City of Edmonton is a participant in the Secretariat of The Convention in Biological Diversity’s Singapore Cities Biodiversity Index project. The index will allow cities to compare their work objectively with other cities and track their own progress towards local sustainability goals. Ten cities from five continents are participating in the project. The user’s manual will be presented at the 10th Conference of the Parties of the Convention on Biological Diversity in October in Japan. This index will provide performance indicators in three areas: 1) biodiversity in the city 2) ecosystem services provided by the native biodiversity in the city 3) governance and management in the city.
In addition, the City of Edmonton is one of the 21 cities from six continents that pioneered ICLEI’s first biodiversity initiative, Local Action for Biodiversity (LAB). Each of the 21 pioneers completed a common, intensive process documenting biodiversity status quo; strengthening existing environmental plans, proclaiming political commitment to biodiversity management improvements, and fine-tuning and profiling biodiversity-related projects. The LAB coordination team indicated that the City of Edmonton has distinguished itself among world leaders through its commitment to integrating biodiversity issues into its decision making processes. The LAB coordination team will release a how-to guide for local government biodiversity management, including best practice examples, at the tenth conference of the Parties on the Convention for Biological Diversity in Nagoya, Japan October 2010. This LAB Guidebook is based on the experience and achievements of the LAB pioneers and includes several examples from the City of Edmonton.
Also in 2009, the City of Edmonton hosted the 2nd Urban Nature Forum with over 50 countries participating in the event. The forum was held in collaboration with ICLEI’s LAB initiative and IUCN’s Countdown 2010 program. The speakers addressed the importance of conserving local urban biodiversity, accomplishments of the LAB Initiative and the vital role of local governments in biodiversity preservation. The event began with an address from United Nations Secretariat for the Convention on Biological Diversity Executive Secretary Dr Ahmed Djoghlaf. The following two days included informative and participatory presentations and other forms of interaction that considered global strategy and hands-on practical biodiversity management at the level of local government.

50Ecovision Annual Report: city of Edmonton 2009
CONTAMINATED LANDS suMMARy of pERfoRMAncE MEAsuREs And condition indicAtoRsobjective: Protect public health, the environment and community quality of life from negative impacts related to contaminated land and maximize opportunities to reclaim and subsequently redevelop currently contaminated land.indicator Target 2009 resultsDollars issued through the City of Edmonton’s Brownfield Redevelopment Grant Pilot Program
Min. $100,000
Max. $500,000
$0
bAcKGRoundContaminated sites are properties where current or past land use has resulted in a release of a substance or combination of substances into the soil or groundwater at a concentration that may present a risk to human health or the environment as defined by the Alberta Environmental Protection and Enhancement Act (AEPEA). When these sites are left vacant, derelict or underutilized, they are often referred to as “brownfields”. Remediation of contaminated sites is important for a number of reasons. If these sites are left unmanaged they can pose a risk to the environment and human health. Further, when these sites remain vacant or underutilized (i.e. brownfields), they are a lost economic opportunity and a barrier to community revitalization. The lack of vacant, serviced developable sites within the City core can drive potential development outward to the edges of the City where undeveloped, unserviced lands (“greenfields”) are available. This contributes to urban sprawl.
tREnds And AnAlysis
city of Edmonton’s brownfield Redevelopment Grant pilot program
Although all five applicant spots were filled in 2006, the program has yet to provide funding to any of the participants. As of December 2009, only two participants formally remained in the program. Participants cited a variety of reasons for withdrawing from the program mostly related to the economic conditions in 2009. The grant program is being evaluated and a “lessons learned” approach will be applied when developing future brownfield programs.
provincial Remediation certificates
Alberta Environment also developed regulations to support the introduction of remediation certificates. The remediation certificates were introduced in 2009 beginning with petroleum storage tank sites. The introduction of this certificate is a significant addition to the current regulatory regime as it will provide regulatory closure of liability after a ten-year period. Although certificates are voluntary, they provide an incentive to remediate contaminated sites by providing certainty to landowners that they are protected against future regulatory changes. Since the introduction of this program, Alberta Environment has issued six remediation certificates. The slow uptake has been attributed to some concerns over professional liability and the voluntary nature of the certificates.

51Ecovision Annual Report: city of Edmonton 2009
AchiEvEMEntsinitiative/Program/action Description 2009 results/achievementsenvironmental Site information Database The Environmental Site Information Database (ESID) contains information
held by City offices related to soil and groundwater contamination and environmental investigations9. The database currently catalogues reports held by Transportation, Asset Management and Public Works, and Planning & Development. The database currently holds 3213 mapped records, 2,803 of which are held by Transportation.
Planning approvals – Monitoring for contamination
City Staff reviewed Environmental Site Assessment (ESA) reports for 72 properties subjected to planning bylaws and subdivision applications to identify potential contamination problems. In support of this review, Alberta Environment and Alberta Health Services provided expert assistance when problem sites were identified.
contaminated Sites Management Strategy In 2009, the Environmental Sites Committee produced an aggressive strategy for managing potential environmental liabilities associated with City-owned property. At this time, implementation of the strategy is limited to what can be accomplished at current funding levels. The City continues to consistently apply proactive measures to identify environmental issues prior to purchasing properties as well as manage its operating sites in an environmentally-responsible manner.
Fleet Service Gas Station renewal Program In 2009, the Central Fuel station was remediated and upgraded and the Davies Fuel station was remediated. Eight in-ground hoists at Patterson Garage were replaced in 2009 with newer hoists equipped with fully contained reservoirs to prevent any releases to the environment (see details of this program under Highlighting Innovation and Leadership).
contaminated Gas Stations Task Force In late 2009, City Council initiated the formation of a task force of council. The Committee is made up of five members of City Council. Essentially the task force will oversee and direct the implementation of a plan to encourage site clean up and deter continued inaction on brownfield sites that were historically operating as gas stations.
9 The ESID catalogues all environmentally-related reports, regardless if they indicate contamination or not; The ESID is not a database of contaminated sites

52Ecovision Annual Report: city of Edmonton 2009
hiGhliGhtinG innovAtion And lEAdERship
fleet services Gas station Renewal program
Fleet Services manages 14 re-fuelling stations, some with underground storage tanks (USTs). In 2006 it was determined that the majority of the USTs were approaching or exceeding expected useful life. Aging infrastructure, stringent environmental legislation, and user demands prompted Fleet Services to develop a long-term renewal plan designed to meet the City’s fuelling needs and address the environmental issues associated with the USTs. The fuel station renewal is a leading-edge program that employs the best available technologies. Whenever possible, sustainable remediation techniques are considered as part of the renewal process. Since launching this initiative in 2007, Fleet Services has completed two fuel site renewals including Mitchell Fuel Station (11904-154 Street) and Main Central Fuel Station (9509-106 Ave). At the Main Central Station, nitrogen was added to the soil to accelerate bioremediation and ultimately minimize the amount of soil material that needed to be excavated and landfilled. The new infrastructure installed at these sites meets the highest environmental standards including doubled wall fuel tanks, flexible, jointless piping, and sophisticated instrumentation for measuring fuel and detecting leaks. In addition, in 2007/2008, two fuel stations with USTs: the Southwest Transportation Yard (6607-103 Street) and the Southeast Transportation Yard (5405-59 Ave), were decommissioned and replaced with aboveground storage tanks (ASTs). In 2009, Davies Fuel Station was remediated with complete infrastructure upgrades expected to be completed in fall 2010.
The projects are managed using expertise from the City of Edmonton’s Capital Construction Department to maximize the overall renewal plan progress. They assist in the design, tender, and construction of the renewal program. In addition, environmental assessments and remediation planning are conducted prior to tender award so that there is a clear understanding of the amount of material that has been impacted and appropriate remedial strategies can be employed. Fleet Services is currently working on the design phases at Ferrier, Westwood Transit, West Engineers Yard, and Fire Stations 1 and 2 fuel stations.
Fleet Services also operates a number of waste oil and new oil sites which will be addressed in the renewal program. These projects are generally smaller and less complex than the fuel station renewals but wherever possible, they are combined to improve efficiency. In 2009, the underground waste oil tank at Davies was removed and the site remediated. In addition, Fleet Services is working on replacing over 100 aging, in-ground hoists that have potential environmental impacts. Eight in-ground hoists at Patterson Garage were replaced in 2009 with newer hoists equipped with fully contained reservoirs to prevent any releases to the environment.

53Ecovision Annual Report: city of Edmonton 2009
TOxIC SUBSTANCESsummary of performance Measures and condition indicatorsobjective: Reduce City use of household, commercial and industrial hazardous or toxic materials from all aspects of office, recreational facility, transit and public works in order to minimize dispersion of these substances into the environment.branch Products replaced with more environmentally friendly alternativesFleet Services 4corporate Properties 11community Facility Services 18Fire rescue Services 7edmonton Transit 2Total 42
bAcKGRoundToxics are chemical substances that are known or suspected, through laboratory and other studies, to have a harmful effect on human life and the natural environment on which they depend. Many household, commercial and industrial chemical products may contain hazardous and toxic components. The Government of Canada’s glossary on chemical substances defines chemical substances as “deliberately created, produced as a by-product of other processes or occurring naturally in the environment and can be elements or compounds”.
Despite proper handling and use, there is the potential that toxic components may enter and move through the environment and potentially enter the body through food, water, air or skin contact. Sound environmental management includes efforts to reduce and, where possible, eliminate the releases of toxics into the air, water and soil.
tREnds And AnAlysisIn 2009, steps were taken to evaluate and either eliminate or reduce products used in City operations that contain toxic or hazardous components that can be dispersed into the environment. Several branches introduced procedures and/or environmental programs with the objective to 1) purchase products that are environmentally sound and/or 2) replace existing products with more environmentally friendly products. The measures above indicate how many products were successfully evaluated and replaced with better alternatives in 2009.
Also in 2009, the City of Edmonton developed a Sustainable Purchasing Policy (SPP). The policy was adopted by City Council early in 2010. The SPP provides a framework for purchasing that can be systematically applied across business units. The SPP is expected to incorporate toxics reduction into its criteria as it is phased in over time.

54Ecovision Annual Report: city of Edmonton 2009
AchiEvEMEntsinitiative/Program/action Description 2009 results/achievements Toxics reduction Task Force’s environmentally Preferred Purchasing Program
Over the last year, the Toxics Reduction Task Force has developed guidelines for environmental procurement; environmental criteria for various products, and a recommended corporate procedure for procurement that includes the development of a database of environmentally-preferred products. The significant work of the task force will be incorporated into the implementation of the Sustainable Purchasing Policy in 2010.
city’s Green Procurement Programs corporate Properties Corporate Properties developed and implemented green product guidelines for custodial staff. The guidelines will be evaluated over 2010 for possible City-wide implementation as part of the SPP implementation.
Fire rescue Services: Fire Rescue Services completed its chemical replacement program which resulted in a total of 23 products being replaced with environmentally-friendlier products.
Fleet Services: Fleet Services replaced 95% of the chlorinated solvent perchloroethylene (PERC)with replacement of brake clean products and reduced the use of aerosol cans by 37% from 2007 levels.
Transit: Transit has developed a “New Chemical Procurement Work Instruction” and began replacing chlorinated, solvent-based brake cleaners with less environmentally-pervasive alternatives.
community Facility Services: Community Facility Services implemented the “Environmental Choice Program” at the Clareview Twin Arena and the Valley Zoo has finished replacing over 14 product categories with environmentally-friendly alternatives. Its green procurement plan includes an innovative evaluation matrix that outlines specific criteria for toxicity, biodegradability and third-party certification.
hiGhliGhtinG innovAtion And lEAdERshipIn 2009, Executive Committee of City Council directed Administration to develop a Sustainable Procurement Policy that would formally incorporate social and environmental considerations into the procurement process in addition to value for money. The SPP (Policy C556) was approved by City Council in early 2010. Generally the SPP helps to ensure that goods, services and construction materials purchased by the City are manufactured, produced and provided in accordance with established international environmental standards and
guidelines. As well, the SPP introduced a system that can reward those contractors and suppliers that are taking proactive steps to decrease environmental impacts or improve environmental sustainability. The City of Edmonton’s approach is unique because it endeavours to incorporate SPP principles across its supply chain. The scope of SPP has the potential to put the City of Edmonton on the map as a leader in environmental sustainability in the public sector.

55Ecovision Annual Report: city of Edmonton 2009
PESTICIDESsuMMARy of pERfoRMAncE MEAsuREs And condition indicAtoRsobjective: Continuously reduce the amounts of toxic pesticides used by the City of Edmonton and minimize the potential for chemical pesticides to be dispersed into the environment.indicator Target 2009 resultsOverall reduction of pesticide use in City Operations Continuously reduce toxic
pesticide use by the City of Edmonton
The lowest use of pesticides by City Operations in 17 years
Reduced use of conventional turf herbicides on Parks turf inventory through spot spraying and improved plant health care techniques
Treat <10% of Parks turf inventory with turf herbicides
5.5% of turf inventory treated with turf herbicides
Reduced use of Guardsman 12 sodium hypochlorite, a pesticide used to sanitize Hawrelak Lake for international water sports events
20% reduction in product use No product use due to lack of event in 2009
Integrated Pest Management (IPM) projects to reduce the need for, and environmental impacts of, more toxic pesticides
Seven IPM studies Two completed, five ongoing and one new study for 2009
bAcKGRoundPesticides are a diverse range of synthetic chemical, biological and natural products used to control pests and as such, a potential exists for them to act as environmental toxins. Environmental impacts of pesticides are largely determined by 1) their mode of action and health and environmental risk assessment by Health Canada’s Pest Management Regulatory Agency (PMRA), 2) their concentration and 3) their method of delivery or application. Older chemistry insecticides tend to be less selective poisons with the potential to affect a wide range of non-target organisms. Trends in federally regulated pesticides have steadily moved towards more target-specific products, such as the microbial insecticide Bacillus thuringiensis kurstaki (Btk). This pesticide affects only plant feeding caterpillars that ingest it, thus conserving natural enemies that tend to be killed off when outbreaks are managed using traditional spraying techniques and older neurotoxin-based products.
Over the past decade, drought has seriously impacted growing conditions in the Edmonton area and encouraged more prevalent native pest and disease activity. Combined with increasing levels of attack from the establishment of new, introduced pest species, the health of Edmonton’s urban forest continues to decline. Advances in tree
protection with injection techniques for systemic insecticide and fungicide applications greatly reduces environmental impacts caused by traditional canopy spraying. For outbreaks of tree pests, this effectively eliminates pesticide contamination of soil and roadway drains beneath the tree and protects the ecology of its canopy habitat.
Under its Integrated Pest Management (IPM) Policy, City of Edmonton Operations uses a variety of preventive strategies, along with cultural controls, biological controls and least toxic pesticides approved by Health Canada’s PMRA. These pesticides include:
• Herbicides to manage weed infestations in hard surfaces, turf and natural areas to control noxious weeds that can choke out native plants
• Aquatic Herbicides to manage algal blooms caused by nutrient loading in stormwater ponds and swimming pools
• Insecticides used (a) in standing water development sites where nuisance and disease-carrying mosquito outbreaks can develop quickly (b) to control nests of stinging insects and (c) to control outbreaks of a growing diversity of native and newer exotic insect pests of the urban forest and interior landscapes

56Ecovision Annual Report: city of Edmonton 2009
• Fungicides to control certain plant diseases on the city’s golf courses and in the urban forest
• Antimicrobials to kill bacterial pathogens for special water contact sports events such as canoe polo
• Rodenticide baits used inside city facilities for mouse control and outdoors on parkland to prevent infrastructure damage from ground squirrel and pocket gophers
• Miscellaneous repellents, attractants and commercial pheromones which are used in early detection of invasive species and pest population monitoring
tREnds And AnAlysisTurf herbicides include controversial synthetic pesticides at the centre of a health risk debate that has caused many municipalities and some eastern provinces to enact laws prohibiting their use. Studies by Alberta Environment show that detection of these products in urban stormwater run-off is largely attributed to the design and use of fertilizer-herbicide combination products. Figure 27 shows historical sales/use data from 2005 collected by Alberta Environment that illustrates the proportional use of these fertilizer-herbicide combination products in Edmonton. This information led Alberta municipalities to request a province-wide restriction on the sale of fertilizer-herbicide combination products, since it was felt this would be more effective than a use ban. As a result, these combination products were removed from the Alberta marketplace effective January 2010.
Figure 27: Edmonton Turf Herbicide Sales/Use (2005)
ResidentialFertilizer/HerbicideCombination
Residential Herbicide Only
City Parks Use Golf Course Use
Professional Residential Property
Professional CommercialProperty
In 2009, 78% of the pesticide active ingredients used by City operations went into controlling unwanted plant material. Of this, roughly three-quarters was used in terrestrial weed management and one-quarter in aquatic systems for algal control in stormwater wet ponds and root intrusion into the City’s sewer system. Figure 28 shows that improved cultural practices on the land continue to support a trend of reduced use of synthetic turf herbicides with only 5.5% of the City’s 4418 Ha inventory of parkland receiving these treatments in 2009.
A growing number of biological pesticides, biological control agents and preventive techniques are being used in Parks and Community Facility Services branches to approach more ecologically sustainable pest management solutions. Figure 29 demonstrates how the Drainage Services Branch has largely been able to replace diquat, an older chemistry algaecide, with a pesticide dye that interferes with the photosynthesis of algae in wet ponds. Investigations into a bacterial product, Liquid Live Micro-Organisms, again demonstrates a more ecological approach to managing algal blooms through various bacterial agents out competing the algae for what’s typically an overabundance of nutrients in the stormwater wet ponds. However, for this newer method, product costs alone are around 20 times higher than the conventional diquat.
Figure 28: Turf Herbicide Use Reduction By City Parks 1996 – 2009
20032002
20012000
19991998
19972005
20042006
20082007
2009
Year
% o
f Tot
al Tu
rf In
vent
ory S
pray
ed
0
10
20
30
40
50
60

57Ecovision Annual Report: city of Edmonton 2009
Figure 29: Algaecide Use Trends in Stormwater Wet Ponds
20052004 2006 20082007Year
ConventionalPhotosynthetic Inhibitor
kg A
l
0
100
200
300
400
500
Pesticide use at the City of Edmonton can be dominated by the needs of international outdoor aquatic sporting events such as triathlon and to a lesser extent, canoe polo held in Hawrelak Lake. Antimicrobial pesticides used to combat fecal bacterial loading in this shallow lake were not required in 2009 due to these events being held elsewhere. As Figure 30 indicates, this, together with many efforts to reduce, made 2009 the lowest pesticide use for City Operations in the past 17 years. Clearly, with judicious use of least toxic pesticides, the impact of City pesticide use on the environment is diminishing.
Figure 30: City Operations Pesticide Use (1993 – 2009)
0
2,000
3,000
1,000
4,000
5,000
6,000
Kg if
Al U
sed
Year
2009
2008
2007
2006
2005
2004
2003
2002
2001
2000
1999
1998
1997
1996
1995
1994
1993
58Ecovision Annual Report: city of Edmonton 2009
AchiEvEMEntsinitiative/Program 2009 results/achievements Physical alternative to reduce fence line use of chemical herbicides
Cost benefit analysis of Weed Seal™, a recycled rubber material to eliminate weeds along fence lines is unfavourable with a 28 year cost recovery compared to fence line trimming and treatment with the herbicide, glyphosate
Cost and performance comparison of EcoClear and glyphosate herbicides
No difference was observed in the weed control performance of the two products but treatment costs were 30x greater for EcoClear which presented some applicator challenges due to the product’s acidic properties
Microclimate management of golf course greens to reduce conditions promoting fungal pathogens
On greens where fungal pathogens are chronic, work to open up surrounding dense under-story caragana growth has begun.
Biological herbicides to reduce chemical herbiciding for the control of broadleaf weeds in turf
Established two field plots in 2009 to investigate the performance of Sarritor, a new fungal pathogen-based herbicide (mycoherbicide) registered in Canada to control dandelions in turf
New lower-impact herbicide application technology
Year two of a three-year investigation into the performance of Wet Blade technology shows improved performance of herbicides against Canada thistle over conventional cutting and spraying techniques
Lower impact control of insect outbreaks on ash trees
An application to expand the product label of the insecticide Orthene® 75 WP to include trunk injection has been submitted under the User Requested Minor Use Label Expansion (URMULE) program
Protection of American elm trees weakened by disease
Year two of this investigation saw another 75 weakened American elm trees injected with the fungicide, Eertavas®
Prevention of algal blooms in stormwater wet ponds
Liquid Live Micro-Organism (LLMO) treatments successfully reduced complaints from homeowners regarding algal blooms in stormwater wet ponds
hiGhliGhtinG innovAtion And lEAdERshipThe City’s policy for Integrated Pest Management is founded on the need for a deeper understanding of issues in natural systems and a scientific approach to investigation and problem solving. Ecologically-based solutions are typically more complex but once achieved provide longer lasting solutions that can benefit the whole community.

59Ecovision Annual Report: city of Edmonton 2009
WAtER
In November 2009, the Government of Alberta released the Water for Life Action Plan. The Water for Life action plan is based on the goals of the renewed Water for Life Strategy released in 2008 and is designed to ensure achievable outcomes that reflect growing pressures on Alberta’s water supplies. The Action Plan states that “water is an essential resource that must be protected to ensure future growth and prosperity in Alberta”8.
The Saskatchewan Glacier in the Columbia Icefields is the source of the North Saskatchewan River (NSR). The 13,900 km2 North Saskatchewan River (NSR) watershed upstream of Edmonton conveys a daily average flow through the city of approximately 200 m3 per second. EPCOR draws its water from this river to supply drinking water to Edmonton.
EPCOR reports that in 2009 Edmontonians consumed approximately 223 L of water per day while the average Canadian consumed approximately 266 L per day. Comparatively, Edmonton’s residential water use is one of the lowest in the country. However, Canada uses more water per person than almost any other country. Although water is considered a renewable resource, pressures on the resource are growing. Between 1972 and 1996, Canada’s rate of water withdrawals increased by almost 90%, from 24 billion m3/yr (cubic metres per year) to 45 billion m3/yr. but its population increased by only 33.6% over the same period9. Comparatively, over the past seven years, Edmonton’s population has increased by 13.6% while the total water consumption in Edmonton has only increased by approximately 3%.
Population growth in the City of Edmonton and surrounding region will likely continue to increase overall demand for water. This, combined with natural drought pressures, represents a water management challenge. Natural surface water and soil moisture conditions in the area have been receding since 2001. This ongoing drought has caused losses of around 30,000 or 10% of the City of Edmonton’s ornamental trees (since 2001). The City has responded through innovative water re-use programs.
Growth also increases the risk of pollutants being carried into streams, rivers, and lakes. I
The implementation of projects
designed to reduce contaminant loading to the river, such as the recently completed Kennedale Wetland, help reduce contaminant loads on the North Saskatchewan River. Innovation in wastewater and stormwater management ensures the continued health of Edmonton’s aquatic systems.
The sustainability of Edmonton is linked to the supply and quality of its water. As the Edmonton region grows in both population and industrial and commercial water users, the cumulative impacts on water quality and supply needs to be understood. The Way We Green will further explore water’s role in building a sustainable Edmonton
9 Water for Life Action Plan: November 2009, Alberta Government10 Environment Canada website accessed March 26, 2010.

60Ecovision Annual Report: city of Edmonton 2009
WATER CONSERVATIONsuMMARy of pERfoRMAncE MEAsuREs And condition indicAtoRsobjective: Conserve water and improve water use efficiency in City operationsindicator Target 2009 resultsPotable water used in Hawrelak Lake Reduce potable water use by
20%(0) No major water sport events in 2009.
Swimming Pool Water Reuse 3,000 cubic meters 3,254 cubic metersWater Management Strategy – City Operations Complete CompletedWater efficiency initiatives Eight initiatives Two completed, six on-going
objective: Conserve water and improve residential and commercial water use efficiency in Edmontonindicator Target 2009 resultsLitres of water consumed per Edmontonian per day (domestic water consumption only)
250 L/person/day 223 L/person/day
bAcKGRoundThe City’s normal annual precipitation is almost 477 mm with 366 mm falling as rainfall. Natural surface water and soil moisture conditions in the area have been receding since 2001. 2009 proved to be another extremely dry year for Edmonton. In these times of drought, demands are escalating for artificial watering to replenish soil moisture deficits necessary to sustain healthy plant life and the ecosystem services provided by a healthy urban forest. City Operations needs to re-think how wise water use can maintain the essentials of fire protection, recreational opportunities like swimming pools and skating rinks as well as healthy green landscapes in Edmonton.
In Alberta’s Capital region, EPCOR supplies treated water not only to the City of Edmonton, but to many communities spanning from Morinville in the north, Leduc in the south, Stony Plain in the west and east to as far as Vegreville. Water is treated at two water treatment plants: the Rossdale plant located downtown and E.L. Smith plant located in the west end. EPCOR currently supplies about 125 billion litres of water annually to over 1 million people in Edmonton and surrounding communities and counties. By promoting efficient water use, EPCOR can help reduce the impact on the local watershed, maximize services from existing water treatment and distribution infrastructure, reduce the volume of water requiring treatment and foster a “culture of sustainability” among its customers.
tREnds And AnAlysis
city operations
Table 5: Water Re-Used From Swimming Pools (2006 – 2009)
year 2006 2007 2008a 2009 ToTalwater re-used 927 m3 4443 m3 2533 m3 3254 m3 11,157 m3

61Ecovision Annual Report: city of Edmonton 2009
Figure 31: Water Re-Use from Swimming Pools (2006 – 2009)
0
4,000
2,000
8,000
12,000
10,000
6,000
Volu
me o
f Wat
er (m
3 )
Year2006 2007 2008 2009 Total
Table 6: Potable Water Used to Fill Hawrelak Lake (2004 to 2009)
year 2004 2005 2006 2007 2008 2009Potable water used in hawrelak lake Fills
6055 m3 19,908 m3 5289 m3 16,525 m3 0 m3 0 m3
The City of Edmonton’s water re-use program is showing success. Water continues to be re-used from Edmonton swimming pools to irrigate parkland with over 11,000 m3 being recycled in the past four years (see Table 5 and Figure 31). In addition, for the past two years no potable water has been used to fill Hawrelak Lake. However, even with these successes, it is clear that the principles of conservation must be more systematically applied across the corporation if the intent of the strategic objective is to be met. At present there is a lack of Federal and Provincial Standards for water reuse applications making it more difficult to initiate programs. Also, it is not clearly understood when grey water reuse will be acceptable and what infrastructure is required. Low impact development concepts are becoming more important for improved landscape sustainability but its application in Edmonton has been slow.

62Ecovision Annual Report: city of Edmonton 2009
Figure 32: Daily Intakes as a % of North Saskatchewan River Flow monthly (2009)
0
1.5
2.5
2.0
1.0
0.5
3.5
3.0
4.0
4.5
% o
f NSR
Flo
w
MonthJan Feb Mar Apr May June July Aug Sept Oct Nov Dec
Figure 33: Annual Residential and Non Residential Water Usage (2003 – 2009)
0
50,000
100,000
15,000
20,000
Volu
me (
mL)
Year2003 2004 2005 2006 2007 2008 2009
Residential UsageNon Residential Usage
Figure 34: Breakdown of Residential Water-Use (1999 Typical Canadian City)
Showers/Bath34%
Toilets29%
Laundry19%
Kitchen13%
Outdoors5%
Figure 35: Domestic Water Use Consumption (2003 – 2009)
0
50
100
150
200
250
L/Pe
rson
/Day
Year200520042003 2006 2007 2008 2009
coMMunity
supply
EPCOR’s two water plants supply the Edmonton metro region with an average of 350 million litres per day (or 4.1 cubic metres/sec). On average, daily withdrawal is 3.0% of the total flow. Seasonally, withdrawals make up a greater percentage during low flow periods, around 4% compared to open water periods, 2% to 3% as illustrated in Figure 32. More than 90% of the water withdrawn at the water plants is returned to the river via the local wastewater treatment plants. This loss equates to less than 0.2% of mean river flows.

63Ecovision Annual Report: city of Edmonton 2009
Currently, the North Saskatchewan River is not challenged in providing adequate flows for municipal, agricultural and industrial uses. Approximately 30% of mean flow of the river is allocated and there is currently no difficulty meeting a requirement that 50% of the mean annual flow be passed on to Saskatchewan. Total consumptive water usage is only about 4% of mean flow. At the same time, future increases in demand need to be managed in ways that protect the river’s ecosystems. As the river is marginally stressed for quality downstream of Edmonton, future increases in demand will have to be addressed in ways that prevent further degradation. Alberta Environment is currently studying the cumulative effects in the Devon-to-Pakan reach of the river (upstream/downstream of Edmonton). Results of this study will provide greater understanding and solutions to quality issues.
Alberta Environment and the Alberta Water Council have also called for major water use sectors across Alberta to develop conservation, efficiency and productivity plans for water use by 2010. Climate change effects may cause more variability in river flows in future with more floods and more periods of drought so water usage must be planned to accommodate this variability.
consumption
Domestic water use in Edmonton (on a per person basis) has historically been lower than the Canadian average due to a city-wide metering program, public education, rate setting methods and relatively short summers. Over 60% of residential water is used for showers, baths and toilet flushing (Figure 34 is illustrative of a typical City and not based on Edmonton data). On average, Canadian communities that are not metered use 74% more water than ones that are metered. Although total domestic (residential and multi-residential) consumption in Edmonton increased from 59,317 ML in 2003 to 63,864 ML in 2009 (due to a larger population), on a per capita basis, domestic water use declined slightly – from 232 litres per person per day in 2003, to 223 litres per person per day in 2009 (Figure 35). This level of consumption compared favourably to the Canadian average of 266 l/p/d for domestic customers in a large metered community. Over the next decade, it is expected that Edmonton’s per person domestic indoor water consumption will continue to decrease as more homes install efficient front-load washing machines and ultra low flush toilets (6 litres or less). It has been shown that a conserving North American household with all efficient fixtures and appliances (and no lawn watering) can chieve 150 l/p/d.
AchiEvEMEntsinitiative/Program/action Description 2009 results/achievements An investigation of new, slow release tree watering techniques
A cost effectiveness study investigated the use of 600 gator bags and ooze tubes on new tree plantings
A new development soil standard to improve infiltration and retention of water in the land
A University of Alberta-lead project team will develop a new soil standard in 2010
On-site stormwater collection in ponds to supplement sports field irrigation at the Multi-Tournament Recreation Facility
Construction completed in 2009
Install sub-surface irrigation to reduce water use on the Hamptons sports fields
Construction completed in 2009, water consumption estimated at 60% of conventional pop-up sprinkler systems
Divert waste water flow out of the Jackie Parker spray deck from sanitary drainage to the Mill Woods Golf course irrigation pond
Construction underway with completion in 2010. This eliminates sanitary charges from the spray deck water bill and reduces potable water demands for golf course irrigation
EPCOR’s Rain Barrel Promotion for Residential Customers
The rain barrel pilot program proved very popular. Approximately 1,000 customers took advantage of EPCOR’s promotion this summer. More than 1600, two hundred litre rain barrels were sold at cost. An Eco-Yard public education event was held May 23 as part of the rain pick up at Victoria Park, in partnership with City of Edmonton (CoE) compost program. A rain barrel promotion will be held in 2010. This time, customers will be able to order directly from the EPCOR call centre and have the charges put directly on their monthly bills.
64Ecovision Annual Report: city of Edmonton 2009
hiGhliGhtinG innovAtion And lEAdERship
EpcoR’s Water Efficiency and productivity plan 2010 – 2030
The Alberta Water Council identified water conservation as a focus for accelerated action in the Water for Life renewal. The Alberta Water Council identified seven sectors and prepared a framework to provide direction to develop the Water Conservation, Efficiency and Productivity (CEP) plan for each sector. Among those seven sectors, the Alberta Urban Municipalities Association (UMA) is overseeing the development of the Municipal Sector CEP. EPCOR has actively been involved in the development of the AUMA CEP. The AUMA CEP has several short term targets, one
of which is that urban municipalities representing 80% of municipal water allocations will develop CEP plans by December 31, 2011. EPCOR has developed a Long Term Water Efficiency Report that aligns with the objectives of the Municipal Sector CEP. EPCOR’s long term vision is to continue to be a leader in water efficiency in the province. Going forward, EPCOR will focus on continuing to actively promote the wise use of water and identifying and reducing the number of inefficient water users in all customer categories
PROTECTION OF COMMUNITY WATER QUALITYsuMMARy of pERfoRMAncE MEAsuREs And condition indicAtoRsobjective: Protect the quality of water entering the North Saskatchewan River so it can support a diversity of uses (Drainage System).indicator Target 2009 resultsEdmonton Watershed Contaminant Reduction Index (EWCRI)
EWCRI is a performance measure that compares combined annual loading data and the City’s population data to the established baseline and represents the progress towards reaching the ultimate target of zero loads to the NSR. An index >7.4 is considered good.
7.9 (Good)
(Improvement from 6.9 in 2008 )
River Water Quality Index (RWQI) The RWQI summarizes the impact of a more comprehensive suite of water quality parameters upstream and downstream of Edmonton. An index of >81 is considered good or excellent (>96)
Downstream 85 (Good) in 2008 (last year data is available)
(Improvement from 83 in 2007)

65Ecovision Annual Report: city of Edmonton 2009
objective: Ensure that wastewater from Edmonton’s sanitary and combined sewer systems is treated in accordance with best practical technology and is returned to the North Saskatchewan River system in a way that minimizes negative impacts on downstream water quality (Waste Water Treatment Centre).indicator Target 2009 resultsDischarge limits as per Approval to Operate (in brackets are City Council supported management targets)
100% Compliance with Approval to Operate
TSS: 20 mg/L (6.0 mg/L)
BOD: 20 mg/L (5.0 mg/L)
Ammonia Nitrogen: 10 mg/L (Winter)
Ammonia Nitrogen: 5 mg/L (Summer)
Total Phosphorus: 1 mg/L
E.coli: 200 counts per 100 mL (40 cfu/100 mL)
pH 6.5 to 9.5
Achieved
4.82 (Compliant)
3.46 (Compliant)
2.35 (Compliant)
1.41 (Compliant)
0.51 (Compliant)
10 (Compliant)
7.37 (Compliant)
bAcKGRoundThe City of Edmonton operates a complex drainage system that is collected and treated at the Gold Bar Wastewater Treatment Plant and subsequently discharges into the North Saskatchewan River. In 2009, the Gold Bar plant was acquired by EPCOR Water Services Inc. The components of the drainage system include the following:
• Gold bar wastewater Treatment Plant: The GBWWTP treats wastewater for about 800,000 people in the greater Edmonton area. The plant has a treatment capacity of 310 ML/day and discharges about 250 ML/day of treated wastewater collected by the sanitary sewer and combined sewer systems.
• Discharges from combined Sewers: The combined sewer system collects both sanitary wastewater and surface runoff from older, central areas of the city. Flows from this sewer system are treated at GBWWTP during dry weather. However, in situations where flows exceed sewer capacity (e.g., during rainfall and snow melt events) water containing untreated waste water is discharged directly to the river.
• Discharges from the Storm Sewer: The City’s storm sewer system consists of storm sewers pipes, wet stormwater management lakes, dry ponds, constructed wetlands and outfalls that discharge surface runoff water to the North Saskatchewan River and creeks during rainfall events.
Discharges to the North Saskatchewan River from the city’s storm sewers, combined sewers and the treatment plant, contain substances that are detrimental to water quality including, but not limited to: sediment, nutrients, oxygen-demanding substances, and bacteria. The City and EPCOR work together to improve the quality of these discharges to protect water quality and the overall ecosystem. The following section is separated into the drainage collection system, which includes discharges from storm sewers and combined sewer overflows, and the GBWWTP, which focuses on the operations of the plant and its effluent to the river.
details on the collection system – drainage services
The City of Edmonton affects the river through discharges from storm sewers and combined sewer overflows. Edmonton’s stormwater system collects runoff from about 30,000 hectares of urban development. The combined sewer system receives runoff from about another 5,000 hectares.
The combined sewer system receives runoff from the City’s central core representing about 15% of Edmonton’s currently developed area. Domestic sewage and stormwater are collected in one pipe and transported to EPCOR’s GBWWTP. There are approximately 930 km

66Ecovision Annual Report: city of Edmonton 2009
of combined sewers. The majority of runoff entering the combined sewers is treated but during rainstorms some is directly discharged to the NSR through one of the combined sewer outfalls.
Separated storm sewer system installation began at the same time as the sanitary system in the mid 1950s. Currently there are about 1,900 km of storm sewers servicing about 85 per cent of total developed area of the City. Stormwater is channelled, via the storm sewer system, either directly to the NSR (21,000 ha) without any treatment, or into stormwater management facilities (9,000 ha) where it receives partial treatment. There are over 70 stormwater management facilities (wet ponds and constructed wetlands) in the city. Stormwater enters the NSR or tributary creeks from over 220 storm sewer outfalls.
tREnds And AnAlysis
city operations – drainage services
The City of Edmonton’s Drainage Services continuously monitors flows and contaminant concentrations of storm and combined sewer discharges to the river. This has been done through the Environmental Monitoring Program (EMP) since 1991 to:
• Comply with the City’s Approval to Operate
• Characterize City of Edmonton contaminant loads on the North Saskatchewan River (NSR)
• Facilitate development of total contaminant loadings framework for the NSR.
total loadings
Edmonton’s Approval-to-Operate (issued by Alberta Environment for 2005 to 2015) is founded on the principle of limiting the total load of contaminants released to the NSR by the wastewater treatment plant, the combined sewers and the stormwater system. Monitoring of sewer outfalls to the NSR commenced in the late 1970’s and has steadily evolved to become the Environmental Monitoring Program (EMP). The total loading approach is developed based on the historic data collected through the EMP. Outfall and in-stream river monitoring has demonstrated that stormwater quality improvements are needed and will become more essential to protect the watershed as the city continues to grow and expand.
In 2009, 80% of storm and 95% of combined sewer discharges were monitored with a total of 379 samples collected and over 3,000 analytical laboratory tests completed. The collected samples were regularly analyzed for nutrients, bacteria and solids content, and occasionally analyzed for an extended list of parameters, including metals and pesticides. The chemical analyses were completed by certified analytical laboratories, and the results were routinely provided to Alberta Environment and other stakeholders.
Historical contaminant loadings for major sources are shown in the following Figures:
Figure 36: Total Phosphorus (1995 – 1999 and 2005 – 2009)
0
50
100
150
200
250
Year
1995 – 19992005 – 2009
Load
(Ton
s)
GBWTP/CBGBWTP/FE CSO Storm
nutrients
Organic matter, fertilizer, sewer overflows and spills can contribute to elevated levels of nutrients in lakes and rivers. If present in sufficient quantities, nutrients can stimulate growth of aquatic plants and algae, leading to dramatic fluctuation of dissolved oxygen levels.
Average nutrient loadings for the period from 2005 to 2009 were reduced from 0.8 T/day (95-99) to 0.3 T/day. Nutrient loading reduction was achieved through major system upgrades and expansion at the Gold Bar Wastewater Treatment Plant. Tertiary Treatment upgrading

67Ecovision Annual Report: city of Edmonton 2009
began in 1995 and was completed in 2003. This Biological Nutrient Removal (BNR) process uses micro organisms in aerobic (oxygen-rich) and anaerobic (oxygen-deprived) environments to treat wastewater, including the removal of nutrients such as phosphorus and nitrogen. Continued work on supporting infrastructure such as Fermenters and Enhanced Primary Treatment will improve both dry and wet weather performance.
Figure 37: Bacteria Load (1995 – 1999 and 2005 – 2009)
0
40,000
20,000
60,000
80,000
100,000
120,000
140,000
160,000
Year
1995 – 19992005 – 2009
Coun
t * 1
0 ^ 1
2
GBWTP/CBGBWTP/FE CSO Storm
bacteria
High bacteria counts can result from various sources, including illicit connections, storm drain and street runoff, illegal discharges, bird and animal waste and Combined Sewer Overflow (CSO) discharges. Bacteria in the plant discharge was mostly addressed with the completion of the Ultraviolet Disinfection facility in 1998. Disinfection reduced fecal coliforms levels in the regular plant discharge by 99.9%. In addition, operation of Enhanced Primary Treatment Facility (2008) will provide further reduction of bacteria by targeting plant bypass (GBWWTP/CB) and CSO discharges.
Wastewater defined…
boD – Biochemical Oxygen Demand
bnr – Biological Nutrient Removal
cFu – Colony Forming Unit
cSo – Combined Sewer Overflow
e.coli – A bacterium generally associated with human and animal waste.
eMP – Environmental Monitoring Program
ewcri – Edmonton Watershed Contaminant Reduction Index
Fc – Fecal Coliforms
STorM – Storm Sewer System
Supernatant – The fluid above a sediment or precipitate
GbwwTP – Goldbar Waste Water Treatment Plant
GbwwTP/cb – CB stands for combined bypass, and these loads represent situations where flows to the GBWWTP exceed its capacity and it is necessary to bypass the secondary processes)
GbwwTP/Fe – FE stands for final effluent and represents the flow that has received the full treatment process.
liD – Low Impact Development
nh3 – Ammonia (a nutrient)
nSr – North Saskatchewan River
rwQi – Alberta River Water Quality Index
TP – Total Phosphorus (a nutrient)
TSS – Total Suspended Solids
uV – Ultra violet light

68Ecovision Annual Report: city of Edmonton 2009
Figure 38: Total Suspended Solids (1995 – 1999 and 2005 – 2009)
0
2,000
1,000
3,000
4,000
5,000
6,000
7,000
9,000
8,000
Year
1995 – 19992005 – 2009
Load
(Ton
s)
GBWTP/CBGBWTP/FE CSO Storm
total suspended solids
Sediment discharges into rivers can be detrimental to aquatic life by reducing light needed for plants to grow, damaging sensitive tissue such as fish gills and suffocating organisms that live on the riverbed. The stormwater system is the major source of sediment discharge to the NSR. Reducing this load through the construction of Kennedale (2009) and other constructed wetlands and through the use of Low Impact Development (LID) efforts will be a focus for the future.
What is low impact development?
Low impact development is a stormwater management and land development strategy that emphasizes conservation and use of natural features, integrated with engineered controls to more closely mimic pre-development hydrology. The goal of LID is to manage stormwater in a manner that helps to prevent harm to natural aquatic systems from commercial, residential or industrial development sites. Examples of LID include green roof, bioswales, and constructed wetlands.
indicators
The historical EMP information has been used to develop “edmonton watershed contaminant reduction index” (EWCRI). EWCRI is a performance measure that compares combined annual loading data and the city’s population data to the established baseline and represents the progress towards reaching the ultimate target of zero loads to the NSR.
EWCRI is calculated by combining annual loading data for three equally weighted key water quality indicators – total suspended solids, nutrients (ammonia and phosphorus), and bacteria and the City’s population numbers for each year. These important watershed parameters are mathematically converted into a simple Contaminant Reduction Index score, where a maximum score of 10 equals zero loads to the river (Table 7). Figure 39 shows the historical trend of the EWCRI. The upward trend shows progress towards reducing contaminant loading to the river with 10 representing elimination of all discharges.

69Ecovision Annual Report: city of Edmonton 2009
Table 7: Edmonton Watershed Contaminant Reduction Index
year annual Status2009 7.92008 6.92007 6.82006 6.82005 7.32004 5.42003 6.82002 8.02001 7.02000 6.41999 5.41998 4.61997 3.11996 3.81995 5.3
>7.45 Good5,45 – 7.45 Fair
<5.45 Poor
Figure 39: Historical Watershed Contaminant Reduction Index Score
199819961994 20022000 2004 20082006 2009Year
Cont
amin
ant R
educ
tion I
ndex
2.0
3.0
4.0
5.0
6.0
7.0
8.0
9.0
10.0
Annual5 -Year Average95 – 99 Average
City of Edmonton – AMPW – Drainage Services Edmonton Watershed Containment Reduction IndexThe alberta river water Quality index (RWQI) provides a simple way of showing the impact of a more comprehensive suite of water quality parameters (metals, nutrients, bacteria and pesticides) on the NSR upstream and downstream of Edmonton. This index provides a general understanding of the inputs of all discharges in the region (municipal, industrial, agricultural and natural processes).
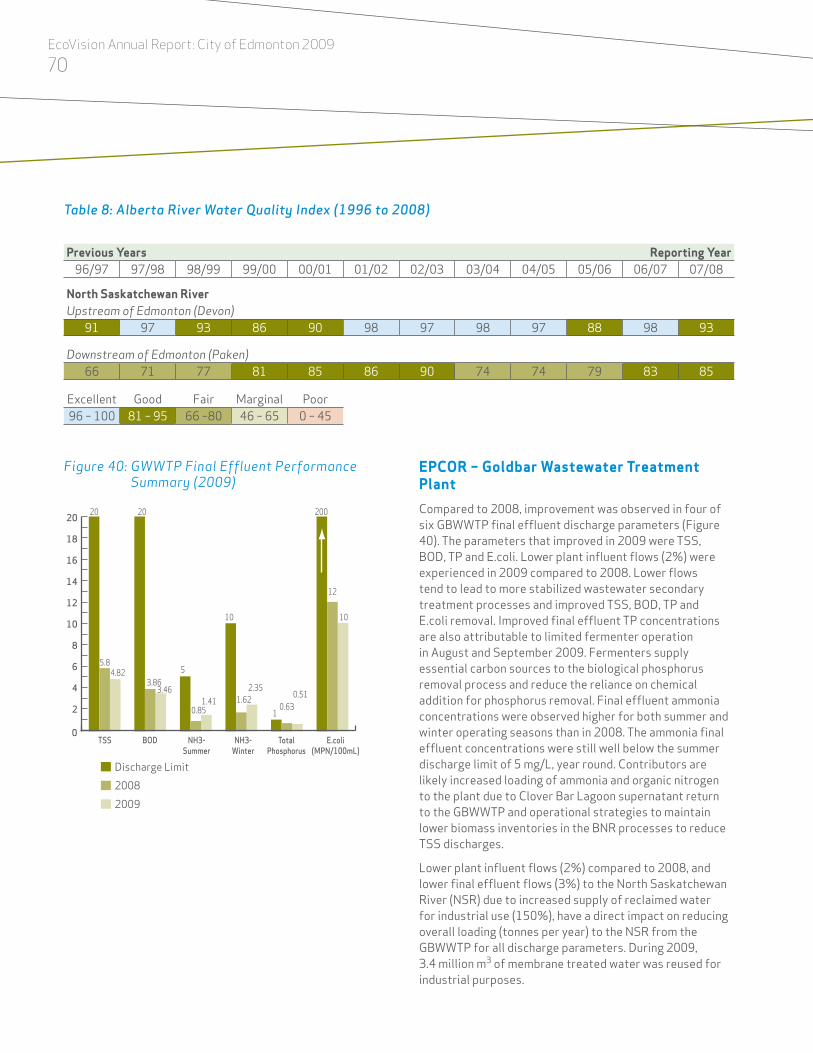
70Ecovision Annual Report: city of Edmonton 2009
Table 8: Alberta River Water Quality Index (1996 to 2008)
Previous years reporting year96/97 97/98 98/99 99/00 00/01 01/02 02/03 03/04 04/05 05/06 06/07 07/08
north Saskatchewan riverUpstream of Edmonton (Devon)
91 97 93 86 90 98 97 98 97 88 98 93
Downstream of Edmonton (Paken)66 71 77 81 85 86 90 74 74 79 83 85
Excellent Good Fair Marginal Poor96 – 100 81 – 95 66 –80 46 – 65 0 – 45
Figure 40: GWWTP Final Effluent Performance Summary (2009)
0
2
4
6
8
10
12
14
16
18
20
Discharge Limit20082009
20
5.84.82
3.863.46
5
0.851.41
10
1.622.35
10.63
0.51
12
10
20 200
BODTSS E.coli(MPN/100mL)
NH3-Summer
NH3-Winter
TotalPhosphorus
ePcor – Goldbar wastewater Treatment Plant
Compared to 2008, improvement was observed in four of six GBWWTP final effluent discharge parameters (Figure 40). The parameters that improved in 2009 were TSS, BOD, TP and E.coli. Lower plant influent flows (2%) were experienced in 2009 compared to 2008. Lower flows tend to lead to more stabilized wastewater secondary treatment processes and improved TSS, BOD, TP and E.coli removal. Improved final effluent TP concentrations are also attributable to limited fermenter operation in August and September 2009. Fermenters supply essential carbon sources to the biological phosphorus removal process and reduce the reliance on chemical addition for phosphorus removal. Final effluent ammonia concentrations were observed higher for both summer and winter operating seasons than in 2008. The ammonia final effluent concentrations were still well below the summer discharge limit of 5 mg/L, year round. Contributors are likely increased loading of ammonia and organic nitrogen to the plant due to Clover Bar Lagoon supernatant return to the GBWWTP and operational strategies to maintain lower biomass inventories in the BNR processes to reduce TSS discharges.
Lower plant influent flows (2%) compared to 2008, and lower final effluent flows (3%) to the North Saskatchewan River (NSR) due to increased supply of reclaimed water for industrial use (150%), have a direct impact on reducing overall loading (tonnes per year) to the NSR from the GBWWTP for all discharge parameters. During 2009, 3.4 million m3 of membrane treated water was reused for industrial purposes.
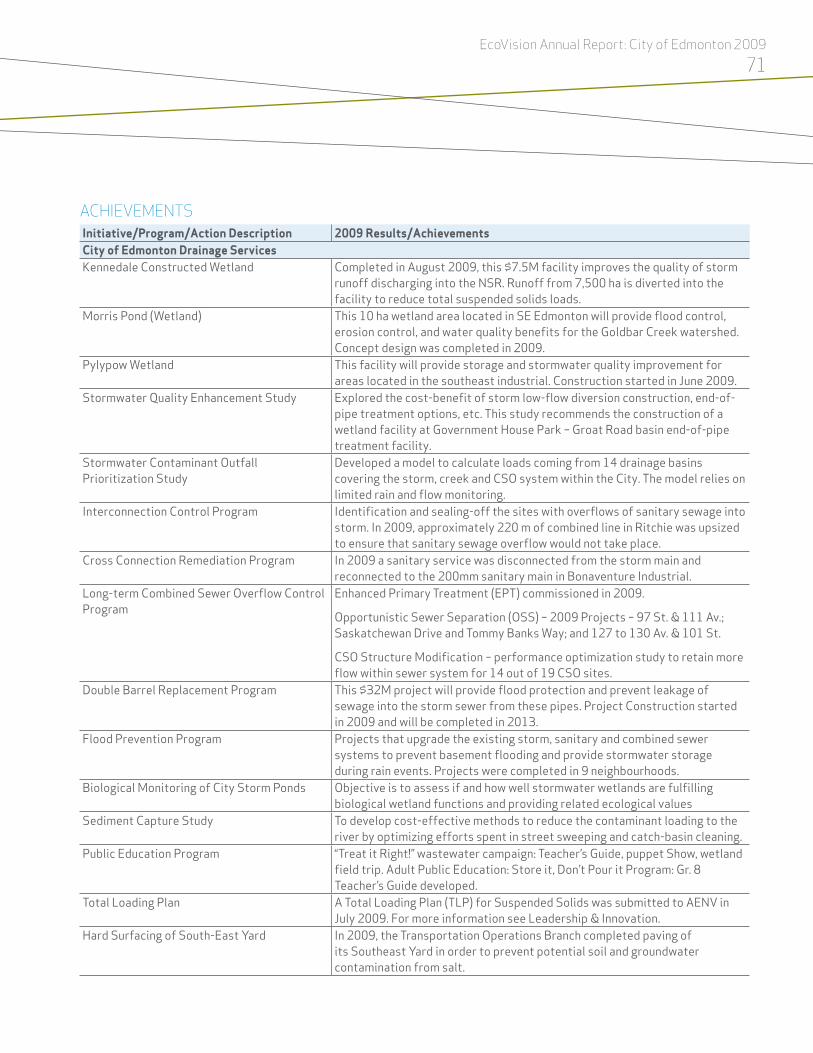
71Ecovision Annual Report: city of Edmonton 2009
AchiEvEMEntsinitiative/Program/action Description 2009 results/achievementscity of edmonton Drainage ServicesKennedale Constructed Wetland Completed in August 2009, this $7.5M facility improves the quality of storm
runoff discharging into the NSR. Runoff from 7,500 ha is diverted into the facility to reduce total suspended solids loads.
Morris Pond (Wetland) This 10 ha wetland area located in SE Edmonton will provide flood control, erosion control, and water quality benefits for the Goldbar Creek watershed. Concept design was completed in 2009.
Pylypow Wetland This facility will provide storage and stormwater quality improvement for areas located in the southeast industrial. Construction started in June 2009.
Stormwater Quality Enhancement Study Explored the cost-benefit of storm low-flow diversion construction, end-of-pipe treatment options, etc. This study recommends the construction of a wetland facility at Government House Park – Groat Road basin end-of-pipe treatment facility.
Stormwater Contaminant Outfall Prioritization Study
Developed a model to calculate loads coming from 14 drainage basins covering the storm, creek and CSO system within the City. The model relies on limited rain and flow monitoring.
Interconnection Control Program Identification and sealing-off the sites with overflows of sanitary sewage into storm. In 2009, approximately 220 m of combined line in Ritchie was upsized to ensure that sanitary sewage overflow would not take place.
Cross Connection Remediation Program In 2009 a sanitary service was disconnected from the storm main and reconnected to the 200mm sanitary main in Bonaventure Industrial.
Long-term Combined Sewer Overflow Control Program
Enhanced Primary Treatment (EPT) commissioned in 2009.
Opportunistic Sewer Separation (OSS) – 2009 Projects – 97 St. & 111 Av.; Saskatchewan Drive and Tommy Banks Way; and 127 to 130 Av. & 101 St.
CSO Structure Modification – performance optimization study to retain more flow within sewer system for 14 out of 19 CSO sites.
Double Barrel Replacement Program This $32M project will provide flood protection and prevent leakage of sewage into the storm sewer from these pipes. Project Construction started in 2009 and will be completed in 2013.
Flood Prevention Program Projects that upgrade the existing storm, sanitary and combined sewer systems to prevent basement flooding and provide stormwater storage during rain events. Projects were completed in 9 neighbourhoods.
Biological Monitoring of City Storm Ponds Objective is to assess if and how well stormwater wetlands are fulfilling biological wetland functions and providing related ecological values
Sediment Capture Study To develop cost-effective methods to reduce the contaminant loading to the river by optimizing efforts spent in street sweeping and catch-basin cleaning.
Public Education Program “Treat it Right!” wastewater campaign: Teacher’s Guide, puppet Show, wetland field trip. Adult Public Education: Store it, Don’t Pour it Program: Gr. 8 Teacher’s Guide developed.
Total Loading Plan A Total Loading Plan (TLP) for Suspended Solids was submitted to AENV in July 2009. For more information see Leadership & Innovation.
Hard Surfacing of South-East Yard In 2009, the Transportation Operations Branch completed paving of its Southeast Yard in order to prevent potential soil and groundwater contamination from salt.

72Ecovision Annual Report: city of Edmonton 2009
initiative/Program/action Description 2009 results/achievementsEngineered Snow Storage Site In 2009, the Transportation Operations Branch initiated the design and
development of engineered snow storage to replace the existing Northeast snow storage site. The site is expected to be operational for the 2010/2011 snow season.
ePcor Goldbar wastewater Treatment PlantDisposal of Biosolids A total mass of 25,569 dry tonnes of biosolids were transferred out of the
Cloverbar Biosolids Recycling Facility in 2009. This mass was over 2,000 dry tonnes more than what was transferred into the Cloverbar facility. The Biosolids volume transferred to the co-composter was 14,244 dry tonnes while the remaining 11,325 dry tonnes were beneficially used on agricultural land in the Edmonton region.
Biosolids Management Plan Phase 2 of the development of the Capital Region Biosolids Management Plan got underway in 2009. There were five alternative land use projects established in the first year of the second phase of this multi-year plan development project. Work has also begun with Alberta Environment to enhance the regulatory framework for the beneficial uses of biosolids in Alberta.
New Demonstration Project to Dry Biosolids The demonstration project to test new biosolids drying technology entered the construction phase in 2009. Final building construction, equipment assembly and testing will occur in 2010
Benefits from New Fermenters Fermenters were commissioned and operated in 2009. Volatile Fatty Acid production targets were achieved, enhancing the Biological Phosphorus removal process. Chemical usage for phosphorus removal was reduced by 29%.
Enhanced Primary Treatment Enhanced Primary Treatment continues to progress through staged commissioning approach. Process was operated intermittently without chemical addition to improve solids capture and provide baseline performance data.
hiGhliGhtinG innovAtion And lEAdERship
Waste Management centre of Excellence
EPCOR and the City of Edmonton continue to support the Edmonton Waste Management Centre of Excellence. The Edmonton Waste Management Centre of Excellence is a non-profit corporation and is a one-stop resource for services and expertise in sustainable management of municipal, industrial, and agricultural solid waste and wastewater. The Centre, a unique public-private partnership, manages practitioner training, research, and demonstration activities and encompasses the world’s largest variety of leading-edge waste management facilities within a small geographic area and includes one of the world’s most advanced biological wastewater treatment plants.
Reducing loading of total suspended solids to the River
The City of Edmonton, Drainage Services developed the Total Loading Plan (TLP) to fulfill the requirement of Alberta Environment as outlined in its Approval to Operate. The TLP establishes a framework for limiting annual loadings of total suspended solids (TSS) from municipal operations to the North Saskatchewan River (NSR). The baseline year (2009) was estimated to be 29,000 kg/d and this number was adopted as the regulatory compliance target to be met by 2015 and in future years. Implementation of TLP will be managed by the City of Edmonton’s Drainage Services. Figure 41 illustrates the results expected after full implementation of the TLP.

73Ecovision Annual Report: city of Edmonton 2009
Figure 41: Measured and Projected TSS Loads (kg/d) Discharged to NSR from Major Sources
0
5,000
10,000
15,000
20,000
25,000
30,000
35,000
40,000
StormwaterCSOGBWWTP
TSS Load Limit = 28,870 kg/d
Historical Projected
TSS
Load
(kg/
d)
20202019
20182017
20162015
20142013
20112010
20092008
20072006
20052004
20032002
20012000
examples of Projects Designed to limit Total Suspended Solids Discharges to river:
• Enhanced Primary Treatment at the GBWWTP ($55M facility);
• Kennedale Constructed Wetland ($7M facility that became operational in August 2009);
• Continuous Monitoring to verify the effectiveness of the plan and facilities (>$450,000 per year)
Kennedale constructed Wetland
The Kennedale Constructed Wetland project is located in Hermitage Park in northeast Edmonton and consists of converting the remnants of a former gravel extraction operation site that is now filled with water. The project was completed in August 2009. Storm flows are diverted from the adjacent existing Kennedale trunk to the constructed wetland. Treated water then returns to the trunk and discharges to the North Saskatchewan River using the existing outfall. The Kennedale storm basin has a catchment area of 7,250 hectares.

74Ecovision Annual Report: city of Edmonton 2009
bAcKGRoundIn 2004, Edmonton City Council approved City Policy C505 which provided the policy framework for City operations to establish ISO14001 environmental management systems (known as Enviso). Through the use of Enviso and cross-departmental task forces, the City’s Environmental Strategic Plan is implemented.
ISO 14001 is an international standard that outlines 18 key requirements. The standard ensures that environmental considerations are taken into account in City decision making while formalizing a mechanism for management to support environmental initiatives and continual improvement. The Enviso system is the primary mechanism for implementing the City’s Environmental Strategic Plan.
In 2005, Drainage Services was the first City of Edmonton operation to adopt the ISO 14001 Standard and obtain certification. The Waste Management Branch followed by receiving its certification in 2006. Five other branches followed: Parks, Fleet Services, Roads Design and Construction and Transportation Operations, Fire Rescue Services, and Transit. As of 2009, Corporate Properties and Community Facility Services branches continued to work towards certification.
2009 Audits
The audit process is a key function that promotes continual improvement within the ISO 14001 systems. There are two types of audits that are conducted: conformance to the ISO14001 standard, and compliance to environmental regulations.
conformance Audits
In 2009 the Office of Environment conducted internal audits for a number of branches. These were: Parks, Fleet Services, Roads Design and Construction and Transportation Operations, Fire Rescue Services, Community Facility Services and Transit. Audit findings that were consistently identified across business units are:
• The identification and formal recording of requirements around competency training and awareness could be improved
• Controlling documents associated with the environmental management system could be improved.
Ensuring every employee is appropriately trained to reduce environmental risk and keep track of and update training records remains a challenge, especially in a large organization where there are many employees. To address this, a software package is being integrated into the environmental management systems in 2010. It is expected that the software solution will help to better manage training requirements.
In 2009 the auditing function (delivered by the Office of Environment) was also audited. Findings included:
• Control of documents and records associated with the audit process could be improved
• Responsibilities for key components of the EMS have been assigned to Office of Environment and other corporate entities; they should be audited in future internal audits.
Regulatory compliance Audits
The Office of Environment also completed environmental compliance audits for Parks, Fleet Services, Roads Design and Construction and Transportation Operations, Fire Rescue Services, Community Facility Services and Transit.
Compliance audits in 2009 were thematic with a scope to reviewing the compliance status of branch activities with respect to storage tank management of flammable and combustible liquids. The storage of propane was also audited and, for some branches, the scope was expanded to include regulations pertaining to “Site Contamination”.
A number of non compliances were identified including findings around:
• Tank inspections
• Site spill containment
• Tank, piping and facility signage requirements
• Identification and location of automatic shut off for fuel dispensing tanks
EnviRonMEntAl MAnAGEMEnt

75Ecovision Annual Report: city of Edmonton 2009
• Fire extinguishers and spill kits at storage tank locations
• Tank registrations
• Proximity of propane tanks to sources of ignition
In some cases, responsibility for tank management was not clearly defined. It was recommended that tank management responsibilities be better defined to assist in consistent compliance with regulations.
implementation of the Environmental strategic plan
In 2008, the objectives in the 2006 Environmental Strategic Plan were evaluated against City Council’s three- and 10-year goals contained in The Way Ahead, the City of Edmonton Strategic Plan 2009 – 2018. Analysis showed that 17 of the 52 objectives were very closely aligned with City Council’s goals.
in 2009, these 17 objectives were the main focus of implementation efforts ensuring corporate-wide coordination, establishing meaningful measures and targets, creating detailed action plans, and ensuring effective monitoring and reporting. The action plans will guide the implementation of the 17 objectives in 2010. Appendix A presents the implementation model described above. Appendix B outlines all of the strategic objectives within the 2006 Environmental Strategic Plan.
Awards
Since 2000, best practices in sustainable community development have been celebrated each year with the FCM–CH2M HILL Sustainable Community Awards. In 2009, the City of Edmonton received an award for the implementation of its ISO14001 Environmental Management Systems.
conclusion
There is a high degree of commitment to environmental protection at all levels within the City of Edmonton and overall environmental performance is continually improving. In 2009, all branches maintained their registration to the ISO 14001:2004 Standard with one more branch, Community Facility Services, being recommended to move forward with obtaining registration in 2010. Corporate Properties continues to evaluate the environmental risks of its operations and the value of implementing ISO14001.
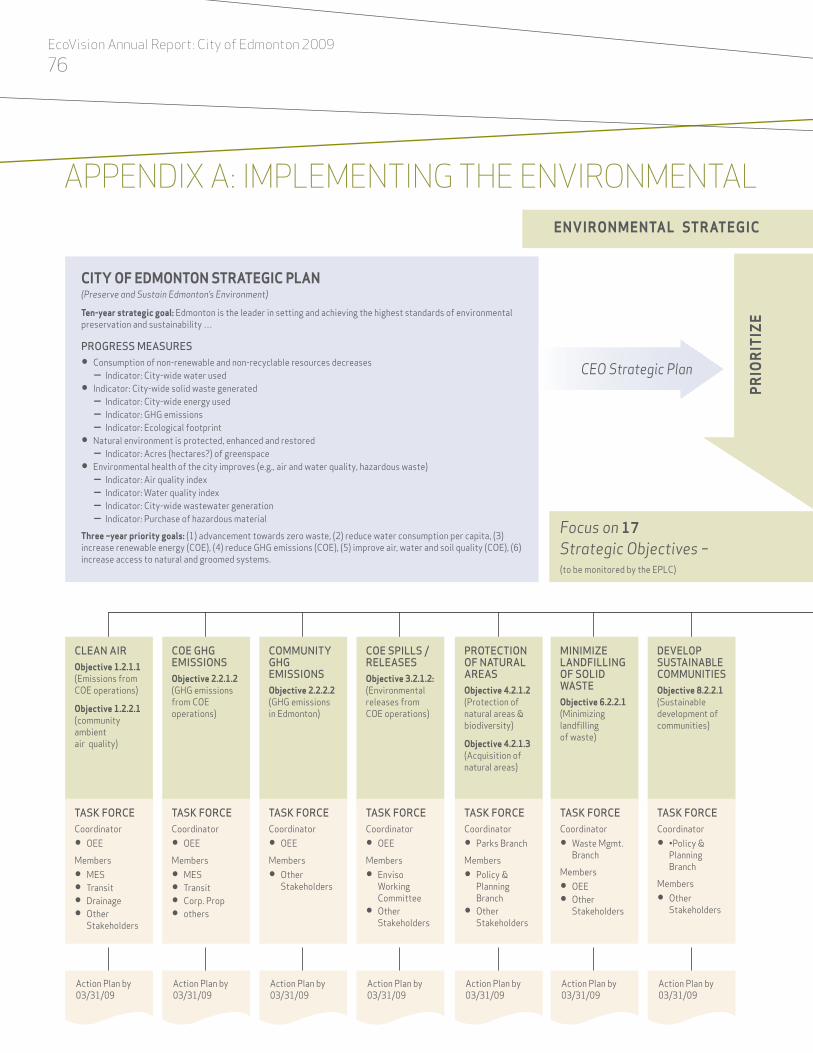
76Ecovision Annual Report: city of Edmonton 2009
AppEndix A: iMplEMEntinG thE EnviRonMEntAl
ciTy oF eDMonTon STraTeGic Plan(Preserve and Sustain Edmonton’s Environment)
Ten-year strategic goal: Edmonton is the leader in setting and achieving the highest standards of environmental preservation and sustainability …
prOgress Measures• Consumption of non-renewable and non-recyclable resources decreases
– Indicator: City-wide water used• Indicator: City-wide solid waste generated
– Indicator: City-wide energy used – Indicator: GHG emissions – Indicator: Ecological footprint
• Natural environment is protected, enhanced and restored – Indicator: Acres (hectares?) of greenspace
• Environmental health of the city improves (e.g., air and water quality, hazardous waste) – Indicator: Air quality index – Indicator: Water quality index – Indicator: City-wide wastewater generation – Indicator: Purchase of hazardous material
Three –year priority goals: (1) advancement towards zero waste, (2) reduce water consumption per capita, (3) increase renewable energy (COE), (4) reduce GHG emissions (COE), (5) improve air, water and soil quality (COE), (6) increase access to natural and groomed systems.
enVironMenTal STraTeGic Plan – 52 Strategic Objectives
Clean airobjective 1.2.1.1 (Emissions from COE operations)
objective 1.2.2.1 (community ambient air quality)
COe ghg eMissiOnsobjective 2.2.1.2 (GHG emissions from COE operations)
COMMunity ghg eMissiOnsobjective 2.2.2.2 (GHG emissions in Edmonton)
COe spills / releasesobjective 3.2.1.2: (Environmental releases from COE operations)
prOteCtiOn Of natural areasobjective 4.2.1.2 (Protection of natural areas & biodiversity)
objective 4.2.1.3 (Acquisition of natural areas)
MiniMize landfilling Of sOlid Wasteobjective 6.2.2.1 (Minimizing landfilling of waste)
develOp sustainable COMMunitiesobjective 8.2.2.1 (Sustainable development of communities)
task fOrCeCoordinator
• OEE
Members
• MES• Transit• Drainage• Other
Stakeholders
Action Plan by 03/31/09
Action Plan by 03/31/09
Action Plan by 03/31/09
Action Plan by 03/31/09
Action Plan by 03/31/09
Action Plan by 03/31/09
Action Plan by 03/31/09
task fOrCeCoordinator
• OEE
Members
• MES• Transit• Corp. Prop• others
task fOrCeCoordinator
• OEE
Members
• Other Stakeholders
task fOrCeCoordinator
• OEE
Members
• Enviso Working Committee
• Other Stakeholders
task fOrCeCoordinator
• Parks Branch
Members
• Policy & Planning Branch
• Other Stakeholders
task fOrCeCoordinator
• Waste Mgmt. Branch
Members
• OEE• Other
Stakeholders
task fOrCeCoordinator
• •Policy & Planning Branch
Members
• Other Stakeholders
Prio
riT
ize
CEO Strategic Plan
Focus on 17Strategic Objectives – (to be monitored by the EPLC)
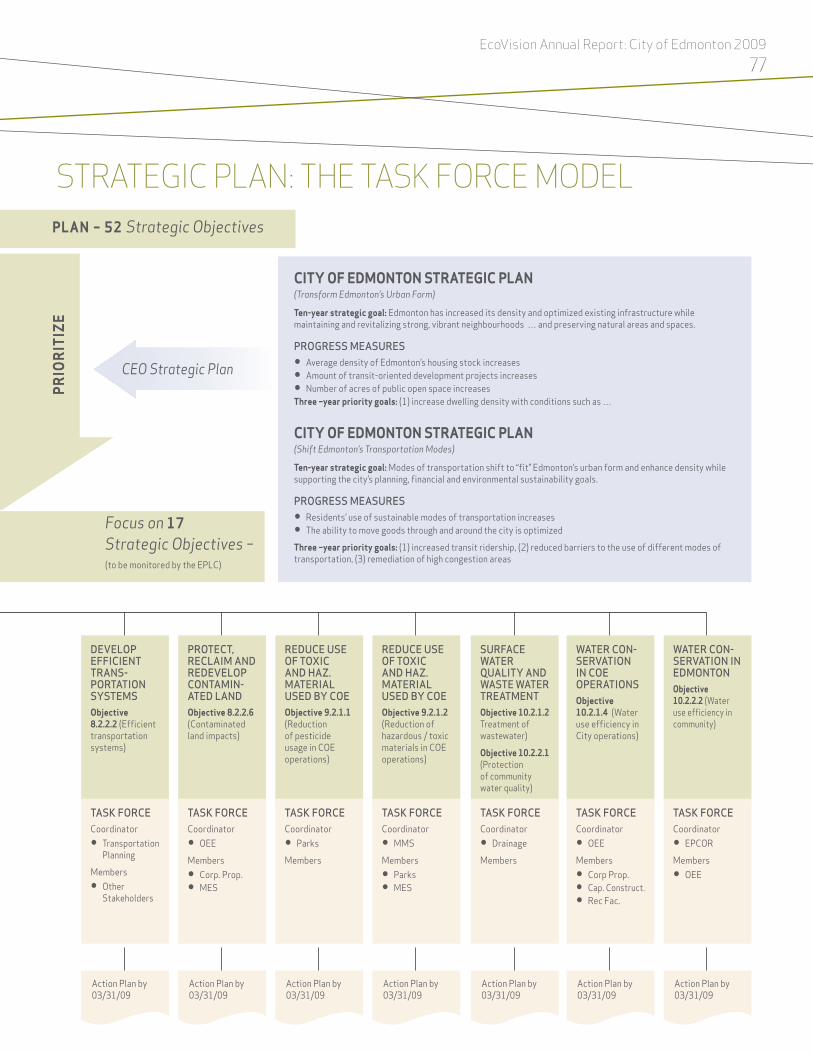
77Ecovision Annual Report: city of Edmonton 2009
enVironMenTal STraTeGic Plan – 52 Strategic Objectives
develOp effiCient trans-pOrtatiOn systeMsobjective 8.2.2.2 (Efficient transportation systems)
prOteCt, reClaiM and redevelOp COntaMin-ated landobjective 8.2.2.6 (Contaminated land impacts)
reduCe use Of tOxiC and haz. Material used by COeobjective 9.2.1.1 (Reduction of pesticide usage in COE operations)
reduCe use Of tOxiC and haz. Material used by COeobjective 9.2.1.2 (Reduction of hazardous / toxic materials in COE operations)
surfaCe Water Quality and Waste Water treatMentobjective 10.2.1.2 Treatment of wastewater)
objective 10.2.2.1 (Protection of community water quality)
Water COn-servatiOn in COe OperatiOnsobjective 10.2.1.4 (Water use efficiency in City operations)
Water COn-servatiOn in edMOntOnobjective 10.2.2.2 (Water use efficiency in community)
task fOrCeCoordinator
• Transportation Planning
Members
• Other Stakeholders
Action Plan by 03/31/09
Action Plan by 03/31/09
Action Plan by 03/31/09
Action Plan by 03/31/09
Action Plan by 03/31/09
Action Plan by 03/31/09
Action Plan by 03/31/09
task fOrCeCoordinator
• OEE
Members
• Corp. Prop.• MES
task fOrCeCoordinator
• Parks
Members
task fOrCeCoordinator
• MMS
Members
• Parks• MES
task fOrCeCoordinator
• Drainage
Members
task fOrCeCoordinator
• OEE
Members
• Corp Prop.• Cap. Construct.• Rec Fac.
task fOrCeCoordinator
• EPCOR
Members
• OEE
ciTy oF eDMonTon STraTeGic Plan(Transform Edmonton’s Urban Form)
Ten-year strategic goal: Edmonton has increased its density and optimized existing infrastructure while maintaining and revitalizing strong, vibrant neighbourhoods … and preserving natural areas and spaces.
prOgress Measures• Average density of Edmonton’s housing stock increases• Amount of transit-oriented development projects increases• Number of acres of public open space increasesThree –year priority goals: (1) increase dwelling density with conditions such as …
ciTy oF eDMonTon STraTeGic Plan(Shift Edmonton’s Transportation Modes)
Ten-year strategic goal: Modes of transportation shift to “fit” Edmonton’s urban form and enhance density while supporting the city’s planning, financial and environmental sustainability goals.
prOgress Measures• Residents’ use of sustainable modes of transportation increases• The ability to move goods through and around the city is optimized
Three –year priority goals: (1) increased transit ridership, (2) reduced barriers to the use of different modes of transportation, (3) remediation of high congestion areas
Prio
riT
ize
CEO Strategic Plan
stRAtEGic plAn: thE tAsK foRcE ModEl
Focus on 17Strategic Objectives – (to be monitored by the EPLC)
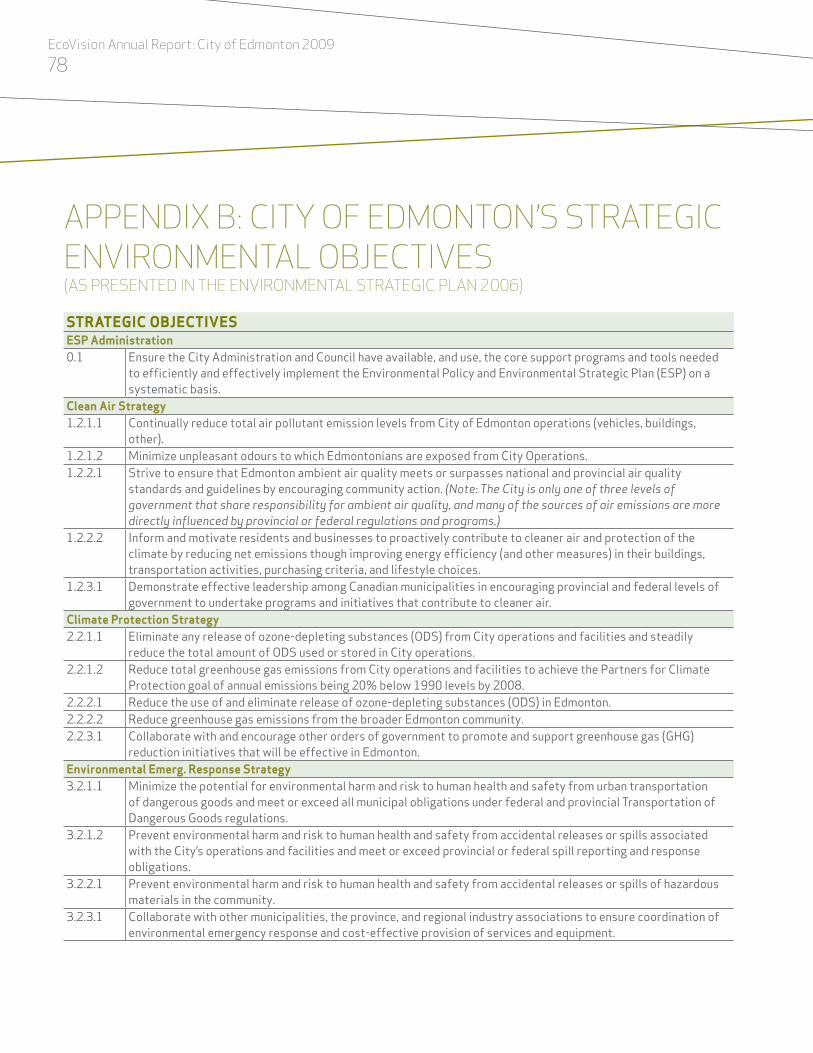
78Ecovision Annual Report: city of Edmonton 2009
AppEndix b: city of EdMonton’s stRAtEGic EnviRonMEntAl objEctivEs (As pREsEntEd in thE EnviRonMEntAl stRAtEGic plAn 2006)
STraTeGic objecTiVeSeSP administration0.1 Ensure the City Administration and Council have available, and use, the core support programs and tools needed
to efficiently and effectively implement the Environmental Policy and Environmental Strategic Plan (ESP) on a systematic basis.
clean air Strategy1.2.1.1 Continually reduce total air pollutant emission levels from City of Edmonton operations (vehicles, buildings,
other).1.2.1.2 Minimize unpleasant odours to which Edmontonians are exposed from City Operations.1.2.2.1 Strive to ensure that Edmonton ambient air quality meets or surpasses national and provincial air quality
standards and guidelines by encouraging community action. (Note: The City is only one of three levels of government that share responsibility for ambient air quality, and many of the sources of air emissions are more directly influenced by provincial or federal regulations and programs.)
1.2.2.2 Inform and motivate residents and businesses to proactively contribute to cleaner air and protection of the climate by reducing net emissions though improving energy efficiency (and other measures) in their buildings, transportation activities, purchasing criteria, and lifestyle choices.
1.2.3.1 Demonstrate effective leadership among Canadian municipalities in encouraging provincial and federal levels of government to undertake programs and initiatives that contribute to cleaner air.
climate Protection Strategy 2.2.1.1 Eliminate any release of ozone-depleting substances (ODS) from City operations and facilities and steadily
reduce the total amount of ODS used or stored in City operations.2.2.1.2 Reduce total greenhouse gas emissions from City operations and facilities to achieve the Partners for Climate
Protection goal of annual emissions being 20% below 1990 levels by 2008.2.2.2.1 Reduce the use of and eliminate release of ozone-depleting substances (ODS) in Edmonton.2.2.2.2 Reduce greenhouse gas emissions from the broader Edmonton community.2.2.3.1 Collaborate with and encourage other orders of government to promote and support greenhouse gas (GHG)
reduction initiatives that will be effective in Edmonton.environmental emerg. response Strategy 3.2.1.1 Minimize the potential for environmental harm and risk to human health and safety from urban transportation
of dangerous goods and meet or exceed all municipal obligations under federal and provincial Transportation of Dangerous Goods regulations.
3.2.1.2 Prevent environmental harm and risk to human health and safety from accidental releases or spills associated with the City’s operations and facilities and meet or exceed provincial or federal spill reporting and response obligations.
3.2.2.1 Prevent environmental harm and risk to human health and safety from accidental releases or spills of hazardous materials in the community.
3.2.3.1 Collaborate with other municipalities, the province, and regional industry associations to ensure coordination of environmental emergency response and cost-effective provision of services and equipment.

79Ecovision Annual Report: city of Edmonton 2009
STraTeGic objecTiVeSnatural area Systems Strategy 4.2.1.1 Natural Areas Planning: Plan, develop, and protect an ecologically functional natural system within the city.4.2.1.2 Protection of Existing Natural Areas and Biodiversity: Protect and conserve existing designated natural areas
within City boundaries, ensuring that these areas are managed to maintain their ecological integrity, protect and enhance regional biodiversity, and retain their natural character, while facilitating the possibility of minimum disturbance, low-impact outdoor recreation and nature appreciation in selected areas.
4.2.1.3 Acquisition of New Natural Areas: Acquire additional Environmentally Sensitive Areas and Significant Natural Areas and associated linkages for protection of natural areas in Edmonton at sufficient number and rate to prevent the loss of ecologically unique and sensitive land areas, and to expand the base of protected natural areas in step with, or in advance of, the overall growth of the City and the conversion rate to developed urban land.
4.2.2.1 Partnerships in Conservation – Initiate, develop and support partnerships with landowners of environmentally sensitive or ecologically valuable lands and with community groups to protect and manage those lands to maximize their ecological value and maintain biodiversity.
4.2.2.2 Community Outreach and Education: Motivate and inspire Edmontonians to support the conservation of the City’s biodiversity and natural areas, appreciate nature within the City’s boundaries, and undertake corporate and residential initiatives to protect habitat or enhance biodiversity.
4.2.3.1 Regional Conservation Partnerships – Establish an effective network of linkages and protected areas that links natural areas in the greater Edmonton region and protects biodiversity.
Solid waste Management Strategy 6.2.1.1 Minimizing Waste from City Operations – Minimize waste produced from City offices and operations.6.2.2.1 Minimizing Landfilling of Waste – Minimize the landfilling of municipal solid waste through reduction, reuse,
recycling and composting.6.2.2.2 Minimizing Impacts of Landfilling: Meet or exceed all environmental regulations and minimize the environmental
impacts of landfill operations for the residual elements of the waste stream that must be landfilled.6.2.2.3 Maintain Leadership Status: Maintain Edmonton’s position as a municipal leader in North America for sustainable
and innovative waste management and continuously improve both the environmental performance and the economic contribution of the City’s waste management system.
6.2.2.4 Community Outreach and Education: Inform and motivate residents to support Edmonton’s waste management system by reducing, reusing, recycling and composting.
6.2.3.1 Waste Management Collaboration with Municipalities and Other Organizations:Collaborate with other municipalities and other organizations and agencies as necessary to effectively and efficiently manage solid waste in the Alberta Capital Region.
Sustainable Planning and Development Strategy 8.2.1.1 Sustainable Urban Development of City Facilities:
Plan, locate, and develop municipal facilities to contribute directly to compact urban form, to enhance green space, and to facilitate reduced reliance on vehicle transportation, thereby demonstrating leadership in economically and environmentally sustainable urban planning and design through the City’s own facilities.

80Ecovision Annual Report: city of Edmonton 2009
STraTeGic objecTiVeS8.2.2.1 Sustainable Urban Development in the Community:
Steer urban development in a more environmentally, socially and financially sustainable direction by guiding the type and form of Edmonton’s development to reduce outward urban growth, increase density, and facilitate greater use of public transit, cycling, and walking.
8.2.2.2 Efficient Transportation Systems:Continuously improve the environmental and economic efficiency of Edmonton’s transportation systems by expanding and upgrading public transit, facilitating safe and convenient pedestrian and bicycle transportation, and proactively managing demand for private vehicle transportation.
8.2.2.3 Eco-efficient Building and Development:Continuously reduce the environmental impacts and financial operating costs of Edmonton’s building stock and specific development projects over their full life cycle through more ecologically sound and efficient design, and increased use of environmentally-friendly building materials and construction practices.
8.2.2.4 Maintenance and Enhancement of Green Space:Ensure that green space remains a dominant and internationally notable characteristic of Edmonton’s landscape by maintaining an extensive connected system of parks, forested natural areas, well treed streets and transportation corridors, naturalized public areas, and a significant level of vegetation cover on private land.
8.2.2.5 Adaptation to Climate Change:Ensure that the City’s development and maintenance of parks and green space, transportation corridors, surface water run-off management and other potentially affected regimes anticipates and is responsive to the predicted impacts of climate change – including more severe storm events and more frequent drought conditions.
8.2.2.6 Contaminated Land Impacts:Protect public health, the environment and community quality of life from negative impacts related to contaminated land, and maximize opportunities to reclaim and subsequently redevelop currently contaminated land.
8.2.2.7 Separating Industrial Development from Other Land Uses:Concentrate industrial land use development in appropriately designated areas, and maintain sufficient separation and buffers between industry and other land uses to minimize potential impacts on residential areas as well as natural areas and parks.
8.2.2.8 Loss of Agricultural Lands: Avoid premature loss of agricultural lands in the City of Edmonton.8.2.2.9 Noise Reduction:
Reduce the negative impacts of noise on the community.8.2.3.1 Engaging Other Governments in Sustainability Design:
Actively engage the provincial and federal governments and other municipal organizations in advocating for legislative reforms and new programs that will strengthen Edmonton’s capacity to encourage urban development that is more environmentally, socially and financially sustainable.
Toxics reduction Strategy9.2.1.1 Reduction of Pesticide Usage in City Operations:
Continuously reduce the amounts of pesticides used by the City of Edmonton and minimize the potential for chemical pesticides to be dispersed into the environment.
9.2.1.2 Reduction of Hazardous or Toxic Material Usage in City Operations:Reduce City use of household, commercial and industrial hazardous or toxic materials from all aspects of office, recreational facility, transit and public works, and minimize dispersion of these substances into the environment.

Ecovision Annual Report: city of Edmonton 2009
81
STraTeGic objecTiVeS9.2.2.1 Reduction of Residential Insecticide/Herbicide Usage:
Reduce the lawn and garden use of herbicides and insecticides by Edmonton residents.9.2.2.2 Managing Household Hazardous Waste:
Minimize contamination of the general waste stream by household hazardous wastes (HHW) and ensure the proper disposal of HHW generated by Edmontonians.
9.2.2.3 Community Outreach and Education:Inform and motivate Edmonton residents to reduce their use of hazardous materials and to properly dispose of household hazardous waste.
9.2.3.1 Engaging Other Governments:Collaborate with other municipalities and provincial authorities to reduce the use of herbicides and pesticides in the Capital Region.
9.2.3.2 Collaboration to Manage Hazardous Materials:Support existing and emerging provincial programs to reduce toxics contamination by providing information and raising awareness of residents and businesses in Edmonton regarding management and disposal options for hazardous materials.
water Strategy10.2.1.1 Provision of High Quality Water: Provide an adequate supply of high quality potable water and ensure that
Edmonton’s potable water quality exceeds Canadian Drinking Water Guidelines and Alberta Environment Standards.
10.2.1.2 Treatment of Wastewater:Ensure that wastewater from Edmonton’s sanitary and combined sewer systems is treated in accordance with best practical technology and is returned to the North Saskatchewan River System so as to minimize negative impacts on downstream water quality.
10.2.1.3 Protection of Surface Runoff Water Quality:Protect the quality of surface runoff waters entering the North Saskatchewan River through the City’s sewer system to support a diversity of compatible uses including local and downstream recreation, and maintain the ecological integrity of the North Saskatchewan River.
10.2.1.4 Water Use Efficiency In City Operations: Conserve water and improve water use efficiency in City operations.10.2.2.1 Protection of Community Water Quality: Protect the quality of surface runoff waters entering the North
Saskatchewan River to support a diversity of uses (including local and downstream recreation); maintain the ecological integrity of the North Saskatchewan River; and protect groundwater for local and regional users.
10.2.2.2 Water Use Efficiency in the Community: Conserve water and improve residential and commercial water use efficiency in Edmonton.
10.2.3.1 Engaging Other Governments: Collaborate with adjoining municipalities and with the Province to protect upstream and downstream surface water quality and to conserve water.
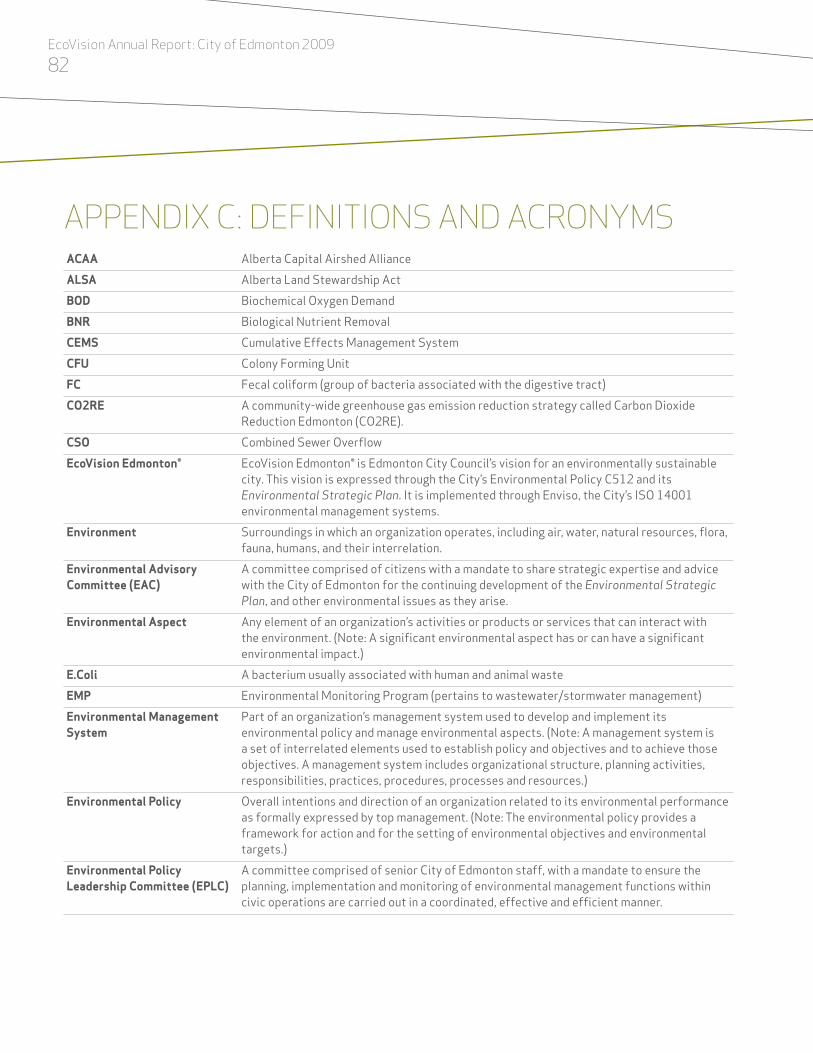
Ecovision Annual Report: city of Edmonton 2009
82
AppEndix c: dEfinitions And AcRonyMsacaa Alberta Capital Airshed AlliancealSa Alberta Land Stewardship ActboD Biochemical Oxygen Demandbnr Biological Nutrient RemovalceMS Cumulative Effects Management SystemcFu Colony Forming UnitFc Fecal coliform (group of bacteria associated with the digestive tract)co2re A community-wide greenhouse gas emission reduction strategy called Carbon Dioxide
Reduction Edmonton (CO2RE).cSo Combined Sewer OverflowecoVision edmonton® EcoVision Edmonton® is Edmonton City Council’s vision for an environmentally sustainable
city. This vision is expressed through the City’s Environmental Policy C512 and its Environmental Strategic Plan. It is implemented through Enviso, the City’s ISO 14001 environmental management systems.
environment Surroundings in which an organization operates, including air, water, natural resources, flora, fauna, humans, and their interrelation.
environmental advisory committee (eac)
A committee comprised of citizens with a mandate to share strategic expertise and advice with the City of Edmonton for the continuing development of the Environmental Strategic Plan, and other environmental issues as they arise.
environmental aspect Any element of an organization’s activities or products or services that can interact with the environment. (Note: A significant environmental aspect has or can have a significant environmental impact.)
e.coli A bacterium usually associated with human and animal wasteeMP Environmental Monitoring Program (pertains to wastewater/stormwater management)environmental Management System
Part of an organization’s management system used to develop and implement its environmental policy and manage environmental aspects. (Note: A management system is a set of interrelated elements used to establish policy and objectives and to achieve those objectives. A management system includes organizational structure, planning activities, responsibilities, practices, procedures, processes and resources.)
environmental Policy Overall intentions and direction of an organization related to its environmental performance as formally expressed by top management. (Note: The environmental policy provides a framework for action and for the setting of environmental objectives and environmental targets.)
environmental Policy leadership committee (ePlc)
A committee comprised of senior City of Edmonton staff, with a mandate to ensure the planning, implementation and monitoring of environmental management functions within civic operations are carried out in a coordinated, effective and efficient manner.

Ecovision Annual Report: city of Edmonton 2009
83
environmental Strategic Plan (eSP)
A plan, approved by the Senior Management Team, that addresses the environmental threats and opportunities facing Edmonton. It details strategic objectives, actions, targets and performance measures – aimed at making Edmonton a more sustainable city.
enviso The name given to environmental management systems in the City of Edmonton.ewcri Edmonton Watershed Contaminant Reduction IndexewMce Edmonton Waste Management Centre of ExcellenceGbwwTP Gold Bar Wastewater Treatment PlantGbwwTP/cb Gold Bar Wastewater Treatment Plant – CB stands for combined bypass and these loads
represent situations where flows to the GBWWTP exceed its capacity and it is necessary to bypass the secondary processes
GbwwTP/Fe Gold Bar Wastewater Treatment Plant – FE stands for final effluent and represents the flow that has received the full treatment process at the GBWWTP.
Key Sustainability Factors Environmental components underlying a society that are mandatory for it to be sustained into the future.
liD Low impact development which is a stormwater management and land development strategy that emphasizes conservation and use of natural features, integrated with engineered controls to more closely mimic pre-development hydrology.
nh3 AmmonianSr North Saskatchewan RiverrwQi Alberta River Water Quality IndexTP Total Phosphorus (a nutrient)TSS Total Suspended SolidsSenior Management Team (SMT)
The highest level administrative committee in the City of Edmonton, comprising the City Manager and General Managers from six City departments.
Supernatant The fluid above a sediment or precipitateuV Ultra violet lightThe way we Green The City of Edmonton’s Environmental Sustainability Plan which is being developed over
2010. The Way We Green also incorporates an update to the City of Edmonton’s 2006 Environmental Strategic Plan.

Ecovision Annual Report: city of Edmonton 2009
84
AppEndix d: AhEAd in 2010 (A suMMARy of pREliMinARy plAns foR 2010) Focus area 2010 Plan Descriptionair Air Quality – City Operations Develop an emissions model for criteria air contaminants for the Transit Fleet and
integrate this information into the emissions profile tracking.Evaluate small engine equipment and develop an estimated emissions profile.
Air Quality – Community With the ACAA, evaluate the adequacy of the current air quality monitoring network and make recommendations for improvements. Continue to implement the Ozone Management Plan, in conjunction with the ACAA and other partners.Continue with the Idle Free Education campaign. Be Idle Free: A Minute or Less is Best campaign was launched in November 2009. The campaign uses community partnerships and social media to spread the message about the hazards of idling more than one minute. Return to City Council with an Idle Fee By-law.
cliMaTeClimate – City Operations In 2010 the GHG Management committee will present its new strategy along with
accompanying target for GHG emissions management in City operations. A model will be developed to evaluate GHG mitigation options for overall effectiveness.
Climate – Community CO2RE will work with river valley programs in community services to expand the Youth Zerofootprint Calculator program. The new Energy Detective program will be piloted by Evergreen Sports Programming, the City of Edmonton, and the City of Calgary.A high efficiency spray valve retrofit site test was successfully completed at the Shaw Conference Center in January of 2010. A larger pilot program is planned for mid-2010. Old model spray valves used to pre-rinse dishes in restaurants waste a great deal of hot water. Replacing these valves not only saves water but, reduces CO2 generated from heating water used in commercial kitchens.High efficiency gas furnace rebates ($2,000 each) will continue for low income households qualifying through RRAP.An increased number of customized commercial workshops and presentations will be delivered.The City of Edmonton will increase its commitment and participation in Earth Hour 2010. Success will be measured in three ways: darkening of the downtown core, reduced power consumption for the entire City, and increased registration on the EarthHourCanada.org website. The goal is to outperform Edmonton’s 2009 resultsMore information is made available at www.edmonton.ca/BeIdleFree.
The LocalMotion project will continue into the second year, wrapping up the Parkallen community project and introducing the program to new communities in the fall.

Ecovision Annual Report: city of Edmonton 2009
85
lanDenvironmental releases – city operations
Fully implement the Intelex (an environmental management system software package) for spill reporting.
waste Management The Waste-to-Biofuels facility will be under construction in 2010. The Advanced Energy Research Facility will be operational by spring of 2010.
A recycling and refuse collection service will be rolled out for businesses in 2010.
urban Development Approval of the Municipal Development PlanIn 2009 City Council directed Planning and Development to prepare a City-Wide Food and Agricultural Strategy. This aligned with policy in the draft MDP to plan for a resilient food and agricultural system that contributes to the local economy and the overall cultural, financial, social and environmental sustainability of the CIty. In 2010 the strategy will be developed and a progress report will be made to Council in June.The Quarters – By mid 2010 the Community Revitalization Levy Plan and Bylaw will be presented to Council for their review and approval in anticipation of submitting that plan to the Province for final approval. Work will commence on the first Phase of infrastructure upon receipt of both approvals.
Transportation An Implementation Plan will be developed that will outline the specific actions, projects and plans to achieve the goals of The Way We Move. To monitor the progress toward these goals a comprehensive monitoring and reporting program will be developed and reported in a Progress Measures document. The 7.8 km South LRT extension from Heath Sciences to Century Park will make public transit more accessible and serve the communities of the southwest Edmonton. The extension and a temporary new Park and Ride facility will open in April 2010. The Integrated Transit and Land Use Framework is a set of regulatory and advisory tools for successfully integrating transit and land use near transit facilities, with a focus on LRT stations. The framework is being developed jointly with the Planning and Development Department and over the next two years we will be working with stakeholders to finalize the details. LRT planning will continue to support the LRT Network Plan and the strategic goals to encourage compact urban growth, transit ridership, social and environmental sustainability, and economic vitality. Some of these plans include: West and Southeast LRT Plans, Northwest LRT Plan, Downtown LRT Plans, and South LRT Plan.
natural areas Local Action for Biodiversity – Phase II (Communication, Education and Public Awareness). Edmonton has committed to the second phase of the Local Action for Biodiversity project, which has a theme of “Communication, Education and Public Awareness” as it relates to biodiversity protection. This project will help the City to share its successes in this effort, and to identify areas for improvement.City-Wide Natural Area Management Plan. A draft city-wide Natural Area Management Plan will be completed, articulating direction for the management of wetlands, tree stands and riparian areas throughout the River Valley and tablelands.

Ecovision Annual Report: city of Edmonton 2009
86
Natural Areas Conservation Atlas. An updated Conservation Atlas will be completed and shared through the City website. The Atlas will help to raise public awareness about local natural areas, how to access them, and the plants and wildlife that can be viewed at each area. Wildlife Passage Engineering Design Guidelines. A set of Wildlife Passage Engineering Design Guidelines will be completed. These guidelines will be applied where the transportation network intersects with the ecological network, which will help to maintain ecological connectivity even through developed areas. Singapore Cities Biodiversity Index Project. Edmonton became a key partner in this international effort to create an index which will allow local governments to measure and compare their progress towards protecting biodiversity. Edmonton is one of the cities that is testing the index and helping to refine the methodology.
contaminated lands A Contaminated Gas Station Task Force was formed by City Council in early 2010. The results of this task force are expected to be presented in mid to late 2010.
Toxic Substances The Sustainable Purchasing Policy implementation plan will be rolled out. Paints and cleaning products are two spend categories in 2010 that are applicable to toxics reduction. Integration of the toxics reduction initiative with the SPP roll-out will be explored.
Pesticides Establishment of plant-feeding insect biological controls for the wetland invasive plant, purple loosestrife, in Edmonton. Surveys for the detection and collection of the leaf beetle biocontrol agent Galerucella calmariensis at previous Alberta release sites, planned for 2010Reduce the use of conventional fungicides on City golf courses Diagnostic survey of turf pathogens on golf courses for investigation and development of improved biological control practicesProcedures, records and trend analysis for Biological Controls applications, for integrated pest management, have been implemented for 2010, at the Muttart Conservatory
waTerwater conservation city operations Assess feasibility of using Membrane-Treated effluent from the EPCOR Waste Water
Treatment Plant for parkland irrigation and lake filling in Rundle and Gold Bar parks.Roof Rainwater Harvesting at the Muttart Conservatory
Develop water use benchmarks to assess facility use efficiency improvements
Track water conservation retrofits for City buildings
Establish a protocol for irrigation water quality to assess various waste water re-use applications eg. waste water from spray decks, stormwater wet ponds and membrane-treated effluent from the Waste Water Treatment Plant. Diversion of spray deck waste water to supply subsurface irrigation systems at Callingwood and Castledowns parksAssess feasibility of using wetland-treated Groat trunk sewer water for irrigation of Victoria Park Golf course
water conservation – community Complete the 2010 – 2030 Edmonton’s Long Term Water Efficiency Planwater Quality Continued implementation of the City of Edmonton, Drainage Services Total Loading Plan
(TLP). The TLP establishes a framework for limiting annual loadings of total suspended solids (TSS) from municipal operations to the North Saskatchewan River (NSR). TLP implementation will include development of LID Design Standards, end-of-pipe constructed wetlands for stormwater quality improvements, and completion of major river crossing project to reduce number and volume of CSO discharges to the NSR.

ECOVISION ANNUAL REPORT 2009 CORRECTIONS Post issuance of the EcoVision Annual Report 2009 the following errors were identified: 1. On Page 35 under the program/initiative “Minimizing Waste from City Operations” It is mentioned that co‐mingle recycling has been implemented at 18 sites for Community Facility Services in 2009. There is an implication that other City facilities are not provided this service, which is not the case. The City’s Waste Branch provides co‐mingled recycling bins to 82 City facilities. 2. Figure 29 on Page 57 has the wrong colours assigned to the lines in the graph: Red should represent conventional and green should represent photosynthetic. The following graph reflects this correction and also presents 2009 numbers:
Figure 29: Algaecide Use Trends in StormwaterWet Ponds
0100200300400
2004 2005 2006 2007 2008 2009
kg A
I
Conventional Algaecide Photosynthetic Inhibitor Dye
3. Figure 41 on Page 73 has the wrong colours assigned in the legend. The following is incorrect: Dark green above (top of legend) should read GBWWTP and the lighter green should be assigned to Stormwater.

Ecovision Annual Report: city of Edmonton 2009
87

100% Postconsumer Content 100% Acid Free