ecreee training manual on energy policy and incentive schemes … · 2015-06-01 · training manual...
TRANSCRIPT

ECREEE Training Manual on Energy
Policy and Incentive Schemes
Schemes

Training manual for the Regional ECREEE Training Workshop on National Renewable Energy Policy and Incentive Schemes
1
Client ECREEE
Consultant IED Innovation Energie Développement 2 chemin de la Chauderaie 69340 Francheville, France Tel : +33 (0)4 72 59 13 20 Fax : +33 (0)4 72 59 13 39
Site web : www.ied-sa.fr
VERSION 1 VERSION 2 VERSION 3
Date 03/04/2012
Rédaction JPL / PA
Relecture
Validation

Training manual for the Regional ECREEE Training Workshop on National Renewable Energy Policy and Incentive Schemes
2
TABLE OF CONTENT
1 RE POLICY, PLANNING AND REGULATORY PRINCIPLES .................................................... 6
1.1 RE concerns and energy policies in the ECOWAS ............................................................. 6
1.2 RE and the Regional/national white Book....................................................................... 6
1.3 Targets for Renewable Energy penetration ..................................................................... 7
1.4 RE in the policy documents ............................................................................................ 8
1.5 Forces and peculiarities for RE ....................................................................................... 9
1.6 Technical options ......................................................................................................... 10
1.6.1 Grid connected options ....................................................................................................................... 10
1.6.2 Suitable RE technologies for mini-grid : .............................................................................................. 11
1.6.3 Stand-alone technologies: ................................................................................................................... 12
1.7 Assessed barriers for RE ............................................................................................... 12
2 RE POLICY/MASTER PLAN STRATEGY ........................................................................ 14
2.1 Policy – strategy .......................................................................................................... 14
2.1.1 Assess the national RE resources ........................................................................................................ 14
2.1.2 Assess feasible RE targets based on available RE resources. .............................................................. 18
2.1.3 Set Targets for RE penetration ............................................................................................................ 19
2.2 The key role of a strong RE sector support ............................................................. 20
2.3 A choice of instruments backed by a theoretical framework ................................ 21
2.4 Feed-in-Tariffs (FIT) ................................................................................................. 22
2.4.1 Definition of the theoretical approach ................................................................................................ 22
2.4.2 Examples of implementation .............................................................................................................. 23
2.4.3 SWOT Analysis ..................................................................................................................................... 25
2.5 Quota system with competitive bidding ................................................................. 26
2.5.1 Definition of the theoretical approach ................................................................................................ 26
2.5.2 Examples of implementation ............................................................................................................... 27
2.5.3 SWOT Analysis ..................................................................................................................................... 27
2.6 Decentralized quota system backed by a green certificate market ...................... 28
2.6.1 Definition of the theoretical approach ................................................................................................ 28
2.6.2 Examples of implementation ............................................................................................................... 29
2.6.3 SWOT Analyses .................................................................................................................................... 30
2.7 Worldwide review of the policy landscape ................................................................... 31
2.7.1 Summary of UE member states' progress ........................................................................................... 31
2.7.2 Summary of developing countries progress ........................................................................................ 33
2.7.3 Comparison of diverse incentives dedicated to the PV sector ............................................................ 34

Training manual for the Regional ECREEE Training Workshop on National Renewable Energy Policy and Incentive Schemes
3
2.8 Power Purchase Agreements (PPA) .............................................................................. 35
2.8.1 Definition of the theoretical approach ................................................................................................ 35
2.8.2 Examples of implementation .............................................................................................................. 35
2.8.3 SWOT Analysis ..................................................................................................................................... 38
2.9 Mini-grid concessions .............................................................................................. 38
2.9.1 Definition of the theoretical approach ................................................................................................ 38
2.9.2 Examples of implementation ............................................................................................................... 39
2.9.3 SWOT analysis ..................................................................................................................................... 42
2.10 Netmetering ................................................................................................................ 42
2.10.1 Definition of the theoretical approach ................................................................................................ 42
2.10.2 Examples of implementation ............................................................................................................... 42
BIBLIOGRAPHY .......................................................................................................... 43
LIST OF TABLES
List of Table
Table 1 : Renewable Energy position in the PRSP documents ................................................................ 6
Table 2 : Targets for Renewable Energy penetration .............................................................................. 7
Table 3 : Renewable Energy in policy documents ................................................................................... 8
Table 4 : Overview of re potentials in the Ecowas Countries ................................................................ 18
Table 5 : FEED in Tariff (FIT) for the UK and Scotland ........................................................................... 24
Table 6 : Strengths and Weaknesses of Feed-in-Tariffs ........................................................................ 25
Table 7 : Strengths and Weaknesses of the quota system with competitive bidding .......................... 27
Table 9 : Incentive Instruments used in EU member countries ........................................................... 32
Table 10 : Incentive Instruments used by developing countries .......................................................... 33
Table 11 : Performance criteria for PV incentives ................................................................................. 34
Table 12 : Examples of Small Power Purchase Agreements ................................................................. 37
Table 13 : Strengths and Weaknesses of PPA ....................................................................................... 38
Table 14 : Differences between concession and authorization ............................................................ 40
Table 15 : Strengths and Weaknesses of of mini-grid concession ........................................................ 42
LIST OF FIGURES
Figure 1: Cost comparison PV versus Diesel ............................................................................................ 9
Figure 2 : Wind study for West Africa ................................................................................................... 16
Figure 3 : Motivations Matrix of policy support for renewable energy ................................................ 20
Figure 4 : Feed-in-Tariff system ............................................................................................................. 22
Figure 5 : Guaranteed price and error of anticipation on the slope of the marginal cost .................... 25
Figure 6 : Quota system with « paid as bid » auctions (Dutch auction) ................................................ 26
Figures 7 : Decentralized quota system backed by a green certificate market .................................... 28

Training manual for the Regional ECREEE Training Workshop on National Renewable Energy Policy and Incentive Schemes
4
LIST OF ABBREVIATIONS
AfDB African Development bank
AfD French Development Agency
BOT Build Operate Transfer
CDM Clean Development Mechanism
ECOWAS Economic Community of West African States
ECREEE Regional Centre for Renewable Energy and Energy Efficiency
EECS European Energy Certificate System
ERERA ECOWAS Regional Electricity Regulatory Authority
ESCO Energy Service Company
EU European Union
FIT Feed in Tariffs
IPP Indipendent Power Producers
MW Megawatt
MWh Megawatt-hour
MWp Megawatt peak
ODA Official Development Assistance
RE Renewable Energy
RET Renewable Energy Technologies
RES Renewable Energy Sources
PRSP Poverty Reduction Strategy Papers
PPA Power Purchase Agreements
REC renewable energy certificates
RESCO Rural Energy Services Company
SPP Small power producer
SWOT Strengths, Weaknesses, Opportunities, Threats
TWh Terawatt-hour

Training manual for the Regional ECREEE Training Workshop on National Renewable Energy Policy and Incentive Schemes
5
UNDP United Nations Development Programme
UNIDO United Nations Industrial Development Organization
WAEMU West African Economic and Monetary Union
WAPP West African Power Pool
WB World Bank
Training manual for the Regional ECREEE Training Workshop on National Renewable Energy Policy and Incentive Schemes
6
1 RE Policy, Planning and Regulatory Principles
1.1 RE concerns and energy policies in the ECOWAS
One of the main conclusions of the Earth Summit held in Johannesburg in 2003 was that energy was
the forgotten MDGs. Many initiatives have been launched in order to mainstream energy in the
national development agenda. At the same time, the different poverty reduction strategy documents
became a reference for the multi and in particular bilateral donors.
Therefore the ECOWAS energy directorate in close cooperation with the WAEMU’s has issued a
regional energy policy, called the Regional White Book, aiming at promoting modern energy access
to the rural poor with obligation for the members states to develop a national policy and to secure
that the objectives and targets of this new policy will be adopted by the national Poverty Reduction
Strategy Papers (PRSP) document in order to secure its financing.
Renewable energies are not directly included as a target for the White Book. But it is expected as
indicator 10 related to the achievement of the MDGs that : ‘At least 20% of new investments in
electricity generation will be driven by local and renewable resources, including hydro-electricity, in
order to achieve energy self-sufficiency, reduced vulnerability and sustainable environmental
development in keeping the regional plan’.
As the investment in RET are from twice to three time the investment in convention power supply,
this indicator should lead to a RE penetration ranging from 7 to 10 %.
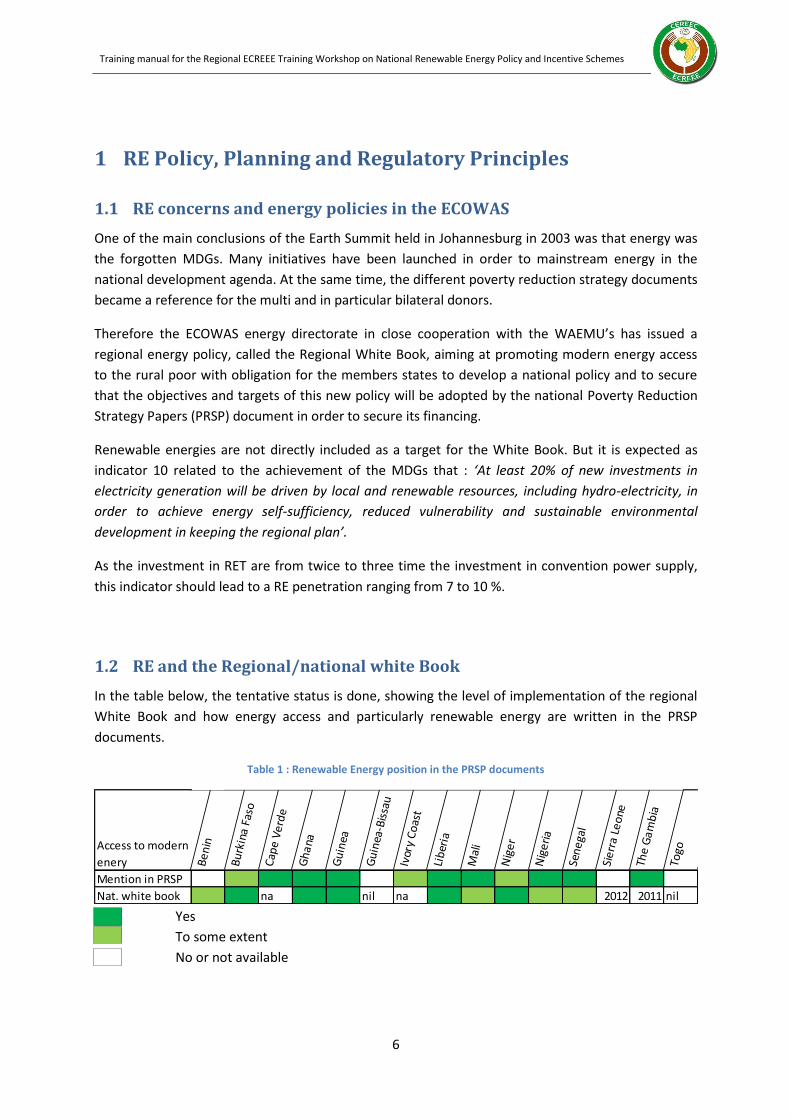
1.2 RE and the Regional/national white Book
In the table below, the tentative status is done, showing the level of implementation of the regional
White Book and how energy access and particularly renewable energy are written in the PRSP
documents.
Table 1 : Renewable Energy position in the PRSP documents
Access to modern
enery Be
nin
Bu
rkin
a F
aso
Cap
e V
erd
e
Gh
ana
Gu
inea
Gu
inea
-Bis
sau
Ivor
y C
oas
t
Lib
eria
Mal
i
Nig
er
Nig
eri
a
Sen
ega
l
Sie
rra
Leo
ne
The
Ga
mb
ia
Togo
Mention in PRSP
Nat. white book na nil na 2012 2011 nil Yes
To some extent
No or not available

Training manual for the Regional ECREEE Training Workshop on National Renewable Energy Policy and Incentive Schemes
7
Five countries have developed a strategic white paper for access to modern energy, following the
regional guide line (Burkina Faso, Ghana, Guinea, Liberia and Niger). This exercise can be deemed as
positive as many countries have been in position to interact positively with the national reference
policy (PRSP) to modify significantly their energy institutional and regulatory framework and to
mobilise financial means to implement their strategy.
Other country like Mali, Senegal have developed adequate tools and policies which have had similar
results, i.e. mainstreaming of energy access and uses of renewable energy into the main reference
policy documents, becoming part of the president programme (Senegal).
At that time Nigeria was developing its Renewable Energy Master Plan and creating an Agency for
rural electrification (2006). In Benin, a study on ‘Renewable Energy for Sustainable Development’ has
been elaborated in 2010 financed by the UNDP.
Few countries have not started or will start this policy exercise. It is the case of Guinea-Bissau and
Togo which have not started and Sierra Leone and The Gambia which are now in the elaboration
process.
1.3 Targets for Renewable Energy penetration
A summary of the targets to be reached in terms of RE penetration is given in the table below:
Table 2 : Targets for Renewable Energy penetration
Targets for
RE penetration Be
nin
Bu
rkin
a F
aso
Cap
e V
erd
e
Gh
ana
Gu
inea
Gu
inea
-Bis
sau
Ivor
y C
oas
t
Lib
eria
Mal
i
Nig
er
Nig
eri
a
Sen
ega
l
Sie
rra
Leo
ne
The
Ga
mb
ia
Togo
Medium term 2015 2010 2013 2015 2015 2010 2010 2020
Targets 13.5% nil 27% 2->6% nil 5% 10% 6% 10% 15% nil nil nil
Long term 2025 2030 2020 2019 2015 2030 2020
Targets 14.4% nil 50% 10% 8-25% nil 25% 23-36% 15% nil nil nil
There are five countries that have not yet defined clear targets for the RE: Burkina Faso, Sierra Leone,
Togo and The Gambia, although they are actively developing RE projects, like Burkina Faso (PV and
biofuels), Togo (wind) and Sierra Leone (mini hydro) and the Gambia (wind and biofuels).
The RE champion is obviously Cape Verde seeking a penetration of 50% of RE in its power
production, developing presently off-shore wind farms to reach its objectives. The target of 25%
wind power and 2% solar electricity in 2011 was close to being fulfilled.
Nigeria is the next country having high targets for RE, followed by Mali, Guinea, Senegal and Ghana.
In average, the national targets lead to 14% penetration rate of 14% in 2020 and 20% in 2030. But
the rate reflects in large extend this of Nigeria (15/25%). Without Nigeria the RE penetration rate
remains at 11% level.

Training manual for the Regional ECREEE Training Workshop on National Renewable Energy Policy and Incentive Schemes
8
1.4 RE in the policy documents
Table 3 : Renewable Energy in policy documents
RE and Policy
Documents Be
nin
Bu
rkin
a F
aso
Cap
e V
erd
e
Gh
ana
Gu
inea
Gu
inea
-Bis
sau
Ivor
y C
oas
t
Lib
eria
Mal
i
Nig
er
Nig
eri
a
Sen
ega
l
Sie
rra
Leo
ne
The
Ga
mb
ia
Togo
RE /Energy Policy na
RE / Electricity bill na
Specific RE Policy
Specific RE law Yes
To some extent
No or not available
In general, the focus of national policies of ECOWAS countries remains on conventional sources of
electric power in a context of latent energy crisis due to the lack of capacity investments in a context
of sector reform and increasing oil prices. However, the framework varies among the countries and
becomes more differentiated in favour to RE during the period 2006-2011:
There is one country that has CV has made of RE a priority for the development of the
country. A strategy and action plan is approved with target for RE: “Cabo Verde 50%
Renovavel em 2020”: the objective is to attend 50% of RE penetration rate of the electricity
production by 2020. The new approved legislative Decree No. 1/2011, establishes provisions
for the promotion, incentives and access, licensing and exploration on the exercise of
independent production activities and self-generation of electricity from renewable energy
sources. It has to be noted that Cape Verde develop an operational approach with quite
operational tool (DECRETO-LEI – PROMOÇÃO E INCENTIVO À PRODUÇÃO E USO DAS
ENERGIAS RENOVÁVEIS 2010)The differences in the geographical and economical context
make of Cap Verde an exception.
A second group is composed by the countries that are currently making an effort to put RE
high on the agenda: Senegal, Ghana, Mali, Liberia, Guinea, and Nigeria have a detailed RE
policy at national/ Presidential level. However, only Ghana the Renewable Energy Bill is
before Parliament and Senegal who has already adopted a law on RE seems to have a mature
regulatory framework for RE development. Nigeria’s regulator (NERC) is developing a
regulatory framework for promoting renewable energy based power in Nigeria too.
A third group is composed by countries where RE is not the focus, but is just mentioned as
diversification of energy mix in order to reduce fuel dependence or increase access to
modern energy services in rural areas. These countries are generally struggling with a
recurrent lack of power capacity and are unfortunately quite focussed on the development
of their conventional power system.

Training manual for the Regional ECREEE Training Workshop on National Renewable Energy Policy and Incentive Schemes
9
We should add that also in the countries where a RE policy is adopted, the financial resources
often do not correspond to the ambitious target set. As for example countries with high
potential on hydro resources.
Also, in many of the countries development of RE is hindered by lack of global planning that
include them in a comprehensive strategy and allocation of financial means to implement it.
The proper technical capacity is often lacking for RETs. Rural electrification is too often
conceived as a natural grid based extension of the national electrification plan, giving little
room for least cost mini-grid and stand-alone solutions powered by RE.
Subsidies to conventional fuel hinder the development of RE, as constituting hidden costs
into the electricity tariffs structure. Currently countries as Ghana have cut subsidies.
1.5 Forces and peculiarities for RE
RE are often least cost solutions for rural areas, but in many case RE are in competition with
uneconomic grid-based electricity where the hidden over-costs are paid by all the consumers
as consequences of cross-subsidizing principles applied.
They are very close to least cost solutions for grid connected production when the base-line
is diesel power generation, particularly for biomass and hydro. For solar PV plants some
incentives are required.
0,00
0,05
0,10
0,15
0,20
0,25
10 MWPV plant
20% subsidies
10 MWPV plant
Commercial…
10 MW Dieselthermal plant
c€/kWh Prod. costs - PV solar plant/thermal power plant
Fuel
Dividend
Equity cost
Financial cost
O&M
Figure 1: Cost comparison PV versus Diesel
The figure simulates the resulting production costs for 10 MW PV plant compared to a 10 MW diesel
plant with to different financing engineering as shown in the table. Based on soft commercial
conditions (8% , 15 years repayment period), the private developed PV plant cannot compete with a
reference diesel plant (0,611 €/l of fueloil). With a 20% grant and softer financial conditions (ODA
conditions with longer repayment period) it is possible to lower the production to a level where it
becomes competitive with a subsidized diesel power generation.
Table 1: Financial assumptions
Investment:
30 millions
€
Equity Grant Interest
rate
loan
Equity
remune-
ration
Private
developer
35% 0% 8% 15%
Public plant 20% 20% 3,5% 2,5%

Training manual for the Regional ECREEE Training Workshop on National Renewable Energy Policy and Incentive Schemes
10
Intermittency for wind and solar energy is a reality as generally energy storage is expensive.
However the over-cost tied to stand-alone systems is estimated to 2-3 c€/kWh1
1.6 Technical options
Two large families:
grid connected options to generated power to the grid or mini grids and
the stand-alone applications that can produce either electricity or heat
1.6.1 Grid connected options
Large and medium sized hydro. The average investments costs for large hydro plants is about
1 million Euro per MW, with generally a quite low production marginal cost at 3-4 c€/kWh..
The demarcation between large and medium sized hydro potential is generally fixed at 10
MW. But within the ECOWAS system the limit is raised to 30 MW. Investment cost for
medium sized hydro is about 3,8 million € for all hydro plants analysed by the regional
programmes. In West Africa the average costs of the hydro plants larger than 30 MW are
estimated to 2,6 M€/MW. But all cases are specific depending on the inflow, the geography
and the type of the water head.
Wind farms. Wind energy is converted to power through wind turbines which unit capacity
can reach up to date 5 MW. For logistical and practical reasons, the largest turbines installed
in WA have a unit capacity of 850 kW. The overall cost inclusive erection and upstart is about
2,0 €/MW which is quite expensive compared with European or American benchmark of 1,1
to 1,3 M€/MW depending on the size of the machine (2 MW -1 MW)
Biomass plants. For solid biomass, the plant consists in a boiler producing steam at a certain
pressure (25-50 bars) and steam turbine for electricity production. The boiler can be built as
a grate furnace with stocker/burner for the smaller capacity plant (5-10 MWe) or as fluid bed
plant for larger capacity (50-100 MWe). The turbine can be of back pressure type to get the
maximum power production or with steam outlets enabling cogeneration and use of heat
water or law pressure steam to industrial processes. The investments costs of the
technology are about 2,5 M€/MW for capacity larger than 50 MWe and almost the double
for smaller capacity.
Large biogas plants for slurry, slam and wet biomass (dump, manure ect) are available. The
investment costs of anaerobic digestors with gas-engines for CHP are in the range of 3,000 to
5,000 €/kW.
Large solar farms connected to the grid. Depending on the size of the farm a 33 kV or often
en 90 kV line will be require to evacuate the power produced. The general benchmark for
this type of equipment is about 2,7 M€/MWp, but recent projects in Mali and Burkina Faso
show that the cost is closer to 3 M€/MWp, the connection cost to the grid are not included in
the price. It is expected a cost reduction in an order of magnitude of 50% up to 2020.
1 IED – Etude de cadrage du solaire photovoltaïque au Burkina Faso.

Training manual for the Regional ECREEE Training Workshop on National Renewable Energy Policy and Incentive Schemes
11
Concentrating Solar Plants are winning in as thermal technology to exploit solar resources to
power production. The first thermal solar plants had been built in the late seventies as an
answer to the first energy crisis. The new technology develop more efficient fluids to
transport the solar energy that is concentrated on a special coated glass pipe to an heat
storage end en heat exchanger that convert the high temperature heat to steam. The
remaining of the plant is a traditional steam turbine plants. Currently, all parabolic trough
plants (US terminology) are "hybrids," meaning they use fossil fuels to supplement the solar
output during periods of low solar radiation. Typically, a natural gas-fired heat or a gas steam
boiler/reheater is used. Troughs also can be integrated with existing coal-fired. CSP cost is
still high and needs financial incentives to face the market. The International Energy Agency
(IEA) estimates a current investment cost for Parabolic Trough plants between 3000€/kW
and 6300€/kW (depending on local conditions, solar irradiance and – not least – the maturity
of the project, i.e. pilot, demonstration, commercial) and projects cost decline by up to 50%
in 2020 due to a larger industrial production of CSP components. The Global CSP Outlook
(Estela-Greenpeace, 2009) envisages steady declining investment costs from a today’s level
of 3700€/kW (2010) to 2500€/kW by 2030 plants.
1.6.2 Suitable RE technologies for mini-grid :
Diesel generator sets with bi-carburation devices, enabling the use of vegetal oil as jatropha
raw filtered oil. In some case the piston can be modified to ensure en better combustion of
jatropha oil. The technology is the same than the diesel gensets. The extra costs are tied to
the fact than an additional oil tank is necessary for the jatropha oil as the motor has be
started and stopped on gasoil.
Solar PV plants with three phase inverters and a battery storage capacity for the night
consumption. The cost remains still high about 8 to10 € the Watt-peak installed. Hybrid
system can reduce the cost of investment as the combination of solar PV production and
diesel generation enables the down-sizing of the storage capacity. The cost for hybrid solar
system with storage is about 6-7 M€/MWp (Mali) for the solar plant. Hybrid systems without
storage are also experimented at a lower costs (4 M€/MWp) when the solar production is
designed to cut the diesel production when the system is full loaded. For full load to 60%
load the gasoil consumption is more or less proportional to the load, and the solar power
injection is totally turn into gasoil saving. At low load (< 30%) the diesel motor is inefficient
and has the same consumption independently of the load and the solar injection becomes
useless.
Shredded solid or loose biomass like shells and husks can be used in gasifiers to produce CO
gas to supply gas motors or dual fuel motors. The size of this technology ranges from scale
(30-200 kWe) well developed and used in the South-Eastern Asia and India where the
technology is fully developed. Larger application are in development with capacity up to 1 to
1,5 MW (South Africa). For smaller technologies the price for the system including gas
cleaning and motor ranges from 1,1 to 1,3 M€/MW and can produce at a price of 150/210
€/MWh.
Training manual for the Regional ECREEE Training Workshop on National Renewable Energy Policy and Incentive Schemes
12
1.6.3 Stand-alone technologies:
Small wind turbine for battery charging in a range of 10-20 W to few kW.
PV panels with battery and charge controller in a range of few W to charge solar lamps to
few kW for institutions. Generally in the range of 30 to 100 W for households application.
The present cost is about 6-8 €/Wc. Systems are becoming more cost effective due to the
uses of LED lamps reducing the size of the panel.
Solar water heaters producing hot domestic water are alternative to electrical water heater
(1 to 2 kW electrical thermal patrons). Generally the cost remains high in regards to the
electrical alternative (for 400 to 1000 € in regards to a 150-200 € for the electrical heater).
The savings can be in the range of 60 to 115 €/year depending on the size of the heater and
the level of tariff. The period of return is comprised between 7 to 10 years. Application for
preheating process water up to 60-70 oC can also be considered.
Solar dryers to be used in agro-processes (fruits, meat, steamed products) Extensive
researches have been carried out in many West-African research centres (Niger, Ghana,
Bamako) but generally the cost remains too high and drying processes are not always totally
controlled by the users (air flow, temperature and moisture).
Household biogas production for cooking and lighting and cooling energy. The digester is an
underground tank built with bricks that needs to be airtight as the methane production
occurs anaerobic. It has an inlet and outlet shaft for the fresh and the outgassed slurry. The
gas needs to be purified before uses. The cost of a household biogas digester is about 85
€/m3 of tank, and the general size is between 3 to 6 m3.
Solar cookers for households. There are two different types of solar cookers, the first one is a
solar oven (isolated plywood box covered with glass and with an adjustable mirror enabling
some additional indirect exposition). Its price is around 30-45 € depending on the size. Food
preparation can be started on traditional stoves. The second type is the parabolic
concentrating one where the solar irradiation is concentrated on the cooking pots placed in
the focal point. The price of this type of cookers is high about 110-135 €. Larger models can
be developed for community kitchens (schools, barracks and hospitals) as combined wood
and solar stoves.
1.7 Assessed barriers for RE
Policy and regulatory barriers
The focus of national policy has until recently been on centralized conventional sources for electrical power. Incentives were established to promote investments in conventional power generation and subsidies in the conventional sector have been detrimental to promote RE power generation. The monopoly position of national utilities has not been in favour for RE and decentralised solutions, as non-discriminatory open access to the national electricity grid for renewable energy is not assured
There is generally little attention to RE in the national energy policy and a weak or no integration of RE in energy planning and in local development policies.

Training manual for the Regional ECREEE Training Workshop on National Renewable Energy Policy and Incentive Schemes
13
The absence of a full-fledged rural electrification strategy with a clear demarcation between grid and off-grid electrification leads to undefined or unquoted RE options for the off-grid electrification. Grid extension is done without much economic justification as it is considered as a structuring element of the local development. To a certain extend is true. But beyond a certain limit that is almost never assessed the cost of grid extension is often uneconomic at least for a certain period of time during which the served load is too weak to justify the investment. But generally the grid extension is realised for political reasons (social equity, administrative centres shall be supply by the grid, local influent people, etc). In that case RE solutions can never appear as least coast when the over-cost for a political decision becomes a hidden cost paid by all the consumers. Again, it is important to stress that grid-based supply will be over time the solution, but untimely and anticipated investment in grid extension freezes large amount of means that could be used for more productive and development-minded investment.
Financing and investment barriers
The high upfront cost and the fact that RE are practically new technologies in WA increase the financial risk perception for the banking system and the investors. As long as there is a lack of regulation for RE applications this perception will last.
Technological barriers and weakness of the present RE market in WA lead to over-cost for acquisition of equipment / spare part supply / maintenance / services.
Lack of conceptual capacity
There are few or none competent designers and operators of RE applications, leading to poor result and failure.
Poor public awareness
Poor or absence standards and quality control
Inadequate resource assessment (Hydro – wind - biomass)
Intermittency of resource availability
As long as national and regional networks are not well functioning and reliable, the penetration rate for intermittent RE sources will meet some technical barriers.

Training manual for the Regional ECREEE Training Workshop on National Renewable Energy Policy and Incentive Schemes
14
2 RE policy/master plan strategy
2.1 Policy – strategy
2.1.1 Assess the national RE resources
Solar. Assessment of solar resources is generally not a problem, at least to get an order of
magnitude of the resources. The online calculator ‘PVGIS estimates of solar electricity
generation’ developed by the Joined Research Centre of the European Commission.
(http://re.jrc.ec.europa.eu/pvgis/imaps/index.htm). The calculator gives you following
information:
Average daily electricity production from the given system (kWh) Average monthly electricity production from the given system (kWh) Average daily sum of global irradiation per square meter received by the modules of the
given system (kWh/m2) Average sum of global irradiation per square meter received by the modules of the given
system (kWh/m2)
The database used for the calculation is the PVGISHelioClim, giving more conservative values.
For CSP technologies, the normal direct irradiation (DNI in kWh / m ²/y) is an essential criterion to
define the potential of sites. Consequently, in the region of interest, 4 ranges of DNI were defined:
not suitable < 2.000 kWh / m2 Acceptable 2.001 - 2.200 kWh / m2 Well 2.201 - 2.600 kWh / m2 Excellent>2.600kWh/m2
This range is specific to the region and is defined on the basis of the available DNI data for the region.
Another key parameter is the latitude which influences the losses of unit. The considered latitudes
are 15 °, 20 ° and 25 °. The latitudes less than 10 ° are not considered because they are classified as
"not suitable" in the range of DNI.
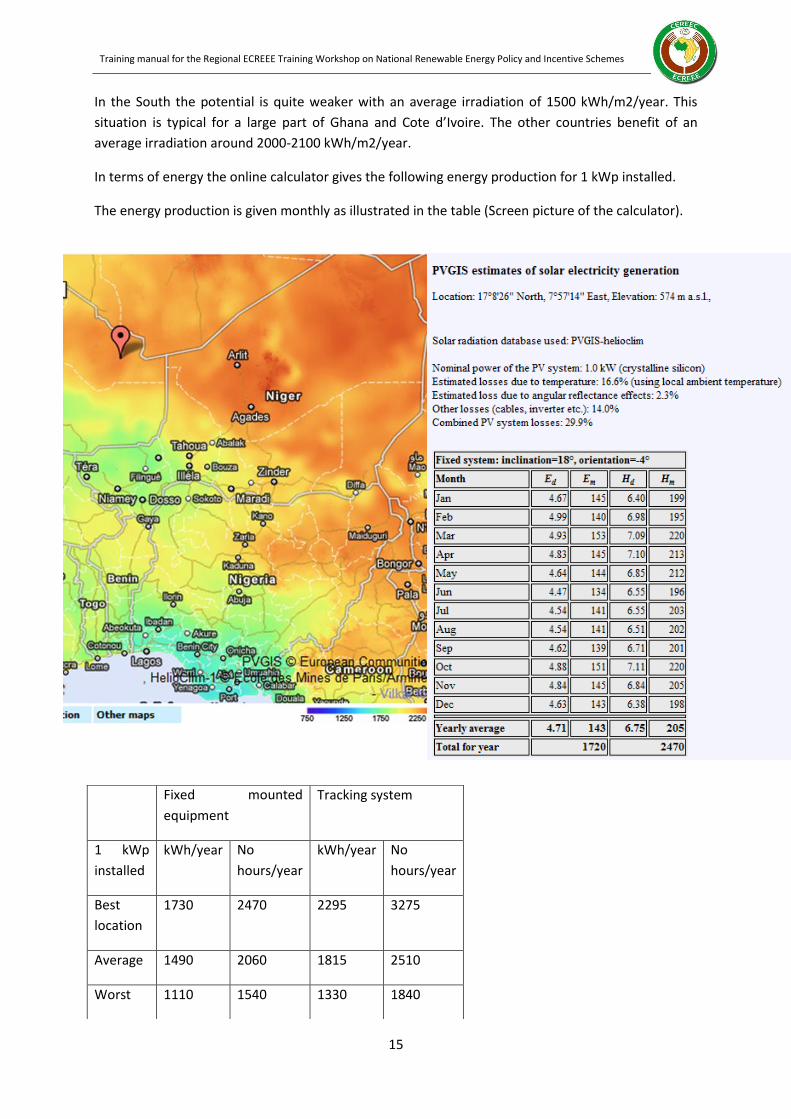
As an illustration, the map of Niger and Nigeria gives a good picture of the solar potentials. The
highest irradiation is in the North (Niger and Mali) and in the Western part of Nigeria with an
irradiation than is greater than 2300 kWh/m2/year.
Training manual for the Regional ECREEE Training Workshop on National Renewable Energy Policy and Incentive Schemes
15
In the South the potential is quite weaker with an average irradiation of 1500 kWh/m2/year. This
situation is typical for a large part of Ghana and Cote d’Ivoire. The other countries benefit of an
average irradiation around 2000-2100 kWh/m2/year.
In terms of energy the online calculator gives the following energy production for 1 kWp installed.
The energy production is given monthly as illustrated in the table (Screen picture of the calculator).
Fixed mounted
equipment
Tracking system
1 kWp
installed
kWh/year No
hours/year
kWh/year No
hours/year
Best
location
1730 2470 2295 3275
Average 1490 2060 1815 2510
Worst 1110 1540 1330 1840
Training manual for the Regional ECREEE Training Workshop on National Renewable Energy Policy and Incentive Schemes
16
For the best location an average production of 1750 kWh/year per kWh installed can be expected on
fixed mounted equipment. Tracking system enabling the PV panel to follow the sun path gives a
better use of the resources but are not recommended as vulnerable in a Sahelian environment.
The propitious potentials are valid for the northern parts of Mali, the most of Niger except the
western part and the north-eastern part of Nigeria.
The lowest potentials are located alongside the coasts from Nigeria to Liberia and on each side of the
border between Ghana and Cote d’Ivoire. It is comprised between 1100 to 1200 kWh/kWp installed.
For the remaining areas and countries the potential is around 1450 kWh/kWp installed.
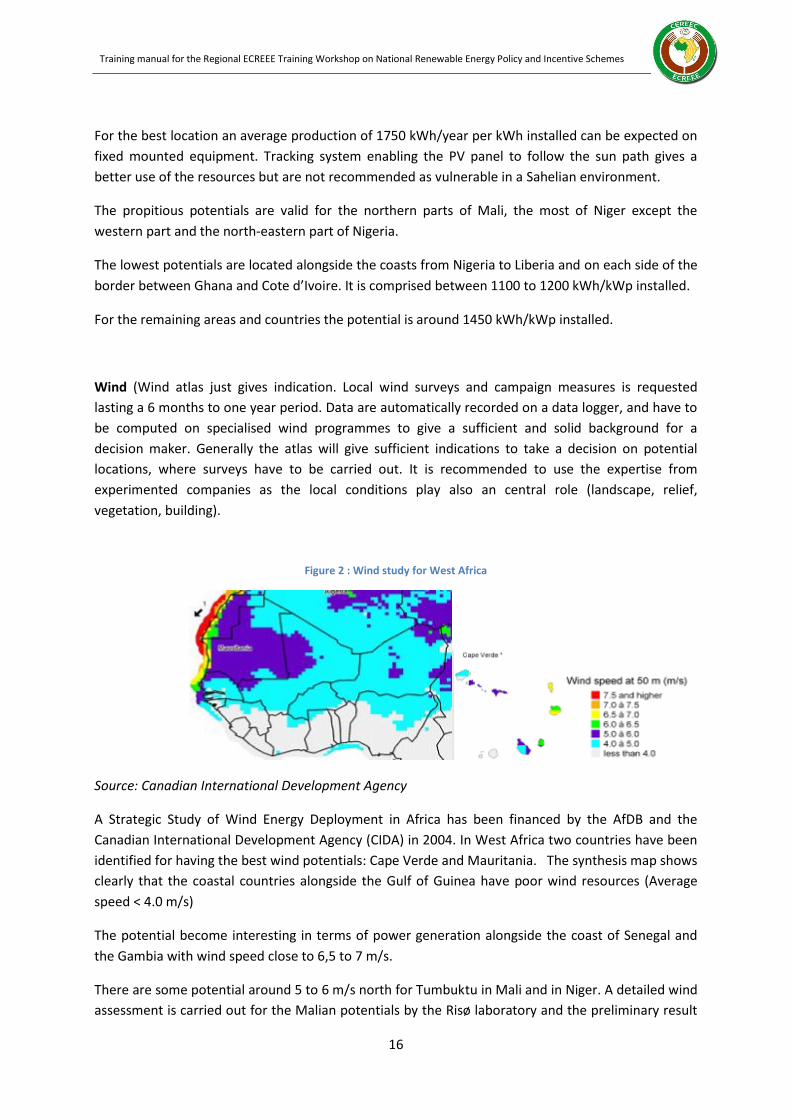
Wind (Wind atlas just gives indication. Local wind surveys and campaign measures is requested
lasting a 6 months to one year period. Data are automatically recorded on a data logger, and have to
be computed on specialised wind programmes to give a sufficient and solid background for a
decision maker. Generally the atlas will give sufficient indications to take a decision on potential
locations, where surveys have to be carried out. It is recommended to use the expertise from
experimented companies as the local conditions play also an central role (landscape, relief,
vegetation, building).
Figure 2 : Wind study for West Africa
Source: Canadian International Development Agency
A Strategic Study of Wind Energy Deployment in Africa has been financed by the AfDB and the
Canadian International Development Agency (CIDA) in 2004. In West Africa two countries have been
identified for having the best wind potentials: Cape Verde and Mauritania. The synthesis map shows
clearly that the coastal countries alongside the Gulf of Guinea have poor wind resources (Average
speed < 4.0 m/s)
The potential become interesting in terms of power generation alongside the coast of Senegal and
the Gambia with wind speed close to 6,5 to 7 m/s.
There are some potential around 5 to 6 m/s north for Tumbuktu in Mali and in Niger. A detailed wind
assessment is carried out for the Malian potentials by the Risø laboratory and the preliminary result

Training manual for the Regional ECREEE Training Workshop on National Renewable Energy Policy and Incentive Schemes
17
seem to confirm that the potential is at the margin of what will be require for developing a fully
commercial use of wind energy on large wind turbines. For commercial application of large wind
turbines, the required average wind speed has to be higher than 6 m/s. And the production will
depend also on the regularity of the wind. Generally off-shore wind turbine can produce about 50%
to 70% more energy and a land-based turbine. Experience from Denmark shows that for a
favourable location a wind turbine can produce up what correspond to 1700-2000 hours operation at
its nominal effect. For offshore wind farm the production is about 2800 to 3500 hours of the installed
capacity. In Cape Verde the wind regime is particularly favourable with an average yearly production
corresponding to 4.000 hours operation at installed effect.
Biomass. Planning with biomass resources required detailed investigations as investments in biomass
RET are high, especially if a cogeneration technology is sought for both power and process heat/low
pressure steam. (questionnaire addressed to agro-industries producing agricultural wastes – oil mills
– coffee plantations – rice production and so on)
General assessments of agricultural biomass residues or by-products based on a statical treatment of
crop or animal productions give just a general indication of the potential but cannot be used for
planning purposes. A lot of this potential is already used for different purposes like construction
materials, feeding stuff for cattle and fish pounds (rice husks in Niger) and cooking fuel. Generally the
logistic and transport cost are a huge barrier to the utilization of this type of biomass. For
decentralised uses as for instance power local production, a specific detailed assessment is
recommended with a special focus on the increasing unpredictability of the seasons especially for the
Sahelian countries.
Generally the assessments and surveys have to target specific areas with concentrated crops
production like rice (Office du Niger au Mali) or cotton areas or agroindustry like oil mills or fruit juice
processing factories. Within milk and meat production, large dairies and slaughterhouses are also
potential locations for medium to large scale biogas production and cogeneration. Traditional agro-
industries like sugar plants, rice husking mills and oil mills have in the past produced their own
energy based on bagasse, rice husks and groundnuts shells until it became easier and cheaper to use
oil.
Hydro. The hydro resources considered by the RREP are medium sized and mini hydro. It is assumed
that all large hydro potential are already included in the WAPP power capacity basket (7.083 MW).
Further 5.670 MW have been identified in 2010 by the UNIDO during a conference of hydropower in
Vienna. Generally most of the sites recorded by UNIDO have been identified or surveyed in the past.
Unfortunately data are not always reliable in terms of inflows as practically no follow-up has been
carried out since the mid-80ies and are often scattered between several entities. It is recommended
to compile all existing data in one office in order to identify the sites that could be suitable for
carrying out complementary surveys as data records are incomplete and not up-to-date, in order to
provide more solid and consistent data that can constitute the basis for feasibility study.

Training manual for the Regional ECREEE Training Workshop on National Renewable Energy Policy and Incentive Schemes
18
Table 4 : Overview of re potentials in the Ecowas Countries
Wind PV
Mini-hydro Biomass
BENIN
BURKINA FASO
CAPE VERDE
COTE D'IVOIRE
GAMBIE
GHANA
GUINEE
GUINEE BISSAU
LIBERIA
MALI
NIGER
NIGERIA
SENEGAL
SIERRA LEONE
TOGO
Mines
White : Nil or very small
Yellow : Satisfactory/acceptable
Orange: Good
Brown: Favourable
2.1.2 Assess feasible RE targets based on available RE resources.
In the UNEP report ‘Financing renewable energy in developing countries’ (2012), only two types of
public intervention are considered, by a majority of survey respondents, to be “most powerful” in
unlocking private investment and finance for renewable energy in developing countries:
the establishment of clear national targets for renewable energy generation and
the introduction of feed-in tariffs.
Therefore it is of first importance to demonstrate at the national policy level a strong commitment by
developing a national RE policy with quantified and achievable targets. The RE targets have to be
SMART:
S as specific: for example a biomass target expressed through as single figure (100.000 ktoe)
is not specific enough for potential projects developers to get interested by this type of
information. In the opposite, if your target is specific, for instance 90.000 t of woody wastes
available in a given location with a solid documented data background, a RE developer or
boiler/steam turbine manufacturer will know that a 30 MW biomass thermal plant can be a
solution to achieve this target and will investigate where there is a suitable grid access for
this production (at least 90 kV)
M for measurable, bodying the RE policy. For example, countries endowed with good solar
potentials should be stated in MW installed capacity connected to the grid at different
Training manual for the Regional ECREEE Training Workshop on National Renewable Energy Policy and Incentive Schemes
19
horizons and the potentials in MW installed for stand-alone systems (SHS-community
systems, smaller power plants to supply mini-grid)
A for attainable or achievable. The target might remain realistic in regards to certain
constraints or barriers. As for example, the overall wind energy penetration will depend on
the quality of the national grid. And as long the overall synchronization of the WAPP
electrical zone is not completed, the penetration ceiling will be limited to 20% of the
minimum peak load on the national grid, a ceiling evolving over time. The same remark is
valid for large PV plant. A 40 MW PV plant target will not be achievable now for a country
having a minimum peak load of 100 MW, but will be achievable in seven years with a
demand growth of 10%.
R for relevant. As the conditions for financing RE are presently uphill it is important to
remain focused on what is really relevant, on what really matters. For instance, wind energy
seems very popular in many countries like Mali, Niger, Ghana and even in Burkina Faso. For
some countries like Burkina Faso, the potential has to be demonstrated. For other countries,
it will require some additional heavy investments in HV transmission line to bring the wind
generated power to the main consumption areas.
T for time-bound. The fifth term stresses the importance of grounding goals within a time
frame, giving them a target date. A commitment to a deadline helps a ministry or an agency
to focus their efforts on completion of the goal on or before the due date.
2.1.3 Set Targets for RE penetration
These targets should cover the following energy fields:
Power Generation, for large grid connected applications, keeping in mind some technical
barriers for solar and wind energy, and the logistics and the availability of the resources for
biomass. Many country will face the dilemma between investing in short term diesel based
solution waiting for the regional grid of for the completion of the large hydro power
programme and some much more sustainable but more capital intensive solutions based on
RE sources.
Off grid electrification target, as RE solution for powering mini grids or as stand-alone
solution. These targets will depend on the methodology applied to the rural electrification
planning. A least cost planning including RE options as mini-grid and stand-alone solutions
based on a GIS based planning tool will enable the decision maker to draw a boundary
among the grid based electrification and the off grid RE based electrification domain. Even
though this exercise is carried out, political viewpoints or decisions are sapping the rationale
of these plans as for example all administrative centres have to be supplied by the national
grid, or SHS is not providing the real service, even though the same consumer will use the
grid connection for lighting and entertainment.
Energy Efficiency targets have to be set in order to enable more access for the same amount
of energy and somehow avoid additional capacity extension and give more room for smarter
RE supply solution
Training manual for the Regional ECREEE Training Workshop on National Renewable Energy Policy and Incentive Schemes
20
Finally targets should be set for sustainable wood-fuel production, for efficient use of this
resource, for modern RE and LPG substitution strategy where is possible.
2.2 The key role of a strong RE sector support
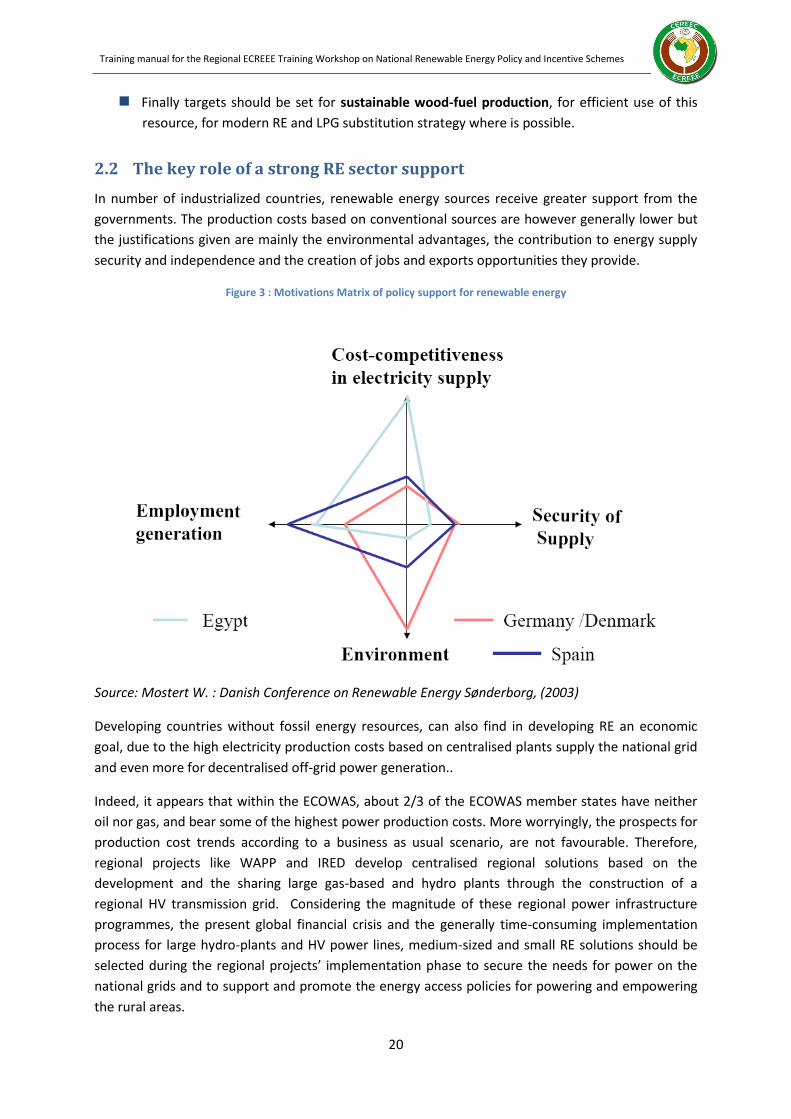
In number of industrialized countries, renewable energy sources receive greater support from the
governments. The production costs based on conventional sources are however generally lower but
the justifications given are mainly the environmental advantages, the contribution to energy supply
security and independence and the creation of jobs and exports opportunities they provide.
Figure 3 : Motivations Matrix of policy support for renewable energy
Source: Mostert W. : Danish Conference on Renewable Energy Sønderborg, (2003)
Developing countries without fossil energy resources, can also find in developing RE an economic
goal, due to the high electricity production costs based on centralised plants supply the national grid
and even more for decentralised off-grid power generation..
Indeed, it appears that within the ECOWAS, about 2/3 of the ECOWAS member states have neither
oil nor gas, and bear some of the highest power production costs. More worryingly, the prospects for
production cost trends according to a business as usual scenario, are not favourable. Therefore,
regional projects like WAPP and IRED develop centralised regional solutions based on the
development and the sharing large gas-based and hydro plants through the construction of a
regional HV transmission grid. Considering the magnitude of these regional power infrastructure
programmes, the present global financial crisis and the generally time-consuming implementation
process for large hydro-plants and HV power lines, medium-sized and small RE solutions should be
selected during the regional projects’ implementation phase to secure the needs for power on the
national grids and to support and promote the energy access policies for powering and empowering
the rural areas.

Training manual for the Regional ECREEE Training Workshop on National Renewable Energy Policy and Incentive Schemes
21
The emergence of the renewable energy sectors in the ECOWAS thus addresses both an economic
and environmental issue. The justification for firmly supporting these sectors cannot be simply
perceived as a solidarity effort towards the coming generations, but also as a response to the
immediate socio-economic requirements.
The renewable energy sectors are currently booming; however, these technologies are sometimes
immature or have not reached a sufficient level of technological and/or economic performance.
Depending on the energy position of the country, the renewable energy sources are not always able
to compete directly with existing technologies that already benefit from series and learning effects.
But the continuation of the dynamics of technical progress which has been under way for several
years may enable them to compete with fossil fuels for grid electricity production. This is already the
case, in many off-grid contexts, including replacement of small diesel with high operating costs by
locally available renewable sources solutions.
By creating favorable frameworks for the adoption of renewable energy by electricity producers, the
process of market opening aims to stimulate the technological change and the learning processes
within energy policies allowing to a decrease in the costs up to the economic competitiveness level2.
price-based approach with the purchase obligation system imposed on electricity companies
at guaranteed prices,
quantity-based approach when the public authorities set a goal to be reached through
competitive biddings, or by setting mandatory quotas to the electricity distribution utilities
and organizing the RE electricity market through green certificates exchanges.
The development and consolidation of the renewable energy market assumes that governments
intervene in its emerging phase to protect it from coarse competition with conventional
technologies. Without this intervention, the market forces alone would only lead to a limited
diffusion of renewable energies on a few niche markets. Dissemination would be insufficient to
enable them to benefit from the dynamic learning process effects and to change the competitiveness
conditions to their advantage.
2.3 A choice of instruments backed by a theoretical framework
Governments will face the choice between different families of instruments, those playing on prices
– controlled purchase tariff - and those playing on quantities - national targets and competitive
bidding, or imposition of quotas and trade of green certificates.
As noticed earlier, the goal of government intervention is very specific: it is to stimulate technical
changes and accelerate the learning technology processes to bring renewable energy fully
competitive with conventional energy sources, after internalizing of environmental costs.
Comparison of instruments must be assessed in connection with the characteristics of innovative
processes and conditions for their adoption - uncertainty regarding cost curves, learning dynamics
etc.
2 Ph. Menanteau (2001)

Training manual for the Regional ECREEE Training Workshop on National Renewable Energy Policy and Incentive Schemes
22
We will examine why effectiveness of various incentive schemes for RE development, both from a
theoretical standpoint by comparing both approaches based on prices and quantities, and from a
practical point of view by referring to the actual experiences of implementing these instruments.
2.4 Feed-in-Tariffs (FIT)
2.4.1 Definition of the theoretical approach
Feed-in-tariff (FIT) is a political mechanism seeking the emergence of private RE electricity generation
through the fixation of incentive purchase tariff stimulating the private investments in this sub-
sector.
FIT will secure a RE Independent power producers (RE-IPP) developing a power production based on
solar PV, wind power, biomass, ... access to a guaranteed market as well as an acceptable return on
investments. It includes generally three main measures:
Guaranteed grid access,
Long-term contracts for the generated electricity,
Purchase prices which are calculated on RE generation cost.
This system makes obligation to the utility to buy renewable electricity produced by the RE- IPP on its
grid, at a fixed price, decided by public authorities and guaranteed over a certain period. The
purchase price calculated on the basis of the generation cost insures the investors their projects
profitability and allows at the same time the development of the RE sector on a entrepreneurial
basis. These incentive prices may represent generally an additional cost imputable to the consumer
(or sometimes to the taxpayer via a solidarity fund or a contribution to the public service).
Figure 4 : Feed-in-Tariff system
The theoretical curve for RE marginal costs covers a panel of RE solutions from the cheapest solution
to more expensive technologies (following the merit order principle). By fixing a price at p* level the

Training manual for the Regional ECREEE Training Workshop on National Renewable Energy Policy and Incentive Schemes
23
planner or the regulator expects to mobilise through private investments an electricity quantity q*,
that will be generated by the panel of RETs for the cheapest to a RET which marginal production cost
is equal to the FIT p*. The total overcost to mobilise private investments corresponds to the cost
difference between p*and the reference cost for conventional power generation multiplied by the RE
electricity volume q*. The portion of the rectangle below the RE marginal costs curve expresses the
reall additional cost (light grey) and the remaining portion (shaded dark grey) is the Guarenteed
income paid to the investor. Therefore the fixation of the FIT has to be based on detailed marked
analyses for both technologies and financial markets in order to avoid too generous FITs resulting
into a quite bigger numbers of projects than planned with additional costs and consumer tariff
increase as consequences.
This system is very incentive but does not manage the uncertainties on the quantity launched on the
market. The fixation of FITs is a sensitive issue as a rent effect can be expected for producers whose
marginal cost is appreciably lower than the guaranteed price. Therefore mechanisms to revise the
FITs have be considered in relation the RETs market prices evolution.
2.4.2 Examples of implementation 3
Among the policies employed by governments, feed-in tariffs (also called premium payments,
advanced renewable tariffs, and minimum price standards) remain the most common. By early 2011,
at least 61 countries and 26 states/provinces had FITs, more than half of which had been enacted
since 2005. In Europe, this system has been firstly presented in the German law in year 2000, then
followed by Denmark, Spain and France among others.
Additional costs generated by these purchase tariffs are financed, in the example of France, by a levy
‘the Contribution to the Electricity Public Service (CSPE)’: a tool for financing of the liberalized market
of electricity. The CSPE was established by the law in year 2003.
There are many variations of FITs, and no single definition can be applied. In one variation of a new
FIT, the U.S. State of Louisiana’s Public Utility Commission announced in 2010 that electric utilities
would be required to implement a limited “standard offer tariff” that is undifferentiated by project
size, technology, or resource intensity. This type of tariff represents the utility’s “avoided cost” of
generation plus an “environment” premium fixed at U.S. 3 cents/kWh. The tariff also sets total floor
and ceiling prices of 6 cents/kWh and 12 cents/kWh, caps total capacity at 30 MW per utility, and
applies to projects between 25 kW and 5 MW. The additional costs are passed on to ratepayers
through a fuel adjustment clause, an approach normally used to cover increases in the cost of fossil
fuels.
Several of the existing FIT policies around the world are presently under review. In particular, many
countries are revising solar PV FITs to dampen the booming rate of installations, which in many cases
are far exceeding expectations due to the unprecedented price reductions in solar PV that occurred
in 2009 and 2010. In late 2010, the Czech Republic passed new legislation to slow the rate of PV
installations as total capacity increased from 65 MW at the end of 2008 to nearly 2 GW by the end of
2010 – in part out of concern for the impact of the FIT on average electricity prices. Effective from
March 2011, the country cut all FIT rates for ground-mounted PV installations that were not yet
interconnected with the grid. In May 2011, Italy cut tariffs for solar PV by 22–30% for 2011, by 23–
3 Exemples majoritairement tirés de la publication Renewables 2011 Global Status Report (REN21)

Training manual for the Regional ECREEE Training Workshop on National Renewable Energy Policy and Incentive Schemes
24
45% for 2012, and by 10–45% for 2013 (ranges apply to different scales of installation). A project
ceiling of 1 MW on rooftops and 0.2 MW for ground mounted systems was also imposed to limit the
total cost to EUR 6–7 billion by the end of 2016, when roughly 23 GW are expected to be installed.
Many other FIT changes took place in 2010. In Spain, the EUR 0.42/kWh FIT level for solar PV, as set
in 2007, still remains, but new legislation now caps the annual hours rewarded by the FIT, and some
uncertainty arose regarding retroactive cuts to existing systems.
Greece’s financial problems led to the government blocking a backlog of project applications for
support incentives worth over EUR 2 billion, but the restriction was lifted in September 2010 and
new projects continued.
The United Kingdom decided in 2010 to replace its existing quota policy with a FIT, starting in 2013,
for “low carbon generation.”
Table 5 : FEED in Tariff (FIT) for the UK and Scotland
System size etc FIT rate
Solar Photovoltaic with total installed capacity of 4kW or less, where installed on a building which is already occupied
21 pence per kilowatt hour
Solar Photovoltaic with total installed capacity of 4kW or less, where installed on a new building before first occupation
21 pence per kilowatt hour
Solar Photovoltaic with total installed capacity greater than 4kW but not exceeding 10kW
16.8 pence per kilowatt hour
Solar Photovoltaic with total installed capacity greater than 10kW but not exceeding 50kW
15.2 pence per kilowatt hour
Solar Photovoltaic with total installed capacity greater than 50kW but not exceeding 250kW
12.9 pence per kilowatt hour
Solar Photovoltaic with total installed capacity greater than 250kW but not exceeding 5MW
8.9 pence per kilowatt hour
Stand-alone (autonomous) solar photovoltaic (not attached to a building and not wired to provide electricity to an occupied building)
8.9 pence per kilowatt hour
Bulgaria, through its new Renewable Energy Act of June 2011, put an annual cap on new projects
receiving the FIT prices by applying a quota.
And Turkey enacted a long-awaited renewable energy law that replaces the existing single-rate FIT
with technology-specific FIT rates over a 10-year term for wind, geothermal, biomass, biogas, and
solar, with bonus payments if hardware components are made in Turkey.
In Africa, Kenya’s FIT policy4 has as its objectives to:
a) facilitate resource mobilization by providing investment security and market stability for
investors in Renewable Energy Sources (RES) electricity generation
b) reduce transaction and administrative costs by eliminating the conventional bidding processes,
and
4 UNEP www.unep.org > Green Economy > Success Stories > Feed-in tariffs in Kenya

Training manual for the Regional ECREEE Training Workshop on National Renewable Energy Policy and Incentive Schemes
25
c) encourage private investors to operate the power plant securely and efficiently so as to
maximize its returns.
By taking a long-term commitment to the development of renewable sources of energy and
stipulating a long-term power purchase agreements of a minimum of 20 years, the Kenya
Government has taken a critically important step in the development of the country’s significant
potential for renewable energy generation, while pursuing equally important economic,
environmental and social policy objectives.
In January 2010, Kenya revised the FIT policy, which resulted in the addition of three renewable
energy sources: geothermal, biogas, and solar energy resource generated electricity. In addition, the
revised policy extended the period of the power purchase agreements from 15 to 20 years and
increased the fixed tariffs per kilowatt-hour for pre-existing wind and biomass under the FIT. It is
expected that the FIT policy in Kenya could stimulate about 1300 MW of electricity generation
capacity.
2.4.3 SWOT Analysis
Table 6 : Strengths and Weaknesses of Feed-in-Tariffs
Strenghts Weaknesses
For producers: Stable and secure income independently from fluctuations in the conventional electricity price
For public authorities: no guarantee on the quantities produced by renewable energies (risks of assessment/assumptions errors on calculation ofmarginal cost curves leading to unexpected impacts in terms of quantity and overall cost for the utility/consumers
Existence of a differential rent incites the producers to invest in the R&D (research) for innovative technologies to reduce generation costs
Guaranteed income in the form of "Windfall Profits" or ‘Free Rides’ for the producers whose marginal cost is low: can require to programme a FIT’s diminution over time or a price cap principle and a differentied FIT by technology
No transaction costs (due to a Stable and transparent regulatory framework)
For consumers: expensive system (if the electricity from conventional source is more competitive). The additional cost will be reduce over time if the price of conventional electricity increases.
The guaranteed price does not take into account the default cost resulting from the irregularity of certain renewable energies ( wind energy)
The FIT system is at present the system dominating in Europe but it is expensive for the consumer.
The total cost increases with the increase of the renewable energy share in the energy mix unless the
price of conventional electricity increases strongly, as during the sharp rise of oil prices.
Figure 5 : Guaranteed price and error of anticipation on the slope of the marginal cost

Training manual for the Regional ECREEE Training Workshop on National Renewable Energy Policy and Incentive Schemes
26
Additional cost with regard to the anticipations of public authorities
2.5 Quota system with competitive bidding
2.5.1 Definition of the theoretical approach
In order to generate a given quantum of green electricity the public authority sets a quantified target
for green electricity bulk production to be injected into the grid and proceeds through competitive
biddings.
Producers that are successful in the tender (merit order) get through their contract with the utility
the guarantee to sale their green energy production to a given price. The contract price for green
electricity for each awarded producer is:
Either the same price-limit fixed on the basis on the last successful offer (the price proposed
by the last awarded bidders ) if the bidding system is "at the marginal price bid" or "French
auctions" (In that case the price is uniform)
Or the price charged by each awarded producer if within the system "pay as bid" or "Dutch
auction" (in that case there is a price discrimination)
Figure 6 : Quota system with « paid as bid » auctions (Dutch auction)

Training manual for the Regional ECREEE Training Workshop on National Renewable Energy Policy and Incentive Schemes
27
The regulator sets a quota (q*) and proceeds through competitive biddings to the selection of
projects. The bids are ranked in order of increasing price (merit order) and each bid receives the
demanded price (Price ) if the rule is ‘paid as a bid’ or the same price corresponding to the highest
awarded bids if the rule is ‘paid as marginal price’.
2.5.2 Examples of implementation
This system was used in England from 1991 to 2001 (Non Fossil Fuel Obligation) and in France
between 1996 and 2000 (program "Eole 2005"), but both abandoned in favor of guaranteed prices in
France and green certificates in England. This system remained in force in Ireland.
Quotas with competitive bidding are nevertheless still used case by case in France for offshore wind
(see Agde and Fos-sur-Mer).
2.5.3 SWOT Analysis
Table 7 : Strengths and Weaknesses of the quota system with competitive bidding
Strenghts Weaknesses
The government keeps control of the volume of green electricity fed into the grid (but not of the cost)
Responses to tenders are uncertain and the price of each bidder is not known ex ante
Governments can choose in the tender documents the areas where the facilities will be implemented (Land-use policy planning)
Transaction costs (related to the organization of the auction)
Differential income observed with the system of guaranteed prices disappears. Bids prices follow the marginal costs (with a "reasonable" rate of profit)
A priori system that is less remunerative to producers and thus less incentive for RE clusters development
The cost of failure remains for wind projects
The "Dutch auctions" bring perverse effects: - The producers have an incentive to overstate their offer price as they anticipate the

Training manual for the Regional ECREEE Training Workshop on National Renewable Energy Policy and Incentive Schemes
28
"winner's curse", whoses price is below the marginal cost. 5 - Producers are seeking to acquire information about competing bids (expensive) - The producers have an incentive to agree (collusion)
2.6 Decentralized quota system backed by a green certificate market
2.6.1 Definition of the theoretical approach
An alternative to the previous quotas system with competitive bidding is the fixation of mandatory
production quotas for green electricity supply. These quotas are imposed on power generating
utilities and / or electricty distribution utilities (calculated as a percentage of production/sales).
Operators can meet these obligations in three ways:
by producing their own green electricity,
by buying the electricity under long term contracts,
by acquiring on the financial market the "Green Certificates" corresponding to the amount of
electricity required.
The green electricity producers receive for each green MWh produced a green certificate and they
sell the two separate commodities (electricity on one hand and certificate on the other hand) in two
markets:
green electricity is sold on the wholesale electricity market, at the price of conventional
electricity,
the green certificate, which represents the " added value" of this electricity, is traded in the
market for green certificates.
The certificate price is equal to the difference between the marginal cost of green electricity and the
price of conventional electricity. This system allows an optimal allocation of effort (equalization of
marginal costs).
Figures 7 : Decentralized quota system backed by a green certificate market
5 Cf Chari et Weber (1992)

Training manual for the Regional ECREEE Training Workshop on National Renewable Energy Policy and Incentive Schemes
29
Both graphs show the dynamics of the green certificates and mandatory quotas. Imposing a quotas
for green electricity will increase the demand of green certificate on the financial market and lead to
readjustment of the value of the green certificates. At the same time, producers or developers in the
real world will build new capacity as the market is giving a clear signal.
The new additional capacity will lead to an increase of the production marginal cost (from AB on
the left inside graph. The product of the green certificates on the financial market has to cover the
extra costs for RE generation (the top of the romble ACQ*Q**) and a reasonable profit for the
producer. The market regulates the quantities of RE electricity produced.
2.6.2 Examples of implementation
There are currently more than 6 million green power consumers in Europe, the United States,
Australia, Japan, and Canada. Green power purchasing and utility green pricing programs are
growing, aided by a combination of supporting policies, private initiatives, utility programs, and
government purchases. The three main vehicles for green power purchases are:
utility green pricing programs,
competitive retail sales by third-party producers enabled through electricity
deregulation/liberalization (also called “green marketing”),
and voluntary trading of renewable energy certificates.
Germany has become the world’s green power leader, with a market that grew from 0.8 million
residential customers in 2006 to 2.6 million in 2009. These consumers purchased 7 TWh of green
electricity in 2009 (6% of the nation’s total electricity consumption). In addition to residential
consumers, 150,000 business and other customers purchased over 10 TWh in 2009 (9.5% of total
electricity consumption). Other major European green power markets are Austria, Finland, Italy,

Training manual for the Regional ECREEE Training Workshop on National Renewable Energy Policy and Incentive Schemes
30
Sweden, Switzerland, and the United Kingdom, although the market share of green power in these
countries is less than 5%.
Australia’s 900,000 residential and 34,000 business consumers collectively purchased 1.8 TWh of
green power in 2008.
In Japan, the green power certificate market grew to 227 GWh in 2009 with more than 50 sellers. The
Green Heat Certificate Program began in 2010 for solar thermal, with biomass joining in 2011.
In South Africa, at least one company offers green power to retail customers using renewable
electricity produced from bagasse combustion in sugar mills.
Some governments require that utilities offer green energy options to their consumers. In the United
States, where green pricing programs are offered by more than 850 utilities, regulations in several
states require utilities or electricity suppliers to offer green power products. More than 1.4 million
U.S. consumers purchased 30 TWh of green power in 2009, up from 18 TWh in 2007.
The U.S. Environmental Protection Agency’s Green Power Partnership grew to more than 1,300
corporate and institutional partners that purchased more than 19 TWh of electricity by the end of
2010. The largest consumer, Intel, nearly doubled its purchases in 2010, to 2.5 TWh. Other innovative
green power purchasing models are emerging in the United States. For example, some utilities
enable customers to purchase shares in a community solar project and then obtain a credit on their
utility bill equivalent to their share of the project output.
The European Energy Certificate System (EECS) framework has 18 member countries and allows the
issue, transfer, and redemption of voluntary renewable energy certificates (RECs). It also provides
“guarantee-of-origin” certificates in combination with RECs to enable renewable electricity
generators to confirm origin. During 2009, 209 TWh of certificates were issued, more than triple the
number in 2006.
Norway, a major hydropower producer, issued 62% of all certificates under the EECS, virtually all of
which were hydropower. In other European countries, green power labels such as “Grüner strom”
and “Ok-power” in Germany and “Naturemade star” in Switzerland have been introduced to
strengthen consumer confidence.6
2.6.3 SWOT Analyses
Figure 8 : Strengths and Weaknesses of a decentralized quota system backed by a green certificate market
Strenghts Weaknesses
Optimal allocation of efforts encourages the most efficient producers to expand its production; flexible and scalable system
High transaction costs
Incentive to locate production in most appropriated areas and allow a regional market for certificates
Market sometimes narrow, with low degree of liquidity and high price volatility of the certificates
6 Renewables 2011 Global Status Report (REN21)
Training manual for the Regional ECREEE Training Workshop on National Renewable Energy Policy and Incentive Schemes
31
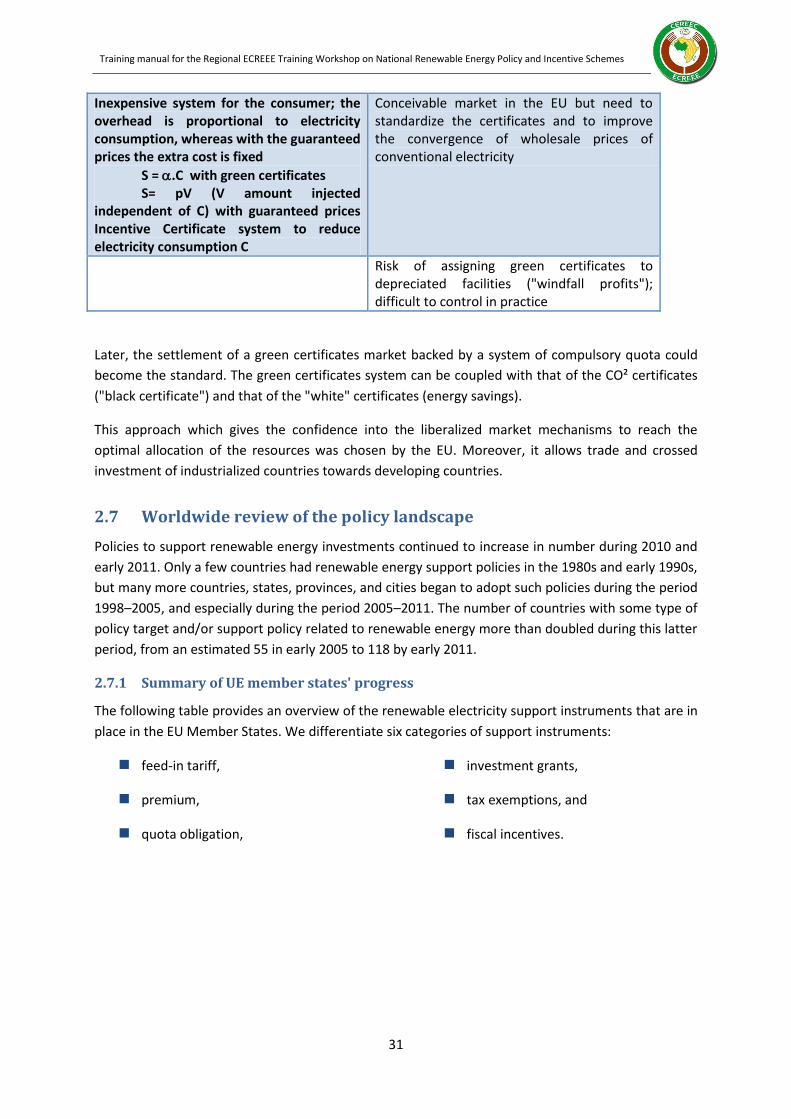
Inexpensive system for the consumer; the overhead is proportional to electricity consumption, whereas with the guaranteed prices the extra cost is fixed
S = .C with green certificates S= pV (V amount injected independent of C) with guaranteed prices Incentive Certificate system to reduce electricity consumption C
Conceivable market in the EU but need to standardize the certificates and to improve the convergence of wholesale prices of conventional electricity
Risk of assigning green certificates to depreciated facilities ("windfall profits"); difficult to control in practice
Later, the settlement of a green certificates market backed by a system of compulsory quota could
become the standard. The green certificates system can be coupled with that of the CO² certificates
("black certificate") and that of the "white" certificates (energy savings).
This approach which gives the confidence into the liberalized market mechanisms to reach the
optimal allocation of the resources was chosen by the EU. Moreover, it allows trade and crossed
investment of industrialized countries towards developing countries.
2.7 Worldwide review of the policy landscape
Policies to support renewable energy investments continued to increase in number during 2010 and
early 2011. Only a few countries had renewable energy support policies in the 1980s and early 1990s,
but many more countries, states, provinces, and cities began to adopt such policies during the period
1998–2005, and especially during the period 2005–2011. The number of countries with some type of
policy target and/or support policy related to renewable energy more than doubled during this latter
period, from an estimated 55 in early 2005 to 118 by early 2011.
2.7.1 Summary of UE member states' progress
The following table provides an overview of the renewable electricity support instruments that are in
place in the EU Member States. We differentiate six categories of support instruments:
feed-in tariff,
premium,
quota obligation,
investment grants,
tax exemptions, and
fiscal incentives.

Training manual for the Regional ECREEE Training Workshop on National Renewable Energy Policy and Incentive Schemes
32
Table 9 : Incentive Instruments used in EU member countries
Source : Ecofys for the DG Energy of the European Commission7
Source : Ecofys for the DG Energy of the European Commission
7 European Commission DG Energy : “Financing Renewable Energy in the European Energy Market” (2011)

Training manual for the Regional ECREEE Training Workshop on National Renewable Energy Policy and Incentive Schemes
33
2.7.2 Summary of developing countries progress
Table 10 : Incentive Instruments used by developing countries
Source : Renewables 2011 Global Status Report (REN21)

Training manual for the Regional ECREEE Training Workshop on National Renewable Energy Policy and Incentive Schemes
34
2.7.3 Comparison of diverse incentives dedicated to the PV sector
Table 11 : Performance criteria for PV incentives
Source : PV Policy Group – European Best practice report (2006)

Training manual for the Regional ECREEE Training Workshop on National Renewable Energy Policy and Incentive Schemes
35
2.8 Power Purchase Agreements (PPA)
Among the major tools at the disposal of the regulator and the public authorities, a standardized
contract type of Power Purchase Agreement must be available in the country to facilitate
involvement of private bodies. PPAs are helpful for projects dealing with national grid as well as mini-
grids.
2.8.1 Definition of the theoretical approach
Power Purchase Agreements are contracts between two parties, one who generates electricity for
the purpose of sale (the seller) and one who is looking to purchase electricity (the buyer). There are
various forms of Power Purchase Agreements; these are differentiated by the source of energy
harnessed (solar, wind, etc.). Financing for the project is delineated in the contract, which also
specifies relevant dates of the project coming into effect, when the project will begin commercial
operation, and a termination date for which the contract may be renewed or abandoned. All sales of
electricity are metered to provide both seller and buyer with the most accurate information about
the amount of electricity generated and bought. Rates for electricity are agreed upon in the contract
between both parties to provide an economic incentive to being a Power Purchase Agreement.
Under a PPA, the buyer is often a utility company that purchases the electricity generated from the
seller. In some circumstances, a company may be trying to meet renewable-energy portfolio
standards and would be considered a retail purchaser. Under this condition, the retail purchaser may
resell the electricity to another entity under a new PPA. Typically, a PPA is established between the
primary seller and a utility company who is regulated to buy the electricity.
The PPA is often regarded as the central document in the development of independent electricity
generating assets (power plants), and is a key to obtaining project financing for the project. Under
the PPA model, the PPA provider would secure funding for the project, maintain and monitor the
energy production, and sell the electricity to the host at a contractual price for the term of the
contract. The term of a PPA generally lasts between 5 and 25 years. In some renewable energy
contracts, the host has the option to purchase the generating equipment from the PPA provider at
the end of the term, may renew the contract with different terms, or can request that the equipment
be removed. One of the key benefits of the PPA is that by clearly defining the output of the
generating assets (such as a solar electric system) and the credit of its associated revenue streams, a
PPA can be used by the PPA provider to raise non-recourse financing from a bank or other financing
counterparty.
2.8.2 Examples of implementation 8
Five innovative nations in Asia have been among the first in developing ECOWAS (SPP) programs to
promote renewable energy development in-country (Thailand, Indonesia, India, Sri Lanka and Viet
Nam). These programs have been very successful in some of these nations in promoting during just a
8 cf Ferrey S. : Small Power Purchase Agreement Application for Renewable Energy Development: Lessons from
Five Asian Countries (2004)

Training manual for the Regional ECREEE Training Workshop on National Renewable Energy Policy and Incentive Schemes
36
few years a substantial contribution of renewable small power projects to the national energy
supply. Some of the most successful program features, innovative elements, and PPA design that
have achieved notable success and could be the basis of programs in other nations. Each of these
programs involves standardized PPAs or standardized tariffs, or both, which are a material element
of program design. Most of these countries advanced their programs with technical and/or financial
assistance from international donors and agencies, although the Thailand program proceeded
without such assistance.
The Thai program operates in tranches of formal solicitation by the state utility. Eligible projects
mirror the requirements of those of the “PURPA program” in the United States, with size limitations
up to 60 MW, and in some cases, 90 MW. State subsidies are provided for some renewable SPPs
competitively selected. As in the U.S. experience, the majority of projects are natural gas-fired
cogeneration projects.
Both firm and non-firm PPAs are available. The contract was designed to be indexed, but instead is
adjusted periodically for foreign exchange risk for capacity and energy payments. For intermittent
renewable projects, the capacity factor9 must be greater than 0.5, without a reduction in capacity
payments. Thailand was the first of the Asian SPP programs, and it set a standard for successful
program development. A noteworthy feature is its competitively determined renewable SPP subsidy
program.
The Indonesian began to develop a program in 1993. It came to involve a standardized PPA and
tariff. The SPP program was designed to supply up to one-third of national new power supply from
small, renewable sources, organized into four tiers of priority for projects of up to 30 MW in size on
the primary island, and half of that size on smaller island grids. Since Indonesia comprises several
separate and not interconnected island grid systems and isolated diesel systems, this program design
was nuanced and disaggregated to address avoided cost and power requirements on a regional basis.
The standardized PPA in its original design contemplated either a firm10 or non-firm power sale. The
incentives for firm power delivery were embodied in the tariff, with indexation of capacity payments
for foreign exchange risk, on the theory that most of the value added of generating capacity would
be foreign production (this program included cogeneration utilizing fossil fuels as a lower-priority
generation source). This provided an innovative approach to structuring the performance obligation,
whereby no legal sanctions were imposed for performance failure of the SPP, but rather a substantial
economic disincentive for the SPP from such nonperformance was in place. Some innovative fuel
price hedging was provided for renewable power projects.
In India, each state makes its own determinations about SPP programs. Two representative Indian
states are described below. Although some Indian states provided formal SPP solicitations or allowed
direct retail third-party sales, or both, neither of the two states evaluated here now allow direct
third-party sales or conduct a formal project solicitation.
In the state of Andhra Pradesh, no formally standardized contract is in place, although de facto a set
contract form is used by the utility, leaving some case-by-case discretion with the utility. The tariff is
escalated at 5 percent annually from a base year. Moreover, the tariff can be reset mid-contract after
9 Total production/installedcapacity/8760 h. A capacity factor >0.5 only for biomass and mini-hydro
10 Firm power sale as defined in the contract (when and how many MW fully available)

Training manual for the Regional ECREEE Training Workshop on National Renewable Energy Policy and Incentive Schemes
37
three years by the government. This undercuts long-term certainty. Energy wheeling is allowed, but
discouraged economically by a high wheeling charge. No third-party retail sales are allowed.
In Tamil Nadu state, a similar de facto set PPA is employed. An SPP is defined as any project up to 25
MW. Many wind power projects have been developed and grid connected. Wheeling of power to an
affiliated location—not to a third-party—is permitted with a 2 percent charge. No third-party retail
sales are allowed.
The Sri Lankan program does not utilize a simultaneous solicitation for SPP bids as was deployed in
Indonesia and Thailand. Ad hoc offers are entertained by the state utility. Fifteen-year PPAs are
available for projects up to 10 MW in size. All but one of the successful SPPs to date are small
hydroelectric projects. The PPA is standardized, as it is the tariff. The tariff development was assisted
by consultants provided by the World Bank. The tariff is revised annually based on a three-year fuel
average, with a tariff floor of 90 percent of the original tariff underneath renewable projects.
These Asian nations offer different forms of government and have different predominant fuel
sources in their generation base (hydro, coal, gas, oil). Some of the national electric systems have an
integrated high-voltage transmission system, whereas others have a disintegrated or island system,
but there are key similarities:
All are in need of long-term increases in power generation capacity (although Thailand has a
short term current surplus).
All have the potential of small-scale renewable energy options which is quite relevant for the
WA region.
Each country is being approached by private developers who seek to develop renewable SPP
projects.
Each system employs either deliberately or de facto a standardized PPA, although it is not
necessarily a neutral or consensual document in all cases.
Although avoided cost concepts for establishing the SPP tariff are recognized in each nation,
avoided cost concepts are applied differently in these nations’ SPP programs.
Table 12 : Examples of Small Power Purchase Agreements

Training manual for the Regional ECREEE Training Workshop on National Renewable Energy Policy and Incentive Schemes
38
2.8.3 SWOT Analysis
Table 13 : Strengths and Weaknesses of PPA
Strengths Weaknesses
Renewable developer (or partner) eligible for tax incentives, accelerated depreciation
Some utilities may find that the PPA option does not provide them with sufficient control over or certainty with regard to the operation and management of renewable resources
Minimal risk to public authorities : minimizes the capital demands on traditional utilities
Many renewable developers are having difficulty attracting the necessary capital to complete their projects (especially individuals or SME involved in small mini-grid projects)
No up-front capital from public required
Renewable developer provides O&M
Known long term electricity price for portion of site load
Buying renewable energy through a PPA also minimizes development and construction risk for the
utility. This may be particularly appealing to those utilities that divested their generation fleet in
response to restructuring mandates, many of whom lack direct experience with renewable energy
development and consider this function to be outside of their core business of energy delivery.
Accordingly, pursuit of and diligence regarding renewable PPAs may provide valuable experience for
traditional utilities in renewable development, particularly if utility personnel work closely with
renewable energy developers in developing the PPA and operational/ dispatch protocols for the
facility.
The PPA option also leaves technology risk with the renewable developer. Given the speed of
technological change in the renewable sector, utilities and their state commissions may be reluctant
to take on actual or perceived technology risk.
2.9 Mini-grid concessions
2.9.1 Definition of the theoretical approach
Mini-grids involve a centrally located generating system that serves generally tens or hundreds of
users. A mini-grid is an attractive option when customers are concentrated enough to be
economically interconnected but the connection to the main grid is not feasible. It is typically the
case of many isolated communities in African countries.
The outputs on which subsidies are disbursed in mini-grid systems are diverse and can range from
construction milestone to installed capacity to connection of new customers. Most projects
identified include a mix of these outputs, but most of the subsidies target the access to energy for
rural population. In terms of market model, public-private partnerships in the form of concession
Training manual for the Regional ECREEE Training Workshop on National Renewable Energy Policy and Incentive Schemes
39
contracts are the most common. Under concession, the service provider has exclusive rights to
generate, distribute, and sell electricity in the concession area.
The concept of a "concession" was first developed in France. As with leasing, the framework for the
concession is set out in the country law and the contract contains specific provisions to the project.
Emphasis is placed in the law on the public nature of the agreement (because the operator has a
direct relationship with the consumer) and safeguards are enshrined in the law to protect the
consumer. Similar legal frameworks have been incorporated into civil law systems elsewhere.
Within the context of common law systems, the closest comparable legal structure is the BOT (Build-
Operate-Transfer), which is typically for the purpose of constructing a facility or system.
The "Concession" and "BOT” contracts are almost similar: The main difference between concession
and BOT contracts is that investment charges, operation and maintenance, commercial risk, and
asset ownership for the duration of the contract are fully born by the private contractor in the case
of the concession, while they can be shared between public and private entities as part of a mixed
enterprise corporation for the BOT. Both systems were developed to attract private investments to
the new infrastructure construction phase. Concession or BOT contracts allow the private sector to
build a new infrastructure in compliance with standards established by the State, and to own
exclusive operation rights for the concession area and for a sufficient period (generally ten to twenty
years) to earn back the initial investment, plus a profit. The State becomes owner of the
infrastructures at the contract expiration and then has the option to place them on a long-term lease
contract, for example, with a private operator. The concession contract differs from other contracts,
such as construction or public service contracts as follows:
The assumption of the total or partial investment by the contractor as part of a long term
contract, (duration of contract must be longer than the expected delay of return on
investment);
The transfer from the conceding entity to the contractor of public service obligations
corresponding to a public responsibility and the sharing of the various risks between both
parties;
Concession is defined by multiple criteria. Consequently, the national law must offer a distinct legal
framework to concessions, different from that of public markets, and with assignment and execution
rules specific to these contracts, in particular for those operating on mini-grid systems.
2.9.2 Examples of implementation
In most African countries, local communities do not (yet) have the technical and organizational
capacities required to directly manage their rural electrification program: Therefore, the most
common public service execution mode is public service management delegation. It is also the best
system to financially involve the private sector in the investment phase.
The Madagascar implementation of concession model for mini-grid systems

Training manual for the Regional ECREEE Training Workshop on National Renewable Energy Policy and Incentive Schemes
40
In Madagascar, mini-grids are operated by private bodies under concession contract or authorization
depending on the size of the generation and/or distribution system.
Table 14 : Differences between concession and authorization
Concession Authorization
Generation :
> Thermal power plant / Genset : > 500 kW
> Hydro power plant : > 150 kW
Generation :
> Thermal power plant / Genset : < = 500 kW
> Hydro power plant : < = 150 kW
Distribution :
Peak load exceeding 500 kW
Distribution :
Peak load under 500 kW
The process to award concession and authorization is basically based on call for tenders. However,
authorization can also be awarded after unsolicited application.
After technical acceptance by the National Agency for the Rural Electrification (ADER), tariff is
negotiated between the contractor and the local community, and submitted for control and
validation to the Regulator.
The ESCO model in Mali
Koraye Kurumba and Yeelen Kura are two Rural Energy Services Companies (RESCOs) created in 1999
and 2001 in two areas of rural Mali (Kayes and Koutiala). The companies were created by France’s
electricity company EDF, in partnership with the Dutch energy company NUON, the French TOTAL
and with the support of the French Agency for the Environment and Energy Efficiency. The provision
of low-cost electricity, based on solar home systems or small low-voltage village micro-networks
supplied by diesel generators, resulted in undeniable development impacts, such as enhancing
standards of living, favouring the development of income-generating activities, and improving quality
of healthcare and education. Backed by a new institutional framework and international donors, the
model– designed to ensure profitability, sustainability, reproducibility and local ownership– is to be
expanded beyond the 24 villages and 2176 households/43,520 people were served at the end of
2006. The initial targets were 10,000 clients for a total population of 200,000 inhabitants.
Senegal: the concept of technological neutrality
In Senegal, the concept of technological neutrality is applied. For every concession, a Local Plan of
Electrification is firstly drawn up, defining the appropriate technologies of electrification, the
required investments, and the potential market. Actually, the technico-economic optimization favors
the use of Renewable energies on mini-grids systems. As a result, from 2000 till 2007, looking at the
solar energy only, the capacity installed in Senegal increased from 850kWc to about 2 000 kWc.
Training manual for the Regional ECREEE Training Workshop on National Renewable Energy Policy and Incentive Schemes
41
The system of attribution of the concessions is based on selection or call for tenders. Regarding the
choice of the concession’s operator, the determining criterion is the number of users to be supplied
with a subsidy at the investment fixed by the ASER (Senegalese Agency of the Rural Electrification) in
the call for tenders. The candidate who proposes the largest number of users' supplied with the
granted level of subsidy is the winner.
To increase the chances of success, the choice of the most adapted technology and efforts in sizing
are essential. The concession contract is obtained for a duration of 25 years. The selected candidate
to operate the concession proceeds to the realization of the works of electrification, the
maintenance and the renewal of the installations present in its area during the duration of its
contract. Within this framework, the integration of the local private sector in the creation of the
project’s company, which will have to operate the concession, is fundamental.
A particular but replicable electrification model in South Africa
The South African Energy Policy White Paper of 1998 required the integration of grid and non-grid
technologies in a single National Electrification Programme. The South African Government
encouraged private-sector participation in rural energy service provision. The approach being
pursued, as in a number of other countries, was the award of geographical concessions to provide
non-grid electricity supplies (primarily solar home systems) in remote areas.
The work conducted was particularly focused on the potential for isolated communities to benefit
from emerging renewable technologies in the form of a renewable mini-grid. The interest in this
particular form of rural electrification comes from the demographic profile of many sub-Saharan
African countries, which have a high proportion of isolated communities. The development of an
appropriate economic solution for isolated communities is a challenging aim. Yet, with rising in fuel
prices and the mitigate success of a number of diesel based isolated systems throughout the region,
there is an emerging interest in the use of renewable energy.
In 2003, the Global Sustainable Electricity Partnership (e7) began the development of a
demonstration project in South Africa targeting off-grid mini-hybrid systems, with an emphasis on
wind and solar power. The project objectives included: eligibility for CDM status, replicability,
financial sustainability, and the practical principles associated with economic sustainability.
After identifying the sites, the e7 undertook a pre-feasibility study that yielded positive conclusions,
leading to a decision to pursue the project at the feasibility stage. However, due to a faster growth in
electrification plans in South Africa, the sites chosen for the feasibility study were no longer eligible
for further implementation. Their conclusion not to proceed in South Africa was driven by the failure
to identify a suitably remote site of reasonable density that was unlikely to be grid connected within
the next five years. In discussions with government it also became obvious that providing rural
communities with renewable energy solutions was likely to conflict with developing electrification
policy in South Africa.
Nevertheless, the information and lessons learned from this study can greatly benefit similar
electrification projects and programmes in other Sub-Saharan African countries. Among the main
lessons learned from this South African experience we note the importance of a good coordination

Training manual for the Regional ECREEE Training Workshop on National Renewable Energy Policy and Incentive Schemes
42
with government and electrification authorities, to avoid any conflict between mini-grids
development and main grid deployment in the country that would result in a waste of financial
resources.
2.9.3 SWOT analysis
The private company is responsible for infrastructure and daily operation financing. Pricing rules are
discussed in the concession contract.
Table 15 : Strengths and Weaknesses of of mini-grid concession
Strenghts Weaknesses
Substantial contribution of private capital Implies a regulation capacity by the
government
Combining private sector responsibilities in
infrastructure development and daily
management: Greater opportunities for
innovation
Contract complexity : need to combine
foresight and flexibility
Public sector get back the infrastructures and
equipment upon expiration of the concession
contract
Process not very competitive
2.10 Netmetering
2.10.1 Definition of the theoretical approach
Netmetering is a power supply arrangement that allows a two-way flow of electricity between the
electricity distribution grid and customers that have their own generation system. The customer pays
only for the net electricity delivered from the utility (total consumption minus self-production). A
variation that employs two meters with differing tariffs for purchasing electricity or exporting excess
electricity off-site is called “net billing.”
2.10.2 Examples of implementation
Net metering is an important policy for rooftop solar PV (as well as other renewables) that allows
self-generated power to offset electricity purchases. Net metering laws now exist in at least 14
countries including Italy, Japan, Jordan, and Mexico, and almost all U.S. states. And finally, new forms
of electric utility regulation and planning are emerging that target the integration of renewables into
power grids at increasing levels of penetration.

Training manual for the Regional ECREEE Training Workshop on National Renewable Energy Policy and Incentive Schemes
43
Bibliography
Rapports
Arthur W.B. : Competing technologies: increasing returns and lock-in by historical events -
Economic Journal, 99 (1989)
Boubou P., Watchueng S. and Massé R. : Public-Private Partnership in rural electrification
programs in Africa – Club-ER (2010)
Chari V.V. et Weber R.J. « How the U.S. Treasury should auction its debt » in Federal Bank of
Minneapolis Quarterly Review , autumn (1992)
Communication de la Commission Européenne : Aide en faveur de l’électricité produite à
partir de sources d’énergie renouvelables (2005)
Ferrey S. (AAEP – World Bank) : Small Power Purchase Agreement Application for Renewable
Energy Development: Lessons from Five Asian Countries (2004)
Foray D. : Diversité, sélection et standardisation : les nouveaux modes de gestion du
changement technique - Revue d'Economie Industrielle (pp.257-274), (1996)
Global Sustainable Electricity Partnership : Community Electricity in Rural South Africa:
Renewable mini-grid assessment Renewable mini-grid assessment (2003)
Menanteau P., Finon D., Lamy M.L. (IEPE) : Prix versus quantités : Les politiques
environnementales d’incitation au développement des énergies renouvelables - CAHIER DE
RECHERCHE N° 25 (Mai 2001)
Mumssen Y., Johannes L., Kumar G. : Output-Based Aid, Lessons learned and best practices
- The World Bank - (2010)
Reiche, Covarrubias, and Martinot : The world Bank (2008)
Weitzman M.L. « Prices versus Quantities » in The Review of Economic Studies vol 41, issue
4, p 477-491 (1974)
Articles
Ben Jannet Allal H., de Perthuis C., Pouffary S. « Le Mécanisme de Développement Propre
dans les pays méditerranéens ; comment accélérer la mise en œuvre ? » Liaison Energie-
Francophonie n°71 (2006)
Pouffary S. « Le financement des énergies renouvelables et de la maîtrise de la demande en
Méditerranée : Réalités, perspectives et opportunités » Medénergie n°23/24 (2007)

Training manual for the Regional ECREEE Training Workshop on National Renewable Energy Policy and Incentive Schemes
44
Chabot B. « Du coût global à la rentabilité différentielle : une nécessité pour le
développement durable, une opportunité pour les économistes du bâtiment » E&C n°142
(2007)
Presentations
Viard E. (AFD) « Plan Solaire Méditerranéen : Le financement de projets novateurs »
Conférence sur le PSM, Paris (22 Novembre 2008)
Cornut B. (ADEME) “Escaping from the trap of social tariffs: Integrating the reforms as an
energy policy : The case of Lebanon” Séminaire Maîtrise de l’énergie (15 mars 2004)
Mostert W. “Financing grid-connected renewable energy systems in developing countries”,
Danish Conference on Renewable Energy Sønderborg, (September 17-19, 2003)
Laws:
FEED-IN-TARIFFS POLICY ON WIND, BIOMASS AND SMALL-HYDRO RESOURCE GENERATED
ELECTRICITY March 2008, MINISTRY OF ENERGY, KENYA
FEED-IN-TARIFFS POLICY ON WIND, BIOMASS SMALL-HYDRO, GEOTHERMAL, BIOGAS AND
SOLAR RESOURCE GENERATED ELECTRICITY revised January 2010, MINISTRY OF ENERGY,
KENYA

Training manual for the Regional ECREEE Training Workshop on National Renewable Energy Policy and Incentive Schemes
45
ECREEE Secretariat
Achada Santo Antonio
C.P. 288, Praia, Cape Verde
Tel: +238 2604630
E-mail: [email protected]
Web: http://www.ecreee.org
ECREEE is supported by: