ection introduction - nse · works on corporate finance and capital structures. ... under...
TRANSCRIPT

Stock Market Development and its Impact on the FinancingPattern of the Indian Corporate Sector
� Parthapratim Pal*
Introduction
During the late 1980s, the developing countries started liberalizing their financialsectors. Increased emphasis was put on the development of equity markets.India also followed this path. Stock markets grew rapidly in India during thelate 1980s and early 1990s. Capital markets have taken a prominent place in thedeveloping countries� financial system during the last decade.
Given this backdrop, it is important to assess the impact of stock markets on acountry�s economic development. One of the most obvious and direct effect ofthe stock market is on the corporate sector of a country. This study intends tofind out how the development of stock markets has affected the financing patternof the Indian corporate sector. This paper is organized in the following way.
Section 1 surveys the literature on the subject of stock market developmentand its impact on the capital structure of the firms in developing countries.This survey will prepare the groundwork for the empirical analysis in section2. Section 2 empirically investigates how the financing pattern of Indian firmshas changed with the development of stock markets in the country. The resultsfrom this section will then be compared with the results from the earlier studies.Section 3 tries to explain the findings of section 2 in the Indian context.
Section 1: Corporate Financing Pattern in Developing
Countries � A Literature Survey.
This section reviews the empirical literature on stock market development and firmfinancing choices in developing countries. This section will not review the theoreticalworks on corporate finance and capital structures. There are several studies thathave reviewed this vast theoretical literature on capital structure. Some of the mostextensive ones are Harris and Raviv (1991) and Samuel (1996)i . This section willreport the empirical findings of the capital structure of the developing countries.However, before proceeding further we briefly look at some of the aspects ofcorporate finance.
Theory of Corporate FinanceAccording to the neo-classical irrelevance theorems (Modigilani and Miller, 1958),the financial structure should not matter at all in determining either the valuation of
the firm, or more generally, the pattern of investment. This theory shows thatin fully developed capital markets, under neo-classical assumptions of perfectcompetition, no transactions cost and no taxation, even in a world of uncertainty,the stock market valuation of the firm is independent of its financing decisionsand the pattern of investment. This is because in perfectly competitive marketsthe same product (a firm) will be priced equally in separate markets (debt andequity). Therefore there can be no advantage to firms or their asset holdersderived from the firms� capital structure. Therefore, with taxes favoring debt,firms would tend to choose 100% debt structure. This result was at greatvariance with the actual behavior of firms. Subsequent studies and modelsattempted to reconcile this conclusion with reality by relaxing variousassumptions of the MM mode and incorporating the concept of imperfectinformation into the model. It has been recognized that apart from imperfectinformation, three other factors are important in determining the capitalstructure: taxes, agency costs, and bankruptcy costs.
However, since then significant progress has been made in the area of imperfectinformation in financial markets. This has given birth to various new theoriesof corporate finance which has modified the conclusions of the Modigilani andMiller. The new theories of corporate finance recognize the importance of thecapital structure on the real economy. One of the most prominent theories ofcapital structure, based on asymmetric information is the �Pecking Order theoryof Finance�. We briefly summarize the main conclusions of this theory here.
Pecking Order theory of FinanceBased on asymmetric information, that managers of a firm have more knowledgethan investors, S. C. Myers (1984)ii has developed the pecking-order theory ofcorporate finance. The pecking-order theory can be summarized as
1. Firms prefer internal finance.2. If external finance is required, firms issue the safest security first. That is,
they start with debt, then possibly hybrid securities like convertible bonds,then as a last resort equity.
According to the Pecking Order theory, retentions are the most efficient wayto finance a firm as the only cost they incur is that because of paying lowerdividends, the share price may be kept lower than it otherwise could be butdividends are not the only factor which determines stock prices. However,very often, especially for start-up and rapidly growing firms, retentions as wellas marketable securities can provide only a small portion of needed investment.Then the enterprise has a choice: whether to borrow more long-term, short-term or issue equity and in what proportion. There are many types of longterm debt and short term debt, such as bank loans, bonds, convertible bonds,commercial paper, trade credits and there are two main types of equity: common
1 2
* Assistant Professor Indian Institute of Foreign Trade. The author gratefully acknowledges the researchgrant obtained from NSE for this paper. The views expressed in this paper and approach suggested are ofthe author & not necessarily of NSE.i Cherian Samuel (1996): Internal Finance and Investment: Another Look, World Bank PolicyResearch Working Paper, 1663.Harris, M. and A. Raviv (1991): "The Theory of Optimal Capital Structure" Journal of Finance,48: 297-356. March
ii S. C. Myres, �The Capital Structure Puzzle� Journal of Finance, July 1984.

and preferred. To choose the right financing mix, the enterprise will assess costsand benefits, risks and returns of various types of instruments and choose thebest one using its own experience and external advice from a commercial orinvestment bank. It is impossible to say in absolute terms what is better: debtor equity, short-term debt or long-term debt. Each has its unique advantagesand disadvantages which are exposed in different ways in various environmentsand at various times and which play an important and unique role. It can be saidthough that in terms of issuance costs (which is one of the key factors undernormal conditions) retentions are the cheapest, then come trade credits, themshort-term credits, then bank loans, then private issues of bonds, convertiblebonds, and equities and finally public issues of bonds, convertible bonds andequity, in that order. This generally corresponds to the pecking order describedabove.
Literature Survey on Financing Pattern of Developing Countries
Empirical research in the filed of financing pattern of companies is pioneeredby Colin Mayer. In a series of papers Mayer (Mayer 1988, 1989, 1990 iii )empirically investigated, on a comparable basis, corporate financial structuresfor the period between 1970 and 1985 for 8 (5 countries for the 1988 study)industrialized economies.
He found the following stylized facts about corporate finance in developedcountries:� Retentions are the dominant source of finance in all countries, especially
in the UK, Canada and US. In the UK and USA more than three-quartersof investment is funded from retentions.
� Companies do not raise a substantial amount of finance from the securitiesmarket in any country. On a net basis, the contribution of short-termsecurities, bonds and shares taken together is only about 13% in USA. InGermany and USA net amounts raised from these three sources werenegative.
� Despite having very developed capital markets, according to Mayer (1988),in UK and USA, the stock market has made the lowest net fundingcontribution among the five countries studied.
� Securities markets have declined in significance, as a source of finance, forindustries in UK. Results by Taggart, quoted in Mayer (1989), also showsthat similar conclusions can be drawn about the US industries also.
� Banks are the dominant source of external finance in all countries,particularly in continental Europe and Japan.
� There is a strong inverse relationship between shares of retentions andbank credit (both are mainly used for long-term investment).
� Securities markets have declined and trade credits have grown inimportance over the post-war period, bond markets are relativelysignificant source of finance only in the US and Canada while equitymarkets� contribution to funding industry has been insignificant ornegative (as in the US and UK due to net repurchases of shares bycorporations).
� Small and medium-size firms are considerably more reliant on externalfinance than large firms, but obtain a lesser share of funds from securitiesmarkets and a greater share from commercial banks.
These observations can describe a corporate financial pattern of a �typical� developedcountry firm. Table 1 gives Mayer�s findings.
Table 1: Industrial Countries Unweighted Average Net Financing ofNon-financial Enterprises (1970-85)
Canada Finland France Germany Italy Japan UK USA
Retentions 76.4 64.4 61.4 70.9 51.9 57.9 102.4 85.9
Capital 0 0.2 2.0 8.6 7.7 0 4.1 0Transfers
Short-term -0.8 3.7 -0.1 -0.1 -1.3 NA 1.7 0.4Securities
Loans 15.2 28.1 37.3 12.1 27.7 50.4 7.6 24.4
Trade -4.4 -1.4 -0.6 -2.1 0 -11.2 -1.1 -1.4Credit
Bonds 8.5 2.8 1.6 -1.0 1.6 2.1 -1.1 11.6
Shares 2.5 -0.1 6.3 0.6 8.2 4.6 -3.3 1.1
Other 1.3 7.4 -1.4 10.9 1.0 -3.8 3.2 -16.9
Statistical 1.2 -5.0 -6.4 0 3.2 NA -13.4 -5.1Adjustment
Total 99.9 100.1 100.1 99.9 100 100 100.1 100
Source: Mayer (1990)
Another study by Corbett and Jenkinson (1994)iv investigates the financingpattern in developed countries for the period 1970-89. The major findings ofthis study are
3 4
iii Mayer, Colin (1988), �New Issues in Corporate Finance� in European Economic Review, 32,1167-1189.
Mayer, Colin (1989), �Myths of the West: Lessons from Developed Countries for DevelopmentFinance� World Bank Working Paper no. 301.
Mayer, Colin (1990), �Financial Systems, Corporate Finance and Economic Development� inAsymmetric Information, Corporate Finance and Investment, R. Glen Hubbard, Editor, The Universityof Chicago Press, Chicago and London.
iv Corbett, J. and T. Jenkinson (1994): �The financing of Industry, 1970-89: an InternationalComparison�, CEPR Discussion Paper 948.

� The most important source for all firms in all countries is internal finance.� Issues of securities and bonds do not provide large amounts of finance in any
country.� The most important source of external finance is bank lending to firms� Internal finance is more important in the US and in the UK than countries
like Japan� Italy and France, where bank credit is more important.
Table 2 gives a summary of Corbett and Jenkinson�s findings.
Table 2: Gross Sources of Finance (Percentage of Total Finance)
Period 1970-89 Germany Japan U. K. U.S.
Internal Finance 62.4 40.0 60.4 62.7Bank Finance 18.0 34.5 23.3 14.7Bonds 0.9 3.9 2.3 12.8New Equity 2.3 3.9 7.0 -4.9Trade Credit 1.8 15.6 1.9 8.8Capital Transfers 6.6 0 2.3 0Other 8.0 2.1 2.9 5.9
Source: Corbett and Jenkinson.
IFC (1991)v analyzes the corporate financial structure in developed anddeveloping countries. It also examines corporate financing pattern within thedeveloping countries. This analysis is based on flow of funds data for G-7 groupof developed countries and balance sheet data for nine developing countries forthe period 1980-88. Data for top 50 publicly traded firms are used in this analysis.Regarding the financing pattern of developing countries, this study has reachedfollowing conclusions.� Retentions are less important in developing countries than developed
countries. This study finds out that the highest internal finance ratios indeveloping countries are well below the average in the developed worldvi .
� Firms in developing countries rely to a much greater extent on externalfinance than firms in developed countries.
Firms in developing countries are found to be more dependent on new equityfinance for their corporate growth. Moreover, the importance of equity,according to this paper, is rising in the developing countries, while it is fallingin the developed world.
Jack Glen and Brian Pinto (1994)vii argue that LDC corporations are found tobe cost-minimizing, but subject to some specific government-related constraints.Government controls not only limit the potential menu of instruments, but frequentlycircumscribe the issue and pricing of permitted instruments. However, theseconstraints are disappearing with financial markets development.
This study also investigated the capital structure for seven developing countries forthe period 1980-92. For each country they used the financial statement informationfor the top 100 publicly traded companies. They find that the use of capital marketsas a source of external finance has soared in the 1990s. According to their calculations,for these seven developing countries, new issues of equity and corporate debt were19 and 41% higher in 1992 than in 1990.
However, empirical evidence suggests that there remains significant difference inthe capital structure of the sample countries. In Brazil, more than two-third of totalfinancing is accounted for by equity whereas India, Pakistan and Korea carriedrelatively low levels of equity. Figure 1 illustrates the difference in capital structurefor the sample firms in the seven developing countries. According to Glen andPinto, the variations in the capital structures across countries over time reflect thediversity of financial markets, tax codes and investor preferences.
Figure 1
5 6
v IFC (1991): Financing Corporate Growth in the Developing World, IFC Discussion Paper, No.12.vi One study by Atkin and Glen (1992) of a set of developing countries has found that internallygenerated finance accounts for about 12 to 58% of total financing in these countries.
vii Glen, Jack and Brian Pinto (1994): �Debt or Equity? How Firms in Developing CountriesChoose�, IFC Discussion Paper 22.
0
20
40
60
80
100
Per
cent
Brazil
India
Jordan
Korea
Malaysia
Mexico
Pakistan
Turkey
Zim
babwe
Emerging Market Companies Capital Structure, 1980-90
Equity Long term Liability Current Liability
Source: Glen and Pinto.
7 8
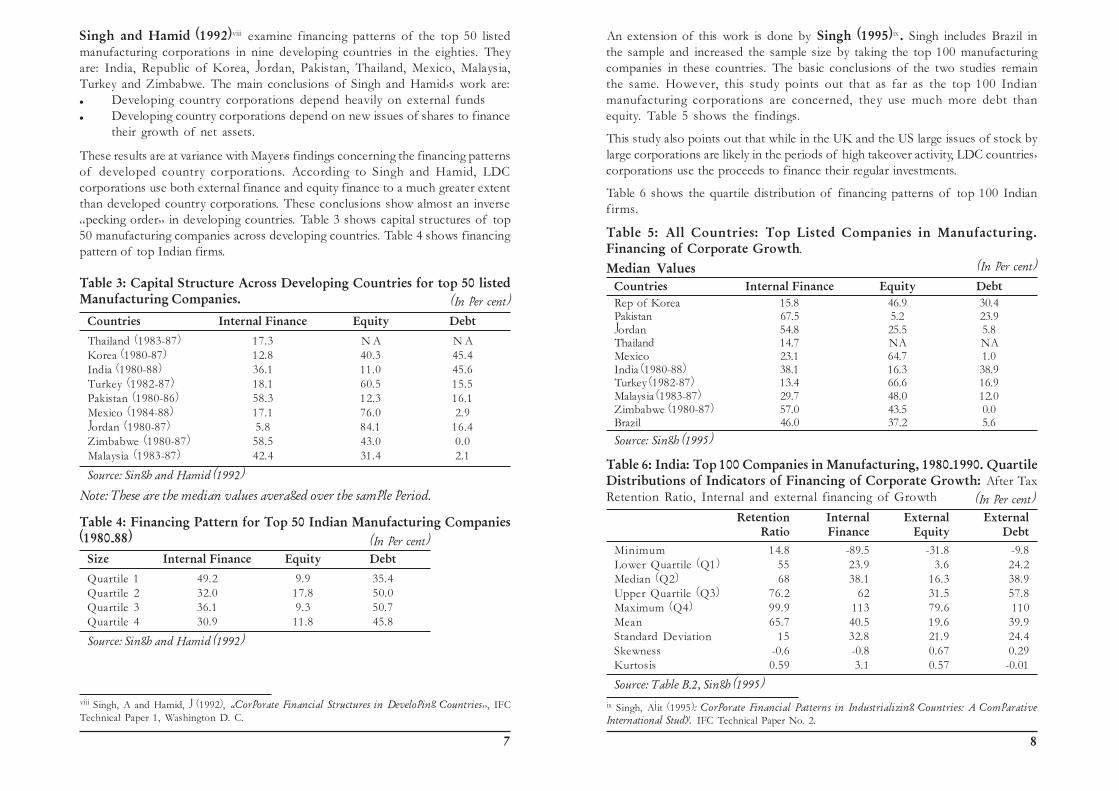
Singh and Hamid (1992)viii examine financing patterns of the top 50 listedmanufacturing corporations in nine developing countries in the eighties. Theyare: India, Republic of Korea, Jordan, Pakistan, Thailand, Mexico, Malaysia,Turkey and Zimbabwe. The main conclusions of Singh and Hamid�s work are:� Developing country corporations depend heavily on external funds� Developing country corporations depend on new issues of shares to finance
their growth of net assets.
These results are at variance with Mayer�s findings concerning the financing patternsof developed country corporations. According to Singh and Hamid, LDCcorporations use both external finance and equity finance to a much greater extentthan developed country corporations. These conclusions show almost an inverse�pecking order� in developing countries. Table 3 shows capital structures of top50 manufacturing companies across developing countries. Table 4 shows financingpattern of top Indian firms.
Table 3: Capital Structure Across Developing Countries for top 50 listedManufacturing Companies.
Countries Internal Finance Equity Debt
Thailand (1983-87) 17.3 N A N AKorea (1980-87) 12.8 40.3 45.4India (1980-88) 36.1 11.0 45.6Turkey (1982-87) 18.1 60.5 15.5Pakistan (1980-86) 58.3 12.3 16.1Mexico (1984-88) 17.1 76.0 2.9Jordan (1980-87) 5.8 84.1 16.4Zimbabwe (1980-87) 58.5 43.0 0.0Malaysia (1983-87) 42.4 31.4 2.1
Source: Singh and Hamid (1992)
Note: These are the median values averaged over the sample period.
Table 4: Financing Pattern for Top 50 Indian Manufacturing Companies(1980-88)
Size Internal Finance Equity Debt
Quartile 1 49.2 9.9 35.4Quartile 2 32.0 17.8 50.0Quartile 3 36.1 9.3 50.7Quartile 4 30.9 11.8 45.8
Source: Singh and Hamid (1992)
viii Singh, A and Hamid, J (1992), �Corporate Financial Structures in Developing Countries�, IFCTechnical Paper 1, Washington D. C.
An extension of this work is done by Singh (1995)ix . Singh includes Brazil inthe sample and increased the sample size by taking the top 100 manufacturingcompanies in these countries. The basic conclusions of the two studies remainthe same. However, this study points out that as far as the top 100 Indianmanufacturing corporations are concerned, they use much more debt thanequity. Table 5 shows the findings.
This study also points out that while in the UK and the US large issues of stock bylarge corporations are likely in the periods of high takeover activity, LDC countries�corporations use the proceeds to finance their regular investments.
Table 6 shows the quartile distribution of financing patterns of top 100 Indianfirms.
Table 5: All Countries: Top Listed Companies in Manufacturing.Financing of Corporate Growth.
Median ValuesCountries Internal Finance Equity DebtRep of Korea 15.8 46.9 30.4Pakistan 67.5 5.2 23.9Jordan 54.8 25.5 5.8Thailand 14.7 NA NAMexico 23.1 64.7 1.0India (1980-88) 38.1 16.3 38.9Turkey (1982-87) 13.4 66.6 16.9Malaysia (1983-87) 29.7 48.0 12.0Zimbabwe (1980-87) 57.0 43.5 0.0Brazil 46.0 37.2 5.6
Source: Singh (1995)
Table 6: India: Top 100 Companies in Manufacturing, 1980-1990. QuartileDistributions of Indicators of Financing of Corporate Growth: After TaxRetention Ratio, Internal and external financing of Growth
Retention Internal External ExternalRatio Finance Equity Debt
Minimum 14.8 -89.5 -31.8 -9.8Lower Quartile (Q1) 55 23.9 3.6 24.2Median (Q2) 68 38.1 16.3 38.9Upper Quartile (Q3) 76.2 62 31.5 57.8Maximum (Q4) 99.9 113 79.6 110Mean 65.7 40.5 19.6 39.9Standard Deviation 15 32.8 21.9 24.4Skewness -0.6 -0.8 0.67 0.29Kurtosis 0.59 3.1 0.57 -0.01
Source: Table B-2, Singh (1995)
ix Singh, Ajit (1995): Corporate Financial Patterns in Industrializing Countries: A ComparativeInternational Study. IFC Technical Paper No. 2.
(In per cent)
(In per cent)
(In per cent)
(In per cent)

9 10
Using Singh and Hamid�s (1992) data, Demirgrüç-Kunt (1992)x investigatedthe relationship between stock market development and financing pattern ofcorporations in developing countries. The question posed in the paper is whetherdebt and equity finance are complements or substitutes. Based on IFC data,Demirgrüç-Kunt suggests that there exists a positive and very significantcorrelation between firm leverage and extent of stock market development.From this observation, the paper concludes that equity and debt finance arecomplementary and the existence of active stock markets results in an increasedvolume of business for the financial intermediaries.
Demirgrüç-Kunt and Maksimovic (1994)xi test and find support for agency-theory and tax-based models of capital structure for the sample of the same tencountries used in Singh (1995). They have used annual data for the period 1980-91. It is found that total indebtedness is negatively related to the proportion ofNet Fixed Assets in Total Assets. It is also found that firms, with assets thatcould be used as collateral, do not, in general issue long-term debt. They useretained earnings or issue equities to finance themselves. According toDemirgrüç-Kunt and Maksimovic this implies that long-term credit marketsdo not function effectively in the sample countries .
Demirgrüç-Kunt and Maksimovic (1995, 1996)xii in a series of papers explorethe effect of the level of financial market development on the financial choicesof the firms. In this study, they use data for thirty industrial and developingcountries for the period 1980-1991. These studies use some indicators as proxymeasures of financial and specially equity market development. Then it isexamined how these indicators affect firms� financial choices.
The findings of these studies suggest that stock market development, fordeveloping countries and especially at its early stage of development, does notlead to lesser leverage � instead, the development of the stock market leads torisk sharing and better aggregation of information for the firms. This allowsfirms to increase their borrowings. Thus, equity finance and debt finance havebeen found to be complements for developing countries. According to thesestudies, for developing countries, stock market development is not an obstacleon the way of obtaining debt, but, on the contrary, it promotes the increase ofdebt in the capital structure of the firms. However, for developed countries ithas been found out in this study that further development of equity marketleads to a substitution of equity financing for debt financing.
Unlike Singh (1995) and Singh and Hamid (1992) who use accounting data for100 largest manufacturing firms, Cobham and Subramaniam (1995)xiii useaggregate accounting data for 1500 firms from the Reserve Bank of India (RBI)data set. Using this dataset based on sectoral and cumulative firm-level data forIndia, this study finds that:a. there was no difference in the financing of large and small corporationsb. smaller Indian companies, including companies that are not listed, issue
large amounts of equity to finance their investment.
Based on these observations, the study concludes that bank loans and internal financeare more important sources of corporate financing for Indian firms. It also findsout that India is not very different from the low internal finance developed countriesand that, since a large part of equity issues are by unlisted firms, the gains from thepromotion of stock markets may be limited.
Table 7 presents Cobham and Subramaniam�s findings.
Table 7: Averages of Annual Sources of Finance as a Percentage of TotalFinance for the Period 1981-90.
Source All Firms Large Firms Small Firms
Internal 43.7 46.9 34.0Equity 7.1 7.2 7.0Total Borrowings 49.1 45.9 59.0Debentures 12.3 13.7 7.0Bank Loans 16.7 13.9 26.0
Source: Cobham and Subramaniam (1994)
Total Borrowings =Debentures + Bank Loans + Other Borrowings.
Samuel (1996)xiv has done a comparative study of financing pattern of Indianand U.S. firms. For India, Samuel�s analysis is based on two sets of data. Thefirst set of data is from the publication titled �Report on Currency and Finance�published by the Reserve Bank of India (RBI). RBI data for medium and largefirms for the period 1972-1991 is used for the analysis. The second set of data isfrom the Industrial Credit and Investment Corporation of India (ICICI). Thesedata are taken for the period 1972-93. For U.S. data Samuel has usedCOMPUSTAT database. This database consists of data of 510 firms for theperiod 1972-1992.
The main conclusions of Samuel�s study are as follows:� Indian firms are more dependent on external funds than their U.S.
counterparts.
x Asli Demirgrüç-Kunt (1992): �Developing Country Capital Structures and Emerging Stock Markets�-World Bank Policy Research Working Paper 933.xi Asli Demirgrüç-Kunt and Vojislav Maksimovic (1994): �Capital Structures in Developing Countries:Evidence from Ten Countries� � World Bank Policy Research Working Paper no. 1320.xii Asli Demirgrüç-Kunt and Vojislav Maksimovic (1995): �Stock Market Development and FirmFinancing Choices� � World Bank Policy Research Working Paper 1461.Asli Demirgrüç-Kunt and Vojislav Maksimovic (1996): �Stock Market Development and FinancingChoices of Firms� in The World bank Economic Review. Vol. 10, No. 2.
xiii David Cobham and Ramesh Subramaniam (1995): �Corporate Finance in Developing Countries:New Evidence for India� CRIEFF Discussion Paper Series no 9512, University of St. Andrews, Scotland.xiv Cherian Samuel (1996), �The Stock Market as a Source of Finance: A Comparison of U.S. and IndianFirms� World Bank Policy Research Working Paper 1592.

11 12
� External debt, debentures and creditors are more important to Indianfirms as a source of finance, while for U.S. firms, current liabilities aremore important.
� The role of the stock market as a source of finance is broadly similar forIndian and U.S. firms. Table 8 gives the summary of the financing patterndata for the U.S. and Indian firms.
� For Indian firms, external debt is an extremely important source of finance.While for U.S. firms internal finance is the most important source offinance. According to Samuel, this is an indication that Indian financialsystem is a bank-oriented one.
Table 8: Summary of Financing Patterns of Indian and U. S. firms
Medium firms Large firms All firms All firms-USA(RBI) (RBI) (ICICI) (COMPUSTAT)
Internal finance 41.7 38.4 37.6 51.0External debt 29.1 33.1 20.4 9.8External Equity 3.7 6.1 4.5 4.0
Time-period 1972-91 1977-93 1981-93 1972-92
Source: Samuel (1996).
Though there are some methodological differences between the studies doneby Samuel and Singh and Singh and Hamid, the broad conclusions are onsimilar lines.
Conclusions
The above discussion shows that there are significant differences between thefinancing pattern of firms of developed and developing countries. Firms ofdeveloping countries tend to rely much more on external finance than theirdeveloped country counterparts. Also, the contribution of equity market, as asource of finance, is much higher in the developing country firms. Theseobservations tend to go against the theoretical predictions. It is expected thatan underdeveloped and imperfect capital market will discourage the firms fromraising stock market finance and should induce the corporate sector to largelygrow from internal sources. In a paper Tirole (1981) has suggested that in anemerging market, where information gathering and dissemination activity isnot adequately developed, the pricing of most firms� shares will tend to bearbitrary and volatile. However, corporate sector of the developing countrieshas shown remarkably high degree of reliance on the stock market for theirfinancing. Singh (1995) has advanced some explanations for this apparentlycontradictory behaviour of the Indian corporate sector. According to Singh,this apparent anomaly can be explained in terms of the following facts:
The stock markets in developing countries grew rapidly in the 1980s and early1990s. This growth was a direct consequence of the active role played by the
developing country governments to promote the stock market. Internationalfinancial institutions were actively encouraging stock market growth also.
Several domestic and international factors also contributed to this rapid growthof the stock markets. Due to large increases in share prices and Price-Earningratios the relative cost of equity capital fell significantly.
During the 1980s there was a worldwide trend towards financial liberalizationand globalization of the stock markets. Due to domestic and internationalcompulsions most of the developing countries liberalized their financial marketsduring this period. Financial liberalization increased the relative cost of debtcapital. This made equity financing even more attractive.
To reconcile the apparent disparity between theory and empirical observations,another explanation has been forwarded. Historically, it has been observedthat firms in the US were using equity much more intensively as a source offinance at the beginning of the century. Using flow of funds data for the non-financial sector, Taggart (1985)xv has shown that during the period 1923-1929,US companies financed about 19% of their investments through the new equityissues. There has been a long-term decline in the equity financing of UScorporations since then. In the 1970s contribution of equity in total sourceshas come down to about 3%. To explain this phenomenon it has been pointedout that under-developed financial markets do not offer a freedom of choice ofcorporate financing instruments. This forces the firms to accept second-best,sub-optimal capital structures. However, as capital markets and banking systemsevolve over time, the financing choices expand and firms� corporate financingpatterns approximate the optimal pecking order as predicted in the theory.
Most of the studies mentioned in the above discussion have covered the periodupto 1992-93. However, there has been a significant change in the behaviour ofthe capital market in India after this period. In particular, the entry of theForeign Institutional Investors (FII) had a huge impact on the domestic stockmarket of India. This study now investigates the corporate financing patternof Indian firms for the period 1989-1998.
xv Quoted in Singh (1995), page 62.
Section 2: Empirical Findings
This section studies the corporate financing pattern of Indian firms for theperiod 1989-1998. All the previous studies done on the corporate financingpattern of Indian firms have used either the ICICI sample or the RBI sample.IFC-World Bank studies are done on the basis of the top 50 companies only.Also most of the studies have covered the period upto 1994-95. From theaggregate level data it can be observed that there has been a significant change in
(In per cent)

13 14
the behaviour of the capital market after 1994-95. This set of samples not onlycovers the period upto 1998, it also provides a wider coverage.
For the analysis in this section balance sheet data for the companies has beenused. Six sets of sample have been used. First, companies that made the BombayStock Exchange Sensitivity Index (BSE Sensex) have been selected. This sampleis called the �Sensex�. In a related sample, we have removed three companiesfrom this sample that are financial service providers. This has been done toremove any bias that might have crept in the analysis of sources and uses offunds. This modified sample is called the �Modified Sensex�. To assess therole of stock market on the smaller companies, data of CNX Mid-Capcompanies have been used as the third sample. CNX Mid Cap is an index thatcovers the companies with an average market capitalization (over the preceding12 months) between Rs.1500 million and Rs.15, 000 million. This sample iscalled �Mid Cap�. Another two samples have been taken to focus exclusivelyon the manufacturing sector. The first sample here is the total manufacturingsector, as reported by CMIE. This sample is called �Total Mfg�. Secondly, theCMIE index of manufacturing sector has also been used. This sample is called�CMIE Mfg�. Data for Sensex, Modified Sensex Mid-Cap and CMIE Mfg iscollected from the �Prowess� database by CMIE. Finally, a sample of top 50Indian business houses has been taken. This sample is called �Top 50�.
Table 1 gives brief description of the samples. It should be mentioned here that forthe discussion of this section, year indicates fiscal year (i.e. 1989 means fiscal yearending at March 1989). All the ratios for sources of funds calculated fromPROWESS are weighted averages of company-wise ratios.
Table 1: Brief Description of the Samples used in this Study
Sample Characteristics
1. Mfg. Total All companies from CMIE dataset. Contains both listed and non-listed companies from the manufacturing sector.Data taken from CMIE Economic Intelligence Service publicationtitled �Corporate Sector� May 1999. Data for the period 1989-91is taken from CMIE PROWESS database.
2. Mfg Index A sample of listed companies from �Mfg Total�. These companiesconstitute the CMIE manufacturing index. This has companiesfrom various size groups.
Data taken from CMIE PROWESS database.
3. Sensex A set of large companies used by Bombay Stock Exchange tocalculate the �BSE Sensex 30� index. Contains companies fromboth manufacturing and other sectors. Data taken from�PROWESS�.
4. Modified Sensex A subset of Sensex without three companies which are financialservice providers. They are ICICI, IDBI and State Bank of India.Data taken from �PROWESS�.
It is to be noted that before 1992, Sensex and Modified Sensex are thesame set of companies.
5. CNX Mid Cap A set of medium sized companies. These companies constitute the�CNX CRISIL MidCap 200� Index. The average annual marketcapitalization of a company, for inclusion in the Index, must rangebetween Rs. 1.5 billion (US$ 35 million) and Rs.15 billion (US$353 million). Data taken from �PROWESS�.
6. Top 50. A set of top fifty companies reported by CMIE �Corporate Sector�May 1999.The top companies are chosen on the basis of sales and the assetof a company over a three-year period.Data taken from CMIE Economic Intelligence Service publicationtitled �Corporate Sector� May 1999.
Table 2 gives the descriptive statistics of the samples. Here �Total Assets� of acompany is taken as a proxy for the size of a company. Descriptive statistics for thesample �Top 50� is not available, as it has not been reported in the source publication.
Table 2: Descriptive Statistics of �Total Assets� of the Samples
(in Rs. crore)Sensex 1998 1994 1989
Mean 12105.92 6326.89 902.27Median 4539.08 2257.24 1428.76Standard Deviation 32976.44 20199.87 1034.87Minimum 198.66 28.63 15.28Maximum 179672.66 111531.33 3723.03
Modified Sensex 1998 1994 1989
Mean 4909.51 2223.2 902.27Median 3565.5 1187.9 1428.76Standard Deviation 5528.54 2668.64 1034.87Minimum 198.66 28.63 15.28Maximum 24387.9 10198.74 3723.03
Mid-Cap Companies 1998 1994 1989
Mean 1348.94 632.62 174.95Median 340.61 194.41 23.34Standard Deviation 2466.8 1159.94 197.03Minimum 19.61 0.17 3.88Maximum 21040.85 10254.95 920.67
Mfg Total 1998 1994 1989
Mean 179.24 106.94 102.42Median 12.48 49.1 20.75Standard Deviation 1060.6 623.46 457.14Minimum 0.01 0.01 0.01Maximum 34712.07 22374.15 10531.09

15 16
Capital Market as a Source of Finance.
The Indian capital market has experienced rapid growth during the late 1980sand early 1990s. It was expected that this rapid development of capital marketin India would help the corporate sector to raise cheap capital to finance theirinvestment.
�Capital Market� as defined by the PROWESS database is an aggregate of financeraised through four channels. They are a) Fresh capital (excluding Bonus issue)b) Share premium c) Debentures/bonds and d) Fixed deposits.
The following figure shows the percentage of finance raised through the capitalmarket.
Figure 1
Percentage of Funds Raised through Capital Market
Mfg Index 1998 1994 1989
Mean 624.5 336.67 226.17Median 77.25 142.28 44.84Standard Deviation 2288.98 1291.72 771.76Minimum 0.06 0.01 3.51Maximum 34712.07 22374.15 10531.09
Source: CMIE PROWESS Database
Results on Sources of Funds
The previous section has shown that developing countries rely much more onexternal finance than developing countries. Data from our sample tend tosupport this hypothesis. The following table gives the share of external financein total financing for sample companies.
Table 3: Share of External Finance in Total Finance(In per cent)
1989 1990 1991 1992 1993 1994 1995 1996 1997 1998
Sensex Companies 61.9 69.0 59.0 80.5 75.4 72.3 70.4 73.5 70.3 61.2Modified Sensex 61.9 69.0 59.0 72.1 72.0 67.5 66.0 54.9 61.6 39.1CNX Mid Cap 74.5 71.3 66.7 74.1 74.2 79.4 72.1 63.9 71.6 72.7CMIE Mfg 67.6 71.6 62.6 69.2 71.0 72.9 69.6 66.5 71.2 62.7Total Mfg CMIE 61.8 73.7 69.3 75.1 75.7 77.4 74.7 71.6 73.8 68.1Top 50 71.0 76.3 74.4 75.1 67.6 68.5 63.8
Table 3 shows that external finance has remained the dominant source offinancing for all the samples. Though there is a slight decline in its share in post1995 era, on an average basis, external finance accounted for more than 60% ofa firm�s total financing for all the samples. This result is consistent with thefindings of the studies cited in Section 1.
However, the statistical analysis of table 2 reveals that though these samplesare highly correlated, there exist statistically significant differences between thesample means.
Therefore to conclude it can be said that:
Indian firms, irrespective of size, are more reliant on external sources fortheir financing needs.
It is also important to understand how the different components of externalfinance have changed over the years. In PROWESS database external finance isan aggregate of financing from three broad sources, viz. capital markets,borrowing and current liabilities. To understand how the development of stockmarket in India has influenced the financing pattern, it is important to investigatefinancing through capital markets and borrowings.
Figure 1 reveals that there has been a spurt in the percentage of funds raisedthrough capital markets during the period 19991-94. However, after 1994, adeclining trend can be observed. On an annual average basis, for the period1994-98, the samples show marginal and sometimes even negative rate of growth.For this period, annual average rate of growth of percentage of funds raisedthrough capital market is 5.46% for Sensex, -3.85% for Modified Sensex, 4.22%for Mfg Total, 1.25% for Mfg Index and �0.09% for Mid Cap.
Though the samples cover a wide range of companies, the figure shows thatthere is a similarity in movement for all the samples over the concerned period.Statistical analysis shows that all these samples are highly correlated. Table 4shows the correlation coefficients between percentage of funds raised throughcapital markets for various samples.
(In
per
cent
)
0
10
20
30
40
50
60
1989
1990
1991
1992
1993
1994
1995
1996
1997
1998
Sensex Modified Sensex MfG TotalMFG Index Mid C ap top 50

17 18
Table 4: Correlation Coefficients for the Samples Sensex Modified MfG MFG Mid Top 50
Sensex Total Index Cap
Sensex 1.00
Modified Sensex 0.59 1.00
MfG Total 0.78 0.59 1.00
MFG Index 0.69 0.78 0.91 1.00
Mid Cap 0.57 0.69 0.60 0.75 1.00
Top 50* 0.59 0.93 0.92 0.93 0.69 1.00
* For this sample the correlation coefficients are based on 1992-98 data
Statistical analysis also shows that the differences of sample means between mostof the samples are statistically not significant. Some statistically significantdifferences exist between the sample mean of Sensex with that of Mfg Index andMfg Total. However, as these differences are not there for Modified Sensex, itcan be presumed that this is caused by the presence of three financial serviceproviders, ICICI, IDBI and SBI, in Sensex.
From the above observations it can be said that the capital market has notperformed too well as a source of finance in the later part of 1990s. After 1995there has been a decline in the importance of capital market as a source of financefor Indian firms. However, capital market has remained an important source offinance for most of the samples. Except for �Modified Sensex� and �Top 50� thecapital market contributes about 20% or more for other samples.
To conclude it can be said that:
1. All the samples in this analysis show that the after a spurt during1992-94, the importance of the capital market as a source of finance hasdeclined for Indian firms. However, the capital market still has importantcontribution in a firm�s financing choice in India.
As mentioned before, the source �Capital Market� is an aggregation of severalinstruments. Table 5 gives the breakup of each sample for the period 1989-98.Table 5 shows that for all the samples, debentures and bonds are the mostimportant source of finance from the capital market. During 1992-93 to 1994-95, the share of external equity (fresh capital + share premium) shot upsignificantly. However, after that there has been a decline in its importance.
Tab
le 5
: Sh
are
of D
iffe
rent
Cap
ital
Mar
ket
Inst
rum
ents
in
Tot
al S
ourc
eSe
nsex
1989
1990
1991
1992
1993
1994
1995
1996
1997
1998
Fre
sh c
apita
l2.
411.
350.
471.
062.
536.
001.
170.
40-0
.26
2.67
Shar
e pr
emiu
m6.
646.
232.
482.
3711
.47
23.0
021
.77
12.8
07.
922.
53D
eben
ture
s/bo
nds
7.27
24.4
813
.16
25.0
517
.45
21.6
118
.18
14.0
532
.02
27.6
3F
ixed
dep
osits
10.5
80.
71-1
.44
-0.1
80.
210.
240.
060.
020.
280.
64
Mod
ifie
d Se
nsex
1989
1990
1991
1992
1993
1994
1995
1996
1997
1998
Fre
sh c
apita
l2.
411.
350.
470.
862.
821.
635.
460.
15-0
.73
1.15
Shar
e pr
emiu
m6.
646.
232.
483.
5014
.73
19.3
030
.78
17.3
04.
075.
21D
eben
ture
s/bo
nds
7.27
24.4
813
.16
13.1
011
.54
22.5
23.
320.
5013
.87
2.53
Fix
ed d
epos
its10
.58
0.71
-1.4
4-0
.30
0.28
0.35
0.09
0.03
0.47
1.36
MfG
Tot
al19
8919
9019
9119
9219
9319
9419
9519
9619
9719
98F
resh
cap
ital
2.34
3.44
2.97
4.00
6.50
13.5
09.
803.
602.
905.
40Sh
are
prem
ium
2.28
2.70
2.89
2.30
12.4
018
.40
20.9
09.
204.
403.
00D
eben
ture
s/bo
nds
4.68
8.22
4.95
6.10
8.00
7.80
2.90
2.10
6.40
8.70
Fix
ed d
epos
its5.
021.
010.
972.
00-1
.50
1.50
1.10
0.30
1.40
2.20
MF
G I
ndex
1989
1990
1991
1992
1993
1994
1995
1996
1997
1998
Fre
sh c
apita
l2.
352.
282.
503.
334.
957.
387.
672.
191.
553.
20Sh
are
prem
ium
3.86
4.61
2.85
2.50
14.9
719
.94
24.9
89.
814.
401.
77D
eben
ture
s/bo
nds
15.8
47.
875.
276.
728.
3810
.22
3.28
2.95
8.98
11.6
4F
ixed
dep
osits
4.68
1.34
0.97
-0.2
10.
681.
701.
420.
361.
502.
34
Mid
Cap
1989
1990
1991
1992
1993
1994
1995
1996
1997
1998
Fre
sh c
apita
l3.
063.
694.
172.
896.
566.
210.
92-6
.80
2.11
2.85
Shar
e pr
emiu
m3.
447.
735.
001.
6413
.47
21.7
226
.04
7.43
6.54
1.74
Deb
entu
res/
bond
s29
.78
7.39
10.1
511
.29
12.2
413
.79
0.08
6.53
15.5
124
.23
Fix
ed d
epos
its1.
770.
060.
241.
020.
831.
600.
901.
203.
882.
14
Top
50
1992
1993
1994
1995
1996
1997
1998
Fre
sh c
apita
l2.
46.
97.
43.
65.
10.
94.
3Sh
are
prem
ium
3.1
20.1
27.1
26.0
10.7
4.5
0.9
Deb
entu
res/
bond
s11
.112
.112
.55.
01.
79.
39.
2F
ixed
dep
osits
-0.4
0.4
0.9
0.6
0.5
1.3
0.9
(In p
er c
ent)

19 20
The Equity Market as a Source of Finance
It has been noted above that there has been a sign of recovery in the share ofcapital market in total source of finance. However, Table 5 shows that for allthe samples, the contributions of equity related instruments have declined sharplyduring 1995-98.
Figure 2 shows the percentage of funds that has been mobilized through equityrelated instruments, viz. funds raised through fresh capital and share premium forall our samples for the period 1989-998. Detailed data for each sample is given inTable 5.
Figure 2
Percentage of Total Funds Raised through Equity Related Instruments
From figure 2 it can be seen that there has been a steep decline in proportion offunds raised through equity related instruments in the post 1994-95 phase. Onan annual average basis, for the period 1994-98, the Sensex has declined by45.3%, Modified Sensex by 47.6%, Mid Cap by 47.5%, Mfg Index by 51.08%,Mfg Total by 41.05% and Top 50 by 54.9%.
The pattern is similar for all the samples. Equity related instruments nowcontribute for less than 10% of total funds raised by all our samples.
Statistical analysis of the samples shows that all the samples are highly correlatedand the difference between the sample means are not statistically significant.
Table 6: Correlation Coefficients for the SamplesSensex Modified MfG MFG Mid Cap Top 50
Sensex Total Index
Sensex 1.00Modified Sensex 0.85 1.00MfG Total 0.95 0.89 1.00MFG Index 0.93 0.94 0.98 1.00Mid Cap 0.82 0.72 0.88 0.89 1.00Top 50 0.94 0.84 0.96 0.95 0.88 1.00
In India borrowing, debentures and other forms of debt have remained the majorsource of finance for the corporate sector. We define funds mobilized throughdebentures, bonds, fixed deposits and borrowing as �external debt�. Tables 7 and7A show the importance of external debt in the context of Indian corporatefinancing.
Table 7: External Debt as a percentage of Total Sources1989 1990 1991 1992 1993 1994 1995 1996 1997 1998
Sensex 35.75 44.83 21.64 61.99 41.93 1.55 38.73 33.13 41.55 46.50Modified 35.75 44.83 21.64 46.31 32.07 23.50 13.95 16.03 34.53 17.09SensexMfG Total 31.85 43.50 37.00 34.60 39.20 23.10 25.80 34.20 48.30 44.40MFG Index 42.11 41.82 33.56 32.01 42.86 23.28 24.12 32.87 48.34 48.22Mid Cap 49.73 30.26 35.83 52.19 47.06 23.71 34.47 43.97 46.00 55.57Top 50 42.3 39.1 19.2 30.2 31.3 49.3 48.3
Table 7A: External Debt as a percentage of External Sources1989 1990 1991 1992 1993 1994 1995 1996 1997 1998
Sensex 57.8 64.9 36.7 77.0 55.6 2.1 55.0 45.1 59.1 76.0Modified 57.8 64.9 36.7 64.3 44.5 34.8 21.1 29.2 56.1 43.7SensexMfG Total 42.8 61.0 55.4 46.7 52.9 29.1 35.8 53.5 67.4 61.0MFG Index 62.3 58.4 53.6 46.3 60.3 31.9 34.7 49.4 67.9 76.9Mid Cap 80.5 41.1 51.7 69.5 62.2 30.6 46.1 61.4 62.3 81.6Top 50 59.6 51.2 25.8 40.2 46.3 72.0 75.7
Tables 7 and 7A show that the debt related instruments and borrowings hasremained the most important source of finance for the Indian corporate sector.This result is consistent with Samuel�s observations.
From figure 2 and table 7 and 7a it seems that in the years after 1995, for financingof Indian corporate sector, there has been a shift away from equity relatedinstruments to external debt.
(In
per
cent
)
0.00
5.00
10.00
15.00
20.00
25.00
30.00
35.00
40.00
1989
1990
1991
1992
1993
1994
1995
1996
1997
1998
Sensex Modified Sensex MfG TotalMFG Index Mid Cap Top 50
(In per cent)
(In per cent)

21 22
Table 8 shows that the correlation coefficients between the share of external debtand equity related instruments are negative for all the samples.
Tables 8: Correlation Coefficient between External Debt and ExternalEquity*
Sensex Modified MfG MFG MidSensex Total Index Cap
Top 50
CorrelationCoefficient -0.62 -0.54 -0.70 -0.69 -0.66 -0.85
* Share premium + New Issues.
The above analysis indicates that external debt has remained the most importantsource of external finance for all the samples. It has become more important inthe post 1995 era. It seems from the data that Indian firms have substitutedexternal equity by external debt as their most important source of externalfinance.Figure 3 shows the period averages of financing pattern for all the samples. ForTop 50 the relevant time period is 1992-98. For rest of the samples it is 1989-98.
Figure 3
A Brief Look At the Financing Pattern of Different Industries in India
In the previous analysis, samples were taken on a cross section basis from all theindustries. The intention was to get a picture of the financing pattern of thecorporate sector as a whole. However, the samples were of overlapping natureand the possibility of bias due to strong presence of a few companies in all the
samples cannot be ruled out. To eliminate that source of bias, this study brieflyinvestigates the industry specific financing pattern of the Indian corporate sector.This set of sample is also taken from the PROWESS database.
The Sample
In the PROWESS database, the total manufacturing sector is divided into ninedifferent industry groups. They are: Food & Beverages, Chemicals, Diversified,Machinery, Metal, Non Metal, Textiles, Transport and Miscellaneous. Data istaken for the period 1991-1998. Like the previous set of samples, balance sheetdata are used here. A possible problem with this set of samples is that thesamples will be affected by industry specific factors. However, this study willnot go into the details of this factor, as the objective here is only to supplementthe results derived with the earlier sample and to check whether this set ofsample broadly conforms to the results derived from the earlier section.
Results
1. Average Financing Pattern for the Period 1991-98:The average financing patterns of different industries broadly conform to theresults derived in the earlier analysis. Though results from this set of sampleare less uniform than the previous set of samples. Fig 4 shows the financingpattern of the samples of different industries for the period 1991-98. Followingobservations can be made from Figure 4.
1. External finance is more important than internal finance for all theindustries. On an average basis, for the period 1991-98, the contributionof External Finance varies between 68% for Diversified to more than86% for Textiles.
2. External debt is an important source of finance for all the industries. Itcontributes more than 20% of total financing for all the industries. Thecontribution of External debt has been more than 45% for samples fromMetal and Textiles industries.
3. Current liabilities play an important role for the financing of theindustries1 .
4. For the sample period, the average contribution of the equity marketvaries from a low of around 12% for Chemicals to more than 21% for�Miscellaneous� industries.
1 According to the PROWESS database Current liabilities and Provisions include all liabilities thatare due within 12 months. It includes funds from sundry creditors, bills payable/acceptances, interestaccrued, provisions for taxation and dividend and share application amount among other things.
0
20
40
60
80
100
%
Sensex
Modified
Sensex
Mfg
Total
Mfg
Index
Mid C
ap
Top 50
Financing Pattern for Various Samples (Period Average)
Internal Finance Fresh capital Share premium
Debentures/bonds Fixed deposits Borrowings
current Liability
(In
per
cent
)

0
10
20
30
40
50
1991
1992
1993
1994
1995
1996
1997
1998
Food & Beverages Chemicals DiversifiedMachinery Metal MiscNon Metal Textiles Transport
23 24
0%
20%
40%
60%
80%
100%
Food &
Beverages
Chem
icals
Diversified
Machinery
Metal
Misc
Non
Metal
Textiles
Transport
Financing Pattern of Different Industries in India (Period Average of 1991-98)
Internal Sources Equity Market External Debt Current liabilities & provisions
2. Trend in the Financing PatternThe details of the financing patterns of these industries are given in Table 92 .The results are summarized here.
1. External source of finance has remained the dominant source of financefor all the industries during all the years in this time period. Contributionof external finance has remained stable over the years. On a trend basis, allthe samples exhibit less than 5% variation over the sample period 1991-98.
2. The contribution of capital markets peaked during 1993-95. For someindustries like Machinery and Textiles the contribution of the capitalmarket was highest in 1993 but for others it peaked in 1994-95. For all theindustries, the contribution of the capital market has declined after 1995.However, for a few industry groups like Diversified, Metal and Non-Metal,the declining trend has been reversed in 1998.
3. As far as the contribution of equity markets is concerned, the trend is verysimilar to the previous analysis. After reaching a peak in 1994-95, there hasbeen a decline in the contribution of equity market in almost all the industries.Figure 5 shows the contribution of equity market for different industrygroups. Figure 5 shows that there is a similarity in movement for all thesamples over the concerned period. Statistical analysis shows that movementsfor all these samples are highly correlated. Table 10 shows the correlationcoefficients for the samples.
However, significant inter-industry differences exist in the level of financingthrough the equity market. For Chemicals and Diversified the contributionof equity market is about 5% of its total financing whereas for Miscellaneousit is more than 15% in 1998.
Figure 5Contribution of Equity Market as a Source of Finance
(As a percentage of Total Sources)
2 Table 9 is given at the end of this section on pages 25-26.
Table 10: Correlation Coefficients for the SamplesFood & Che- Diver- Machi- Metal Misc Non Text- Tran-
Beverages micals sified nery Metal iles sport
Food & Beverages 1.00Chemicals 0.93 1.00Diversified 0.75 0.67 1.00Machinery 0.90 0.83 0.92 1.00Metal 0.80 0.65 0.88 0.81 1.00Misc 0.62 0.48 0.74 0.83 0.60 1.00Non Metal 0.93 0.84 0.53 0.74 0.67 0.47 1.00Textiles 0.89 0.83 0.83 0.97 0.76 0.83 0.81 1.00Transport 0.72 0.75 0.48 0.71 0.32 0.50 0.74 0.81 1.00
4. External debt plays an important role for all the industries. The contributionof external debt has increased for all the industries after 1994-95. However insome industries (like Transport and Machinery) significant year-to-year variationis observed. Correlation coefficients among the samples in this case are lowand sometimes negative.This set of samples also shows negative correlations between thecontribution of external debt and external equity over the sample period.Table 11 shows the results
Table 11: Correlation Between the Contribution of External Debt andExternal Equity for Different Industry Groups (1991-98)
Food & Chemi- Divers- Mach- Metal Misc Non Tex- Tran-Beverages cals ified inery Metal tiles sport
-0.41 -0.39 -0.63 -0.61 -0.48 -0.37 -0.29 -0.39 -0.55
(In
per
cent
)
Figure 4

25 26
5. Current liability and provisions play a very important role in the financingof the industries. For certain industries like Food and Beverages, Transport,Machinery and Textiles the contribution of Current Liabilities have beenvery high. However, as mentioned before, this component of financingconsists of many short-term liabilities and it is difficult to analyze thiscomponent of financing.
Conclusions
Therefore, to sum up, this section finds out that the financing pattern of thecorporate sector in India shows some broad similarity across the samples. Thefindings in this section are in similar lines with the findings of the earlier studiesdiscussed in section 1. The main results are obtained from these two sets ofsamples are:
1. External finance is more important as a source of finance for Indian firms.
2. The Importance of the capital market has declined as a source of finance after1995. However, the capital market still contributes significantly in the financingof Indian firms.
3. The contribution of external equity has declined after 1995.
4. External debt has remained an important source of finance for Indian firms.The importance of external debt has increased over the years.
5. Samples show negative correlations between the contribution of External Debtand External Equity.
These results indicate that equity related finance got a spurt in the early 1990s.The importance of equity as a source of finance peaked around 1994. After thatthere has been a shift away from equity related financing towards external debt.The next section will try to explain some of the findings of this section in thecontext of stock market development in India.
Table 9: Contribution of Major Sources of Financing (as a percentage oftotal financing) for Different Industry Groups
Capital Markets 1991 1992 1993 1994 1995 1996 1997 1998 Average(91-98)
Food & Beverages 10.89 13.38 26.28 40.70 24.07 13.11 14.40 14.29 19.64Chemicals 11.30 10.81 19.76 32.65 39.94 10.77 13.67 17.03 19.49Diversified 11.28 14.21 40.20 45.13 50.60 13.81 10.91 15.55 25.21Machinery 9.43 1.41 37.54 30.76 28.47 16.31 19.23 16.92 20.01Metal 21.03 20.54 16.92 69.07 26.17 23.92 20.72 28.84 28.40Miscellaneous 4.07 22.96 33.52 48.07 34.80 10.66 42.19 28.90 28.15Non Metal 4.70 7.55 26.28 37.14 47.08 18.90 17.89 35.93 24.43Textiles 6.36 15.37 40.35 36.24 40.09 19.81 25.12 14.87 24.78Transport 6.63 28.81 22.33 16.92 25.41 16.32 21.49 21.30 19.90
Equity Market 1991 1992 1993 1994 1995 1996 1997 1998 Average(91-98)
Food & Beverages 2.79 7.44 24.73 37.75 17.91 15.98 8.34 6.40 15.17Chemicals 4.36 5.32 14.14 26.87 31.94 8.43 5.62 4.28 12.62Diversified 10.33 6.03 30.54 30.66 46.77 9.42 0.32 5.29 17.42Machinery 4.06 5.88 23.75 31.75 26.53 13.61 13.37 6.28 15.65Metal 8.20 5.91 14.57 41.84 23.47 17.87 6.13 14.02 16.50Miscellaneous 3.67 4.53 30.96 41.78 27.64 12.50 35.59 15.61 21.54Non Metal 5.60 10.47 13.12 27.31 43.87 14.46 10.09 13.83 17.35Textiles 2.90 5.76 27.70 32.61 34.29 17.22 16.87 13.03 18.80Transport 3.61 11.03 20.57 12.90 26.67 15.70 13.11 8.54 14.02
External Debt 1991 1992 1993 1994 1995 1996 1997 1998 Average(91-98)
Food & Beverages 44.32 32.50 35.64 20.96 45.21 41.66 25.35 32.85 34.81Chemicals 38.71 4.83 42.98 18.96 23.53 35.11 49.06 49.96 32.89Diversified 16.95 36.85 27.23 16.94 20.18 37.12 45.28 26.59 28.39Machinery 30.97 39.44 40.34 3.12 19.93 33.16 38.80 27.62 29.17Metal 49.08 52.89 40.99 43.98 29.44 39.61 52.63 56.67 45.66Miscellaneous 21.32 42.72 22.62 14.48 40.86 35.66 36.67 50.83 33.14Non Metal 28.57 22.50 48.57 34.98 25.27 29.17 57.12 64.69 38.86Textiles 45.26 50.09 35.55 41.43 44.37 43.16 64.78 72.42 49.63Transport 36.43 36.15 26.15 -1.23 -3.41 10.52 53.59 27.74 23.24
Current liabilities 1991 1992 1993 1994 1995 1996 1997 1998 Average& provisions (91-98)
Food & Beverages 21.35 32.93 10.74 10.60 19.01 10.88 33.33 20.77 19.95Chemicals 22.72 54.52 14.45 28.44 5.82 27.93 24.62 17.61 24.51Diversified 31.19 26.78 13.92 27.72 11.32 22.79 24.63 19.94 22.29Machinery 41.65 36.45 11.05 36.49 30.40 30.22 14.29 26.94 28.44Metal 23.60 25.93 22.55 -3.47 19.58 8.60 19.48 9.36 15.70Miscellaneous 20.87 29.33 28.18 36.43 18.18 17.80 -7.77 19.77 20.35Non Metal 20.93 24.43 14.26 18.81 4.36 20.10 8.90 3.94 14.47Textiles 21.50 23.83 19.40 11.69 10.49 27.62 17.42 14.43 18.30Transport 30.11 29.01 37.09 67.07 55.06 44.75 -6.72 23.87 35.03
Source: CMIE PROWESS Database
External Sources 1991 1992 1993 1994 1995 1996 1997 1998 Average(91-98)
Food & Beverages 68.47 72.87 71.11 69.31 82.13 68.52 67.02 60.02 69.93Chemicals 65.79 64.67 71.57 74.27 61.29 71.47 79.30 71.86 70.03Diversified 58.47 69.67 71.69 75.32 78.26 69.33 70.23 51.82 68.10Machinery 76.68 81.77 75.14 71.36 76.85 77.00 66.45 60.84 73.26Metal 80.87 84.73 78.10 82.35 72.49 66.08 78.24 80.04 77.86Miscellaneous 45.86 76.57 81.76 92.69 86.68 65.96 64.49 86.21 75.03Non Metal 55.10 57.41 75.96 81.11 73.50 63.73 76.11 82.46 70.67Textiles 69.65 79.68 82.65 85.73 89.14 88.00 99.07 99.87 86.73Transport 70.15 76.20 83.81 78.74 78.32 70.96 59.98 60.15 72.29

0
5000
10000
15000
20000
25000
1970
1972
1974
1976
1978
1980
1982
-83
1984
-85
1986
-87
1988
-89
1990
-91
1992
-93
1994
-95
1996
-97
1998
-99
Rs.
cro
reOrdinary Shares Preference Shares Debentures
0
5000
10000
15000
20000
25000
30000
35000
1991-92 1992-93 1993-94 1994-95 1995-96 1996-97 1997-98 1998-99
27 28
Section 3: Primary Issues Market: The Indian Experience
Primary capital markets are the direct links between investors and issuers withinvestment needs. Therefore it is extremely important to understand how Indianprimary security markets has helped companies to mobilize resources.
Figure 1
Aggregate Resource Mobilization from the Primary Market
Source: RBI Annual Report, several issues.
Figure 1 shows that the Indian primary market really picked up in the early1990s. This upward trend continued upto 1994-95. In 1994-95, the aggregateresource mobilization1 from the primary market reached a peak of 31, 014crore. However, from 1995-96, there has been a steep decline in both the numberof new issues as well as the amount of money raised through them. In 1997-98,only Rs 4,657 crore rupees were raised through the primary market. Thisdeclining trend in the mobilization of resources in the primary market wasreversed in 1998-99. In 1998-99 Rs 9,365 crore was mobilized through theprimary market. This increase in the resource mobilized through the primarymarket was due to the higher level of capital mobilization by banks and financialinstitutions. Banks and financial institutions raised about 85 % of the totalcapital raised during 1998-99.
Money raised by non-government public limited companies (the privatecorporate sector) also shows a similar trend. Figure 2 shows new capital issuesby non-government public limited companies. From the figure it can be seenthat during the early 1990s there has been a huge jump in new capital issues bynon-government companies. Free pricing of equities and buoyant conditionsof the secondary market are the said to be the main factors behind this massiveincrease in the primary market activity.
Before 1992, Indian firms were required to obtain approval from the office ofController of Capital Issues (CCI) for raising capital. New companies wereallowed to issue shares only at par values. Only existing companies withsubstantial reserves were allowed to issue shares at a premium. This premiumwas decided on an estimated �fair value�. This act was repealed in May 1992.This allowed firms to price their issues without any intervention fromauthorities. This resulted in a sharp increase of capital mobilized through equityrelated instruments in the post 1992 phase. Money raised through new capitalIssues by non-government public limited companies grew at an annual averagerate of more than 43 % during 1991-92 to 1994-95 phase.
The amount raised through new issues peaked during 1994-95, after that therehas been a sharp declining trend in the capitalization by the Indian corporatesector. Table 1 shows the growth rates of the capital mobilized for differentperiods.
Table 1: Growth Rates of New Capital Issues by Non Govt. Public LimitedCompanies
1970-79 1980-90 1990-95 1995-99
Period Growth Rate 9.51% 32.39% 47.63% -49.61
Source: RBI Handbook of Statistics on Indian Economy, 1999
Figure 2
New Capital Issues by Non Govt. Public Limited Companies
1 Including funds mobilized by banks, private placements, non government public limited companiesand PSU bonds.
Source: RBI Handbook of Statistics on Indian Economy, 1999
Monthly data for new issues by non-government public limited companiesare available from the RBI publication titled �Handbook of Statistics onIndian Economy 1999� for the period April 1993 to March 1999. Figure 3shows these data
Rs.
cro
re

29 30
Figure 3
New Equity Issues by Non Govt. Public Limited Companies
0
500
1000
1500
2000
2500
3000
3500
Apr
-90
Sep-
90
Feb
-91
Jul-9
1
Dec
-91
May
-92
Oct
-92
Mar
-93
Aug
-93
Jan-
94
Jun
-94
Nov
-94
Apr
-95
Sep-
95
Feb
-96
Jul-9
6
Dec
-96
May
-97
Oct
-97
Mar
-98
Aug
-98
Jan-
99
Rs
cror
e
0
50
100
150
200
250
Num
ber
of I
ssu
es
Equity Shares Number
Source: Handbook of Statistics on Indian Economy, 1999
This data show that the primary market has plummeted after 1996. Both thenumber of new issues and the amount raised through them has declined sharplyin recent years.
To have a better idea of how the new issues market has plummeted, it has beenbenchmarked against the gross domestic capital formation and gross capitalformation by the private corporate sector. Table 2 shows the results.
Table. 2: New Issues as a Percentage of Gross Domestic Capital Formation(GDCF) and Gross Domestic Capital Formation by the Corporate Sector
New Capital Issues by Non Govt. New IssuesPublic Ltd. Companies GDCF as a % of
Ordinary Preference Debentures Total Aggregate Corporate GDCF GDCFShares Shares Sector (Corporate
Sector) (In Rs. crore) (In Rs. crore) (In per cent)
1981-82 305.2 2.8 290.4 598.4 34208.0 9118.0 1.75 6.561982-83 258.7 2.3 445.0 706.0 36340.0 10085.0 1.94 7.001983-84 381.6 1.7 454.2 837.5 41811.0 6956.0 2.00 12.041984-85 363.0 0.1 693.3 1056.4 45470.0 10111.0 2.32 10.451985-86 898.4 1.2 845.7 1745.3 58167.0 14405.0 3.00 12.121986-87 1007.5 0.7 1573.2 2581.4 61156.0 15506.0 4.22 16.651987-88 1105.2 6.8 675.7 1787.7 76456.0 12025.0 2.34 14.871988-89 1033.6 3.3 2187.9 3224.8 96972.0 15978.0 3.33 20.181989-90 1220.1 7.9 5281.9 6509.9 114649.0 19330.0 5.68 33.681990-91 1284.3 13.1 3014.8 4312.2 148195.0 23082.0 2.91 18.681991-92 1916.2 1.5 4275.4 6193.1 144628.0 36311.0 4.28 17.061992-93 9952.6 0.5 9850.3 19803.4 169041.0 47463.0 11.72 41.721993-94 9959.7 0.3 9370.3 19330.3 196379.0 48734.0 9.84 39.661994-95 17414.4 131.4 8870.9 26416.7 263415.0 69751.0 10.03 37.871995-96 11954.5 150.1 3970.1 16074.7 314340.0 109191.0 5.11 14.721996-97 6101.4 74.9 4233.2 10409.5 361687.0 105386.0 2.88 9.881997-98 1152.4 4.3 1971.6 3128.3 387377.0 131531.0 0.81 2.38
Source: RBI Annual Report and Economic Survey, various issues
Table 2 shows that during 1992-93, capital raised through the primary marketreached a level of more than 40% of total gross domestic capital formation bythe private corporate sector and about 12% of GDCF in India. After that therehas been a steep decline. In 1997-98, the primary market contributed only 2.4%ofgross domestic capital formation by the private corporate sector. Thecontribution of new issues has come down to 0.81% of GDCF in 1997-98.
According to the SEBI Annual Report of 1998-99, among the first 500 topcompanies in India, only a handful of companies (excluding the banks and FIs)have entered the Indian market in the last three years for raising fresh capital.This shows the overall negative sentiment and the lack of confidence about thenew issues market in general.
Euro IssuesFrom 1992, Indian firms with good track records have also been allowed toissue convertible debentures (Foreign Currency Convertible Bonds- FCCB)and equity (Global Depository Receipts) on foreign stock markets. The amountsraised by such companies from foreign market have remained modest. During1998-99, only three issues aggregating Rs.1,148 crore were floated as againstseven issues aggregating Rs.4,009 crore during 1997-98. Figure 4 shows thenumber and amount raised through Euro issues for the period 1992-99.
Figure 4
Number and Amount of Euro Issues
Source: Handbook of Statistics on Indian Economy, RBI, 1999.
From the aggregate level data, it is apparent that the primary market has notmobilized enough resources for the corporate sector during the last few years.
Period
0100020003000400050006000700080009000
1992
-93
1993
-94
1994
-95
1995
-96
1996
-97
1997
-98
1998
-99
Am
ount
(Rs.
cro
re)
0
5
10
15
20
25
30
35
Num
ber
Amount Number

31
Reasons Behind the Poor Performance of the Primary Market
The analysis in this section has shown that the primary market activities inIndia have declined in the second half of the 1990s. Resource mobilizationsthrough the new issues of shares and debentures have plummeted. Findings ofsection 2 has shown that from 1994, across all the samples, equity has declinedsharply as a source of financing for the corporate sector. The findings of thissection corroborate the results of section 2. The Annual Report of the Securitiesand Exchange Board of India (SEBI) for the year 1998-99 mentioned the followingpossible reasons for this depressed condition of the primary market. They are:1. Sluggish secondary market conditions are said to be the main reason behind
the poor performance of the primary market.2. Poor performance and uncertainties of the secondary markets have induced
retail investors to look to other avenues of investment at the expense ofequity.
3. The poor performance of the country in the macroeconomic front hasadversely affected the performance of the primary market.
4. The East Asian crisis has affected the sentiments of investors, both domesticand FIIs, in Indian markets.
5. Institutional problems also had a negative impact on the primary issuemarket.
These issues will now be discussed in a greater detail.
1. Secondary Market Behaviour
The financial l iberal ization and active government support for thedevelopment and fostering of the stock markets in the late 1980s and early1990s led to a vibrant stock market in India. As a result share prices, increasedrapidly in the initial phase. The BSE Sensex rose from a level of 123.6 in 1980to cross 4000 in 1994. But after 1994, the share prices have stagnated and dataupto March 1999 shows that the Sensex has remained in the 4000-45000 band.The average Price-Income ratio of the BSE Sensex rose from about 17 inApril 1990 to cross 50 by the middle of 1992. However, after 1994, there hasbeen a decline in the PE ratio.
Cost of Equity Capital
Secondary market activities have a strong influence on the performance of theprimary market. One of the most important determinants of the financingdecision of a firm is the cost of equity capital. The main criterion affecting thefinancing decision of a firm is generally the minimization of the weighted averagecost of capital. High stock prices in the secondary market allow corporates tocharge high premia in the primary market, thereby reducing the cost of equitycapital. Upward movements of stock prices influence firms� decisions to issuenew capital as the pricing of new issues depends on the level and trend of stock
prices at the time of issue. Issuing equities at a high premium reduces the costof capital for a firm and makes it an ideal financing choice. As a secondaryeffect, a reduction in the cost of equity capital is likely to transform someinvestment projects that had a negative net present value (NPV) before intopositive NPV projects2, thereby inducing more investment. Therefore, theperformance of primary market is crucially dependent upon the level and trendof share prices in the secondary market.
The stock market liberalization of the late 1980s and the entry of large numberof domestic and foreign investors into the capital market in the early 1990s wereexpected to lower the cost of capital for the Indian corporate sector3 .
This section will empirically investigate whether the cost of capital for the Indiancorporate sector has declined and whether the cost of capital has a statisticallysignificant influence on new equity issues in India. Monthly data of BSE Sensexand monthly data of the Price-Earning Ratio of Sensex companies are used asmeasures of cost of capital in this analysis.
Price Earning ratio (P/E ratio) of a company is taken as a better proxy of thecost of capital of a company, than share prices4 . A company�s P/E ratio iscomputed by dividing the current market price of a company�s stock by thatcompany�s per share earnings. A company�s per share earning is a company�safter tax profit divided by the number of outstanding shares.
Cost of capital (K) is related with the Price Earning ratio (P/E ratio) accordingto the formula:
K = +g�where por is the payout ratio and g is the growth rate of
earnings.
Thus for given earnings growth prospects, the lower the P/E, the higher thecost of capital and the lesser the incentive to make primary equity issues.
Figure 5 shows that the average P/E ratio has declined sharply after May 1994and as a result of this, the supposed reduction in the cost of capital for companieshas not taken place. Figure 1 shows the value of Bombay Stock Exchangesensitivity index (BSE Sensex) and the average Price-Earning Ratio (P/E Ratio)of the BSE Sensex. From the figure it can be seen that since October 1994, on a
2 See Henry (2000) for an empirical confirmation of this assertion.3 See Levine and Zervos (1998) and Henry (2000b) for a discussion on why stock marketliberalization can lead to decline in the cost of capital.4 Equating the cost of capital to a firm with its price/earning ratio is an approximate measure. Thissimplification does not include the role of expected growth in earnings. Also, as Singh (1995)points out, the cost of capital is a complex issue as a firm�s shareholders may have different interestsand circumstances. No single measure of cost of capital can capture the perspective of differentgroups of the firm�s shareholders.
EP
por
/
)(1−
32

trend basis, the Sensex has not shown a positive growth and there has been asteep decline of the P/E ratio. This decline in the P/E ratio seems to beinstrumental in dampening the primary issues market.
Figure 5
Monthly Data on BSE Sensex and Price Earning Ratio
0500
100015002000250030003500400045005000
Apr
-90
Apr
-91
Apr
-92
Apr
-93
Apr
-94
Apr
-95
Apr
-96
Apr
-97
Apr
-98
Sens
ex
510152025303540455055
PE
Rat
io
Sensex P/E Ratio
Source: Bombay Stock Exchange.
The RBI Annual Report 1995-96 finds strong two-way causal relationshipsbetween Sensex and new capital Issues by non-government public limitedcompanies. This section will try to verify these findings with more recent data.Additionally, this section will use data on PE ratios as an alternate measure ofcost of capital.
Statistical Analysis
Methodology
First the correlation between NEI and other variables will be tested. It isexpected that the NEI will be related with these variables with some amountof lag. This is so because if the share price or the PE ratio of a firm in montht is influencing the decision to issue new equities, then it will take the firmsome time to actually issue the new equities. For this reason various lags (uptothree months) have been used to determine the relationship between NEI andother variables.
Correlation analysis only shows the degree of association between the two variablesand it does not necessarily imply causation. To test whether there are any causalrelationships between the NEI and other variables, the Granger Causality test isused here.
It is important to mention here that application of econometric tools on time seriesdata is allowed only if the data fulfills certain conditions. The first condition is thata series has to be stationary for the application of any econometric tool. However,as a special case, econometric tools can be applied on two sets of non-stationarytime series data, subject to the condition that they are cointegrated. If two variablesshow different statistical properties and are not cointegrated, suitable statisticaladjustments have to be done before econometric tests can be applied on thesevariables.
This section will test each variable for its stationarity. For those variables whichare integrated of the same order as NEI, i.e. have similar statistical properties,a further check for co-integration will be made. If co-integration is discovered,the Granger Causality Test will be applied. However, if the variables showdifferent statistical properties, then suitable adjustments are required to usetime series applications on them.
Variables
Monthly data on new equity issues by non-government public limited companiesare used here to capture the primary market activities. Data are available for theperiod April 1990 to March 1999. This series is called NEI.
Monthly data of BSE Sensex are used in this section as a measure of cost of capital.Monthly data is used for the period April 1990 to March 1999. This gives 108observations for the variable. This series is called �SENSEX 1�.
As mentioned before, the CCI Act was abolished in May 1992. It is expectedthat the abolition of CCI should have some impact on new equity issues. Tocapture this, monthly data for the period June 1992 to March 1999 is used as aseparate case. 82 observations are available for each variable in this case. Thisseries is called �SENSEX 2�.
Sensex 1 and Sensex 2 show the nominal share price values. To eliminate the inflationcomponent in Sensex 2, it has been deflated by the monthly Wholesale Price Indexseries. This gives us the series �SENSEX 3�. This series covers the period June 1992to March 1999.
Monthly data on the Price-Income Ratio (P/E ratio) of the BSE Sensex companieshave been used here to have an alternate measure of the cost of capital. This seriesis called PE and it covers the period June 1992 to March 1999.
Results
Table 3 shows the correlation between NEI and other variables with different lags.
33 34

Table 3: Correlation with NEI (with various lags)
No Lags Lag 1 month Lag 2 months Lag 3 months
Sensex 1 0.34 0.39 0.40 0.39Sensex 2 0.02 0.12 0.13 0.13Sensex 3 0.39 0.48 0.51 0.54PE 0.52 0.55 0.57 0.61
The table shows that Sensex1 shows positive correlation with NEI. However, thecorrelation is significantly lower for Sensex 2. The correlation between NEI andSensex in fact becomes negative if the data for the period December 1994 to March1999 is taken. Therefore, no consistent pattern of association is found betweennominal values of Sensex and NEI.
However, when the deflated value of Sensex (Sensex 3) or the PE ratio is used forcalculations, the correlation is positive and significantly higher. It should be notedhere that Sensex 2, Sensex 3 and PE refer to the same time period.
Next the Granger Causality Test has been applied to find out the causal relationshipsbetween NEI and other variables. Some statistical tests are required before theGranger Causality Test can be applied. Table 4 shows the results of the series orderand cointegration with NEI
Table 4: Series Order and Cointegration with NEI: Summary
Variable Series Order Co-integrated with NEI
1. Sensex 1 I(1) No2. Sensex 2 I(1) No3. Sensex 3 I(1) Yes4. PE I(1) Yes5. NEI I(1) -
Table 4 indicates that none these variables are stationary. All of them are I(1), i.e.they are integrated of order 1. Moreover, tests show that Sensex 1 and Sensex 2 arenot cointegrated with NEI. Normal econometric tools cannot be applied on theseseries. However, econometric analysis can be done with the first differences ofthese variables (first difference of an I(1) series is stationary) . The application ofGranger Causality Test on the first difference of these variables shows that the nullhypothesis that D(NEI) does not Granger cause D(SENSEX1)5 is rejected whentwo months� lag is used. This implies that a change in new equity issues Grangercauses a change in the Sensex. However, the reverse hypothesis that change in Sensex1 does not Granger cause change in NEI cannot be rejected.
5 Where the D operator shows the first difference of the variables.
Causality tests with Sensex 2 and NEI produce identical results. As in the earliercase, both variables turn out to be integrated of order one and not cointegrated.This allows operations with first differences only. Results show that a change in newequity issues Granger causes a change in Sensex 2 when two months� lag is used.However, in this case also there is no evidence that changes in Sensex 2 cause changesin the new equity issues.
Therefore, based on this set of data, it cannot be statistically confirmed that changesin the Sensex cause changes in the new equity issues.
Table 4 shows that PE and Sensex 3 are both I(1) and are cointegrated with NEI.Normal econometric tools can be applied to these variables. The results of theGranger Causality test shows that the null hypothesis that PE ratio does not Grangercause New Issue is rejected. The results also show that the reverse is not true. Thatis, the null hypothesis that New Issue does not Granger cause PE ratio cannot berejected. Granger Causality test also reveals that the null hypothesis that Sensex 3does not Granger Cause NEI is rejected.
Therefore, from these results it can be said that cost of capital, when measuredas the deflated value of share prices or as PE ratio, influences firms� decision toissue new equities. Figure 5 shows that the PE ratio increased substantially duringearly 1990s. This made equity capital relatively cheaper. Cheaper cost of equitycapital induced the firms to raise money through the primary market. However,after 1994, there has been a sharp and sustained decline in the PE ratio of theSensex firms. For example, the average PE ratio of the Sensex companiesdeclined from 51.93 in July 1994 to 14.59 in March 1999. This has made thecost of equity financing higher for companies. Cheaper alternate sources offinancing have induced firms to move away from financing their investmentsthrough stock markets.
Other Secondary Market Variables
Theoretically, the increased depth of a stock market, measured by the ratio ofmarket capitalization to GDP, should have a favourable impact on the primarymarket. This ratio is viewed as a rough (and inverse) indicator of the transactionscost of the capital market6 . The market capitalization to GDP ratio can also beviewed as a proxy for the level of development of a stock market.
On the other hand, the depth of the secondary market depends on the activity ofthe primary market because it is only when more corporate entities come into themarket and raise funds, that more instruments are available in the secondary market.Therefore, a two-way causal relationship exists between stock market depth andprimary market activities.
6 Aylward and Glen (1999)
35 36

Stock markets may also induce investment through the creation of liquidity.Profitable investments often require long-term commitment of capital, butinvestors are generally reluctant to relinquish control of their savings for longperiods. Liquid equity markets make investment less risky-and more attractive-because they allow savers to acquire an asset (equity) which can be sold quicklyand cheaply if they need access to their savings or want to alter their portfolios.Levine and Zervos (1997) find that stock market liquidity is positively andsignificantly correlated with current and future rates of economic growth, capitalaccumulation, and productivity growth, even after controlling for economicand political factors.
The above discussion shows that a number of secondary market variables affect theactivities of the primary market. The objective of this section is to empiricallyverify these causal relationships.
Monthly data on market capitalization and turnover will be used to estimatesecondary market�s impact on new equity issues. They will be called �Mkap� and�turn�.
This section will also try to estimate the impact of stock market depth andstock market liquidity on new equity issues. Stock market depth is traditionallytaken as the ratio of market capitalization to GDP. However, monthly data onGDP is not available in India. Following Pethe and Karnik (2000), this sectionuses the Index of Industrial Production (IIP) as the proxy of GDP data.Therefore, in this section, stock market depth is measured as a ratio of marketcapitalization to the IIP. This series will be called �Depth�.
As mentioned before, a liquid secondary market is supposed to act as an incentiveto the primary market. To empirically verify this, three measures of liquiditysuggested by Levine and Zervos (1996) are used here.1. One commonly used measure is the total value of shares traded on a
country�s stock exchanges as a share of GDP. In the absence of monthlydata on GDP, the monthly data on IIP will be used here. This ratio iscalled �Liq1�.
This ratio does not directly measure the costs of buying and selling securitiesat posted prices. Yet, averaged over a long time, the value of equitytransactions as a share of national output is likely to vary with the ease oftrading. In other words, if it is very costly or risky to trade, there will notbe much trading.
2. The second measure of liquidity is the value of traded shares as a percentageof total market capitalization (the value of stocks listed on the exchange).This turnover ratio measures trading relative to the size of the stock market.This ratio is called �Liq2�.
3. The third measure is the turnover divided by stock price volatility. Marketsthat are liquid should be able to handle heavy trading without large price swings.
The coefficient of variation of daily stock prices7 of the BSE is used as ameasure of volatility. This ratio is called the �Liq3�.
Data for the analysis for this section pertain to the period April 1993 to March1999. Figures in chart A.1 in the Appendix show the movements of these sixvariables. These figures show that though market capitalization and stock marketdepth have not shown any sustained upward trend, turnover and other measures ofliquidity have shown an increasing trend.
Summary of Statistical Results:Table 5: Correlation Coefficients between NEI and Other SecondaryMarket Variables
No Lags Lag 1 month Lag 2 months Lag 3 months
Turnover -0.56 -0.52 -0.49 -0.49Market Capitalization -0.32 -0.28 -0.28 -0.31Liquidity1 -0.53 -0.50 -0.22 -0.17Liquidity2 -0.55 -0.50 -0.45 -0.44Liquidity3 -0.42 -0.37 -0.46 -0.41Depth -0.14 -0.06 -0.03 -0.05
The results shown in the table 5 are not on the expected lines. Secondary marketvariables like market capitalization, stock market depth and the liquidity measuresare expected to have a positive influence on the activities of the primary market.But the results show that even with various lags, there is no evidence of any positiveassociation between monthly data on new equity issues and these secondary marketvariables.
Table 6: Series Order and Cointegration with NEI: Summary
Variable Series Order Co-integrated with NEI1. Mkap I(1) No2. Depth I(0) -3. Turnover I(1) Yes4. Liquidity 1 I(1) Yes5. Liquidity 2 I(1) Yes6. Liquidity 3 I(1) Yes7. NEI I(1)
As the statistical properties of Market Capitalization and Depth are not similarto that of NEI, direct application of Granger Causality is not possible.However, as the above table indicates, all these variables are integrated of order1 and normal econometric applications are allowed on the first differences ofthese variables.
Application of Granger Causality Test on the first differences of these variablesindicate that
7 Daily opening prices are used for the calculation.
37 38

1. There do not exist any statistically significant causal relationships betweenchanges in market capitalization and changes in NEI.
2. There do not exist any statistically significant causal relationships betweenchanges in market depth (market capitalization/IIP) and changes in NEI.
The statistical properties of turnover and Liq1, Liq2 and Liq3 are statistically similarto that of NEI. That is, individually these variables are cointegrated to NEI. Normaleconometric exercises are allowed for these variables.
Applications of Granger Causality Test on these variables indicate that
1. NEI Granger causes Turnover, Liq1 and Liq2. No such statistically significanteffect exists on Liq3. This implies that, according to this set of data, primarymarket activities affect the liquidity condition of the secondary market.
2. Also, there does not exist any statistical evidence that turnover, Liq1, Liq2and Liq3 Granger causes NEI. This implies that data do not support thetheoretical prediction that an increase in liquidity in the secondary market willhave a positive impact on the activities of the primary market.
The statistical analysis done above suggest that from the data used here, it cannotbe inferred that market capitalization, stock market depth, turnover and liquiditymeasures are positively correlated with the activities of the primary market. Nocausal effects of these variables on NEI have been found to be statistically significant.However, the results suggest that primary market activities have some feedback onthe secondary market variables.
Conclusion
From the above analysis it can be seen that an increase in the cost of capital hasbeen the most important reason for the decline in primary market activities in India.Among the various measures of the cost of capital, PE ratios have shown thestrongest correlations and statistically significant causal relationships with primarymarket activities.
From this set of data it appears that other secondary market indicators like liquidityand the market capitalization do not have a statistically significant causal effect onthe primary market. These results do not conform to the theoretical predictionthat increase in liquidity and market depth of the secondary market will have apositive impact on the primary market.
To reconcile between the empirical findings and the theoretical predictions itcan be mentioned that the time period used for the analysis in this section isabout five to seven years. This is too a short period to warrant any definiteconclusion. Analysis with a longer time period is likely to yield a more stablerelationship.
However, one definite trend that is observable in the Indian equity markets isthat activities in the equity markets are very much skewed in favour of thelarger companies. In 1995-96, the top 50 companies with the highest turnoveraccounted for about 60% of the total turnover on the BSE while in 1997-98they accounted for about 92%of it. In 1997-98, market capitalization of top25 companies were more than 52% of total market capitalization of BSE.Detailed data is given in Table A.1 in the appendix. It is possible thatdominance of the large companies in the Indian stock markets is creating abias in the secondary market data.
Also it has been pointed out that a number of other factors can influence thebehaviour of the primary market. For example, the cost of capital of alternatesources of financing and the sentiment of retail investors can affect the primarymarkets. This study will now look into these factors in a greater detail.
2. Rate of InterestPrior to the financial liberalization, interest rates in India were administered. Duringthis period, credit deployment by banks and financial institutions were at low ratesof interests. Low rates of interest made industries more dependent upon the financialinstitutions for resource mobilization.
As a consequence of financial liberalization, interest rates shot up in India. In August1991, the Government of India allowed all term lending institutions to charge interestrates according to the risk perception of the concerned project, subject to aminimum rate of 15%. Table 7 shows the Prime Lending Rates (PLR) charged bymajor financial institutions in India for the period 1977 to 1999. From the table itcan be seen that immediately after the financial liberalization, there has been a spurtin the lending rates. For example, financial institutions raised their lending ratesfrom 14.5% in 1990-91 to 19% in 1991-92.
Table 7: Interest Rate Structure of Some Major Financial Institutions*
Year SBI Advance IDBI IFCI ICICI Average of IDBI,Rate IFCI and ICICI
1977-80 13.00 11.00 11.00 11.00 11.001980-90 16.50 14.00 14.00 14.00 14.001990-91 16.50 14.50 14.50 14.50 14.501991-92 16.50 19.00 19.00 19.00 19.001992-93 19.00 18.00 18.00 18.00 18.001993-94 19.00 16.00 16.00 16.00 16.001994-95 15.00 15.00 16.50 15.75 15.751995-96 16.50 17.50 18.00 14.00 16.501996-97 14.50 16.20 16.25 16.50 16.321997-98 14.00 13.30 16.25 14.25 14.601998-99 13.00 13.50 15.25 13.00 13.92
*Average PLR for IDBI, ICICI and IFCISource: Handbook of Statistics on Indian Economy, 1999, RBI
39 40

As far as the liberalization of lending rates of the commercial banks, governmenttook a more gradual approach. Table 6 shows the gradual rationalization of interestrates. Table 8 shows that though there has not been an across the board hike in thelending rates of the commercial banks, the minimum rate on loans over 2 lakh hasremained very high. Sen and Vaidya (1997) calculated that during this period, thereal lending rate has remained positive at 8-10%. This high real rate of interestresulted in a decline in the growth rate of non-food credit to industry. This is shownin Table 9.
Table 8: Structure of Bank Lending Rates
Category of Account October April April September October1991 1992 1993 1993 1994
Upto and inclusive of Rs.7,500 11.5 11.5 12.0a 12.0 12.0Over Rs.7,500 and Rs.15,000 13.0 13.5b
Over Rs. 15,000 and upto Rs.25,000 13.5Over Rs.25,000 and upto Rs.50,000 15.5 16.5c 16.5 15.0 13.5Over Rs.50,000 and upto Rs.2 lakh 16.5Over Rs. 2 lakh (minimum rate) 20.0 19.0 17.0 15.0 Free
Note:a upto and inclusive of Rs.25,000b over Rs.7,500 and upto Rs.25,000c over Rs.25,000 and upto Rs. 2 lakh.Sources Sen and Vaidya (1997).
The rationalization of lending rates of the commercial banks culminated in October1994 when banks were allowed total freedom to decide their own lending rates.Figure 6 shows the average PLR of five major public sector banks in India on amonthly basis.
Table 9: Growth Rate of Non Food Credit to Industry (Medium and Large)(In per cent)
Period Growth Rate
1979-80-1989-90 14.521990-91-1993-94 10.071994-95-1998-99 13.50
Source: Handbook of Statistics on Indian Economy, RBI, 1999.
It should be mentioned here that PLR is only an indicative rate. The actual ratescharged by banks are often much higher. A study by EPW Research Foundationpoints out that �..almost all banks and FIs have their modal rates at about 20-22% � far higher than their PLRs. In fact, FIs have again breached their implicitagreement to limit the upper end of their lending rate structure to 4% pointsover their PLR and have begun lending, generally at around 22%� EPW ResearchFoundation 1996. 8 Khanna (1999)
Source: RBI Annual Report 1998-99.
This period of high interest rate coincided with a very favourable situation inthe stock market. High share prices and a booming secondary market inducedinvestors to mobilize funds through the stock market. During this period therehas been a shift in the financing pattern of the Indian corporate sector awayfrom borrowing and towards equity oriented funds.
Commenting on this, Sen and Vaidya (1997) have said that:
�Financial Liberalization thus, had not led to a major disruption in investmentactivity of the private corporate sector. This ability to respond to shocks generatedby interest rate deregulation was a consequence of far reaching changes in the primaryissues market which opened up a new source of funds.� Pg. 136.
This will become more evident from Table 10, which shows the debt-equityratio for private sector firms in India. The table shows an uniform decline inthe debt-equity ratios of the Indian firms during 1992-95.
41 42
11
12
13
14
15
16
17
Oct-94
Apr-95
Oct-95
Apr-96
Oct-96
Apr-97
Oct-97
Apr-98
Oct-98
Apr-99
Oct-99
Apr-00
in percent
Along with this increase in the cost of bank finance, the availability of creditto the private sector was also under severe strain. Stock market scams andother official investigations into the lending by some Indian banks made themreluctant to lend to the corporate sector. Bank loans as a proportion of totaldomestic finance to the corporate sector declined from 60% in 1988-89 to37%in 19993-948 .
Figure 6
Prime Lending Rate of Five Major Public Sector Banks
(In per cent)

Table 10: Debt-Equity Ratios of Indian Firms
Year Private Sector Firms Sensex Companies CNX Mid-Cap Companies
1990-91 1.95 1.21 1.741991-92 1.99 1.43 1.731992-93 1.91 1.35 2.051993-94 1.53 1.13 1.781994-95 1.24 0.85 1.391995-96 1.21 0.73 1.161996-97 1.35 0.81 1.191997-98 1.45 0.75 1.271998-99 1.45 0.87 1.43
Source: CMIE Prowess Database for Sensex and CNX Mid-Cap dataCMIE �Industry Financial Aggregates & Ratios� for Private Sector firms
However, this scenario changed quickly after 1994-95. The stock market scamof 1992 was followed by another major decline in share prices during the endof 1994 and early 1995. During the end of 1994 some irregularities also surfacedin working of the primary market (discussed below in more detail). This had anegative impact on investors� sentiment. The cumulative effect of all these ledto a prolonged decline in share prices.
Along with the decline in share prices, major changes were introduced in themonetary policy of the RBI also. The RBI, in a bid to inject more liquidity intothe economy, made significant reductions in CRR and SLR requirements. TheBank Rate was also reduced to give a signal to the commercial banks and lendinginstitutions to reduce their lending rates. This was done to pull the economyout of the recession in industrial production. These measures resulted in asustained decline in the lending rates of the banks. Table 7 and Fig 6 show thetrend. The reduction of the lending rates by the commercial banks and otherlending institutions could have induced the industry to finance more of theirinvestments through borrowings.
A noteworthy feature of the primary market in 1998-99, which corroboratesthe above hypothesis, was the issue of 10 bonds by the financial institutionslike IDBI and ICICI. The Industrial Development Bank of India raised Rs 2250crore and ICICI raised Rs 2200 crore through debentures and bonds in primarymarket. In contrast, the only large issue from the manufacturing sector was aRs. 160.84 crore equity issue by India Cements. This huge amount of resourcemobilization by the financial institutions indicates that the demand for creditfrom the term lending institutions has been growing9 . The SEBI Annual Report1998-99 commented:
�The share of large issues was 82.5% in the total amount mobilized during the year1998-99. The Industrial Development Bank of India raised Rs 2250 crore and ICICIRs 2200 crore, whereas India Cements Ltd. raised Rs 160.84 crore. Thus, themanufacturing sector did not enter the market with mega issues during 1998-99.Since these funds are advanced as loans to the corporates it is possible the investmentin industrial sector is taking place through intermediation of financial institutions�.SEBI Annual Report 1998-99.
Figure 7 shows the total assistance sanctioned and distributed by the financialinstitutions10 .
Figure 7
Assistance Sanctioned and Distributed by Financial Institutions
9 Table A.3 in the appendix shows the Large Issues during 1998-99; page 60.10 Financial Institutions include IDBI, IFCI, ICICI, SIDBI, IIBI, SCICI, RCTC, TDICI, TFCI,LIC, UTI, GIC, SFCs and SIDCs.
Source: Handbook of Statistics on Indian Economy, 1999, RBI
This figure shows that after 1996-97, there has been an increase in the creditflow from the financial institutions to the industrial sector. Table A.2 in theappendix shows the assistance distributed by some leading financial institutionsin India.
3. Institutional ProblemsAs mentioned before, the CCI act was abolished in May 1992. The abolition ofCCI and allowing free pricing of issues prompted many companies to raise fundsfrom the equity market at a premium. The prices of many of these issues declinedon listing and has been quoted substantially below the issue prices. Apart frompoor performance on the price front, the stock market has suffered from a numberof corruption charges and irregularities. The scam of 1992, where a number of
43 44
0
10000
20000
30000
40000
50000
60000
70000
80000
90000
100000
1988-89
1989-90
1990-91
1991-92
1992-93
1993-94
1994-95
1995-96
1996-97
1997-98
1998-99
sanctioned distributed
Rs.
cro
re

foreign banks and some leading brokers were involved, had an adverse impacton the secondary market. Towards the end of the financial year 1994-95, thenew issues market received a setback when it was found that some issuingcompanies were rigging prices of their shares with the help of marketintermediaries before entering the market for raising capital. It was also foundthat many companies were not observing the disclosure norms set by SEBI.
A committee headed by Malegam appointed by SEBI looked into this matter.Based on the Malegam Committee recommendations relating to disclosurerequirements and issue procedures, SEBI imposed a set of entry barriers on newissues, specifying minimum issue size requirement for companies seeking listing.In addition, special requirements were imposed on finance companies seekingpublic funds. Though these requirements are relaxed by SEBI from time totime, it has been pointed out that small firms are finding it increasingly difficultto access the equity market.
The strict entry and disclosure norms put into practice by SEBI has made itdifficult for most companies without a track record to access the capital market.According to SEBI, this has increased the quality of the papers but it has alsoresulted in a decline in the number of issues and amount raised in the primarymarket.
A closer look at the trend in size and composition of the issues in primarymarket reveals some interesting facts. Table 11 summarizes the data.
Table 11: Trends and Composition of New Issues
Number Amount Share of Mega Premium chargedof Mega Raised Issues in as a proportion of
Issues through Total Capital total amount raisedMega Issues Mobilized (%) from equity
(Rs. Cr.) issues (%)
1992-93 34 45.25 51.91993-94 na 7387 37.88 44.11994-95 39 10304 38.95 48.31995-96 19 4038 24.67 40.61996-97 13 4869 46.56 23.91997-98 8 2221 70.78 56.21998-99 10 4194 83.66 51.7
Source: RBI Annual Reports, various issues.
From table 11 it can be seen that the share of mega issues, i.e. issues bigger than100 crore, in total capital raised has increasingly becoming larger. In 1998-99, 10mega issues account for more than 83% of total capital mobilized from primarymarket. The average size of new issues floated by private sector companies in1998-99 increased to Rs.104 crore as compared with Rs.31 crore during theprevious year. It can also be seen from table 2 that premium charged on new
issues has increased to a very high level in the last two years. These facts indicatethat only reputed and large companies were able to tap the capital market. Thisdata seems to validate SEBI�s point that though the number of issues has declined,there has been an increase in the quality of issues in the last few years.
Also it has been found that some of the companies, which raised money throughpublic issues, are now not even traceable. According to an interview by P. L.Sanjeeva Reddy, Secretary, Company Affairs, around 140 companies havedisappeared after raising money from the equity market11 . The charging ofinordinately high prices for the new issues in a large number of cases and thedisappearance of some of these companies adversely affected investors in termsof liquidity and confidence. This resulted in a huge exodus of retail investorsfrom the market. The apparent loss of investors� faith in the primary market iscontinuing. The primary market has virtually dried up and it has not yetresponded to the series of policy measures that have been announced insubsequent budgets as well as the credit policies to revitalize it. The entry of FIIshas not been able to boost the primary market either.
Another important factor that could have affected the equity issues market isthe cost of raising capital from the primary market. According to a SEBIDiscussion Paper12 under some general conditions it has been estimated that foran issue of Rs. 1500 million, the cost of raising capital from the domestic marketis 9.6% of the issue size. The same amount of money when raised through theGDR route costs only 4% of the issue size.
From the point of view of issuers, the process of raising money through newequity issues in domestic markets is also time consuming. The public subscriptionprocess requires that price determination should be made at least 45 days beforethe date of issuance. After the subscription of the issue, due to post subscriptionprocedures, about 60 days elapse before the security is listed. This delay sometimesmakes a new issue expensive for the issuers.
These institutional problems and the enforcement of strict norms for enteringthe new issue market have discouraged many smaller firms from seeking fundsthrough the equity market. Khanna (1999) has also pointed out that as the accessto credit is now dependent upon the evaluation of the credit rating agencies,smaller and less profitable firms with low credit rating are finding it increasinglydifficult to access the credit market and are often forced to borrow at a rateabove the prime lending rates.
These factors, coupled with the fact that the retail investors have shied awayfrom the primary issues market has prompted the corporate sector to look foralternate avenues of financing, namely external borrowing.
11 Interview in BBC India Business Report, 14 May, 2000.12 �Indian Securities Market: Agenda for development and Reform�-SEBI Discussion Paper
45 46
Year

4. Corporate Debt Market
Another important source of finance for the corporate sector is the corporatedebt market. Recently debt has emerged as the most favoured instrument formobilizing capital in the corporate sector. Table 12 shows the amount ofresources raised by the corporate sector through debt related instruments inprimary market. It can be seen from the table that the share of debt relatedinstruments has grown steadily over the years. In 1998-99, debt accounted forabout 99% of the total resources mobilized by the corporate sector throughthe primary market. Resources raised by the corporate sector through debtrelated instruments recorded an annual average growth rate of more than 40%during the period 1995-96 to 1998-1999.
Table 12: Resources Raised in the Corporate Debt Market*
Year Public Private Total Share of Total Resource Share ofIssue Placements Debt Private Mobilization Debt (%)
Placement in the Primary (4/6)(%) (3/4) Market
1 2 3 4 5 6 7
1995-96 2940 10035 12975 77.34 21857 59.361996-97 6977 18391 25368 72.50 30039 84.451997-98 1929 30983 32912 94.14 34045 96.671998-99 7407 38748 46155 83.95 46658 98.92
Source: Indian Securities Market: A Review13 , National Stock Exchange Website,http://www.nse-india.com/invfocus/publication.htm* This data do not match with the RBI data
From the table it can be seen that the private placement market has emerged asthe major route for raising resources by the industry. In a private placement,resources are raised through arrangers (merchant banking intermediaries) whoplace securities with a small number of financial institutions, corporates andhigh net-worth individuals.
Data also reveal that debt has become the most preferred instrument in theprivate placement market. According to the RBI data, it constituted 95.3% ofthe total amount raised by way of private placement in 1998-99. The interestrates on debt instruments floated in the private placement market remained inthe range of 10 to 16.5%.
The popularity of the private placement method can be attributed to its threeinherent benefits. They area. The private placement method is a cost- and time-effective method of raising
funds.b. It can be tailored to meet the specific needs of the entrepreneurs.
c. Private placement does not come under the strict regulatory provisionsapplicable to public issues.
It is interesting to note that public sector companies have used the privateplacement market in a big way to raise resources. Figure 8 shows the resourcesmobilized through the private placement market in India for the period 1995-96 to 1998-99.
Figure 8
Private Placement Market in India
13 In this report Prime Database is mentioned as the source for this data.
0
10000
20000
30000
40000
50000
Rs. C r.
1995-96 1996-97 1997-98 1998-99
Public Sector Private Sector
Source: Handbook of Statistics on Indian Economy, RBI, 1999
The emergence of the private placement market as the major source of financebecomes evident when it is compared with other modes of financing available tothe industrial sector. Table 13 shows the contribution of different modes ofraising finance in primary market. From the table it can be seen that capitalraised by the corporate sector through rights and public issues from the primarymarket has declined after 1994-95. As discussed above, the main reasons for thisdecline are the lack of investors� interest in the primary market and poorperformance of the secondary market. However, it can also be seen from thetable that this decline has been matched by a commensurate increase in the shareof private placements in the primary market.
From the table it is clear that for mobilizing resources, the industrial sector isnot using new equity issues to raise funds and firms are alternatively using theprivate placement route as their major source of funds. A strong negativecorrelation is observed between the share of private placements and that ofresources mobilized by corporate sector through rights and public issues. Thecorrelation coefficient between them is �0.89.
47 48

Table 13: Contribution of Some Selected Mode of Financing in TotalResource Mobilized by the Primary Market.
Private Rights and Public Issues PSU Govt. BanksPlacement by Corporate Sector Bonds Companies and FIs
Shares Debentures Total
1990-91 29.85 9.12 21.20 30.33 39.83 0.00 0.001991-92 27.27 11.72 26.12 37.84 34.89 0.00 0.001992-93 7.02 42.74 42.30 85.04 4.56 1.85 1.531993-94 20.15 26.89 25.30 52.18 15.08 2.21 10.371994-95 26.62 41.80 21.13 62.94 7.31 2.12 1.011995-96 36.92 33.44 10.97 44.41 6.33 2.76 9.571996-97 44.48 18.23 12.50 30.73 10.02 1.92 12.851997-98 79.76 3.09 5.22 8.32 7.90 0.11 3.911998-99 84.13 4.44 4.05 8.49 0.00 0.00 7.37
Source: RBI Annual Report, various issues
5. Retail Investors and the Stock Market
Liberalization of the stock market and the consequent opening up of the financialsector provided investors with an array of assets with varying degree of risk,return and liquidity. This increased choice of assets and the existence of a vibrantstock market encouraged retail investors to invest in equity related instruments.The volume of household savings in the form of shares and debentures rosefrom Rs 412 crore in 1980-81 to Rs. 13,474 crore in 1994-95. The volume ofhousehold savings going to the Unit Trust of India increased from Rs 31 crorein 1980-81 to Rs 9087 crore in 1991-92. Nagraj (1996) and Singh (1998) havepointed out that the higher than bank interest rate on debentures and theintroduction of several fiscal incentives on investments in the mutual funds arethe other possible reasons behind this sudden increase in the retail investors�interest in the capital market.
However, after 1994-95, there has been a massive exodus from equity relatedinstruments. In 1998-99, the household sector�s investment in shares anddebentures was less than Rs 5,000 crore and in units of UTI the investment wasRs 565 crore. These figures reveal that during this period, household sector�sinvestment in equity related instruments (shares and debentures + units of UTI)has declined at an average annual rate of more than 30%.
Data on the composition of household savings in financial assets show that in1992-93, 10.22% of total household saving in financial assets went into sharesand debentures. In 1998-99 the figure has come down to a mere 2.4%. This iseven lower than the corresponding figure in 1980-81. The proportion ofhousehold savings that has gone into units of UTI has also suffered a decline inthe recent years. This will be evident from Figure 9
Table A.4 in the appendix shows the complete data.
Figure 9
Proportion of Savings as a Percentage of Gross Financial Savingsof the Household Sector
0
2
4
6
8
10
12
14
1980-81
1981-82
1982-83
1983-84
1984-85
1985-86
1986-87
1987-88
1988-89
1989-90
1990-91
1991-92
1992-93
1993-94
1994-95
1995-96
1996-97
1997-98
1998-99
Shares and Debentures Units of UTI
Source: Handbook of Statistics on Indian Economy, 1999, RBI
This negative sentiment of retail investors had its impact on the primary market.From Figure 9 and Table 14 it can be seen that retail investors� interest in theprimary market has declined over the years. According to Singh�s (1995)hypothesis, the growth of the primary stock market in India during the late1980s and early 1990s was caused by household sectors� substitution of bankdeposits by equity related savings instrument. Data tend to suggest that after1994, there has been a reverse substitution in favour of deposits (both in bankand non bank deposits). From this data it can also be seen that the decline inthe primary market activities has coincided with the exodus of the retail investorsfrom the capital market. As the FII investment in primary market has remainedmarginal, it can be inferred that the lack of interest among retail investors inthe capital market has contributed to the decline of the primary market.
Table 14: Subscription of Primary Issues
Number of times 1995-96 1996-97 1997-8 1998-99Oversubscribed
2 or less 971 617 19 51Between 2 and 5 246 30 2 4Between 5 and 10 79 4 0 1Between 10 and 20 58 2 0 1Between 20 and 50 43 1 0 0Between 50 and 100 12 1 0 0100 or more 8 0 0 1
Source: SEBI Annual Report, various issues.
49 50
Year
In p
er c
ent
(In per cent)

Three reasons are given for this massive exodus of small investors from theprimary market. They are1. Overpricing of issues by many firms2. Scams and irregularities that dogged the market since 19923. Poor secondary market conditions.
1. Overpricing of Issues
Abolition of CCI and allowing free pricing of issues prompted many companiesto raise funds from the equity market at a premium. The price of many of theseissues declined on listing and is being quoted substantially below the issue prices.According to Prithvi Haldea of Prime Database, 92% of the issues floated inthe period 1992-95 (both premium and par offers) were quoting below theprice in 1997 at which they were originally sold14 . Retail investors lost hugeamounts of money during this time. An estimate suggests that the money lostby those who backed issues floated between 1992 and 1995 is between Rs 20,000crore and Rs 30,000 crore15 .
The situation has not changed in 1998 also. According to a database maintainedby the website www.investresearchindia.com16 , for a sample of companies whoraised capital through large public issues (issue size greater than Rs. 25 crore)between 1993 to 1998, share prices of more than 80% of these companies arecurrently quoting below their issue prices17. Table 15 shows the summary ofthe data.
Table 15: Distribution of Issues Selling at Less than Issue Price.Year Total Number No. of issues where current Share (%)
of Issues adjusted price is less than issue price* (2/3)
(1) (2) (3) (4)
1993 13 6 46.151994 34 27 79.411995 28 27 96.431996 9 7 77.781997 10 9 90.001998 4 3 75.00
Total 98 79 80.61
*Bonus, Stock split adjusted priceSource: www.investresearchindia.com
14 Quoted in India Today, November 3, 1997.15 1997 estimate.16 This website maintains a database of 423 large companies from a wide cross section of industries.Data pertains to May 2000.17 These data seems to contradict SEBI�s claim that the quality of new issues has improved in therecent years.
2. Scams and irregularities since 1992During the period 1992-94 retail investors suffered huge losses due to thesurfacing of numerous instances of corruption and irregularities in the Indianstock market. The first major scam was the Harshad Mehta scam which crippledthe secondary market in 1992. Then there was the MS shoes affair, which had anegative influence on the primary market. Finally the CRB scam put a shadowof doubt on the NBFC market. The Harshad Mehta scam is estimated to be ofthe order of Rs 8,200 crore. The CRB scam is estimated to be of over Rs 1,032crore18.
Apart from these, there have been numerous allegations of about forged andduplicate shares, non-delivery of share certificates, problems with brokers andpromoters etc. It is alleged that both the domestic investors and the NRIs, whoare a big source of fund in the Indian stock market, suffered losses due to theseirregularities and eventually moved out of the market19 . These problems arestill continuing. In 1999, two NBFCs, the Kuber Group and CU Marketing,which between them owe depositors over Rs 10 billion, have gone bust. In1998 JVG Group closed down owing Rs 5.5 billion to its depositors20 .
Regarding the irregularities and scams in the Indian financial market, thepublication India Abroad has commented:
�Since the beginning of reforms in 1991, there has been a spurt in financial crimes.The first major scandal that made newspaper headlines was the 1992 multi-billiondollar securities fraud that centered around Mumbai stock exchange broker HarshadMehta...Other major white collar offences reported since 1991 are those concerningthe Calcutta based blue chip company, ITC Ltd., the share switch charges againstReliance Industries, questionable transactions by the Shaw Wallace company, TheMS shoes scandal masterminded by Pawan Sachdeva, the Indian Bank fraud andthe CRB Capital Market case...White collar crimes have become so common thatthe CBI, which started an economic offenses wing after the securities scandal, recentlystrengthened the division by recruiting specialists with background in banking andfinance�. page. 28. India Abroad �How Liberalization Spawned a String ofScandals� June 27, 1997
Also towards the end of the financial year 1994-95, instances were found thatsome issuing companies colluded with the market intermediaries to rig theirshare prices before entering the market for raising capital. It was also foundthat disclosure standards were not followed properly in their offer documents21 .This and other irregularities had a huge negative impact on the retail investors.
18 �Expose the ungodly� by Joginder Singh, Indian Express, Saturday, July 4, 199819 For a comment on this see �Corruption is the Key� by Arun Jethmalani. http://www.dhan.com/impressions/980224-jetu.html20 �White collar criminals wreak havoc on money markets� Business Commentary by Dilip ThakoreRediff on the Net, June 30, 199921 Some critics have shown this example as a case of hasty de-regulation.
51 52

3. Poor Performance of the Secondary Market
In the previous sections it has been discussed how the secondary market hasstagnated in the recent years. Poor performance of the secondary market hasresulted in a decline in the rate of returns on equity related instruments in therecent years. Table 16 shows the rates of return on various assets. From thetable it can be seen that in the recent years the equity market has given lowerreturns than most other forms of investment. In some years, the rate of returnon equities has even remained negative. This has prompted retail investors toshift towards fixed income assets like government securities and bank deposits.
Table 16: Relative Rates of Return on Investment in Financial Markets(% per annum)
Investment 1994 1995 1996 1997 1998 1999
Call Money Market 6.38 16.10 16.28 3.66 8.69 8.4991 Day Treasury Bill 7.46 11.90 12.97 7.96 7.33 8.75364 Day Treasury Bill 9.97 11.94 13.12 10.10 7.98 10.07Certificate of Deposit 9.60 12.50 17.13 11.38 16.60 10.25Commercial Paper 11.50 14.50 20.15 11.88 14.86 10.77Prime Lending Rate 15.00 15.00 16.50 14.5- 14.00-
15.00 14.50 13.0010- year GOI securities 12.50 12.35 14.00 13.65 12.15 12.25Annual Inflation Rate 10.81 10.41 5.00 6.90 5.30 5.00S&P CNX Nifty 78.20 -15.90 -0.50 -1.70 15.30 -3.50Deposit Rates (1-3 years) 10.00 11.00 12.00 11.00- 10.50- 9.00-
12.00 11.00 11.00Deposit Rates (3-5 years) 10.00 11.00 13.00 12.00- 11.50- 10.50-
13.00 12.00 11.50
Source: Indian Securities Market: A Review22, National Stock Exchange Website andHandbook of Statistics on Indian Economy, RBI.
There is a perception that in the recent years, increased volatility associatedwith the share prices has contributed to the exodus of retail investors from thestock market. However, data do not seem to support this view. Monthlyvolatility of BSE Sensex has been calculated using daily opening prices of Sensexfor the period January 1991 to December 1999. Coefficient of variation is usedto measure the volatility. Figure 10 shows the data. From the figure it can beseen that there has not been any perceptible increase in the level of volatility inthe stock market till December 1999. Annual data on volatility also supportsthis view. Table 17 shows the annual volatility data.
22 In this report Prime Database is mentioned as the source for this data.
Table 17: Volatility in BSE Sensitive Index
Year Range Coefficient of variation1991-92 3091 39.21992-93 2242 15.41993-93 2249 23.61994-95 1397 9.11995-96 772 5.51996-97 1324 8.61997-98 1338 7.91998-99 1517 11.8
Source: Calculated from Monthly Sensex data
Figure 10
Monthly Volatility of BSE Sensex
0.00
1.00
2.00
3.00
4.00
5.00
6.00
7.00
8.00
9.00
10.00
Jan-
91
Jul-9
1
Jan-
92
Jul-9
2
Jan-
93
Jul-9
3
Jan-
94
Jul-9
4
Jan-
95
Jul-9
5
Jan-
96
Jul-9
6
Jan-
97
Jul-9
7
Jan-
98
Jul-9
8
Jan-
99
Jul-9
9
Source: Calculated from Daily Sensex data
Conclusion
Financial liberalization and the active role of the government to develop andfoster capital markets resulted in a vibrant stock market in India during theearly 1990s. High equity prices, the abolition of CCI and free pricing of equityissues induced corporates to mobilize funds from the primary market. Theavailability of a wide portfolio of investment alternatives, with varying degreeof risk and return also encouraged the retail investors to invest heavily in equityrelated instruments. Due to favourable demand and supply side factors, equitybecame the most important source of finance for corporates in the early 1990s.
However, the stock market was hit by a number of charges of corruption andirregularities during the period 1992-94. This had a negative impact on thesecondary market. Retail investors suffered heavy losses and moved out of themarket. Influx of FII investment failed to liven up the secondary market on a
53 54

sustained basis. Though lately there have been signs of revival in the secondarymarket but data suggest that activities in the secondary market are currentlyconcentrated among the top companies or within a few specific sectors.
Poor performance of the secondary market, declining PE ratio, lack of faith ofretail investors in the market and a reduction in the lending rates of the Indianbanks and lending institutions led to the depressed condition of the new issuesmarket. For the period 1995-98, the primary market for equities in India hasvirtually dried up. Corporates were avoiding using equity as their source offinancing and increasingly using external borrowing as the preferred mode offinancing.
It has also been found that public subscriptions in domestic markets are expensiveas well as time consuming. To avoid strict norms of SEBI and to reduce thecost and time associated with public subscription of new issues, companies aretaking resort to the informal source of financing through the private placementsmarket. In the private placements market, debt has emerged as the favouredalternative.
Section 4: Concluding Observations
A stock market contributes to the real economy because a) it provides an additionalchannel for encouraging and mobilizing domestic savings b) it improves the efficiencyof capital by providing market measures of returns on capital and c) it improvesgearing and helps to reduce dependence on borrowing23. Using a number of samplesfor the period 1989-98 (1991-98 in some cases) this study has found out that theIndian corporate sector is increasingly using debt as its preferred mode of financing.If raising funds is one of the primary objectives of the equity markets then currentlythe stock market in India is not fulfilling this role satisfactorily.
The advance estimates of GDP growth for 1999-2000 have placed at 5.9%.According to an RBI report, given the trend value of ICOR, an investment rateof 22 to 24% would be necessary to support this level of growth. This willrequire substantial contribution from the domestic sources. If the primarymarket is not revived, this will be a strain on the domestic financial institutions.Though the lending rates are declining, due to low inflation, too muchdependence on debt can cause a distortion in the capital structure of a firm. Torevive the primary market it is important to restore the confidence of retailinvestors in the market. It has been pointed out that encouraging retail investorsthrough the promotion of mutual funds can be useful to attain this goal24 .Increasing fiscal incentives to retail investors can also be thought of. The FII
investment has essentially remained confined in the secondary market. To encouragethe participation of FIIs in the primary market, the limit on primary issuances toFIIs can be removed.
The RBI Annual Report 1999-2000 has pointed out that during 1999-2000, theprimary market showed signs of revival with a significant increase in the numberof new capital issues. This happened in spite of a substantial decline in moneyraised by banks and financial institutions. This revival of the primary market ismainly due to the increase in issues from the IT sector. During 1999-2000, theIT sector issued 32 new issues accounting for Rs.495 crore which is significantlyhigher than Rs.39 crore raised through 4 issues by this sector during 1998-99
However, the recent meltdown of the Information Technology (IT) stocks islikely to have a negative impact on the market. The RBI Annual Report 1999-2000 points out that the CNX IT Index has declined by 47.0% between end-March 2000 and end-July 2000. Another feature that has come up lately is thatthe movement in stock prices in India (particularly IT stocks) seems to havebecome correlated with international stock price movements25 . The interestrate hike by the Federal Bank of USA is likely to have a depressing impact onthe international stock markets. Also the increased volatility of the Indiancurrency in the foreign exchange market is likely to affect the stock markets inIndia. The cumulative effect of these factors can put a brake on the revival ofthe primary market in India.
23 WIDER (1990): �Foreign Portfolio Investment in Emerging Markets� Study Group. Series no. 5.24 �Reforms in The Financial Sector and Capital Markets� Prime Minister�s Council on Trade andIndustry. 25 See chart A2 in the Appendix.
55 56

APPENDIXFigure A1: Figures Showing Monthly Secondary Market Data Based on BSE Sensex
Market Capitalization (in Rs. crore)
Depth of Stock Market (Market Capitalization/IIP)
Turnover (in Rs. crore)
Source : RBI Handbook of Statistics on Indian Economy, 1999
APPENDIX
Liquidity 1 (Turnover/IIP)
Liquidity 3 (turnover/volatility)
Liquidity 2 (Turnover/Market Capitalization)
Source : RBI Handbook of Statistics on Indian Economy, 1999
57 58
Rs.
cror
eR
s. cr
ore

Appendix to Section 3
Table A1: Stock Market Trading Profile in India
Representation by Representation by1995-96 Market Cap Trading Value
Market Cap Trading Market Cap TradingValue Value
Top 25 companies 40.35 44.71 19.1 54.56Top 50 companies 51.44 49.33 30.85 61.36Top 100 companies 62.51 53.97 39.51 68.48Top 250 companies 76.37 65.26 52.91 78.41Top 500 companies 85.35 70.77 66.58 85.84Top1000 companies 92.42 77.24 76.66 92.44
Representation by Representation by1997-98 Market Cap Trading Value
Market Cap Trading Market Cap TradingValue Value
Top 25 companies 52.8 60.55 30.85 84.5Top 50 companies 66.65 74.8 44.42 91.4Top 100 companies 77.78 89.28 55.57 96.64Top 250 companies 87.98 98.32 83.35 99.38Top 500 companies 93.22 99.5 88.27 99.81Top1000 companies 96.6 99.82 91.54 99.96
Trading Pattern
Trading Frequency NumberRange of Companies
100% - 90% 44490% - 80% 20880% - 70% 19470% - 60% 22160% - 50% 22550% - 40% 24940% - 30% 256< 30% 3569
5366
Source: �REFORMS IN THE FINANCIAL SECTOR AND CAPITAL MARKETS�by Prime Minister�s Council on Trade and Industry
Table A2: Credit to The Industrial Sector
Assistance Distributed by Financial InstitutionsYear Total Credit
to Medium and All IDBI IFCI ICICILarge firms
1990-91 44508 12810 3613 1574 19681991-92 47090 16260 4822 1604 23511992-93 58636 23150 6084 1733 33151993-94 57865 26624 7703 2163 44131994-95 74672 33568 10300 2839 68791995-96 93053 38650 10178 4563 71201996-97 102604 42657 10799 5157 111811997-98 117530 56258 14835 5650 158071998-99 130516 59072 14301 4750 19225
Source: Handbook of Statistics on Indian Economy, RBI, 1999
Chart A 2:
Source: RBI Annual Report 1999-2000.
Table A3: Large Issues During 1998-99Name of the Company Type of Type of Issue Offer
Issue Instru date sizement
The Industrial Credit & Invt.Corp.of India Ltd. Public Bonds 27/04/98 300.00The Industrial Credit & Invt.Corp.of India Ltd. Public Bonds 16/07/98 300.00The Industrial Credit & Invt.Corp.of India Ltd. Public Bonds 27/08/98 300.00Industrial Development Bank of India Public Bonds 21/09/98 750.00The Industrial Credit & Invt.Corp.of India Ltd. Public Bonds 26/10/98 400.00The Industrial Credit and InvestmentCorporation .of India Ltd. Public Bonds 09/12/98 300.00Industrial Development Bank of India Public Bonds 21/12/98 750.00The India Cements Ltd. Rights Equity 28/12/98 160.84The Industrial Credit & Invt.Corp.of India Ltd. Public Bonds 21/01/99 300.00Industrial Development Bank of India Public Bonds 22/02/99 750.00The Industrial Credit & Invt.Corp.of India Ltd. Public Bonds 10/03/99 300.00
Source: SEBI Annual Report
59 60
Movements in BSE Sensitive Indexand Nasdaq Composite Index
5200
4700
4200
3700
3200
2700
2200
6100
5600
5100
4600
4100
3600
3100
1 A
pr 9
9
12 M
ay 9
9
18 J
un 9
9
26 J
ul 9
9
30 A
ug 9
9
6 O
ct 9
9
15 N
ov 9
9
22 D
ec 9
9
1 F
eb 0
0
8 M
ar 0
0
17 A
pr 0
0
24 M
ay 0
0
26 J
un 0
0
21 J
ul 0
0
Nas
daq
BS
E S
ense
x
BSE
Nasdaq
(In per cent)
(In per cent)
(In Rs. crore)
(In Rs. crore)

Tab
le A
4:B
reak
up o
f F
inan
cial
Sav
ings
by
the
Hou
seho
ld S
ecto
r
19
80-8
119
89-9
019
90-9
119
91-9
219
92-9
319
93-9
419
94-9
519
95-9
619
96-9
719
97-9
819
98-9
9
1. G
ross
Fin
anci
al sa
ving
s12
118
4823
358
908
6807
780
386
1094
8514
5382
1233
8115
4200
1785
7620
7841
1.1
Cur
renc
y16
2576
5562
5181
5765
6213
367
1591
616
525
1364
312
780
2213
11.
2 B
ank
Dep
osits
5550
1398
718
777
1788
029
550
3620
055
834
3994
150
902
7951
476
590
1.3
Loa
ns to
Com
pani
es37
818
3912
8622
1860
3511
654
1154
713
198
2598
077
7515
376
1.4
Insu
ranc
e Fu
nds
915
4415
5599
7003
7114
9548
1137
013
894
1612
119
431
2276
61.
5 Pr
ovid
end
and
Pens
ion
Fund
s21
2295
0811
155
1250
114
814
1822
621
295
2231
125
617
3280
838
742
1.6
Cla
ims
on G
over
nmen
t71
267
5878
8348
4538
8569
0813
186
9588
1178
422
164
2700
41.
7 Sh
ares
and
Deb
entu
res
412
2655
4972
6800
8212
1006
713
474
8839
6645
3777
4935
1.8
Uni
ts o
f U
TI
3121
7934
3890
8756
1247
0539
0826
237
7659
556
51.
9 O
ther
Ass
ets.
373
-763
-453
-414
-139
8-1
190
-114
8-1
177
-268
-268
-268
Shar
e of
Var
ious
Sav
ings
Ins
trum
ents
in F
inan
cial
Sav
ings
by
the
Hou
seho
ld S
ecto
r
1980
-81
1989
-90
1990
-91
1991
-92
1992
-93
1993
-94
1994
-95
1995
-96
1996
-97
1997
-98
1998
-99
1.1
Cur
renc
y13
.41
15.8
710
.61
11.9
88.
1612
.21
10.9
513
.39
8.85
7.16
10.6
51.
2 B
ank
Dep
osits
45.8
029
.00
31.8
826
.26
36.7
633
.06
38.4
132
.37
33.0
144
.53
36.8
51.
3 L
oans
to
Com
pani
es3.
123.
812.
183.
267.
5110
.64
7.94
10.7
016
.85
4.35
7.40
1.4
Insu
ranc
e F
unds
7.55
9.15
9.50
10.2
98.
858.
727.
8211
.26
10.4
510
.88
10.9
51.
5 P
rovi
dend
and
Pen
sion
Fun
ds17
.51
19.7
118
.94
18.3
618
.43
16.6
514
.65
18.0
816
.61
18.3
718
.64
1.6
Cla
ims
on G
over
nmen
t5.
8814
.01
13.3
87.
124.
836.
319.
077.
777.
6412
.41
12.9
91.
7 Sh
ares
and
Deb
entu
res
3.40
5.50
8.44
9.99
10.2
29.
199.
277.
164.
312.
122.
371.
8 U
nits
of
UT
I0.
264.
525.
8413
.35
6.98
4.30
2.69
0.21
2.45
0.33
0.27
1.9
Oth
er A
sset
s.3.
08-1
.58
-0.7
7-0
.61
-1.7
4-1
.09
-0.7
9-0
.95
-0.1
7-0
.15
-0.1
3
Sour
ce: R
epor
t on
Cur
renc
y an
d Fi
nanc
e, v
ario
us is
sues
BIBLIOGRAPHY
1) Abegglen, J. C. and G. C. Stalk (1985): The Japanese Corporation, New York:Basic Books Inc.
2) Atkin, M and J. Glen (1992): �Comparing Capital Structure Around the Globe:The International Executive, 34, 369-387.
3) Balasubramanian, N. (1993): Corporate Financial Policies and FinancialReturns-The Indian Experience (Bombay: Himalaya Publishing House).
4) Bhaduri, Saumitra N. and S. Tholkappian (1999): �Capital Structure Choicein an Emerging Economy: Some Evidence from the Indian Corporate Sector�Working Paper, Madras School of Economics, Madras.
5) CMIE (1999): Corporate Sector, Economic Intelligence Service, May 1999.Mumbai, India.
6) CMIE (2000): Industry Financial Aggregates & Ratios, , Economic IntelligenceService, June 2000.
7) Cobham, David and Ramesh Subramaniam (1995): �Corporate Finance inDeveloping Countries: New Evidence for India� CRIEFF Discussion PaperSeries no 9512, University of St. Andrews, Scotland.
8) Corbett, J. and T. Jenkinson (1994): �The financing of Industry, 1970-89: anInternational Comparison�, CEPR Discussion Paper 948.
9) Corbett, J. T. Jenkinson (1994): �The financing of Industry, 1970-89: anInternational Comparison�, CEPR Discussion Paper 948.
10) Demirgrüç-Kunt Asli (1992): �Developing Country Capital Structures andEmerging Stock Markets�- World Bank Policy Research Working Paper 933.
11) Demirgrüç-Kunt Asli and Vojislav Maksimovic (1994): �Capital Structuresin Developing Countries: Evidence from Ten Countries� � World Bank PolicyResearch Working Paper no. 1320.
12) Demirgrüç-Kunt Asli and Vojislav Maksimovic (1995): �Stock MarketDevelopment and Firm Financing Choices� � World Bank Policy ResearchWorking Paper 1461.
13) Demirgrüç-Kunt Asli and Vojislav Maksimovic (1996): �Stock MarketDevelopment and Financing Choices of Firms� in The World bank EconomicReview. Vol. 10, No. 2.
14) Economic Survey, Government of India. Various Issues.
15) EPW Research Foundation (1996): �High Costs of Funds Forces IndustrialSlowdown� Economic and Political Weekly, August 10.
61 62
(In
Rs.
cror
e)
(In
per c
ent)

16) Glen, Jack and Brian Pinto (1994): �Debt or Equity? How Firms in DevelopingCountries Choose�, IFC Discussion Paper 22.
17) Harris, M. and A. Raviv (1991): �The Theory of Optimal Capital Structure�Journal of Finance, 48: 297-356. March
18) Henry, P B (2000): �Do Stock Market Liberalizations Cause InvestmentBooms?� Working Paper, Stanford University, Stanford.
19) Henry, P.B., (2000b). �Stock Market Liberalization, Economic Reform, andEmerging Market Equity Prices�. Journal of Finance 55, 529-564.
20) IFC (1991): �Financing Corporate Growth in the Developing World�, IFCDiscussion Paper, No. 12.
21) Khanna, Sunil (1999); �Financial Reform and Industrial Sector in India�Economic and Political Weekly, November 6.
22) Levine, Ross (1996): �Stock Markets, Banks, and Economic Growth�-PolicyResearch working Paper no. 1678. World Bank.
23) Levine, Ross (1997): �Financial Development and Economic Growth: Viewsand Agenda� -Journal of Economic Literature, pp. 688-726.
24) Levine, Ross and Zervos Sara (1996):�Stock Markets, Banks and EconomicGrowth�-Pol icy Research working Paper no. 1690. World Bank.
25) Levine, Ross. and Zervos, S. (1998). �Stock markets, banks, and economicgrowth�. American Economic Review 88, 537-558.
26) Mayer, Colin (1988), �New Issues in Corporate Finance� in EuropeanEconomic Review, 32, 1167-1189.
27) Mayer, Colin (1989), �Myths of the West: Lessons from Developed Countriesfor Development Finance� World Bank Working Paper no. 301.
28) Mayer, Colin (1990), �Financial Systems, Corporate Finance and EconomicDevelopment� in Asymmetric Information, Corporate Finance andInvestment, R. Glen Hubbard, Editor, The University of Chicago Press,Chicago and London.
29) Nagraj. R. (1996) : � India�s Capital Market Growth - Trends, Explanationsand Evidences.� - Economic and Political Weekly, Vol XXXI, Nos 35, 36, 37.
30) Pethe, Abhay and Ajit Karnik (2000): �Do Indian Stock Markets Matter?Stock Market Indices and Macro-economic Variables� Economic and PoliticalWeekly, January 29.
31) Prime Minister�s Council on Trade and Industry: Reforms in the FinancialSector and Capital Markets. Government of India.
32) RBI (1999): Handbook of Statistics on Indian Economy, Reserve Bank ofIndia, Mumbai.
33) Reserve Bank of India Annual Report. Various Issues.
34) S. C. Myres, �The Capital Structure Puzzle� Journal of Finance, July 1984.
35) Samuel, Cherian (1996), �The Stock Market as a Source of Finance: AComparison of U.S. and Indian Firms� World Bank Policy Research WorkingPaper 1592.
36) Samuel, Cherian (1996): Internal Finance and Investment: Another Look,World Bank Policy Research Working Paper, 1663.
37) SEBI (1998): �Indian Securities Market: Agenda for Reform� in Bankingand Financial Sector Reforms in India. Edited by Raj Kapila and Uma Kapila,Academic Foundation, New Delhi.
38) Sen, Kunal and Rajendra R. Vaidya (1997): The Process of FinancialLiberalization in India, Oxford University Press. New Delhi.
39) Singh, A and Hamid, J (1992): �Corporate Financial Structures in DevelopingCountries�, IFC Technical Paper 1, Washington D. C.
40) Singh, A (1995): Corporate Financial Patterns in Industrializing Countries:A Comparative International Study. IFC Technical Paper No. 2.
41) Singh, A., (1998): �Liberalization, the Stock Market and the Market forCorporate Control: A Bridge too Far for the Indian Economy?� in India�sEconomic Reforms and Development: Essays for Manmohan Singh editedby Isher Judge Ahluwalia and I. M. D. Little, Oxford University Press, NewDelhi.
42) Stiglitz, J E (1993): �The Role of State in Financial Markets� Proceedings ofthe World Bank Annual Conference on Development Economics.
43) Taggart, Jr. R. A. (1985): �Secular Patterns in the Financing of USCorporations� in B. M. Friedman ed. Corporate Capital Structure in theUnited States, Chicago University Press, Chicago.
44) WIDER (1990): �Foreign Portfolio Investment in Emerging Markets� StudyGroup. Series no. 5.
63 64