ed 019 691 al 000 835 some determinants of …
TRANSCRIPT

R E P O R T R E S U M E S
ED 019 691 AL 000 835SOME DETERMINANTS OF STYLISTIC PHONOLOGICAL VARIATIONS.BY- IANNUCCI, DAVID AND OTHERSMRS PRICE MF -$0.25 HC-$1.40 33P.
DESCRIPTORS.... *ARTICULATION (SPEECH), 'AMERICAN ENGLISH,PHONOLOGY, LANGUAGE RESEARCH,.*PSYCHOLINGUISTICS, PHONETICS,PHONEMICS, SPEECH, *PRONUNCIATION; WORD FREQUENCY, LANGUAGE,
THE PURPOSE OF THIS RESEARCH WAS TO EXPLORE SOME OF THEVARIABLES THAT INFLUENCE INTRAINDIVIDUAL PHONETIC VARIATIONIN CERTAIN ASPECTS OF AMERICAN ENGLISH SPEECH. FORTY COLLEGESTUDENTS PARTICIPATED IN THE EXPERIMENT. EACH PERFORMED TWOTASKS-*(1) READING ALOUD WORDS (16 IN EACH OF FIVECATEGORIES) FROM FLASHCARDS AS PART OF AN OSTENSIBLE LEARNINGTASK AND (2) READING THROUGH THE SAME LIST OF WORDS WITHINSTRUCTIONS TO PRONOUNCE THEM "CLEARLY AND ACCURATELY." TWOOF THE CATEGORIES INVOLVED SUBPHONEMIC OR ALLOPHONICDISTINCTIONS AND THREE INVOLVED THE RETENTION OR LOSS OF ONEPHONEME..EACH CATEGORY HAD TWO STYLISTIC VARIANTS-A FORMALALTERNANT (FA) AND A CASUAL ALTERNANT (CA). A SIGNIFICANTLYHIGHER USE OF FA PRONUNCIATIONS WAS FOUND IN THE SECONDCONDITION (CLEAR PRONUNCIATION) THAN IN THE FIRST FOR ALLFIVE CATEGORIES. THE CATEGORIES INVOLVING SUBPHONEMICDISTINCTIONS ELICITED MUCH LOWER FA RESPONSES THAN THECATEGORIES INVOLVING THE LOSS OF A PHONEME, AND THEIRVARIANCE INCREASED FROM CONDITION 1 TO CONDITION 2. THIS WASATTRIBUTED TO THE EMIC/ETIC DIFFERENCE. FINDINGS ALSOINDICATED THAT WORD FREQUENCY AND STATUS ARE RELEVANTVARIABLES TO THE CHOICE BETWEEN FA AND CA, AS IS A PERSON'SSPEED OF ARTICULATION. (DO)
Some Determinants of Stylistic Phonological Variations
David Iannucci, Lynn Liben, and Moshe Anisfeld
Cornell University
An investigation was made of factors that influence the choice of
alternate stylistic pronunciations of words in five categories, exemplified
by: (a) citx, the Formal Alternant (FA) [sitiy} versus the Casual Alternant
(CA) Dilly]; (b) patt-,lye FA [pazitivj versus CA Epazikv1; (c) twenty,
FA Etwentiy] versus CA [tweiiiyi ; (d) kIncl, FA [kaynd] versus CA [kayo);
and (e) fists, FA [fists) versus CA Efissi. Each S first read aloud words.
16 in each categoryfrom flashcards as part of an ostensible learning task
and then read through the same list of words under instructions to pronounce
the words "clearly and accurately." A significantly. higher use of FA prow
nunciations was found in the second condition than in the first for all
five categories. Categories (a) and (b) elicited much lower FA responses
than Categories (c), (d) and (e) and their variance increased from condition
1 to condition 2. This was attributed to a structural difference setting
off (a) and (b) from the rest. Findings also Indicated that word Frequency
and Status are relevant variables to the choice between FA and CA, as is
Ws Speed of articulation.
U.S. DEPARTMENT OF HEALTH, EDUCATION & WELFARE
OFFICE OF EDUCATION
THIS DOCUMENT HAS BEEN REPRODUCED EXACTLY AS RECEIVED FROM THE
PERSON OR ORGANIZATION ORIGINATING IT. POINTS OF VIEW OR OPINIONS
STATED DO NOT NECESSARILY REPRESENT OFFICIAL OFFICE OF EDUCATION
POSITION OR POLICY.
AL 000 835
Some Determinants of Stylistic Phonological VariationsI
David Iannucci Lynn Liben, and Moshe Anisfeld
Cornell University
The purpose of the experiment reported here was to explore some of
the variables that influence intraindividual phonetic variation in certain
aspects of American English speech. It is well known that there are dif-
ferences, both dialectal and idiolectal, in the styles of speech among
members of the same linguistic community. The concern of this study, bow
ever, is not with intraindividual differences in speech but with intra-
individual, variation. A general linguistic treatment of speech styles
is provided by Joos (1961), and a sociolinguistic one by Labov (1966).
A number of variables might be postulated as related to the observed
variations in an individual's style of speech. One of the most obvious
factors is the nature of the communication situation. Thus, for instance,
when an individual delivers a formal lecture he is likely to enunciate
more carefully than when he engages in a casual conversation with E. friend,
The two situations, of course, differ considerably in the content of corn.
munication and in syntax, but our concern here is only with phonetic dif
ferences. The degree of formality of the situation, however, is not the
only variable affecting the quality of speech: even in one situation, words
of similar phonological shape may be pronounced differently by the same
speaker. Such differences in pronunciation seem to depend on certain charac-
teristics of the individual words used. Two variables which may be relevant
-1-
lannucci -2-
in this respect are: (a) the frequency of usage of a word, and (b) its place
on a dimension ranging from colloquial to formal. The meaning of this
dimension will become clearer in the discussion of the five phonetic alter-
nations chosen for investigation. They are as follows.
(a) In the environment (S = syllabic, primary stress, *' =
weak stress), /t/ is usually realized as a voiced alveolar flap, ['J, a
sound very much like the Spanish one-tap [F] in Es..,ra (for) and peso (but).
So, for example, the /t/ of cif is usually pronounced with this flap rather
than the voiceless alveolar stop Et) which occurs for /t/ in the reverse of
the above environment, i.e., S S, as in attend. However, in the environ-
ment cited for the occurrence of the flap[r1 in English, the stop Etj
sometimes does occur in a formal style of speech. So that, whereas Oa
is usually pronounced as Esiii0, in formal speech it is occasionally prow
nounced as [sitiy], especially when the word is being emphasized by the
speaker for some reason.
There has been some controversy over the exact nature of the alveolar
flap; e.g., to what extent it is voiced, its duration, its degree of tense.
ness, and its distribution. For a brief discussion and further references,
see Sharf (1960, p. 105). But no one denies that this sound is distin-
guishable from a clearly articulated [t]. We accept as a working criterion
for identification, Francis' (1958, p. 89) characterization of the sound:
"In all cases it [the flap] is apico-alveolar and at least partially voiced,
though the exact point at which the tongue tip touches the alveolar ridge,
the duration of contact and the amount of voice used all vary from region
to region and from speaker to speaker."
In the above stylistic alternation, Lt] is more characteristic of a
Iannucci -3..
formal style than is Ei.1; thus [t] and [it] will be called respectively the
Formal Alternant (FA) and the Casual Alternant (CA). This is by no means
an absolute classification; the FA is only relatively more formal than the CA.
In the above alternation, as well as in the four which follow, slant
lines / / are used to indicate underlying phonological representation of a
similar nature as that espoused by current generative phonologists (e.g.,
Chomsky, 1964; Halle, 1962) and earlier by Sapir (1933). This level of
representation -- referred to by some as "morphophonemic"entails an abstract
characterization of the sound patterns of a language from which all actually
realized forms may be mapped by series of phonological rules. The forms
that are actually realized in speech are represented here in a "broad"
phonetic notation, designated by brackets r)
(b) The second phonetic variable involves the same alternants as
(a) but in a slightly different environment, g S. Againpft] is the FA
and Lrj is the CA. For example, the casual pronunciation of quality, is
tywaliiiY], and the more formal pronunciation is [kwalitiy).
(c) The third alternation entails words with /nab/ in the environs
ment S S. The FA is [ntl and the CA is IN, e.g., for twenty, Etwentiy3
versus [tweiliy]. The soundriq is a voiced nasalized flap that may infor-
mally be characterized as a flapped [n], with the motion of the tongue
very much like that of Ei3.
(d) The fourth alternation entails words ending in a final consonant
cluster /nd/. Here the FA is [nd] and the CA is [n], e.g., for kind,
[kaynd) versus Dtayni,
(e) The final alternation entails words ending in the cluster /sts /.
Here the FA is [sts] and the CA is [s(4, e.g., for fists, (fists] versus

Iannucci
pris(s)1. The parenthetic [s] indicates an optional lengthening of the
.4-
preceding [s]. For future reference, what will later be called "categories
(a), (b), (c), (d), and (e)" refers back to the above groupings.
Note that an important structural difference sets off categories (a)
and (b) from the rest. The first two categories involve alternate reali-
zations (Et] and [i]) of the same underlying phonological unit (/t/), but
Categories (c), (11), and (e) each involve the retention or deletion of one
underlying unit. Category (c) does involve an alternate realization of
the underlying /n/ ([n] versus[ii3), but the occurrence of the [ri] alter -
nant is an automatic consequence of the deletion of /t/. In terms of
earlier phonemic theory, (a) and (b) might be said to involve subphonemic,
or allophonic, distinctions, whereas (c), (d), and (e) would involve the
retention or loss of one phoneme.
We can now return to two of the variables studied in the experi..
went to be reported. Word Frequency, of course, entails a relative measure
of the commonness of occurrence of words in a language. Word Status is
characterized as follows. English words, besides having a meaning, also
carry a broad range of tones that vary from very casual (or slangy) to very
formal (or stuffy). For example:
slightly
slang colloquial casual formal formal affected
(my)PAD (my)PLACE (my)HOUSE (my)HOME (my)RESIDENCE (my)DOMICILE
(The labels "slang," etc., are meant only as a mnemonic guide.) All six
words denote the same referent: where I live. But there is a gradual in-
crease in the formality of tone of these words as one goes from left to
Iannucci.5_
right on the above line. Thus, my place has more of a casua Status than
does my residence.
It is quite probable that Status and Frequency are in general highly
correlated. It should not be surprising that words with a formal tone are
relatively; infrequent in our speech, since most speech generally occurs in
fairly informal situations.
One of the purposes of this experiment was to investigate whether
Status and/or Frequency have an effect on the choice of alternants in the
above five categories. Observation suggests that frequent words and low
Status words are more likely to be pronounced casually than infrequent words
and high Status words. For example, under the same conditions, university
would be more likely than permiacity to be pronounced with the CA
(We submit that university is both more frequent and less formal-sounding
than perspicacity.)
The situational variable was introduced into the experiment by simu-
lating for the Ss two speech situations differing in degree of formality.
The first entails an ostensible learning task which requires from S a degree
of attention sufficient to prevent him from consciously monitoring his pro-
nunciation. The second entails an explicit pronunciation task for the same
words involved in the first task,. In both situations, each word was read
by S in citation form in order to control for differences in pronunciation
due to sentential distribution of stress, i.e., all words occurred at the
center of intonation.
It is not expected that these two situations will elicit S's usual
formal and casual styles. They are intended, only to elicit two different
styles such that one style can be assumed to be more formal, in general, than
Iannucci-6-
the other. Under these circumstances, it will be possible to compare the
number of FA pronunciations that occur in each of the five categories in the
two different situations, and also to examine the distribution of FA, pro-
nunciations relative to the Status and Frequency ratings of the words in
which they occur.
Another purpose of this study is to ascertain whether or not the two
situations differ in the speed at which the speakers articulate, since a
more formal situation may elicit a slower articulatory style than a casual
situation. Placement of the formal task second, following the casual task,
may eliminate or at least reduce the potential confounding effect of speed.
Apart from this, the present study will be concerned with speed of articu-
lation as a subject variable in its own right. An attempt will be made to
determine whether people who speak faster produce more formal pronunciations,
for the five phonetic categories discussed, than people who speak at a
slower rate.
Method
Subj ects
The Ss were 19 male and 21 female Cornell University students enrolled
in an introductory psychology course. They represent a broad range of
dialect areas, with the primary concentration in the East: New York Metro-
politan area, 12; other New York State, 9; New Jersey and Pennsylvania, 1&;
New England, 3; South Midland, 2; Deep South, 2; Northern Midwest, 6; and
Far West, 2.

Iannucci
Word List
Twenty words were selected for each of the five categories. These 100
words were rated by 30 females in a Cornell sorority for relative Frequency
(17 raters) and Status (13 raters). The raters were instruoted to consider
both written and spoken usage in the Cornell community, and to rate the words
on the list in relation to one another. Thus, if a Frequency rater thought
that a particular word was one of the most frequent on the list, she was
expected to rate it 5, whereas if she had never seen nor heard it before,
she should have rated it 0. Similarly, if a Status rater thought a parti-
cular word was one of the most casual, she should have rated it 5, whereas
if she thought it was very formal, she should have rated it 1. Intermediate
ratings were expressed by 2, 3, and 4. The average rating was calculated
for each word on the list. The list was then reduced to 80 words to shorten
the length of time needed to run each S. Words were eliminated when it
seemed likely that usage would differ significantly by sex (e.g., cosmetics,
fighter) or to reduce the number of words in any one category with similar
ratings. Frequency was determined in this experiment by student ratings,
rather than by the Thorndike-Lorge count, becaLse of the outdatedness of
the count and its sole reliance on written sources. In a study like this,
commonness of spoken usage is, of course, critical. There is, however, a
high overall correlation between the Frequency ratings obtained in this ex-
periment and the Thorndike-Lorge G count (r = .73, df = 79).
For the experiment proper, the 80 words were randomized and slightly
reordered to avoid two words from the same category following one another.
Three different random orders were used in the experiment. The final list
of words and their Frequency and Status ratings are given in Table 1. To
Iarmucci
facilitate exposition, the Status score for each word was subtracted from 5,
thus a high score on the Status variable in Table 1 and in subsequent dis-
cussions indicates high Status and a low score indicates low Status.
Frequency and Status ratings were significantly correlated for all
words (r = -.69, df = 79, It<.001), and for each category (df = 15), with the
exception of the last: (a) -.56, p K.01; (b) -.77, E (c) -.65,
E<:.001; (d) -.87, p -<-.001; and (e) -.28, VS.
Procedure
Each S took part in two tasks. In the first, the S was told that he
should memorize the words printed on flash cards to be presented to him at
a quick steady rate by the experimenter, He was instructed to read each
word aloud to facilitate his learning and was told that he would be stopped
after each third of the list in order to speak into a microphone to record
all the words he could remember. Actually, the tape recorder was on through-
out the entire experiment. In the second task, the words were presented in
the same way, but this time the Ss were asked to concentrate on "clear and
accurate" pronunciation of each word, and they were assured that recall of
words would not be required.
After an S had completed these two tasks, the E asked him for ques-
tions and comments, explained the experiment, and obtained relevant personal
information. The Ss were also asked about the tape recorder, and their
comments indicated that very few Ss were even suspicious that the tape
recorder was running at all times.
The two tasks, learning and pronunciation, were used to create situ-
ations in which styles of articulation would differ. In the first, the

Iannucci.9_
Unattended speech task (Condition U), the Ss were concentrating on a diffi-
cult learning task, with no reason to believe that pronunciation was the
focus of the experiment. In the second, the Deliberate speech task (Condi-
tion D), their attention was specifically directed towards pronunciation.
Although it is expected that there will be fewer formal pronunciations in
Condition U than in Condition D, it must be emphasized that Condition U can-
not be equated with casual everyday speech. First, the experimental situation
itself is a fairly formal one. Second, the fact that words were presented
in citation form also increases the likelihood of formal pronunciation, in
that each word is in a position of stress equal to that rf the center of
intonation of a sentence. Furthermore, the fact that the words were pre-
sented visually may also have increased the number of formal presentations.
While one E (LL) was exposing the words to S, the other E (DI) noted
which of the two alternants the S produced for each word, and later listened
to the tapes to check his notes. Except for 11 items, 6 in Category (b)
and 5 in Category (e), which were mispronounced, all words were classifiable
as having either the FA or the CA. The mispronounced words were eliminated
from the analysis. When an S mispronounced a word in one Condition, that
word was also eliminated from the analysis of the second Condition. Two
other trained observers each listened to the tapes of six different Ss and
made independent tallies of the occurring alternants for each word. Agree-
ment between E and one judge was 94% and between E and the second judge,
92%. The disagreements were distributed among the categories about evenly,
and about half were cases in which E had classified a pronunciation as for-
mal when the judge had not, and about half were in the opposite direction.
Disagreements in a rating task such as this one must be expected, since in

Iannucci -10-
borderline cases different judges will focus on different features of a sound
to decide how it should be labeled, e.g., for Categories (a) and (b), one
rater might depend more heavily on voicing whereas another might rely on
aspiration or tenseness.
Finally, the tapes were processed through a Brush Recorder Mark II
oscillograph which transforms the sound signal into a line on mark paper.
Rises of the line above a base level indicate sound. The duration of each
word spoken by S could thus be accurately measured. The measurements were
in terms of milliseconds, where 25 mm = 1 sec. Because of the high degree
of sensitivity of the oscillograph, occasional extraneous noise interfered
with the exact measurement of the duration of some words. Because of this,
the tapes of seven Ss which were especially noisy were eliminated altogether
from this analysis. For the remaining Ss, there were only 21 words which
could not be measured because of noise. For these Ss, the average duration
per word in Condition U and in Condition D was calculated. In all cases,
when a word was eliminated from the analysis of one Condition, it was auto-
matically eliminated from the other Condition.
Results
Of the variables manipulated in this experiment, the change in situ-
ation had the strongest effect on the number of FA pronunciations produced
by the Ss. The overall mean number of FA's for all five categories of words
was 24.32 in Condition U, and 28.22 in Condition D, t = 13.55, df = 79,
< .001. As can be seen in Table 1, only four out of the 80 words had
fewer FA's in Condition D than in Condition U, and similarly, only three
Iannucci
out of the 40 Ss in the experiment gave fewer FA's in Condition D. The
effect was also strong for each category considered separately. The t values
for Categories (a), (b), (c), (d), and (e) are 7.72, 4.66, 6.21, 9.06, and
5.19 respectively (for each test, df = 15 and 1(.001). It is notable that
all categories exhibited this situational effect despite differences among
them in other respects. The number of FA's for each word is tabulated in
Table 1 for both Conditions.
Insert Table 1 about here
It can be seen in Table 1 that the number of FA's in Category (a) was
much smaller than in any of the other four categories within each Condition.
All comparisons of (a) with the other four categories in Condition U and in
Condition D are significant beyond the .001 level. The smallest difference
of all comparisons involving Category (a) was in Condition D for (a) minus
(b), and this difference yields a t value (df = 39) of 4.91. Even more
striking are the differences in number of FA's between Categories (a) and
(b) on the one hand and (c), (d), and (e) on the other. The smallest dif-
ference of all comparisons involving Categories (a) or (b) versus any of the
other three categories was between (b) and (d), and even this difference
reached a t value of 7.35. The comparisons among (c), (d), and (e) in
Condition U and in Condition D do not yield significant differences, except
for the difference between (c) and (d) in Condition U (t = 2.06, E .05).
It is clear that, while the tendency in the first two categories was to give
CA pronunciations, the tendency in the last three categories was to give FA
pronunciations.
The first two categories also differ from the last three with regard
1 Iannucci -12-
to how the variation in number of FA's was affected by the situational
change. As can be seen in Table 2, the variances of Categories (a) and (b)
increased significantly from Condition U to Condition D, while those of
Categories (c), (d), and (e) decreased, although only in Category (c) signi-
ficantly so.
Insert Table 2 about here
It can also be seen in Table 2 that the variance differences among
categories changed with the situation: in Condition U the variance of
Category (a) was significantly smaller than that of any other category,
while in Condition D it was Category (c) which was significantly smaller
than all others. Also, in Condition D, the variance in Category (d) was
significantly smaller than in Categories (b) and (e). In Condition U, no
other comparisons, aside from those with Category (a), were significant.
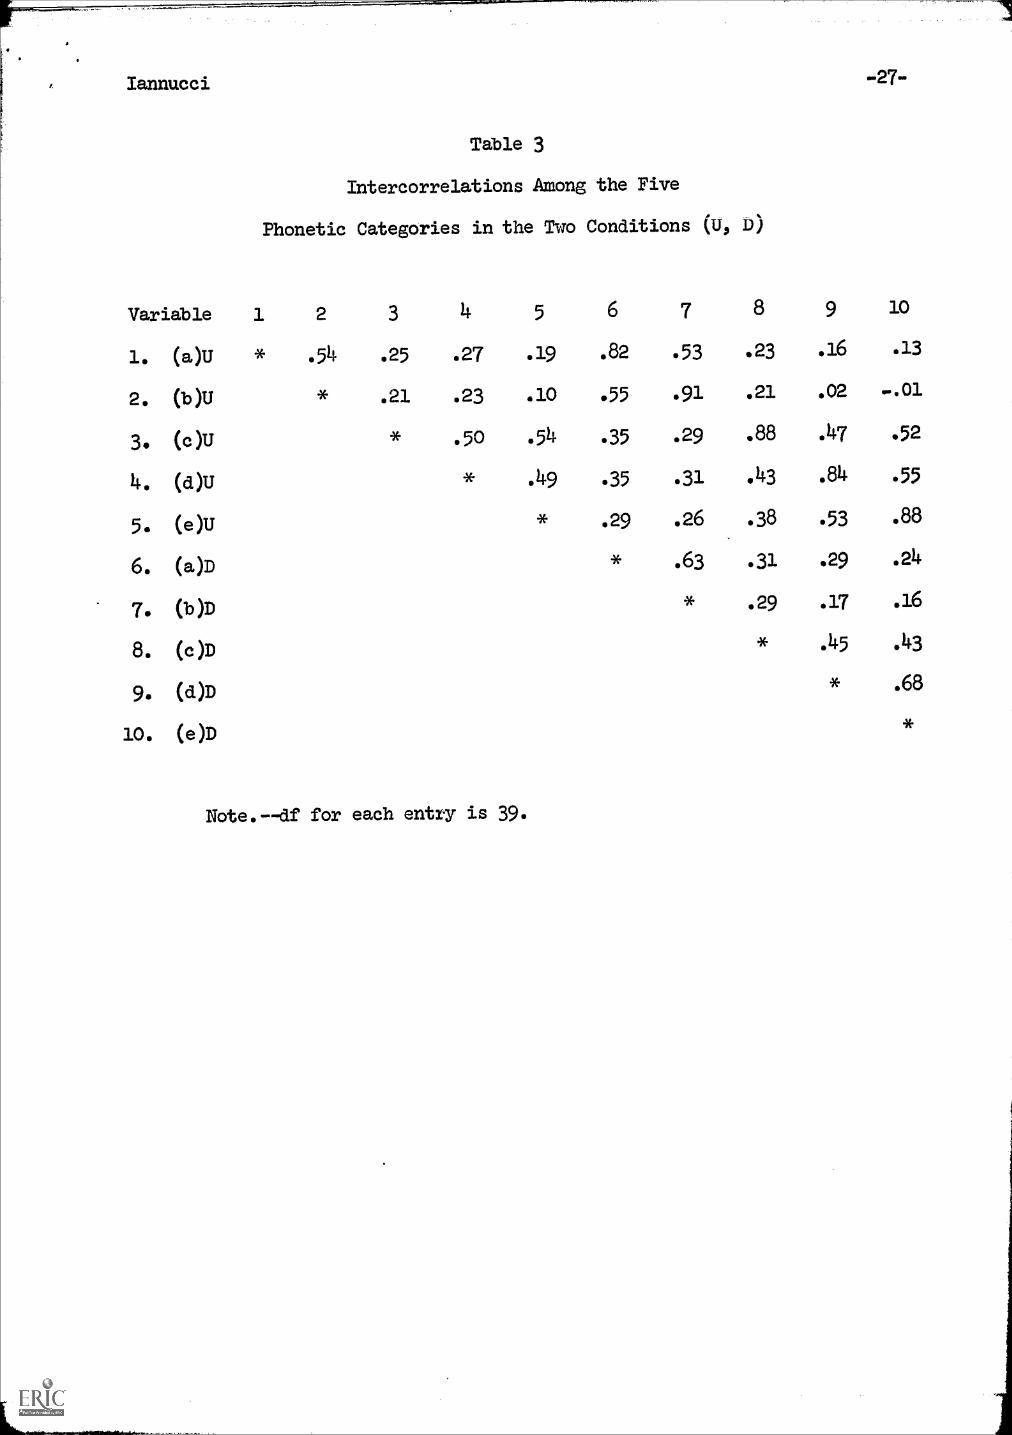
In order to study the relations among the five categories within and
across conditions, the numbers of FA's given by the Ss to each of the five
categories in each of the two conditions were intercorrelated and factor
analyzed. A. principle component solution was used in the analysis and five
factors were extracted to account for the 10 variables. The fifth residual
matrix contained no correlations higher than .08 and only 4% of the total
variance remained unaccounted for after extraction of the five factors. The
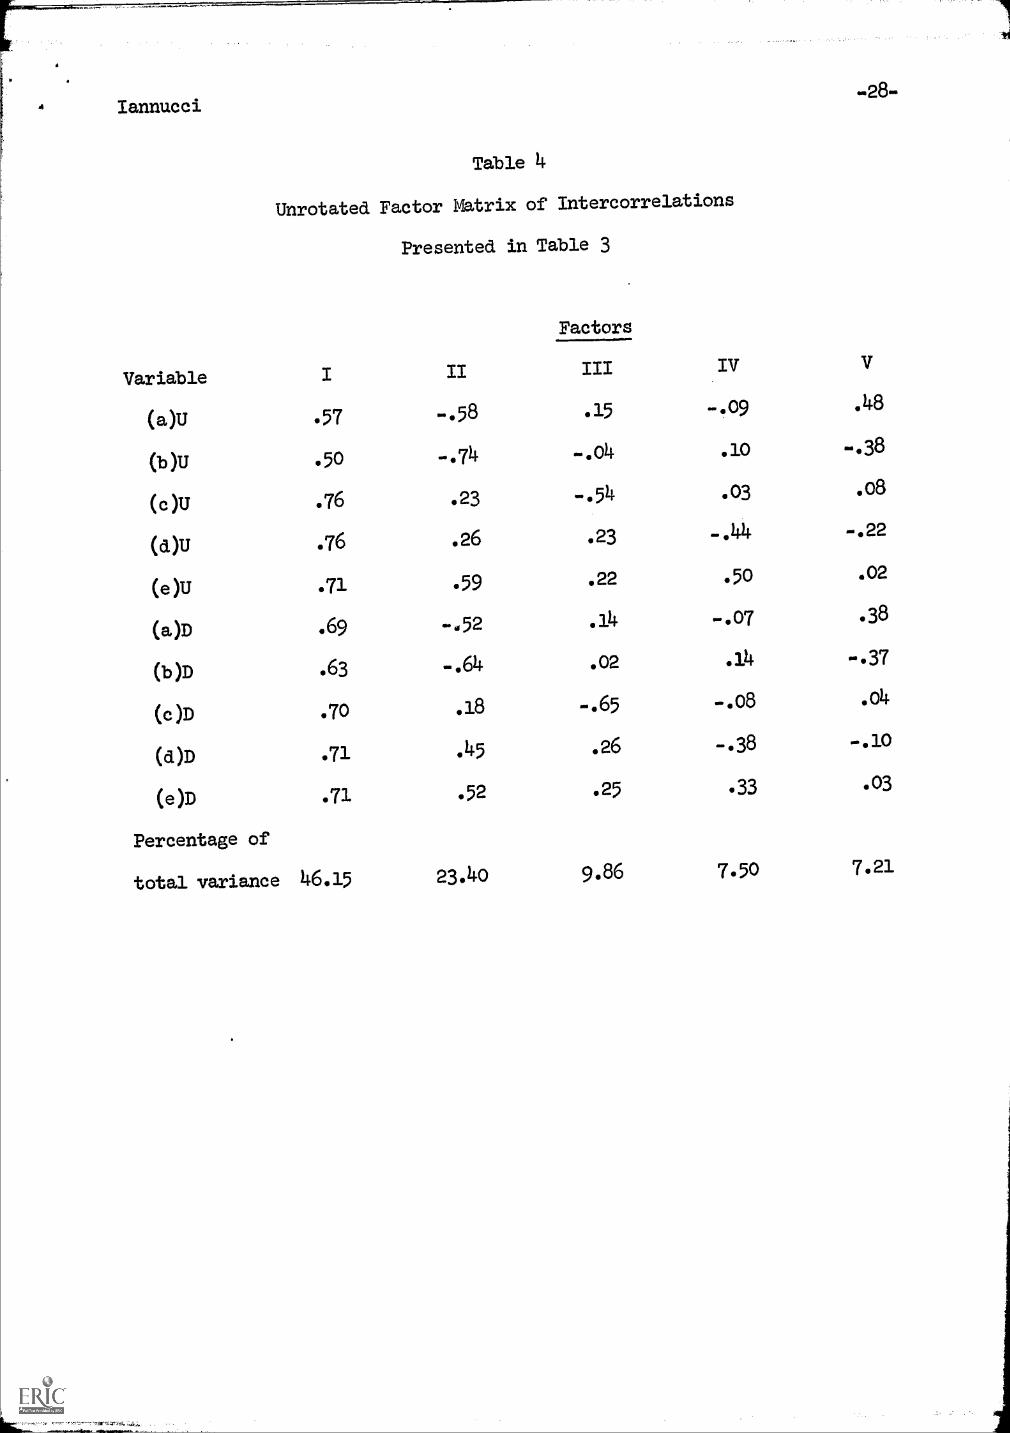
correlation matrix is presented in Table 3 and the unrotated factor matrix
in Table 4. The factor matrix was also rotated but the resulting structure
Insert Tables 3 and 4 about here
is less clearly interpretable than the unrotated matrix and hence is not
presented here.
Iannucci-13-
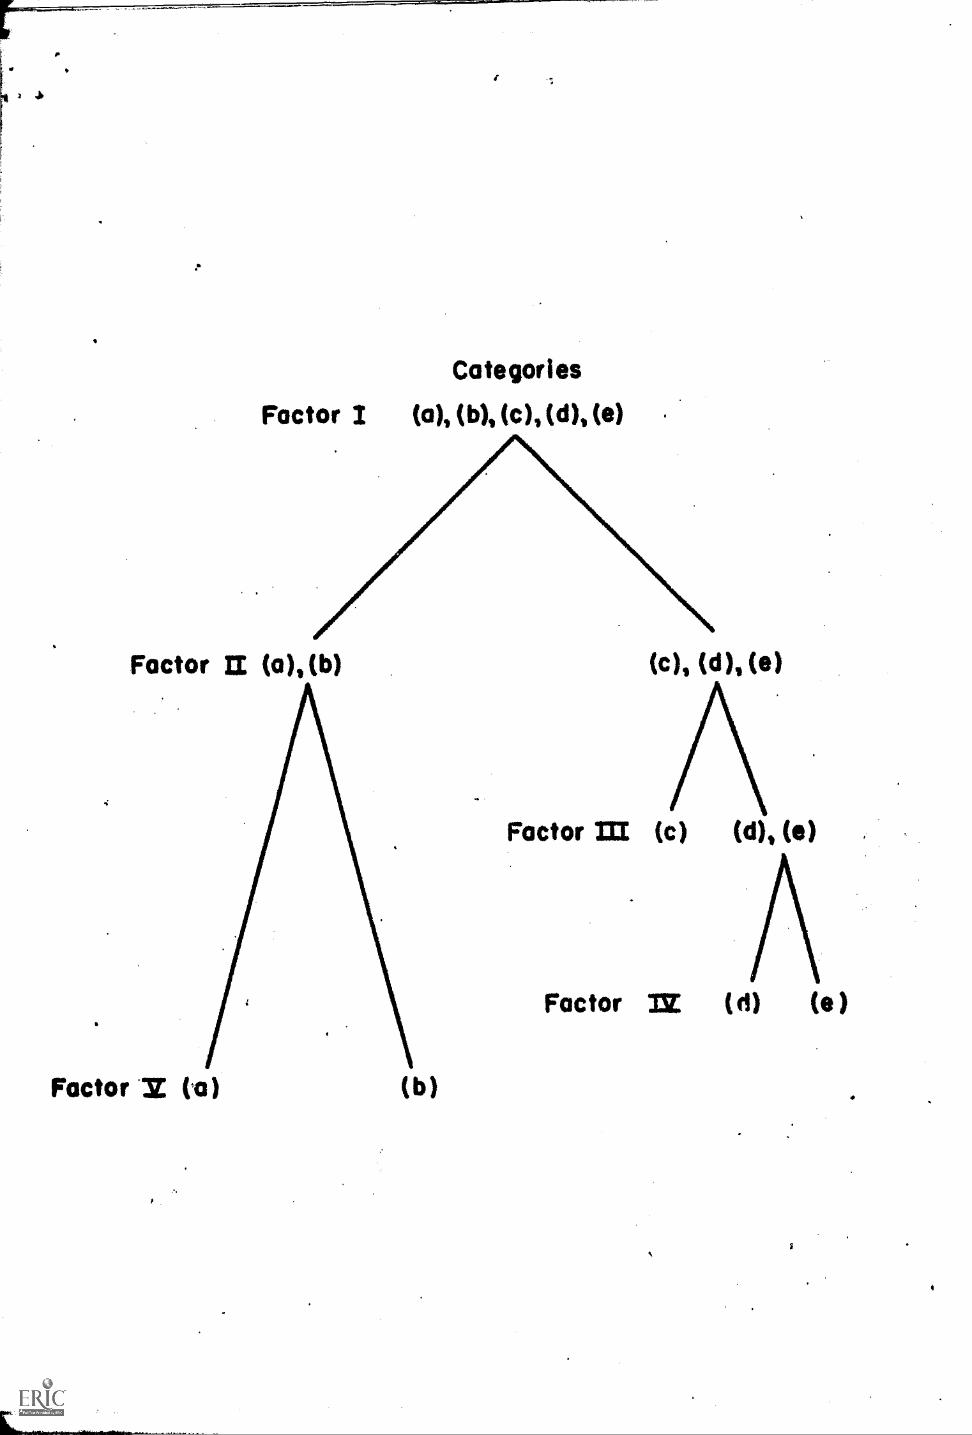
Factor I is clearly a general factor, indicating that Ss who tended
to pronounce words in a relatively more formal manner in one category also
tended to do so in all categories. In other words, this factor reflects the
Ss' general predisposition to respond in a more formal or a more casual
manner.
Factor II separates the first two categories from the last three.
This split has already been indicated by the level of FA responses and by
the variance shifts across conditions. It will be further reinforced in
the relations of the FA responses with Speed, Status, and Frequency.
Factor III shows negligible loadings for Categories (a) and (b). The
other three categories are divided by positive and negative loadings into
Category (c) on the one hand and Categories (d) and (e) on the other.
Factor IV separates Category (d) from Category (e), and Factor V
separates Category (a) from Category (b).
Following Deese's (1965) lead, we present in Figure 1 a graphic rep-
resentation of this factorial structure.
Insert Figure 1 about here
It is noteworthy that the situational variable is not reflected in
the factor matrix, indicating that the increase in number of FA responses
in Condition D left the relative standing of each S le 'gely unchanged. This
stability is clearly indicated by the high correlations in Table 3 across
conditions within categories (all above .80).
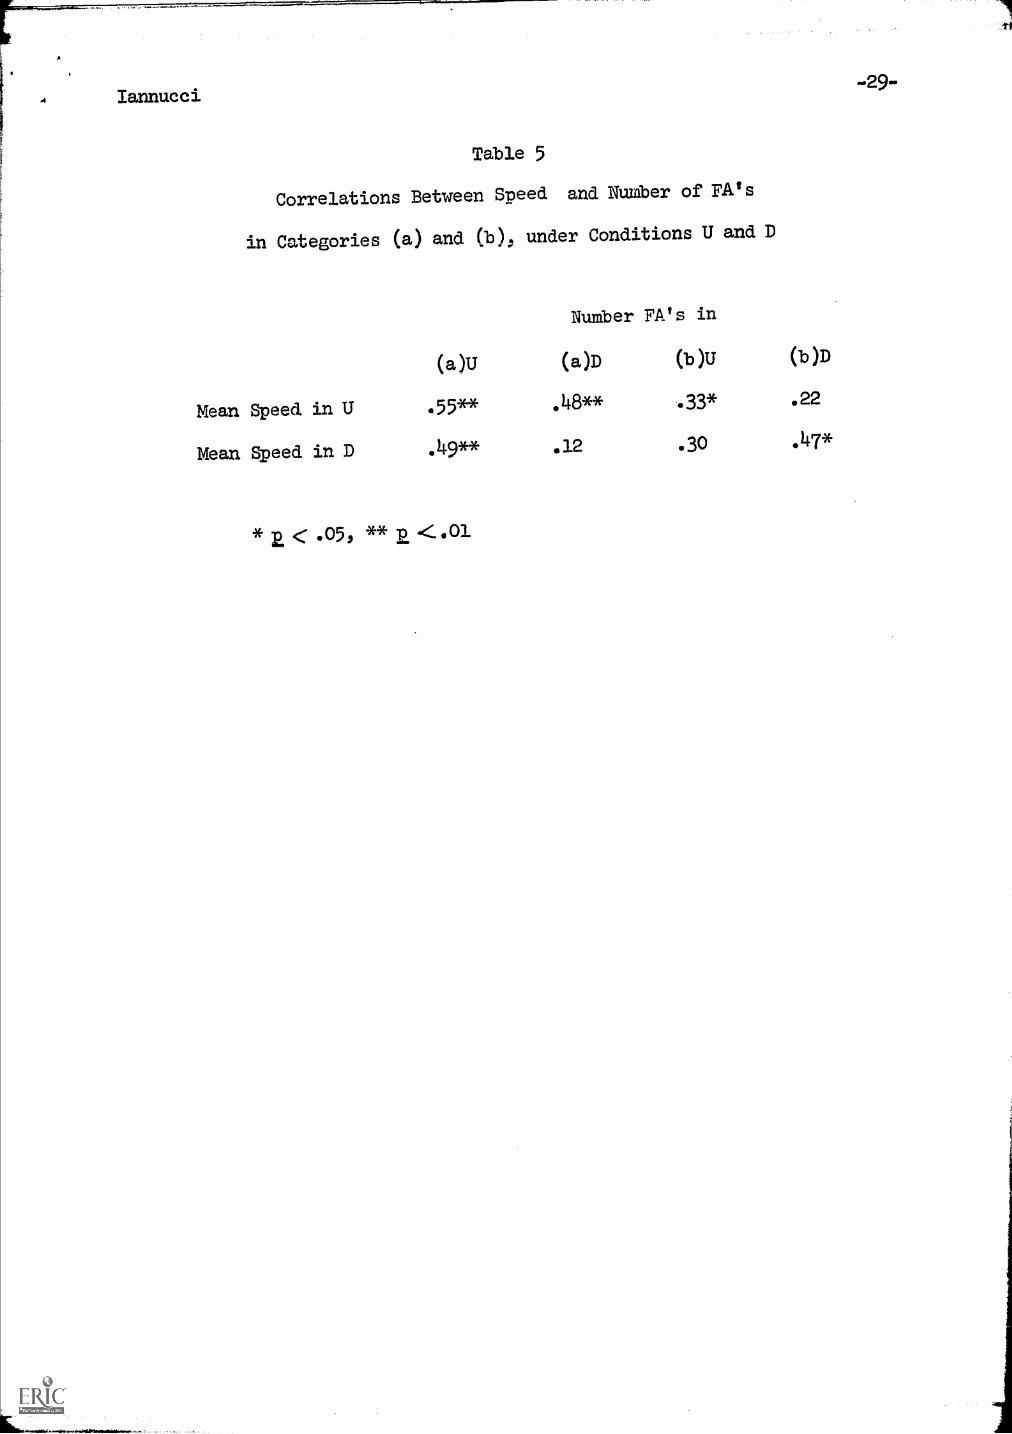
One subject variable, i.e., Speed of articulation, was specifically
examined in this study. The average times taken by the Ss to produce the
words in Condition U and in Condition D were correlated with their FA scores
Iannucci
in each of the five categories under both conditions. None of the correla-
tions with Categories (c), (d), and (e) were significant. The correlations
with Categories (a) and (b) are presented in Table 5. As can be seen, even
for these categories, Speed reaches significance only in five out of the
eight comparisons.
Insert Table 5 about here
In view of these correlations it was necessary to test whether Condi-
tions U and D differed with respect to Speed. This comparison showed no
difference (t = .01, df = 39) between the mean Speed per word per S in Con-
dition U (16.42 mm, 25 mm = 1 sec) and the mean Speed in Condition D (15.88
mm). It is thus clear that although slower speakers tended to produce more
FA's than faster speakers, the conilribution of the situational variable was
independent of this effect.
So far we have discussed the effects of the situational, categorical,
and subject variables on number of FA responses. It remains now for the
results of the two word variables, Status and Frequency, to be reported. Be-
cause of the variance differences among the categories, a nonparametric sta-
tistic, the chi square, was used to assess the relation between these
variables and the number of FA responses in each category under each condi-
tion. For purposes of this analysis, the 16 words in each category were
divided into equal groups, those eight having the highest Status ratings in
one group and those eight having the lowest Status rating in the other--and
similarly for Frequency. The proportion of FA's in the High half was com-
pared with the proportion in the Low half for each category and each condi-
tion, for Status and Frequency. The results of this analysis are displayed
Iannucci -15-
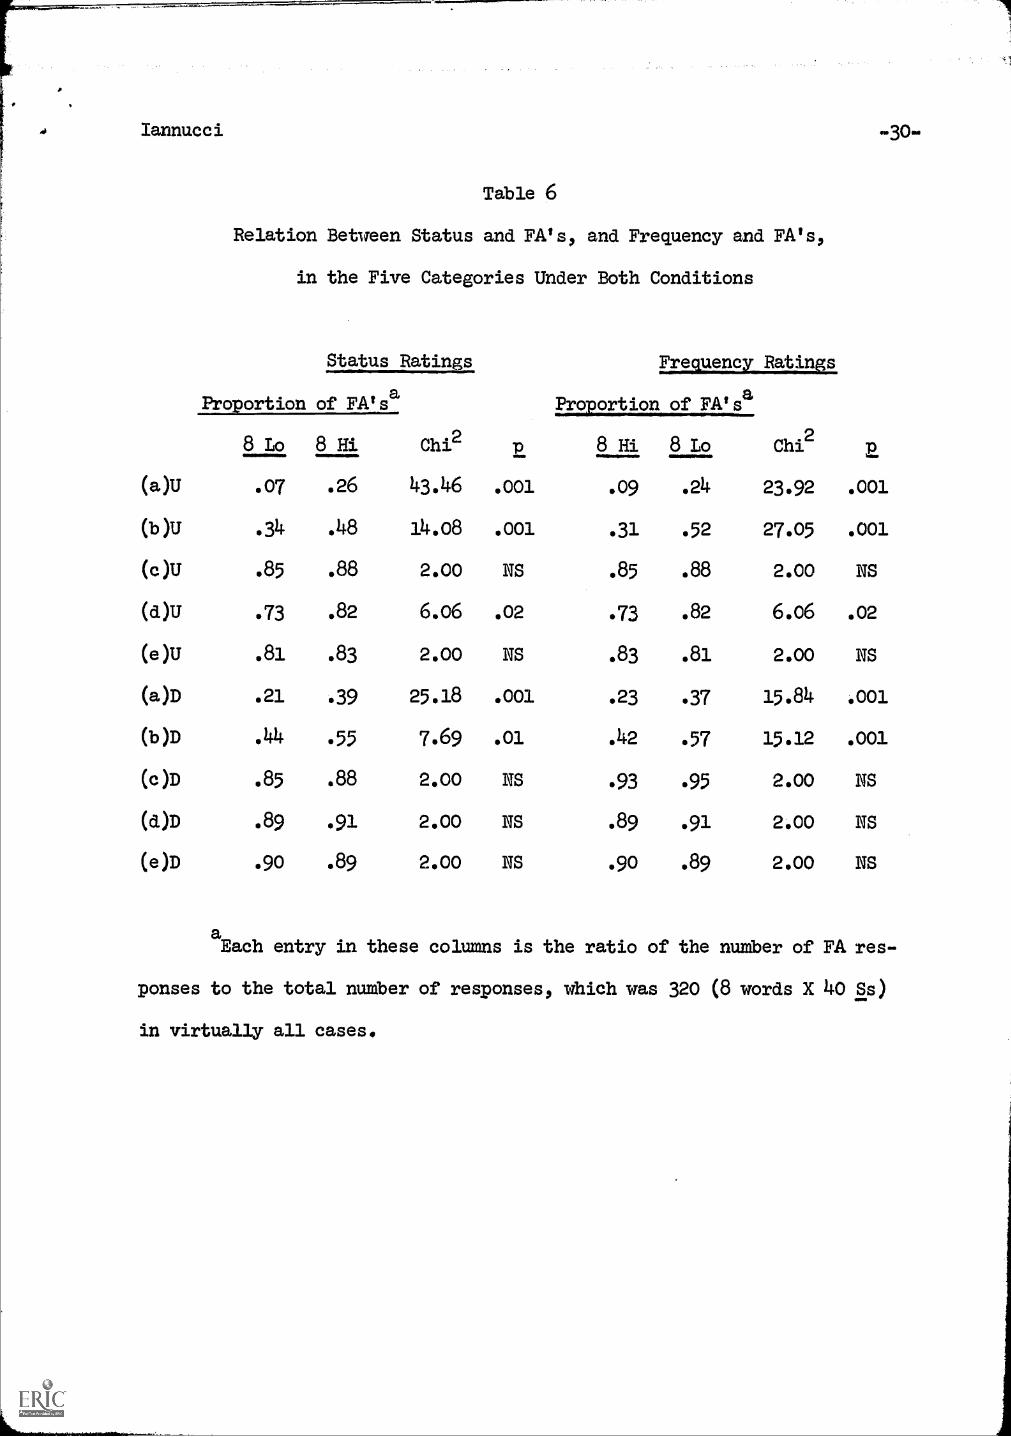
in Table 6. As can be seen, Status and Frequency are significantly related
to number of FA responses for Categories (a) and (b) in both Conditions, and
for Category (d) only in Condition U and at a relatively low level of sig-
nificance.
Insert Table 6 about here
Discussion
The results single out the situational variable as the strongest and
most pervasive of the variables considered here. The Ss, when confronted
with explicit directions for clear and accurate pronunciation in Condition
. , .
D, increased markedly, as might be expected, their use of the formal alter-
nants over the level of these alternants in the ostensible learning task of
Condition U. The Speed analysis indicates that the effect is directly
attributable to the instructions and not mediated by differences in rate of
speaking in the two conditions. That the shift was elicited relatively
uniformly for all five categories lends empirical validation to our combining
these categories as concomitants of style. That is, there seems to be jus-
tification for saying that the FA's defined for each of the five categories
are in fact related as aspects of formal style, and that the CA's are related
as aspects of casual style. The striking difference between the two condi-
tions in number of FA's establishes the situational variable as one of the
major factors controlling choice of style. This conclusion accords well
with common observation. For instance, one of our Ss, a radio station
announcer, noted that he differentiated between his "FM" and "AM" pronun-
ciations. The "FM" style is, in the present five categories, closer to
lannucci-16-
the actual spelling than the casual one, and for this reason may be given
by Ss when asked for "accurate" pronunciation.
The situation was manipulated in this study rather obviously by means
of instructions; it remains to be determined what aspects of everyday situ-
ations lead speakers to self-instruct themselves to engage in a formal or
casual style.
While the generality of the situational effect shows that all five
phonological categories constitute, on one level, a unitary class, other
results reflect differences among the categories and lead to refinements
in the notion of style. First, it was found that the number of FA's elicited
for Category (a) in either condition was significantly smaller than for all
other categories, and that--even more so--Categories (a) and (b) differed
from (c), (d), and (e) in the same respect. The latter difference is pro-
bably related to the structural difference, discussed in the Introduction,
that sets off (a) and (b) from the others. That is, the two alternants of
both Categories (a) and (b) differ from each other only in that each involves
an alternate realization of the same underlying segment, But members of the
pairs of alternants for Categories (c), (d), and (e) differ from each other
by the presence or absence of one phonological segment; i.e., for each of
these three categories, the casual alternant involves the deletion of an
underlying segment that the formal alternant retains. The casual alternants
of Categories (c), (d), and (e) thus omit an underlying phonological segment
while those of (a) and (b) merely give it a different phonetic realization
than the formal alternants. Because of this, it is possible that the casual
alternants of (a) and (b) are reacted to as more acceptable than those of
(c), (d), and (e). Although there doesn't seem to be any obvious structural
Iannucci -17-
grounds for a preference of the casual alternant of (a) over that of (b),
such a preference seems nevertheless to exist and to be reflected in the
smaller number of FA's in (a) than in (b). The formal pronunciation in
Category (a), such as [sitiyj for city, seems more aberrant in American
English than the formal pronunciation in Category (b), such as [pazitiv] for
positive. Most Americans would tend to react to the former, but not the
latter, as sounding somewhat British. Also, the mean Status rating of
Category (b) words (2,8) is significantly higher (t = 13.2, df = 12, p < 9001)
than the Category (a) mean (1.8).
The comparisons of category variance in Table 2 yield further evi-
dence in support of the above contentions, In Condition D, as per directions,
the S was directly concerned with finding what he thought to be the more pre-
cise or "correct" pronunciations. The variances in number of FA's produced
for Categories (a) and (b) were significantly greater, under this condition
than when S's attention was not directed towards pronunciation; but the
variances of (c), (d), and (e) decreased from Condition U to Condition D
(except for (c), not significantly). It would seem then that, when con-
sciously concerned with the well-formed or "correct" pronunciation, Ss tended
to have a more clear-cut notion of what was more normative for Categories
(c), (d), and (e) than they did for Categories (a) and (b). This difference
may be attributed to the observation, made above, that in the case of
Categories (c), (d), and (e) only the formal alternant realizes the under-
lying phonological segment, whereas in Categories (a) and (b) the underlying
segment is expressed by both alternants in different ways. It seems reason-
able, therefore, to assume that Ss will almost exclusively consider the
formal alternants of (c), (d), and (e) as well-formed, while they may consider

Iannucci-18-
the casual alternants of (a) and (b)--and not only their formal alternants--
also as well-formed.
That Category (a) has by far the smallest variance in Condition U sup-
ports the contention that the formal alternant of (a) was generally reacted
to as unacceptable. The Ss seem to have agreed in their preference for the
casual alternant in the case of (a) in Condition U. In Condition D, however,
Ss were not primarily guided by their personal preferences but by what they
considered to be the proper or normative pronunciation.
That the variance of (e) is highest everywhere CU and D) may be due
to the difficulty in pronouncing the [St3 cluster. That is, there may
have been some Ss who intended, like the majority, to produce this formal
cluster, but failed, in some words, to articulate fully the sounds they
intended to produce, and instead produced the CA. pronunciation ([s(s)J). The
pronunciation difficulty would introduce an additional source of variation.
The fact that the variance of (e) is significantly higher than that of most
other categories only in D, where Ss were directly concerned with "correct-
ness," lends support to this interpretation. It is also supported by the
comments of several Ss who indicated that this cluster sometimes caused them
to be tongue-tied. The finding that (c) had the smallest variance in Condi-
tion D is probably due to a "ceiling effect," the mean number of FA's in
this category (37.6) being closer to the maximum possible (4o) than in any
other category. Thus, the small variance of (c) in Condition D is attributed
to a "ceiling effect" and the small variance of (a) in Condition U to a
"basement effect."
The ceiling effect seems also to have affected the Status and Fre-
quency results. As can be seen in Table 6, both Status and Frequency were

Iannucci -19-
consistently related to the number of FA's only in Categories (a) and (b).
The high level of formal responses in the last three categories may have
prevented Status and Frequency from exhibiting their effects. In fact,
Status and Frequency did show significant relations to FA's in (d)U, which
had the smallest number of FA responses among the last three categories.
The Speed variable also seems to have singled out Categories (a) and
(b). As is shown in Table 5, Speed is correlated with FA's in five out of
the eight possible cases in Categories (a) and (b), but it is not correlated
with any of the twelve possibilities involving Categories (c), (d), and (e).
Again, the ceiling effect may be an inhibiting factor here. Since the dura-
tion of the casual alternant Fib] is shorter than that of the formal alter-
nant [ti, it is not surprising that Ss who spoke at a faster rate tended to
choose the casual alternant more often than those who spoke at a slower rate.
By way of summary, consider how the results of the factor analysis
tend to reaffirm the patterns described above. Factor I, the general factor,
lends more credence to our grouping of the five category alternants with res-
spect to style, in that it reflects, as noted above, the disposition of Ss
to respond in a more formal or more casual manner in all five categories.
The split between Categories (a), (b) and (c), (d), (e), indicated by
Factor II, is supported throughout the analysis; (1) in the magnitude of FA
responses, (2) in the variance shifts across conditions, (3) in the relation
of FA responses to Status and Frequency, and (4) in the relation of FA res-
ponses to Speed. This split corresponds to the difference in the structural
relation between the members of the pairs of alternants in (a) and (b)
versus (c), (d), and (e).
The remaining three factors, splitting these two major groups into
Iannucci -20-
the individual categories, reflect the unique characteristics of each cate-
gory, as outlined in the above discussion. The absence of a situational
factor in the matrix further corroborates the generality of this effect across
all five categories.
Iannucci 21-
References
Chomsky, tL Current issues in linguistic theory. The Hague: Mouton, 1964.
Deese, J. The structure of associations in language and thought. Baltimore,
Md.: The Johns Hopkins Press, 1965.
Francis, W. N. The structure of American English. New York: Ronald Press,
1958.
Halle, M. Phonology in a generative grammar. Word, 1962, 18, 54-72.
Joos, M. The five clocks. New York: Harcourt, Brace & World, 1967.
(First published in 1961.)
Labov, W. The social stratification of English in New York City.
Washington, D. C.: Center for Appliecx Linguistics, 1966.
Sapir, E. La rgaliterpsychologique des phonemes. Journal de Psychologie
Normale et Pathologique, 1933, 30, 247-265. Reprinted, in English,
in D. G. Mandelbaum (Ed.), Selected writings of Edward Sapir.
Berkeley and Los Angeles: Univ. of California Press, 1950.
Pp. 122-149.
Shari, D. J. Distinctiveness of "voiced T" words. American Speech,
1960, 35, 105-109.

Iannucci
Footnote
-22-
l'We are grateful to J. Iannucci and R. Weber for helpful linguis-
tic advice, to M. Gordon and P. Carlson for acting as judges in classifying
pronunciations, and to A. Savishinsky for giving us the benefit of her
experience with Brush recorder measurements.

Iannucci
Table 1
Words Used in Experiment, their Frequency, Status Ratings,
and Number of FA Pronunciations in Conditions U and D
/Category (a), StS Category (b), 6Stg
# FA's # FA's
1110MI.MISIMW ord Status Eta. in U in D Word Status y222.. in U in D
fatty
kitty
water
sitter
notice
better
spaghetti
little
thirty
unwitting
poultice
neuter
belittle
furtive
strata
neuritis
Totals
Means
.5 2.3
.1 2.4
1.2 4.8
.5 2.9
1.7 4.6
.9 4.6
1.1 3.5
.9 4.4
1.3 4.1
2.7 2.4
3.4 1.0
2.1 2.3
3.0 2.6
3.2 2.1
3.5 2.1
2.8 1.6
28.9 47.7
1.8 3.0
0 6 university 2.2 5.0 1 7
1 i 5 positive 2.1 h.2 25 29
7 11 persorality, 1.8 4.8 6 13
5 14 exe,!utive 2.5 3.8 11 14
4 7 ility 1.9 4.8 12 18
5 10 plnitixe 3.5 2.7 36 34
1 3 pierogative 3.2 3.5 13 16
3 9 :laztitor 1.8 2.8 24 23,
0 8 . ,Aative 2.1 2.6 21 23
7 12 cap:ctol 2.2 3.0 8 13
39 40 mendacitya
3.9 1.3 3 3 -
2 13 levity 3.0 1.9 15 18
5 10 felicitousa 3.8 1.9 20 27
21 29 purgative 3.5 1.4 27 28
4 6 heritage 2.8 2.8 34 36
2 7 proclivity 3.8 1.2 8 13
106 190 Totals 44.1" 47.7 264 315
6.6 11.9 Means 2.8 3.0 16.5 19.7

lannucci
Category (c), gi#g
Word Status Freq.
winter 1.6 4.7
panties .7 3.2
mental 1.8 4.5
integrate 2.2 4.7
twenty 1.4 3.9
gentle 1.6 4.2
wanting 1.6 4.1
center 1.5 4.1
phantom 2.8 2.0
printed 1.6 4.1
flaunting 2.8 2.6
slanted 2.2 3.4
scented 2.2 3.1
dental 2.1 2.5
ventilate 3.2 2.5
mantle 3.2 2.2
Totals 32.5 55.8
Means 2.0 3.5
Table 1 (cont.)
# FA's
in U in D
35 38
31 39
36 38
33 36
33 37
33 37
35 38
33 34
36 36
35 38
38 38
36 39
35 39
36 39
31 36
37 39
553 601
34.6 37.6
Category (d), nd# # FA's
Word Status Freq. in U in D
mind 1.5 4.8 31 34
transcend 3.2 3.'0 35 37
hand 1.1 4.6 27 34
round 1.3 4.5 30 37
found .8 4.4 27 37
end 1.1 4.5 32 37
stand 1.0 4.4 29 36
find 1.1 4.5 32 36
behind 1.0 4.4 27 34
descend 2.2 3.6 30 33
remand 3.3 1.2 32 38
defend 1.8 4.1 31 37
confound 2.8 2.4 33 35
abound 2.7 2.5 33 37
amend 2.6 2.5 35 38
gland 1.8 2.4 32 37
Totals 29.3 57.8 496 577
Means 1.8 3.6 31.0 36.1
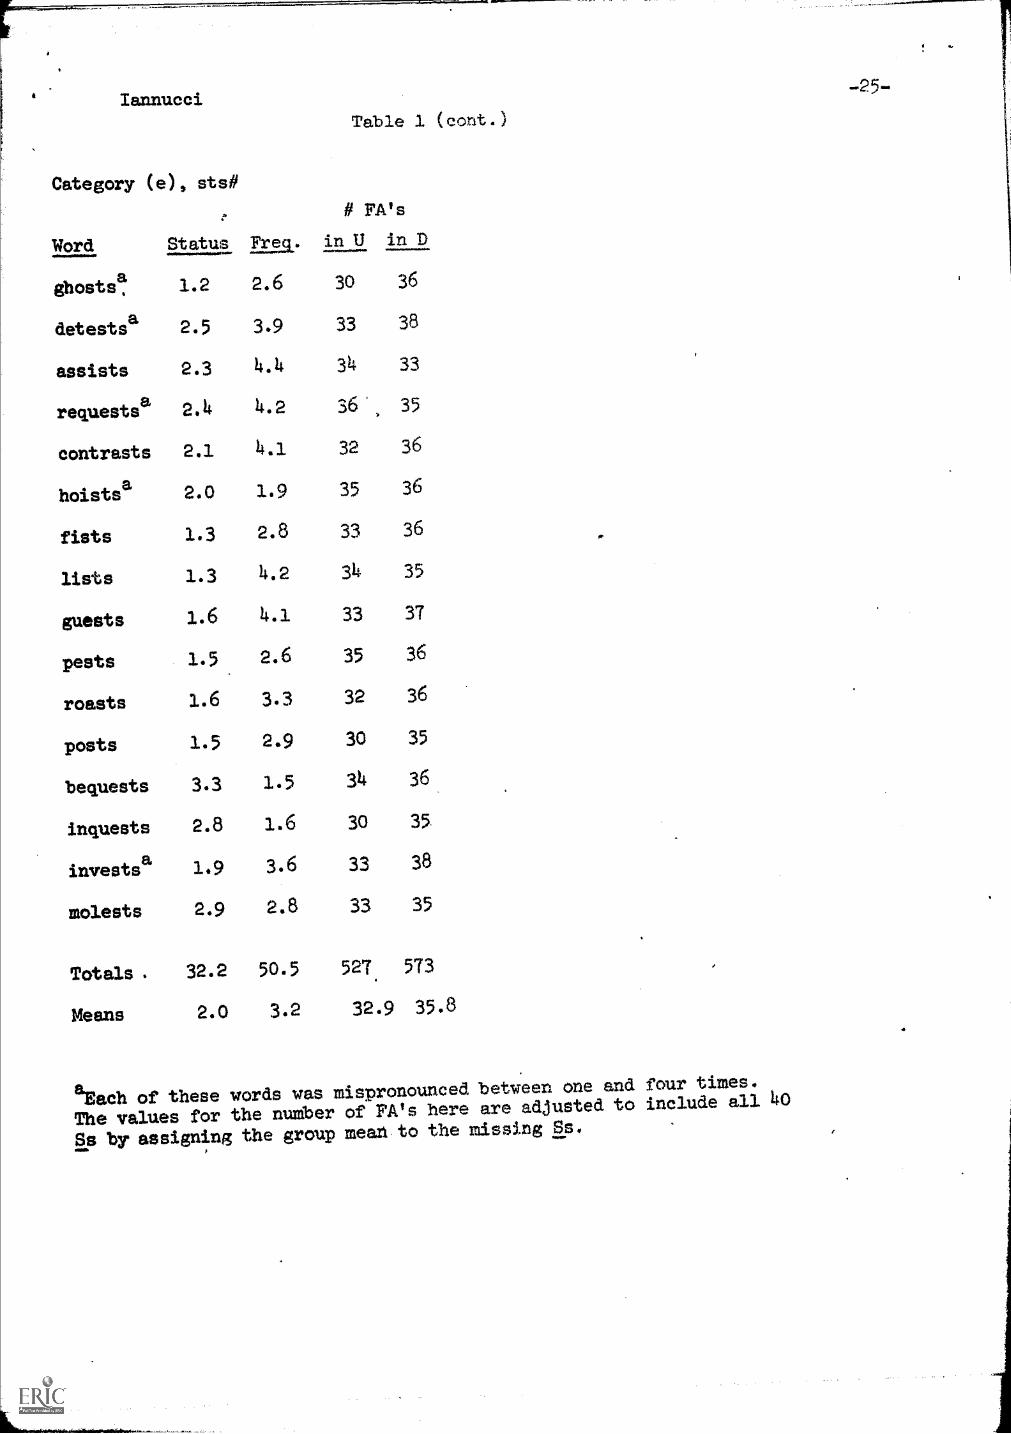
lannucci
Category (e), sts#
Word Status Freg.
-25-
Table 1 (cont.)
# FA's
in U in D
ghosts! 1.2 2.6 30 36
detestsa 2.5 3.9 33 38
assists 2.3 4.4 34 33
requestsa
contrasts
2.4
2.1
4.2
4.1
36
32
35
36
hoistsa 2.0 1.9 35 36
fists 1.3 2.8 33 36
lists 1.3 4.2 34 35
guests 1.6 4.1 33 37
pests 1.5 2.6 35 36
roasts 1.6 3.3 32 36
posts 1.5 2.9 30 35
bequests 3.3 1.5 34 36
inquests 2.8 1.6 30 35.
investsa 1.9 3.6 33 38
molests 2.9 2.8 33 35
Totals . 32.2 50.5 527. 573
Means 2.0 3.2 32.9 35.8
aEach of these words was mispronouncedbetween one and four times.
The values for the number of FA's here are adjusted to include all 40
Ss by assigning the group meat to the missing Ss.

Iannucci
Table 2
Comparison of Category Variance Within and Across Conditions
-26-
Variance j Values
Condition Category
Category U D (a) (b) (c) (d) (e)
(a) 5.72 17.58 -6.38* -3.25* -3.51* -3.06* -4.70*
(b) 13.28 20.63 .63 -3.31* -.65 -.23 -1.60
(c) 16.35 4.97 -4.39* -4.96* 6.73* .47 -1.18
(d) 14.34 10.66 -1.63 -2.10* 2.72* 1.64 -1.51
(e) 22.44 20.05 .40 -.13 5.14* 2.68* .75
Note.--The t values in the cells on the main diagonal (underlined) are
for categories across conditions. The t values above the diagonal are for
differences between categories within Condition U, and below the diagonal,
within Condition D. The df for every comparison is 38. Significant t
values are starred, for t:L 2.03, p <r.05; for t' 2.71, p .01; for
pA! .001.
Iannucci
Table 3
Intercorrelations Among the Five
Phonetic Categories in the Two Conditions (U, D)
-27-
Variable 1 2 3 4 5 6 7 8 9 10
1. (a)U * .54 .25 .27 .19 .82 .53 .23 .16 .13
2. (b)U * .21 .23 .10 .55 .91 .21 .02 ....01
3. (c)u * .50 .54 .35 .29 .88 .47 .52
4. (d)u * .49 .35 .31 .43 .84 .55
5. (e)U * .29 .26 .38 .53 .88
6. (a)D* .63 .31 .29 .24
7. (b)D* .29 .17 .16
8. (c)D* .45 .43
9. (d )D* .68
10. (e )D*
Note.--df for each entry is 39.
Iannucci
Table 4
Unrotated Factor Matrix of Intercorrelations
Presented in Table 3
-28-
Factors
Variable I II III IV V
(a)U .57 -.58 .15 -.09 .48
(b)u .5o -.74 ...04 .10 -.38
(c)u .76 .23 -.54 .03 .08
(d)u .76 .26 .23 -.44 -.22
(e)U .71 .59 .22 .50 .02
(a)D .69 -,52 .14 -.07 .38
(b)D .63 -.64 .02 .14 -.37
(c)D .7o .18 -.65 -.08 .04
(d)D .71 .45 .26 -.38 -.10
(e)D .71 .52 .25 .33 .03
Percentage of
total variance 46.15 23.40 9.86 7.50 7.21
Iannucci
Table 5
Correlations Between Speed and Number of PA's
in Categories (a) and CO: under Conditions U and D
Number FA's in
(a)U (a )D (b )U (b )D
Mean Speed in U .55** .48** 33* .22
Mean Speed in D .49** .12 .30 .47*
* < .05, P <..01
-29.-
Iannucci
Table 6
Relation Between Status and FA's, and Frequency and FA's,
in the Five Categories Under Both Conditions
Status Ratings Frequency Ratings
Proportion of FA' a Proportion of FA'sa
8 Lo 8 Hi Chi2 p 8 Hi 8 Lo Chi2
p
(a)U .07 .26
(b)u .34 .48
(c)U .85 .88
(d)U .73 .82
(e)U .81 .83
(a)D .21 .39
(b)D .44 .55
(c)D .85 .88
(d)D .89 .91
(e)D .90 .89
43.46
14.08
2.00
6.06
2.00
25.18
7.69
2.00
2.00
2.00
-30-
.001 .09 .24 23.92 .001
.001 .31 .52 27.05 .001
NS .85 .88 2.00 NS
.02 .73 .82 6.06 .02
NS .83 .81 2.00 NS
.001 .23 .37 15.84 .001
.01 .42 .57 15.12 .001
NS .93 .95 2.00 NS
NS .89 .91 2.00 NS
NS .90 .89 2.00 NS
aEach entry in these columns is the ratio of the number of FA res-
ponses to the total number of responses, which was 320 (8 words X 40 Ss)
in virtually all cases.
Iannucci
Figure Caption
-31--
Fig. 1. Graphic representation of factor matrix in Table 4. The
lower the factor in this hierarchy and the smaller the angle, the smaller
the percentage of the total variance accounted for by the factor
(not proportionately so, only suggestively). The actual percentages
are given in Table 4.
Categories
Factor I Oh (b), (c), CA
Factor a (a) (b)
Factor (a) (b)
Cc), (d), (e)
Factor 331 (c) (d), (e)
Factor 13Z (d) (9 )