ed 338 664 tm 017 453 author wilkinson, david; spano ... · document resume. ed 338 664 tm 017 453....
TRANSCRIPT
DOCUMENT RESUME
ED 338 664 TM 017 453
AUTHOR Wilkinson, David; Spano, Sedra G.TITLE GENESYS 1990-91: Selected Program Evaluations.
Publication Number 90.39.INSTITUTION Austin Independent School District, Tex. Office of
Research and Evaluation.PUB DATE Jul 91
NOTE 171p.
PUB TYPE Statistical Data (110) -- Reports -Evaluative/Feasibility (142)
EDRS PRICE MF01/PC07 Plus Postage.DESCRIPTORS Academically Gifted; Bilingual Education; *Databases;
Data Collection; Elementary Secondary Education;English (Second Language); Honors Curriculum; MagnetSchools; *Management Information Systems; *ProgramEvaluation; *School Districts; School Statistics;Special Education; Statistical Data; *StudentCharacteristics; Supplementary Education; Tables(Data)
IDENTIFIERS *Austin Independent School District TX; *GENESYSTX
ABSTRACTGENESYS is a GENeric Evaluation SYStem for data
collection and evaluation through computer technology. GENESYSgathers and reports the standard information (studentcharacteristics, achievement, attendance, discipline, grades/credits,dropouts, and retainees) for specific groups of students. In theAustin (Texas) Independent School District's (AISD's) third year ofusing GENESIS, several elementary school and secondary schoolprograms were evaluated, including: (1) the Science Academy; (2) theLiberal Arts Academy; (3) the Kealing Magnet School; (4) AIM High (ahelementary school program for gifted and talented students); (5) thesecondary honors program; (6) bilingual andEnglish-as-Second-Language (ESL) programs; (7) Teach and Reach(supplementary reading and mathematics instruction for low-achievingblack students); and (8) special education. The evaluation indicatesthat students in the magnet schools, including the academies, and thegifted and talented and honors programs tended toward higher academicachievement than did students in other schools. Students in thebilingual and ESL programs, Teach and Reach, and special educationgenerally tended to achieve no faster than did studentsdistrict-wide, were more likely to be disciplinary problems, and weremore likely to drop out. Figures and tables present data for theeight programs evaluated. Ten attachments provide GENESYS operationalcharacteristics, GENESYS definitions, ideas for GENESYS.enhancements,a sample GENESYS printout for data by students, requirements forGENESYS data files, flowcharts, a sample GENESYS file/run sheet, 31pages presenting cross-program comparison charts for Spring 1991,cross-tabulation tables', and evaluation summaries for the AISD. Eightreferences are included. (SLD)
GENESYS I 990-91:t d Proaram Evaluations
U.S. DEPARTMENT OF EDUCATIONOffice of Educational Research and ImProvemeni
EDUCATIONAL RESOURCES INFORMATIONCENTER (ERIC)
fichis document has been reproduced eareceived from the Person or organizationoriginating it
O Minor changes have been made to improvereproduction quality
Points of view or opinions stated in this docu .ment do not necessarily represent officialOERI position or policy
"PERMISSION TO HEPRODUCE THIS
MATERIAL HAS BEEN GRANTED SY
r NO44.6-1/
TO THE EDUCATIONAL RESOURCES
INFORMATION CENTER (ERIC)."
411110.
Austin IndePendent School DistrictOffice of Research and Evaluation
kb, 1991
2 BEST COPY AVAILABLE
9039
Managetnen
__Eragramiltscription_
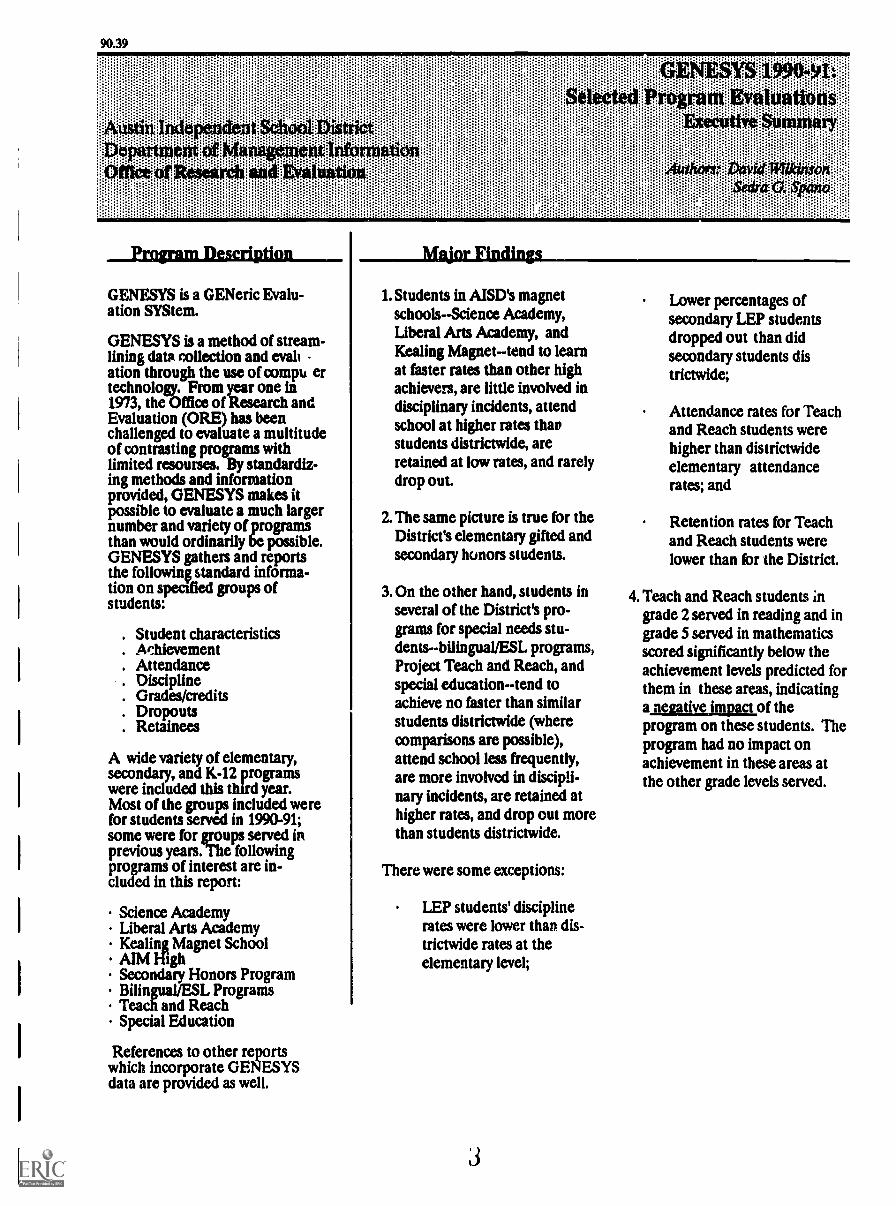
GENESYS is a GENeric Evalu-ation SYStem.
GENESYS is a method of stream-lining datn collection and evali -ation through the use of comp ertechnology. From year one in1973, the Office of Research andEvaluation (ORE) has beenchallenged to evaluate a multitudeof contrasting programs withlimited resourses. By standardiz-ing methods and informationprovided, GENESYS makes itpossible to evaluate a much largernumber and variety of programsthan would ordinarily be possible.GENESYS gathers and reportsthe following standard informa-tion on specified groups ofstudents:
Student characteristicsAchievement
. Attendance
. DisciplineGrades/creditsDropouts
. Retainees
A wide variety of elementary,secondary, and K-12 programswere included this thfrd year.Most of the groups included werefor students served in 1990-91;some were for groups served inprevious years. The followingprograms of interest are in-cluded in this report:
Science AcademyLiberal Arts AcademyKealing Magnet SchoolAIM HighSecondary Honors ProgramBilingual/ESL ProgramsTeach and ReachSpecial Education
References to other reportswhich incorporate GENESYSdata are provided as well.
1. Students in AISD's magnetschoolsScience Academy,Liberal Arts Academy, andKealing Magnettend to learnat faster rates than other highachievers, are little involved indisciplinary incidents, attendschool at higher rates thanstudents districtwide, areretained at low rates, and rarelydrop out.
2. The same picture is true for theDistrict's elementary gifted andsecondary honors students.
3.0n the other hand, students inseveral of the District's pro-grams for special needs stu-dentsbilingual/ESL programs,Project Teach and Reach, andspecial educationtend toachieve no faster than similarstudents districtwide (wherecomparisons are possible),attend school less frequently,are more involved in discipli-nary incidents, are retained athigher rates, and drop out morethan students districtwide.
There were some exceptions:
LEP students' disciplinerates were lower than dis-trictwide rates at theelementary level;
3
Lower percentages ofsecondary LEP studentsdropped out than didsecondary students districtwide;
Attendance rates for Teachand Reach students werehigher than districtwideelementary attendancerates; and
Retention rates for Teachand Reach students werelower than for the District.
4. Teach and Reach students ingrade 2 served in reading and ingrade 5 served in mathematicsscored significantly below theachievement levels predicted forthem in these areas, indicatinga negative impact of theprogram on these students. Theprogram had no impact onachievement in these areas atthe other grade levels served.
90.39
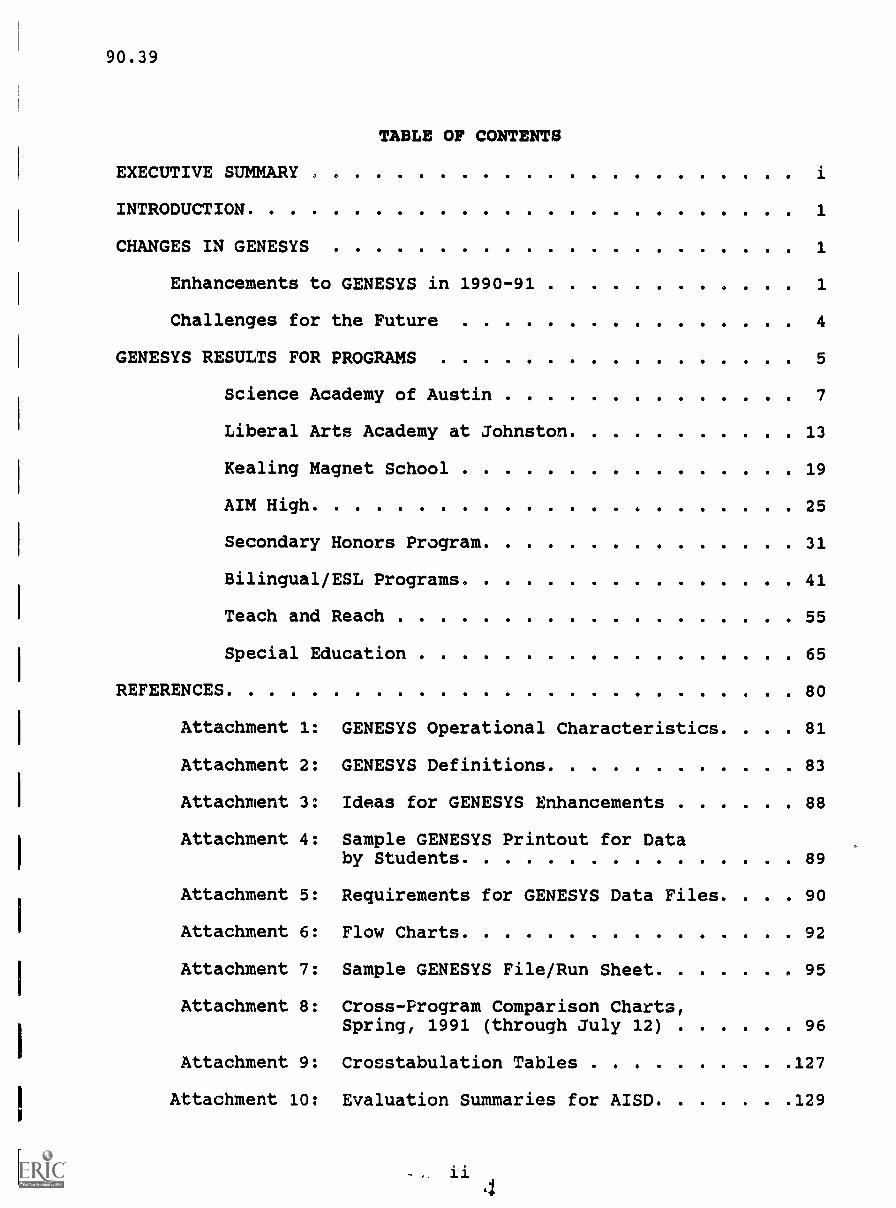
TABLE OF CONTENTS
EXECUTIVE SUMMARY
INTRODUCTION 1
CHANGES IN GENESYS 1
Enhancements to GENESIS in 1990-91 1
Challenges for the Future 4
GENESYS RESULTS FOR PROGRAMS 5
Science Academy of Austin 7
Liberal Arts Academy at Johnston 13
Kealing Magnet School 19
AIM High 25
Secondary Honors Program 31
Bilingual/ESL Programs 41
Teach and Reach 55
Special Education 65
REFERENCES 80
Attachment 1:
Attachment 2:
Attachment 3:
Attachment 4:
Attachment 5:
Attachment 6:
Attachment 7:
Attachment 8:
GENESYS Operational Characteristics. . . 81
GENESYS Definitions 83
Ideas for GENESYS Enhancements 88
Sample GENESYS Printout for Databy Students 89
Requirements for GENESYS Data Files. . . 90
Flow Charts 92
Sample GENESYS File/Run Sheet 95
Cross-Program Comparison Charts,Spring, 1991 (through July 12) 96
Attachment 9: Crosstabulation Tables 127
Attachment 10: Evaluation Summaries for AISD 129
90.39
GENESYS 1990-91: SELECTED PROGRAN EVALUATIONS
FINAL REPORT
INTRODUCTION
GENESYS is ORE's GENeric Evaluation SYStem. The genericevaluation system is ORE's response to a growth in informationneeds at the same time that staff resources have been shrinking.By taking advantage of a bigger, faster mainframe computer andthe District's extensive data bases, GENESIS produces a highvolume of information about many programs. GENESYS may notprovide everything a user wants in the exact form desired, but ithas proven to be a very useful evaluation tool to enhancetraditional evaluations or as the total evaluation for programsto which limited resources can be devoted. The continuingchallenge for evaluation and program staff is to use the systemto produce the best information for program decisionmaking.
The 1990-91 school year is the third year of GENESYS implemen-tation. Readers interested in more information about thedevelopment and implementation of GENESYS in its first two yearsare urged to consult the reports listed in the reference section.Details about how GENESYS works may also be found in the reportsreferenced, particularly ORE publications 88.40 and 89.30. Aspecification of the outcome information that GENESYS provides iscontained in Attachment 1. Specific definitions for each of thevariables included in GENESYS are provided in Attachment 2.
CHANGES IN GENESYS
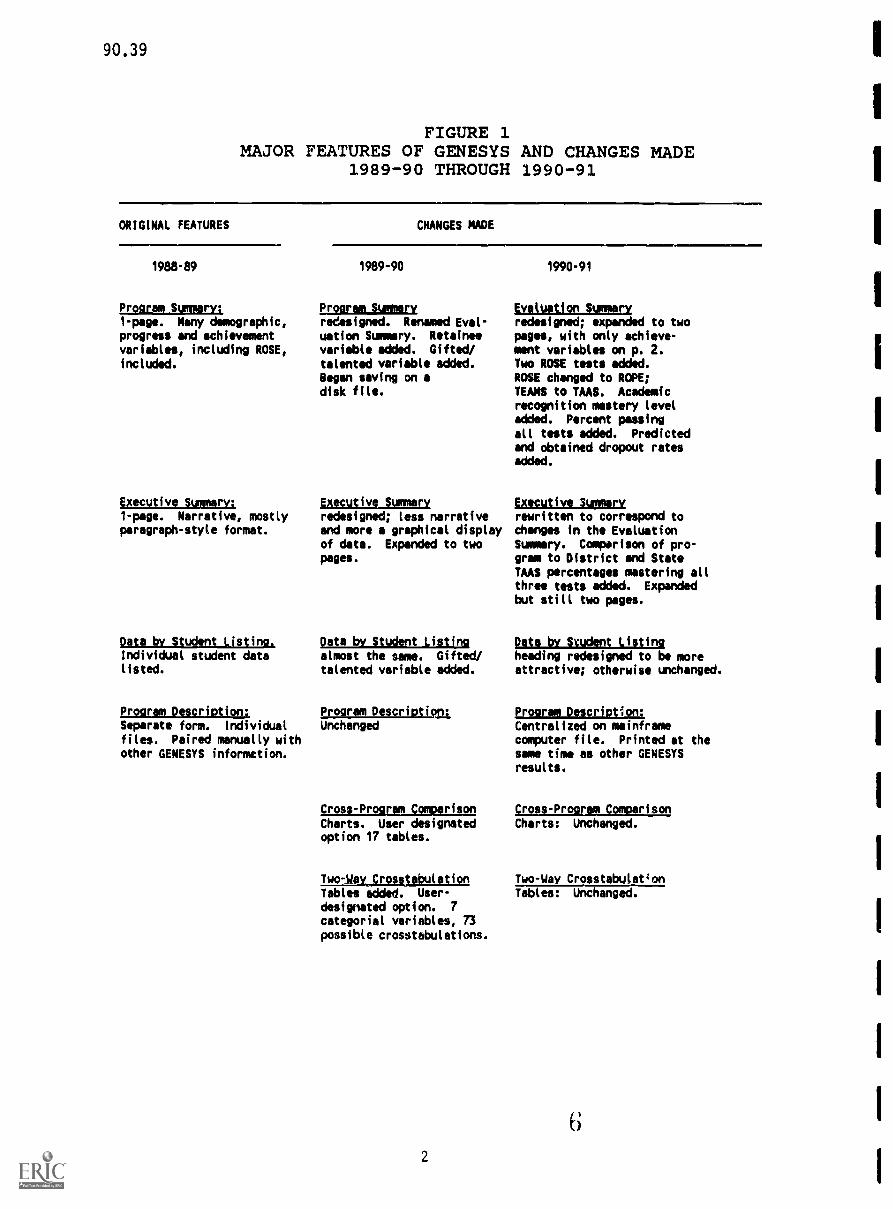
Since its inception in 1988-89, GENESYS has changed and beenimproved each year. Figure 1 summarizes the major features andchanges made to GENESYS each year.
Enhancements tQ_QEMEEIE_in_1222=11
Some important improvements and enhancements were made to GENESYSthis year:
o The evaluation summary was mdmignol to add in newinformation about dropouts and to reflect changes in thereporting of achievement. The evaluation summary wasexpanded from one to two pages, with the second pageentirely devoted to achievement indicators.
o New_progress indicators were added_to the evaluationsummary. Predicted and obtained dropout rates, and theobtained rate as a percentage of the predicted rate, wereadded to the first page of the evaluation summary.Definitions of these and related terms were also added.More will be said about this enhancement later.
90.39
FIGURE 1MAJOR FEATURES OF GENESYS AND CHANGES MADE
1989-90 THROUGH 1990-91
ORIGINAL FEATURES
1988-89
Program Summon,:1-page. Many demographic,progress and achievement
variables, including ROSE,included.
Exeutive_Surmary:I-page. Narrative, mostlyparagraph-style format.
Data by Student Listing.
Individual student datalisted.
Program Description:Separate form. Individual
files. Paired manually with
other GENESYS information.
CHANGES MADE
1989-90
Program Summery
redesigned. Renamed Eval-uation Summery. Retain*,
variable added. GiftedV
talented variable added.Began saving on a
disk file.
Executive Summeryredesigned; less narrativeand more a graphical displayof data. Expanded to twopages.
Data bv Student Listingalmost the same. Gifted/talented variable added.
Program_BescriaimiUnchanged
Charts. User designatedoption 17 tables.
Tables adde4. User-
designated option. 7
categorial variables, 73
possible crosstabulations.
2
1990-91
VAWMImiammuredesigned; expanded to twopages, with only achieve-
ment variables on P. 2.Two ROSE tests added.
ROSE changed to ROPE;TEAMS to TAAS. Academicrecognition mastery leveladded. Percent passing
all tests added. Predictedand obtained dropout ratesadded.
Executive Summaryrewritten to correspond tochanges in the EvaluationSummery. Comparison of pro-gram to District and State
TAAS percentages mastering allthree tests added. Expandedbut still two pages.
Data by Svudent Listingheading redesigned to be moreattractive; otherwise unchanged.
Program Description:Centralized on mainframecomputer file. Printed at thesame time as other GENESYSresults.
cskse±m)rCharts: Unchanged.
Two-Way Crosstabulat4onTables: Unchanged.
90.39
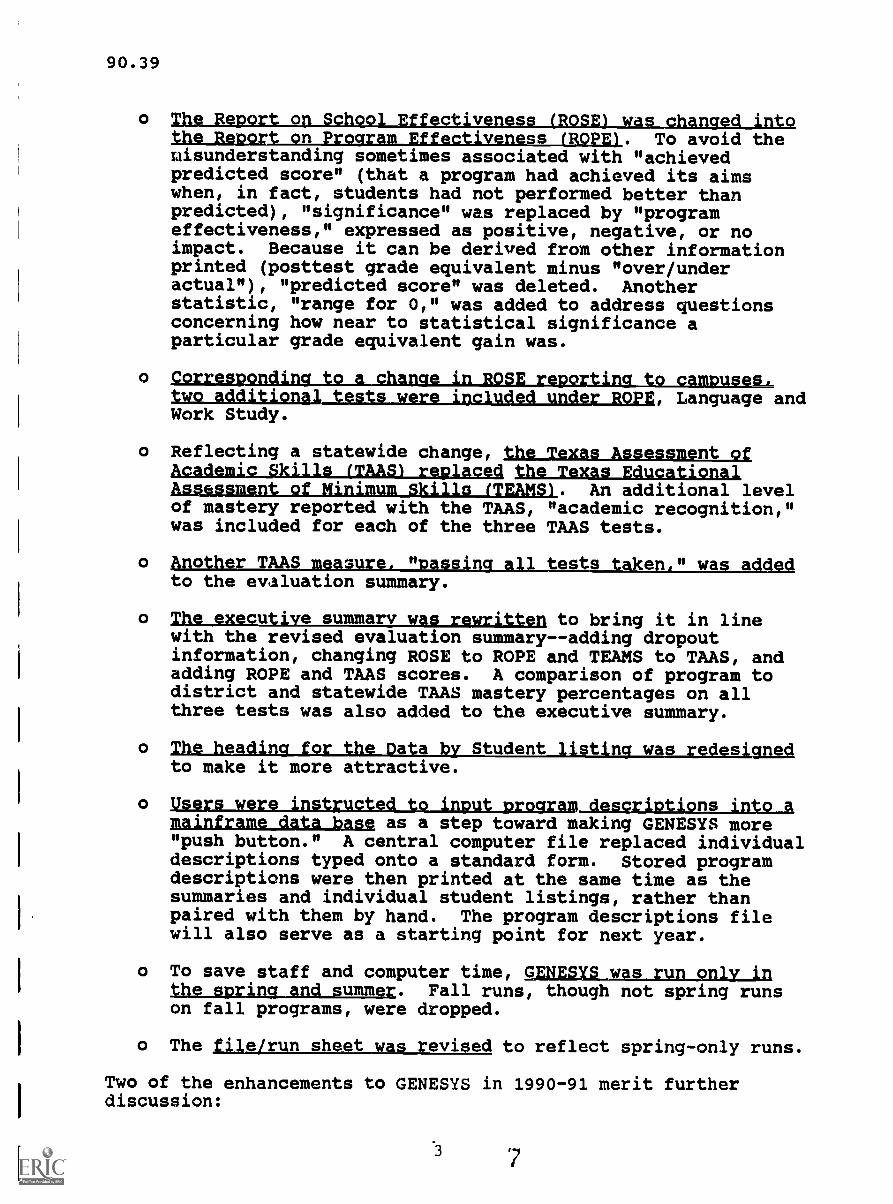
o The Report on School Effectiveness (ROSE) was changed intoTo avoid the
misunderstanding sometimes associated with "achievedpredicted score" (that a program had achieved its aimswhen, in fact, students had not performed better thanpredicted), "significance" was replaced by "programeffectiveness," expressed as positive, negative, or noimpact. Because it can be derived from other informationprinted (posttest grade equivalent minus "over/underactual"), "predicted score" was deleted. Anotherstatistic, "range for 0," was added to address questionsconcerning how near to statistical significance aparticular grade equivalent gain was.
R S.
Language andWork Study.
o Reflecting a statewide change, the Texas Assessment ofAgadmia_ajja,t_amsi_rapjages1 the Texas Educationalhatatement_a_tliniamn_arutalainkta. An additional levelof mastery reported with the TAAS, "academic recognition,"was included for each of the three TAAS tests.
o Another_TAAS mea3ure. "passing all_tests taken." was addedto the evaluation summary.
o The_gie=lys_s_umurziag_rwirittom to bring it in linewith the revised evaluation summary--adding dropoutinformation, changing ROSE to ROPE and TEAMS to TAAS, andadding ROPE and TAAS scores. A comparison of program todistrict and statewide TAAS mastery percentages on allthree tests was also added to the executive summary.
41 - I a Student W S es O Ito make it more attractive.
o Users were instructed to input program_dasgriptignt_intp_AmainfrAng_giAtajami as a step toward making GENESYS more"push button." A central computer file replaced individualdescriptions typed onto a standard form. Stored programdescriptions were then printed at the same time as thesummaries and individual student listings, rather thanpaired with them by hand. The program descriptions filewill also serve as a starting point for next year.
o To save staff and computer time, _zulia_rig_ign_gaux_inGthg_apring_And_Imm. Fall runs, though not spring runson fall programs, were dropped.
o The file/run sheet was revisgd to reflect spring-only runs.
Two of the enhancements to GENESIS in 1990-91 merit furtherdiscussion:
-3

90.39
1. The addition of predicted and obtained dropout rates, and2. The changes in achievement reporting.
The comparison of predicted and obtained dropout rates is one oftwo important enhancements proposed last year for implementationin 1990-91. (The other was significance tests, to be discussedunder "challenges" below.) The comparison of rates wasparticularly desired because, by providing the means for judginghow well a program had succeeded in reducing the dropout ratepredicted for its students, this comparison represents anotheroutcome indicator which goes beyond the merely descriptive, thelevel of much of the GENESYS information. In conception,although not in methodology, the comparison is akin to the ROSE,now ROPE, in which predicted and obtained achievement arecompared. ORE publication 88.36 contains an example of thismethodology as first derived and applied. An elaboration on themethodology is discussed in ORE publication 90.19. Like theROSE, the comparison of predicted and obtained dropout ratesserves to provide GENESYS with the kind of evaluative capabilitya generic evaluation system needs to fulfill expectations of itsutility.
The statewide change from TEAMS to TAAS testing, and tLeexpansion of the ROSE information reported to AISD campuses, madeit an opportune time to include some additional achievementindicators in GENESIS, in particular, the percentages of studentsattaining mastery at the academic recognition level and thepercentages passing all tests taken. See Attachment 2 forspecific definitions of these variables. The addition of theseachievement indicators is notable because both are beginning toreceive a high level of scrutiny in districts across the State.The comparison of program results with district- and statewideachievement levels is therefore of interest. The reporting ofthe Language and Work Study tests makes the GENESYS resultsparallel to the District's expanded ROSE. Overall, the expansionof the achievement information reported in GENESYS necessitated asecond page to the evaluation summary and a longer executivesummary, but more and new information is being reported toGENESYS users in 1990-91.
Challenges for the Future
Although a number of important enhancements were made to GENESYSin 1990-91, there is still room for improvement. Some of thechallenges described in the 1989-90 GENESYS final report (seePublication No. 89.30) have been met, but some have not.
o Developing program files and descriptions can still 11lengthy wocess, but the amount of time depends on theexperience of evaluation and program staff with file-building and with the capabilities of GENESYS and would benecessary even in a traditional evaluation.
4 8
90.39
-u s U.envisioned, in that the GENESYS programmer still handlesGENESIS runs exclusively and direct involvement withGENESYS outside ORE is limited. However, the constantevolution of GENESYS has dictated keeping it "in house,"and since the few requests for GENESYS runs made by peopleoutside ORE have been readily satisfied, there does notseem to be a problem with user access.
Some additional enhancements to GENESYS have been proposed.Attachment 3 lists some ideas for enhancements, some remainingfrom 1989-90, which remain for future development. One of thesein particular needs further attention: significance tests.
Significance tests for GENESYS are important because they wouldprovide an inferential dimension not now furnished by GENESIS,namely, a means for determining if the differences between groups(either between program students and students districtwide orprogram students at two points in time) are meaningful. Renewedefforts to introduce significance tests into GENESIS will have tobe made.
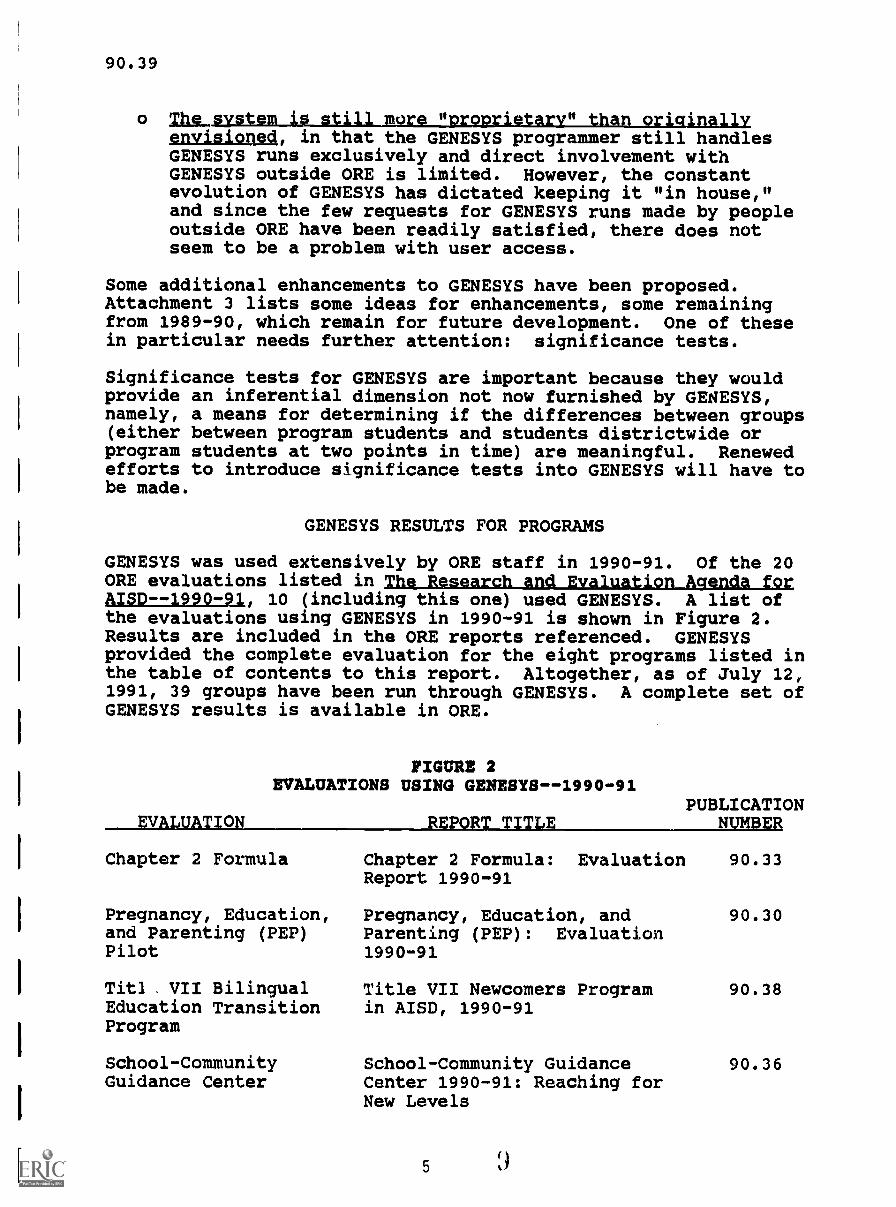
GENESYS RESULTS FOR PROGRAMS
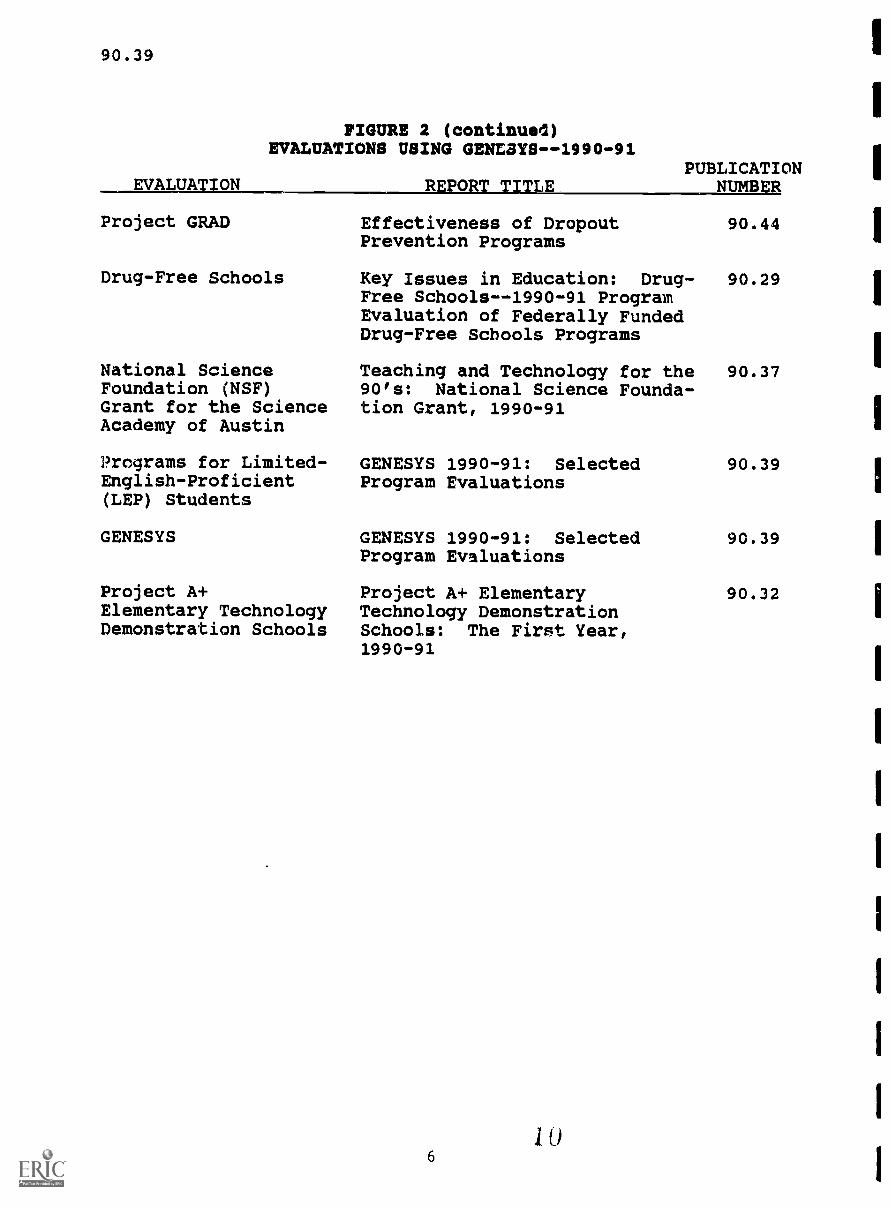
GENESYS was used extensively by ORE staff in 1990-91. Of the 20ORE evaluations listed in The Research and Evaluation Agenda forAISD--1990-U, 10 (including this one) used GENESYS. A list ofthe evaluations using GENESYS in 1990-91 is shown in Figure 2.Results are included in the ORE reports referenced. GENESYSprovided the complete evaluation for the eight programs listed inthe table of contents to this report. Altogether, as of July 12,1991, 39 groups have been run through GENESYS. A complete set ofGENESYS results is available in ORE.
V
FIGURE 2EVALUATIONS USING GENESYS - -1990-91
TLEPUBLICATION
Chapter 2 Formula
Pregnancy, Education,and Parenting (PEP)Pilot
Titl VII BilingualEducation TransitionProgram
School-CommunityGuidance Center
Chapter 2 Formula: Evaluation 90.33Report 1990-91
Pregnancy, Education, andParenting (PEP): Evaluation1990-91
90.30
Title VII Newcomers Program 90.38in AISD, 1990-91
School-Community GuidanceCenter 1990-91: Reaching forNew Levels
5
90.36
90.39
A UA ON
FIGURE 2 (continued)EVALUATIONS USING GENESYS - -1990-91
R 0PUBLICATION
NUMB
Project GRAD
Drug-Free Schools
National ScienceFoundation (NSF)Grant for the ScienceAcademy of Austin
Programs for Limited-English-Proficient(LEP) Students
GENESYS
Project A+Elementary TechnologyDemonstration Schools
Effectiveness of DropoutPrevention Programs
Key Issues in Education: Drug- 90.29Free Schools--1990-91 ProgramEvaluation of Federally FundedDrug-Free Schools Programs
90.44
Teaching and Technology for the 90.37901s: National Science Founda-tion Grant, 1990-91
GENESYS 1990-91: SelectedProgram Evaluations
GENESYS 1990-91: SelectedProgram Evaluations
Project A+ ElementaryTechnology DemonstrationSchools: The First Year,1990-91
6
90.39
90.39
90.32
90.39
SCIENCE ACADEMY AT LBJ
* 0 0 0 0
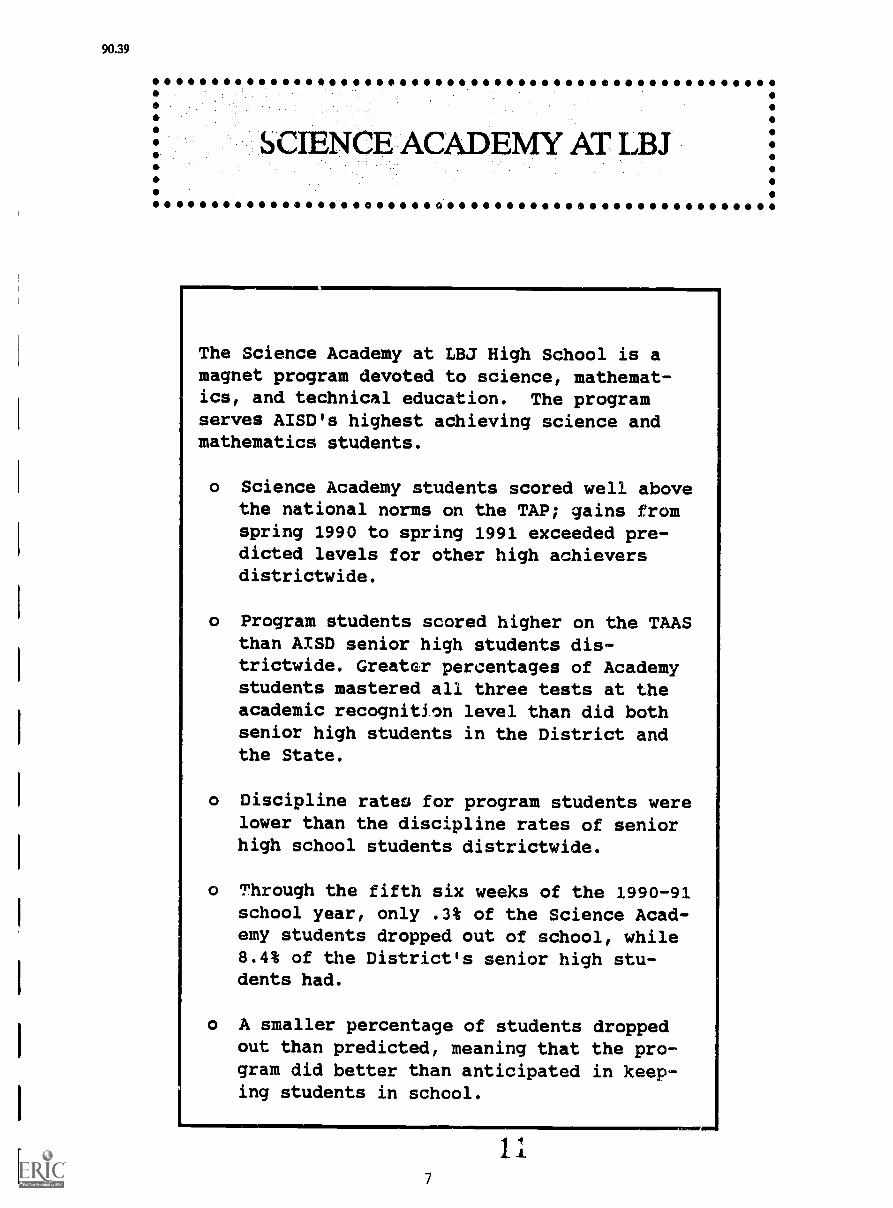
The Science Academy at LBJ High School is amagnet program devoted to science, mathemat-ics, and technical education. The programserves AISD's highest achieving science andmathematics students.
o Science Academy students scored well abovethe national norms on the TAP; gains fromspring 1990 to spring 1991 exceeded pre-dicted levels for other high achieversdistrictwide.
o Program students scored higher on the TAASthan AISD senior high students dis-trictwide. Greater percentages of Academystudents mastered all three tests at theacademic recognition level than did bothsenior high students in the District andthe State.
o Discipline rates for program students werelower than the discipline rates of seniorhigh school students districtwide.
o Through the fifth six weeks of the 1990-91school year, only .3% of the Science Acad-emy students dropped out of school, while8.4% of the District's senior high stu-dents had.
o A smaller percentage of students droppedout than predicted, meaning that the pro-gram did better than anticipated in keep-ing students in school.
7
90.39GENESYS PROGRAM DESCRIPTION
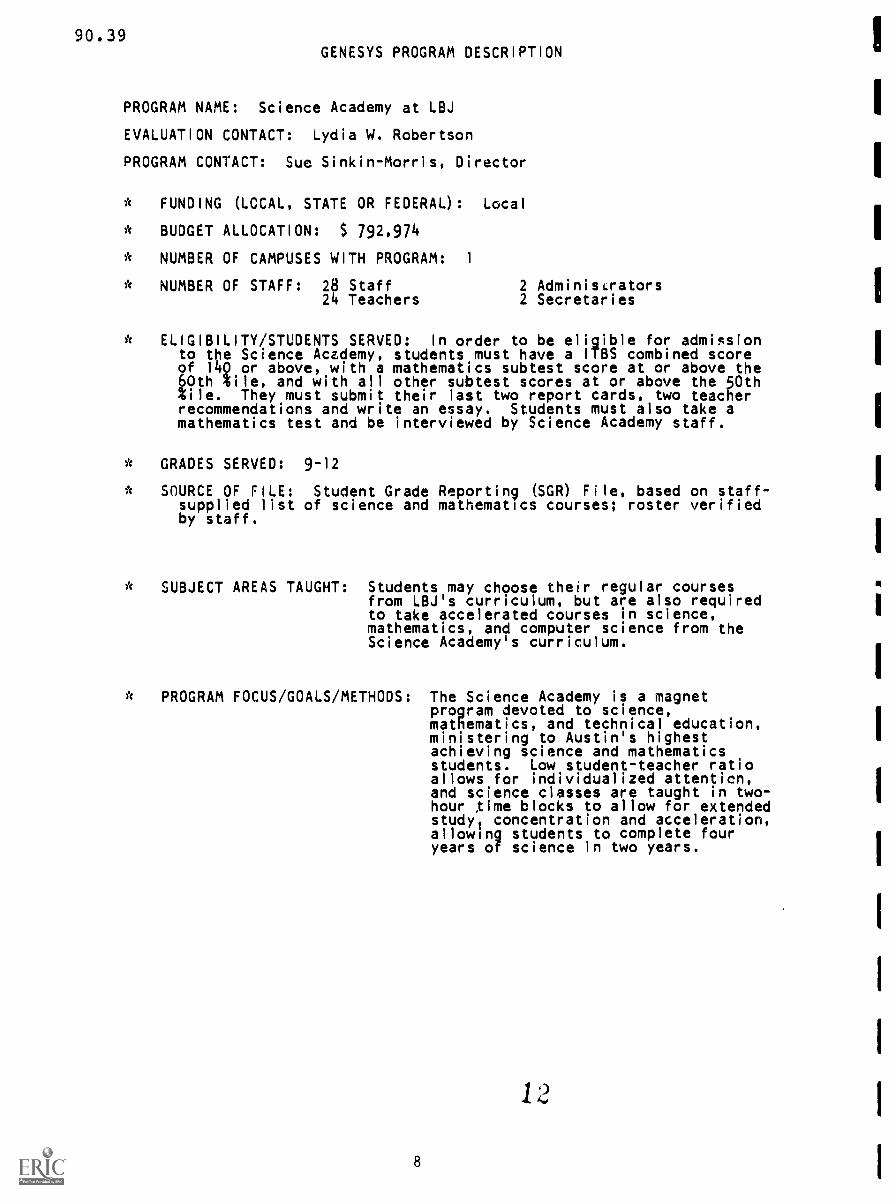
PROGRAM NAME: Science Academy at LBJ
EVALUATION CONTACT: Lydia W. Robertson
PROGRAM CONTACT: Sue Sinkin-Morris, Director
* FUNDING (LOCAL, STATE OR FEDERAL) : Local
* BUDGET ALLOCATION: $ 792,974
* NUMBER OF CAMPUSES WITH PROGRAM: 1
* NUMBER OF STAFF: 28 Staff 2 Administrators24 Teachers 2 Secretaries
* ELIGIBILITY/STUDENTS SERVED: In order to be eligible for admissionto the Science Academy, students must have a ITBS combined scoreof 14g or above, with a mathematics subtest score at or above the60th tile, and with all other subtest scores at or above the 50thtile. They must submit their last two report cards, tdo teacherrecommendations and write an essay. Students must also take amathematics test and be interviewed by Science Academy staff.
* GRADES SERVED: 9-12
* SOURCE OF FILE: Student Grade Reporting (SGR) File, based on staff-supplied list of science and mathematics courses; roster verifiedby staff.
* SUBJECT AREAS TAUGHT: Students may choose their regular coursesfrom LBJ's curriculum, but are also requiredto take accelerated courses in science,mathematics, and computer science from theScience Academy's curriculum.
* PROGRAM FOCUS/GOALS/METHODS: The Science Academy is a magnetprogram devoted to science,mathematics, and technical education,ministering to Austin's highestachieving science and mathematicsstudents. Low student-teacher ratioallows for individualized attentien,and science classes are taught in two-hour Xime blocks to allow for extendedstudy ? concentration and acceleration,allowing students to complete fouryears of science in two years.
8
90.39
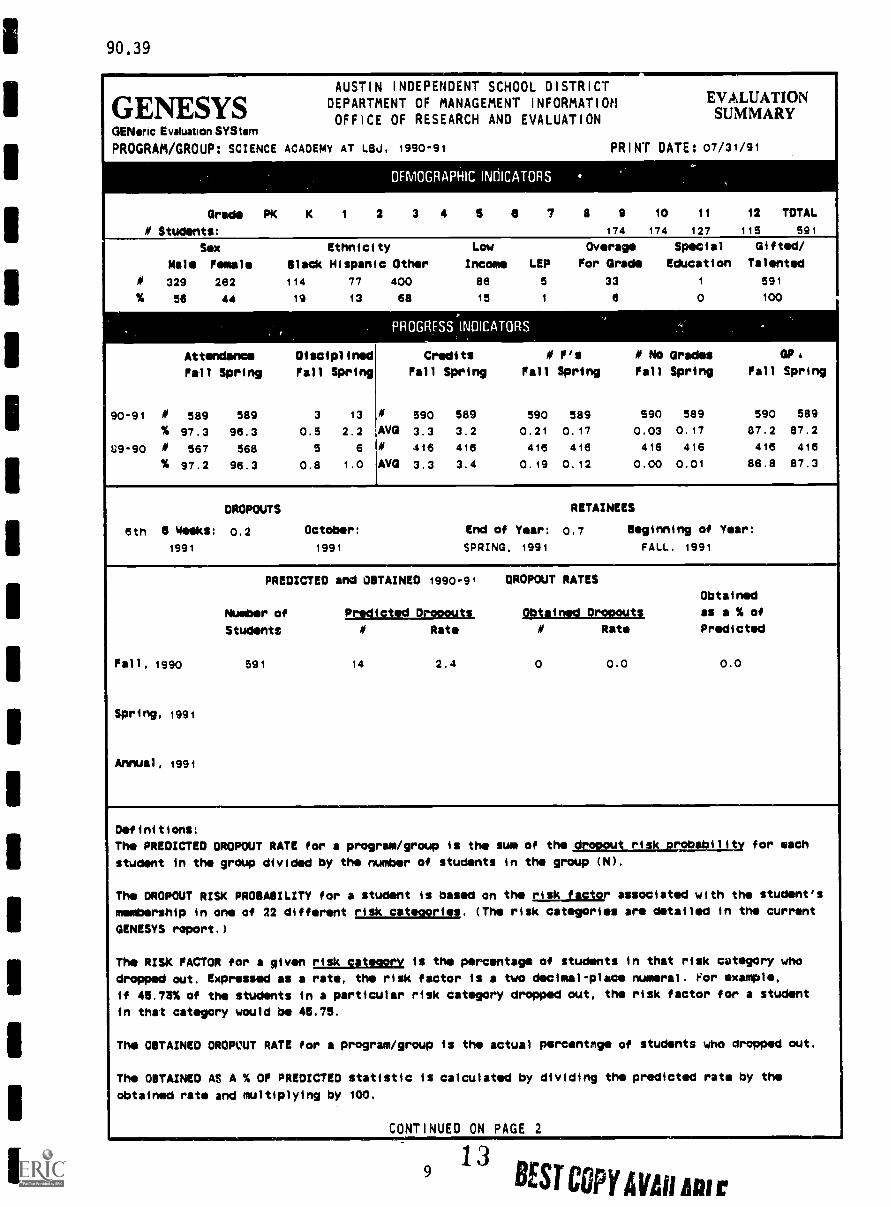
AUSTIN INDEPENDENT SCHOOL DISTRICT
GE1NESYS DEPARTMENT OF MANAGEMENT INFORMATIOH EVALUATION
OFFICE OF RESEARCH AND EVALUATION SUMMARYGENancEvaluatonSYStarn
PROGRAM/GROUP: SCIENCE ACADEMY AT L8d, 1990-91 PRINT OATE: 07/31/91..
OEMOGRAPHIC INdICATORS.
Grade PK K 1 2 3 4 5 5 7 8 9 10 11 12 TOTAL
/I Students: 174 174 127 115 591
Sox Ethnicity
Male Female Black Hispanic
M 329 262 114 77
% 56 44 19 13
Attendance Disciplined
Fall Spring Fall Spring
90-91 M 589 589 3 13
% 97.3 96.3 0.5 2.2
09-90 M 567 568 5 6
% 97.2 96.3 0.8 1.0
Low Overage Special Gifted/
Other Income LEP For Grade Education Talented
400 86 5 33 1 591
68 15 1 a o 100
. .,
PROGRESS INOICATORS
Credits M F's f No Gradse OP4
Fall Spring Fall Spring Fall Spring Fall Spring
M 590 589 590 589 590 589 590 589
AVG 3.3 3.2 0.21 0.17 0.03 0.17 87.2 87.2
M 416 416 416 416 416 416 416 416
AVG 3.3 3.4 0.19 0.12 0.00 0.01 86.8 87.3
DROPOUTS RETAINEES
6th 5 Weeks: 0.2 October: End of Year: 0,7 Beginning of Year:
1991 1991 SPRING, 1991 FALL. 1991
PREDICTED and OBTAINED 1990-94 QROPOUT RATES
Obtained
Number of Predicted_Drocouts Obtained Dropouts as a % of
Students f Rats f Rate Predicted
Fall, 1990 591 14 2.4 o 0.0 0.0
Spring, 1991
Annual, 1991
Definitions:
The PREDICTED OROPOUT RATE for a program/group
student in the group divided by the number
The DROPOUT RISK PROBABILITY for a student
membership in one of 22 different risk
is the sum of the dropout_risk prat:Agility for each
of students in the group (N).
is based on the upjulogr associated with the student'scateggralg, (The risk categories are detailed in the current
OENESYS roport,)
The RISK FACTOR for a given risk Cat000rv is the percentage of students in that risk category who
dropped out. Expressed as a rate, the risk factor is a two decimal-place numeral. For xample,
if 45.78% of the students in a particular risk category dropped out, the risk factor for a student
in that category would be 45,75.
The OBTAINED DROPCUT RATE for a program/group is the actual porcentmge of students who dropped out.
The OBTAINED AS A % OF PREDICTED statistic is calculated by dividing the predicted rate by the
obtainod rate and multiplying by 100.
..CONTINUED ON PAGE 2
9 13 BEST COPY AVM c
90.39
PROGRAN/GRUUP: SCIENCE ACADEMY AT LEW, 1990-91 tVALUA I I UN JUPINAKTr.. Z
, . ACHIEVEMENT INOICATORS .
<,
.
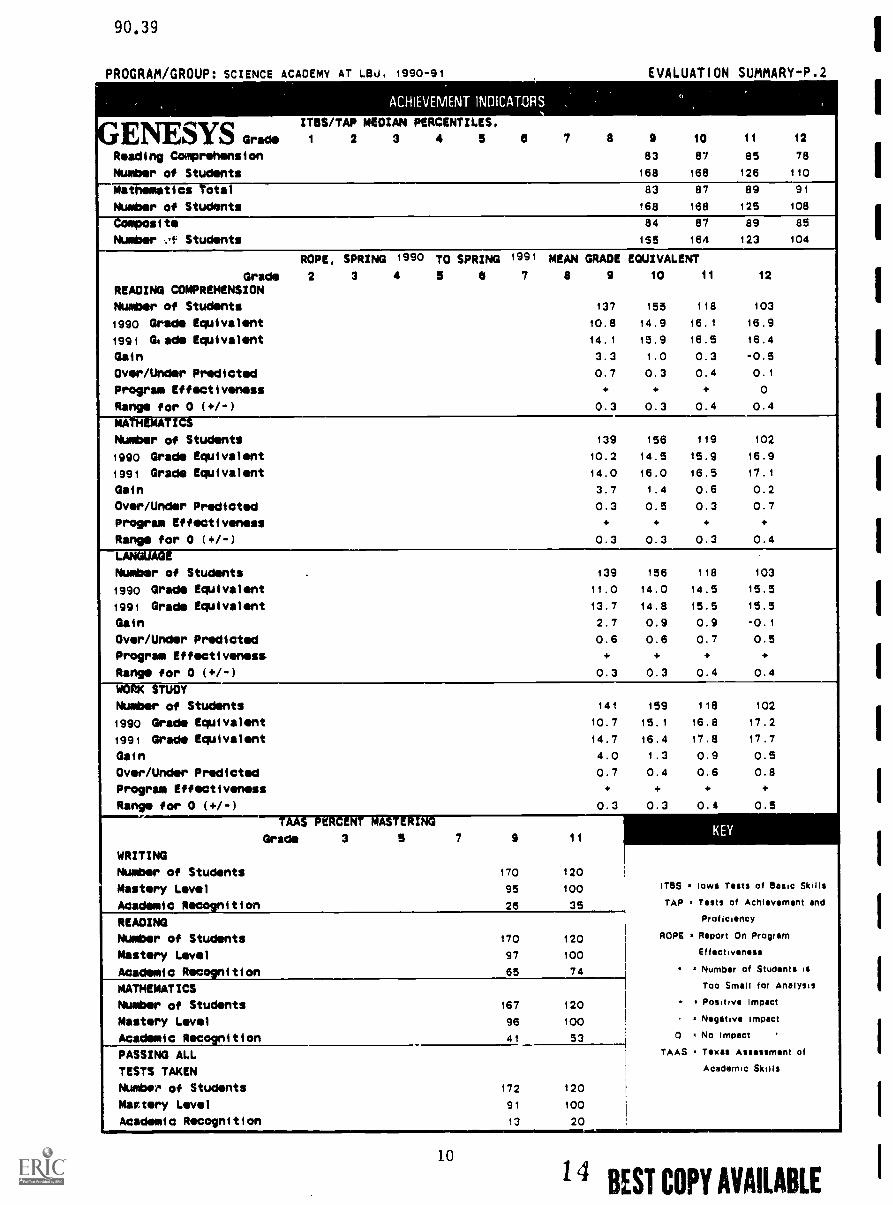
GENESYS Grade
Ti5S/T MEDIAN PERCENTILESI AP ,
2 3 4 5 a 7 a 9 10 11 12
Reading Comprehension 83 87 85 78
Number of Students 168 168 126 110
Mathematics Total 83 87 89 91
Number of Students 168 168 125 108
Composite 84 87 89 85
Number ...I' Students 165 164 123 104
ROPE, SPRING 1990 TO SPRING 1991 MEAN GRADE EQUIVALENT
Grade 2 3 4 5 5 7 8 9 10 11 12
READING COMPREHENSION
Number of Students 137 155 118 103
1990 Grade Equivalent 10.8 14.9 16.1 16.9
1991 Glade Equivalent 14.1 15.9 16.5 16.4
Gain 3.3 1.0 0.3 -0.5
Over/Under Predicted 0.7 0.3 0.4 0.1
Program Effectiveness 4. 4. 4. 0
Range for 0 (+1-) 0.3 0.3 0.4 0.4
MATHEMATICS
Number of Students 139 156 119 102
1990 Grade Equivalent 10.2 14.5 15.9 16.9
1991 Grade Equivalent 14.0 16.0 16.5 17.1
Gain 3.7 1.4 0.6 0.2
Over/Under Predicted 0.3 0.5 0.3 0.7
Program Effectiveness 4. 4. 4. 4.
Range for 0 (+/-) 0.3 0.3 0.3 0.4
FT r
Number of Students.
139 156 118 103
1990 Grade Equivalent 11.0 14.0 14.5 15.5
1991 Grade Equivalent 13.7 14.8 15.5 15.5
Gain 2.7 0.9 0.9 -0.1
Over/Under Predicted 0.6 0.6 0.7 0.5
Program Effectiveness 4. 4. 4. 4.
Range for 0 (+1-) 0.3 0.3 0.4 0.4
WORK STUDY
Number of Students 141 159 118 102
1990 Grade Equivalent 10.7 15.1 16.8 17.2
1991 Grade Equivalent 14.7 16.4 17.8 17.7
Gain 4.0 1.3 0.9 0.5
Over/Under Predicted 0.7 0.4 0.6 0.8
Program Effectiveness 4. 4. 4. 4.
Range for 0 (+/-) 0.3 0.3 0.4 0.5...
TAAS PERCENT MASTERING
Grade 3 5 7 9 11KEY
WRITING
Number of Students 170 120
Mastery Level 95 100 inn lows Tests of Basic Skills
Academic Recognition 26 35 TAP Tests of Achievement and
READING Prof iciency
Number of Students 170 120 ROPE Report On Program
Mastery Level 97 100 Effectiveness
Academic Recognition 65 74 Number of Students is
MATHEMATICS Too Small for Analysis
Number of Students 167 120 Positive Impact
Mastery Level 96 100 Negative impact
Academic Recognition 41 53 0 No impact '
PASSING ALL TAAS Texas Assessment of
TESTS TAKEN Academic Skills
Numbee of Students 172 120
Maxtery Level 91 100
Academic Recognition 13 20
10
14 BEST COPY AVAILABLE
90.39
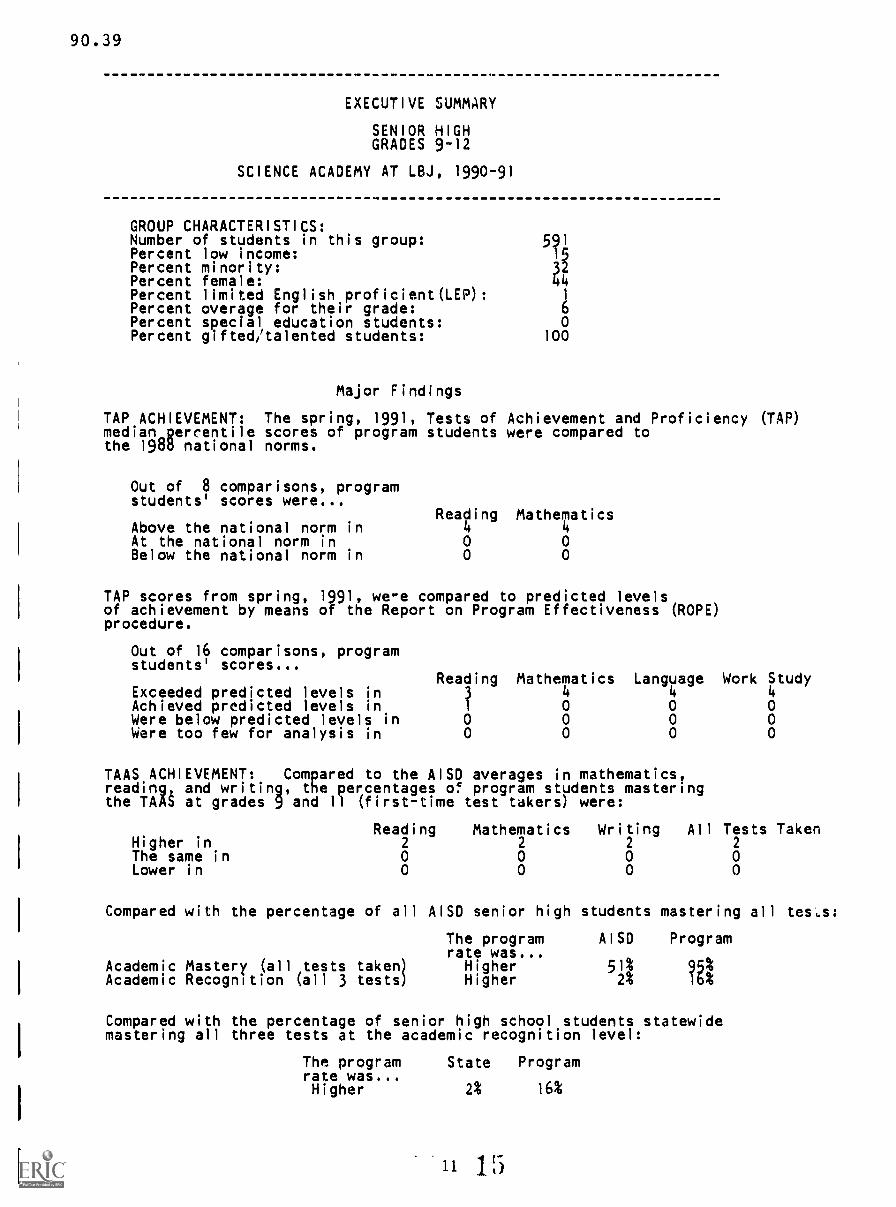
EXECUTIVE SUMMARY
SENIOR HIGHGRADES 9-12
SCIENCE ACADEMY AT LBJ, 1990-91
GROUP CHARACTERISTICS:Number of students in this group: .5?iPercent low income:Percent minority: 31
44Percent female:Percent limited English proficient(LEP): 1
Percent overage for their grade: 6Percent special education students: 0Percent gifted/talented students: 100
Major Findings
TAP ACHIEVEMENT: The spring, 1991, Tests of Achievement and Proficiency (TAP)median prcentile scores of program students were compared tothe 198U national norms.
Out of 8 comparisons, programstudents' scores were...
Reading MathematicsAbove the national norm in 4 4At the national norm in 0 0Below the national norm in 0 0
TAP scores from spring, 1991, we-e compared to predicted levelsof achievement by means of the Report on Program Effectiveness (ROPE)procedure.
Out of 16 comparisons, programstudents' scores...
Exceeded predicted levels inReading Mathematics Language Work Study
4 4 4Achieved predicted levels in 0 0 0Were below predicted levels in 0 0 0 0Were too few for analysis in 0 0 0 0
TAAS ACHIEVEMENT: Compared to the AISD averages in mathematics,reading, and writing, the percentages of program students masteringthe TAAS at grades 9 and 11 (first-time test takers) were:
Reading Mathematics Writing All Tests TakenHigher in 2 2 2 2
The same in 0 0 0 0Lower in 0 0 0 0
Compared with the percentage of all AISD senior high students mastering all tes,s:
The program AISD Programrate was...
Academic Mastery (all tests taken) Higher 51%Academic Recognition (all 3 tests) Higher 2% ?a
Compared with the percentage of senior high school students statewidemastering all three tests at the academic recognition level:
The program State Programrate was...Higher 2% 16%
15

90.39
ATTENDANCE: Compared with the attendance rates for senior highJistrictwide:
Fall, 1990Spring, 1991
Compared to...
Progrgm studentsin 19149-90
The programrate was...HigherHigher
AISD Program
Bit NA1990-91 program attendance was...
Fall: HigherSpring: The same
DISCIPLINE: Compared with the percentages of students involved indiscipline incidents at the senior high level districtwide:
The program AISD Programrate was...
Fall, 1990 Lower 4.1% 0.5%Spring, 1991 Lower 4.2% 2.2%
Compared to... 1990-91 program discipline was...
Progrgm students Fall: Lowerin 19d9-90 Spring: Higher
GRADES: Compared with the GPA's for all AISD senior high students:
The program AISD Programrate was...
Fall, 1990 Higher 80.3 INSpring, 1991 Higher 79.5
Compared to... 1990-91 program GPA was...
Progrgm students Fall: Higherin 19o9-TO Spring: Lower
RETAINEES/DROPOUTS: Comparing the percentage of program stJdentsrecommended in spring, 1991, for retention the following year withall AISD senior high students:
The program AISD Programrate was...
Lower 6.1% 0.7%
Compared to the sixth six weeks dropout rate for senior high studentsfor 1990-91:
The programrate was...
Lower
AISD Program
9.7% 0.2%
Compared with the percentage of program students predicted to drop out:
The obtained Predicted Obtainedrate was...
Lower 2.4% 0.0%
As a percentage of the dropout rate predicted for these students:
The program rate was... Meaning that...Less than 100% The program did better
than anticipated
File name:LR@NSF91
9039
IllAbespleesesoleeleessesesoodos
4-4-4ti '. .'s
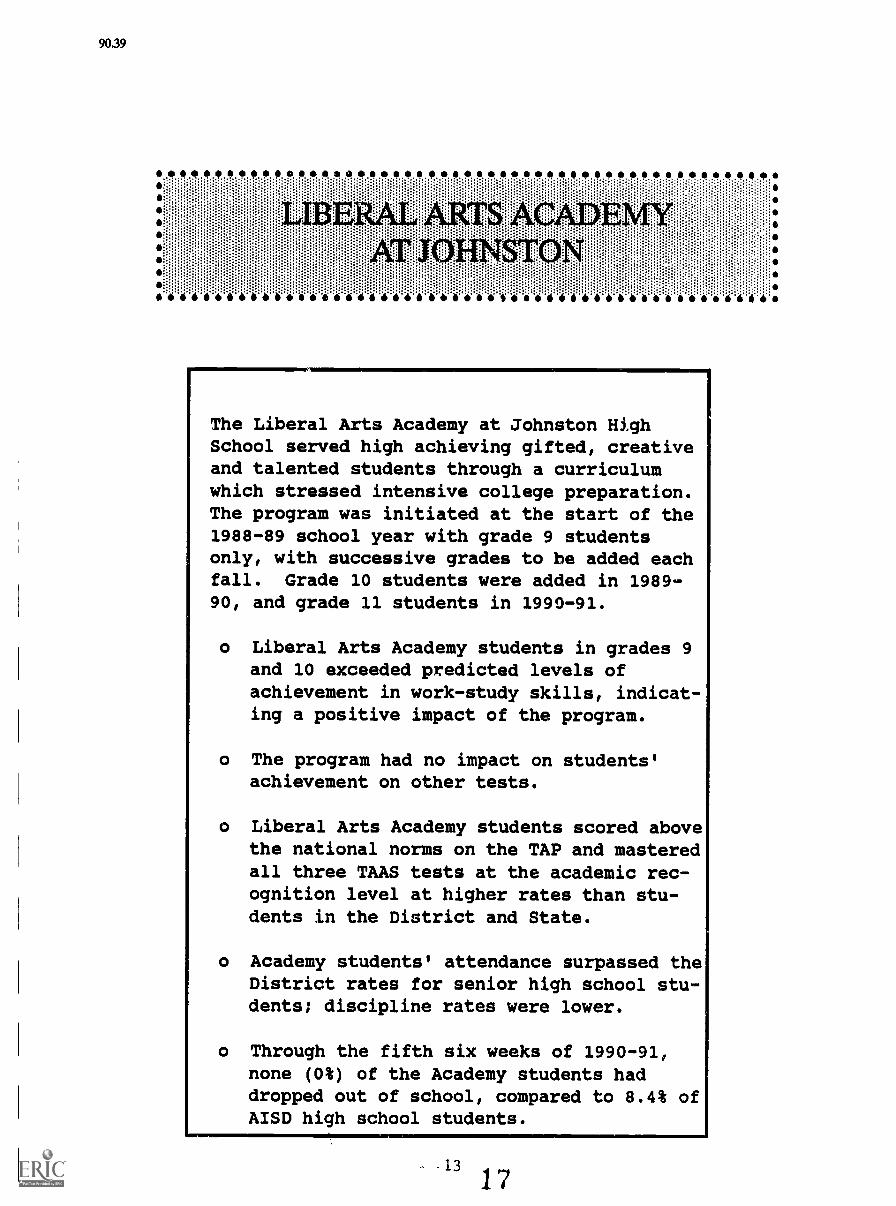
The Liberal Arts Academy at Johnston HighSchool served high achieving gifted, creativeand talented students through a curriculumwhich stressed intensive college preparation.The program was initiated at the start of the1988-89 school year with grade 9 studentsonly, with successive grades to be added eachfall. Grade 10 students were added in 1989-90, and grade 11 students in 1990-91.
o Liberal Arts Academy students in grades 9and 10 exceeded predicted levels ofachievement in work-study skills, indicat-ing a positive impact of the program.
o The program had no impact on students'achievement on other tests.
o Liberal Arts Academy students scored abovethe national norms on the TAP and masteredall three TAAS tests at the academic rec-ognition level at higher rates than stu-dents in the District and State.
o Academy students' attendance surpassed theDistrict rates for senior high school stu-dents; discipline rates were lower.
o Through the fifth six weeks of 1990-91,none (0%) of the Academy students haddropped out of school, compared to 8.4% ofAISD high school students.

90.39GENESYS PROGRAM DESCRIPTION
PROGRAM NAME: Lrai Arts Academy at Johnston, 1990-91
EVALUATION CONTACT: Vince Paredes
PROGRAM CONTACT: Clark Lyman
* FUNDING (LOCAL, STATE OR FEDERAL) : Local
* BUDGET ALLOCATION: $379,688
* NUMBER OF CAMPUSES WITH PROGRAM: 1--Johnston High SchoolStudents from all public middle/junior highs, allattendance areas
NUMBER OF STAFF: 13 staff
* ELIGIBILITY/STUDENTS SERVED: 1. ITBS Language and Reading Total2. GPA--(middle/junior high)3. Most recent grades4 Application essay5. Interview6. Two or more teacher recommendations
Staff takes into account all of the above to place thestudent in LAA, science academy or honors courses.
* GRADES SERVED: 9, 10, 11 (3rd year of program) . Eventually 9-12(one grade per year will be added).
* SOURCE OF FILE: Roster with all in program as of June, 1991
* SUBJECT AREAS TAUGHT: 7-period academic dayForeign Language, LAA English, LAA Social Studies,Science, Mathematics, Health/PE, Selected electives(must be approved)--Band, Drama, Journalism, Dance,Debate
* PROGRAM FOCUS/GOALS/METHODS: The Liberal Arts Academy at JohnstonHigh School provides gifted, creative, and talented students anaccelerated academic program leading to an exceptionally strongperparation for college. It is expected that students willgraduate at the end of four years with one year's college credit.Capable students and their LAA families are interested in generalpreparation in all liberal arts areas and special enrichment inthe areas of foreign languages and the humanities. Additionally,the Liberal Arts Academy provides study trips, resourse speakers,and numerous cultural opportunities to its scholars on an ongoingbasis.
13
14
90.39
A=M.AUSTIN
GENESYS DEPARTMENTOFFICE
GENeric Evaluation SYStem
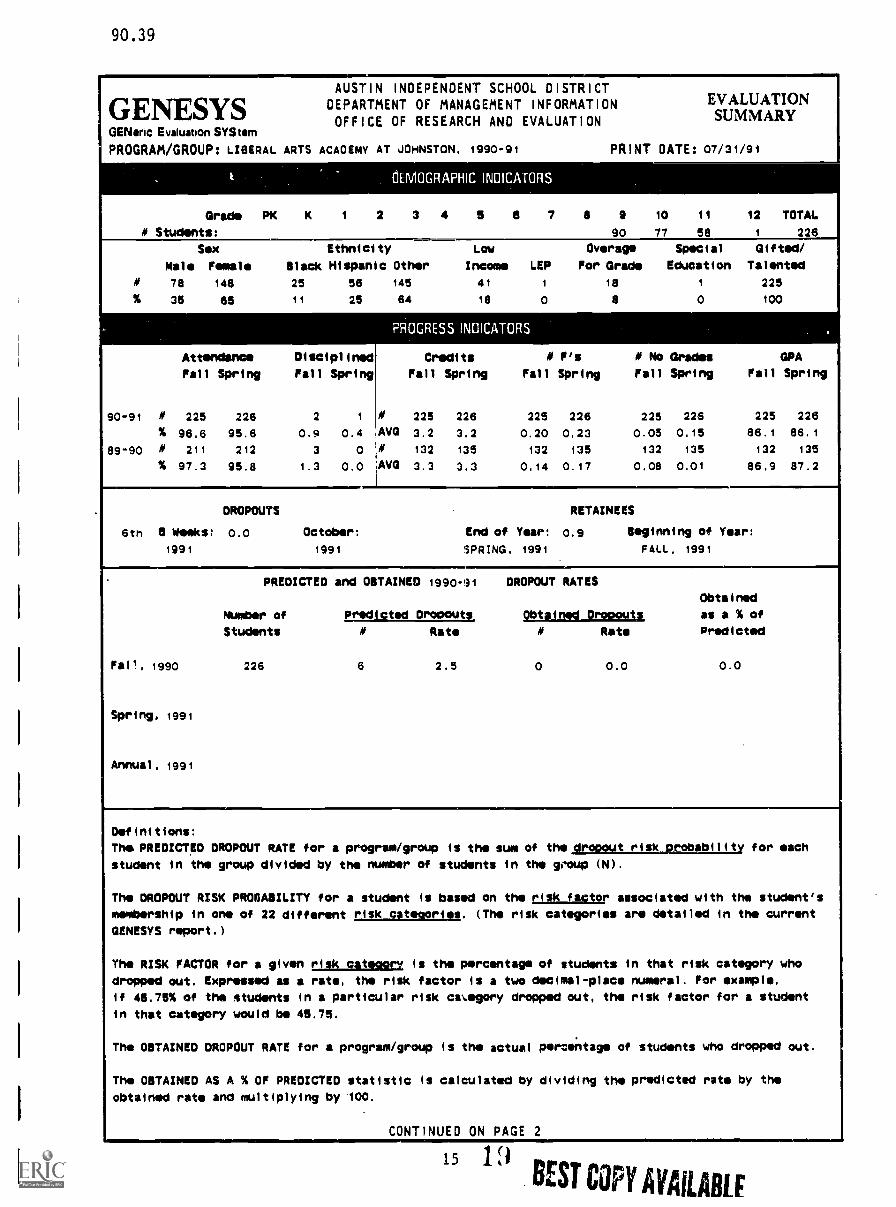
PROGRAM/GROUP: LIBERAL ARTS ACADEMY
, .
t
Grade PK K 1
S Students:
iMimmmw
INDEPENDENT SCHOOL DISTRICTOF MANAGEMENT INFORMATION EVALUATION
OF RESEARCH AND EVALUATION SUMMARY
AT JOHNSTON, 1990-91 PRINT ()ATE: 07/31/91
DEMOGRAPHIC INDICATORS
2 3 4 5 6 7 8 6 10 11 12 TOTAL
90 77 58 1 226
Sex Ethnicity
Male Female Black Hispanic
# 78 148 25 56
% 35 85 11 25
Attendance Disciplined
Fall Spring Fall Spring
90-91 # 225 226 2 i
% 96.6 95.6 0.9 0.4
89-90 # 211 212 3 0
% 97.3 95.8 1.3 0.0
Low Overage Special Gifted/
Other Income LEP For Grade Education Talented
145 41 1 18 1 225
64 18 0 8 0 100
PROGRESS INDICATORS .
Credits S F's S No Grades GPA
Fall Spring Fall Spring Fall Spring Fall Spring
# 225 226 225 226 225 226 225 226
AVG 3.2 3.2 0.20 0.23 0.05 0.15 86.1 86.1
# 132 135 132 135 132 135 132 135
AVG 3.3 3.3 0.14 0.17 0.08 0.01 86.9 87.2
DROPOUTS RETAINEES
6th a Weeks: 0.0 October: End of Year: 0.9 Beginning of Year:
1991 1991 SPRING, 1991 FALL. 1991
PREDICTED and OBTAINED i990-91 DROPOUT RATES
Obtained
Number of padicted oromutt Obtained DroDouts as a % of
Students S Rate S Rate Predicted
Fall, 1990 226 6 2.5 o 0.0 0.0
Spring, 1991
Annual, 1991
Definitions:
The PREDICTED DROPOUT RATE for a program/group
student in the group divided by the nueber
The DROPOUT RISK PROBABILITY for a student
membership in one of 22 different risk
is the sum of theija.20SLeILULLty for eachof students in the geoup (N).
is based on the risk_fector associated with the student's
categories. (The risk categories are detailed in the current
GENESYS report.)
The RISK FACTOR for a given risk category is the percentage of students in that risk category who
dropped out. Expressed as a rate, the risk factor is a two decimal-place numeral. For example,
if 45.75% of the students in a particular risk caArgory dropped out, the risk factor for a student
in that category would be 45.75.
The OBTAINED DROPOUT RATE for a program/group is the actual percentage of students who dropped out.
The OBTAINED AS A % OF PREDICTED statistic is calculated by dividing the predicted rate by the
obtained rate and multiplying by 100.
CONTINUED ON PAGE 2
151 9 BEST COPY AV AlLARir
90.39
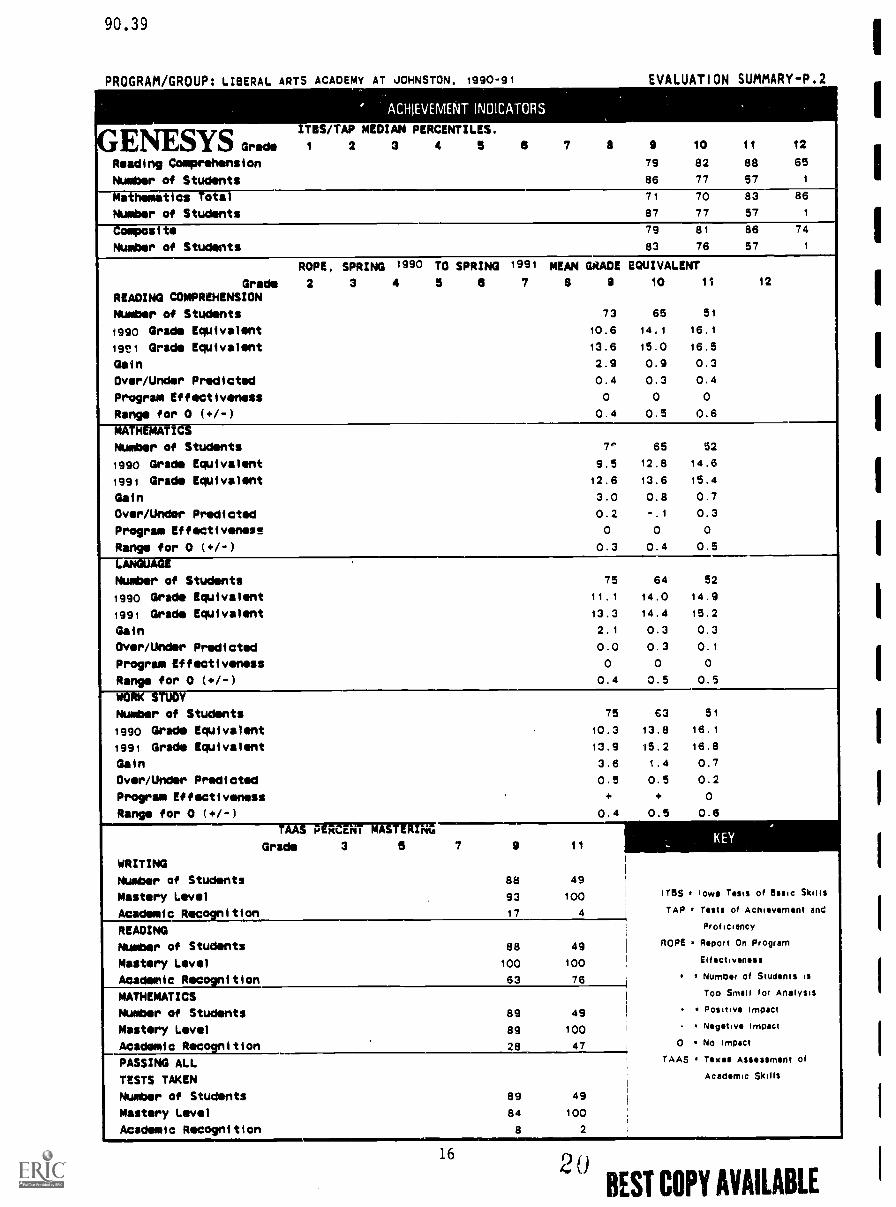
PROGRAM/GROUP: LIBERAL ARTS ACADEMY AT JOHNSTON, 1990-91
' ACHIEVEMENT INCICATORS
ENESYS Grade
IT:SS/TAP MEDIAN PERCENTILES,
2 3 4 5 a
Reading Comprehension
Number of Students
7 8
EVALUATION SUMMARY-P.2
,
9 10 11 12
79 82 88 65
86 77 57 1
athemat es o al 71 70 83 86
Number of Students 87 77 57 1
--site 79 81 86 74
Number of Students 83 76 57 i
ROPE, SPRING 1990 TO SPRING 1991 MEAN GRADE EQUIVALENT
Grade 2 3 4 5 0 7 a a 10 11 12
READING COMPREHENSION
Number of Students 73 65 51
1990 Grade Equivalent 10.6 14.1 16.1
19e1 Grade Equivalent 13.6 15.0 16.5
Gain 2.9 0.9 0.3
Over/Under Predicted 0.4 0.3 0.4
Program Effectiveness 0 0 0
Range for 0 (+/-) 0.4 0.5 0.6
MATHEMATICS
Number of Students 7e 65 52
1890 Grade Equivalent 9.5 12.8 14.6
1991 Grade Equivalent 12.6 13.6 15.4
Gain 3.0 0.8 0.7
Over/Under Predicted 0.2 -.1 0.3
Program Effectiveness 0 0 0
Range for 0 (+/-) 0.3 0.4 0.5
LANGUAGE
Number of Students 75 64 52
1990 Grade Equivalent 11.1 14.0 14.9
1991 Grade Equivalent 13.3 14.4 15.2
Gain 2.1 0.3 0.3
Over/Under Predicted 0.0 0.3 0.1
Program Effectiveness 0 0 0
Range for 0 (+/-) 0.4 0.5 0.5
' 7 STUDY
Number of Students 75 63 51
1990 Grade Equivalent 10.3 13.8 16.1
1991 Grade Equivalent 13.9 15.2 16.8
Gain 3.6 1.4 0.7
Over/Under Predicted 0.5 0.5 0.2
Program Effectiveness + + 0
Range for 0 (+/-) 0.4 0.5 0.6
TAAS P tiL.Cret MASTERING
Grade 3 5 7 9 11
WRITING
Number of Students 88 49
Mastery Level 93 100 ITEIS Iowa Tests Of INISIC Skills
Academic Recognition 17 4 TAP Tests of Achievement and
READING Prof iciency
Nueber of Students 88 49 ROPE Report On Program
Mastery Level 100 100 Effectiveness
Academic Recognition 63 76 Number of Students is
MATHEMATICS Too Small for Analysis
Number of Students 89 49 - Positive Impact
Mastery Level 89 100 = Negative Impact
Academic Recogn 1 t ion 28 47 0 No Impact
PASSING ALL TAAS Texas A merit of
TESTS TAKEN Academic Skills
Number of Students 89 49
Mastery Level 84 100
Academic Recognition 8 2
162 o
BEST COPY AVAILABLE
90.39
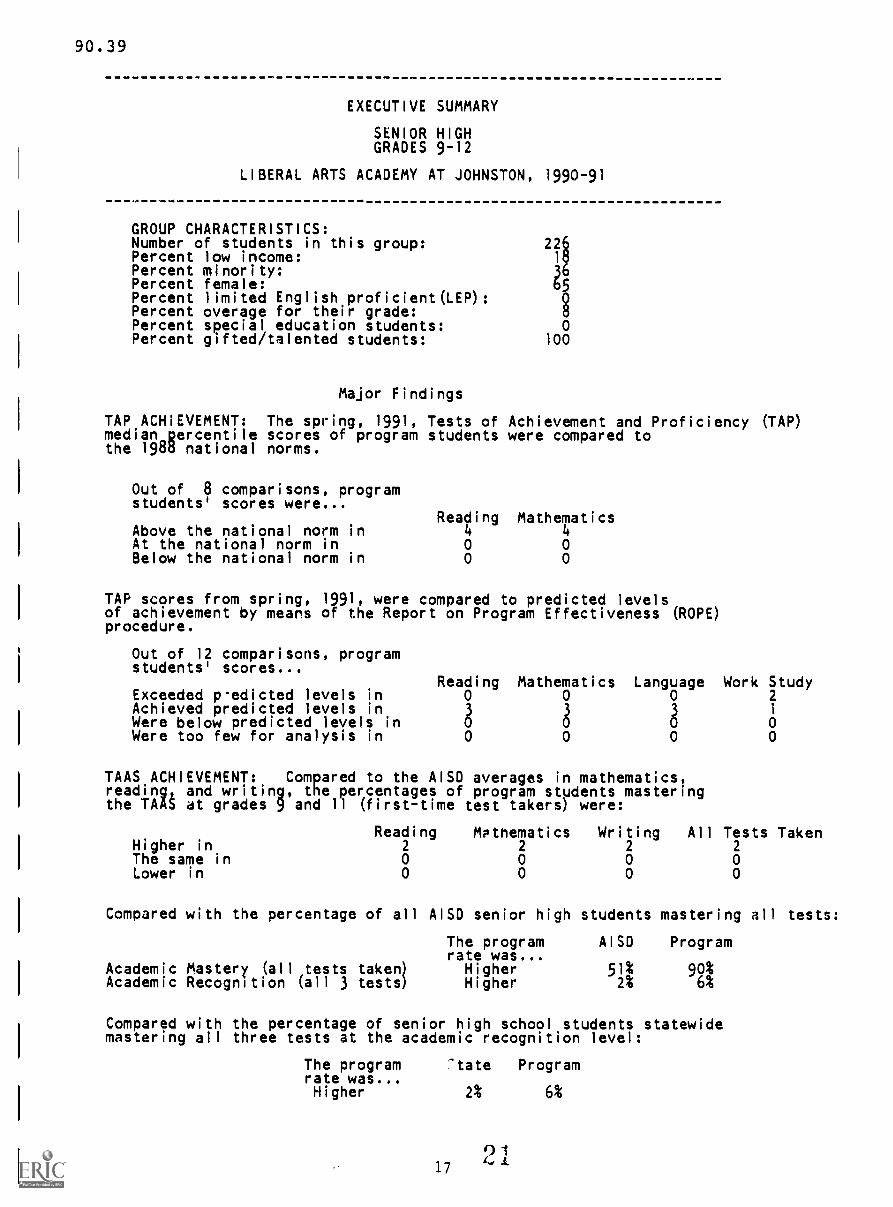
EXECUTIVE SUMMARY
SENIOR HIGHGRADES 9-12
LIBERAL ARTS ACADEMY AT JOHNSTON, 1990-91
GROUP CHARACTERISTICS:Number of students in this group:Percent low income: 1
Percent minority:gPercent female: 5
Percent limited English proficient(LEP):gPercent overage for their grade:
Percent special education students: 0Percent gifted/talented students: 100
Major Findings
TAP ACHiEVEMENT: The spring, 1991, Tests of Achievement and Proficiency (TAP)median Rercentile scores of program students were compared tothe 198d national norms.
Out of 8 comparisons, programstudents' scores were...
Reading MathematicsAbove the national norm in 4 4At the national norm in 0 0Below the national norm in 0 0
TAP scores from spring, 1991, were compared to predicted levelsof achievement by means of the Report on Program Effectiveness (ROPE)procedure.
Out of 12 comparisons, programstudents' scores...
Exceeded p-edicted levels inReading Mathematics Language Work Study
0 0 0 2Achieved predicted levels inWere below predicted levels in 0Were too few for analysis in 0 0 0 0
TAAS ACHIEVEMENT: Compared to the AISD averages in mathematics,reading, and writing, the percentages of program students masteringthe TAAS at grades 9 and 11 (first-time test takers) were:
Reading Mptnematics Writing All Tests TakenHigher in 2 2 2 2
The same in 0 0 0 0Lower in 0 0 0 0
Compared with the percentage of all
Academic Mastery (all tests taken)Academic Recognition (all 3 tests)
AISD senior high students mastering all tests:
The program AISD Programrate was...
Higher 51% 90%Higher 2% 6%
Compared with the percentage of senior high school students statewidemastering all three tests at the academic recognition level:
The program 'tate Programrate was...Higher 2% 6%
17
014.1
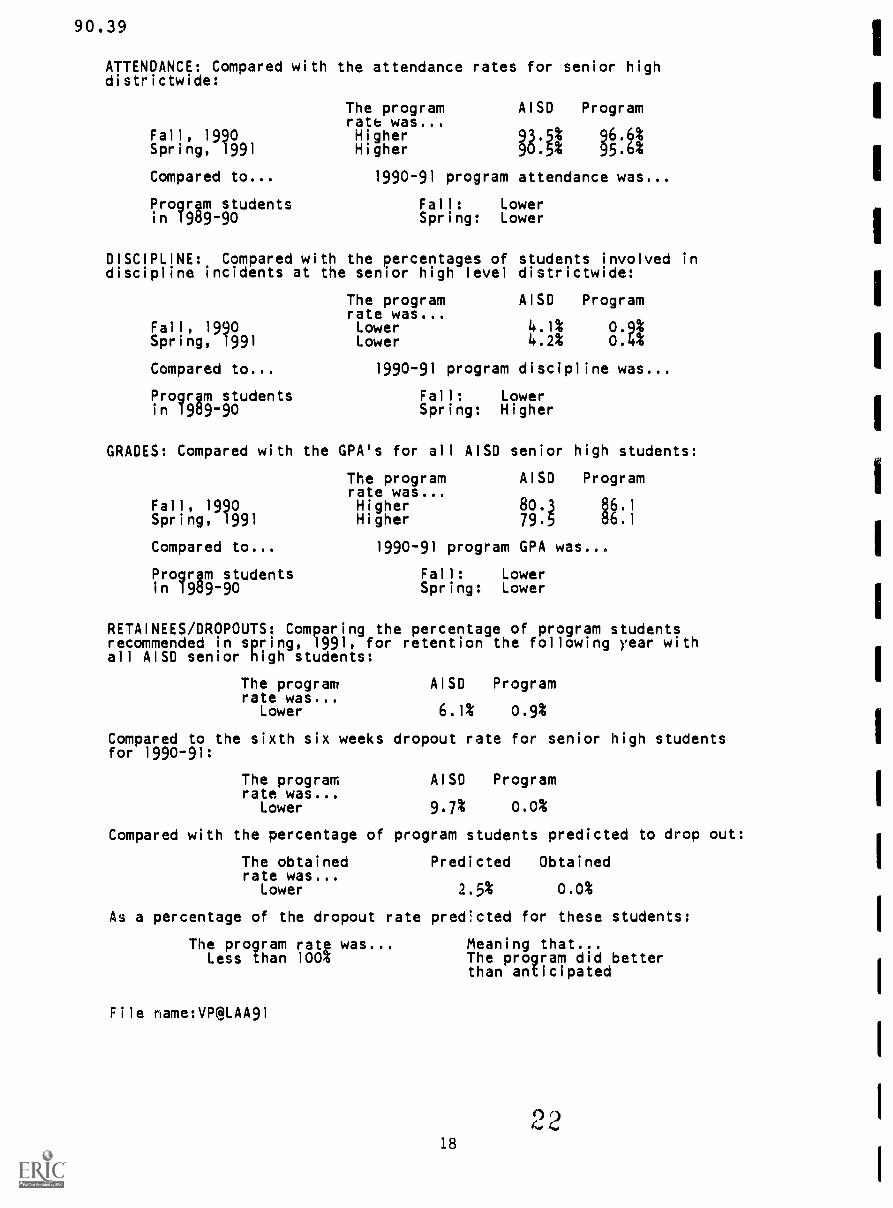
90.39
ATTENDANCE: Compared with the attendance rates for senior highdistrictwide:
Fall, 1990Spring, 1991
Compared to...
Program studentsin 1989-90
The programrate was...HigherHigher
AISD Program
38it n:211990-91 program attendance was...
Fall: LowerSpring: Lower
DISCIPLINE: Compared with the percentages of students involved indiscipline incidents at the senior high level districtwide:
The program AISD Programrate was...
Fall, 1990 Lower 4.1%8:3Spring, 1991 Lower 4.2%
Compared to... 1990-91 program discipline was...
Program students Fall: Lowerin 1989-90 Spring: Higher
GRADES: Compared with the GPA's for all AISD senior high students:
Fall, 1990Spring, 1991
Compared to...
Program studentsin 1969-90
The programrate was...HigherHigher
AISD Program
80.3 86.179.5 166.1
1990-91 program GPA was...
Fall: LowerSpring: Lower
RETAINEES/DROPOUTS: Comparing the percentage of program studentsrecommended in spring, 1991, for retention the following year withall AISD senior high students:
The program AISD Programrate was...
Lower 6.1% 0.9%
Compared to the sixth six weeks dropout rate for senior high studentsfor 1990-91:
The program AISD Programrate was...
Lower 9.7% 0.0%
Compared with the percentage of program students predicted to drop out:
The obtained Predicted Obtainedrate was...
Lower 2.5% 0.0%
As a percentage of the dropout rate predicted for these students:
The program ratp was... Meaning that...Less than 1004 The program did better
than anticipated
File name:VP@LAA91
90.39
:::
,.44444'44.:4.4.
!:1* *
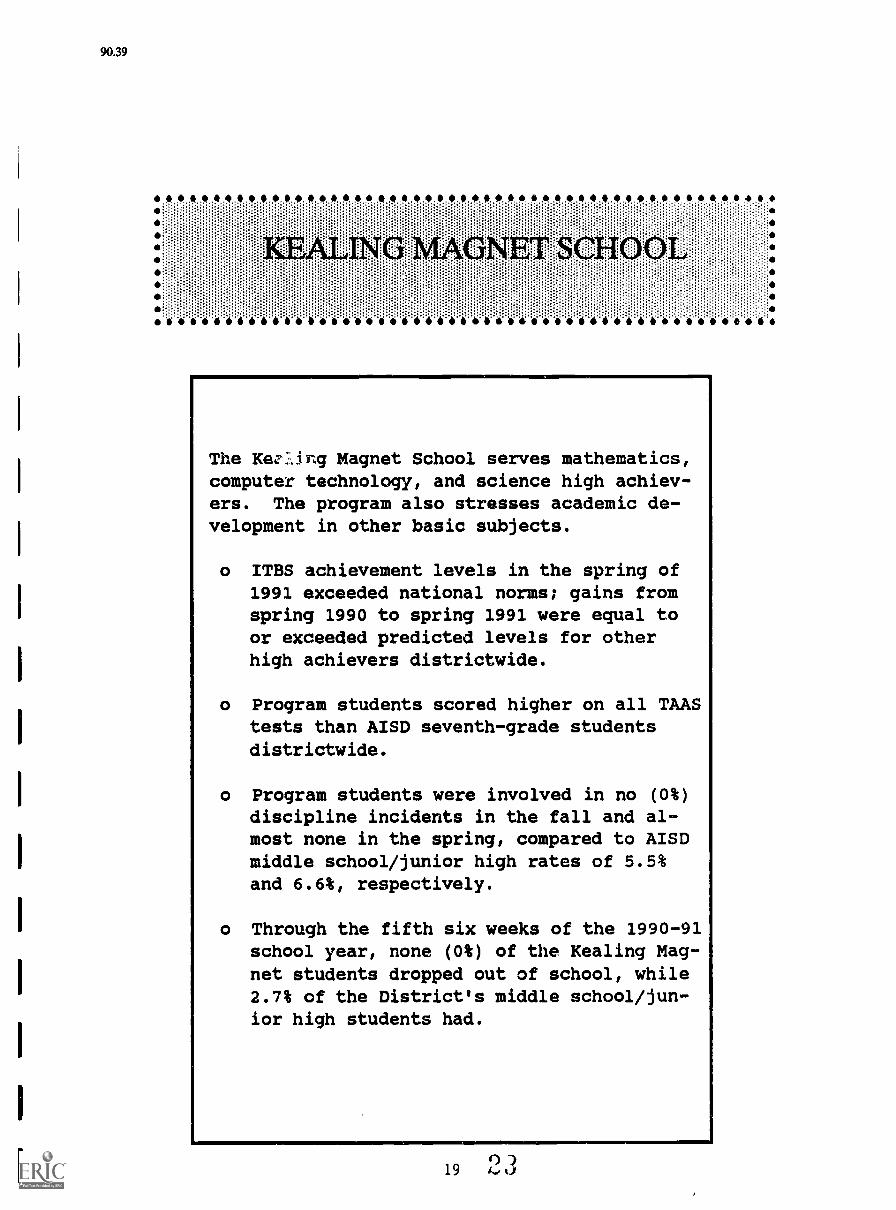
The Kec?:ing Magnet School serves mathematics,computer technology, and science high achiev-ers. The program also stresses academic de-velopment in other basic subjects.
o ITBS achievement levels in the spring of1991 exceeded national norms; gains fromspring 1990 to spring 1991 were equal toor exceeded predicted levels for otherhigh achievers districtwide.
o Program students scored higher on all TAAStests than AISD seventh-grade studentsdistrictwide.
o Program students were involved in no (0%)discipline incidents in the fall and al-most none in the spring, compared to AISDmiddle school/junior high rates of 5.5%and 6.6%, respectively.
o Through the fifth six weeks of the 1990-91school year, none (0%) of the Kealing Mag-net students dropped out of school, while2.7% of the District's middle school/jun-ior high students had.
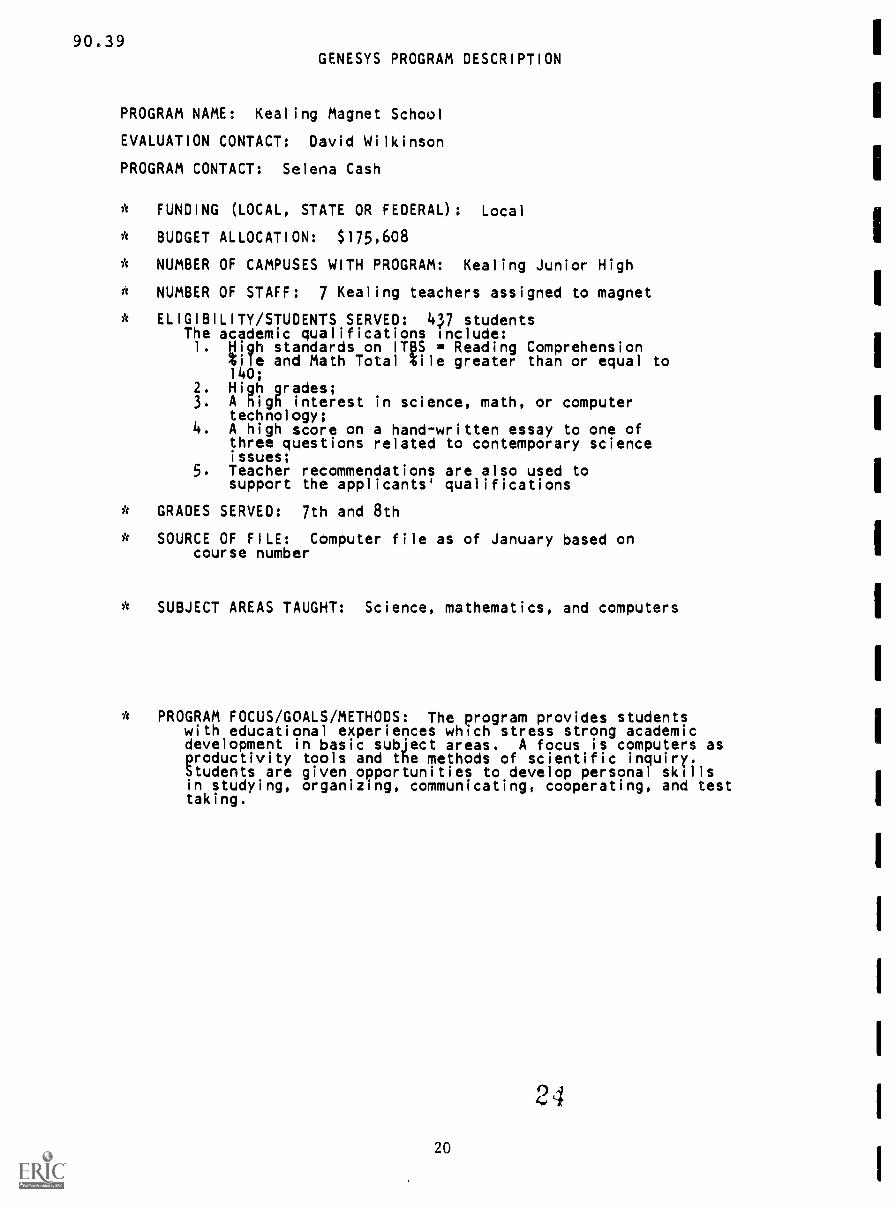
90.3 9GENESYS PROGRAM DESCRIPTION
PROGRAM NAME: Kealing Magnet School
EVALUATION CONTACT: David Wilkinson
PROGRAM CONTACT: Selena Cash
FUNDING (LOCAL, STATE OR FEDERAL) : Local
BUDGET ALLOCATION: $175,608
NUMBER OF CAMPUSES WITH PROGRAM: Kealing Junior High
NUMBER OF STAFF: 7 Kealing teachers assigned to magnet
ELIGIBILITY/STUDENTS SERVED: 4.7?7 studentsThe academic qualifications include:1. eigh standards on IT0 st Reading Comprehension
4i1e and Math Total Cie greater than or equal to140;
2. High grades;3. A high interest in science, math, or computer
technology;4. A high score on a hand-written essay to one of
three questions related to contemporary scienceissues;
5. Teacher recommendations are also used tosupport the applicants' qualifications
Ic GRADES SERVED: 7th and 8th
Ic SOURCE OF FILE: Computer file as of January based oncourse number
* SUBJECT AREAS TAUGHT: Science, mathematics, and computers
* PROGRAM FOCUS/GOALS/METHODS: The program provides studentswith educational experiences which stress strong academicdevelopment in basic subject areas. A focus is computers asproductivity tools and the methods of scientific inquiry.Students are given opportunities to develop personal skillsin studying, organizing, communicating, cooperating, and testtaking.
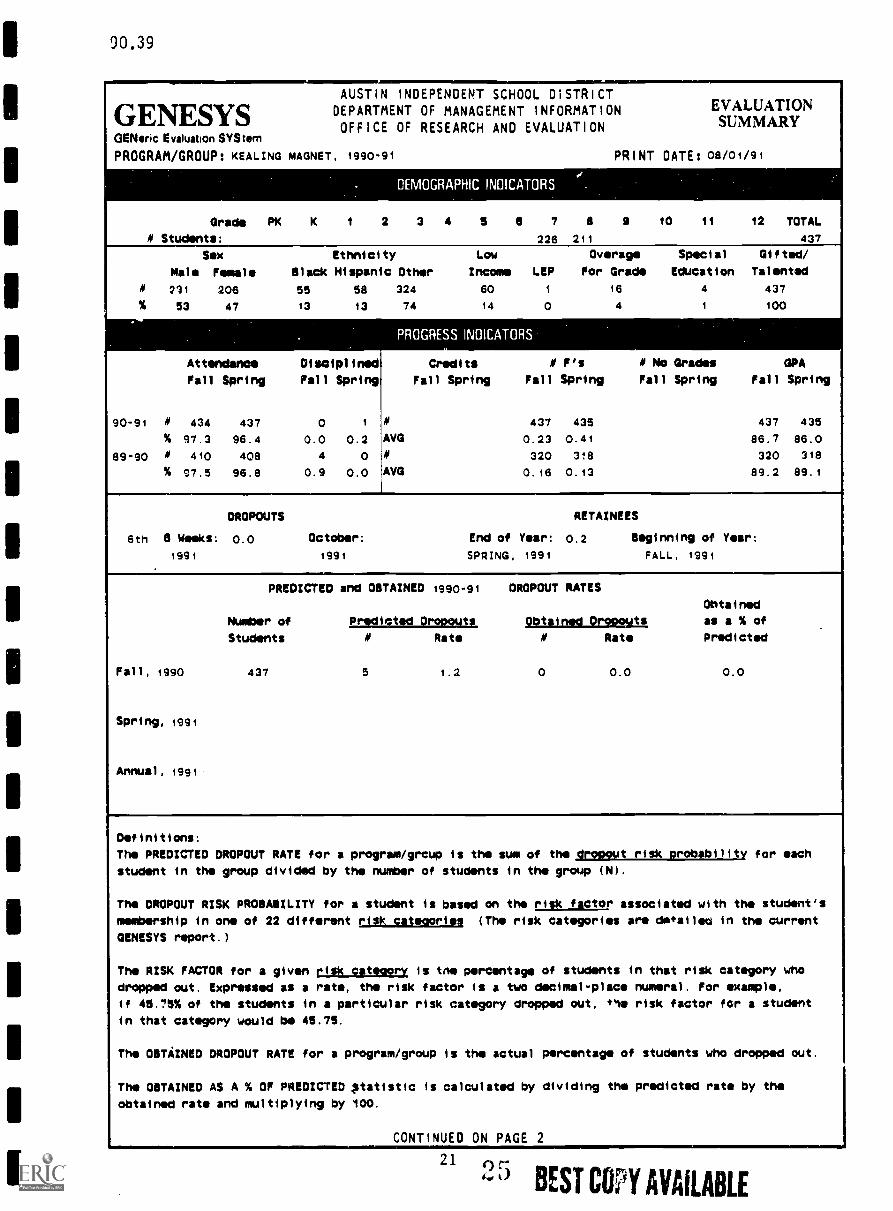
90.39
AUSTIN
GENESYS DEPARTMENTOFFICE
GENoric Evaluation SYStem
PROGRAM/GROUP: KEALING MAGNET, 1990-91
Grade PK K 1
# Students:
INDEPENDENT SCHOOL DISTRICTOF MANAGEMENT INFORMATION ENTMLUATION
OF RESEARCH AND EVALUATION SUMMARY
PRINT DATE:08/01/91
DEMOGRAPHIC INDICATORS
2 3 4 5 6 7 B 9 10 11 12 TOTAL
226 211 437
Sex Ethnicity
Male Female Black Hispanic
# 231 206 55 58
% 53 47 13 13
Attendance Disciplined
Fall Spring Fall Spring
90-91 # 434 437 0 1
% 97.3 96.4 0.0 0.2
89-90 4° 410 408 4 0
% S7.5 96.8 0.9 0.0
Low Overage Special Gifted/
Other Income LEP For Grade Education Talented
324 60 1 16 4 437
74 14 0 4 1 100
PROGRESS INDICATORS
Credits F's No Grades GPA
Fall Spring Fall Spring Fall Spring Fall Spring
# 437 435 437 435
AVG 0.23 0.41 86.7 86.0
# 320 318 320 318
AVG 0.16 0.13 89.2 89.1
DROPOUTS RETAINEES
6th 6 Weeks: 0.0 October: End of Year: 0.2 Beginning of Year:
1991 1991 SPRING, 1991 FALL. 1991
PREDICTED and OBTAINED 1990-91 DROPOUT RATES
Obtained
Number of Predicted Dropout* gklemsLAinwsLti as a % of
Students # Rate # Rate Predicted
Fall, 1990 437 5 1.2 0 0.0 0.0
Spring, 1991
Annual, 1991
Definitions:
The PREDICTED DROPOUT RATE for a program/grcup
student in the group divided by the number
The DROPOUT RISK PROBABILITY for a student
membership in one of 22 diffrent risk
is the sum of the dropout risk probability for each
of students in the group (N).
is based on the EILIK_LIII2r associated with the student's
catevories (The risk categories are diosiled in the current
GENESYS report.)
The RISK FACTOR for a given risk Cateaory is tne percentage of students in that risk category who
dropped out. Expressed as a rate, the risk factor is a two decimal-place numeral. For example,
if 45.75% of the students in a particular risk category dropped out, vlo risk factor for a student
in that category would be 46.75.
The OBTAINED OROPOUT RATE for a program/group is the actual percentage of students who dropped out.
The OBTAINED AS A % OF PREDICTED !tatistic is calculated by dividing the predicted rats by the
obtained rate and multiplying by 100.
CONTINUED ON PAGE 2
21 0BEST COPY AVAILABLE
90,39
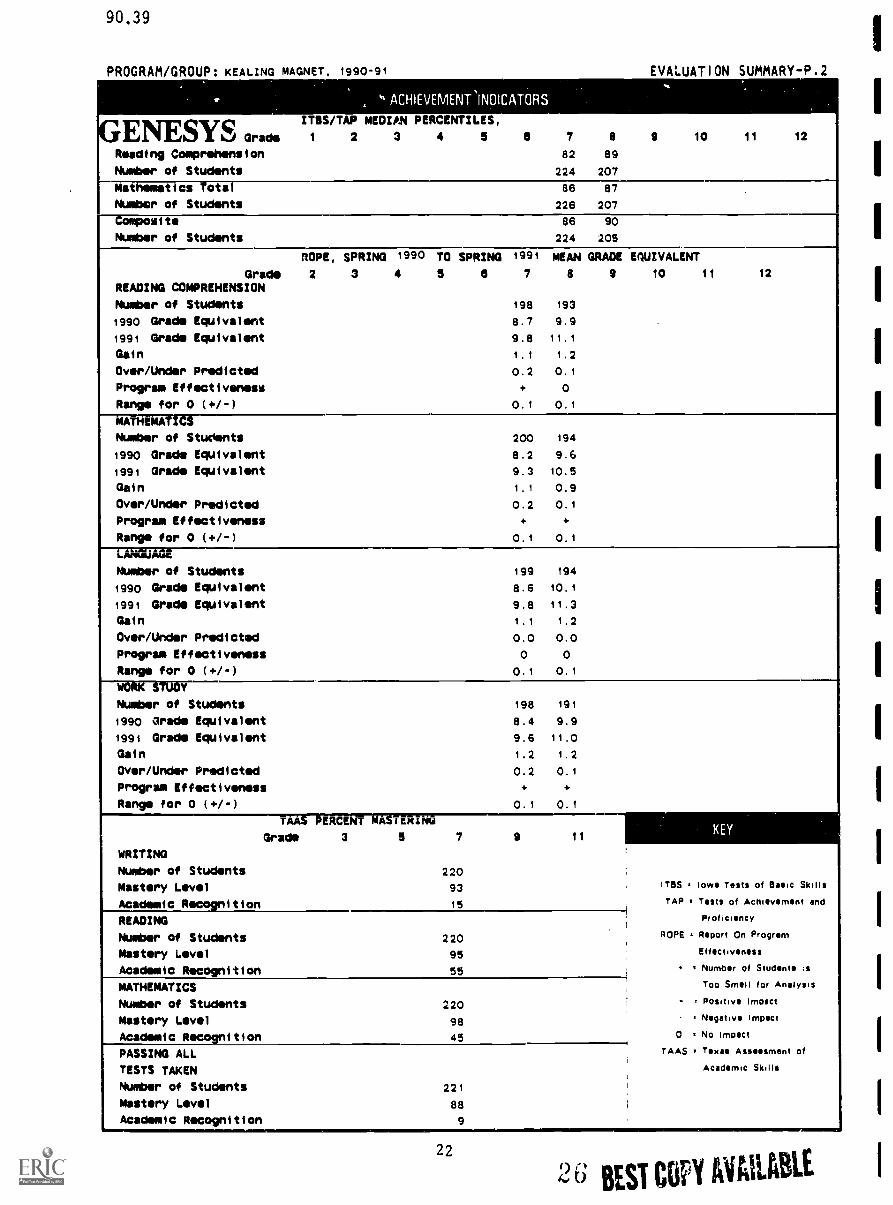
PROGRAM/GROUP: KEALING MAGNET. 1990-91
.. *a ACHIEVEMENT,
INOICATORS
ENESYS Grads
ITieS/TAP MEDIAN PERCENTILES,
2 3 4 5 6
Reading Comprehension
Number of Students
7 a
82 89
224 207
EVALUATION SUMMARY-P.2
,
9 10 11 12
Mathematics fatal 86 87 .
Number of Students 226 207
Composite 86 90
Number of Students 224 205
nOPE, SPRING 1990 TO SPRING 1991 MEAN GRADE EQUIVALENT
Grade 2 3 4 5 6 7 8 9 10 11 12
READING COMPREHENSION
Number of Students 198 193
1990 Grade Equivalent 8.7 9.9
1991 Grade Equivalent 9.8 11.1
Gain 1,1 1.2Over/Under Predicted 0.2 0.1
Program Effectiveness + 0
Range for 0 (+/-) 0.1 0.1
MATHEMATICS
Number of Students 200 194
1990 Grade Equivalent 8.2 9.6
1991 Grade EqUivalent 9.3 10.5
Gain 1.1 0.9
Over/Under Predicted 0.2 0.1
Program Effectiveness + +
Range for 0 (+/-) 0.1 0.1
LANGUAGE
Number of Students 199 194
1990 Grade Equivalent 8.6 10.1
1991 Grade Equivalent 9.8 11.3
Gain 1.1 1.2Over/Under Predicted 0.0 0.0
Program Effectiveness 0 0
Range for 0 (+/-) 0.1 0.1
WORK STUDY
Number of Students 198 191
1990 Grade Equivalent 8.4 9.9
1991 Grade Equivalent 9.6 11.0
Gain 1.2 1.2
Over/Under Predicted 0.2 0.1
Program Effectiveness + +
Range for 0 (+/-) 0.1 0.1
TAAS PERCENT MASTERING
Grade 3 5 7 9 11
WRITING
Number of Students 220
Mastery Level 93 ITEM low. Tests of Basic Skills
Academic Recognition 15-i,
TAP Tests of Achievement and
READING1
Proficiency
Number of Students 220 ROPE Report On Program
Mastery Level 95 Effectiveness
Academic Recognition 55 Number of Students ;s
MATHEMATICS Too Smell for Analysis
Number of Students 220 . Positive Impact
Mastery Level 98 . Negative Impact
Academic Recognition 45i
0 No Impact
PASSING ALL T.44s . Texas Assessment of
TESTS TAKEN Academic Skills
Number of Students 221 1
Mastery Level 88
Academic Recognition 9.
22
26 BEST COPY Marla I
9 0 . 3 9
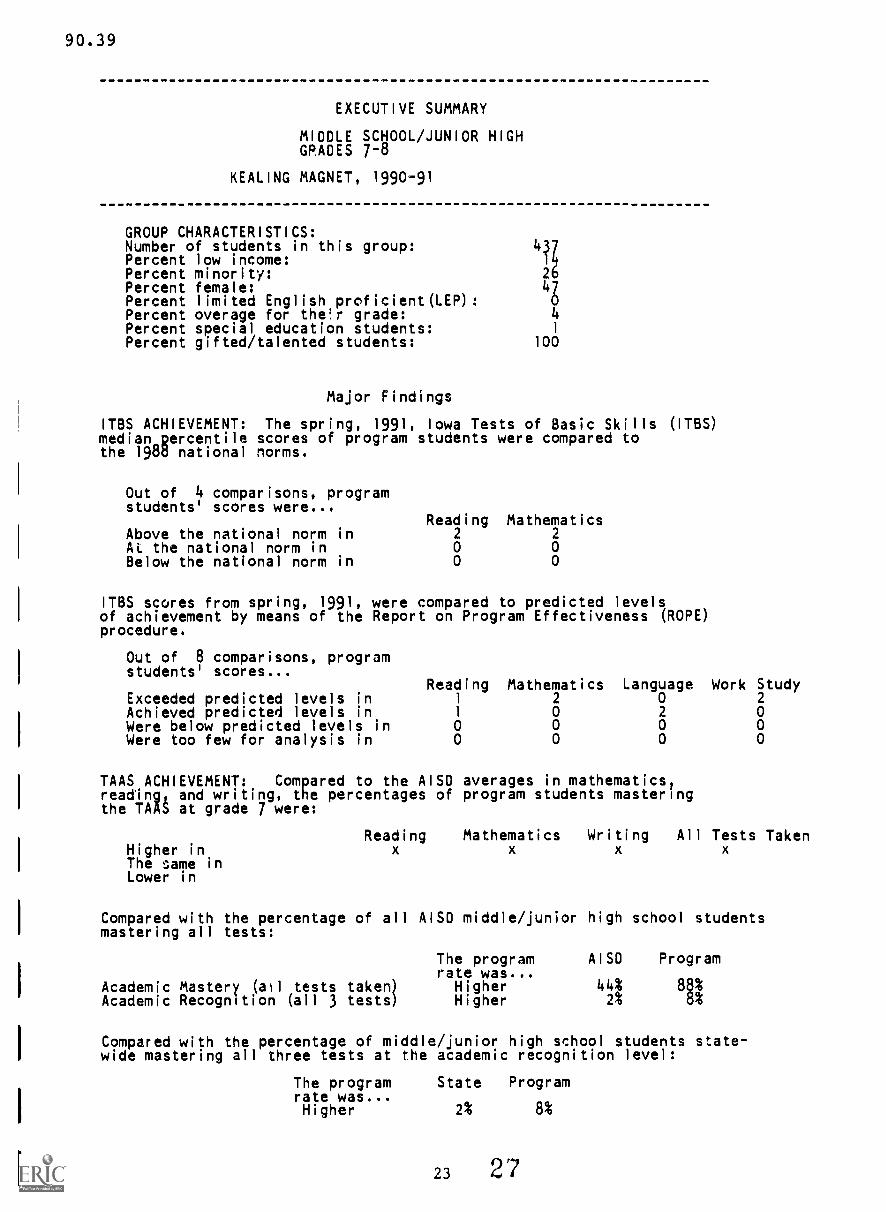
EXECUTIVE SUMMARY
MIDDLE SCHOOL/JUNIOR HIGHGRADES 7-8
KEALING MAGNET, 1990-91
GROUP CHARACTERISTICS:Number of students in this group: LiZPercent low income:Percent minority: 26Percent female:Percent limited English proficient(LEP):
4g
Percent overage for ther grade: 4Percent special education students: 1
Percent gifted/talented students: 100
Major Findings
ITBS ACHIEVEMENT: The spring, 1991, Iowa Tests of Basic Skills (ITBS)median gercentile scores of program students were compared tothe 198d national norms.
Out of 4 comparisons, programstudents' scores were...
Reading MathematicsAbove the national norm in 2 2
Al the national norm in 0 0Below the national norm in 0 0
ITBS scores from spring, 1991, were compared to predicted levelsof achievement by means of the Report on Program Effectiveness (ROPE)procedure.
Out of 8 comparisons, programstudents' scores...
Reading Mathematics Language Work StudyExceeded predicted levels in 1 2 0 2
Achieved predicted levels in 1 0 2 0Were below predicted levels in 0 0 0 0Were too few for analysis in 0 0 0 0
TAAS ACHIEVEMENT: Compared to the AISD averages in mathematics,reading, and writing, the percentages of program students masteringthe TAAS at grade 7 were:
Reading Mathematics Writing All Tests TakenHigher inThe same inLower in
Compared with the percentage of all AISD middle/junior high school studentsmastering all tests:
The program AISD Programrate was...
Academic Mastery (ail tests taken) Higher 44%Academic Recognition (all 3 tests) Higher 2% d%
Compared with the percentage of middle/junior high school students state-wide mastering all three tests at the academic recognition level:
The program State Programrate was...Higher 2% 8%

90.39
ATTENDANCE: Compared with the attendance rates for middle school/juniorhigh districtwide:
Fall, 1990Spring, 1991
Compared to...
Progrgm studentsin 1989-90
The programrate was...HigherHigher
AISD Program
31:d1990-91 program attendance was...
Fall: LowerSpring: Lower
DISCIPLINE: Compared with the percentages of students involved in disciplineincidents at the middle school/junior high level districtwide:
The program AISO Programrate was...
Fall, 1990 LowerSpring, 1991 Lower glt SICompared to... 1990-91 program discipline was...
Progrgm students Fall: Lowerin 19d9-90 Spring: Higher
GRADES: Compared with the GPA's for all AISO middle school/juniorhigh students:
Fall, 1990Spring, 1991
Compared to...
Progrgm studentsin 19d9-90
The programrate was...HigherHigher
AISO Program
10 12:Z
1990-91 program GPA was...
Fall: LowerSpring: Lower
RETAINEES/DROPOUTS: Comparing the percentage of program studentsrecommended in spring, 1991, for retention the following year withall AISO middle school/jurjor high students:
The programrate was...
Lower
AISD Program
3.7% 0.2%
Compared to the sixth six weeks dropout rate for middle school/junior high studentsfor 1990-91:
The program AISO Programrate was...
Lower 3.14 0.0%
Compared with the percentage of program students predicted to drop out:
The obtained Predicted Obtainedrate was...
Lower 1.2% 0.0%
As a percentage of the dropout rate predicted for these students:
The program rate was... Meaning that...Less than 100; The program did better
than anticipated
File name:GE@KEAL
24
90.39
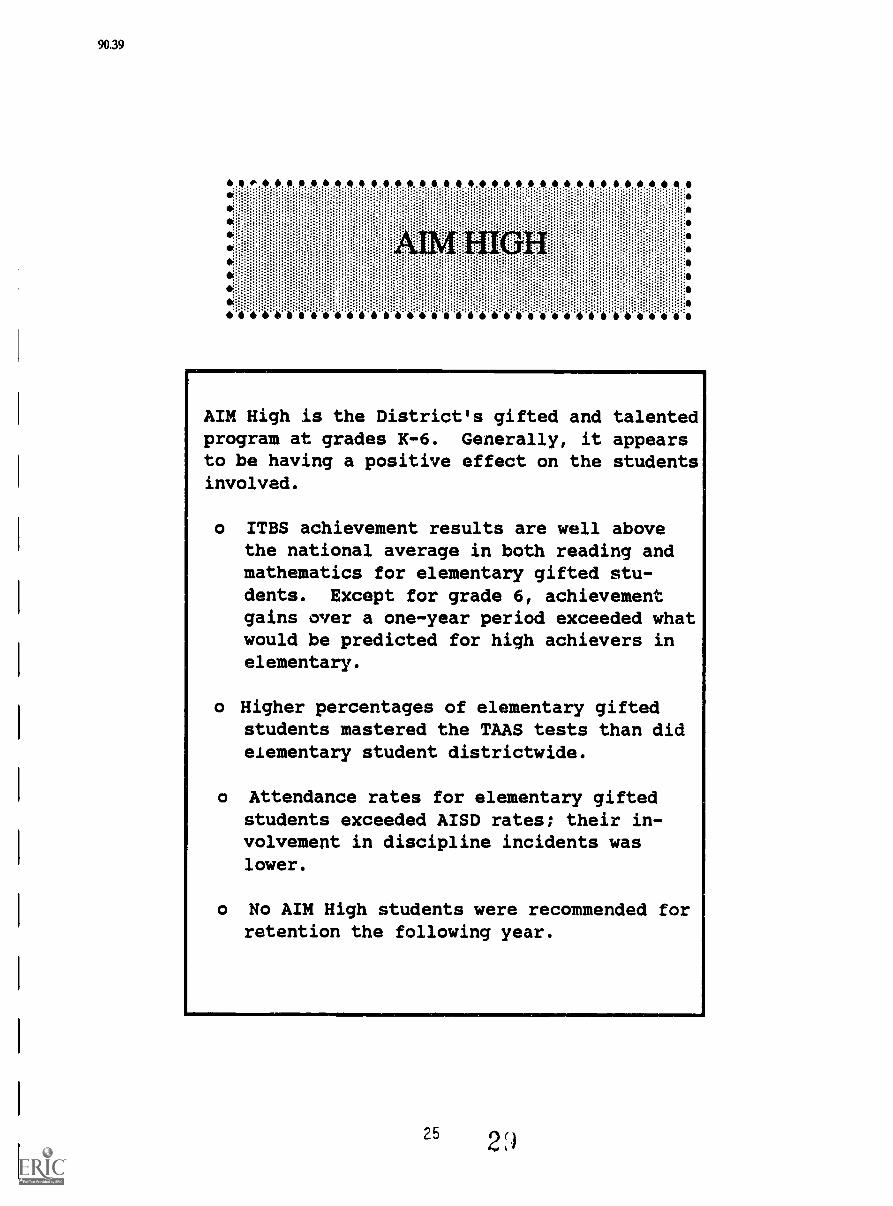
AIM High is the District's gifted and talentedprogram at grades K-6. Generally, it appearsto be having a positive effect on the studentsinvolved.
o ITBS achievement results are well abovethe national average in both reading andmathematics for elementary gifted stu-dents. Except for grade 6, achievementgains over a one-year period exceeded whatwould be predicted for high achievers inelementary.
o Higher percentages of elementary giftedstudents mastered the TAAS tests than didelementary student districtwide.
o Attendance rates for elementary giftedstudents exceeded AISD rates; their in-volvement in discipline incidents waslower.
o No AIM High students were recommended forretention the following year.
90.39GENESYS PROGRAM DESCRIPTION
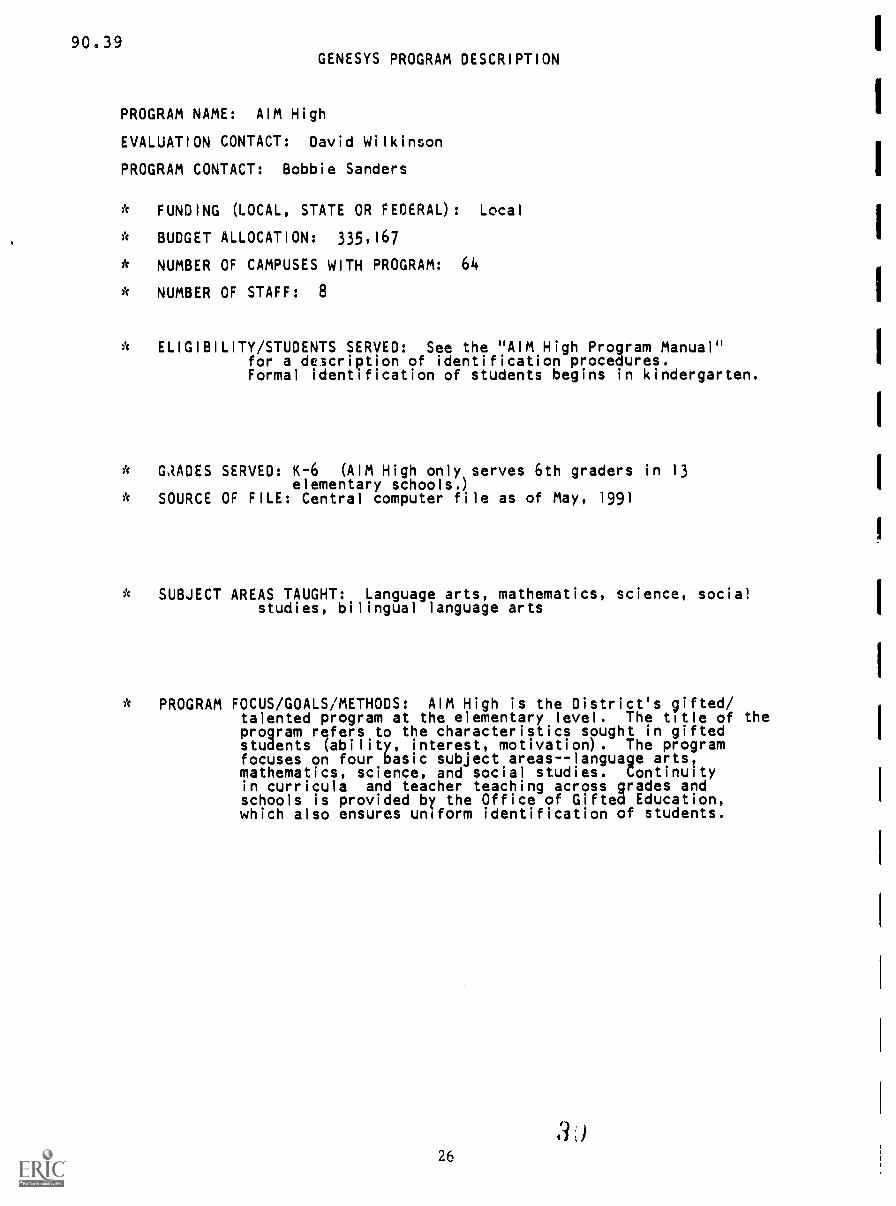
PROGRAM NAME: AIM High
EVALUATION CONTACT: David Wilkinson
PROGRAM CONTACT: Bobbie Sanders
* FUNDING (LOCAL, STATE OR FEDERAL) : Local
* BUDGET ALLOCATION: 335,167
* NUMBER OF CAMPUSES WITH PROGRAM: 64
* NUMBER OF STAFF: 8
* ELIGIBILITY/STUDENTS SERVED: See the "AIM High Program Manual"for a description of identification procedures.Formal identification of students begins in kindergarten.
* GRADES SERVED: K-6 (AIM High only serves 6th graders in 13elementary schools.)
* SOURCE OF FILE: Central computer file as of May, 1991
* SUBJECT AREAS TAUGHT: Language arts, mathematics, science, socialstudies, bilingual language arts
* PROGRAM FOCUS/GOALS/METHODS: AIM High is the District's gifted/talented program at the elementary level. The title of theprogram refers to the characteristics sought in giftedstudents (ability, interest, motivation) . The programfocuses on four basic subject areas--language artstmathematics, science, and social studies. Continuityin curricula and teacher teaching across grades andschools is provided by the Office of Gifted Education,which also ensures uniform identification of students.
26
90.39
AUSTIN INDEPENDENT SCHOOL DISTRICT
GErsTESYS DEPARTMENT OF MANAGEMENT INFORMATION EVALUATIONOFFICE OF RESEARCH AND EVALUATION SUMMARY
GENeric Evaluation SYStem
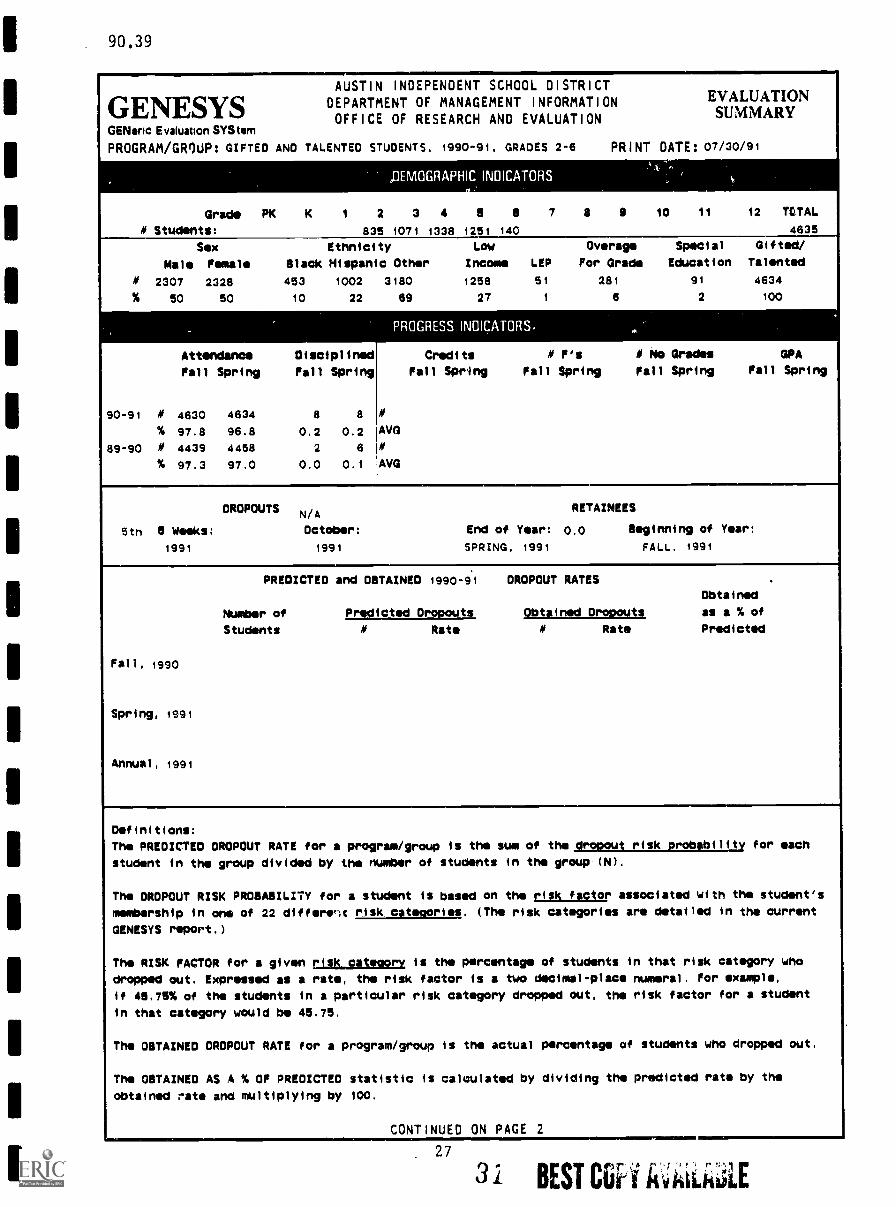
PROGRAM/GROUP: GIFTED AND TALENTED STUDENTS, 1990-91, GRADES 2-6 PRINT DATE: 07/30/9 i
,UMOGRAPHIC INOICATORS. ,
Grade PK K 1 2 3 4 5 8 7 8 0 10 11 12 TCTAL
M Students: 835 1071 1338 1251 140 4635
Sx Ethnicity LOW Overage Special Gifted/
Male Female Black Hispanic Other Income LEP For Grade Education Talented
M 2307 2328 453 1002 3180 1258 51 281 91 4634
% 50 50 10 22 89 27 1 6 2 100
PROGRESS INGICATORS., .
Attendance Disciplined
Fall Spring Fall Spring
90-91 M 4630 4634 8 a
% 97.8 96.8 0.2 0.2
89-90 M 4439 4458 2 6
% 97.3 97.0 0.0 0.1
Credits M F's M No Grades GPA
Fall Spring Fall Spring Fall Spring Fall Spring
#
AVG
M
AVG
DROPOUTS N/ARETAINEES
5th a Weeks: October: End of Yar: 0.0 Beginning of Year:
1991 1991 SPRING, 1991 FALL. 1991
PREDICTED and OBTAINED 1990-91 DROPOUT RATES .
Obtained
Number of Predicted Dropouts Obtained Dropouts as a % of
Students M Rate M Rat Predicted
Fall, 1990
Spring, 1991
Annual, 1991
Definitions:
The PREDICTED DROPOUT RATE for a program/group
student in the group divided by the number
The DROPOUT RISK PROBABILITY for a student
membership in one of 22 difforylc risk
is the sum of the Ilmout risk probability for ach
of students in the group (N).
is based on tho risk factor associated with the student's
categories. (The risk categories are detailed in the current
GENESYS report.)
The RISK FACTOR for a given risk cateoorv is the percentage of students in that risk category who
dropped out. Expressed as a rate, the risk factor is a two decimal-place numeral. For xample.
if 48.75% of the students in a particular risk category dropped out, the risk factor for a student
in that category would be 45.75.
The OBTAINED DROPOUT RATE for a program/group is the actual percentage of students who dropped out.
The OBTAINED AS A % OF PREDICTED statistic is calculated by dividing the predicted rate by the
obtained rate and multiplying by 100.
CONTINUED ON PAGE 2
27
3 i BEST a iatijLE
90.39
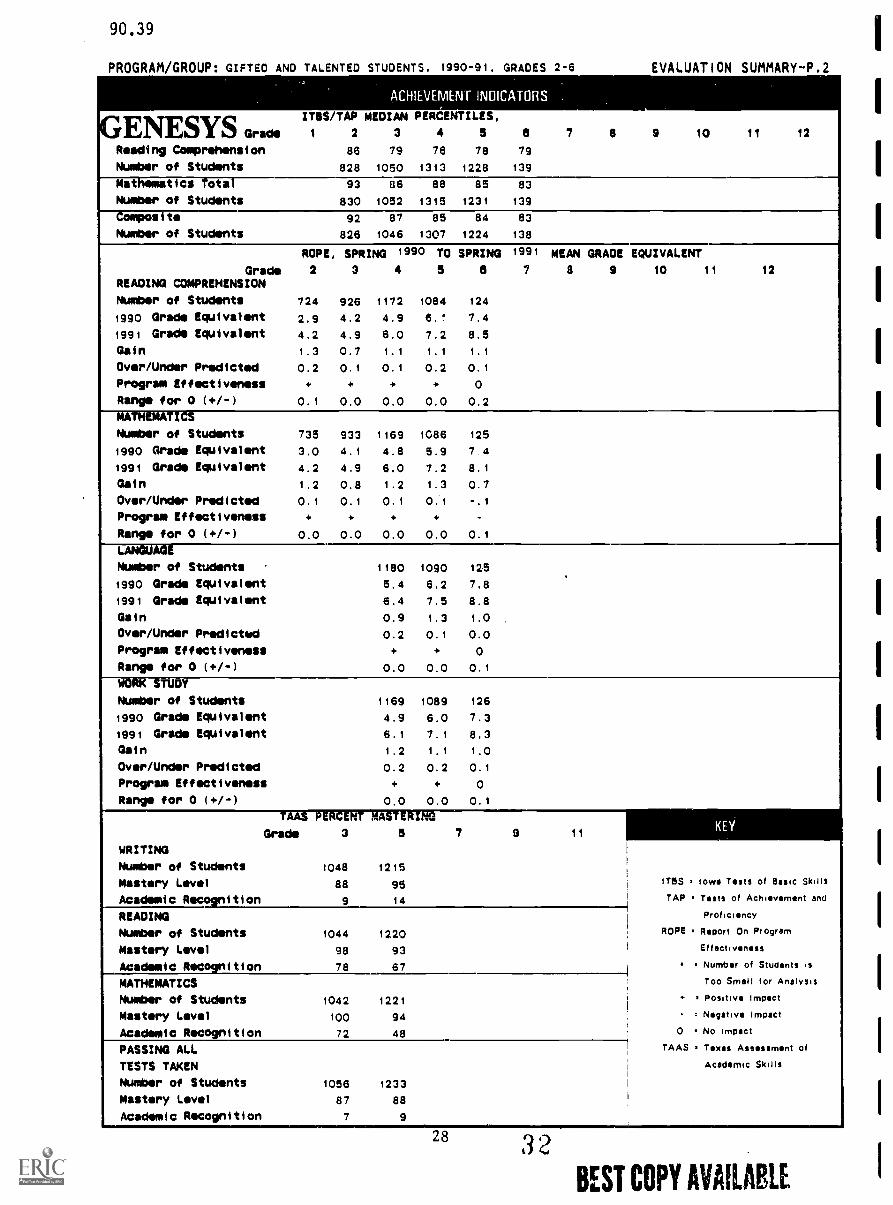
PROGRAM/GROUP: GIFTED AND TALENTED STUDENTS. 1990-91. GRADES 2-6 EVALUATION SUMMARY-P.2-
ACHIEVEMENT INOICATORS .
GENESILTS Grade
ITIIIS/TAP MEDIAN PERCENTILES,
2 3 4 5 a 7 a 9 10 11 12
Reading Comprehension 86 79 76 78 79
Number of Students 828 1050 1313 1228 139
Mat t es Tote 93 86 88 85 83
Number of Students 830 1052 1315 1231 139
Composite 92 87 85 84 83
Number of Students 826 1046 1307 1224 138
ROPE, SPRING 1990 TO SPRING 1991 MEAN GRADE EQUIVALENT
Grade 2 3 4 5 e 7 a 9 10 11 12
READING COMPREHENSION
Number of Students 724 926 1172 1084 124
1980 Grade Equivalent 2.9 4.2 4.9 6. 7.4
1991 Grade Equivalent 4.2 4.9 6.0 7.2 8.5
Gain 1.3 0.7 1.1 1.1 1.1
Over/Under Predicted 0.2 0.1 0.1 0.2 0.1
Program Effectiveness + + + + 0
Range for 0 (+/-) 0.1 0.0 0.0 0.0 0.2
MATHEMATICS
Number of Students 735 933 1169 1086 125
1990 Grade Equivalent 3.0 4.1 4.8 5.9 7 4
1891 Grade Equivalent 4.2 4.9 6.0 7.2 8.1
Gain 1.2 0.8 1.2 1.3 0.7
Over/Under Predicted 0.1 0.1 0.1 0.1 -.1
Program Effectiveness + + + + -
Range for 0 (+1 -) 0.0 0.0 0.0 0.0 0.1
LANQUAGg
Number of Students 1180 1090 125
1990 Grade Equivalent 5.4 6.2 7.8
1991 Grade Equivalent 6.4 7.5 8.8
Gain 0.9 1.3 1.0
Over/Under Predicted 0.2 0.1 0.0
Program Effectiveness + + 0
Range for 0 (+/-) 0.0 0.0 0.1
, T TUDY
Number of Students 1169 1089 126
1990 Grade Equivalent 4.9 6.0 7.3
1991 Grade Equivalent 6.1 7.1 8.3
Gain 1.2 1.1 1.0
Over/Under Predicted 0.2 0.2 0.1
Program Effectiveness + + 0
Range for 0 (+/-) 0.0 0.0 0.1
. -
Grade 3 5 7 9 11KEY
WRITING
Number of Students 1048 1215
Mastery Level 88 95 ITSS . lows Tests of Bsic Skills
Academic Recognition 9 14 TAP Tests of Achievement and
READING Proficiency
Number of Students 1044 1220 ROPE Report On Program
Mastery Level 98 93 Effectiveness
Academic Recognition 78 67 Number of Students is
MATHEMATICS Too Small for Analysis
Number of Students 1042 1221 . Positive Impact
Mastery Level 100 94 Negative Impact
Academic Recognition 72 48 0 No impct
PASSING ALL1
TAAS Texas A mint of
TESTS TAKEN Acadenme Skills
Number of Students 1056 12331
Mastery Level 87 88I
I
Academic Recognition 7 9
283 2
BEST COPY AVAILABLE
90.39
EXECUTIVE SUMMARY
ELEMENTARYGRADES 2-6
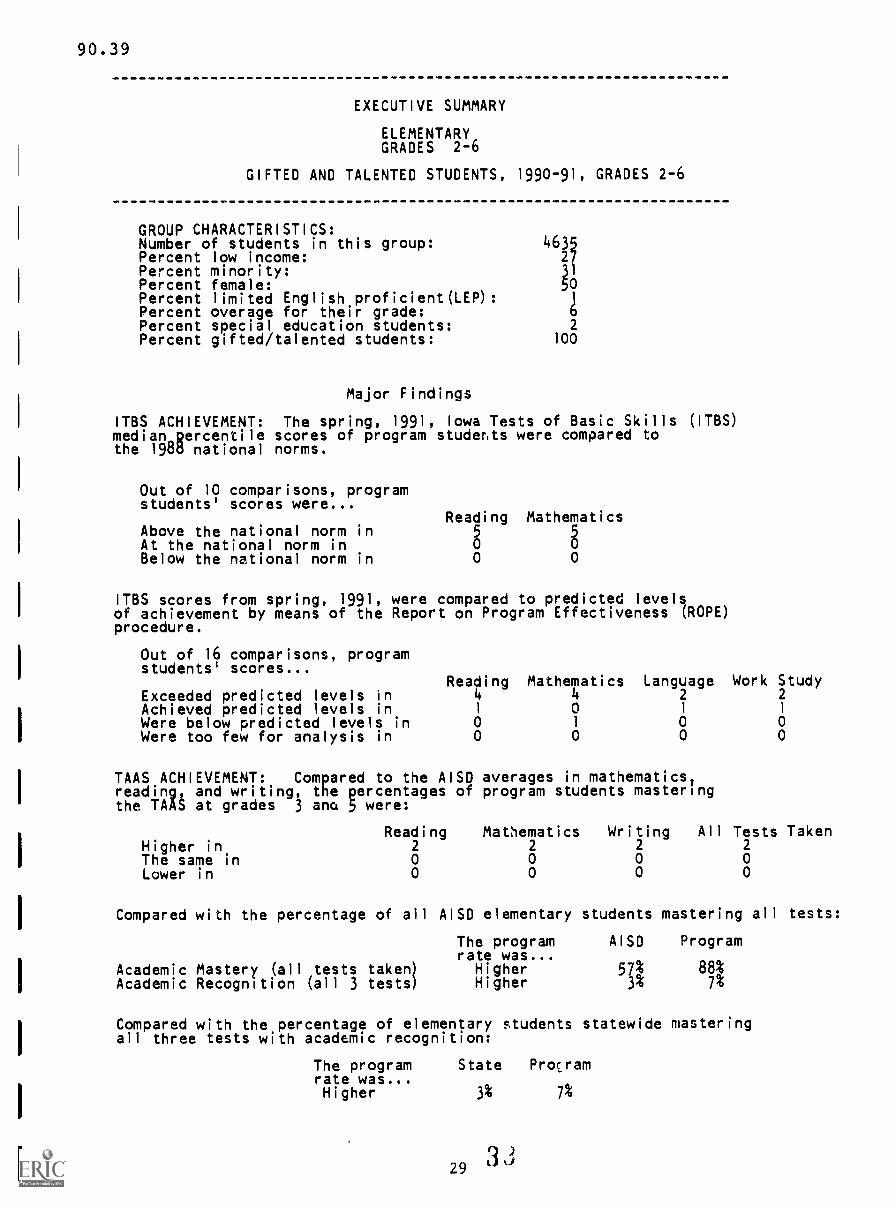
GIFTED AND TALENTED STUDENTS, 1990-91, GRADES 2-6
GROUP CHARACTERISTICS:Number of students in this group: 4635Percent low income: 27Percent minority:
ilPercent female: 0Percent limited English proficient(LEP) : 1
Percent overage for their grade: 6Percent special education students: 2
Percent gifted/talented students: 100
Major Findings
ITBS ACHIEVEMENT: The spring, 1991, Iowa Tests of Basic Skills (ITBS)median percentile scores of program students were compared tothe 198d national norms.
Out of 10 comparisons, programstudents' scores were...
Reading MathematicsAbove the national norm in 5 5At the national norm in 0 0Below the national norm in 0 0
ITBS scores from spring, 1991, were compared to predicted levelsof achievement by means of the Report on Program Effectiveness (ROPE)procedure.
Out of 16 comparisons, programstudents' scores...
Reading Mathematics Language Work StudyExceeded predicted levels in 4 4 2 2
Achieved predicted levels in 1 0 1 1
Were below predicted levels in 0 1 0 0Were too few for analysis in 0 0 0 0
TAAS ACHIEVEMENT: Compared to the AISD averages in mathematics,reading, and writing, the percentages of program students masteringthe TAAS at grades 3 ana 5 were:
Reading Mathematics Writing All Tests TakenHigher in 2 2 2 2
The same in 0 0 0 0Lower in 0 0 0 0
Compared with the percentage of all AISD elementary students mastering all tests:
The program AISD Programrate was...
Academic Mastery (all tests taken) Higher 571 88%Academic Recognition (all 3 tests) Higher 7%
Compared with the percentage of elementary students statewide masteringall three tests with academic recognition:
The program State Procramrate was...Higher 3% 7%
90.39
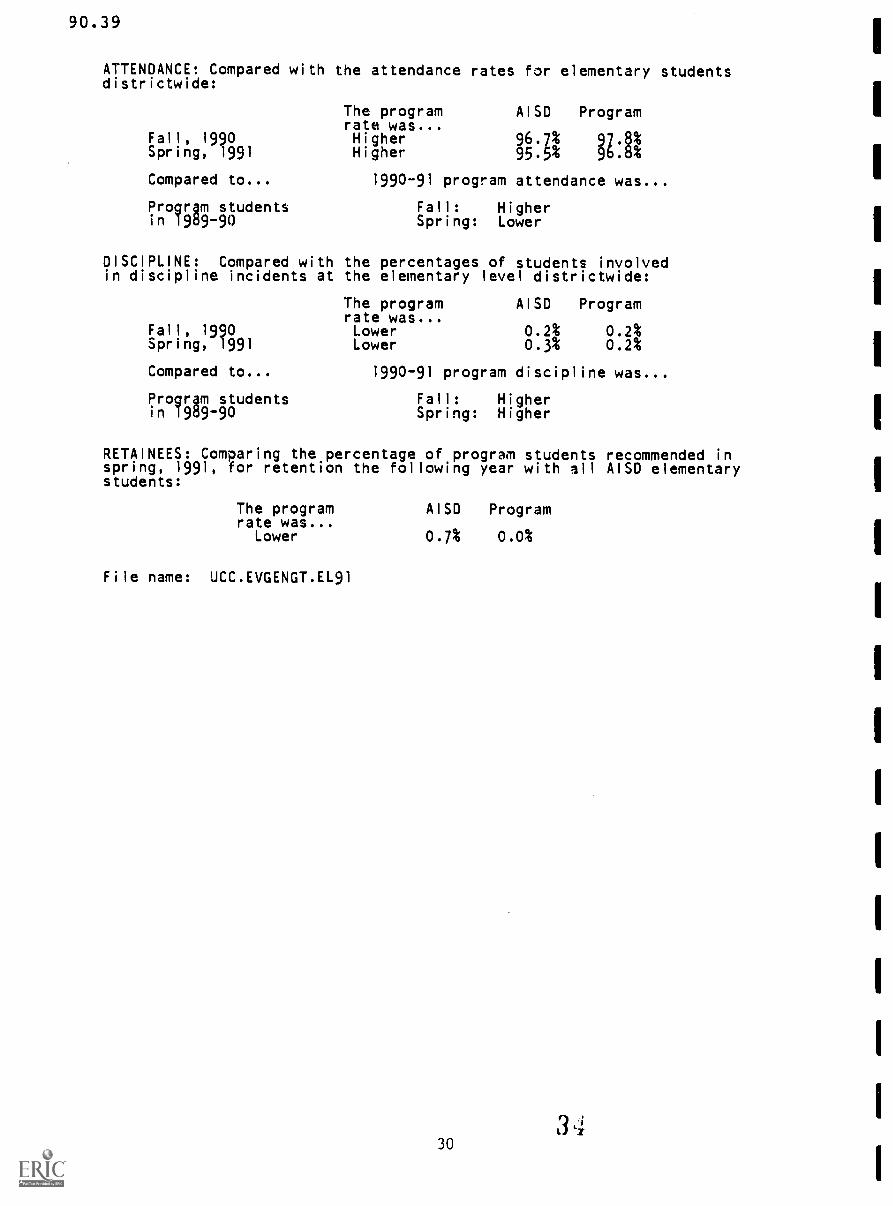
ATTENDANCE: Compared with the attendance rates for elementary studentsdistrictwide:
Fall, 1990Spring, 1991
Compared to...
Program studentsin 1989-90
The programrate was...HigherHigher
A1SD Program
31:1I1990-91 program attendance was...
Fall: HigherSpring: Lower
DISCIPLINE: Compared with the percentages of students involvedin discipline incidents at the elementary level districtwide:
The program AISD Programrate was...
Fall, 1990 Lower 0.2% 0.2%Spring, 1991 Lower 0.3% 0.2%
Compared to... 1990-91 program discipline was...
Program students Fall: Higherin 1989-90 Spring: Higher
RETAINEES: Comparing the percentage of program students recommended inspring, 1991, for retention the following year with all AISD elementarystudents:
The program AISD Programrate was...
Lower 0.7% 0.0%
File name: UCC.EVGENGT.EL91
90.39
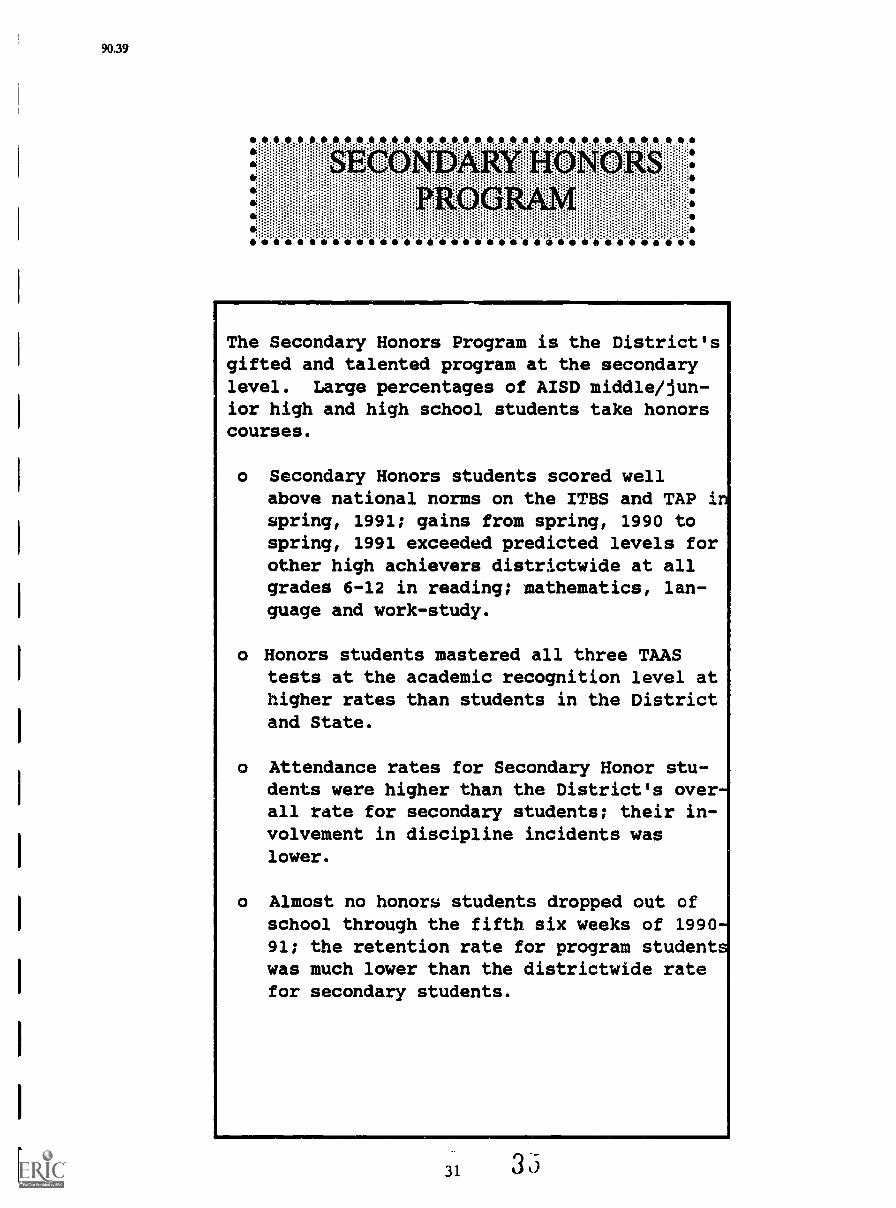
The Secondary Honors Program is the District'sgifted and talented program at the secondarylevel. Large percentages of AISD middle/jun-ior high and high school students take honorscourses.
o Secondary Honors students scored wellabove national norms on the ITBS and TAP inspring, 1991; gains from spring, 1990 tospring, 1991 exceeded predicted levels forother high achievers districtwide at allgrades 6-12 in reading; mathematics, lan-guage and work-study.
o Honors students mastered all three TAAStests at the academic recognition level athigher rates than students in the Districtand State.
o Attendance rates for Secondary Honor stu-dents were higher than the District's over-all rate for secondary students; their in-volvement in discipline incidents waslower.
o Almost no honors students dropped out ofschool through the fifth six weeks of 1990-91; the retention rate for program studentswas much lower than the districtwide ratefor secondary students.
31 3 5

90.39
GENESYS PROGRAM DESCRIPTION
PROGRAM NAME: Secondary Honors Program
EVALUATION CONTACT: David Wilkinson
PROGRAM CONTACT: Al Suttles
* FUNDING (LOCAL, STATE OR FEDERAL) : Local
* BUDGET ALLOCATION: The Honors Program is supported throughinstructional support lines in the budget.
* NUMBER OF CAMPUSES WITH PROGRAM: 23
* NUMBER OF STAFF: 1 central administrator, instructionalcoordinators, and regular campus staff assigned
* ELIGIBILITY/STUDENTS SERVED: Students in middle/junior highor high school taking one or more honors courses
* GRADES SERVED: 6-12
* SOURCE OF FILE: Students Grade Reporting (SGR) file as of May, 1991
* SUBJECT AREAS TAUGHT: Inglish/language arts, science, mathematics,and social studies; computer science and foreign language at highschool only
* PROGRAM FOCUS/GOALS/METHODS: A student in an honors course with:Function at higher skill levelsAnalyze more complex data to solve problemsCover material in greater depthRead at a higher level of comprehensionWrite with more independent self-initiated learningPlace emphasis on the quality of learning activitiesrather than the quantity
32

90.39
AUSTIN INDEPENDENT SCHOOL DISTRICT
GENESYS DEPARTMENT OF MANAGEMENT INFORMATION EVALUATION
OFFICE OF RESEARCH ANO EVALUATION SUMMARYGENencEvMuatonSYSteir
PROGRAM/GROUP: GIFTED AND TALENTED STUDENTS, 1990-91, GRADES 8-8 PRINT DATE: 08/02/91
.0EMOGRAPHIC INDICATORS
Grade PK K 1 2 3 4 5 8 7 8 9 10 11 12 TOTAL
M Students: 1004 1405 1405 3837
Sex Ethnicity Low Overage Special Gifted/
Male Female Black Hispanic Other Income LEP For Grade Education Talented
M 1780 2057 438 664 2737 687 15 188 30 3837
% 46 54 11 17 71 18 0 5 I loo
f PROGRESS INDICATORS.
Attendance Disciplined
Fall Spring Fall Spring
90-91 # 3821 3837 37 58
% 97.1 95.7 1.0 1.5
89-90 # 3503 3528 25 24
5 97.3 96.7 0.7 0.6
Credits 8 F's 8 No Grades OPA
Fall Spring Fall Spring Fall Spring Fall Spring
M 3811 3785 3811 3785
AVG 0.11 0.19 89.5 89.0
M 2366 2359 2366 2360
AVG 0.07 0.08 90.1 89.8
DROPOUTS RETAINEES
6th 8 Weeks: 0.2 October: End of Year: 0.4 rNainning of Year:
1991 1991 SPRING. 1991 FALL. 1991
PREDICTED and .OBTAINED 1990-91 DROPOUT RATESObtained
Number of Predicted Drocout9. Obtained Drocouts as a % of
Students M Rate M Rate Predicted
Fall, 1990 2833 34 1.2 0 0.0 0.0
Spring, 1991
Annual, 1991
Definitions:
The PREDICTED DROPOUT RATE for a program/group
student in the group divided by the number
The OROPOUT RISK PROBABILITY for a student
membership in one of 22 different risk
is the sum of the Arg2gml_s_siatril for each
of students in the group (N).
is based on the risk factor associated with the student,s
categories. (The risk categories are detailed in the current
GENESYS report.)
The RISK FACTOR for a given risk cateaory is the percentage of students in that risk category who
dropped out. Expressed as a rate, the risk factor is a two decimal-place numeral. For example,
if 45.75% of the students in a particular risk category dropped out, the risk factor for a student
in that category would be 45.75.
The OBTAINED DROPOUT RATE for a program/group is the actual percentage of students who dropped out.
The OBTAINED AS A % OF PREDICTED statistic is calculated by dividing the pogdicted rate by the
obtained rats and multiplying by 100.
CONTINUED ON PAGE 2
33 37BEST COPY AVAILABLE
90.39
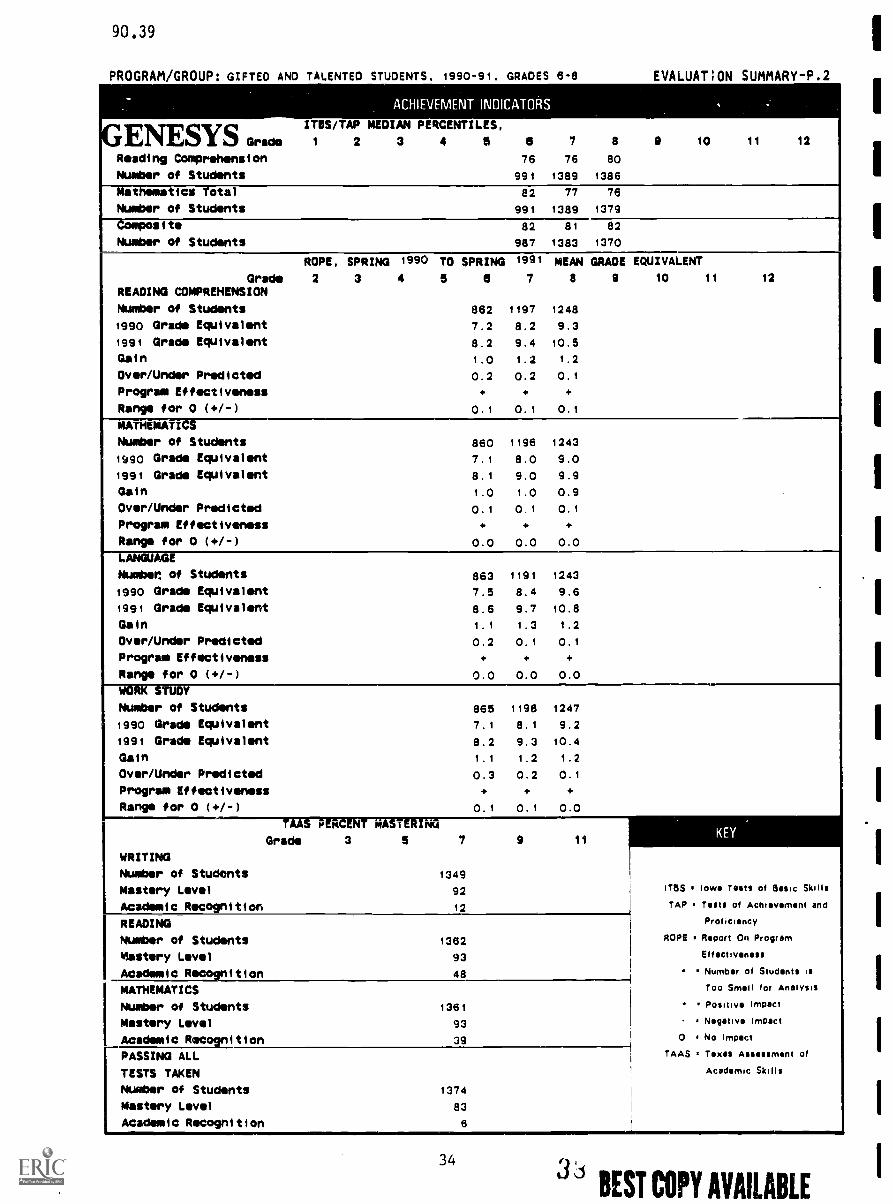
PROGRAM/GROUP: GIFTED AND TALENTED STUDENTS. 1990-91. GRADES
.
ACHIEVEMENT INDICATORS
ENESYS Grade
ITIE1S/TAP MEDIAN PERCENTILES,
2 3 4 5 eReading Comprehension 76
Number of Students 991
6-8 EVALUATiON SUMMARY-P.2
7 8 9 10 11 12
76 80
1389 1386
Mathematics Total 82 77 76
Number of Students 991 1389 1379
- -.site 82 81 82
Number of Students 987 1383 1370
ROPE, SPRING 1990 TO SPRING 1991 MEAN GRADE EQUIVALENT
Grade 2 3 4 5 a 7 8 9 10 11 12
READING COMPREHENSION
Number of Students 862 1197 1248
1990 Grade Equivalent 7.2 8.2 9.3
1991 Grade EqUivalent 8.2 9.4 10.5
Gain 1.0 1.2 1.2
Over/Under Predicted 0.2 0.2 0.1
Program Effectiveness + + +
Range for 0 (41-) 0.1 0.1 0.1
MATHEMATiCS
Nurber of Students 860 1196 1243
1990 Grade Equivalent 7.1 8.0 9.0
1991 Grade Equivalent 8.1 9.0 9.9
Gain 1.0 1.0 0.9
Over/Under Predicted 0.1 0.1 0.1
Program Effectiveness + + +
Range for 0 (41-) 0.0 0.0 0.0
ANGU rE
Numben of Students 863 1191 1243
1990 Grade Equivalent 7.5 8.4 9.6
1991 Grade Equivalent 8.6 9.7 10.8
Gain 1.1 1.3 1.2
Over/Under Predicted 0.2 0.1 0.1
Program Effectiveness + + +
Range for 0 (41-) 0.0 0.0 0.0
-0E-STUOV--------Number of Students 865 1198 1247
1990 Grade Equivalent 7.1 8.1 9.2
1991 Grade Equivalent 8.2 9.3 10.4
Gain 1.1 1.2 1.2
Over/Under Predicted 0.3 0.2 0.1
Program Effectiveness + + +
Range for 0 (41-) 0.1 0.1 0.0
PERCENT MASTERING
Grade 3 5 7 a 1 iWRITING
Number of Students 1349
Mastery Level 92 1185 Iowa Tests of Basic Skills
Academic Recognition 12 TAP Tests of Achievement and
READING Proficiency
Number of Students 1362 ROPE Report On Program
Mastery Level 93 Effectiveness
Academic Recognition 48 Number of Students is
MATHEMATICS Too Smell for Analysis
Number of Students 1361 Positive Impact
Mastery Level
I
93 Negative Impact
Academic Recognition 39 0 No Impact
PASSING ALL TAAS Texas Assessment of
TESTS TAKEN Academic Skills
Number of Students 1374
Mastery Level 83
Academic Recognition 6
34
BEST COPY AVAILABLE
90 .39
EXECUTIVE SUMMARY
MIDDLE $CHOOL/JUNIOR HIGHGRADE': 6-8
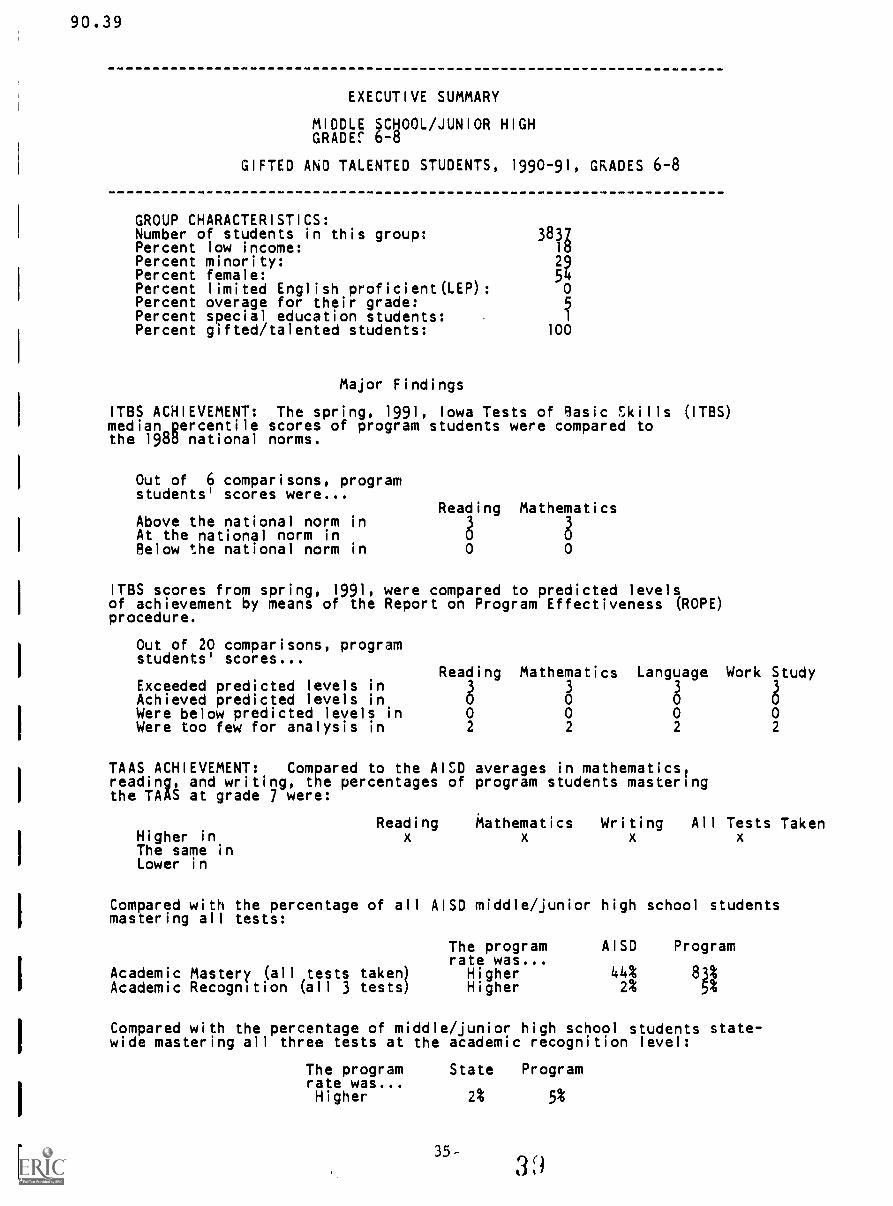
GIFTED ANO TALENTED STUDENTS, 1990-91, GRADES 6-8
GROUP CHARACTERISTICS:Number of students in this group: 38NPercent low income:Percent minority:Percent female:Percent limited English proficient(LEP): 0Percent overage for their grade:Percent special education students:Percent gifted/talented students: 100
Major Findings
ITBS ACHIEVEMENT: The spring, 1991, Iowa Tests of Basic Skills (ITBS)median percentile scores of program students were compared tothe 198d national norms.
Out of 6 comparisons, programstudents' scores were...
Above the national norm inAt the national norm inBelow the national norm in
Reading Mathematics
ITBS scores from spring, 1991, were compared to predicted levelsof achievement by means of the Report on Program Effectiveness (ROPE)procedure.
Out of 20 comparisons, programstudents' scores...
Exceeded predicted levels inAchieved predicted levels inWere below predicted levels inWere too few for analysis in
Reading Mathematics Language Work Study
830 8 8
0 0 0 02 2 2 2
TAAS ACHIEVEMENT: Compared to the AISD averages in mathematics,reading, and writing, the percentages of program students masteringthe TAAS at grade 7 were:
ReadingHigher inThe same inLower in
kathematics Writing All Tests Taken
Compared with the percentage of all AISD middle/junior high school studentsmastering all tests:
Academic Mastery (all tests taken)Academic Recognition (all 3 tests)
The programrate was...
HigherHigher
AISD
44%2%
Program
83%5%
Compared with the percentage of middle/junior high school students state-wide mastering all three tests at the academic recognition level:
The program State Programrate was...Higher 2% 5%
35-
90.39
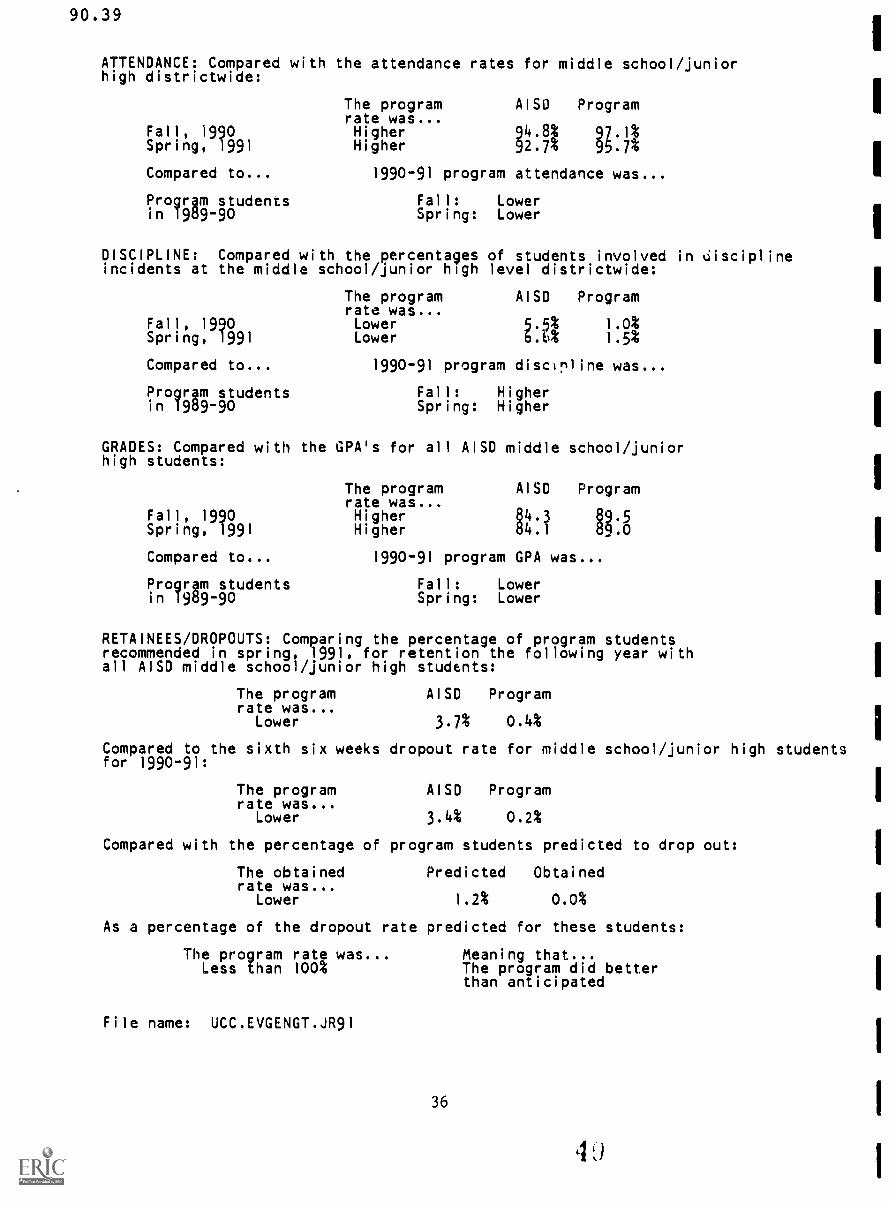
ATTENDANCE: Compared with the attendance rates for middle school/juniorhigh districtwide:
Fall, 1990Spring, 1991
Compared to...
Program studentsin 19d9-90
The programrate was...HigherHigher
AISO Program
1990-91 program attendance was...
Fall: LowerSpring: Lower
DISCIPLINE: Compared with the percentages of students involved in 6iscip1ineincidents at the middle school/junior high level districtwide:
The program AISD Programrate was...
Fall, 1990 Lower 5.5% 1.0%Spring, 1991 Lower 6.il% 1.5%
Compared to... 1990-91 program disctroine was...
Progrgm students Fall: Higherin 19169-90 Spring: Higher
GRADES: Compared with the GPA's for all AISD middle school/juniorhigh students:
Fall, 1990Spring, 1991
Compared to...
Progrgm studentsin 19169-90
The programrate was...HigherHigher
AISD Program
83.5.0
1990-91 program GPA was...
Fall: LowerSpring: Lower
RETAINEES/DROPOUTS: Comparing the percentage of program studentsrecommended in spring, 1991, for retention the following year withall AISD middle school/junior high students:
The program AISD Programrate was...
Lower 3.7% 0.14
Compared to the sixth six weeks dropout rate for middle school/junior high studentsfor 1990-91:
The program AISD Programrate was...
Lower 3.4% 0.2%
Compared with the percentage of program students predicted to drop out:
The obtained Predicted Obtainedrate was...
Lower 1.2% 0.0%
As a percentage of the dropout rate predicted for these students:
The program rate was...Less than 100%
File name: UCC.EVGENGT.JR91
36
Meaning that...The program did betterthan anticipated
90.39
AUSTIN INDEPENDENT SCHOOL DISTRICT
GENESYS DEPARThENT OF MANAGEMENT INFORMATION EVALUATION
OFFICE OF RESEARCH AND EVALUATION SUMMARYGENanc Evaluation SYS tam
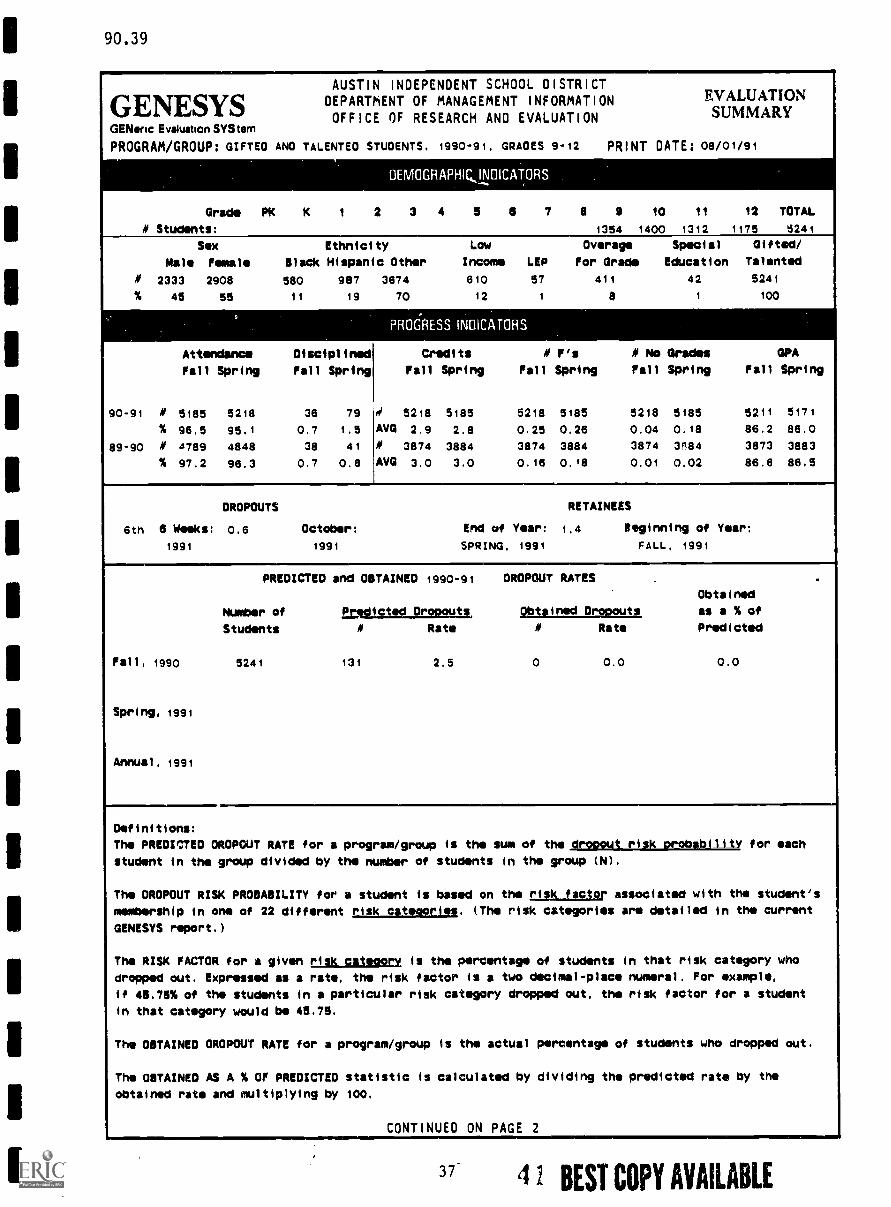
PROGRAM/GROUP: GIFTED AND TALENTED STUDENTS, 1990-91. GRADES 9-12 PRINT DATE: 08/01/91
DEMOGRAPHICJNOICATORS
Grade PK K 1 2 3 4 5 6 7 6 0 10 11 12 TOTAL
M Students: 1354 1400 1312 1175 5241
Sex Ethnicity Low Overage Special Gifted/
Male Female Black Hispanic Other Income LIP For Grade Education Talented
M 2333 2908 580 987 3674 610 57 411 42 5241
% 45 66 11 19 70 12 1 a 1 loo
PROGRESS INDICATORS
Attendance Disciplined
Fall Spring Fall Spring
90-91 M 5185 5218 36 79
% 96.5 95,1 0.7 1.5
89-90 M 4789 4848 38 41
% 97.2 96.3 0.7 0.8
Credits # F's # No Grades GPA
Fall Spring Fall Spring Fall Spring Fall Spring
d 5218 5185 5218 5185 5218 5185 5211 5171
AVG 2.9 2.8 0.25 0.26 0.04 0,18 86.2 86.0
M 3874 3884 3874 3884 3874 3S84 3873 3883
AVG 3.0 3.0 0.16 0.18 0.01 0.02 86.6 86.5
DROPOUTS RETAINEES
6th 6 Meeks: 0.6 October: End of Year: 1.4 Beginning of Year:
1991 1991 SPRING, 1991 FALL, 1991
PREDICTED and OBTAINED
Number of p_iterlits_dimaStudents M
Fall, 1990 5241 131
Spring, 1991
Annual , 1991
1990-91 DROPOUT RATES .
Obtained
ea1.1_4111
as a % of
Rate M Rate Predicted
2.5 0 0.0 0.0
Definitions:
The PREDICTED DROPOUT RATE for a program/group
student in the group divided by the number
The DROPOUT RISK PROBABILITY for a student
membership in one of 22 different risk
is the sum of the simps&d_UNLE_L,obbilitY for each
of students in the group (N).
is based on the risk factor associated with the student's
catedoris. (The risk categories are detailed in the current
GENESYS report.)
The RISK FACTOR for a given ELIA...alma is the percentage of students in that risk category who
dropped out. Expressed as a rate, the risk factor is a two decimal-place numeral. For xample,
if 46.76% of the students in a particular risk category dropped out, the risk factor for a student
in that category would be 46.76.
The OBTAINED DROPOUT RATE for a program/group is the actual percentage of students who dropped out.
The OBTAINED AS A % OF PREDICTED statistic is calculated by dividing the predicted rate by the
obtained rate and multiplying by 100.
CONTINUED ON PAGE 2
37- 4 1 BEST COPY AVAILABLE
90.39
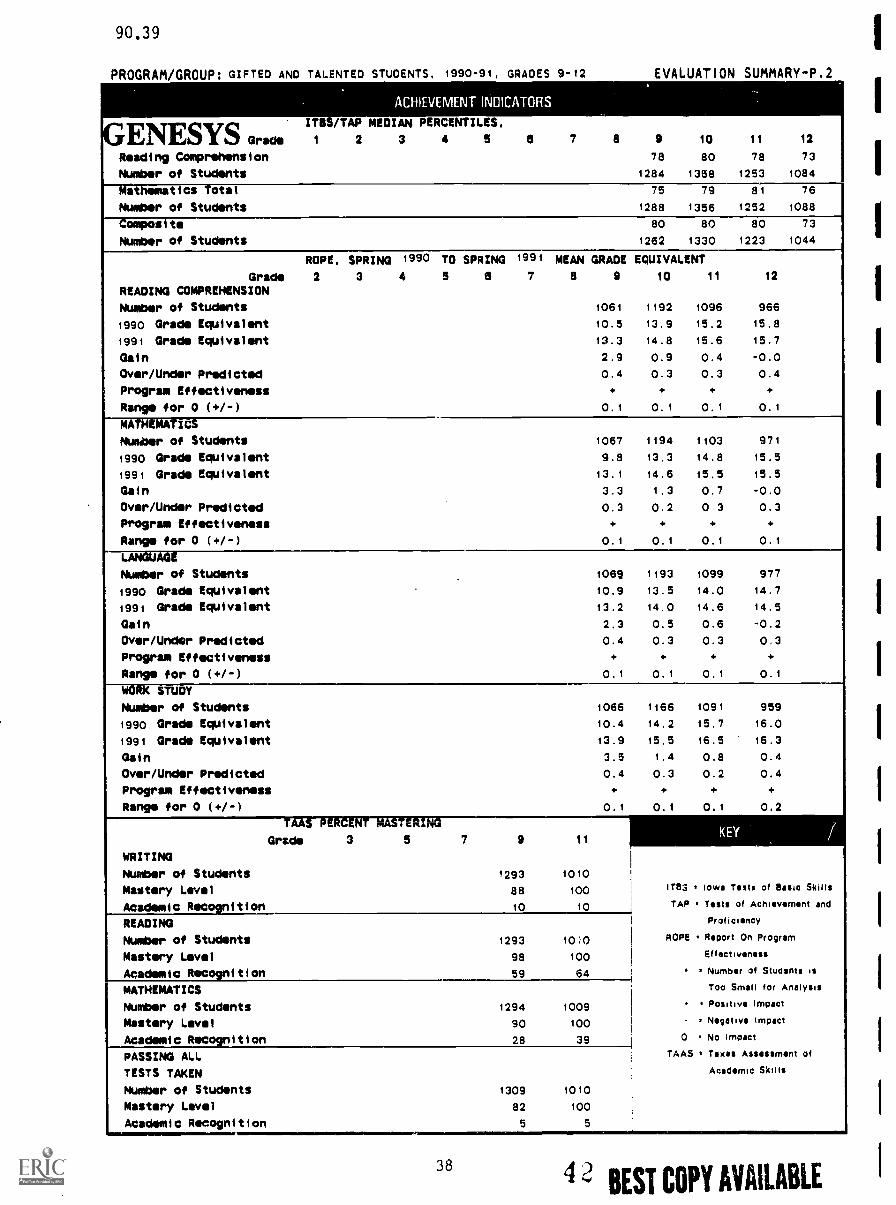
PROGRAM/GROUP: GIFTED AND TALENTED STUDENTS. 1990-91, GRADES 9-12 EVALUATION bUMMAKY -F.2
ACHIEVEMENT INDICATORS
GENESYS Grade
IT1BS/TAP MEDIAN PERCENTILES,
2 3 4 7 8
,
-
9 10 11 125 5
Reading Comprehension 78 80 78 73
Number of Students 1284 1358 1253 1084
--githematics Total 75 79 81 76
Number of Students 1288 1356 1252 1088
Composite 80 80 80 73
Number of Students 1262 1330 1223 1044
ROPE. SPRING 1990 TO SPRING 1991 MEAN GRADE EQUIVALENT
Grade 2 3 4 5 a 7 a 9 10 11 12
READING COMPREHENSION
Number of Students 1061 1192 1096 966
1990 Grade Equivalent 10.5 13.9 15.2 15.8
1991 Grade Equivalent 13.3 14.8 15.6 15.7
Gain 2.9 0.9 0.4 -0.0
Over/Under Predicted 0.4 0.3 0.3 0.4
Program Effectiveness « « « «
Rang. for 0 (+/-) 0.1 0.1 0.1 0.1
MATHEMATICS
liember of Students 1067 1194 1103 971
1990 Grade Equivalent 9.8 13.3 14.8 15.5
1991 Grade Equivalent 13.1 14.6 15.5 15.5
Gain 3.3 1.3 0.7 -0.0
Over/Under Predicted 0.3 0.2 0 3 0.3
Program Effectiveness « « « «
Range for 0 (+/-) 0.1 0.1 0.1 0.1
AG
Number of Students.
1069 1193 1099 977
1990 Grade Equivalent . 10.9 13.5 14.0 14.7
1991 Grade Equivalent 13.2 14.0 14.6 14.5
Gain 2.3 0.5 0.6 -0.2
Over/Under Predicted 0.4 0.3 0.3 0.3
Program Effectiveness « « « «
Range for 0 (+/-) 0.1 0.1 0.1 0.1
WORK STUDY
Number of Students 1066 1166 1091 959
1990 Grade Equivalent 10.4 14.2 15.7 16.0
1991 Grade Equivalent 13.9 15.5 16.5 16.3
Gain 3.5 1.4 0.8 0.4
Over/Under Predicted 0.4 0.3 0.2 0.4
Program Effectiveness « « + +
Range for 0 (+/-) 0.1 0.1 0.1 0.2
Grid. 3 5 7 9 11
WRITING
Number of Students 1293 1010
Mastery Level 88 100 ITEIS Iowa Tests of Basic Skills
Academic Recognition 10 10 TAP Tests of Achievement and
READING Proficiency
Number of Students 1293 1010 ROPE Report On Program
Mastery Level 98 100 Effectiveness
Academic Recognition 59 64 Number of Students is
MATHEMATICS Too Small for Analysis
Number of Students 1294 1009 Positive Impact
Mastery Level 90 100 - Negative Impact
Academic Recognition 28 39 0 No Impact
PASSING ALL TAAS Texas Assessment of
TESTS TAKEN Academic Skills
Number of Students 1309 1010
Mastery Level 82 100
Academic Recognition 5 5
38
4 2 BEST COPY AVAILABLE
90.39
EXECUTIVE SUMMARY
SENIOR HIGHGRADE 9-12
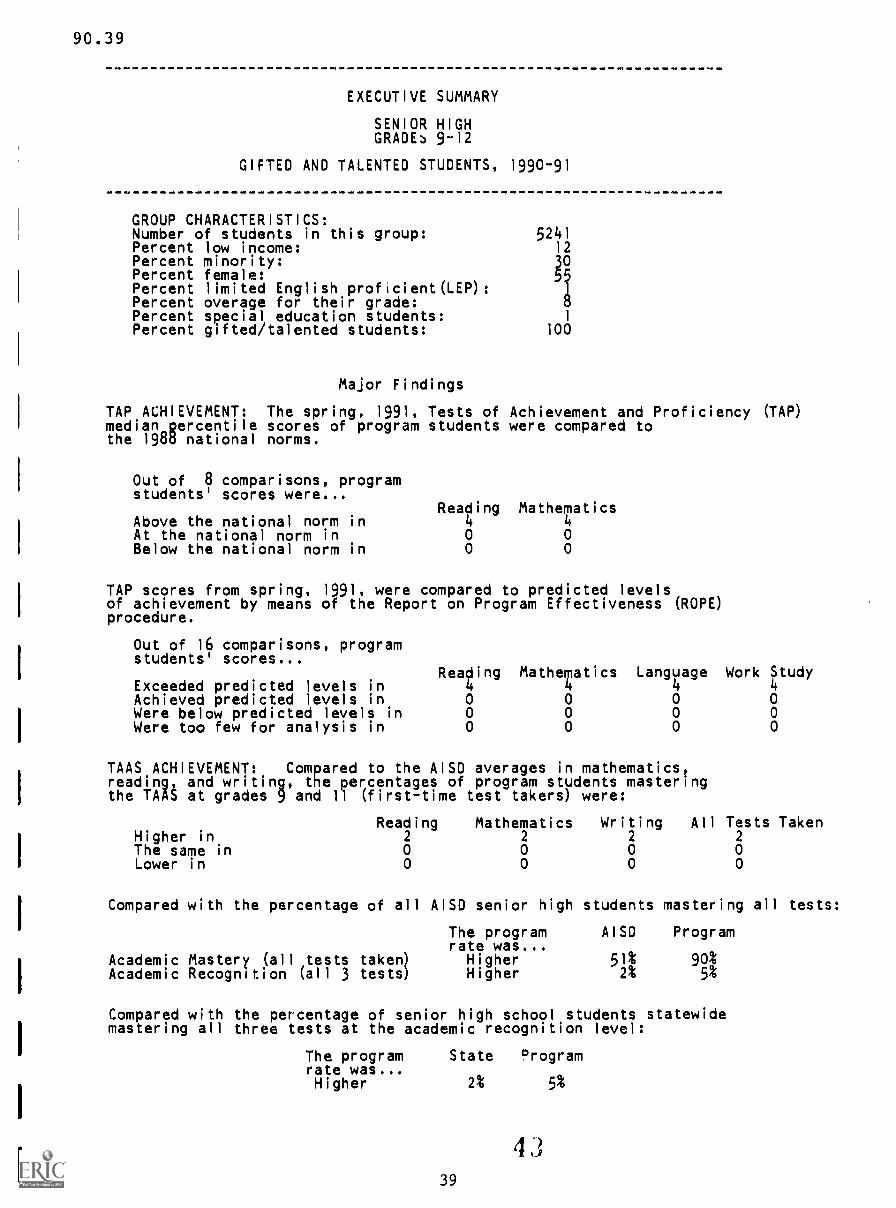
GIFTED AND TALENTED STUDENTS, 1990-91
GROUP CHARACTERISTICS:Number of students in this group: 5241Percent low income: 12Percent minority:Percent female:Percent limited English proficient(LEP):
1Percent overage for their grade:Percent special education students: 1
Percent gifted/talented students: 100
Major Findings
TAP ACHIEVEMENT: The spring, 1991. Tests of Achievement and Proficiency (TAP)median percentile scores of program students were compared tothe l9816 national norms.
Out of 8 comparisons, programstudents' scores were...
Reading MathematicsAbove the national norm in 4 4At the national norm in 0 0Below the national norm in 0 0
TAP scores from spring, 1991, were compared to predicted levelsof achievement by means of the Report on Program Effectiveness (ROPE)procedure.
Out of 16 comparisons, programstudents' scores...
Reading Mathematics Language Work StudyExceeded predicted levels in 4 4 4 4Achieved predicted levels in 0 0 0 0Were below predicted levels in 0 0 0 0Were too few for analysis in 0 0 0 0
TAAS ACHIEVEMENT: Compared to the AISD averages in mathematics?reading, and writing, the percentages of program students masteringthe TAAS at grades 9 and 11 (first-time test takers) were:
Reading Mathematics Writing All Tests TakenHigher in 2 2 2 2
The same in 0 0 0 0Lower in 0 0 0 0
Compared with the percentage of all
Academic Mastery (all tests taken)Academic Recognition (all 3 tests)
AISD senior high students mastering all tests:
The program AlS0 Programrate was...
Higher 51% 90%Higher 2% 5%
Compared with the percentage of senior high school students statewidemastering all three tests at the academic recognition level:
The program State °rogramrate was...Higher 2% 5%
4
39
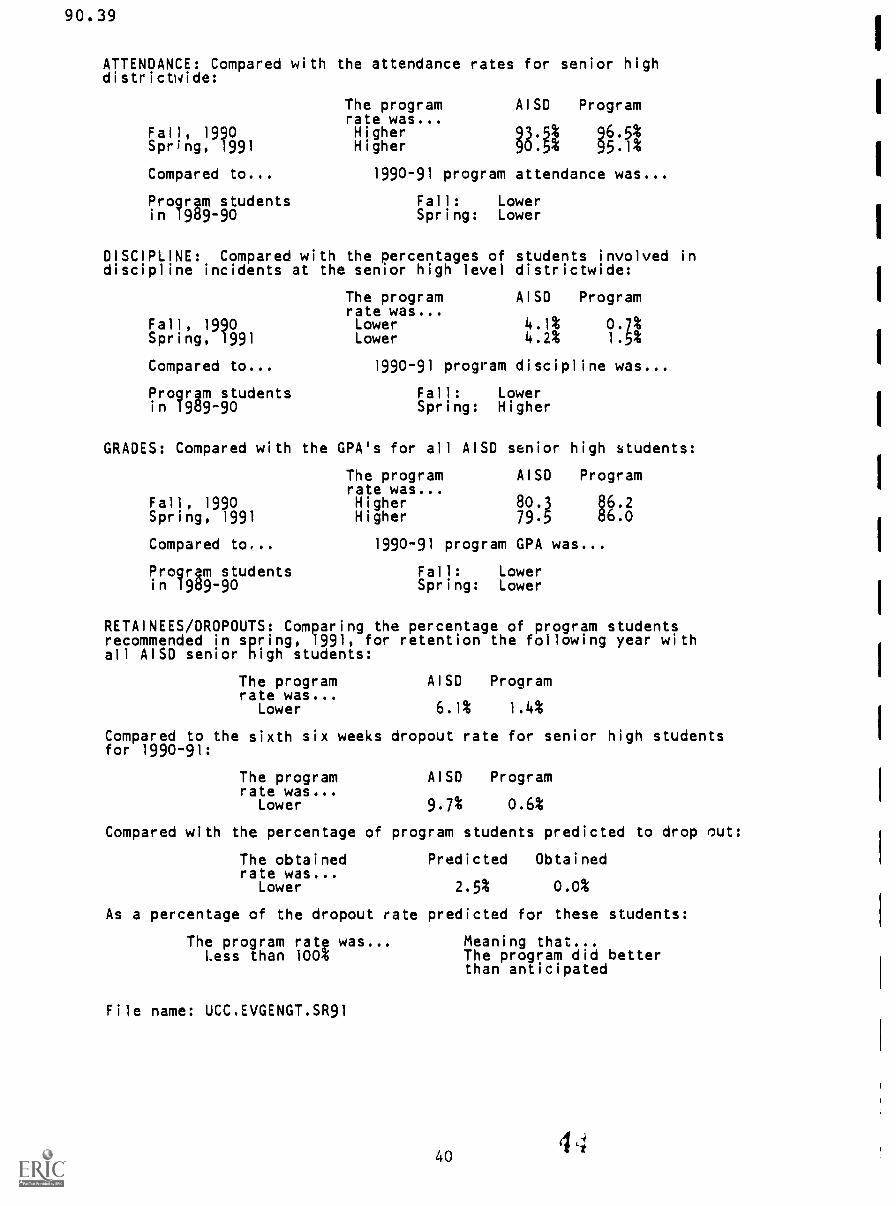
90.39
ATTENDANCE: Compared with the attendance rates for senior highdistrictwide:
Fall, 1990Spr;ng, 1991
Compared to...
Progrgm studentsin 1989-90
The programrate was...HigherHigher
AISD Program
BA ?Mt1990-91 program attendance was...
Fall: LowerSpring: Lower
DISCIPLINE: Compared with the percentages of students involved indiscipline incidents at the senior high level districtwide:
The program AISD Programrate was...
Fall, 1990 Lower 4.1% 0.7%Spring, 1991 Lower 4.2% 1.5%
Compared to... 1990-91 program discipline was...
Progrgm students Fall: Lowerin 1989-90 Spring: Higher
GRADES: Compared with the GPA's for all AISD senior high students:
Fall, 1990Spring, 1991
Compared to...
Progrgm studentsin 1989-90
The programrate was...HigherHigher
AISD Program
80.3 86.279.5 86.0
1990-91 program GPA was...
Fall: LowerSpring: Lower
RETAINEES/DROPOUTS: Comparing the percentage of program studentsrecommended in spring, 1991, for retention the following year withall AISD senior high students:
The program AISD Programrate was...
Lower 6.1% 1.4%
Compared to the sixth six weeks dropout rate for senior high studentsfor 1990-91:
The program AISD Programrate was...
Lower 8.7% 0.6%
Compared with the percentage of program students predicted to drop out:
The obtained Predicted Obtainedrate was...
Lower 2.5% 0.0%
As a percentage of the dropout rate predicted for these students:
The program ratp was...Less than 100;
File name: UCC.EVGENGT.SR91
Meaning that...The program did betterthan anticipated
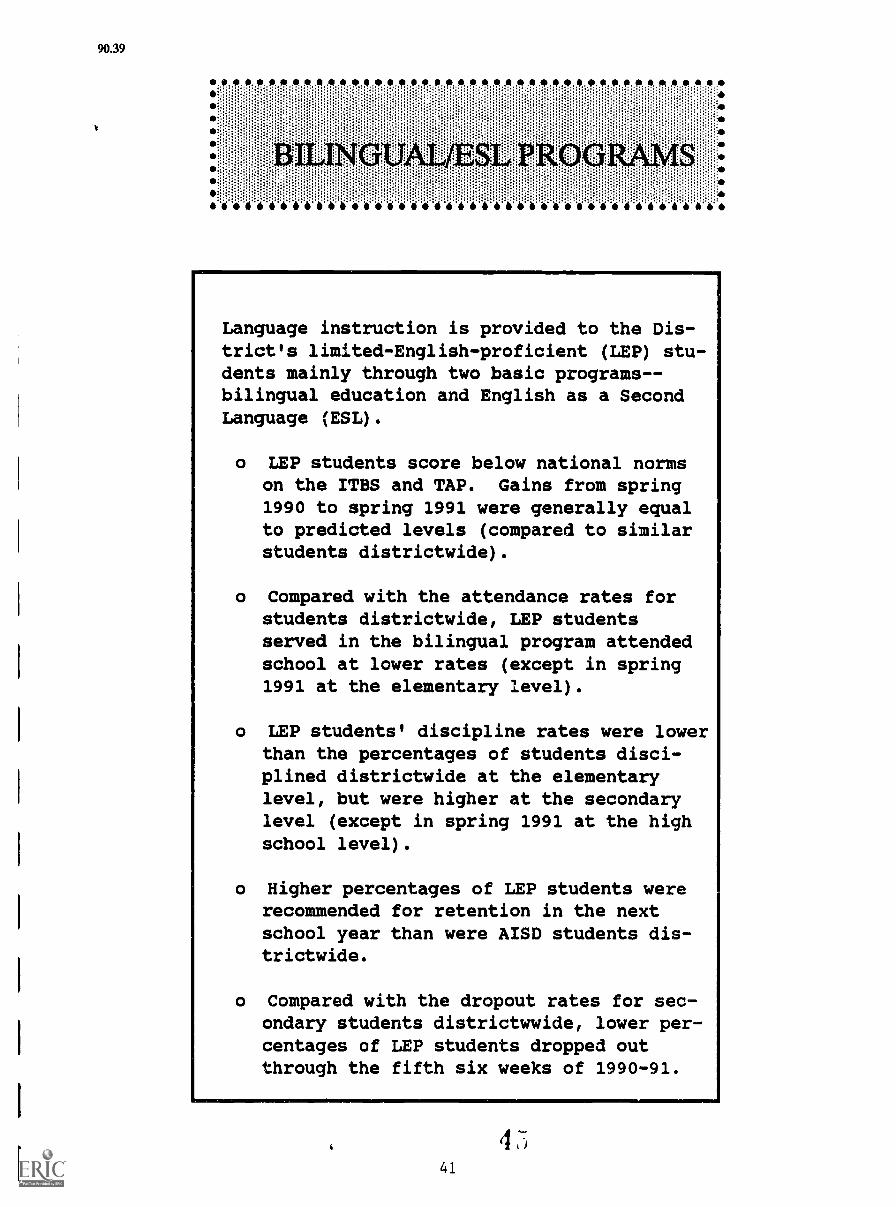
90.39
Language instruction is provided to the Dis-trict's limited-English-proficient (LEP) stu-dents mainly through two basic programs--bilingual education and English as a SecondLanguage (ESL).
o LEP students score below national normson the ITBS and TAP. Gains from spring1990 to spring 1991 were generally equalto predicted levels (compared to similarstudents districtwide).
o Compared with the attendance rates forstudents districtwide, LEP studentsserved in the bilingual program attendedschool at lower rates (except in spring1991 at the elementary level).
o LEP students' discipline rates were lowerthan the percentages of students disci-plined districtwide at the elementarylevel, but were higher at the secondarylevel (except in spring 1991 at the highschool level).
o Higher percentages of LEP students wererecommended for retention in the nextschool year than were AISD students dis-trictwide.
o Compared with the dropout rates for sec-ondary students districtwwide, lower per-centages of LEP students dropped outthrough the fifth six weeks of 1990-91.
41
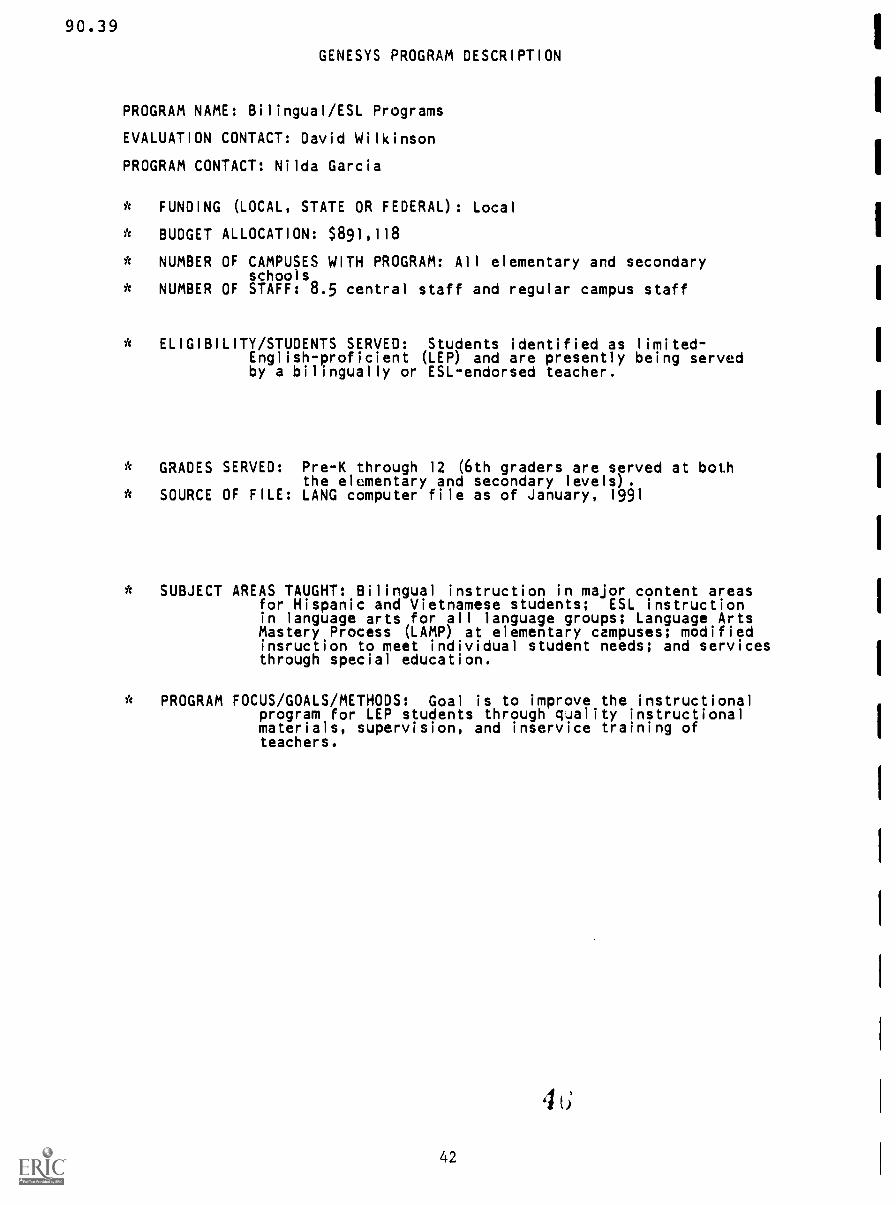
90.3 9
GENESYS PROGRAM DESCRIPTION
PROGRAM NAME: Bilingual/ESL Programs
EVALUATION CONTACT: David Wilkinson
PROGRAM CONTACT: Nilda Garcia
* FUNDING (LOCAL, STATE OR FEDERAL) : Local
* BUDGET ALLOCATION: $891,118
* NUMBER OF CAMPUSES WITH PROGRAM: All elementary and secondaryschools
* NUMBER OF STAFF: 8.5 central staff and regular campus staff
* ELIGIBILITY/STUDENTS SERVED: Students identified as limited-English-proficient (LEP) and are presently being servedby a bilingually or ESL-endorsed teacher.
* GRADES SERVED: Pre-K through 12 (6th graders are served at boththe elementary and secondary levels).
* SOURCE OF FILE: LANG computer file as of January, 1991
* SUBJECT AREAS TAUGHT: Bilingual instruction in major content areasfor Hispanic and Vietnamese students; ESL instructionin language arts for all language groups; Language ArtsMastery Process (LAMP) at elementary campuses; modifiedinsruction to meet individual student needs; and servicesthrough special education.
ft PROGRAM FOCUS/GOALS/METHODS: Goal is to improve the instructionalprogram for LEP students through quality instructionalmaterials, supervision, and inservice training ofteachers.
42
46

1
90.39
AUSTIN INDEPENDENT SCHOOL DISTRICT
GENESYS DEPARTMENT OF MANAGEMENT INFORMATION EVALUATION
OFFICE OF RESEARCH AND EVALUATION SUMMARYGENeric Evaluation SYS tem
PROGRAM/GROUP: SERVED LEP STUDENTS, 1990-91, GRADES K-6 PRINT DATE:07/30/91
,. .
DEMOGRAPHIC INDICATORS.
. 4
Grade PK K 1 2 3 4 5 0 7 8 9 10 11 12 TOTAL
f Students: 623 670 754 687 537 426 372 65 4143
Sex Ethnicity
Male Female Black Hispanic
M 2139 1995 24 3742
% 52 48 1 91
,
Attendance Disciplined
Fall Spring Fall Spring
90-91 M 3999 4141 a 8
% 96.4 95.8 0.1 0.2
89-90 # 2365 2434 2 4
% 96.3 96.3 0.0 0.1
Low Overage Special Gifted/
Other Income LEP For Grade Education Talented
368 3775 4106 874 453 59
9 91 99 21 11 1
PROGRESS INDICATORS
Credits f F/s f No Grades GPA
Fall Spring Fall Spring Fall Spring Fall Spring
#AVG
#
AVG
DROPOUTS N/ARETAINEES
5th 5 Meeks: October: End of Year: 1.8 Beginning of Year:
1991 1991 SPRING, 1991 FALL, 1991
PREDICTED and OBTAINED'1990-91 DROPOUT RATES
Obtained
Number of Predicted DroPouts Obtained OroDouts as a % of
Students f Rate # Rate Predicted
Fall, 1990
Spring, 1991
Annual, 1991
Definitions:
The PREDICTED DROPOUT RATE for a program/group
student in the group divided by the number
The DROPOUT RISK PROBABILITY for a student
membership in one of 22 different risk_catecories.
is the sum of the amaghstrisibbilit flr eachof students in the group (N).
is based on the risk factor associated with the student's
(The risk categories are detailed in the current
GENESYS report.)
The RISK FACTOR for a given rilk_Catecitorv is the percentage of students in that risk category who
dropped out. Expressed as a rate, the risk factor is a two decimal-place numeral. For example,
If 45.75% of the students in a particular risk category dropped out, the risk factor for a student
in that category would be 45.75.
The OBTAINED DROPOUT RATE for a program/group is the actual percentage of students who dropped out.
The OBTAINED AS A % OF PREDICTED statistic is calculated by dividing tho predicted rate by the
obtained rate and multiplying by 100.
CONTINUED ON PAGE 2 .
4 743 BEST COPY mu ARI r
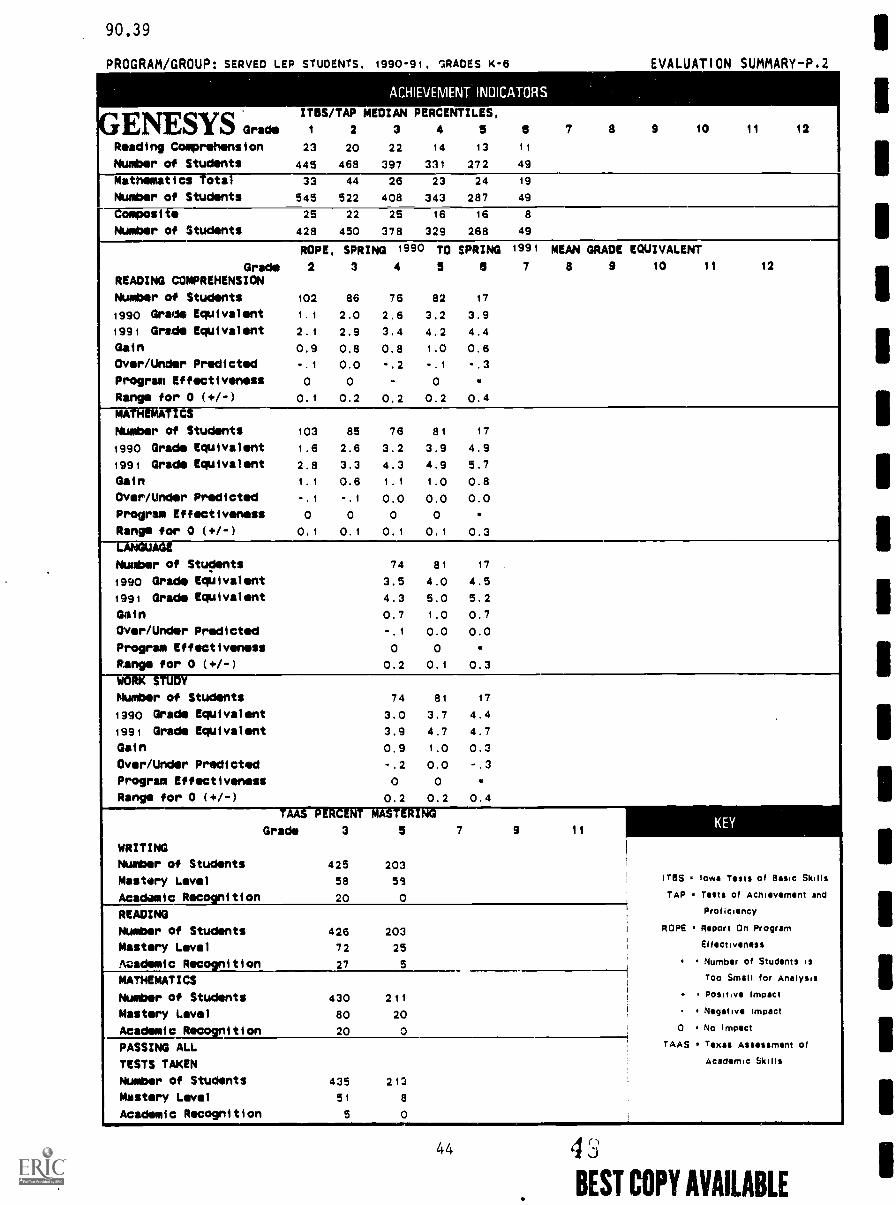
90.39
PROGRAM/GROUP: SERVED LEP STUDENTS, 1990-91, GRADES K-6 hVALUATIUN bUMMAKY-F.1
ACHIEVEMENT' INDICATORS
GENESSI( Grad*
IT1OS/TAP MEDIAN PERCENTILES,
2 3 4 5 8 7 9 9 10 11 12
Reading Comprehension 23 20 22 14 13 11
Number of Students 445 468 397 331 272 49
Mathematics Total 33 44 26 23 24 19
Number of Students 545 522 408 343 287 49
Composite 25 22 25 16 16 8
Number of Students 428 450 378 329 268 49
ROPE, SPRING 1990 TO SPRING 1991 MEAN GRADE EQUIVALENT
Grade 2 3 4 5 a 7 a 9 10 11 12
READING COMPREHENSION
Number of Students 102 86 76 82 17
1990 Grade Equivalent 1.1 2.0 2.6 3.2 3.9
1991 Grade Equivalent 2.1 2.9 3.4 4.2 4.4
Gain 0.9 0.8 0.8 1.0 0.6
Over/Under Predicted -.1 0.0 -.2 -.1 -.3
Program Effectiveness 0 0 - 0
Range for 0 (+/-) 0.1 0.2 0.2 0.2 0.4
MATHEMATICS
Number of Students 103 85 76 81 17
1990 Grade Equivalent 1.6 2.6 3.2 3.9 4.9
1991 Grade Equivalent 2.8 3.3 4.3 4.9 5.7
Gain 1.1 0.6 1.1 1.0 0.8
Over/Under Predicted -.1 -.1 0.0 0.0 0.0
Program Effectiveness 0 0 0 0
Range for 0 (+1-) 0.1 0.1 0.1 0.1 0.3
W ,'- AGE
Number of Stugents 74 81 17 .
1990 Grade Equivalent 3.5 4.0 4.5
1991 Grade Equivalent 4.3 5.0 5.2
Gain 0.7 1.0 0.7
Over/Under Predicted -.1 0.0 0.0
Program Effectiveness 0 0
Range for 0 (+1-) 0.2 0.1 0.3
WORK STUDY
Number of Students 74 81 17
1990 Grade Equivalent 3.0 3.7 4.4.
1991 Grade Equivalent 3.9 4.7 4.7
Gain 0.9 1.0 0.3
Over/Under Predicted -.2 0.0 -.3
Program Effectiveness 0 0
Range for 0 (+/-) 0.2 0.2 0.4
TAAS PERCENT MASTERING
Grade 3 5 7 9 11KEY
WRITING
Number of Students 425 203
Mastery Level 58 59 ITss Iowa Tests of Basic Skills
Acadamic Recognition 20 0 TAP Tests of Achievement and
READING Proficiency
Number of Students 426 203 I
ROPE Report On Program1
Mastery Level 72 25 1
Effectiveness
Academic Recognition 27 5 Number of Students is
Too Small for AnalysisMATHEMATICS
Number of Students 430 211 . POSitive Impact
Mastery Level 80 201 Negative Impact
Academic Recognition 20 0 !o No Impact
PASSING ALL TAAS Texas Assessment Of
TESTS TAKEN Academic Skills
Number of Students 435 213
Mastery Level 51 8
Academic Recognition 5 0
44
BEST COPY AVAILABLE
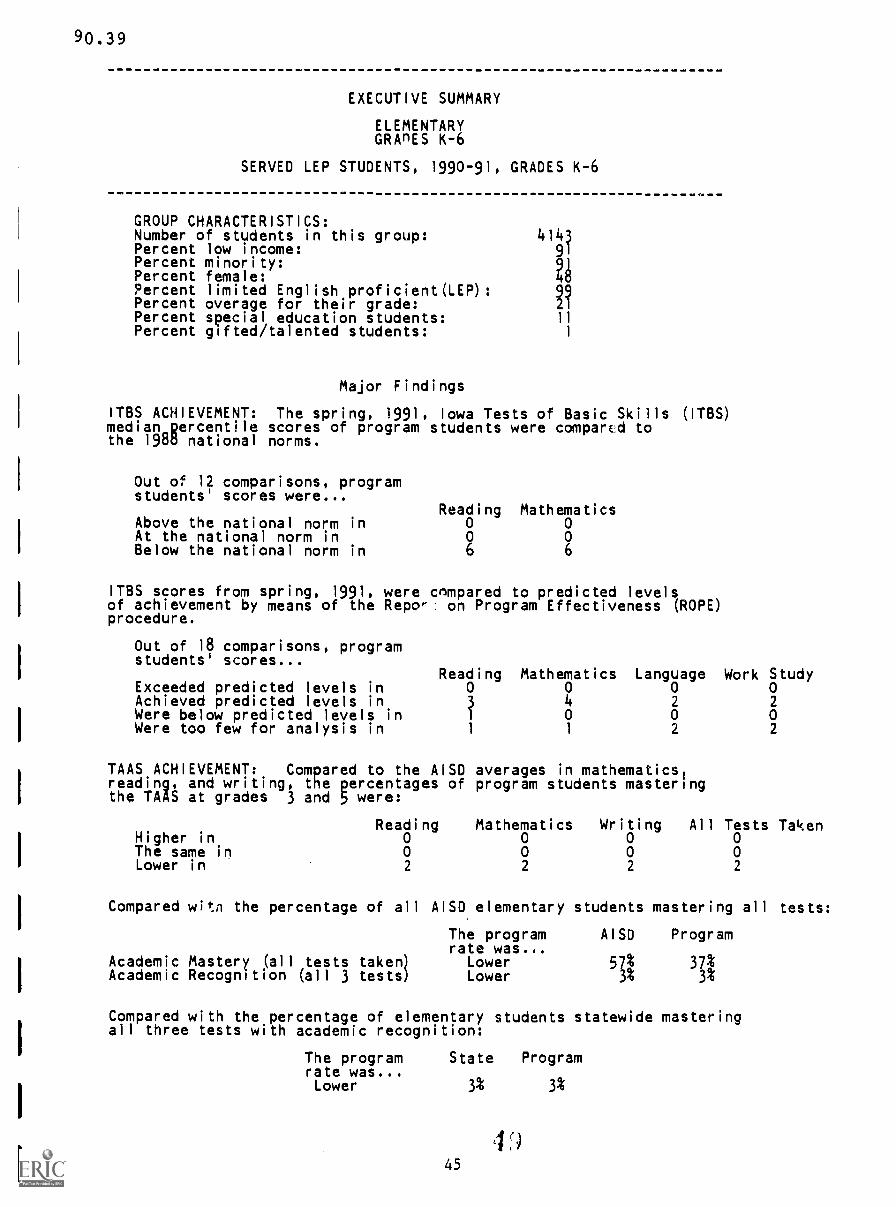
90 . 3 9
EXECUTIVE SUMMARY
ELEMENTARYGRADES K-6
SERVED LEP STUDENTS, 1990-91, GRADES K-6
GROUP CHARACTERISTICS:Number of students in this group: 414Percent low income:Percent minority:
hPercent female:Percent limited English proficient(LEP):
??Percent overage for their grade:Percent special education students: 11
Percent gifted/talented students: 1
Major Findings
ITBS ACHIEVEMENT: The spring, 1991, Iowa Tests of Basic Skills (ITBS)median gercentile scores of program students were comparud tothe 198d national norms.
Out of 12 comparisons, programstudents' scores were...
Reading MathematicsAbove the national norm in 0 0At the national norm in 0 0Below the national norm in 6 6
ITBS scores from spring, 1991, were cnmpared to predicted levelsof achievement by means of the Repo'. on Program Effectiveness (ROPE)procedure.
Out of 18 comparisons, programstudents scores...
Reading Mathematics Language Work StudyExceeded predicted levels in 0 0 0 0Achieved predicted levels inWere below predicted levels in
4 2 2
0 0 0Were too few for analysis in 1 1 2 2
TAAS ACHIEVEMENT: Compared to the AISO averages in mathematics!reading, and writing, the percentages of program students masteringthe TAAS at grades 3 and 5 were:
Reading Mathematics Writing All Tests TakenHigher in 0 0 0 0The same in 0 0 0 0Lower in 2 2 2 2
Compared witn the percentage of all AISO elementary students mastering all tests:
The program AISD Programrate was...
Academic Mastery (all tests taken) Lower 57% 371Academic Recognition (all 3 tests) Lower 3% 34
Compared with the percentage of elementary students statewide masteringall three tests with academic recognition:
The program State Programrate was...Lower 3% 3%
45
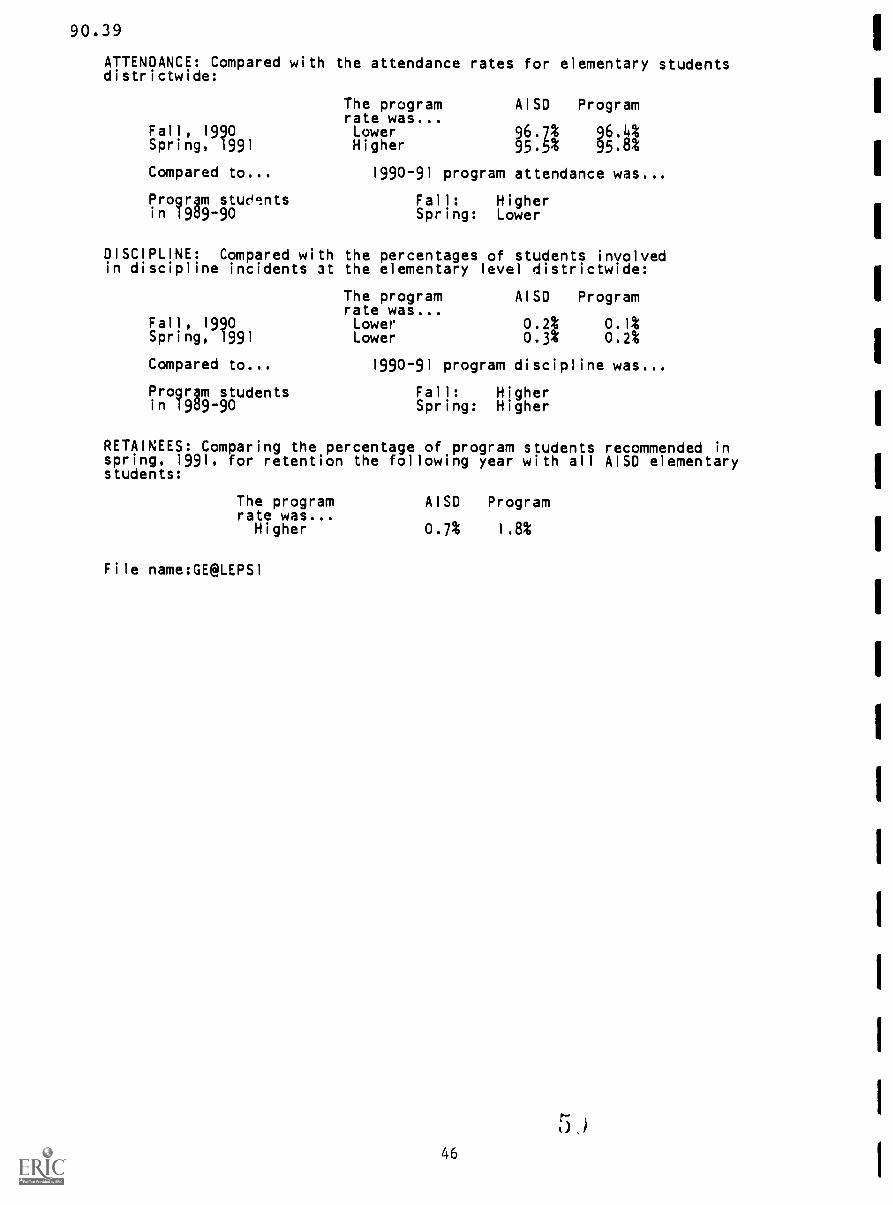
90.39
ATTENDANCE: Compared with the attendance rates for elementary studentsdistrictwide:
Fall, 1990Spring, 1991
Compared to...
Progrgm stud,Intsin 1989-90
The program AISD Programrate was...Lower 96.7% 96.4Higher 95.5% 95.8%
1990-91 program attendance was...
Fall: HigherSpring: Lower
DISCIPLINE: Compared with the percentages of students involvedin discipline incidents at the elementary level districtwide:
The program AISD Programrate was...
Fall, 1990 Lower 0.2% 0.1%Spring, 1991 Lower 0.3% 0.2%
Compared to... 1990-91 program discipline was...
Progrgm students Fall: Higherin 1989-90 Spring: Higher
RETAINEES: Comparing the percentage of program students recommended inspring, 1991, for retention the following year with all AISD elementarystudents:
The programrate was...
Higher
File name:GE@LEPS1
AISO Program
0.7% 1.8%
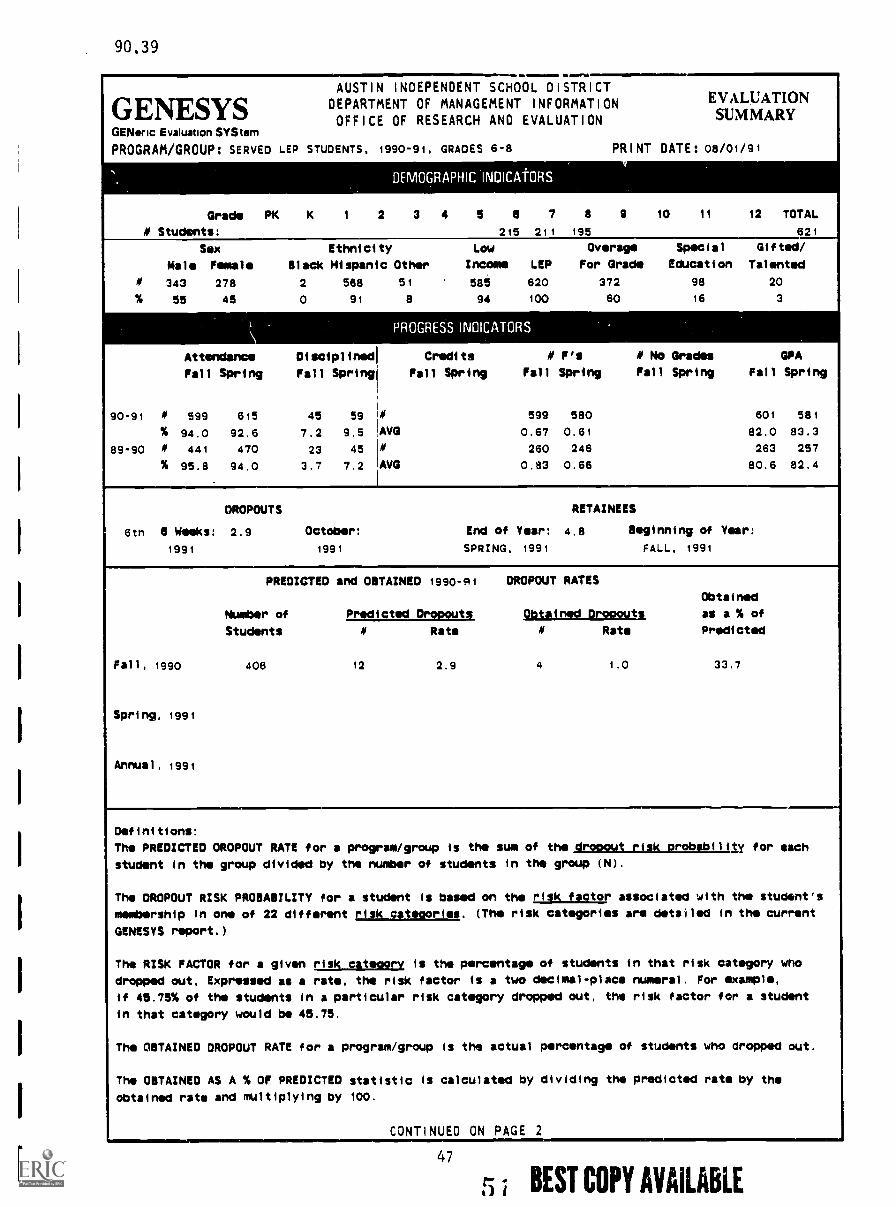
90.39
AUSTIN
GENESYS DEPARTMENTOFFICE
GENeric Evaluation SYS tem
PROGRAM/GROUP: SERVED LEP STUDENTS,
Grade PK K 1
# Students:
INDEPENDENT SCHOOL DISTRICTOF MANAGEMENT INFORMATION EVALUATION
OF RESEARCH AND EVALUATION SUMMARY
1990-91, GRADES 6-8 PRINT DATE: 08/01/91,
DEMOGRAPHIC INDICAIORS
2 3 4 5 8 7 8 9 10 11 12 TOTAL
215 211 195 621
Sex Ethnicity
Male Female Black Hispanic
lif 343 278 2 588
% 55 45 0 91
.
Attendance Disciplined
Fall Spring Fall Spring
90-91 lif 599 615 45 59
% 94.0 92.6 7.2 9.5
89-90 lif 441 470 23 45
% 95.8 94.0 3.7 7.2
Low Overage Special Gifted/
Other Income LEP For Grade Education Talented
51 585 620 372 98 20
8 94 100 60 16 3
PROGRESS INDICATORS
Credits # F's # No Grades GPA
Fall Spring Fall Spring Fall Spring Fall Spring
lif 599 580 601 581
AVG 0.67 0.61 82.0 83.3
4, 260 246 263 257
AVG 0.83 0.66 80.6 82.4
DROPOUTS RETAINEES
6tn 6 Weeks: 2.9 October: End of Year: 4.8 Beginning of Year:
1991 1991 SPRING, 1991 FALL, 1991
PREDICTED and OBTAINED 1990-911 DROPOUT RATES
Obtained
Number of fliteltNNA 2211.1.M51.205MiLl as a % of
Students # Rate # Rate Predicted
Fall, 1990 406 12 2.9 4 1.0 33.7
Spring, i99i
Annual, 1991
Definitions:
The PREDICTED DROPOUT RATE for a program/group
student in the group divided by the number
The DROPOUT RISK PROBABILITY for a student
mewbership in one of 22 different risk
is the sum of the SIMI;alia_rcrobbility for each
of students in the group (N).
is based on the risk factor associated with the student's
categories. (The risk categories are detailed in the current
GENESYS report.)
The RISK FACTOR for a given risk cateaorv is the percentage of students in that risk category who
dropped out, Expressed as a rate, the risk factor is a two decimal-place numeral. For example,
if 48.75% of the students in a particular risk category dropped out, the risk factor for a student
in that category would be 45.75.
The OBTAINED DROPOUT RATE for a program/group is the actual percentage of students who dropped out.
The OBTAINED AS A % OF PREDICTED statistic is calculated by dividing the predicted rate by the
obtained rate and multiplying by loo.
CONTINUED ON PAGE 2
47
5 BEST COPY AVAILABLE
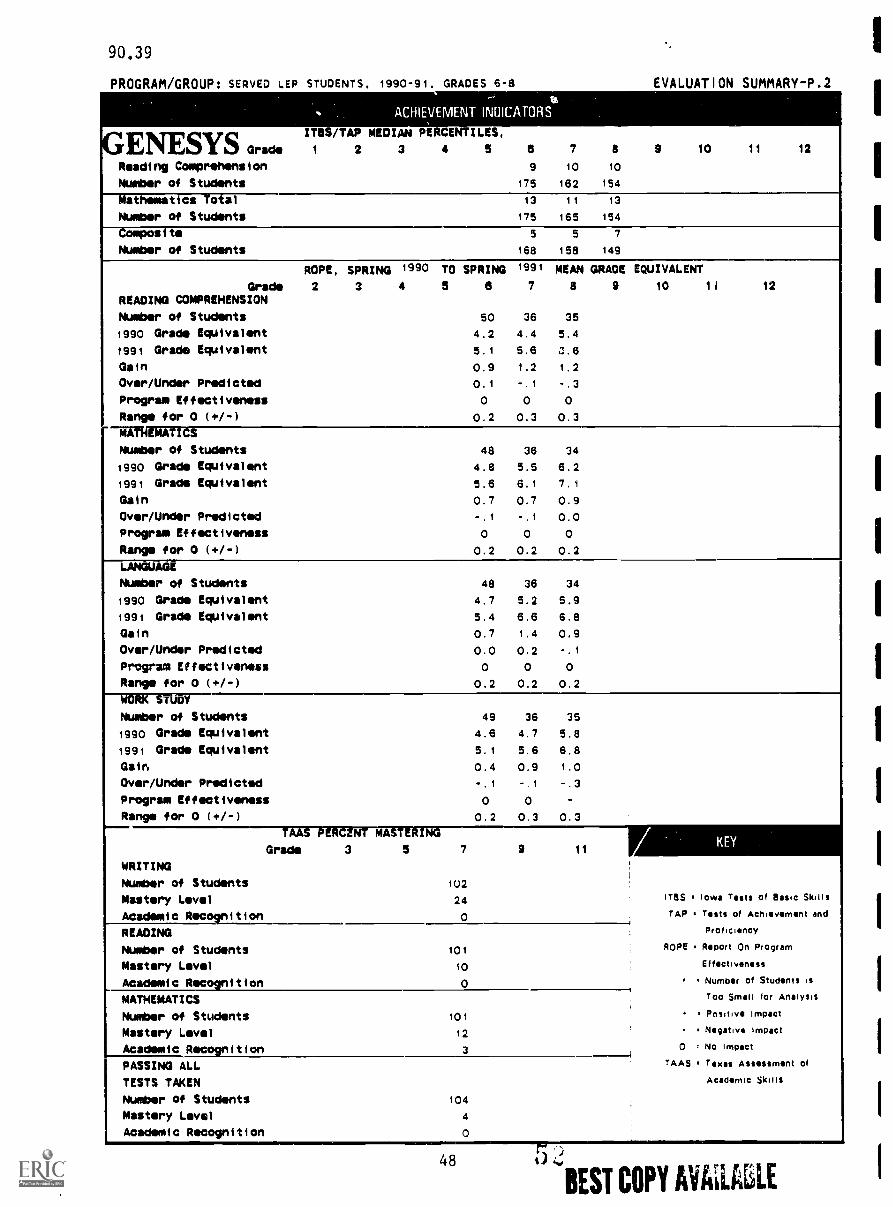
90.39
PROGRAM/GROUP: SERVED LEP STUDENTS, 1990-91, GRADES 6-8 LVALUAIION bUMMAKY -P.2
. ACHIEVEMENTINMCATORS .
GENESYS Grade
173/TAP MEDIAN PERCENTILES.
2 3 4 5 a 7 8 9 10 11 12
Reading Comprehension 9 10 10
Number of Students 175 162 154
matnematics Total 13 11 13
Number of Students 175 165 154
Composite 5 5 7
Number of Students 168 158 149
ROPE, SPRING 1990 YO SPRING 1991 MEAN GRADE EQUIVALENT
Grade 2 3 4 5 6 7 8 9 10 11 12
READING COMPREHENSION
Number of Students 50 36 35
1990 Grade Equivalent 4.2 4.4 5.4
1991 Grade Equivalent 5.1 5.6 3.6
Gain 0.9 1.2 1.2
Over/Under Predicted 0.1 -.1 -.3
Program Effectiveness 0 0 0
Range for 0 (+/-) 0.2 0.3 0.3
I--aniem--ffetNumber of Students 48 36 34
1990 Grade Equivalent 4.8 5.5 6.2
1991 Grade Equivalent 5.6 6.1 7.1
Gain 0.7 0.7 0.9
Over/Under Predicted -.1 -.1 0.0
Program Effectiveness 0 0 0
Range for 0 (+/-) 0.2 0.2 0.2
lir-7"- AG
Number of Students 48 36 34
1990 Grade Equivalent 4.7 5.2 5.9
1991 Grade Equivalent 5.4 6.6 6.8
Gain 0.7 1.4 0.9
Over/Under Predicted 0.0 0.2 -.1
Program Ef f ect 1 vines% 0 0 0
Range for 0 (+1-) 0.2 0.2 0.2
WORK STUDY
Number of Students 49 36 35
1990 Grade Equivalent 4.6 4.7 5.8
1991 Grade Equivalent 5.1 5.6 6.8
Gain 0.4 0.9 1.0
Over/Under Predicted -.1 -.1 -.3
Program Effectiveness 0 0 -
Range for 0 f+/-1 0.2 0.3 0.3
TAAS PERCENT MASTERING
Grade 3 5 7 9 11KEY
WRITING
Number of Students 102
Mastery Lvl 24 MIS low. Tests of Baste Skills
Academth Recogn i t i on 0 TAP Tests of Achievement and
READING 1Proficiency
Number of Students 101 ROPE Report On Program
Mastery Levl 10 Effectiveness
Academ 1 c Recognit i on 0 Number of Students is
MATHEMATICS Too Smelt f or Analysis
Number of Students 101 Pnsitive Impact
Mastery Levl 12 Negative Impact
Academic Recognition 3 0 = No impact
PASSING ALL r AAS Texas Assessment of
TESTS TAKEN Academic Skulls
Number of Students 104
Mastery Level 4
Academic Recognition 0
48
BEST COPY AVAMLE
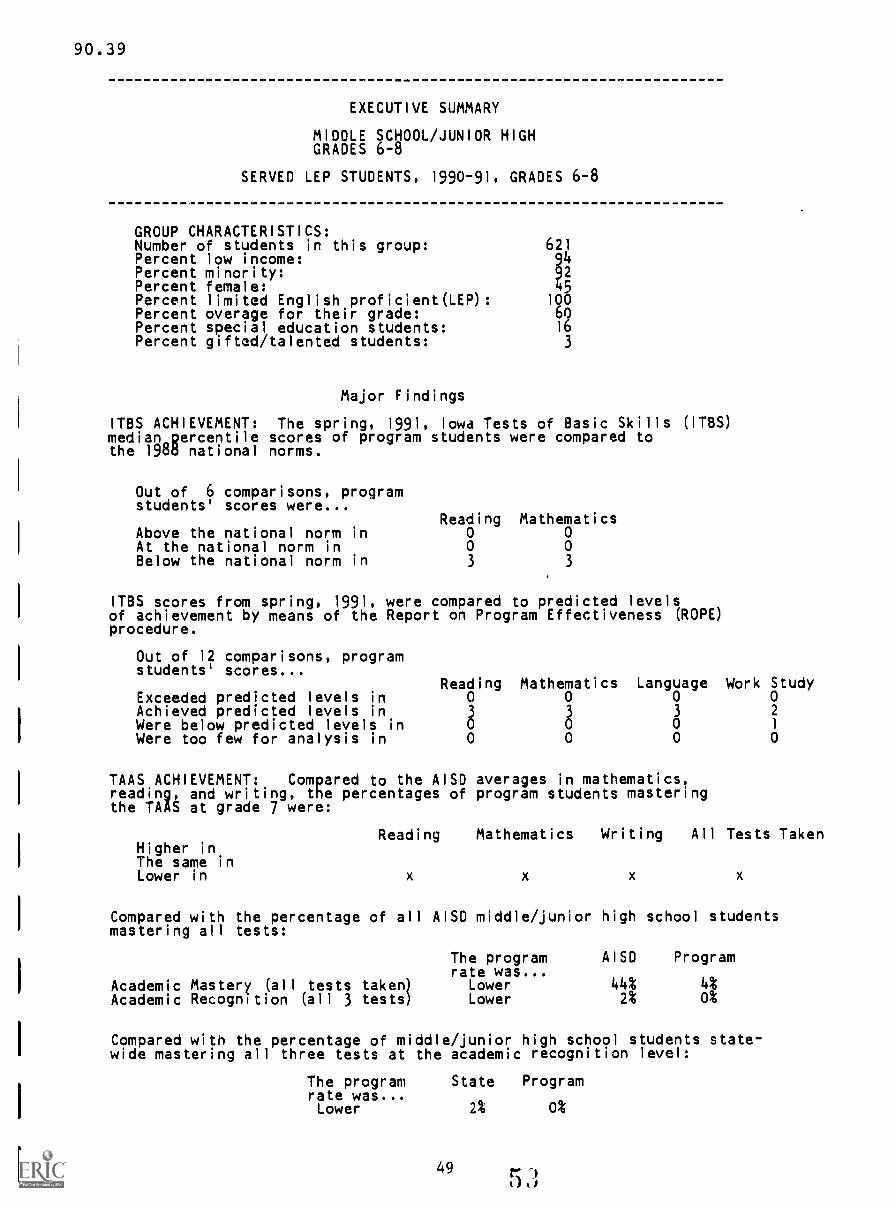
90.3 9
EXECUTIVE SUMMARY
MIDDLE SCHOOL/JUNIOR HIGHGRADES 6-8
SERVED LEP STUDENTS, 1990-91, GRADES 6-8
GROUP CHARACTERISTICS:Number of students in this group: 621Percent low income:
VIPercent minority:Percent female: 45Percent limited English proficient(LEP): 100Percent overage for their grade: 60Percent special education students: 16Percent gifted/talented students: 3
Major Findings
ITBS ACHIEVEMENT: The spring, 1991, Iowa Tests of Basic Skills (ITBS)median percentile scores of program students were compared tothe 198d national norms.
Out of 6 comparisons, programstudents' scores were...
Reading MathematicsAbove the national norm in 0 0At the national norm in 0 0Below the national norm in 3 3
ITBS scores from spring, 1991, were compared to predicted levelsof achievement by means of the Report on Program Effectiveness (ROPE)procedure.
Out of 12 comparisons, programstudents' scores...
Exceeded predicted levels inAchieved predicted levels inWere below predicted levels inWere too few for analysis in
Reading0
300
Mathematics0
80
Language0300
Work Study02
1
0
TAAS ACHIEVEMENT: Compared to the AISO averages in mathematics,readingt and writing, the percentages of program students masteringthe TAAS at grade 7 were:
Higher inThe same inLower in
Reading Mathematics Writing All Tests Taken
Compared with the percentage of all AISD middle/junior high school studentsmastering all tests:
Academic Mastery (all tests taken)Academic Recognition (all 3 tests)
The programrate was...
LowerLower
AISD
44%2%
Program
4%0%
Compared with the percentage of middle/junior high school students state-wide mastering all three tests at the academic recognition level:
The program State Programrate was...Lower 2% 0%
49
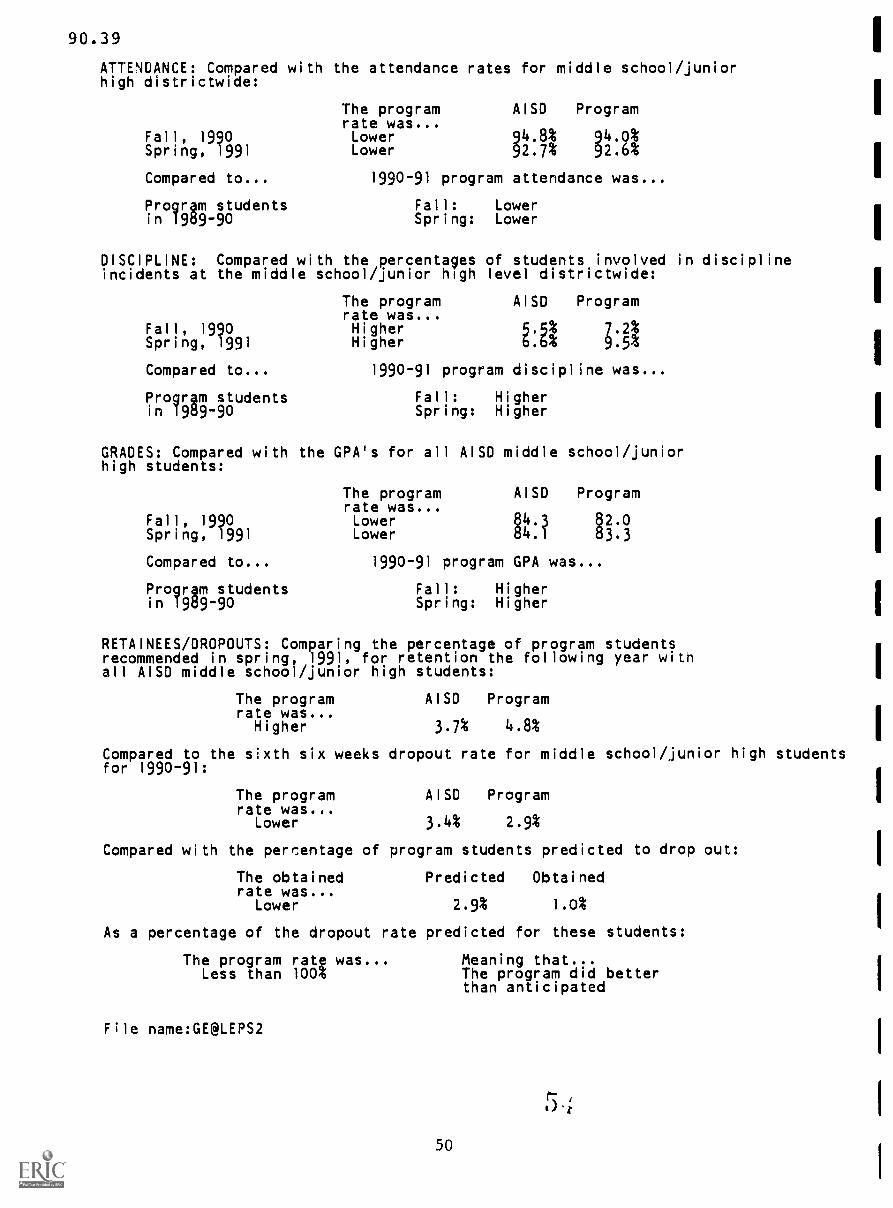
90.39ATTENDANCE: Compared with the attendance rates for middle school/juniorhigh districtwide:
The program AISD Programrate was...
Fall, 1990 Lower 94.8% 94.0%Spring, 1991 Lower 92.7% 92.6%
Compared to... 1990-91 program attendance was...
Progrgm students Fall: Lowerin 1989-90 Spring: Lower
DISCIPLINE: Compared with the percentages of students involved in disciplineincidents at the middle school/junior high level districtwide:
Fall, 1990Spring, 1991
Compared to...
Progrgm studentsin 1989-90
The programrate was...HigherHigher
AISD Program
7.2%6.6% 9.5%
1990-91 program discipline was...
Fall: HigherSpring: Higher
GRADES: Compared with the GPA's for all AISD middle school/juniorhigh students:
The program AISD Programrate was...
Fall, 1990 Lower a4.3 a2.0Spring, 1991 Lower 84.1 83.3
Compared to... 1990-91 program GPA was...
Progrgm students Fall: Higherin 1989-90 Spring: Higher
RETAINEES/DROPOUTS: Comparing the percentage of program studentsrecommended in spring, 1991, for retention the following year withall AISD middle school/junior high students:
The program AISD Programrate was...
Higher 3.7% 4.8%
Compared to the sixth six weeks dropout rate for middle school/junior high studentsfor 1990-91:
The programrate was...
Lower
AISD Program
3.4% 2.9%
Compared with the percentage of program students predicted to drop out:
The obtained Predicted Obtainedrate was...
Lower 2.9% 1.0%
As a percentage of the dropout rate predicted for these students:
The program rate was... Meaning that...Less than 100:t The program did better
than anticipated
File name:GE@LEPS2
50

90.39
AUSTIN INDEPENDENT SCHOOL DISTRICT
GENESYS DEPARTMENT OF MANAGEMENT INFORMATION EVALUATION
OFFICE OF RESEARCH AND EVALUATION SUMMARYGENeric Evaluation SYStem
PROGRAM/GROUP: SERVED LEP STUDENTS , 1490-91, GRADES 9-12 PRINT DATE: 07/30/91
DEMOGRAPHIC INDICATORS
Grade PK K 1 2 3 4 5 8 7 8 0 10 11 12 TOTAL
M Students: 311 151 107 61 630
Sex Ethnicity
Male Female Black Hispanic
M 367 263 1 529
% 58 42 0 84
Attendance Disciplined
Fall Spring Fall Spring
90-91 M 583 628 37 21
% 92.2 88.8 5.9 3.3
89-90 # 432 452 30 31
% 93.3 91.3 4.8 4.9
Low Overage Special Gifted/
Other Income LEP For Grade Education Talented
100 523 630 444 84 65
16 83 100 70 13 10
PROGRESS INDICATORS
Credits M F's 8 No Grades GPA
Fall Spring Fall Spring Fall Spring Fall Spring
M 530 595 580 595 580 595 575 585
AVG 2.2 1.9 1.14 1.29 0.25 0.69 77.6 76.1
M 317 329 317 329 317 329 315 328
AVG 2.4 2.3 0.99 1.11 0.18 0.26 78.5 77.9
DROPOUTS RETAINEES
6th 6 walks: 5.4 October: End of Year: 36.7 Beginning of Year:
1991 1991 SPRING, 1991 FALL, 1991
PREDICTED and OBTAINED 1990-91 DROPOUT RATES
Obtained
Number of Predicted Dropouts Obtained_Dropouts as a % of
Students it Rate M Rate Predicted
Fall, 1990 6". 46 7.3 2 0.3 4.4
Spring, 1991/
Annual, 1991
Definitions:
The PREDICTED DROPOUT RATE for a program/group
studeiA in the group divided by the number
The DROPOUT RISK PROBABILITY for a student
membership in one of 22 different risk
is the sum of the dr000ut probability for each
of students in the group (N).
is based on the riA_Ligisr associated with the student's
categories. (The risk categories are detailed in the current
GENESYS report.)
The RISK FACTOR for a given r;sk cateaory is the percentage of students in that risk category who
dropped out. Expressed as a rate, the risk factor is a two decimal-place numeral. For example,
if 45.75% of the students in a particular risk category dropped out, the risk factor far a student
1M that category would be 45.75.
The OBTAINED DROPOUT RATE for a program/group is the actual percentage of students who dropped out.
The OBTAINED AS A % OF PREDICTED statistic is calculated by dividing the predicted rate by the
obtained rate and multiplying by 100.
CONTINUED ON PAGE 2
51
5 5 BEST COPY AVAILABLE
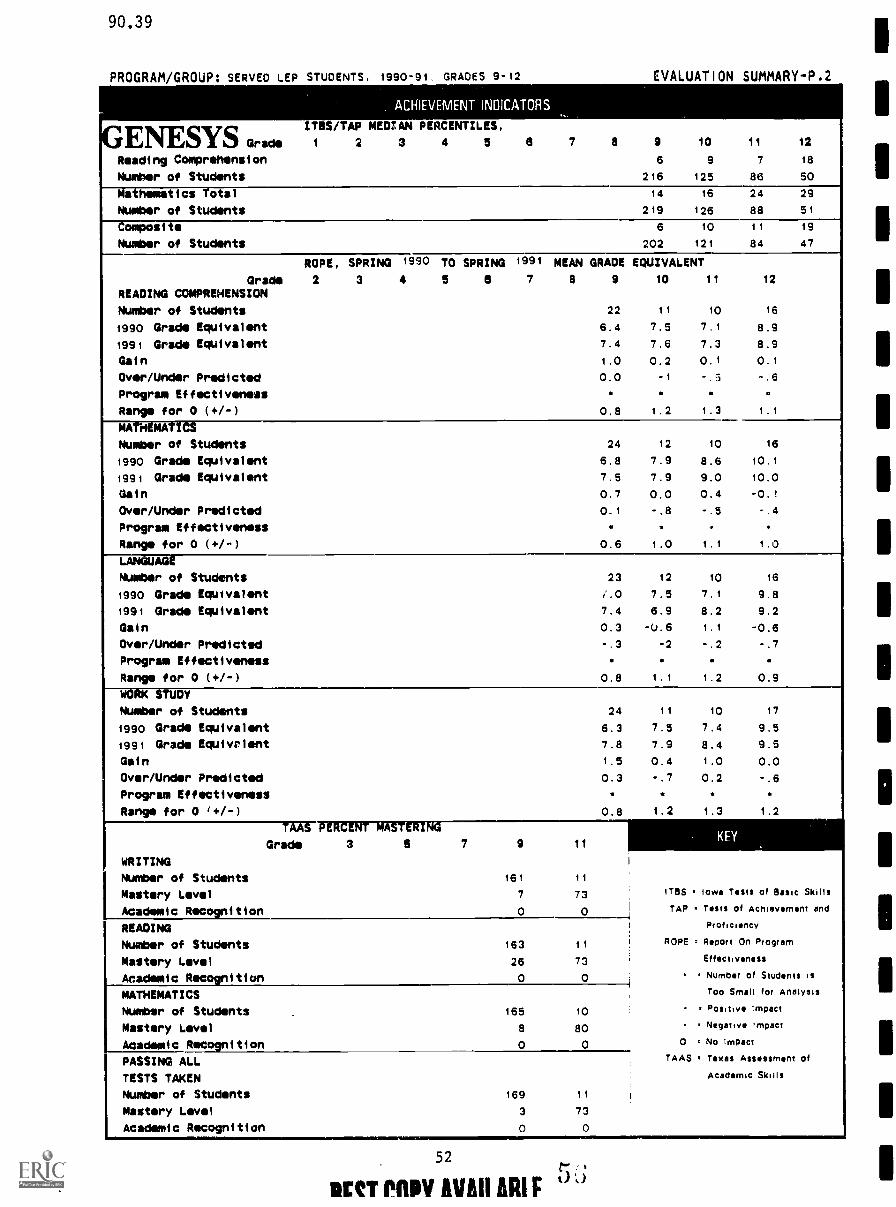
90.39
PROGRAM/GROUP: SERVED LEP STUDENTS, 1990-91 GRADES 9-12 LVALUATION 5UMMAKY-17.2
ACFfIEVEN1ENT INDICATORS -. .
GENESYS Grade
/TIES/TAP MEDIAN PERCENTILES,
2 3 4 5 8 7 8 9 10 11 12
Reading Comprehension 6 9 7 18
Number of Students 216 125 86 50
Mathematics total 14 16 24 29
Number of Students 219 126 88 5 1
o-riFiciiir uri- 6 10 11 19
Number of Students 202 121 84 47
ROPE, SPRING 1990 YO SPRING 1991 MEAN GRADE EQUIVALENT
Grade 2 3 4 5 8 7 8 9 10 11 12
READING COMPREHENSION
Number of Students 22 11 10 16
1990 Grade Equivalent 6.4 7.5 7.1 8.9
1991 Grade Equivalent 7.4 7.6 7.3 8.9
Gal n 1.0 0.2 0.1 0.1
Over/Under Predicted 0.0 -1 -.5 -.6
Program Effectiveness .
Range for 0 (+/-) 0.8 1 . 2 1 . 3 1.1
MATHEMATIcS
Number of Students 24 12 10 16
1990 Grade Equivalent 6.8 7.9 8.6 10.1
1991 Grade Equivalent 7.5 7.9 9.0 10.0
Gain 0.7 0.0 0.4 -0.1
Over/Under Predicted 0.1 -.8 -.5 -.4
Program Effectiveness . . .
Range for 0 (+/-) 0.6 1.0 1.1 1.0
LANGUAG
Number of Students 23 1 2 10 16
1990 Grade Equivalent 1.0 7.5 7.1 9.8
1991 Grade Equivalent 7.4 6.9 8.2 9.2
Gain 0.3 -(j.6 1.1 -0.6
Over/Under Predicted -.3 -2 -.2 -.7
Program Effectiveness .
Range for 0 (+/-) 0.8 1.1 1.2 0.9
o't TUDY
Number of Students 24 11 10 17
1990 Grade Equivalent 6.3 7.5 7.4 9.5
1991 Grade Equivrlent 7.8 7.9 8.4 9.5
Gain 1.5 0,4 1.0 0.0
Over/Under Predicted 0.3 -.7 0.2 -.6
Program Effectiveness .
Range for 0 1+/-) 0.8 1.2 1.3 1.2
fAX3-PERCENT MASTERING
Grade 3 5 7 9 11KEY
,
WRITING
Number of Students 161 11
Mastery Level 7 73 ITBS 3 Iow Tsts of Basic Skills
Academic Recognition 0 0 TAP * Tests of Achievement and
READING Proficiency
Number of Students 163 11 ROPE 3 Report On Program
Mastery Level 26 73 Effectiveness
Academic Roc- ition 0 0 3 Number of Students is
MATHEMATICS Too Small for Analysis
Number of Students 165 10 =Positive Impact
Mastery Level 8 80 - 3 Negative impact
Academic Recognition 0 0 ,
0 3 No Impact
PASSING ALL TAAS * Texas Assessment of
TESTS TAKEN Academic Skills
Number of Students 169 11
Mastery Level 3 73
Academic Recognition o..,--o
52
RECT 11111111 AVAIl AM
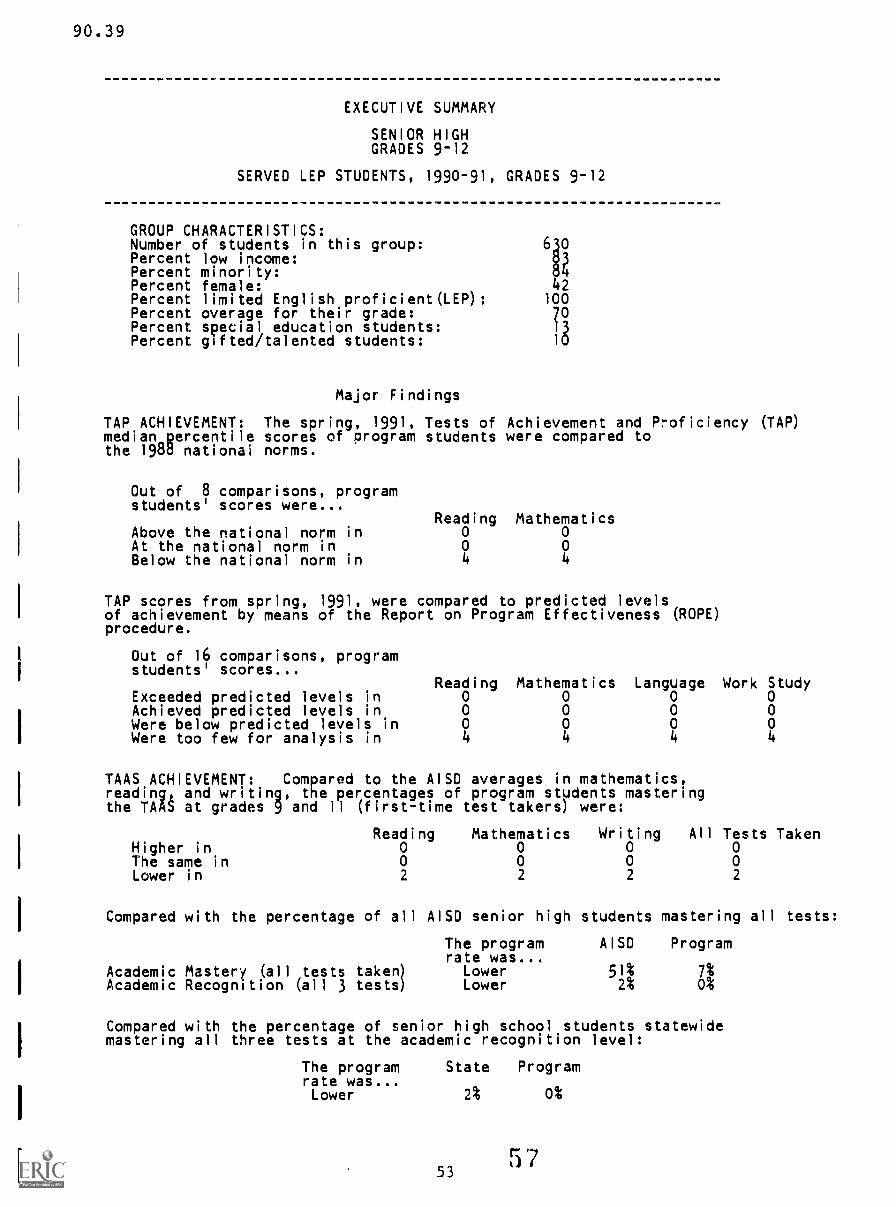
90.39
EXECUTIVE SUMMARY
SENIOR HIGHGRADES 9-12
SERVED LEP STUDENTS, 1990-91, GRADES 9-12
GROUP CHARACTERISTICS:Number of students in this group: 630Percent low income:Percent minority:Percent female: 42Percent limited English proficient(LEP): 100Percent overage for their grade: 70Percent special education students:
8Percent gifted/talented students: 1
Major Findings
TAP ACHIEVEMENT: The spring, 1991, Tests of Achievement and Proficiency (TAP)median percentile scores of program students were compared tothe 198d nationai norms.
Out of 8 comparisons, programstudents' scores were...
Reading MathematicsAbove the national norm in 0 0At the national norm in 0 0Below the national norm in 4 4
TAP scores from spring, 1991, were compared to predicted levelsof achievement by means of the Report on Program Effectiveness (ROPE)procedure.
Out of 16 comparisons, programstudents' scores...
Reading Mathematics Language Work StudyExceeded predicted levels in 0 0 0 0Achieved predicted levels in 0 0 0 0Were below predicted levels in 0 0 0 0Were too few for analysis in 4 4 4 4
TAAS ACHIEVEMENT: Compared to the AISD averages in mathematics,reading, and writing, the percentages of program students masteringthe TAAS at grades 9 and 11 (first-time test takers) were:
Reading Mathematics Writing All Tests TakenHigher in 0 0 0 0The same in 0 0 0 0Lower in 2 2 2 2
Compared with the percentage of all
Academic Mastery (all tests taken)Academic Recognition (all 3 tests)
AISD senior high students mastering all tests:
The program AISD Programrate was...
Lower 51% 7%Lower 2% 0%
Compared with the percentage of senior high school students statewidemastering all three tests at the academic recognition level:
The program State Programrate was 444Lower 2% 0%
5 35 7

90.39
ATTENDANCE: Compared with the attendance rates for senior highdistrictwide:
Fall, 1990Spring, 1991
Compared to...
Progrgm studentsin 1989-90
The programrate was...LowerLower
AISO Program
3811 RR1990-91 program attendance was...
Fall: LowerSpring: Lower
DISCIPLINE: Compared with the percentages of students involved indiscipline incidents at the senior high level districtwide:
The program AISO Programrate was...
Fall, 1990 Higher 4.1% 5.9%Spring, 1991 Lower 4.2% 3.3%
Compared to... 1990-91 program discipline was...
Progrgm students Fall: Higherin 1989-90 Spring: Lower
GRADES: Compared with the GPA's for all AISO senior high students:
The program AISD Programrate was...
Fall, 1990 LowerSpring, 1991 Lower
80.379.5
1:,i.
Compared to... 1990-91 program GPA was...
Progrgm students Fall: Lowerin 1989-90 Spring: Lower
RETAINEES/DROPOUTS: Comparing the percentage of program studentsrecommended in spring, 1991, for retention the following year withall AISD senior high students:
The program AISD Programrate was...
Higher 20.8% 36.7%
Compared to the sixth six weeks dropout rate for senior high studentsfor 1990-91:
The programrate was...
Lower
AISO Program
9.7% 5.4%
Compared with the percentage of program students predicted to drop out:
The obtained Predicted Obtainedrate was...
Lower 7.3% 0.3%
As a percentage of the dropout rate predicted for these students:
The program ratp was... Meaning that...Less than 100; The program did better
than anticipated
File name:GE@LEPS3
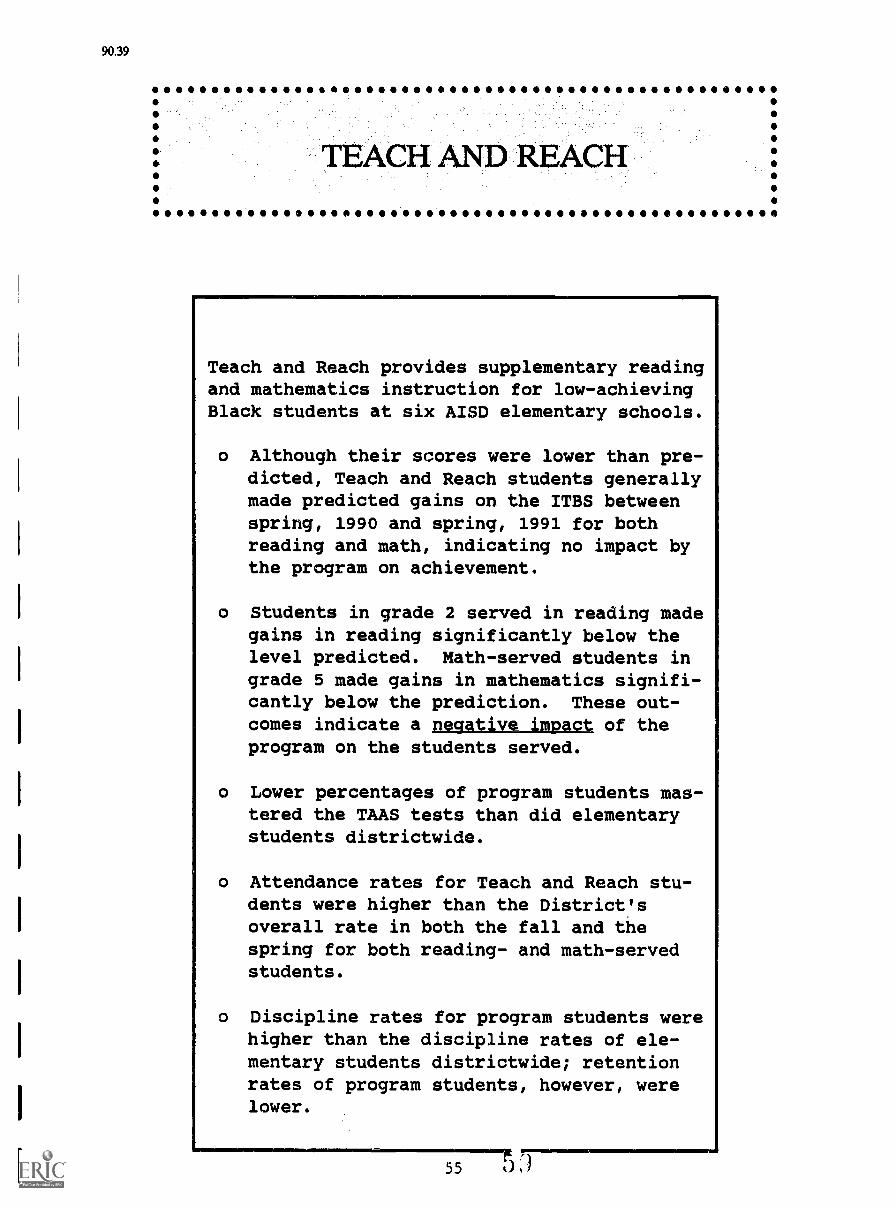
90.39
600OOOOOOOOO000006000116064060060IOSOOOOOOOOOO00001011
TEACH AND REACH00*Teach and Reach provides supplementary readingand mathematics instruction for low-achievingBlack students at six AISD elementary schools.
o Although their scores were lower than pre-dicted, Teach and Reach students generallymade predicted gains on the ITBS betweenspring, 1990 and spring, 1991 for bothreading and math, indicating no impact bythe program on achievement.
o Students in grade 2 served in reading madegains in reading significantly below thelevel predicted. Math-served students ingrade 5 made gains in mathematics signifi-cantly below the prediction. These out-comes indicate a mative impact of theprogram on the students served.
o Lower percentages of program students mas-tered the TAAS tests than did elementarystudents districtwide.
o Attendance rates for Teach and Reach stu-dents were higher than the District'soverall rate in both the fall and thespring for both reading- and math-servedstudents.
o Discipline rates for program students werehigher than the discipline rates of ele-mentary students districtwide; retentionrates of program students, however, werelower.
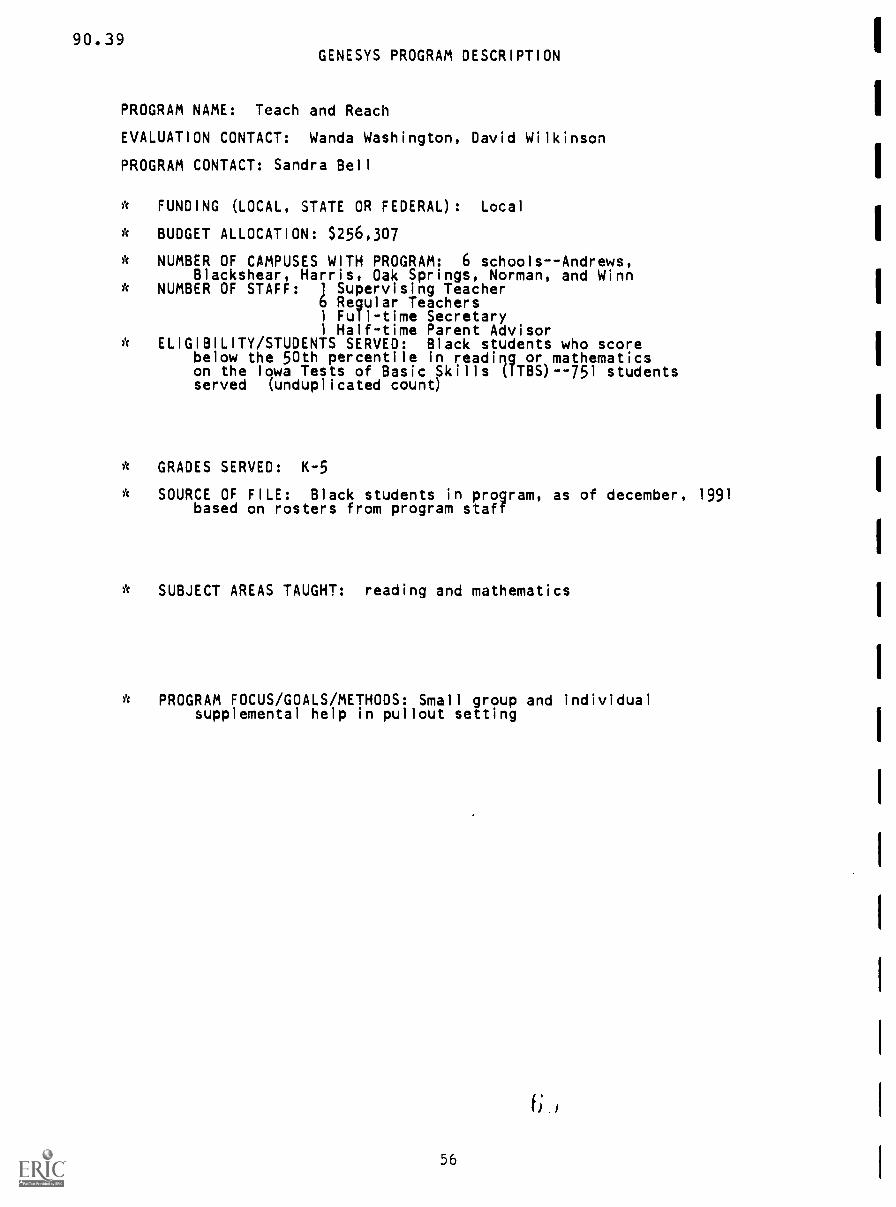
90.39GENESYS PROGRAM DESCRIPTION
PROGRAM NAME: Teach and Reach
EVALUATION CONTACT: Wanda Washington, David Wilkinson
PROGRAM CONTACT: Sandra Bell
FUNDING (LOCAL, STATE OR FEDERAL) : Local
BUDGET ALLOCATION: $256,307
NUMBER OF CAMPUSES WITH PROGRAM: 6 schools--Andrews,Blackshear, Harris, Oak Springs, Norman, and Winn
NUMBER OF STAFF: 1 Supervising Teacher6 Regular Teachers1 Full-time Secretary1 Half-time Parent Advisor
ELIGIBILITY/STUDENTS SERVED: Black students who scorebelow the 50th percentile in reading or mathematicson the Iowa Tests of Basic Skills (ITBS)--751 studentsserved (unduplicated count)
* GRADES SERVED: K-5
* SOURCE OF FILE: Black students in program, as of december, 1991based on rosters from program staff
*
SUBJECT AREAS TAUGHT: reading and mathematics
PROGRAM FOCUS/GOALS/METHODS: Small group and individualsupplemental help in pullout setting

90.39
AUSTIN INDEPENDENT SCHOOL DISTRICT
GENESYS DEPARTMENT OF MANAGEMENT INFORMATION EVALUATION:OFFICE OF RESEARCH AND EVALUATION iUMNIARY
GENeric Evaluation SYS tem
PROGRAM/GROUP: TEACH AND REACH, READING SERVED, 1990-91 PRINT DATE: 07/30/91
.
,
''' DEMOGRAPHIC INDICATORS
Grade PK K 1 2 3 4 5 6 7 8 8 10 11 12 TOTAL
# Students: 2 20 3 98 126 203 199 1 678
Sex Ethnicity Low Overage Special Gifted/
Male Female . Black Hispanic Other Income LEP For Grade Education Talented
/0 312 341 515 109 29 519 11 142 47 86
% 48 52 79 17 4 79 2 22 7 13
.
PROGRESS INDICATORS
Attendance Disciplined
Fall Spring Fall Spring
90-91 /0 649 629 5 6
% 96.8 95.9 0.7 0.9
89-90 /0 604 608 0 4
% 96.6 95.8 0.0 0.6
Credits # F's # No Grades GPA
Fall Spring Fall Spring Fall Spring Fall Spring
#AVG
#
AVGN
DROPOUTS N/ARETAINEES
5th 0 Weeks: October: End of Year: 0.3 Beginning of Year:
1991 1991 SPRING. 1991 FALL, 1991
PREDICTED and OBTAINED 1990-91 DROPOUT RATES
Obtained
Numbr of Predicted Dropouts Obtained Dropouts as a % of
Students # Rat # Rat Predicted
Fall, i990
Spring, 1991
Annual, 1991
---------
Definitions:
The PREDICTED DROPOUT RATE for a program/group
student in the group divided by the number
The DROPOUT RISK PROBABILITY for a student
menbership in one of 22 different risk
is the sum of the drobout risk_probability for each
of students in the group (N).
is based on the risk factor associated with the student's
cateaories. (The risk categories are detailed in the current
GENESYS report.)
The RISK FACTOR for a given risk cateaorv is the percentage of students in that risk category who
dropped out. Expressed as a rat, the risk factor is a two decimal-place numeral. For example.
if 46.75% of the students in a particular risk category dropped out, the risk factor for a student
in that category would be 45.75.
The OBTAINED DROPOUT RATE for a program/group is the actual percentage of students who dropped out.
The OBTAINED AS A % OF PREDICTED statistic is calculated by dividing the predicted rate by the
obtained rate and multiplying by lop.
CONTINUED ON PAGE 2
57
61
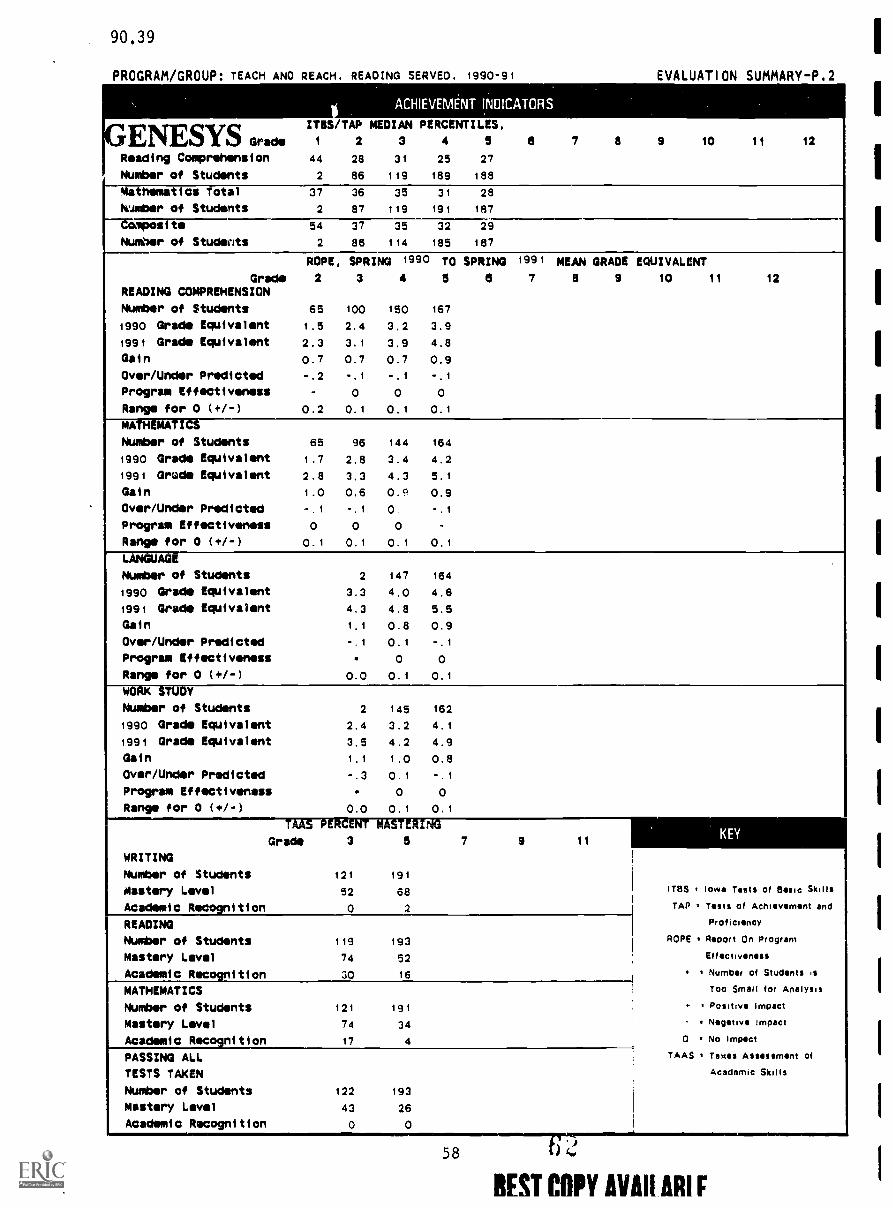
90.39
PROGRAM/GROUP: TEACH ANO REACH, READING SERVED, 1990-91 EVALUATION SUMMARY-P.2
ACHIEVEMENT INDICATORS
GENESYS Grade
Reading Comprehension
Number of Students
ITBS/TAP MEDIAN PERCENTILES.
1 2 3 4 5 6 7 8 9 10 11 12
44 28 31 25 27
2 as 119 189
Mathematics Total 37 36 35 31
Number of Students 2 87 119 191
28
157
Composite 54 37 35 32
Number of Studeots 2 86 114 185
29
187
ROPE, SPRING 1990 TO SPRING 1991 MEAN GRADE EQUIVALENT
Grade 2 3 4 5 5 7 a 9 10 11 12
READING COMPREHENSION
Number of Students 65 100 150 167
1990 Grade Equivalent 1.5 2.4 3.2 3.9
1991 Grade Equivalent 2.3 3.1 3.9 4.8
Gain 0.7 0.7 0.7 0.9
Over/Under Predicted -.2 -.1 -.1 -.1
Program Effectiveness - o o o
Range for 0 (+/-) 0.2 0.1 0.1 0.1
MATHEMATICS
Number of Students 65 96 144 164
1990 Grade Equivalent 1.7 2.8 3.4 4.2
1991 Grade Equivalent 2.8 3.3 4.3 5.1
Gain 1.0 0.6 09 0.9
Over/Under Predicted -.1 -.1 O. -.1
Program Effectiveness 0 0 0 -
Range for 0 (+/-) 0.1 0.1 0.1 0.1
LANGUAGE
Number of Students 2 147 164
1990 Grade Equivalent 3.3 4.0 4.6
1991 Grade Equivalent 4.3 4.8 5.5
Galn 1.1 0.8 0.9
Over/Under Predicted -.1 0.1 -.1
Program Effectiveness 0 0
Range for 0 (+/-) 0.0 0.1 0.1
WORK STUDY
Number of Students 2 145 162
1990 Grade Equivalent 2.4 3.2 4.1
1991 Grade Equivalent 3.5 4.2 4.9
Gain 1.1 1.0 0.8
Over/Under Predicted -.3 0.1 -.1
Program Effectiveness 0 0
Range for 0 (+/-) 0.0 0.1 0.1
TAAS PERCENT MASTERING ..
Grade 3 5 7 9 11KEY
WRITING
Number of Students 121 191
Mastery Level 52 68 inn Iowa Tests of Basic Skills
Academic Recognition o 2 TAP Tests of Achievement and
READING Prof icioncy
Number of Students 119 193 ROPE Report On Program
Mastery Level 74 52 Eff activeness
Academic Recognition 30 16 Number of Students is
MATHEMATICS Too Small for Analysis
Number of Students 121 191 Positive Impact
Mastery Level 74 34 Negative impact
Academic Recognition 17 4 0 No Impact
PASSING ALL TAAS Texas Assessment of
TESTS TAKEN Academic Skills
Number of Students 122 193
Mastery Level 43 26
Academic Recognition 0 0 -----.58
REST COPY AVAII ARI F
1
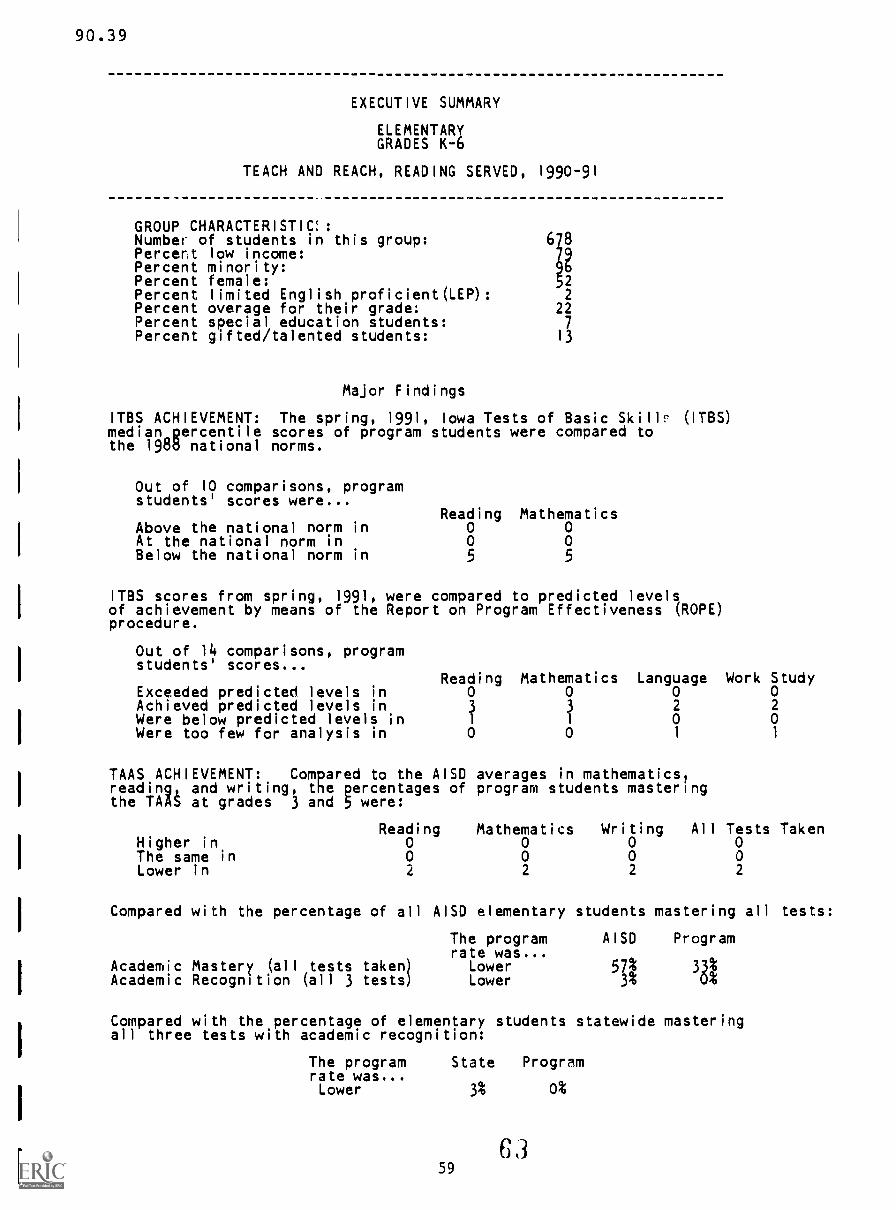
90.39
EXECUTIVE SUMMARY
ELEMENTARYGRADES K-6
TEACH AND REACH, READING SERVED, 1990-91
GROUP CHARACTERISTIC!:Number of students in this group: 678Percent low income: 72Percent minority:
?Percent female: 2
Percent limited English proficient(LEP): 2Percent overage for their grade: 22Percent special education students: 7Percent gifted/talented students: 13
Major Findings
ITBS ACHIEVEMENT: The spring, 1991, Iowa Tests of Basic Skillr (ITBS)median percentile scores of program students were compared tothe 198d national norms.
Out of 10 comparisons, programstudents' scores were...
Reading MathematicsAbove the national norm in 0 0At the national norm in 0 0Below the national norm in 5 5
ITBS scores from spring, 1991, were compared to predicted levelsof achievement by means of the Report on Program Effectiveness (ROPE)procedure.
Out of 14 comparisons, programstudents' scores...
Reading Mathematics Language Work StudyExceeded predicted levels in 0 0 0 0Achieved predicted levels in 3Were below predicted levels in 1
2 2
0 0Were too few for analysis in 0 0 1 1
TAAS ACHIEVEMENT: Compared to the AISO averages in mathematics,reading, and writing, the percentages of program students masteringthe TAAS at grades 3 and 5 were:
Reading Mathematics Writing All Tests TakenHigher in 0 0 0 0The same in 0 0 0 0Lower in 2 2 2 2
Compared with the percentage of all AISO elementary students mastering all tests:
The program AISO Programrate was...
Academic Mastery (all tests taken) Lower 57% 33%Academic Recognition (all 3 tests) Lower 3% u%
Compared with the percentage of elementary students statewide masteringall three tests with academic recognition:
The program State Programrate was...Lower 3% 0%
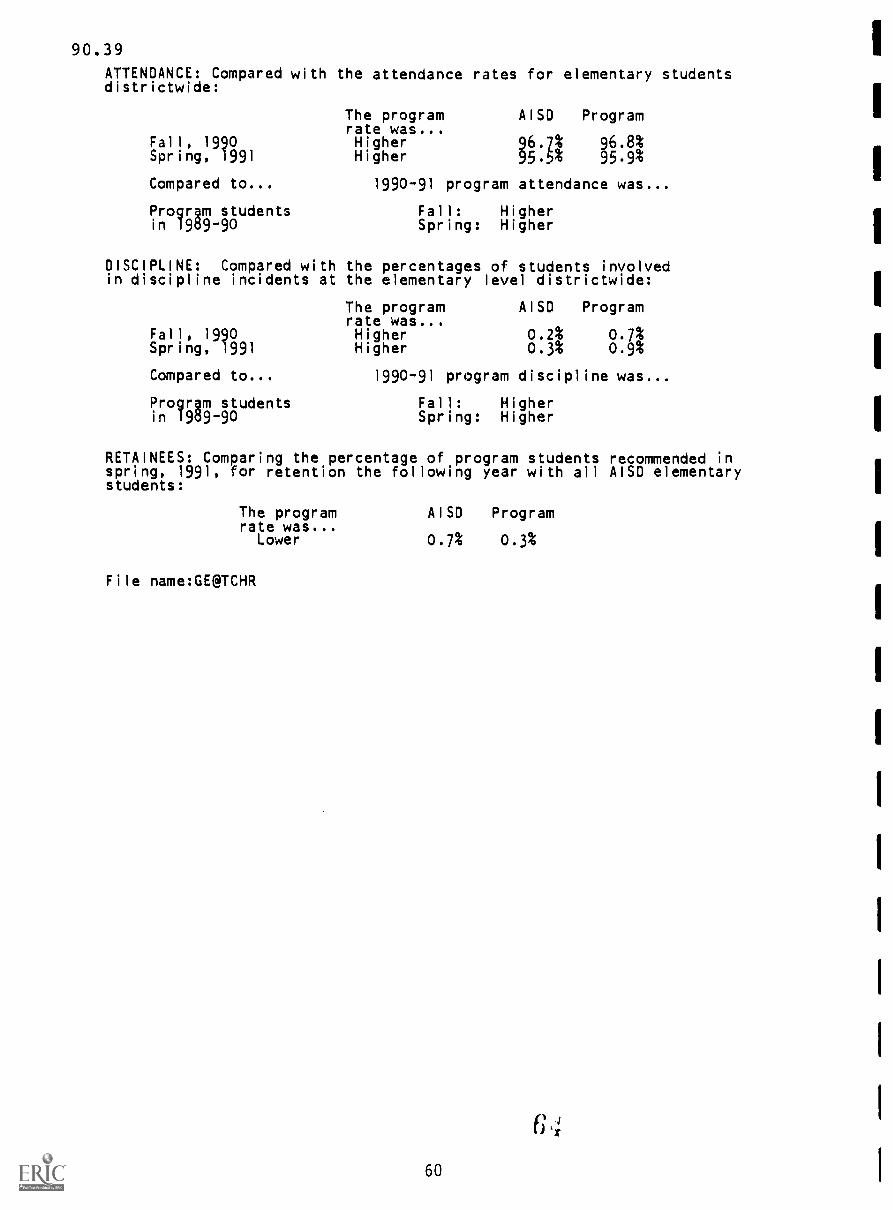
90.3 9
ATTENDANCE: Compared with the attendance rates for elementary studentsdistrictwide:
Fall, 1990Spring, 1991
Compared to...
Progrgm studentsin 1989-90
The program AISD Programrate was...Higher 96.7% 96.8%Higher 95.5% 95.9%
1990-91 program attendance was...
Fall: HigherSpring: Higher
DISCIPLINE: Compared with the percentages of students involvedin discipline incidents at the elementary level districtwide:
The program AISO Programrate was...
Fall, 1990 Higher 0.2% 0.7%Spring, 1991 Higher 0.3% 0.9%
Compared to... 1990-91 program discipline was...
Progrgm students Fall: Higherin 1989-90 Spring: Higher
RETAINEES: Comparing the percentage of program students recommended inspring, 1991, for retention the following year with all AISD elementarystudents:
The programrate was...
Lower
File name:GE@TCHR
AISD Program
0.7% 0.3%
60
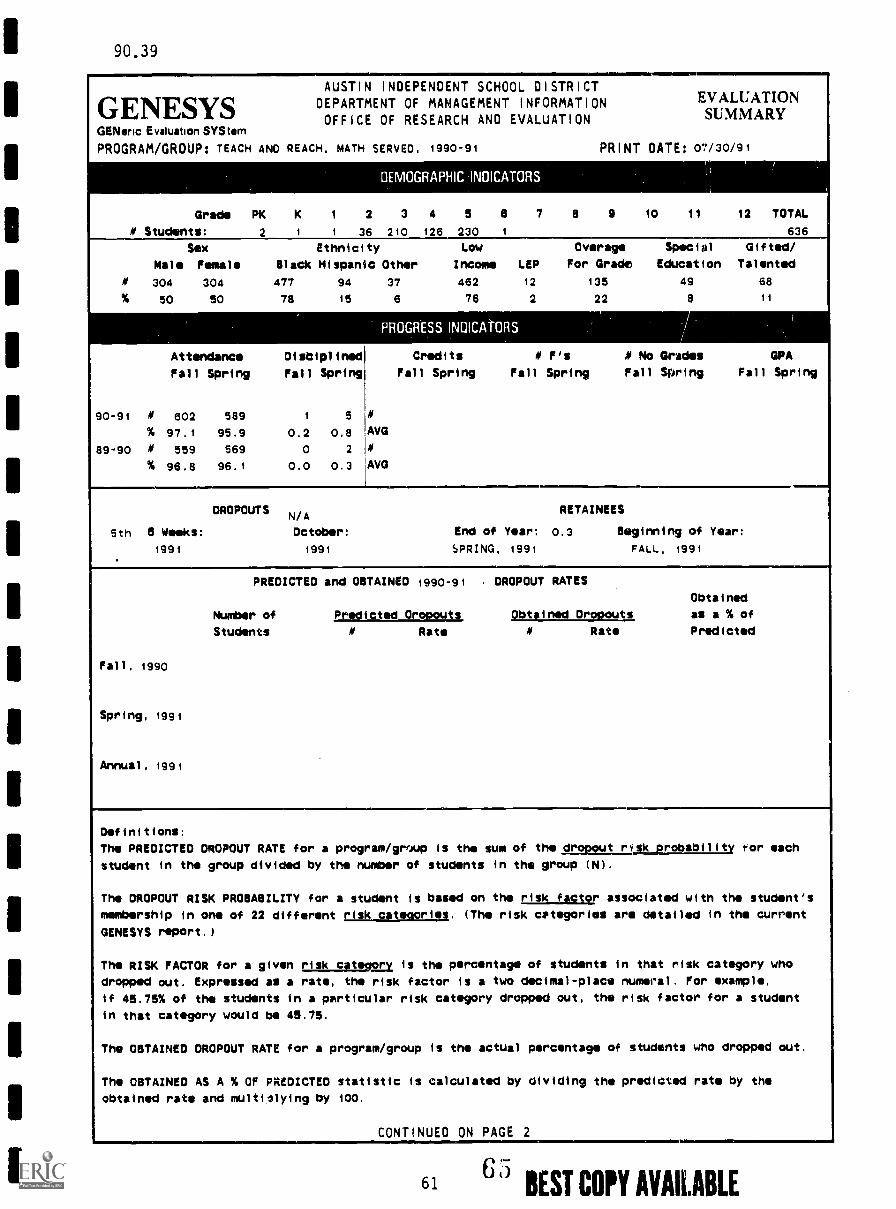
90.39
AUSTIN INDEPENDENT SCHOOL DISTRICT
GENESYS DEPARTMENT OF MAMAGEMENT INFORMATION EVALUATIONOFFICE OF RESEARCH AND EVALUATION SUMMARY
GENeric Evaluation SYStemPROGRAM/GROUP: TEACH AND REACH, MATH SERVED, 1990-91 PRINT DATE: 07/30/91
DEMOGRAPHIC INOICATORS
Grade PK K 1 2 3 4 5 8 7 8 9 10 11 12 TOTAL
# Students: 2 1 1 36 210 126 230 1 636
Sex Ethnicity
Male Female Black Hispanic
# 304 304 477 94
% 50 50 78 15
'
Attendance Disciplined
Fall Spring Fall Spring
90-91 # 602 589 1 s
% 97.1 95.9 0.2 0.8
89-90 # 559 569 o 2
% 96.8 96.1 0.0 0.3
Low Overage Special Gifted/
Other Income LEP For Grade Education Talented
37 462 12 135 49 68
6 76 2 22 8 11
)
PROGRESS INOICATORS
Credits # F's # No Grades GPA
Fall Spring Fall Spring Fall Spring Fall Spring
#
AVG
#
AVG
DROPOUTS N/ARETAINEES
5th a Weeks: October: End of Year: 0.3 Beginning of Year:
1991 1991 SPRING, 1991 FALL, 1991
PREDICTED and OBTAINED 1990-91 . DROPOUT RATES
Obtained
Number of Predicted Dropouts Obtained Dropouts as a % of
Students # Rate # Rate Predicted
Fall, 1990
Spring, 1991
Annual, ig61
Definitions:
The PREDICTED DROPOUT RATE for a program/gmup
student in the group divided by the number
The DROPOUT RISK PROBABILITY for a student
membership in one of 22 different risk
is the sum of the dropout risk probability tor each
of students in the group (N).
is based on the risk factor associated with the student's
categories. (The risk categories are detailed in the current
GENESYS report.)
The RISK FACTOR for a given ujeLjEtwgra is the percentage of students in that risk category who
dropped out. Expressed as a rate, the risk factor is a two decimal-place numeral. For example,
if 45.75% of the students in a particular risk category dropped out, the risk factor for a student
in that category would be 45.75.
The OBTAINED DROPOUT RATE for a program/group is the actual percentage of students who dropped out.
The OBTAINED AS A % OF PREDICTED statistic is calculated by dividing the predicted rate by the
obtained rate and multi2lying by 100.
CONTINUED ON PAGE 2 ..---
6561 BEST COPY AVAILABLE

90.39
PROGRAM/GROUP: TEACH AND REACH. MATH SERVED. 1990-91 EVALUAT I ON SUMMARY-P.2
ACHIEVEMENT INDICATORS
GENESYS Grads
Reading Comprehension
Number of Students
ITBS/TAP MEDIAN PERCENTILES,
1 2 3 4 5 a 7 8 9 10 11 12
29 32 25 27
30 195 117 216
Mathematics fatal 39 35 25 27
Number of Students 31 196 119 215
Composite 39 37 31 26
Number of Students 30 190 115 215
ROPE, SPRING 1990 TO SPRING 1991 MEAN GRADE EQUIVALENT
Grade 2 3 4 5 6 7 8 9 10 11 12
READING COMPREHENSION
Number of Students 23 152 96 180
1990 Grade Equivalent 1.6 2.4 3.1 3.9
1991 Grade Equivalent 2.3 3.3 3.9 4.7
Gain 0.7 0.9 0.7 0.8
Over/Under Predicted -.2 0.1 0.0 -.1
Program Effectiveness 0 0 -
Range for 0 (+/-) 0.3 0.1 0.2 0.1
MATHEMATICS
Number of Students 24 148 90 176
1990 Grade Equivalent 1.8 2.8 3.3 4.2
1991 Grade Equivalent 2.9 3.5 4.2 5.1
Gain 1.0 0.7 0.9 0.8
Over/Under Predicted -.1 0.0 0.0 -.2
Program Effectiveness 0 0 -
Range for 0 (+/-) 0.2 0.1 0.1 0.1
L. r. AG
Number of Students 2 94 175
1990 Grade Equivalent 3.3 4.0 4.6
1991 Grade Equivalent 4.3 4.8 5.4
Gain 1.1
Over/Under Predicted -.1 0.1 -.2
Program Effectiveness 0 -
Range for 0 (+/-) 0.0 0.1 0.1
WORK STUDY.
Number of Students 2 92 176
1990 Grade Equivalent 2.4 3.1 4.1
1991 Grade Equivalent 3.5 4.2 4.8
Gain 1.1 1.0 0.8
Over/Under Predicted -.3 0.1 -.1
Program Effectiveness 0 -
Range for 0 (+/-) 0.0 0.1 0.1
TAAS PERCENT MASTERMr-------------
Grade 3 5 7 9 11KEY
WRITING
Number of Students 197 217
Mastery Level 55 61 ITBS lowa TOMS Of ea SIC Skills
Academic Rec.. ition 2 1TAP Tam of Achievement and
READING Pmficioncy
Number of Students 197 221 ROPE Allport On Program
Mastery Level 70 46 Effectiveness
Academic Recognition 32 13 Number of SIUSGrits IS
MATHEMATICS Too Small for Analysis
Number of Students 197 219 PO Wive Impact
Mastery Level 75 29 = Negative Impact
Academic Recognition 23 4 0 No impact
PASSING ALL TAAS Taxes Assessment of
TESTS TAKEN Academic Skills
Number of Students 199 222
Mastery Level 45 22
Academic Recognition 2 0
62
6 6 BEST COPY AVAILABLE
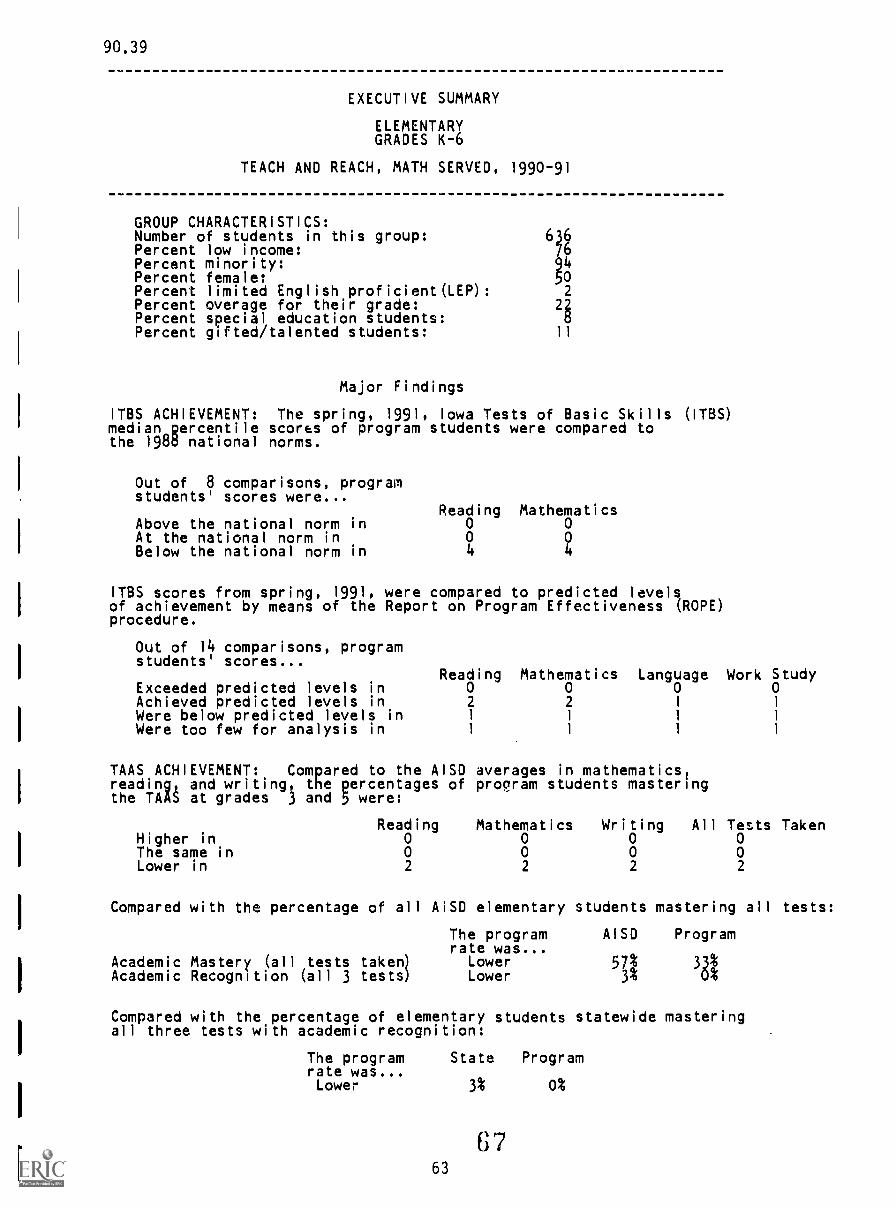
90.39
EXECUTIVE SUMMARY
ELEMENTARYGRADES K-6
TEACH AND REACH, MATH SERVED, 1990-91
GROUP CHARACTERISTICS:Number of students in this group: 64Percent low income:Percent minority:
PPercent female:Percent limited English proficient(LEP) : 2
Percent overage for their grade: 2iPercent special education students:Percent gifted/talented students: 11
Major Findings
ITBS ACHIEVEMENT: The spring, 1991, Iowa Tests of Basic Skills (ITBS)median percentile scores of program students were compared tothe 198b national norms.
Out of 8 comparisons, programstudents' scores were...
Reading MathematicsAbove the national norm in 0 0At the national norm in 0 0Below the national norm in 4 4
ITBS scores from spring, 1991, were compared to predicted levelsof achievement by means of the Report on Program Effectiveness (ROPE)procedure.
Out of 14 comparisons, programstudents' scores...
Reading Mathematics Language Work StudyExceeded predicted levels in 0 0 0 0Achieved predicted levels in 2 2 1 1
Were below predicted levels in 1 1 1 I
Were too few for analysis in 1 1 1 1
TAAS ACHIEVEMENT: Compared to the AISD averages in mathematics,reading, and writing, the percentages of program students masteringthe TAAS at grades 3 and 5 were:
Reading Mathematics Writing All Tests TakenHigher in 0 0 0 0The same in 0 0 0 0Lower in 2 2 2 2
Compared with the percentage of all AISD elementary students mastering all tests:
The program AISD Programrate was...
Academic Mastery (all tests taken) Lower 57%381Academic Recognition (all 3 tests) Lower 3%
Compared with the percentage of elementary students statewide masteringall three tests with academic recognition:
The program State Programrate was...Lower 3% 0%
6763
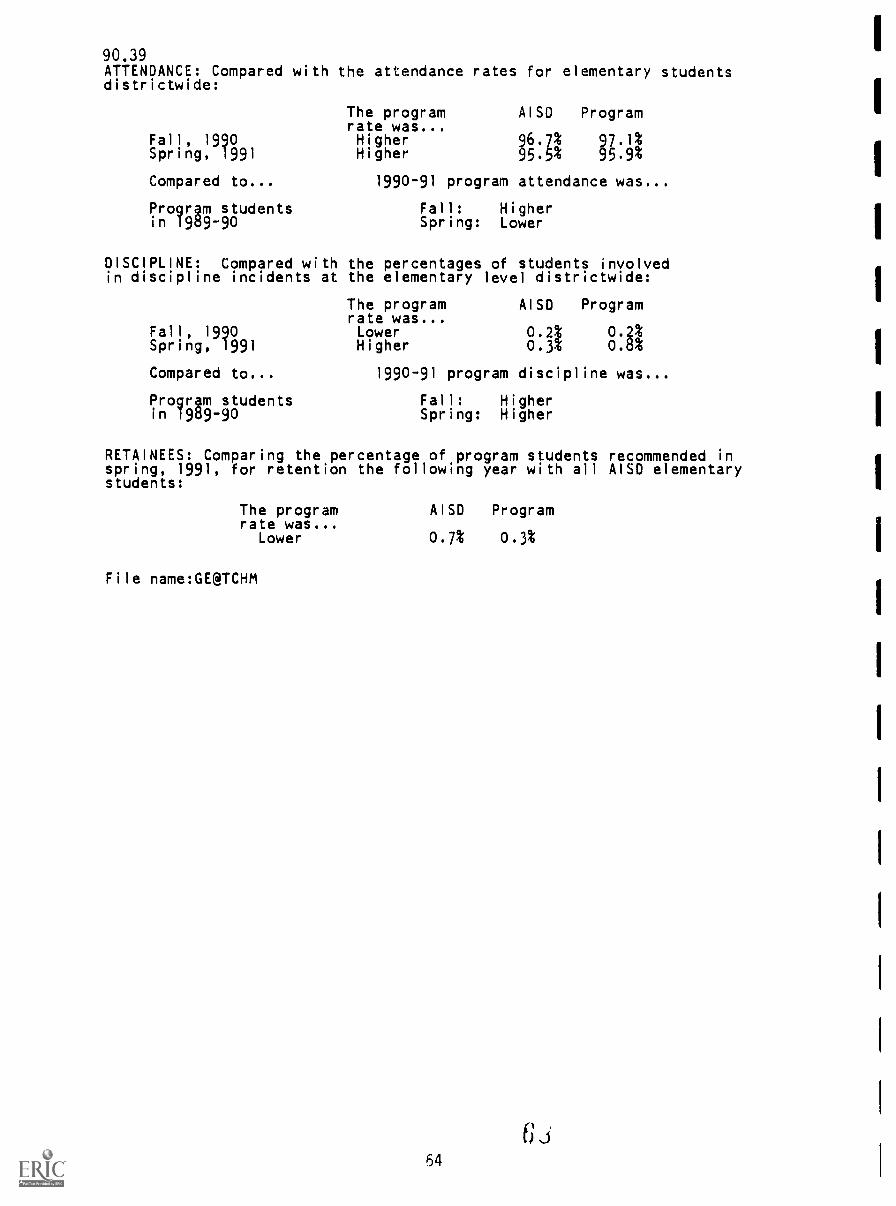
90.39ATTENDANCE: Compared with the attendance rates for elementary studentsdistrictwide:
Fall, 1990Spring, 1991
Compared to...
Progr4m studentsin 1969-90
The programrate was...HigherHigher
AISO Program
HI NA1990-91 program attendance was...
Fall: HigherSpring: Lower
DISCIPLINE: Compared with the percentages of students involvedin discipline incidents at the elementary level districtwide:
The program AISD Programrate was...
Fall, 1990 Lower 0.2%8:itSpring, 1991 Higher 0.3%
Compared to... 1990-91 program discipline was...
Progr§m students Fall: Higherin 1969-90 Spring: Higher
RETAINEES: Comparing the percentage of program students recommended inspring, 1991, for retention the following year with all AISD elementarystudents:
The programrate was...
Lower
File name:GE@TCHM
AISD Program
0.7% 0.3%
64
G.J
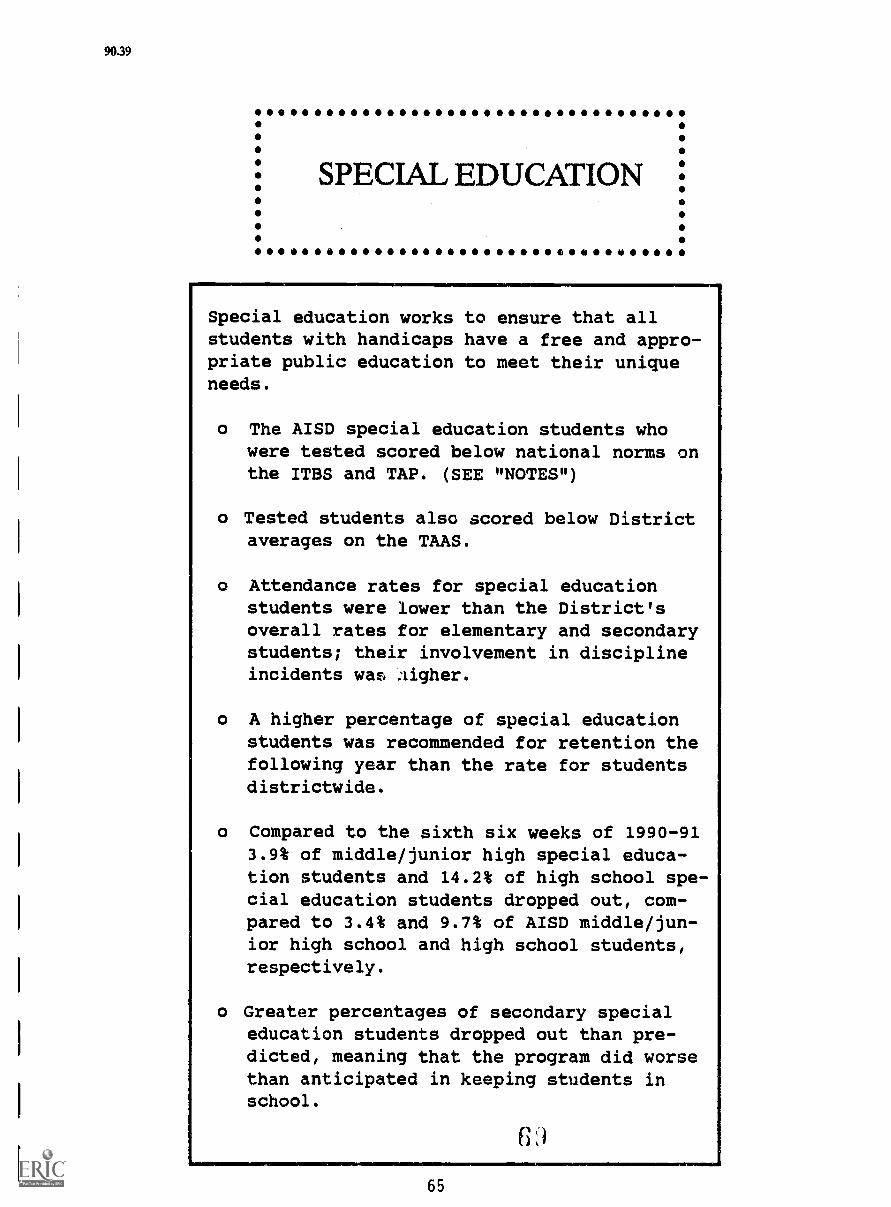
90.39
....................................
SPECIAL EDUCATION.. I o
Special education works to ensure that allstudents with handicaps have a free and appro-priate public education to meet their uniqueneeds.
o The AISD special education students whowere tested scored below national norms onthe ITBS and TAP. (SEE "NOTES")
o Tested students also scored below Districtaverages on the TAAS.
o Attendance rates for special educationstudents were lower than the District'soverall rates for elementary and secondarystudents; their involvement in disciplineincidents was aigher.
o A higher percentage of special educationstudents was recommended for retention thefollowing year than the rate for studentsdistrictwide.
o Compared to the sixth six weeks of 1990-913.9% of middle/junior high special educa-tion students and 14.2% of high school spe-cial education students dropped out, com-pared to 3.4% and 9.7% of AISD middle/jun-ior high school and high school students,respectively.
o Greater percentages of secondary specialeducation students dropped out than pre-dicted, meaning that the program did worsethan anticipated in keeping students inschool.
6;)
65
90.39
NOTES:
1. The student counts reported here reflect those specialeducation students in grades pre-K through 12 who wereactive as of the end of the first six-weeks period, theDistrict's "official" date for reporting many statisticsto the Texas Education Agency. Counts are thus point-in-time, rather than cumulative, which means that fewerstudents are shown as served than are actually servedover the course of the entire school year. Point-in-time counts, however, are a better reflection of thenumber of students served at any given time. EarlyChildhood (EC) students and infants served are notincluded in these counts.
2. The standardized test information about specialeducation students reported here shouid be treated withcaution. While special education students areencouraged to take standardized tests whenever they canbe validly tested, their participation is determined bytheir Admission, Review, and Dismissal (ARD) Committees.Not all special education students are tested, nor doall tested students take all tests.
In addition, the test scores of special educationstudents are excluded from median score computationsaccording to the following conditions:
o Grades 1-6 If served > 1 hour/dayo Grades 7-12 If served > 3 hours/day
Special education students were excluded from ROPEanalyses.
66

90.39GENESYS PROGRAM DESCRIPTION
PROGRAM NAME: Special Education
EVALUATION CONTACT: David Wilkinson
PROGRAM CONTACT: Sandy Kern, ElementaryZoe Griffith, Secondary
* FUNDING (LOCAL, STATE OR FEDERAL) : Local, State and Federal
* BUDGET ALLOCATION: $13,053,657
* NUMBER OF CAMPUSES WITH PROGRAM: All, plus special facilities
* NUMBER OF STAFF: 445 teachers, 263.5 teacher assistants on regularcampuses
* ELIGIBILITY/STUDENTS SERVED: Determined by Admission, Review,and Dismissal (ARD) Committees based on a comprehensiveassessment, per law and State Board of Education rules.
* GRADES SERVED: EC-12 (Ages birth-22)
* SOURCE Or; FILE: Centrally maintained Special Education ManagementSystem (SEMS) file; active students as of the end of the first sixweeks
* SUBJECT AREAS TAUGHT: All, or designated by the ARD's in students'individualized eduation plan (IEP's).
* PROGRAM FOCUS/GOALS/METHODS: Special education works to insurethat all children with handicaps have a free, appropriate publiceducation to meet their unique needs. Specially trained personnelprovide special education and related services as specified in theIEP, to enable each student with handicaps to acquire knowledgeand skills in the basic areas of learning commesurate with thestudent's needs and abilities.
7 A.
67
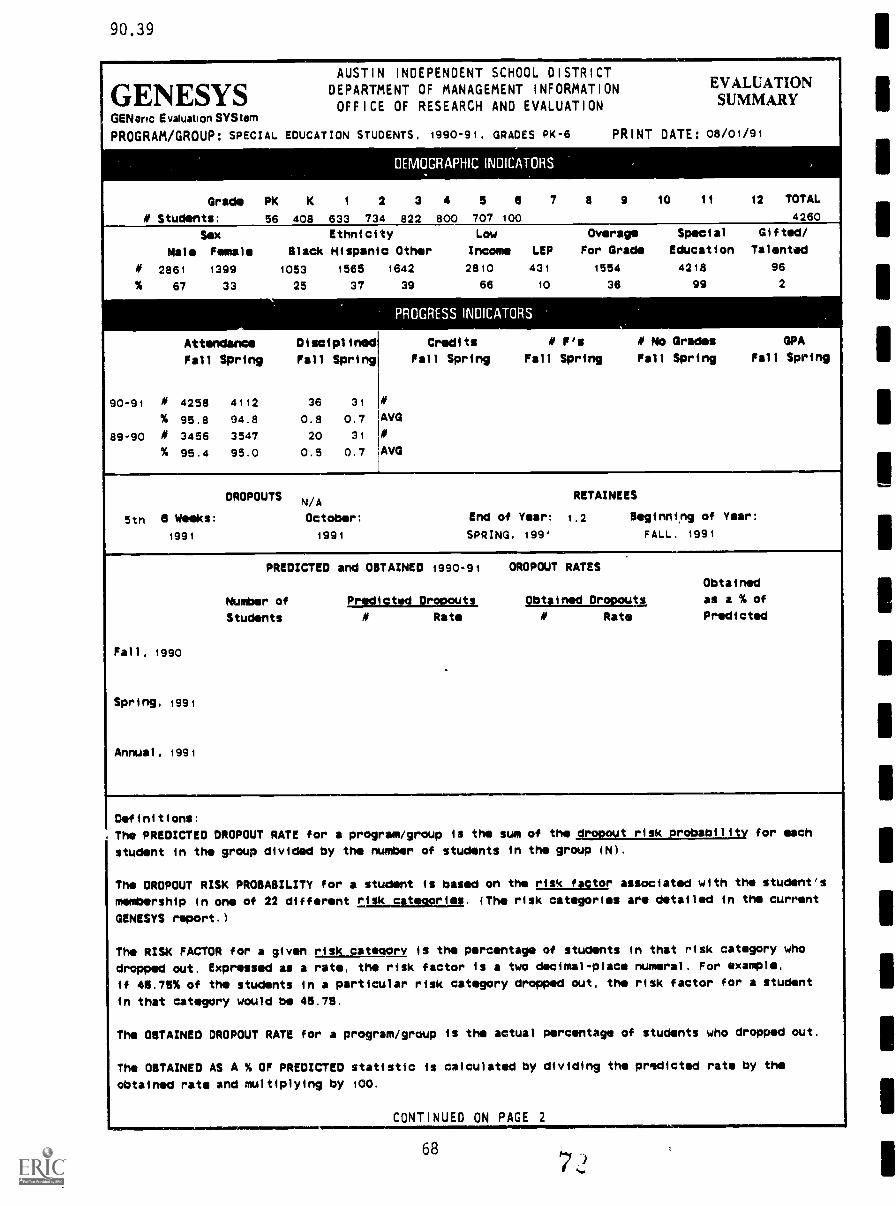
90.39
AUSTIN
GENESYS DEPARTMENT
OFFICEGENeric E valuation SYS tem
PROGRAM/GROUP: SPECIAL EDUCATION STUDENTS,
Grade PK K 1
# Students: 56 408 633 734
INDEPENDENT SCHOOL DISTRICTOF MANAGEMENT INFORMATION EVALUATION
OF RESEARCH AND EVALUATION SUMMARY
1990-91, GRADES PK-6 PRINT DATE: 08/01/91
DEMOGRAPHIC INOICATORS
2 3 4 5 0 7 8 9 10 11 12 TOTAL
822 800 707 100 4260
Sex Ethnicity
Male Femal Black Hispanic
# 2861 1399 1053 1565
% 67 33 25 37
Attendance Disciplined
Fall Spring Fall Spring
90-91 # 4258 4112 36 31
% 95.8 94.8 0.8 0.7
89-90 # 3456 3547 20 31
% 95.4 95.0 0.5 0.7
Low Overage Special Gifted/
Other Income LEP For Grade Education Talented
1642 2810 431 1554 4218 96
39 66 10 36 99 2
PROGRESSINOICATORS
Credits # F's # No Grades GPA
Fall Spring Fall Spring Fall Spring Fall Spring
#
AVG
#
AVG
OROPOUTS N/ARETAINEES
5th 0 Weeks: October: End of Year: 1.2 Beginnirg of Yar:
1991 1991 SPRING. 199 FALL, 1991
PREDICTED and OBTAINED 1990-91 DROPOUT RATES
Obtained
Number of Predicted Dropouts g_lia413t511NM2itl as a % of
Students # Rat # Rate Predicted
Fall, 1990
Spring, 1991
Annual, 1991
Definitions:
. The PREDICTED DROPOUT RATE for a program/group
student in the group divided by the number
The DROPOUT RISK PROBABILITY for a student
membership in one of 22 different tILLIALmtaki.
GENESYS report.)
The RISK FACTOR for a given risk cat_Orv
is the sum of the Aropout risk probability for ach
of students in the group (N).
is based on the risk factor associated with the student's
(The risk categoris are detailed in the current
is the percentage of students in that risk category who
dropped out. Expressed as a rate, tho risk factor is a two decimal-place numeral. For example,
if 45.75% of the students in a particular risk category dropped out, the risk factor for a student
in that category would be 45.75.
The OBTAINED DROPOUT RATE for a program/group is the actual percentage of students who dropped out.
The OBTAINED AS A % OF PREDICTED statistic is calculated by dividing the predicted rate by the
obtained rate and multiplying by 100.
CONTINUED ON PAGE 2
68
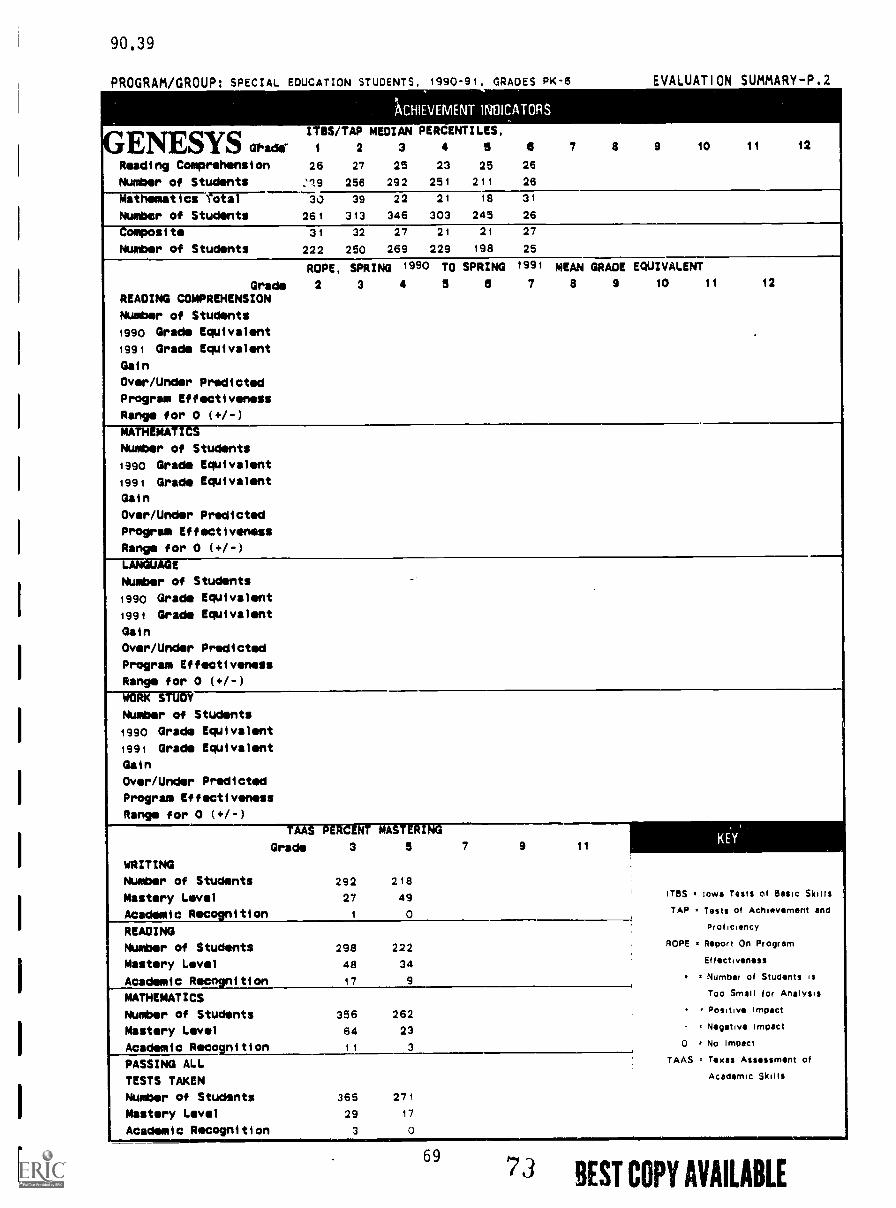
90.39
PROGRAM/GROUP: SPECIAL EDUCATION
OrliReading Comprehension
Number of Students
STUDENTS. 1990-91. GRADES PK-6
;!kCHIEVEMENT INDICATORS
ITIS/TAP MEDIAN PERCENTILES,
1 2 3 4 a a 7 8
26 27 25 23 25 26
:19 256 292 251 211 26
30 39 22 21 18 31
261 313 346 303 245 26
hVALUAIIUN Jr1MAKT-r.4
9 10 11 12
Mathematics laii---Number of Students
Composite 31 32 27 21 21 27
Number of Students 222 250 269 229 198 25
ROPE, SPRING 1990 TO SPRING 1991 MEAN GRADE EQUIVALENT
Grade 2 3 4 5 a 7 s s 10 11 12
READING COMPREHENSION
Number of Students
1990 Grade Equivalent
1991 Grade Equivalent
Gain
Over/Under Predicted
Program Effectiveness
Range for 0 (+/-)
MATH MATIC
Number of Students
1990 Grade Equivalent
1991 Grads Equivalent
Gain
Over/Under Predicted
Program Effectiveness
Range for 0 (+/-)WTIT rE
Number of Students
1990 Grade Equivalent
1991 Grade Equivalent
Gain
Over/Under Predicted
Program Effectiveness
Range for 0 (+/-)
WORK STUDY
Number of Students
1990 Grade Equivalent
1991 Grade Equivalent
Gain
Over/Under Predicted
Program Effectiveness
Range for 0 (+/-)
T ENI . i
Grade 3 s 7 9 11KEY
WRITING
Number of Students 292 218
Mastery Level 27 49 ITBS a Iowa Tests of Basic Skills
Academic Recognition 1 0 TAP Tests of Achievement and
READING Proficiency
Number of Students 298 222 ROPE Report On Program
Mastery Level 48 34 Effectiveness
Academic Recognition 17 9, Number of Students is
Too Small for AnalysisMATHEMATICS
Number of Students 356 262 Positive Impact
Mastery Level 64 23 Negative Impact
Academic Recognition 11 30 * No Impact
PASSING ALL TAAS = Texas Assessment of
TESTS TAKEN Academic Skills
Number of Students 365 271
Mastery Level 29 17
Academic Recognition 3 0
69
73 BEST COPY AVAILABLE

90.39
EXECUTIVE SUMMARY
ELEMENTARYGRADES PK-6
SPECIAL EDUCATION STUDENTS, 1990-91, GRADES PK-6
GROUP CHARACTERISTICS:Number of students in this group: 4260Percent low income: 66Percent minority: 61Percent female:Percent limited English proficient(LEP): qPercent overage for their grade:Percent special education students: il
Percent gifted/talented students:
Major Findings
ITBS ACHIEVEMENT: The spring, 1991, Iowa Tests of Basic Skills (1TBS)median gercentile scores of program students were compared tothe 198d national norms.
Out of 12 comparisons, programstudents' scores were...
Reading MathematicsAbove the national norm in 0 0At the national norm in 0 0Below the national norm in 6 6
1TBS scores from spring, 1991, were compared to predicted levelsof achievement by means of the Report on Program Effectiveness (ROPE)procedure.
Out of 16 comparisons, programstudents' scores...
Reading Mathematics Language Work StudyExceeded predicted levels in 0 0 0 0Achieved predicted levels in 0 0 0 0Were below predicted levels in 2 2 0 0Were too few for analysis in 3 3 3 3
TAAS ACHIEVEMENT: Compared to the AISD averages in mathematics,reading, and writing, the percentages of program students masteringthe TAAS at grades 3 and 5 were:
Reading Mathematics Writing All Tests TakenHigher in 0 0 0 0The same in 0 0 0 0Lower in 2 2 2 2
Compared with the percentage of all
Academic Mastery (all tests taken)Academic Recognition (all 3 tests)
RISC) elementary students mastering all tests:
The program A1SD Programrate was...
Lower 571 214Lower 34, o%
Compared with the percentage of elementary students statewide masteringall three tests with academic recognition:
The program State Programrate was...Lower 3% 0%
70 74
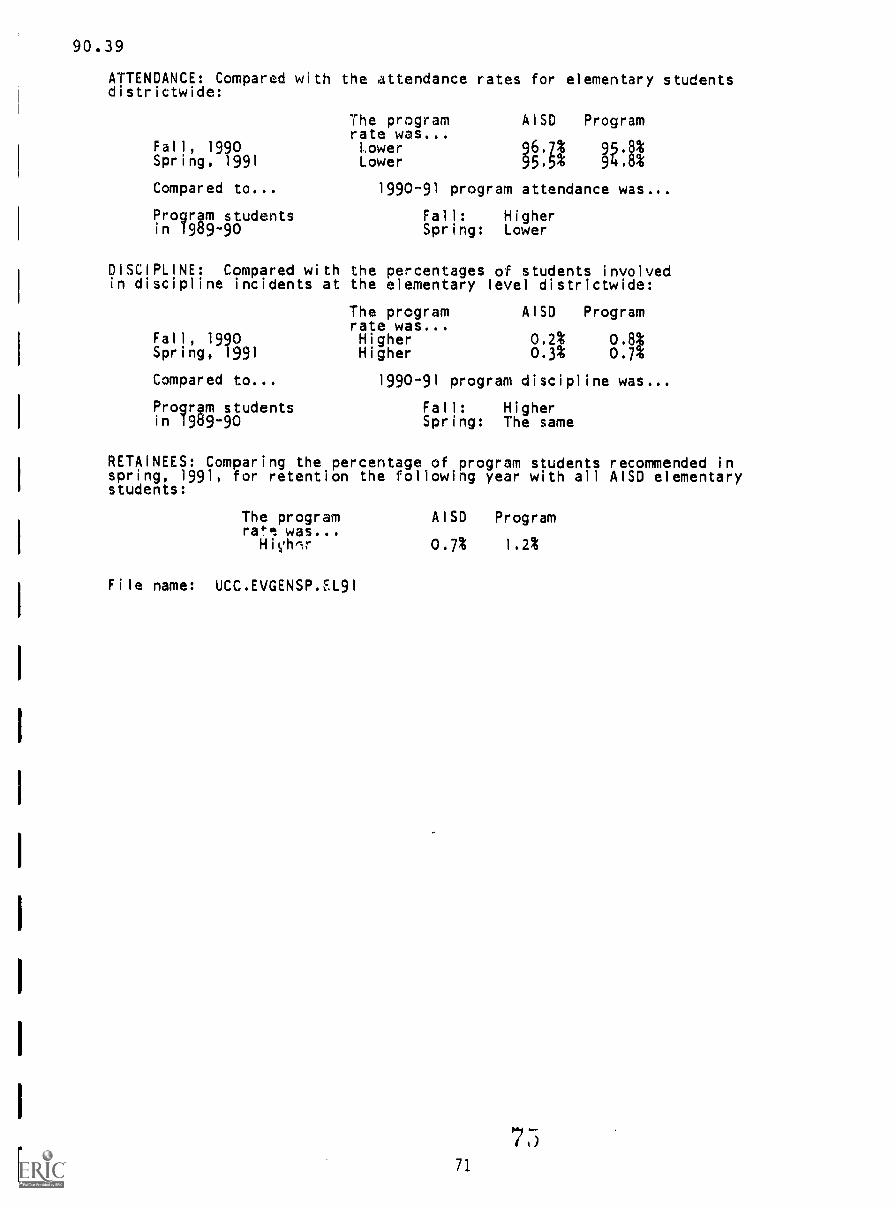
90.39
ATTENDANCE: Compared with the attendance rates for elementary studentsdistrictwide:
Fall, 1990Spring, 1991
Compared to...
Progrgm studentsin 1989-90
The programrate was...LowerLower
AISD Program
;Mt1990-91 program attendance was...
Fall: HigherSpring: Lower
DISCIPLINE: Compared with the percentages of students involvedin discipline incidents at the elementary level districtwide:
The program AISO Programrate was...
Fall, 1990 Higher 0.2% 0.8%Spring, 1991 Higher 0.3% 0.7%
Compared to... 1990-91 program discipline was...
Progrgm students Fall: Higherin 1989-90 Spring: The same
RETAINEES: Comparing the percentage of program students recommended inspring, 1991, for retention the following year with all AISD elementarystudents:
The programret was...
Hivhnr
File name: UCC.EVGENSP.EL91
AISD Program
0.7% 1.2%
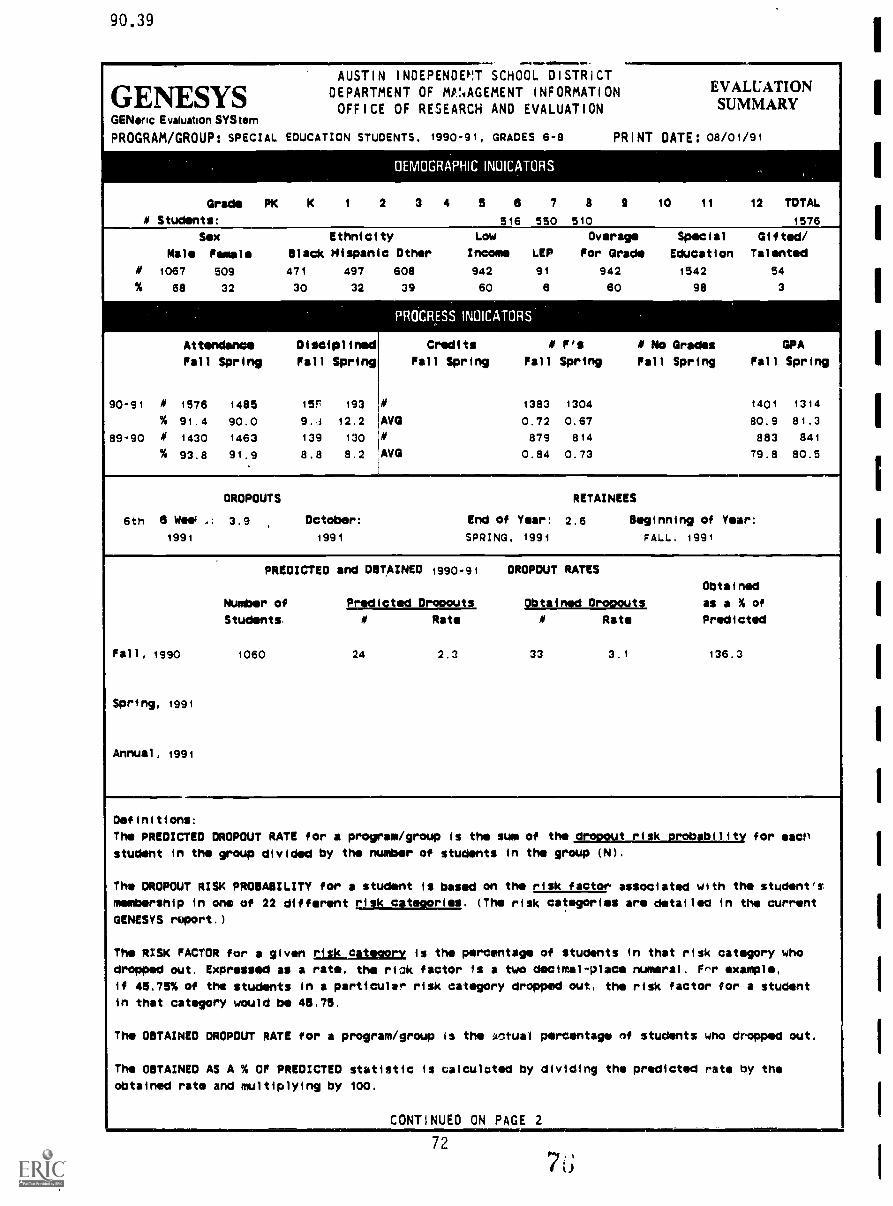
90.39
GENESYSGENeric Evaluation SYStem
PROGRAM/GROUP: SPECIAL EDUCATION STUDENTS, 1990-91, GRADES 6-8
.11M.1111111111 11.11,
AUSTIN INDEPENOPT SCHOOL DISTRICTDEPARTMENT OF MANAGEMENT INFORMATIONOFFICE OF RESEARCH AND EVALUATION
EVALUATIONSUMMARY
PRINT DATE: 08/01/91
OEMOGRAPHIC INOICATORS
Grade PK K 1 2 3 4 5 81 7 8 2 10 11 12 TOTAL
1576M Students:
Sex
Male Female
516 550 510
Ethnicity
Black Hispanic Other
Low Overage
Income LEP For Grade
942
60
0 1067 509 471 497 608 942 91
% 68 32 30 32 39 60 6
90-91
89-90
PROGRESS 1NMCATORS
Attendance
Fall Spring
Disciplined
Fall Spring
Credits
Fall Spring Fall
M 1576 1485 15r 193 1383
% 91.4 90.0 9 i 12.2 AVG 0.72
M 1430 1463 139 130 879
% 93.8 91.9 8.8 8.2 AVG 0.84
DROPOUTS
6th el wet ,; 3.9 October:
1991 1991
F's
Spring
1304
0.67
814
0.73
Special Gifted/
Education Talented
1542 54
98 3
No Grades
Fall Spring
GPA
Fall Spring
14,01 1314
80.9 81.3
883 841
79.8 80.5
RETAINEES
End of Year: 2.6
SPRING, 1991
Beginning of Year:
FALL. 1991
PREDICTED and OBTAINED 1990-91
Number of
Students.
Fall, 1990 1060
Spring, 1991
Annual, 1991
DROPOUT RATES
Predicted Dropouts Obtained Dropouts
Rate
24 2.3 33
Obtained
as a % of
Rate Predicted
3.1 136.3
Definitions:
The PREDICTED DROPOUT RATE for a program/group is the sum of the dropout risk probability for eactl
student in the group divided by the number of students in the group (N).
The DROPOUT RISK PROBABILITY for a student is based on the risk factor associated with the student's
membership in one of 22 different EllijcaImnig. (The risk categories are detailed in the current
GENESYS report.)
The RISK FACTOR far a given ELguattori is the percentage of students in that risk category who
dropped out. Expressed as a rate, the Mak factor is a two decimal-place numeral. Frr example,
if 45.75% of the students in a particular risk category dropped out, the risk factor for a student
in that category would be 45.75.
The OBTAINED DROPOUT RATE for a program/group is the mitual percentage af students who dropped out.
The OBTAINED AS A % OF PREDICTED statistic is calculated by dividing the predicted rate by the
obtained rate and multiplying by 100.
CONTINUED ON PAGE 2
72
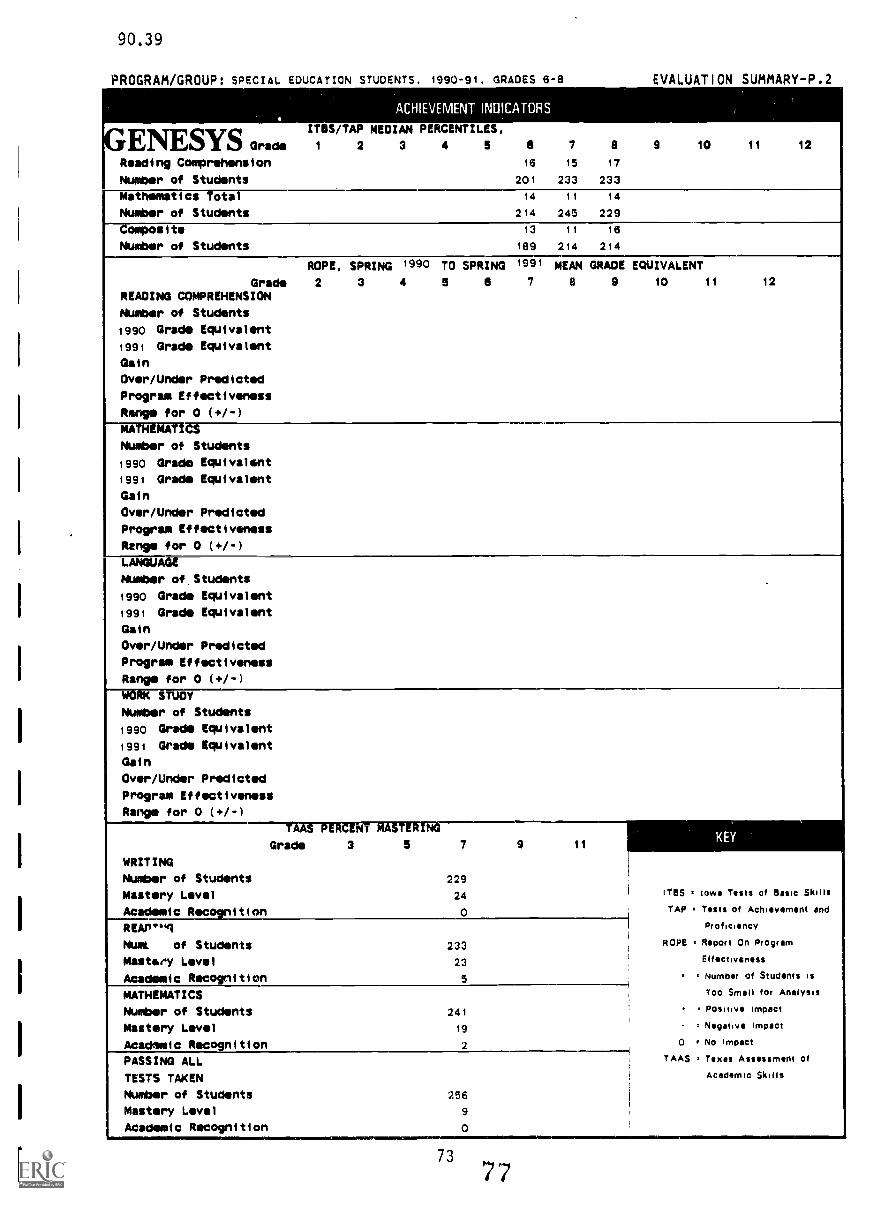
90.39
PROGRAM/GROUP: SPECIAL EDUCATION STUDENTS, 1990-91, GRADES 6-8
GENESYS Grad.Reading Comprehension
Number of Students
ACHIEVEMENT INDICATORS
ITOS/TAP MEDIAN PERCENTILES,
1 2 3 4 5 6
16
201
EVALUATION SUMMARY-P.2
7 a 9 10 11 12
15 17
233 233
Mathematics Total
Number of Students
14
214
11
245
14
229
Composite
Number of Students
13
189
11
214
16
214
ROPE, SPRING 1990 TO SPRING
Grade 2 3 4 5 a
READING COMPREHENSION
Number of Students
1990 Grade Equivalent
1991 Grade Equivalent
Gain
Over/Under Predicted
Program Effectiveness
Range for 0 (+1-)
1991
7
MEAN GRADE EQUIVALENT
a 9 10 11 12
--RATREKTIcsNumber of Students
1990 Grade Equivalent
1991 Grade Equivalent
Gain
Over/Under Predicted
Program Effectiveness
Ringo for 0 (+/-)
LANGUAGE
Number of.Students
i990 Grade Equivalent
1991 Grade Equivalent
Gain
Over/Under Predicted
Program Effectiveness
Range for 0 (+/-)
.
WORK STUDY
Number of Students
1990 Grade Equivalent
1991 Grade Equivalent
Gain
Over/Under Predicted
Program Effectiveness
Range for 0 (+/-)
TAAS PERCENT MASTERINC-Grade 3 5 7
WRITING
Number of Students 229
Mastery Level 24
Academic Recognition o
9 11
i
1
,
KEY
1TBS Iowa Tests of Basic SkillsTAP Tests of Achievement and
Proficiency
ROPE Report On Program
Effctivsness
r Number of Students is
Too Small for Analysis- r Positive impact
= Negative Impact
0 No Impact
TAAS = Texas Assessment of
Academic Skills
REAn'"g
Numt of Students 233
Masteey Level 23
Academic Recognition 5
MATHEMATICS
Number of Students 241
Mastery Level 19
Acadmmfc Recognition 2
I
PASSING ALL
TESTS TAKEN
Number of Students 256
Mastery Level 9
Academic Recognition
73
77

90.39
EXECUTIVE SUMMARY
MIDDLE SCHOOL/JUNIOR HIGHGRADES 6-8
SPECIAL EDUCATION STUDENTS, 1990-91, GRADES 6-8
GROUP CHARACTERISTICS:INumber of students in this group:
Percent low income: 0Percent minority: 1
Percent female: 3Percent limited English proficient(LEP):
i
IPercent overage for their grade: 69Percent special education students: 90Percent gifted/talented students: 3
I
Major Findings
ITBS ACHIEVEMENT: The spring, 1991, Iowa Tests of Basic Skills (ITBS)Imedian percentile scores of program students were compared to
the 198b national norms.
Out of 6 comparisons, program Istudents' scores were...
Reading MathematicsAbove the national norm in 0 0At the national norm in 0 0
IBelow the national norm in 3 3
ITBS scores from spring, 1991, were compared to predicted levelsof achievement by means of the Report on Program Effectiveness (ROPE)
Iprocedure.
I
1
TAAS ACHIEVEMENT: Compared to the AISD averages in mathematics,reading, and writing, the percentages of program students mastering
Ithe TAAS at grade 7 were:
Out of 12 comparisons, programstudents' scores...
Reading Mathematics Language Work StudyExceeded predicted levels in 0 0 0 0Achieved predicted levels in 0 0 0 0Were below predicted levels in 0 0 0 0Were too few for analysis in 3 3 3 3
Reading Mathematics Wi iting All Tests TakenHigher inThe same inLower in x x x x
Compared with the percentage of all AISD middle/junicr high school studentsImastering all tests:
I
Academic Mastery (all tests taken)Academic Recognition (all 3 tests)
The programrate was...
LowerLower
AISD
his%
2%
Program
10%0%
Compared with the percentage of middle/junior high school students state-I
wide mastering all three tests at the academic recognition level:
The program State Programrate was...Lower 2% 0%
I
74 731
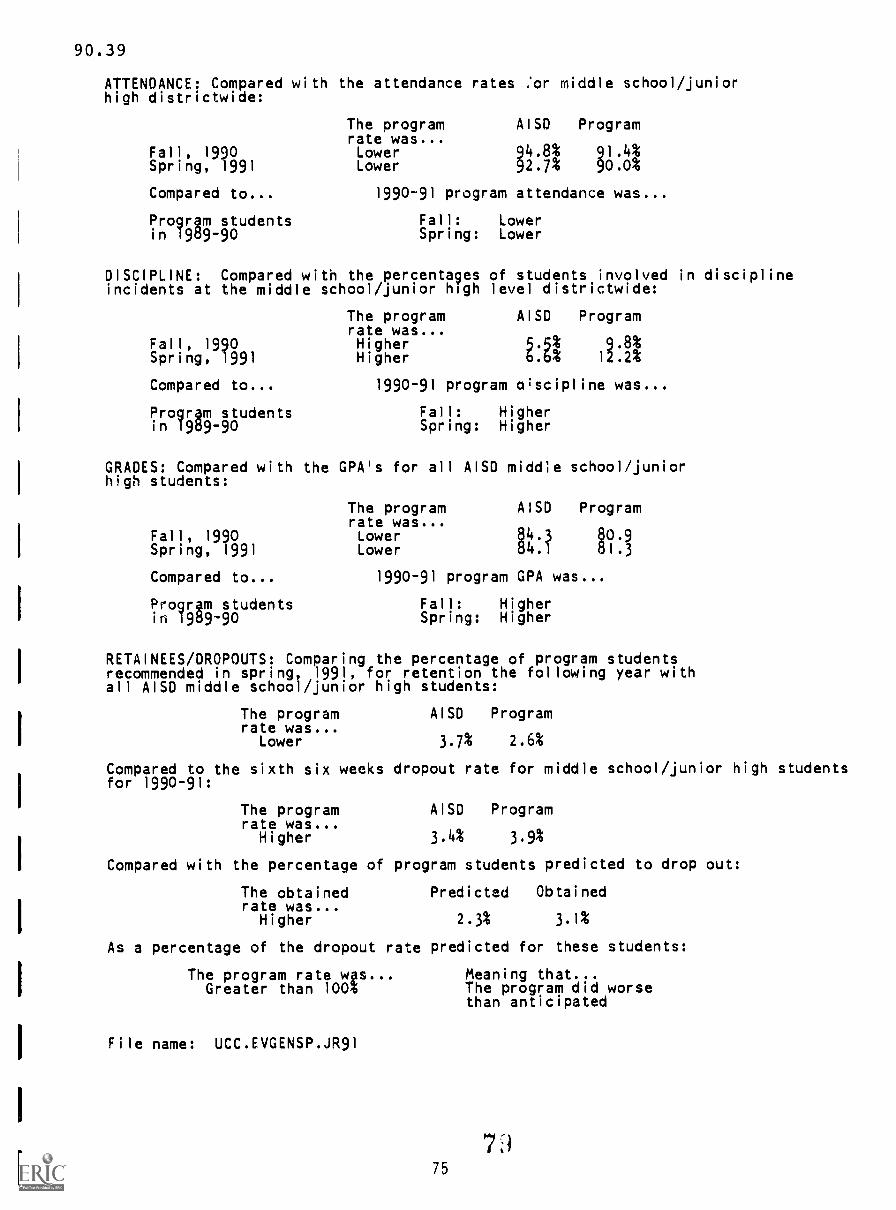
90.39
ATTENDANCE: Compared with the attendance rates :or middle school/juniorhigh districtwide:
Fall, 1990Spring, 1991
Compared to...
Progrgm studentsin 1959-90
The program AISD Programrate was...Lower 94.8% 91.4%Lower 92.7% 90.0%
1990-91 program attendance was...
Fall: LowerSpring: Lower
DISCIPLINE: Compared with the percentages of students involved in disciplineincidents at the middle school/junior high level districtwide:
Fall, 1990Spring, 1991
Compared to...
Progrgm studentsin 1959-90
The programrate was...HigherHigher
AISD Program
5.5% 9.8%6.6% 12.2%
1990-91 program cOscipline was...
Fall: HigherSpring: Higher
GRADES: Compared with the GPA's for all AISD middle school/juniorhigh students:
Fall, 1990Spring, 1991
Compared to...
Progrgm studentsin 1959-90
The program AISD Programrate was...Lower $0.9Lower 51.3
1990-91 program GPA was...
Fall: HigherSpring: Higher
RETAINEES/DROPOUTS: Comparing the percentage of program studentsrecommended in spring, 1991, for retention the following year withall AISD middle school/junior high students:
The program AISD Programrate was...
Lower 3.7% 2.6%
Compared to the sixth six weeks dropout rate for middle school/junior high studentsfor 1990-91:
The programrate was...
Higher
AISD Program
3.4% 3.9%
Compared with the percentage of program students predicted to drop out:
The obtained Predicted Obtainedrate was...Higher 2.3% 3.1%
As a percentage of the dropout rate predicted for these students:
The program rate wgs...Greater than 100;
File name: UCC.EVGENSP.JR91
75
Meaning that...The program did worsethan anticipated
7
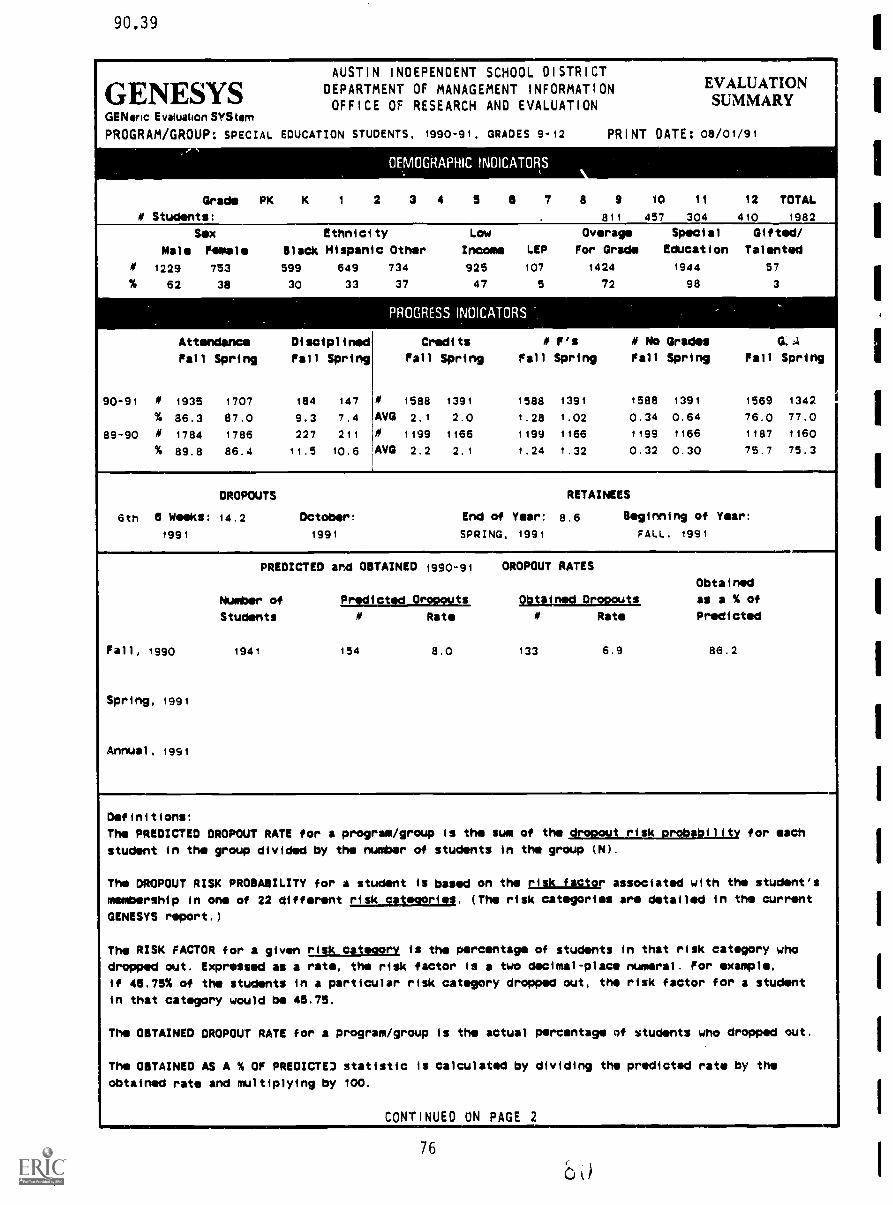
90.39
AUSTIN
GENE SY S DEPARTMENTOFFICE
GENeric E valuation SYS tem
PROGRAM/GROUP: SP ECIAL EDUCATION STUDENTS," N
Grade PK K 1
4 Students:
INDEPENDENT SCHOOL DISTRICTOF MANAGEMENT INFORMATION
OF RESEARCH AND EVALUATION
EVALUATIONSUMMARY
1990-91, GRADES 9-12 PRINT DATE: 08/01/91
OEMOGRAPHIC INOICATORS,
2 3 4 5 5 7 8 9 10 11 12 TOTAL
, 611 457 304 410 1982
Sx Ethnicity
Male Female Black Hispanic
# 1229 753 599 649
% 62 38 30 33
Attendance Disciplined
Fall Spring Fall Spring
90-91 M 1935 1707 184 147
% 86.3 87.0 9.3 7.4
89-90 M 1784 1786 227 211
% 89.8 86.4 11.5 10.6
Low Overage Special Gifted/
Other Income LEP For Grade Education Talented
734 925 107 1424 1944 57
37 47 5 72 98 3
PROGRESS INOICATORS
Credits M F's 4 No Grades G:.4
Fall Spring Fall Spring Fall Spring Fall Spring
M 1588 1391 1588 1391 1588 1391 1569 1342
AVG 2.1 2.0 1.28 1.02 0.34 0.64 76.0 77.0
M 1199 1166 1199 1166 1199 1166 1167 1160
AVG 2.2 2.1 1.24 1.32 0.32 0.30 75.7 75.3
DROPOUTS RETAINEES
6th a Weeks: 14.2 October: End of Year: 6,6 Beginning of Year:
1991 1991 SPRING, 1991 FALL, 1991
PREDICTED and OBTAINED 1990-91 DROPOUT RATES
Obtained
Number of Predicted Dropouts Obtained Drocguts as a % of
Students 4 Rate 4 Rate Predicted
Fall, 1990 1941 154 8.0 133 6.9 86.2
Spring, 1591
Annual, 1991
Definitions:
The PREDICTED DROPOUT RATE for a program/group
student in the group divided by the number
The DROPOUT RISK PROBABILITY for a student
membership in one of 22 different ttgLanw_rlsg.
GENESYS report.)
The RISK FACTOR for a given risk category
is the sum of the dropout risk probability for each
of students in the group (N).
is based on the risk factor associated with the student's
(The risk categories are detailed in the current
is the percentage of students in that risk category who
dropped out. Expressed as a rate, the risk factor is a two decimal-place numeral. For example,
if 45.75% of the students in a particular risk category dropped out, the risk factor far a student
in that category would be 45.75.
The OBTAINED DROPOUT RATE for a program/group is the actual percentage of students who dropped out.
The OBTAINED AS A % OF PREDICTED statistic is calculated by dividing the predicted rate by the
obtaingd rate and multiplying by loo.
CONTINUED ON PAGE 2
76
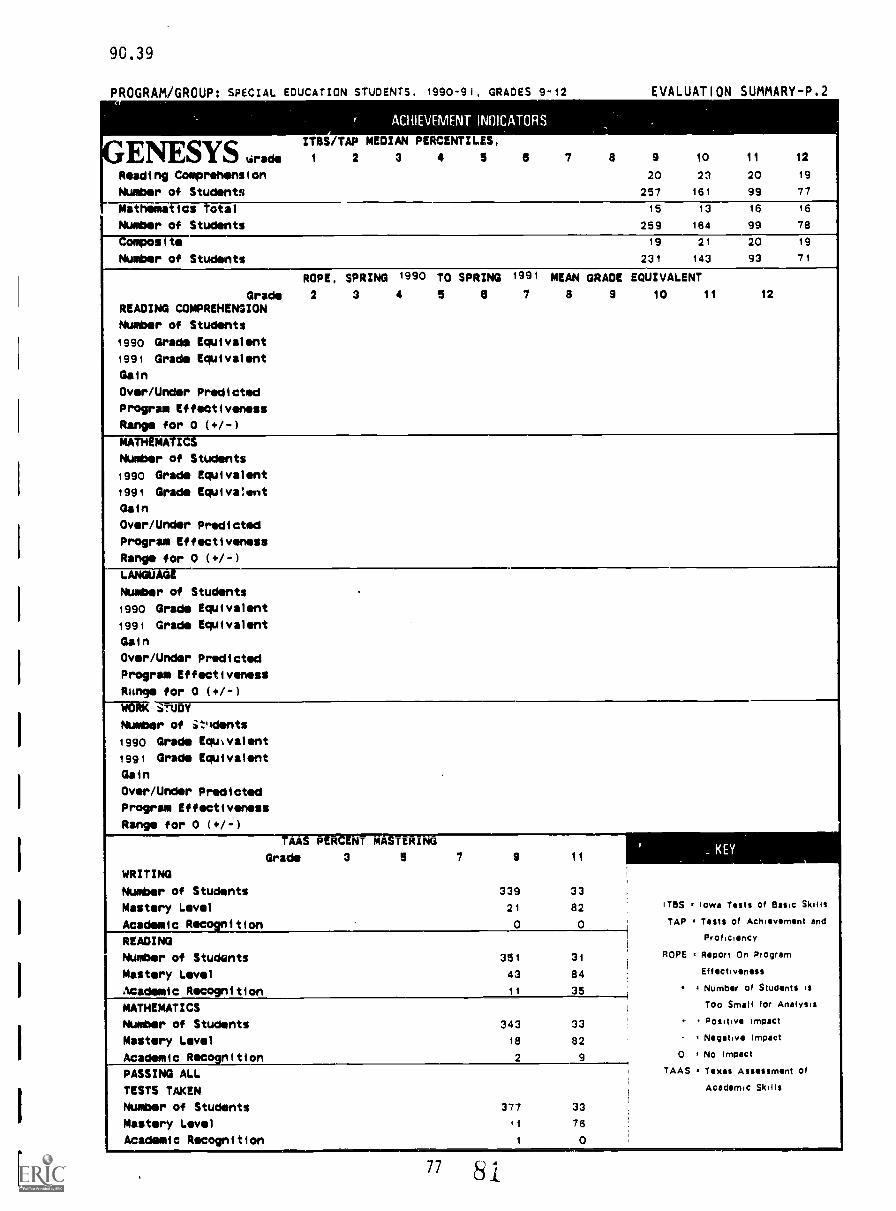
90.39
PROGRAM/GROUP: SPECIAL EDUCATION STUDENTS, 1990-91, GRADES 9-12 EVALUATION SUMMARY-P.2
77
I ACHIEVWENTINMCATORS
GENESYS 4rade
IT15S/TAP MEDIAN PERCENTILES,
2 3
Reading Comprehension
Number of Students
7 a 9 10 11 12
20 23 20 19
257 161 99 77
4 5 a
Mathemat 1 cs Total 15 13 16 16
Number of Students 259 164 99 78
--tomposite 19 21 20 19
Number of Students 231 143 93 71
ROPE. EpR/No 1990 TO SPRING 1991 MEAN GRADE EQUIVALENT
Grade 2 3 4 5 a 7 8 9 10 11 12
READING COMPREHENSION
Number of Students
1990 Grade Equivalent
1991 Grade Equivalent
Gain
Over/Under Predicted
Program Effectiveness
Range for 0 (.01-)
MATHEMATICS
Number of Students
1990 Grade Equivalent
1991 Grade EqUivaluent
Gain
Over/Under Predicted
Program Effectiveness
Range for 0 (.01-)
LAWair--Number of Students
1990 Grade Equivalent
1991 Grade Equivalent
Gain
Over/Under Predicted
Program Effectiveness
Range for 0 (.01-)
WORK .iTUDY
Number of it4dents
1990 Grade EquIvalent
1991 Grade Equivalent
Gain
Over/Under Predicted
Program Effectiveness
Range for 0 (.01-)
7113-TINtl'71,NTMMIT4Grade 3 5 7 9 11
,
_ KEY.
WRITING
Number of Students 339 33
Mastery Level 2 1 82 I T S Iowa Tests M Basic Sicilia
Academic Recognition 0 0 TAP Tests of Achievement and
READING Proficiency
Number of Students 351 31 ROPE Report On Program
Mastery Level 43 84 Effectiveness
Academic Recognition 11 35 'Number of Students is
MATHEMATICS Too EmaH for Analysis
Number of Students 343 33 - . Posiiiva impact
Mastery Level 18 82 , Negmive Impact
Academic Recognition 2 9 o No Impact
PASSING ALL TAAS Texas A mem W
TESTS TAKEN 1
Ammmic Skills
Number of Students 377 33
Mastery Level 11 76
Academic Recognition 1 0
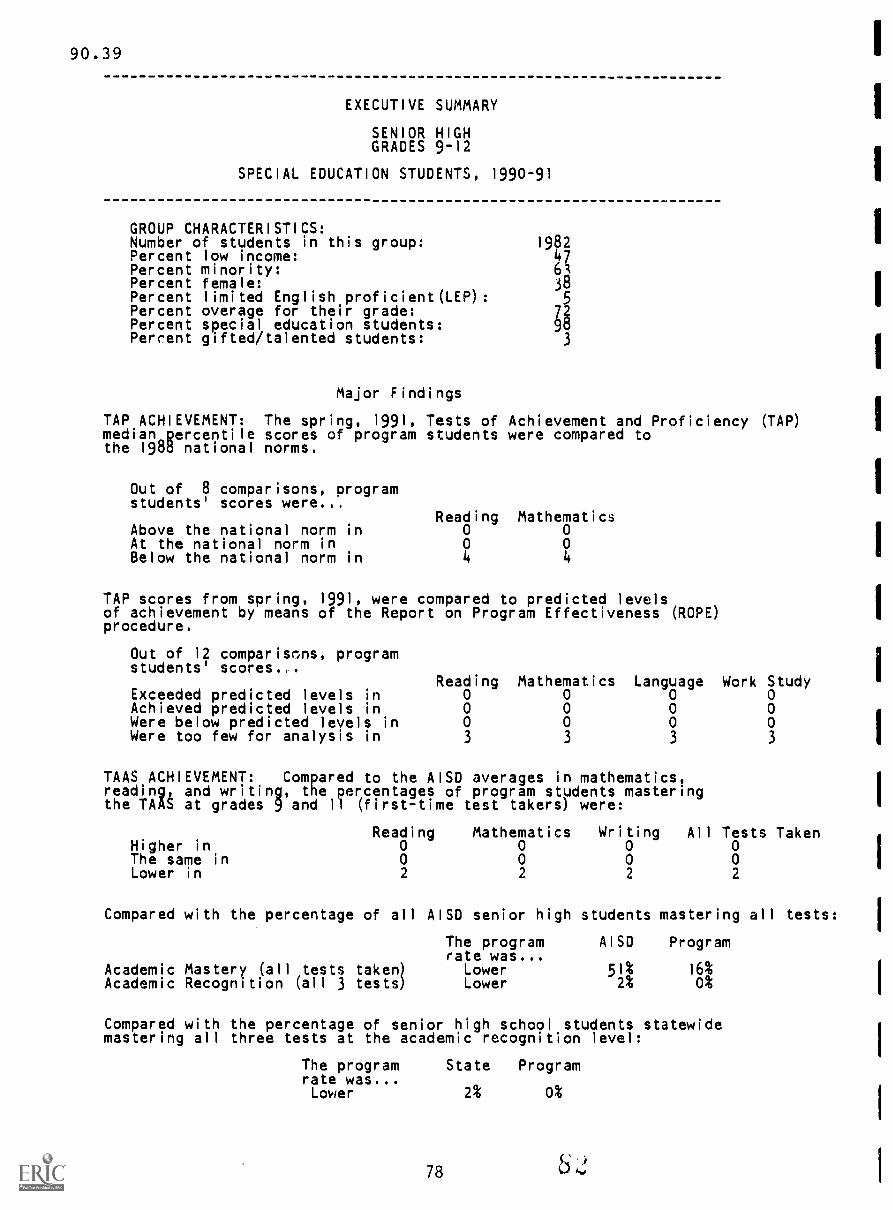
90.39
EXECUTIVE SUMMARY
SENIOR HIGHGRADES 9-12
SPECIAL EDUCATION STUDENTS, 1990-91
GROUP CHARACTERISTICS:Number of students in this group:Percent low income:Percent minority:Percent female:Percent limited English proficient(LEP):Percent overage for their grade:Percent special education students:Percent gifted/talented students:
19824761385
3
Major Findings
TAP ACHIEVEMENT: The spring, 1991, Tests of Achievement and Proficiency (TAP)median percentile scores of program students were compared tothe 198d national norms.
Out of 8 comparisons, programstudents' scores were...
Reading MathematicsAbove the national norm in 0 0At the national norm in 0 0Below the national norm in 4 4
TAP scores from spring, 1991, were compared to predicted levelsof achievement by means of the Report on Program Effectiveness (ROPE)procedure.
Out of 12 comparisons, programstudents' scores.,.
Reading Mathematics Language Work StudyExceeded predicted levels in 0 0 0 0Achieved predicted levels in 0 0 0 0Were below predicted levels in 0 0 0 0Were too few for analysis in 3 3 3 3
TAAS ACHIEVEMENT: Compared to the AISD averages in mathematics,reading, and writing, the percentages of program students masteringthe TAAS at grades 9 and 11 (first-time test takers) were:
Higher inThe same inLower in
Reading002
Mathematics001,
Writing002
All Tests Taken002
Compared with the percentage of all
Academic Mastery (all tests taken)Academic Recognition (all 3 tests)
AISD senior high students mastering all tests:
The program AISD Programrate was...
Lower 51% 16%Lower 2% 0%
Compared with the percentage of senior high school students statewidemastering all three tests at the academic recognition level:
The program State Programrate was...Lower 2% 0%
78
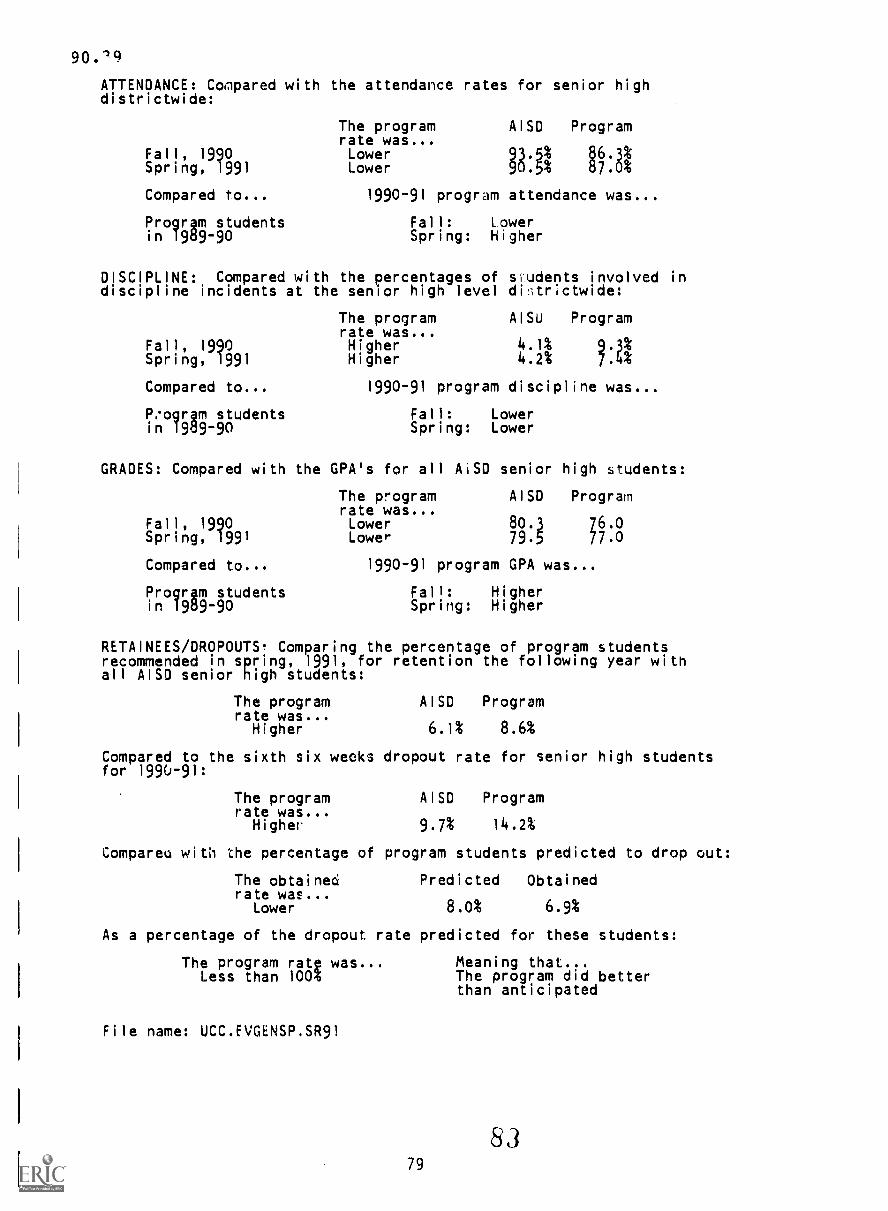
90.1q
ATTENDANCE: Collpared with the attendance rates for senior highdistrictwide:
Fall, 1990Spring, 1991
Compared to...
Program studentsin 1989-90
The programrate was...LowerLower
AISD Program
38:gt 1;:8t
1990-91 program attendance was...
Fall: LowerSpring: Higher
DISCIPLINE: Compared with the percentages of sludents involved indiscipline incidents at the senior high level dilltrictwide:
Fall, 1990Spring, 1991
Compared to...
P..ogram studentsin 1989-90
The programrate was...HigherHigher
AISU Program
t:It ?:d
1990-91 program discipline was...
Fall: LowerSpring: Lower
GRADES: Compared with the GPA's for all AiSD senior high students:
Fall, 1990Spring, 1991
Compared to...
Program studentsin 1989-90
The programrate was...LowerLower
AISD Program
80.3 76.079.5 77.0
1990-91 program GPA was...
Fall: HigherSpring: Higher
RETAINEES/DROPOUTS. Comparing the percentage of program studentsrecommended in spring, 1991, for retention the following year withall AISO senior high students:
The program AISD Programrate was...
Higher 6.1% 8.6%
Compared to the sixth six weeks dropout rate for senior high studentsfor 1990-91:
The programrate was...
Higher
AISD Program
9.7% 14.2%
Compared with the percentage of program students predicted to drop out:
The obtained Predicted Obtainedrate was...
Lower 8.0% 6.9%
As a percentage of the dropout rate predicted for these students:
The program ratp was...Less than 100;
File name: UCC.RIGENSP.SR91
79
Meaning that...The program did betterthan anticipated
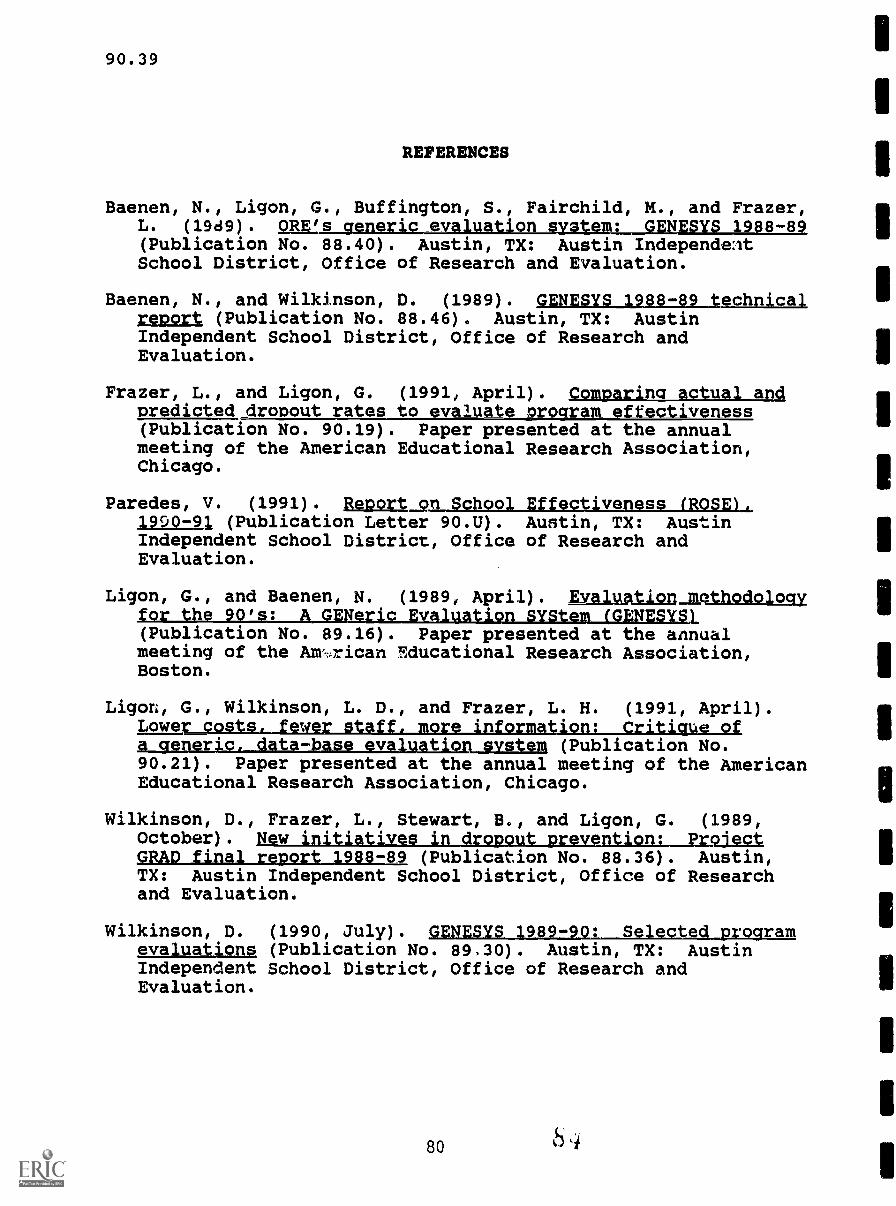
90.39
REFERENCES
Baenen, N., Ligon, G., Buffington, S., Fairchild, M. and Frazer,L. (19d9). ORE's __ev t m: 1988-89(Publication No. 88.40). Austin, TX: Austin IndependentSchool District, Office of Research and Evaluation.
Baenen, N., and Wilkinson, D. (1989). unaLlamp.=0_111thaigglrtmrt (Publication No. 88.46). Austin, TX: AustinIndependent School District, Office of Research andEvaluation.
Frazer, L., and Ligon, G.nredicted_ dromut_rates(Publication No. 90.19)meeting of the AmericanChicago.
(1991; April). Comparina_actual andto evaivate oroaram eftectiveness
. Paper presented at the annualEducational Research Association,
Paredes, V. (1991). Report_gmlOssLiagg_tjamp_s_s_CROLL.1990-91 (Publication Letter 90.U). Austin, TX: AustinIndependent School District, Office of Research andEvaluation.
Ligon, G., and Baenen N. (1989; April). Kulgfttimjmth2iollogyI _E
(Publication No. 89.16). Paper presented at the annualmeeting of the Arvzican Educational Research Association,Boston.
Ligon, G., Wilkinson, L. D., and Frazer, L. H. (1991, April).Lowvr costs, fewer staff, more information: Critique ofLi_ge'data-n (Publication No.90.21). Paper presented at the annual meeting of the AmericanEducational Research Association, Chicago.
Wilkinson, D., Frazer, L., Stewart, B., and Ligon, G.October). New initiatives in dropout prevention:gEADLIInAl_rugxt_1211=12 (Publication No. 88.36).TX: Austin Independent School District, Office ofand Evaluation.
Wilkinson, D.evaluationsIndependentEvaluation.
(1990, July).(Publication No.School District,
falartai_S-1.289.30). Austin, TX: AustinOffice of Research and
80
(1989,ErpjectAustin,Research
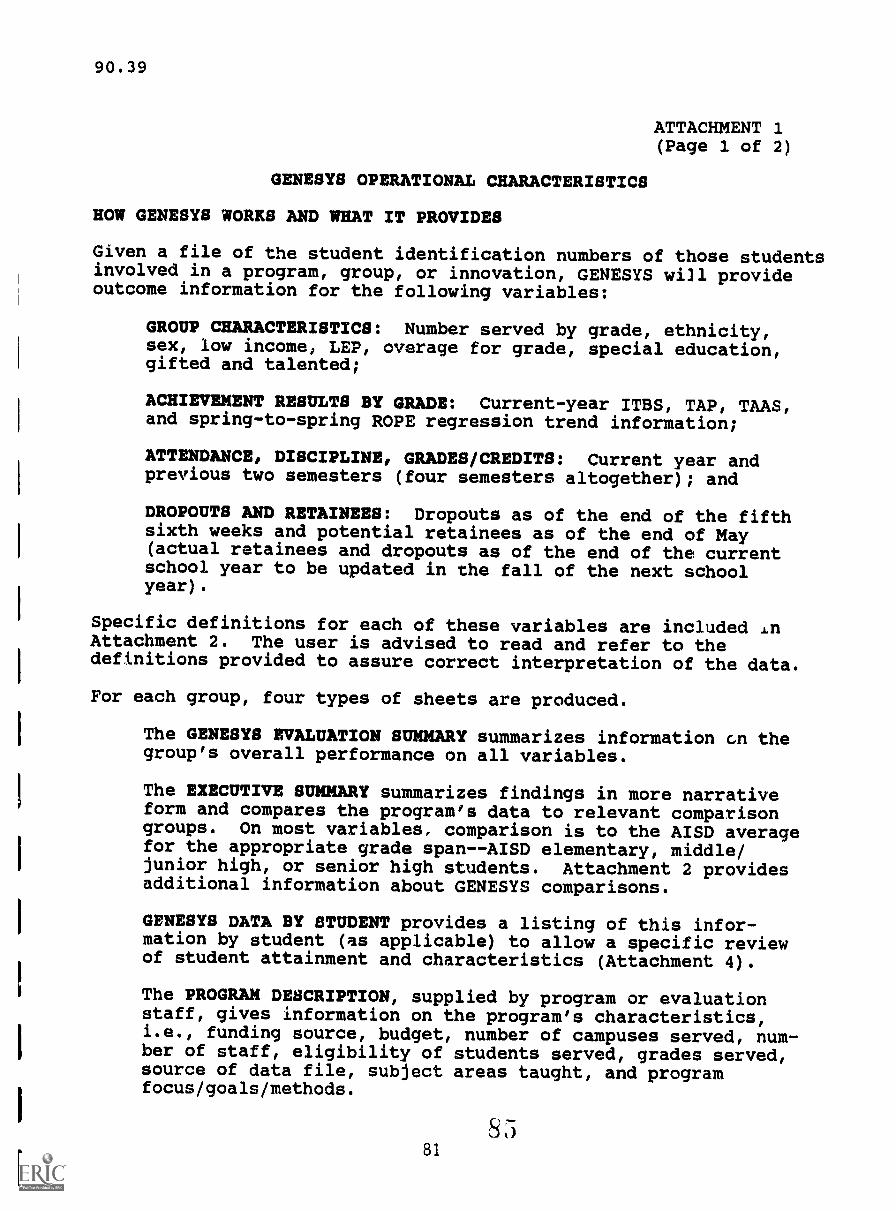
90.39
ATTACHMENT 1(Page 1 of 2)
GENESYS OPERATIONAL CHARACTERISTICS
HOW GENESYS WORKS AND WHAT IT PROVIDES
Given a file of the student identification numbers of those studentsinvolved in a program, group, or innovation, GENESYS will provideoutcome information for the following variables:
GROUP CHARACTERISTICS: Number served by grade, ethnicity,sex, low income, LEP, overage for grade, special education,gifted and talented;
ACHIEVEMENT RESULTS BY GRADE: Current-year ITBS, TAP, TAAS,and spring-to-spring ROPE regression trend information;
ATTENDANCE, DISCIPLINE, GRADES/CREDITS: Current year andprevious two semesters (four semesters altogether); and
DROPOUTS AND RETAINEES: Dropouts as of the end of the fifthsixth weeks and potential retainees as of the end of May(actual retainees and dropouts as of the end of the currentschool year to be updated in the fall of the next schoolyear).
Specific definitions for each of these variables are included inAttachment 2. The user is advised to read and refer to thedefinitions provided to assure correct interpretation of the data.
For each group, four types of sheets are produced.
The GENESYS EVALUATION SUMMARY summarizes information cn thegroup's overall performance on all variables.
The EXECUTIVE SUMMARY summarizes findings in more narrativeform and compares the program's data to relevant comparisongroups. On most variables, comparison is to the AISD averagefor the appropriate grade span--AISD elementary, middle/junior high, or senior high students. Attachment 2 providesadditional information about GENESYS comparisons.
UNESYS DATA BY STUDENT provides a listing of this infor-mation by student (as applicable) to allow a specific reviewof student attainment and characteristics (Attachment 4).
The PROGRAM DESCRIPTION, supplied by program or evaluationstaff, gives information on the program's characteristics,i.e., funding source, budget, number of campuses served, num-ber of staff, eligibility of students served, grades served,source of data file, subject areas taught, and programfocus/goals/methods.
8581
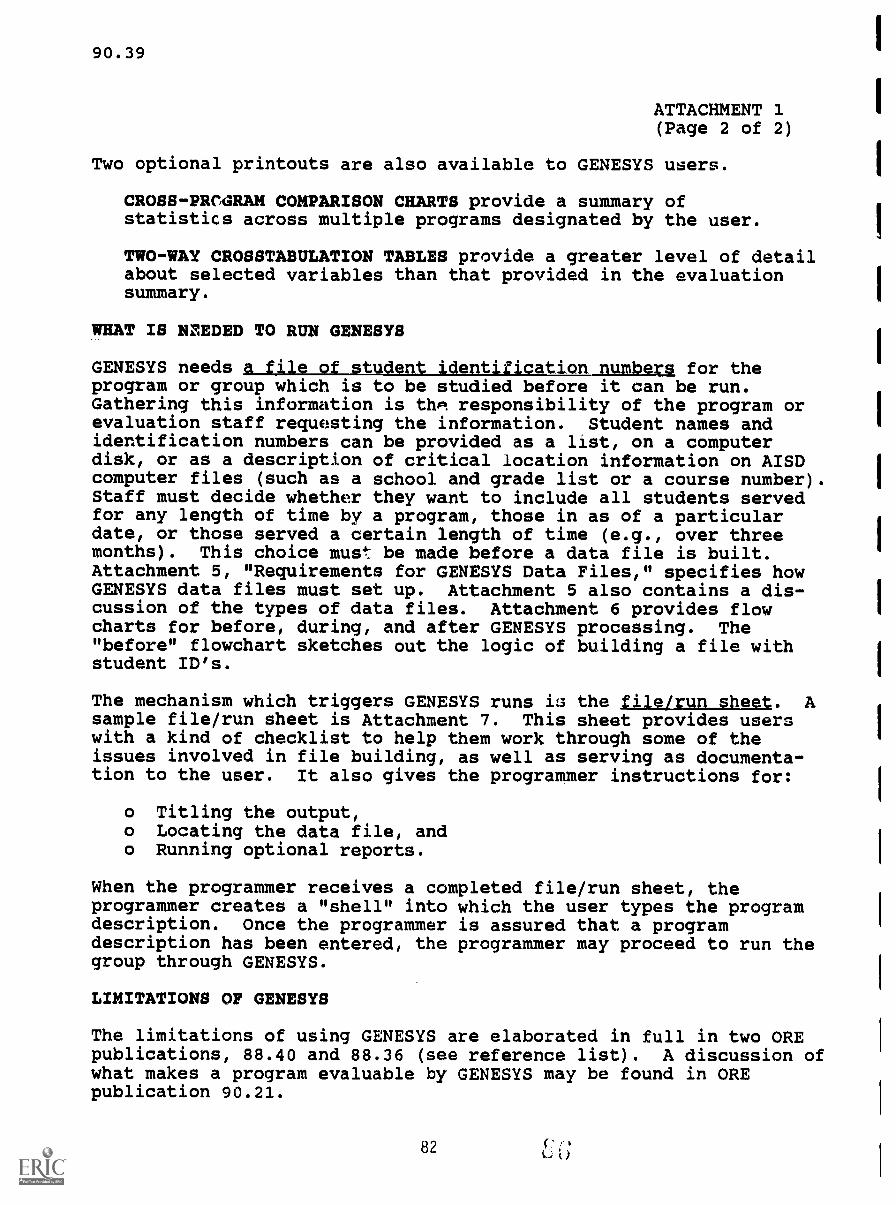
90.39
ATTACHMENT 1(Page 2 of 2)
Two optional printouts are also available to GENESYS users.
CROSS-PROGRAM COMPARISON CHARTS provide a summary ofstatistics across multiple programs designated by the user.
TWO-WAY CROSSTABULATION TABLES provide a greater level of detailabout selected variables than that provided in the evaluationsummary.
WHAT IS NEEDED TO RUN GENESYS
GENESYS needs a file of student identification numbeu for theprogram or group which is to be studied before it can be run.Gathering this information is thn responsibility of the program orevaluation staff requesting the information. Student names andidentification numbers can be provided as a list, on a computerdisk, or as a description of critical location information on AISDcomputer files (such as a school and grade list or a course number).Staff must decide whether they want to include all students servedfor any length of time by a program, those in as of a particulardate, or those served a certain length of time (e.g., over threemonths). This choice must be made before a data file is built.Attachment 5, "Requirements for GENESYS Data Files," specifies howGENESYS data files must set up. Attachment 5 also contains a dis-cussion of the types of data files. Attachment 6 provides flowcharts for before, during, and after GENESYS processing. The"before" flowchart sketches out the logic of building a file withstudent ID's.
The mechanism which triggers GENESYS runs is' the file/run sheet. Asample file/run sheet is Attachment 7. This sheet provides userswith a kind of checklist to help them work through some of theissues involved in file building, as well as serving as documenta-tion to the user. It also gives the programmer instructions for:
o Titling the output,o Locating the data file, ando Running optional reports.
When the programmer receives a completed file/run sheet, theprogrammer creates a "shell" into which the user types the programdescription. Once the programmer is assured that a programdescription has been entered, the programmer may proceed to run thegroup through GENESYS.
LIMITATIONS OF GENESIS
The limitations of using GENESYS are elaborated in full in two OREpublications, 88.40 and 88.36 (see reference list). A discussion ofwhat makes a program evaluable by GENESYS may be found in OREpublication 90.21.
82 L.,Z)
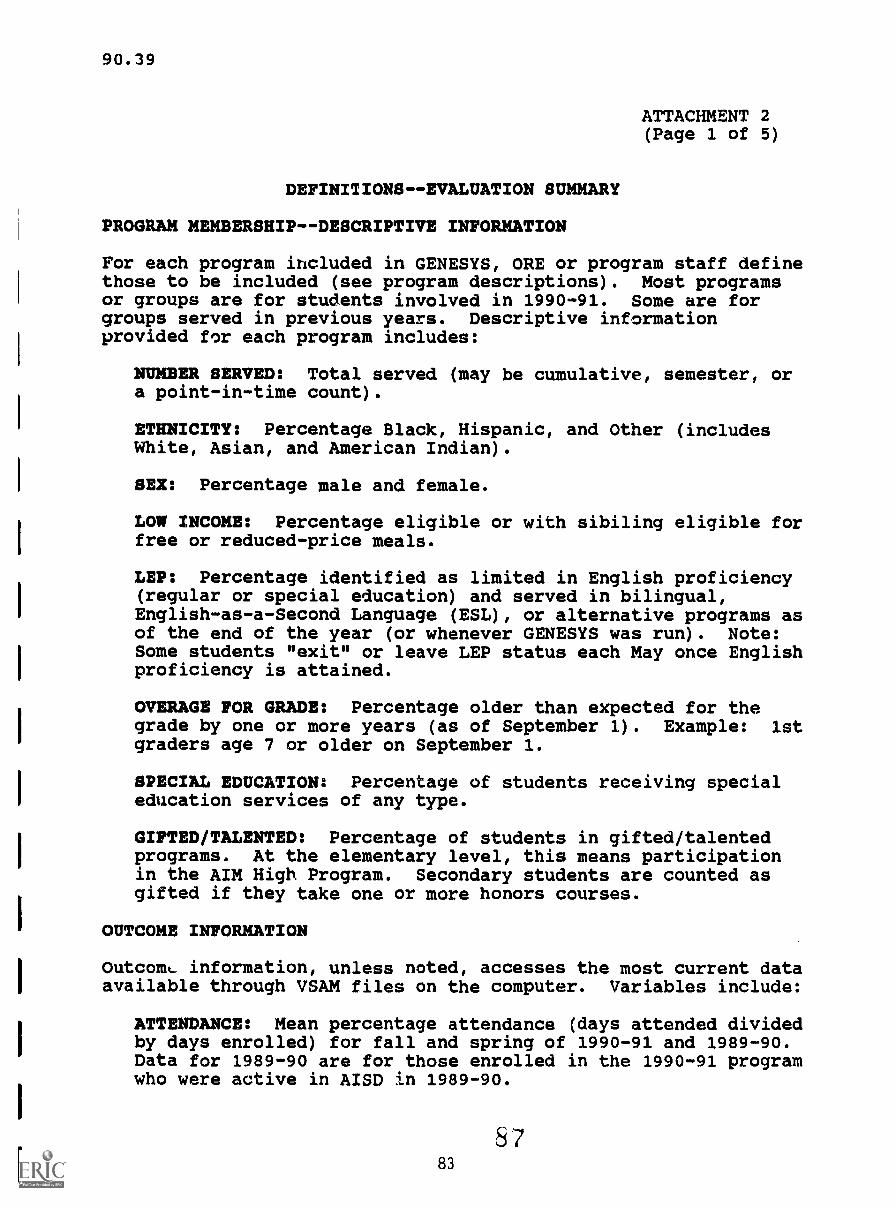
90.39
ATTACHMENT 2(Page 1 of 5)
DEFINITIONSEVALUATION SUMMARY
PROGRAM MEMBERSHIPDESCRIPTIVE INFORMATION
For each program included in GENESYS, ORE or program staff definethose to be included (see program descriptions). Most programsor groups are for students involved in 1990-91. Some are forgroups served in previous years. Descriptive informationprovided for each program includes:
NUMBER SERVED: Total served (may be cumulative, semester, ora point-in-time count).
ETHNICITY: Percentage Black, Hispanic, and Other (includesWhite, Asian, and American Indian).
SEX: Percentage male and female.
LOW INCOME: Percentage eligible or with sibiling eligible forfree or reduced-price meals.
LEP: Percentage identified as limited in English proficiency(regular or special education) and served in bilingual,English-as-a-Second Language (ESL), or alternative programs asof the end of the year (or whenever GENESYS was run). Note:Some students "exit" or leave LEP status each May once Englishproficiency is attained.
OVERAGE FOR GRADE: Percentage older than expected for thegrade by one or more years (as of September 1). Example: 1stgraders age 7 or older on September 1.
SPECIAL EDUCATION: Percentage of students receiving specialeducation services of any type.
GIFTED/TALENTED: Percentage of students in gifted/talentedprograms. At the elementary level, this means participationin the AIM High Program. Secondary students are counted asgifted if they take one or more honors courses.
OUTCOME INFORMATION
OutcomL information, unless noted, accesses the most current dataavailable through VSAM files on the computer. Variables include:
ATTENDANCE: Mean percentage attendance (days attended dividedby days enrolled) for fall and spring of 1990-91 and 1989-90.Data for 1989-90 are for those enrolled in the 1990-91 programwho were active in AISD in 1989-90.
8783
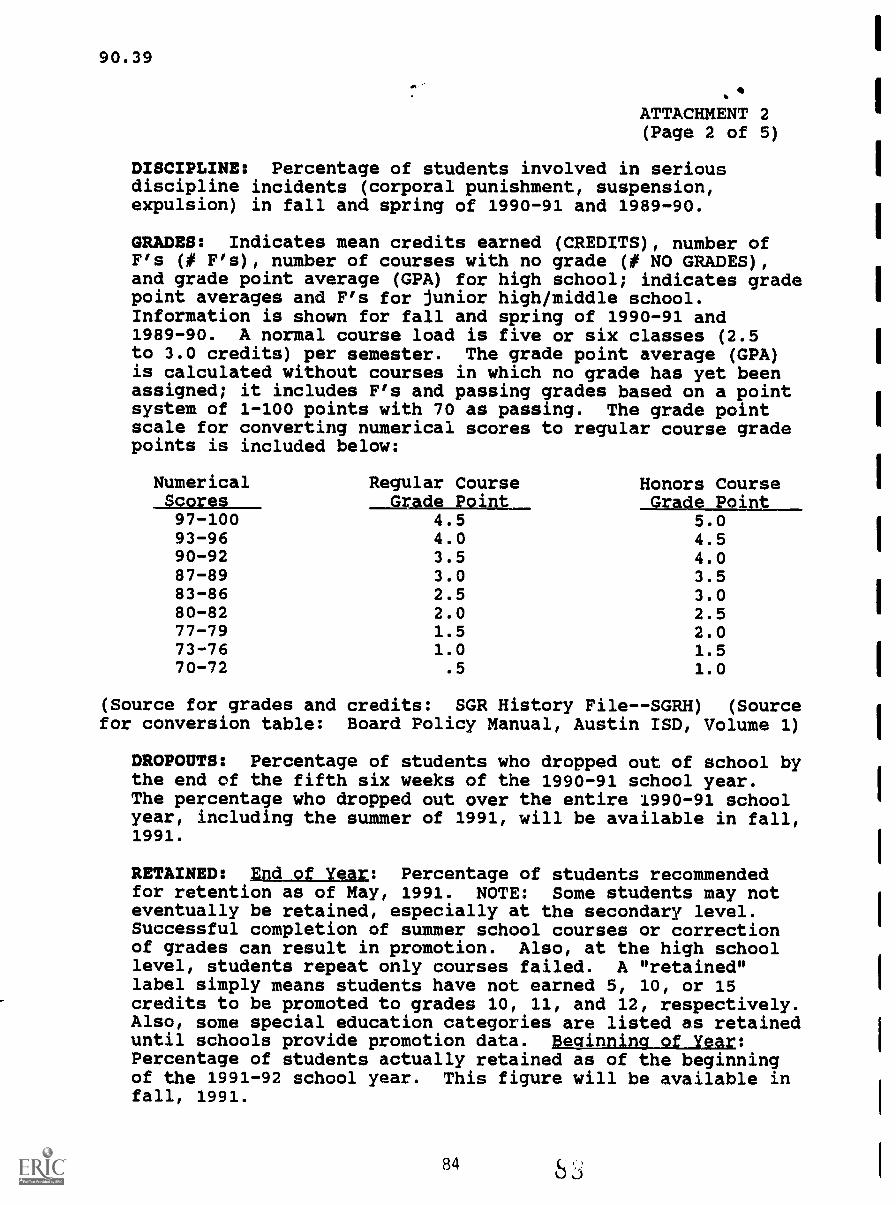
90.39
ATTACHMENT 2(Page 2 of 5)
DISCIPLINE: Percentage of students involved in seriousdiscipline incidents (corporal punishment, suspension,expulsion) in fall and spring of 1990-91 and 1989-90.
GRADES: Indicates mean credits earned (CREDITS), number ofF's (# F's), number of courses with no grade (# NO GRADES),and grade point average (GPA) for high school; indicates gradepoint averages and F's for junior high/middle school.Information is shown for fall and spring of 1990-91 and1989-90. A normal course load is five or six classes (2.5to 3.0 credits) per semester. The grade point average (GPA)is calculated without courses in which no grade has yet beenassigned; it includes F's and passing grades based on a pointsystem of 1-100 points with 70 as passing. The grade pointscale for converting numerical scores to regular course gradepoints is included below:
NumericalScores
Regular CoursegrAgg_Egint
Honors Course
97-100 4.5_grAdg_122int___
5.093-96 4.0 4.590-92 3.5 4.087-89 3.0 3.583-86 2.5 3.080-82 2.0 2.577-79 1.5 2.073-76 1.0 1.570-72 .5 1.0
(Source for grades and credits: SGR History File--SGRH) (Sourcefor conversion table: Board Policy Manual, Austin ISD, Volume 1)
DROPOUTS: Percentage of students who dropped out of school bythe end of the fifth six weeks of the 1990-91 school year.The percentage who dropped out over the entire 1990-91 schoolyear, including the summer of 1991, will be available in fall,1991.
RETAINED: gmd_gtaur: Percentage of students recommendedfor retention as of May, 1991. NOTE: Some students may noteventually be retained, especially at the secondary level.Successful completion of summer school courses or correctionof grades can result in promotion. Also, at the high schoollevel, students repeat only courses failed. A "retained"label simply means students have not earned 5, 10, or 15credits to be promoted to grades 10, 11, and 12, respectively.Also, some special education categories are listed as retaineduntil schools provide promotion data. Beginning of year:Percentage of students actually retained as of the beginningof the 1991-92 school year. This figure will be available infall, 1991.
84
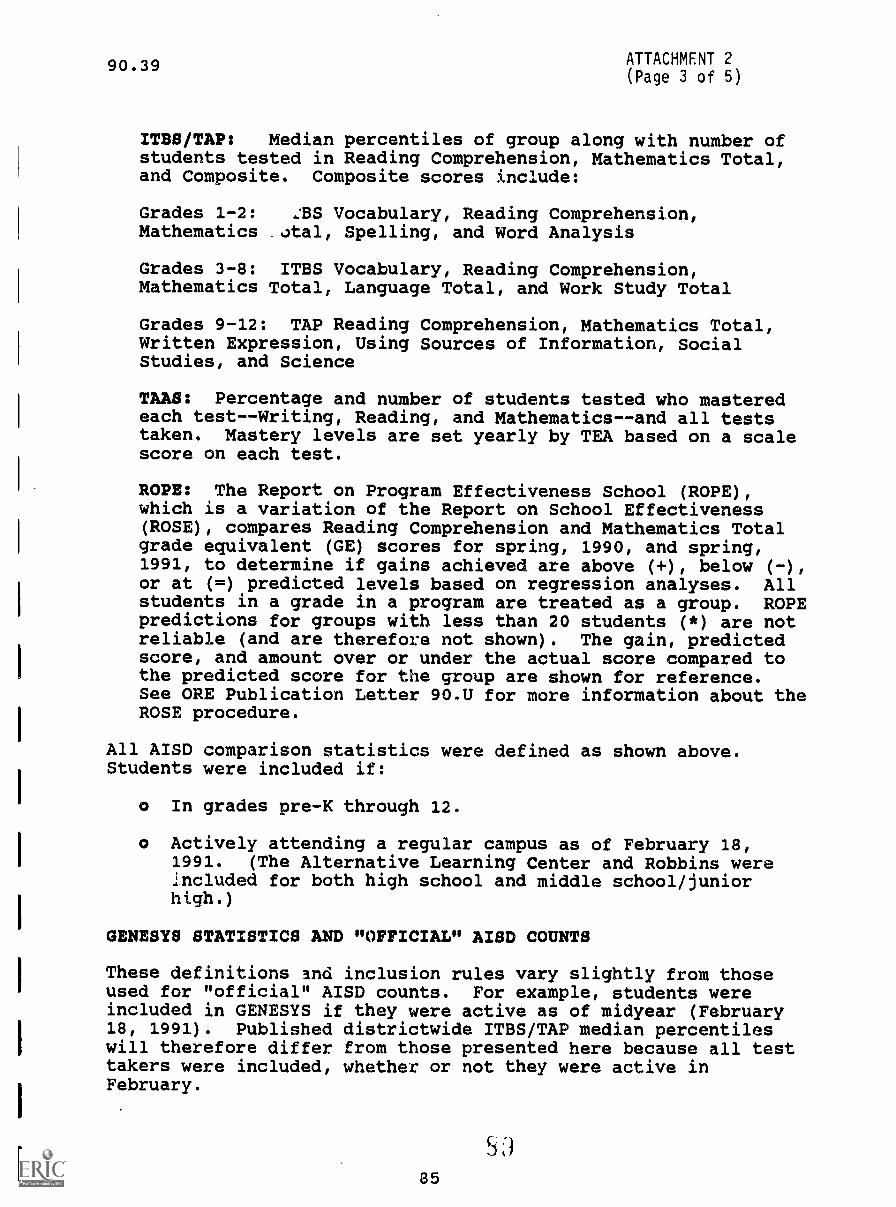
90.39 ATTACHMENT 2(Page 3 of 5)
ITBS/TAP: Median percentiles of group along with number ofstudents tested in Reading Comprehension, Mathematics Total,and Composite. Composite scores include:
Grades 1-2: .:BS Vocabulary, Reading Comprehension,Mathematics .Jtal, Spelling, and Word Analysis
Grades 3-8: ITBS Vocabulary, Reading Comprehension,Mathematics Total, Language Total, and Work Study Total
Grades 9-12: TAP Reading Comprehension, Mathematics Total,Written Expression, Using Sources of Information, SocialStudies, and Science
TAAS: Percentage and number of students tested who masteredeach test--Writing, Reading, and Mathematics--and all teststaken. Mastery levels are set yearly by TEA based on a scalescore on each test.
ROPE: The Report on Program Effectiveness School (ROPE),which is a variation of the Report on School Effectiveness(ROSE), compares Reading Comprehension and Mathematics Totalgrade equivalent (GE) scores for spring, 1990, and spring,1991, to determine if gains achieved are above (+), below (-)0or at (=) predicted levels based on regression analyses. Allstudents in a grade in a program are treated as a group. ROPEpredictions for groups with less than 20 students (*) are notreliable (and are therefore not shown). The gain, predictedscore, and amount over or under the actual score compared tothe predicted score for the group are shown for reference.See ORE Publication Letter 90.0 for more information about theROSE procedure.
All AISD comparison statistics were defined as shown above.Students were included if:
o In grades pre-K through 12.
o Actively attending a regular campus as of February 18,1991. (The Alternative Learning Center and Robbins wereIncluded for both high school and middle school/juniorhigh.)
GENESYS STATISTICS AND "OFFICIAL" AISD COUNTS
These definitions lnd inclusion rules vary slightly from thoseused for "official" AISD counts. For example, students wereincluded in GENESYS if they were active as of midyear (February18, 1991). Published districtwide ITBS/TAP median percentileswill therefore differ from those presented here because all testtakers were included, whether or not they were active inFebruary.
5:)85
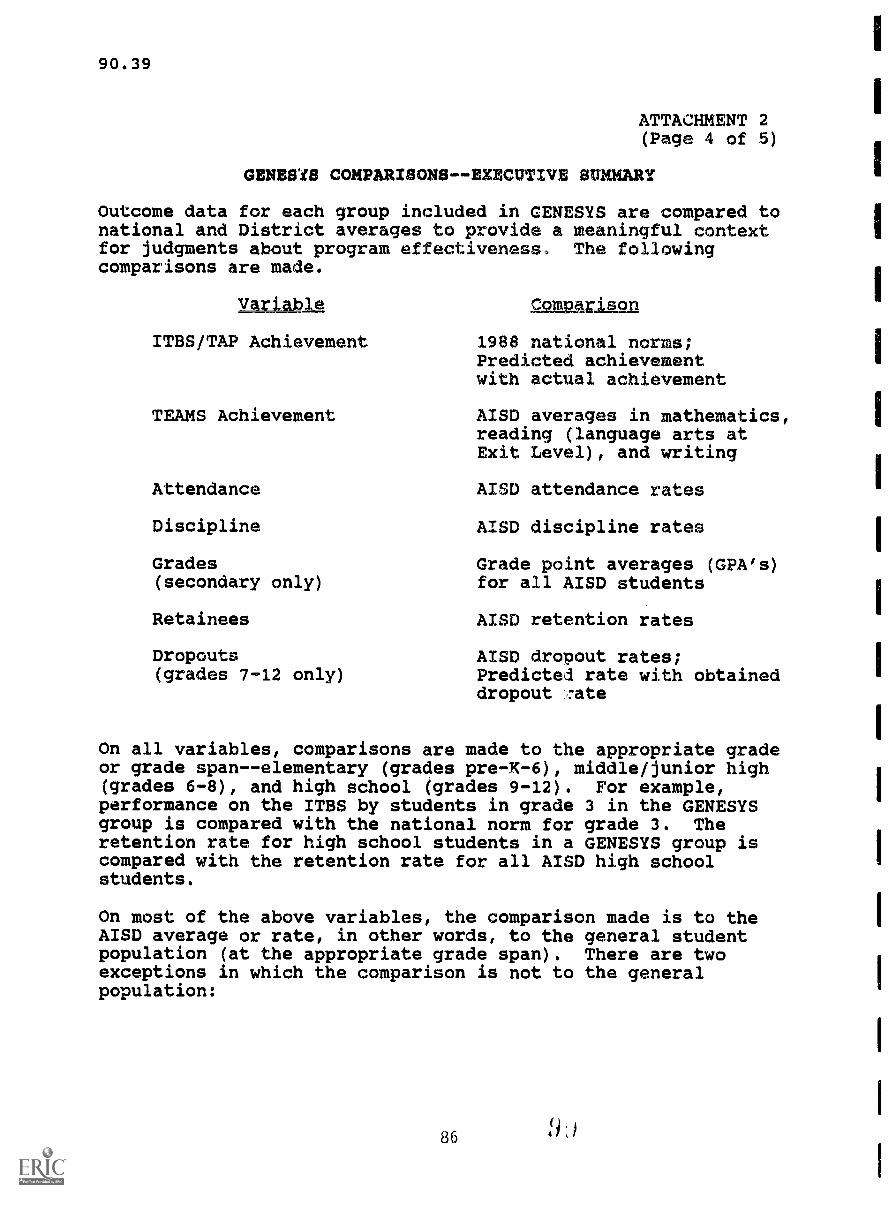
90.39
ATTACHMENT 2(Page 4 of 5)
GENESIS COMPARISONSEXECUTIVE SUMMARY
Outcome data for each group included in CENESYS are compared tonational and District averages to provide a meaningful contextfor judgments about program effectiveness The followingcomparisons are made.
Variakile.
ITBS/TAP Achievement
TEAMS Achievement
Attendance
Discipline
Grades(secondary only)
Retainees
Dropouts(grades 7-12 only)
csnpArjacm
1988 national norms;Predicted achievementwith actual achievement
AISD averages in mathematics,reading (language arts atExit Level), and writing
AISD attendance rates
AISD discipline rates
Grade point averages (GPAls)for all AISD students
AISD retention rates
AISD dropout rates;Predicted rate with obtaineddropout rate
On all variables, comparisons are made to the appropriate gradeor grade span--elementary (grades pre-K-6), middle/junior high(grades 6-8), and high school (grades 9-12). For example,performance on the ITBS by students in grade 3 in the GENESISgroup is compared with the national norm for grade 3. Theretention rate for high school students in a GENESIS group iscompared with the retention rate for all AISD high schoolstudents.
On most of the above variables, the comparison made is to theAISD average or rate, in other words/ to the general studentpopulation (at the appropriate grade span). There are twoexceptions in which the comparison is not to the generalpopulation:
86
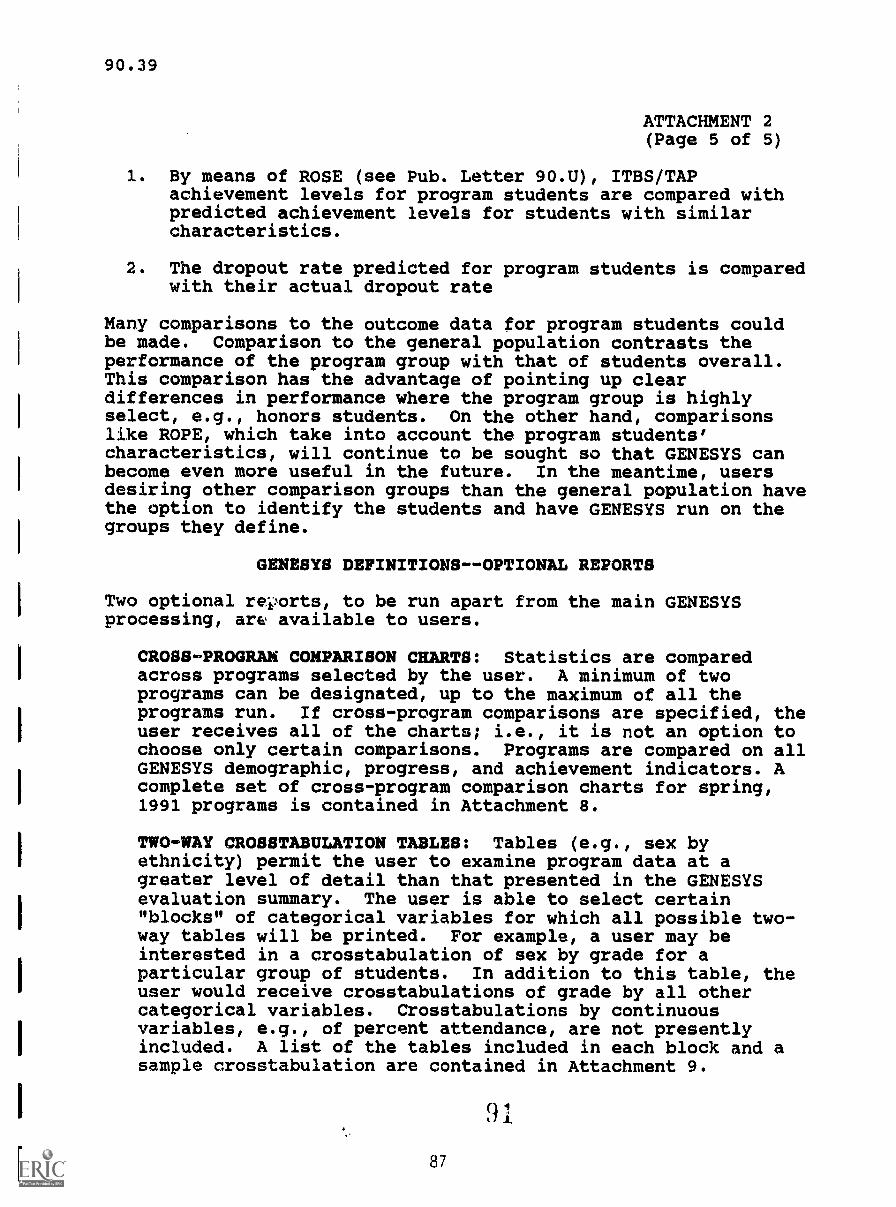
90.39
ATTACHMENT 2(Page 5 of 5)
1. By means of ROSE (see Pub. Letter 90.U), ITBS/TAPachievement levels for program students are compared withpredicted achievement levels for students with similarcharacteristics.
2. The dropout rate predicted for program students is comparedwith their actual dropout rate
Many comparisons to the outcome data for program students couldbe made. Comparison to the general population contrasts theperformance of the program group with that of students overall.This comparison has the advantage of pointing up cleardifferences in performance where the program group is highlyselect, e.g., honors students. On the other hand, comparisonslike ROPE, which take into account the program students'characteristics, will continue to be sought so that GENESIS canbecome even more useful in the future. In the meantime, usersdesiring other comparison groups than the general population havethe option to identify the students and have GENESIS run on thegroups they define.
GENESYS DEFINITIONS--OPTIONAL REPORTS
Two optional reports, to be run apart from the main GENESISprocessing, are available to users.
CROSS-PROGRAM COMPARISON CHARTS: Statistics are comparedacross programs selected by the user. A minimum of twoprograms can be designated, up to the maximum of all theprograms run. If cross-program comparisons are specified, theuser receives all of the charts; i.e., it is not an option tochoose only certain comparisons. Programs are compared on allGENESIS demographic, progress, and achievement indicators. Acomplete set of cross-program comparison charts for spring,1991 programs is contained in Attachment 8.
TWO-WAY CROSSTABULATION TABLES: Tables (e.g., sex byethnicity) permit the user to examine program data at agreater level of detail than that presented in the GENESYSevaluation summary. The user is able to select certain"blocks" of categorical variables for which all possible two-way tables will be printed. For example, a user may beinterested in a crosstabulation of sex by grade for aparticular group of students. In addition to this table, theuser would receive crosstabulations of grade by all othercategorical variables. Crosstabulations by continuousvariables, e.g., of percent attendance, are not presentlyincluded. A list of the tables included in each block and asample crosstabulation are contained in Attachment 9.
9.1
87
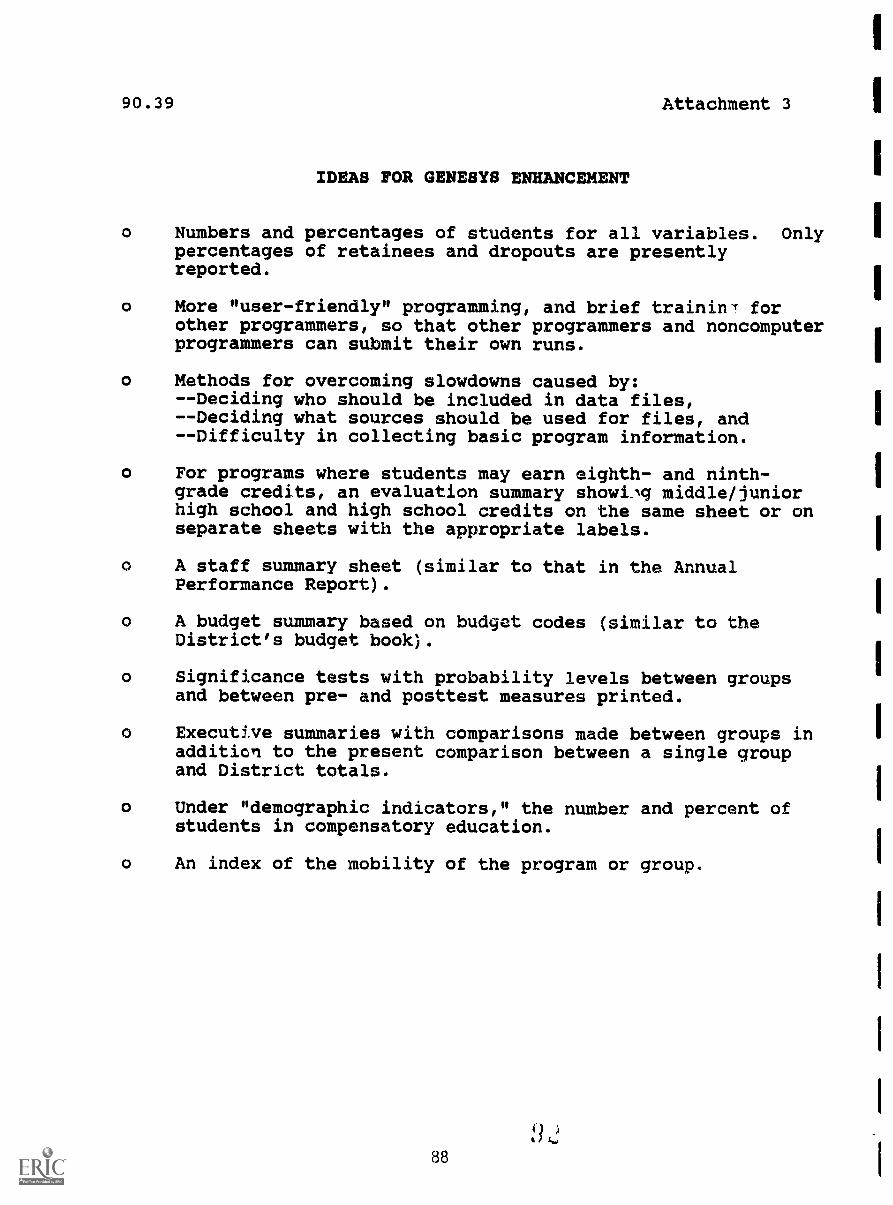
90.39 Attachment 3
IDEAS FOR GENESYS ENHANCEMENT
o Numbers and percentages of students for all variables. Onlypercentages of retainees and dropouts are presentlyreported.
o More "user-friendly" programming, and brief trainin-r forother programmers, so that other programmers and noncomputerprogrammers can submit their own runs.
o Methods for overcoming slowdowns caused by:- -Deciding who should be included in data files,--Deciding what sources should be used for files, and- -Difficulty in collecting basic program information.
o For programs where students may earn eighth- and ninth-grade credits, an evaluation summary showi_Ag middle/juniorhigh school and high school credits on the same sheet or onseparate sheets with the appropriate labels.
o A staff summary sheet (similar to that in the AnnualPerformance Report).
o A budget summary based on budget codes (similar to theDistrict's budget book).
o Significance tests with probability levels between groupsand between pre- and posttest measures printed.
o Executive summaries with comparisons made between groups inaddition to the present comparison between a single groupand District totals.
o Under "demographic indicators," the number and percent ofstudents in compensatory education.
o An index of the mobility of the program or group.
88
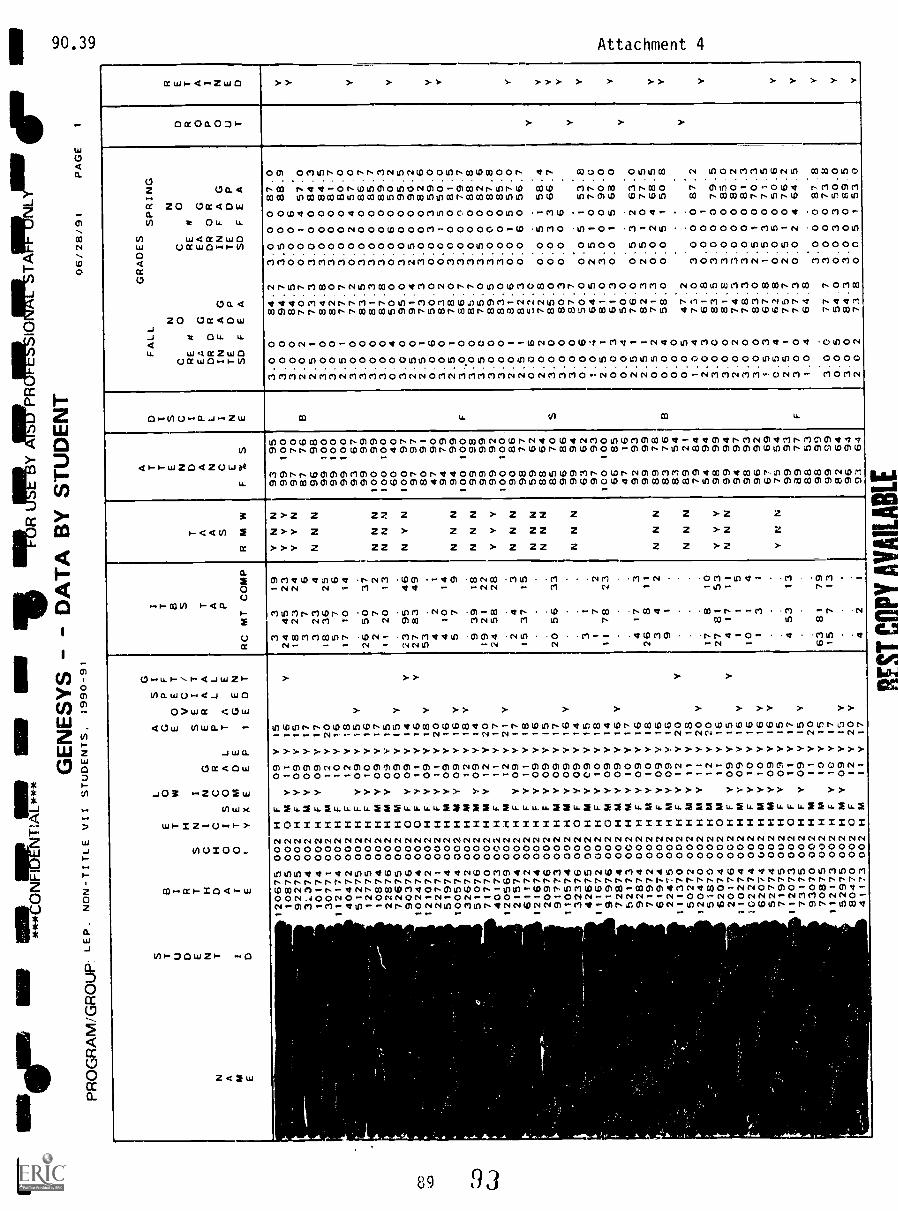
:40
G.)
MO
NM
ITN
TIA
L***
lititR
AM
Y A
PP
RA
IMIO
MP
LTA
LPR
NLY
1111
111/
el*
IMP
GE
NE
SY
S -
- D
AT
A B
Y S
TU
DE
NT
PR
OG
RA
M/G
RO
UP
LEP. NON-TITLE VII STUDENTS. 1990-91
06/28/91
PAGE
1
N A M E
S T U E N T I 0
B I T H D A T E
S C H 0 0 t
LE
0T
W
NI
IN
CC
I SO
TEM
YXE
G R AL
DEEP
GA
SI
GP
FEOET
S E
IT
ERAA
PL L
T A
EG E N
1EDT
RC
I T B S T A P
MT
COMP
T A A S
RMW
A TD
TI
ES
NC
DI
AP
NL
c1
EN
F%SE
FALL
C RE N
EADR D
IN F
TE SD F
N 0 G R A G
D P
E A
GRADES
C REEADR IN
TE
SD
SPRING
N 0N
G0 R
F A G
D P
F E A
D R 0 P 0 U T
R E T A I N E D
.-
_
6.----
. i 0 . * )'
.
t . 0 *_
1.,.-
!.' 7',-
G -i-
,-,
t
_
.
_
,
e
_.--..
-
.
1
,
.
120675
10875
92275
3...374
10174
30771
112174
40472
51275
12775
10874
22876
72675
90376
102474
121072
22771
51974
100574
32672
51076
71770
40173
120569
21574
61172
121674
20976
91773
110574
32376
42675
111672
91976
72874
52173
92874
71972
61974
22475
111370
50272
120470
51870
62074
20176
110274
102274
62074
52774
71975
112073
73175
93070
70875
112173
-52975
80470
41173
002
002
002
002
002
002
002
002
002
002
002
002
002
002
002
002
002
002
002
002
002
002
002
002
002
002
002
002
002
002
002
002
002
002
002
002
002
002
002
002
002
002
002
002
002
002
002
002
002
002
002
002
002
002
002
002
002
002
002
H 0 H H H H H H H H H H H 0 0 H H H H H H H H H H H H H H H 0 H H 0 H H H H H H H H H H 0 H H H H H H 0 H H H H H 0 H
F M F M F M F F F F M M M F F F F M M M M M F M F F F F M M F M F M M M F M F M F M M M M F M F M M F F F M M F M F M
Y Y Y Y Y Y V Y Y Y V Y Y Y Y Y Y Y Y Y Y Y Y Y Y Y Y Y Y Y Y Y V Y Y Y V Y Y Y Y Y Y Y
09 11
09
09
09 1210
12
09 10
09
0909
09
110911
090912
09 12
1112
09 11
0909090909C9 10
09 0910
0910
090912 111112
11
0909 1010
09
09 11
09 11 10
10
09 12
11
Y Y Y Y V Y Y Y Y Y Y V Y Y V Y Y V Y Y Y Y Y Y Y V Y V Y V Y Y Y Y Y Y Y Y V V Y Y Y Y Y Y V Y Y Y Y Y Y Y Y V Y Y Y
15
16
15
1717
20 16 18
1516
17
1515
1416
18
201616
18
14
2017
21 1718 16
15
1716
14
15 18
1416
1716181616
2018
20
2016
1516161616
151715
20 15
1715
2017
V Y V V Y Y Y Y Y Y Y Y Y Y Y
v v Y Y 11
324 18 3 3
18 5
17 .
26 2
11
23
2753 4 4 5 . 619
24 215
20 3 1
11 426 3 9 .
17
27 4 1
10 1 4
63 15 4
34523 7
2336 710
5i) 7
20
9583 . 210 7
36
21 58 4
37
56 1 7
78
17 8 4 1 . 8
81 17 1 1 3
53
81 7 2
19
23
24 6 425 6 14
37 213
4649 1
14 9
18
2228 3 15
33 . 223 3
11 2
10
5311 5 4 1
13
7913 1
Y Y Y N N N N N N Y N N N N N N Y N Y
N Y Y N N N Y N N Y N N N N N N Y N N
N Y N N N N N N N Y N N N N N N Y N N
93 99
97
8796 9999
99
99
100
100
60
100
9780
479494
99
9999
100
90 98
59
88 8596
99
63
97
10066
479299
89
83
83
89
79
549899
94
9896
67 75
9989
88
98
9982
96
93
95
10070
7698
100
100
100
679999
100
40 9797
9190
7999
1009899
92
10086
776264
7086
94
6293
100
85 16
9399 7876
5421
84
9499
94
9793
92 69
54 93
7753
99
99
64 9464
B S B 1
3.0
3.0
3.0
2.0
2.5
3.0
3.0
2.5
3.0
3.0
3.0
3.0
0.0
3.0
2.5
2.5
0.0
3.0
2.5
3,0
3.0
3.5
3.0
3.0
2.0
2.5
0.0
2.0
3.0
3.0
3.0
0.0
1.0
2.5
0.0
0.0
2.5
2.5
0.5
0.0
0.0
0.0
1.0
2.0
3.0
3.0
2.0
3.0
3.0
15
0.5
2.5
3.0
1.0
3.0
0.0
3.0
2 0
0 0 0 2 1 0 0 1 0 0 0 0 4 0 0 1 6 0 1 0 0 0 0 0 1 1 6 2 0 0 0 6 4 1 3 4 1 1 2 4 0 5 4 3 0 0 2 0 0 3 4 1 0 4 0 5 0 2
84.2
94.7
84.5
70.7
73.3
84.8
82.0
77.7
77.2
83.5
81.3
87.8
50.0
95.0
91.4
73.3
50.0
83 2
78.0
86.7
85.7
75.0
89.5
83.0
81.6
82.3
52.0
72.8
85.0
80.3
87.7
50.0
64.5
81.0
61.3
50.0
76.0
82 3
71.3
58.0
47.2
73.0
61.8
83.5
81.S
74.3
78.3
83.0
67.8
62.8
75.7
77.3
64.8
77.7
54.0
84.3
73 8
3.0 0
3.5 0
0.0 0
0.0
1
3.0 0
3.0 0
3.0 0
3.0 0
0.0 2
3.0 0
3.0 0
3.0 0
0.0 6
3.0 0
2.5 0
3,0 0
0.0 3
0.0
1
3.0 0
3.0 0
3.0 0
3.5 0
3.0 0
3.0 0
0.0
1
0.0 6
0.0 5
0.0 3
0.0 0
0.0 5
2.5
1
3.0 0
0.0
1
0.5 3
2.5
1
0.0 2
0.0 5
3 0 0
0.0 0
3.0 0
3.0 0
3.0 0
3.0 0
2.5
1
1.5 3
0.0 5
2.5
1
0.0 2
3.0 0
3 0 0
0.0 3
3.0 0
0 0 5
0 0 6 4 0 0 0 0 4 0 0 0 0 0 0 0 3 5 0 0 0 0 0 0 5 0 1 3 6 1 0 0 5 2 0 4 1 0 1 0 0 0 0 0 0 0 0 4 0 0 3 0 1
87.0
88.9
57.0
84.3
84.5
81.7
80.0
57.0
86.7
85.7
89.3
50.2
95.5
90.2
82.6
59.0
50.0
81.5
79.7
88.8
82.6
87.8
85.0
57.0
56.7
58.4
66.7
53.8
77.0
90.0
68.0
63.0
77.5
68.5
50 8
87.2
79.5
85.0
80.2
81.3
70.3
71.5
50.6
76.2
64.5
87.8
73.8
50.0
89.5
53 0
v v v r
v v v v v Y r Y v Y 11 v v v v v v v v
RnT
CO
PY
AV
AIL
AB
LE
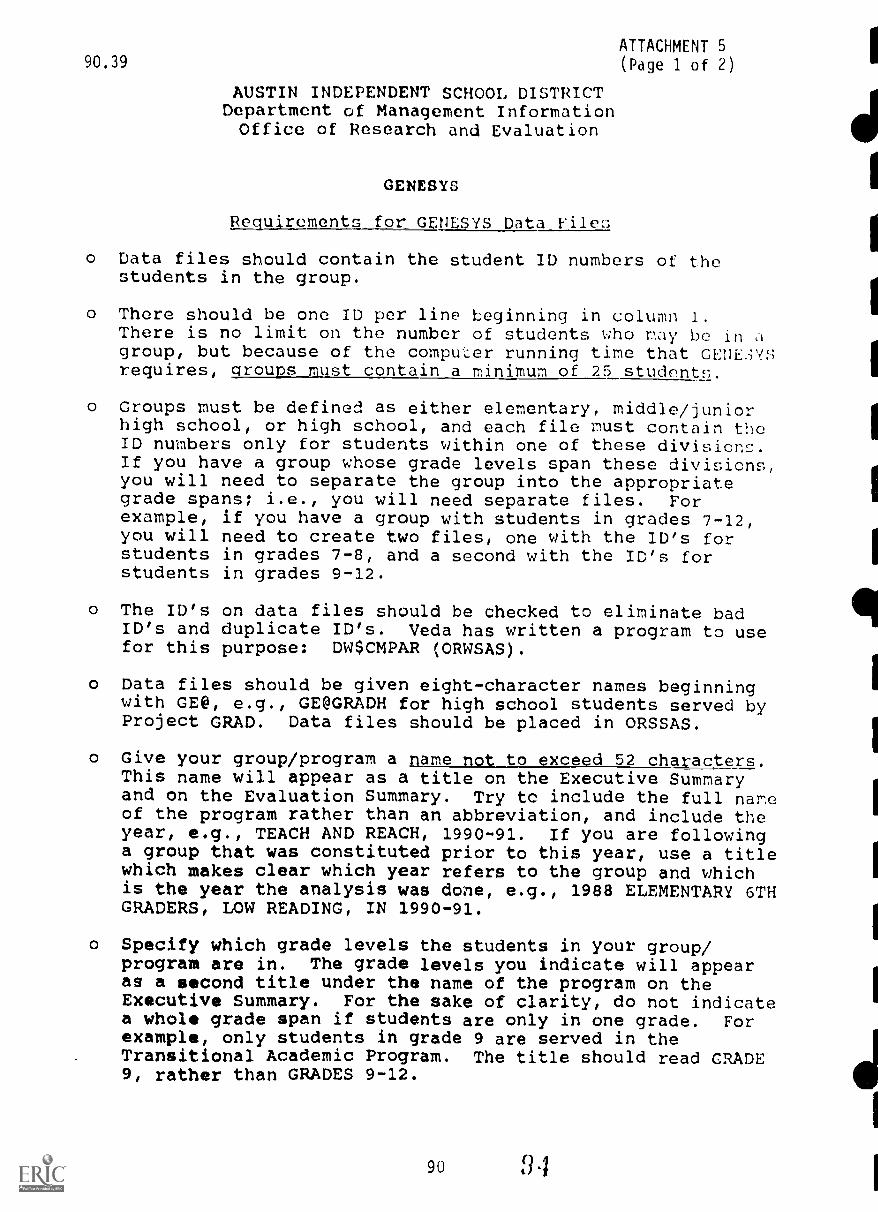
ATTACHMENT 590.39 (Page 1 of 2)
AUSTIN INDEPENDENT SCHOOL DISTRICTDepartment of Management InformationOffice of Research and Evaluation
GENESYs
Requirements for GENESYS Data Files
o Data files should contain the student ID numbers of thestudents in the group.
o There should be one ID per line beginning in column 1.There is no limit on the number of students who nay be in a
group, but because of the computer running time that GENEsrequires, groung_muat_contain a minimum of 25 student.
o Groups must be defined as either elementary, middle/juniorhigh school, or high school, and each file must contain theID numbers only for students within one of these divisions.If you have a group whose grade levels span these divisicns,you will need to separate the group into the appropriategrade spans; i.e., you will need separate files. Forexample, if you have a group with students in grades 7-12,you will need to create two files, one with the ID's forstudents in grades 7-8, and a second with the ID's forstudents in grades 9-12.
o The ID's on data files should be checked to eliminate badID's and duplicate ID's. Veda has written a program to usefor this purpose: DW$CMPAR (ORWSAS).
o Data files should be given eight-character names beginningwith GE@, e.g., GE@GRADH for high school students served byProject GRAD. Data files should be placed in ORSSAS.
o Give your group/program a name not to exceed 52 characters.This name will appear as a title on the Executive Summaryand on the Evaluation Summary. Try to include the full nameof the program rather than an abbreviation, and include theyear, e.g., TEACH AND REACH, 1990-91. If you are followinga group that was constituted prior to this year, use a titlewhich makes clear which year refers to the group and whichis the year the analysis was done, e.g., 1988 ELEMENTARY 6THGRADERS, LOW READING, IN 1990-91.
o Specify which grade levels the students in your group/program are in. The grade levels you indicate will appearas a second title under the name of the program on theExecutive Summary. For the sake of clarity, do not indicatea whol grade span if students are only in one grade. Forexample, only students in grade 9 are served in theTransitional Academic Program. The title should read CRADE9, rather than GRADES 9-12.
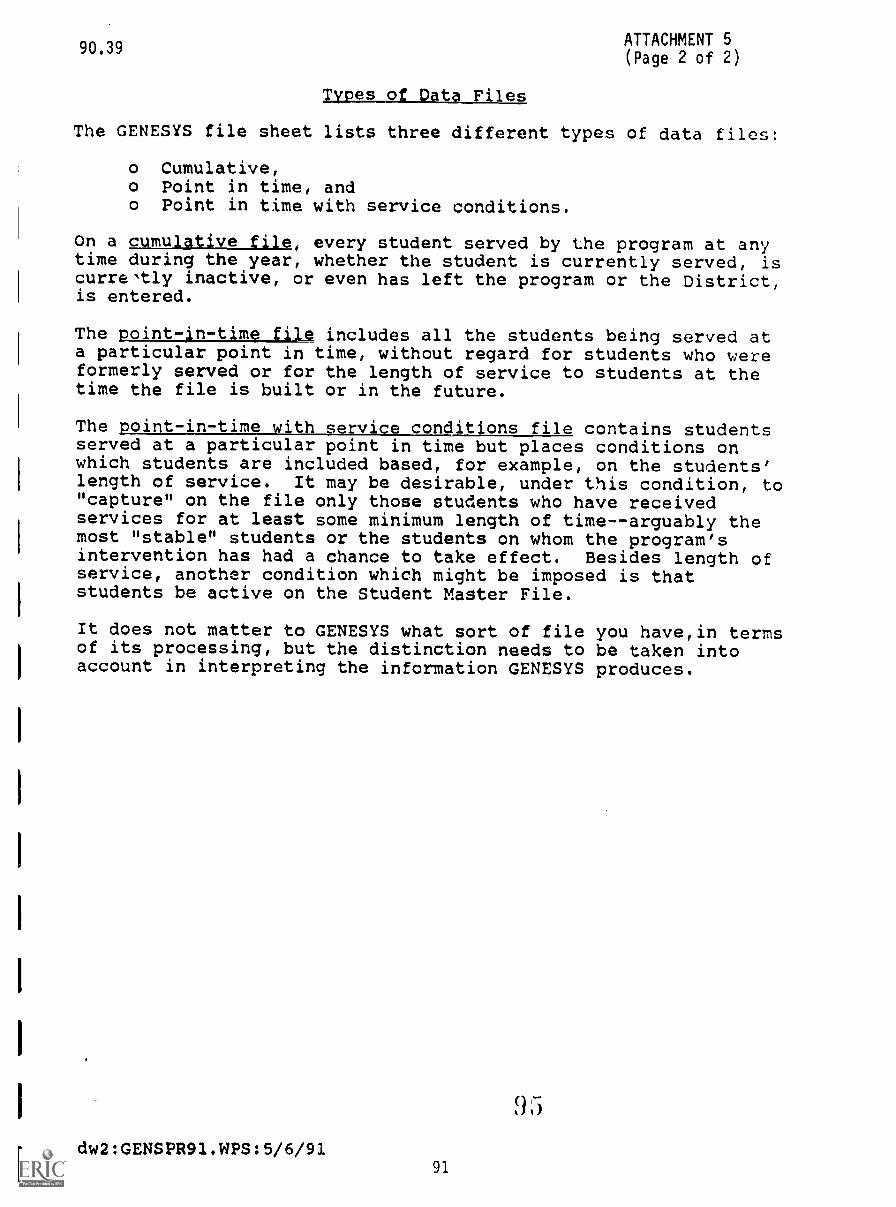
90.39
Types of Data Files
ATTACHMENT 5(Page 2 of 2)
The GENESIS file sheet lists three different types of data files:
o Cumulative,o Point in time, ando Point in time with service conditions.
On a cumulative file, every student served by the program at anytime during the year, whether the student is currently served, iscurre,tly inactive, or even has left the program or the District,is entered.
The point-In-time file includes all the students being served ata particular point in time, without regard for students who wereformerly served or for the length of service to students at thetime the file is built or in the future.
The point-in-time with service conditions file contains studentsserved at a particular point in time but places conditions onwhich students are included based, for example, on the students'length of service. It may be desirable, under this condition, to"capture" on the file only those students who have receivedservices for at least some minimum length of time--arguably themost "stable" students or the students on whom the program'sintervention has had a chance to take effect. Besides length ofservice, another condition which might be imposed is thatstudents be active on the Student Master File.
It does not matter to GENESIS what sort of file you havelin termsof its processing, but the distinction needs to be taken intoaccount in interpreting the information GENESYS produces.
dw2:GENSPR91.WPS:5/6/9191
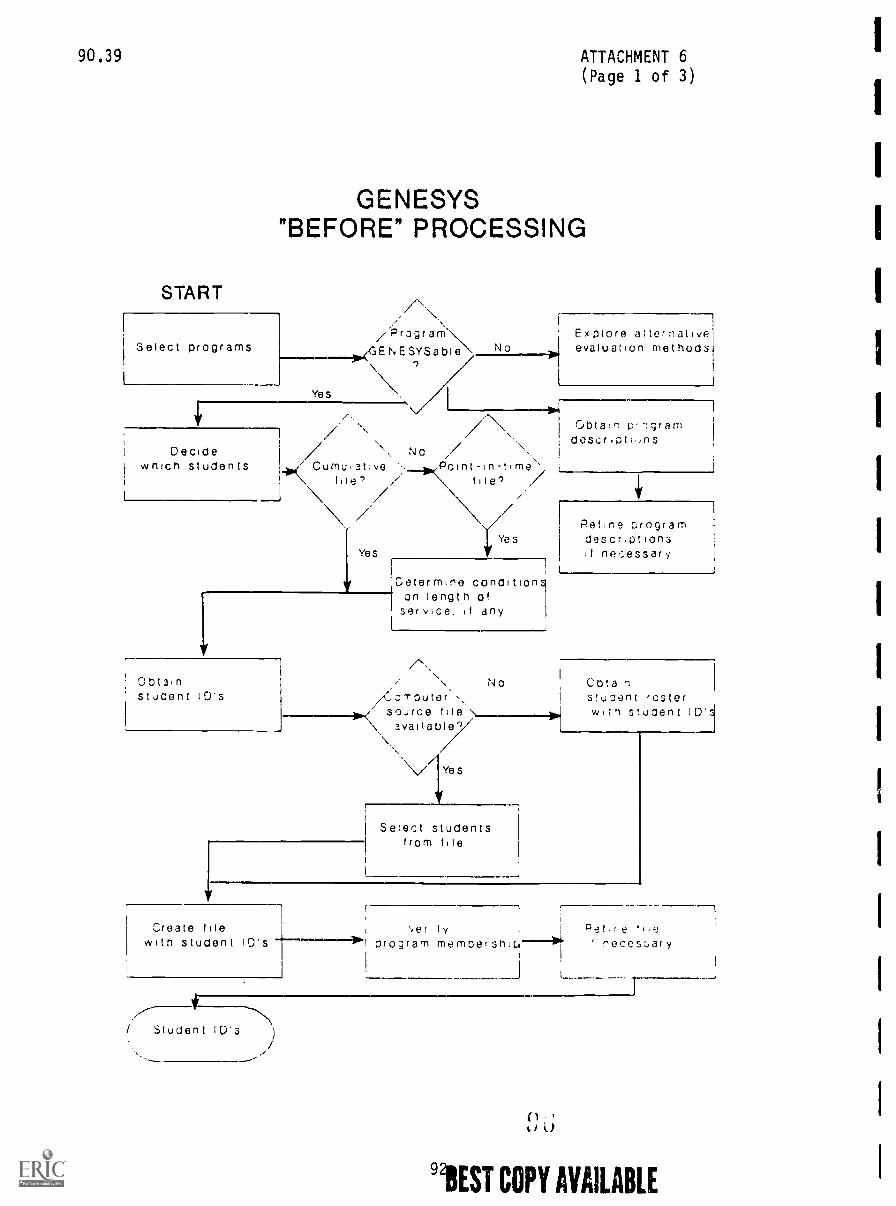
90.39
START
Select programs
ATTACHMENT 6(Page 1 of 3)
GENESYS"BEFORE" PROCESSING
// Prorram\d Explore alternative36,<GENESYSable\ No evaluation methods
Yes
\ 1\ Si
Decidewhich students
OttsinstJcent ID's
No4,(Curnu,ative
Ille/Point-in-time
tile? /\i Y
Yeses
Determine condition
1
on length ofservice, it any
/
tid-r0utersojrce file
\ 3vailaOle9\Yes
No
1
Gota,r1 p--)gramdescr.pti,,f1S
Pefne programdescr.otionsII ne,Lessary
etr,astudent fosterwith student ID
I Select studentsIrom tile
Create tilewith student 1D's Of ograrn
Student ID
1
I y °el nemembership-01. necest,ar y
J
91EST COPY AVAILABLE
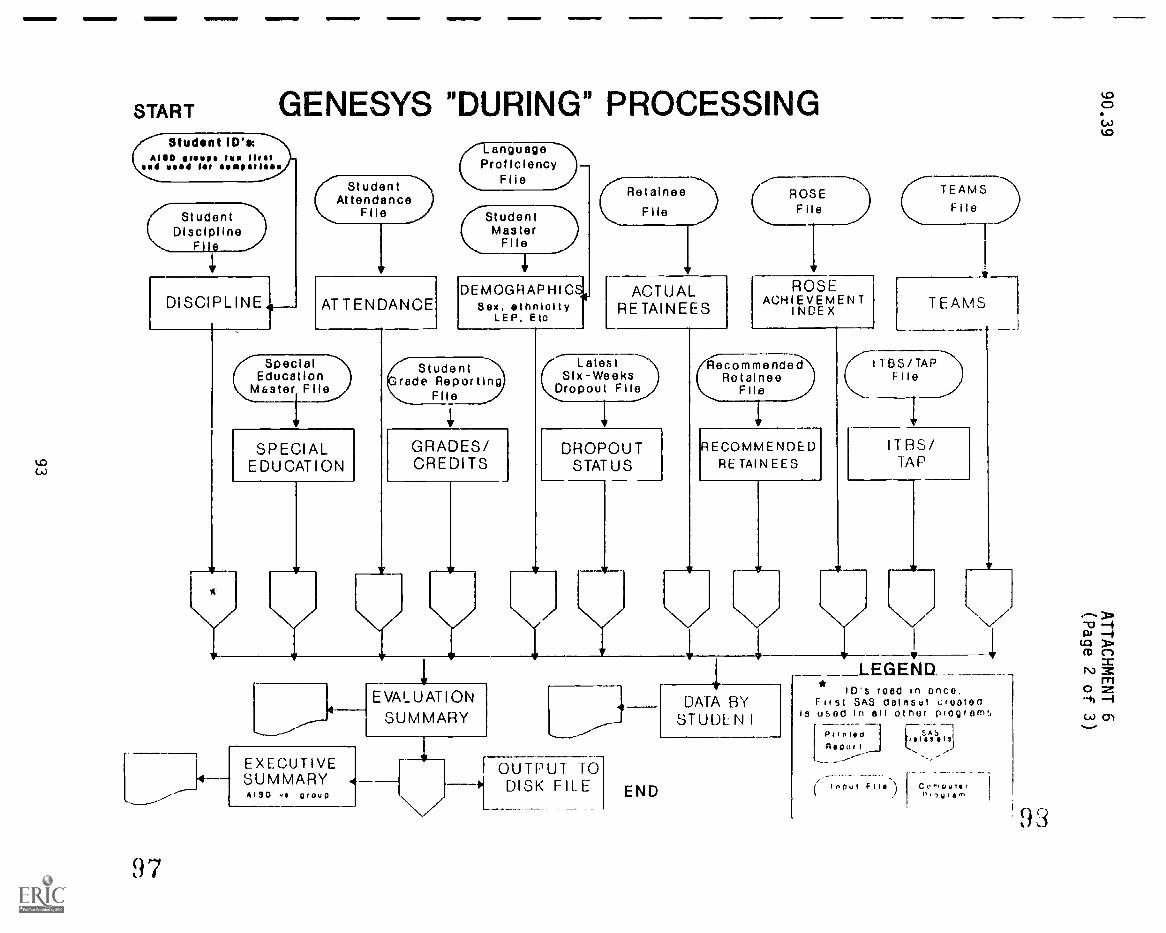
START GENESYS "DURING" PROCESSING 6c)
CAIStudent ID's:SO fless fee fleet
Sad weed ler ffeseeflets
( StudentDiscipHne
File
lir
DISCIPLINE 4
9 7
("languageProficiency
Student \ Hies.Attendance
Flle
1
ATTENDANCE
( SpecialEducation
Master File
SPECIALEDUCATION
StudentMaster
Hie
RetalneeFile
IDEMOGHAPHICS, ACTUALSex, ethnloIty RETAINEESLEP, Eta
Studentrade Reporting
Flle
GRADES/CREDITS
( LatestSi x-Weeks
Dropou File
DROPOUTSTATUS
ROSEF Ile
TEAMS )
ROSEACHIEVEMENT
I NDE X
RecommendedRotainee
File
RECOMMENDEDFIE TAINEES
TEAMS
11BS/ TAPF: i le
ITBS/TAP
y \/JLEGEND
4SUtv1MARY 1 STUDENT
DATA BY iris usoa 811 01 no( ofogroms
Fst SAS det t)es! CteetedID's reed in once.EVALUATION
Rsooft
EXECUTIVESUMMARYAlso . group
I OUTPUT TO]DISK FILE END
- -. ____
( I nOuf F Cott.outer` u a
9(3
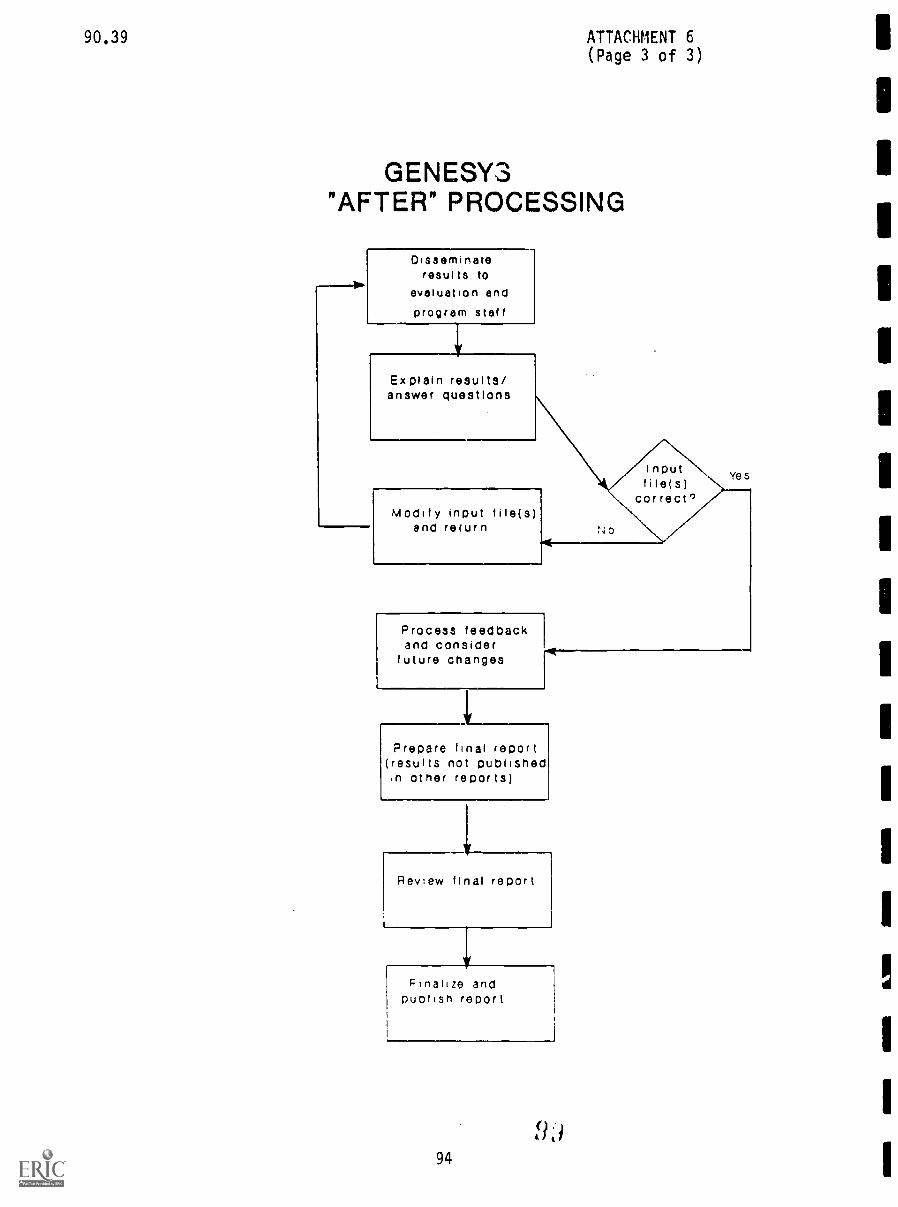
90.39 ATTACHMENT 6(Page 3 of 3)
GENESY3"AFTER" PROCESSING
Disseminateresults to
evaluation andprogram staff
Explain results/answer questions
Modify input file(s)and recurn N o
inputfile(s)
correct")
Ye s
Process feedbackand consider
future changes
Prepare final report(results not published,r1 other reports)
Review final report
Pinailze andpublish report
94
9,1
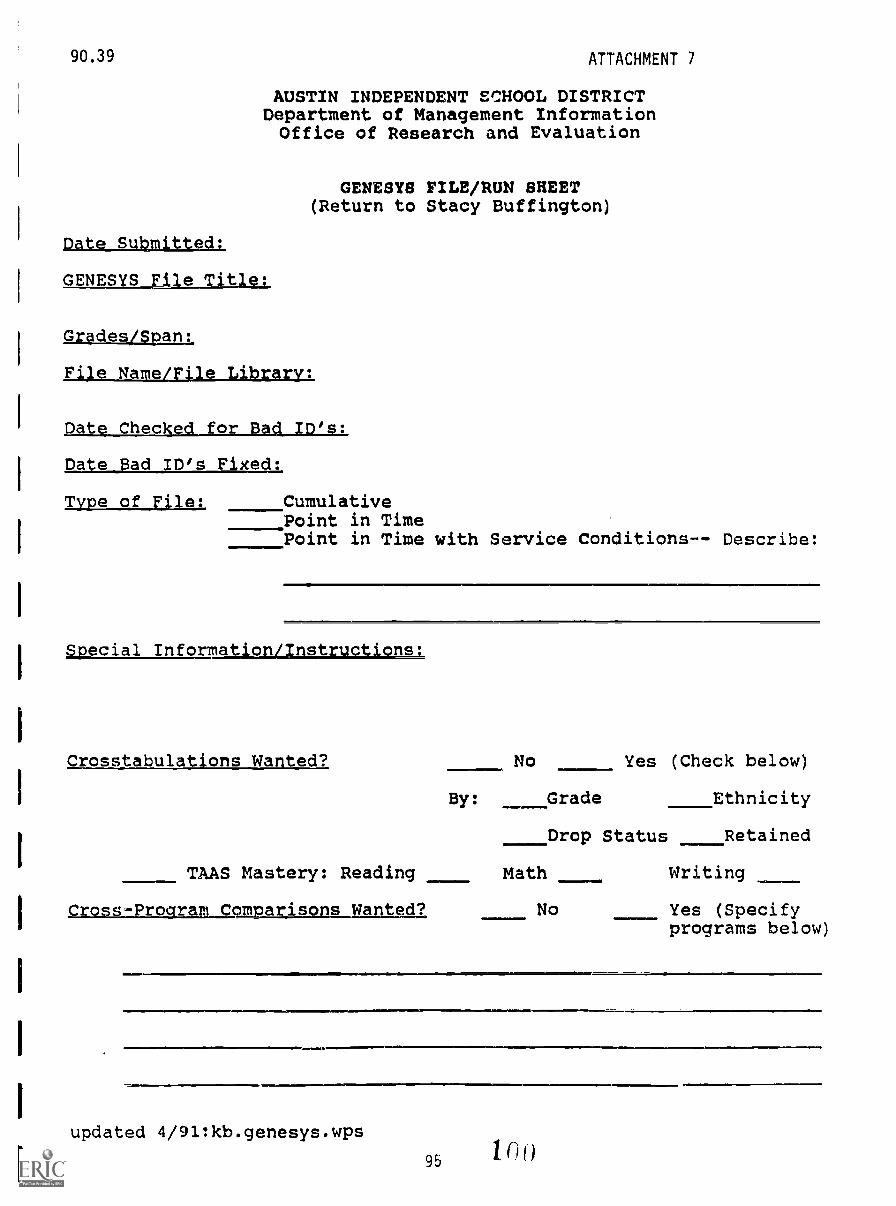
90.39 ATTACHMENT 7
AUSTIN INDEPENDENT ECHOOL DISTRICTDepartment of Management InformationOffice of Research and Evaluation
GENESIS FILE/RUN SHEET(Return to Stacy Buffington)
Date Submitted:
gal Elia_Ellt2rItlfti
ausiggLERIaL
File Name/rile Library:
2att.SJILIligitillt_PLOA_LaLEL
Date_illad IDis Fixed:
TYRA_QL_Eilli CumulativePoint in TimePoint in Time with Service Conditions-- Describe:
Soecial Information/Instructions:
Crosstabulations Wanted? No Yes (Check below)
By: Grade Ethnicity
Drop Status Retained
TAAS Mastery: Reading Math Writing
Compari_Agang_ljanted? No Yes (Specifyprograms below)
=ammelaalmiNIININA.=111.
updated 4/91:kb.genesys.wps
951
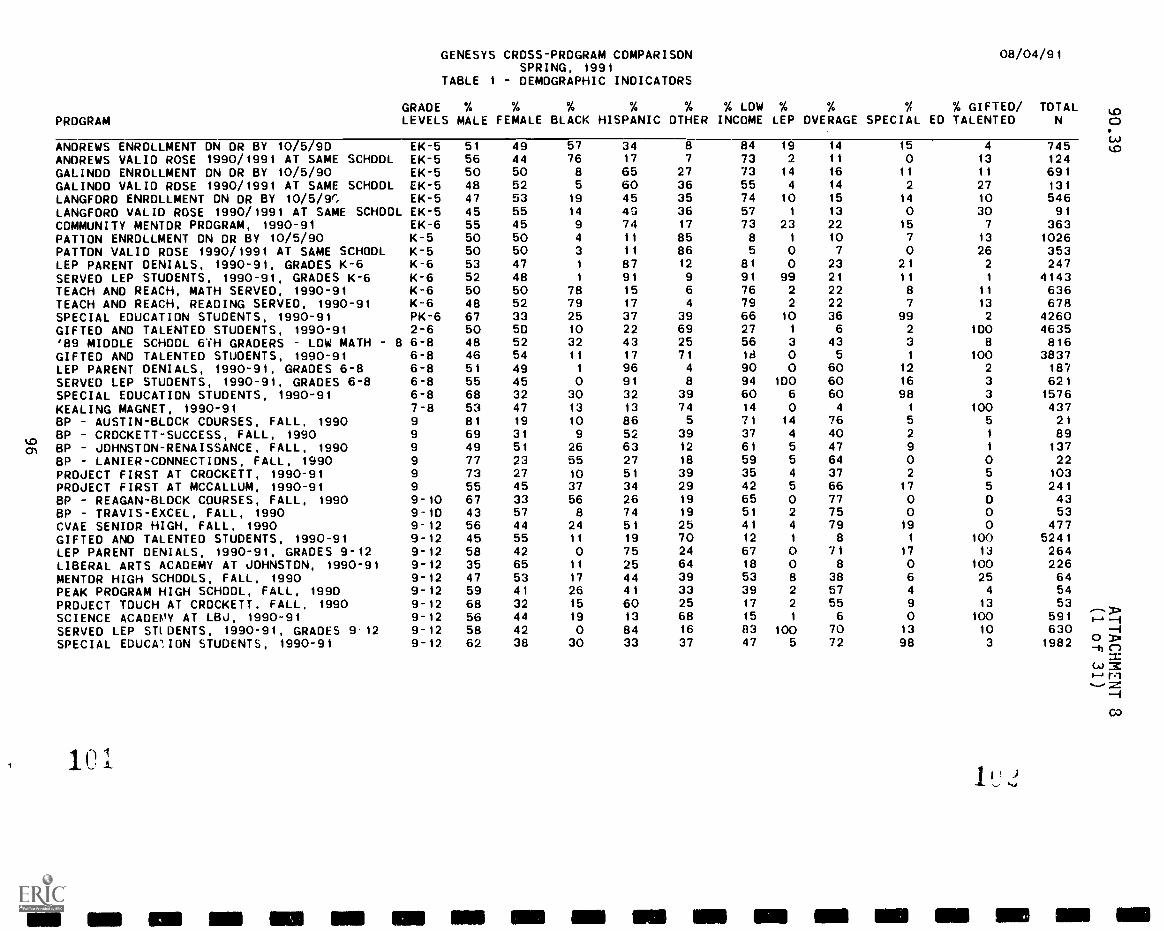
PROGRAM
GENESYS CROSS-PROGRAM COMPARISONSPRING, 1991
TABLE 1 - DEMOGRAPHIC INDICATORS
GRADE % % % % %LEVELS MALE FEMALE BLACK HISPANIC OTHER
% LOW % %INCOME LEP OVERAGE
08/04/91
V % GIFTED/ TOTALSPECIAL ED TALENTED N
UDcp
ANDREWS ENROLLMENT ON DR BY 10/5/90 EK-5 51 49 57 34 8 84 19 14 15 4 745 UDANDREWS VALID ROSE 1990/1991 AT SAME SCHOOL EK-5 56 44 76 17 7 73 2 it 0 13 124GALINDO ENROLLMENT ON DR BY 10/5/90 EK-5 50 50 8 65 27 73 14 16 11 11 691GALINDO VALID ROSE 1990/1991 AT SAME SCHOOL EK-5 48 52 5 60 36 55 4 14 2 27 131LANGFORD ENROLLMENT ON OR BY 10/5/9r, EK-5 47 53 19 45 35 74 10 15 14 10 546LANGFORD VALID ROSE 1990/1991 AT SAME SCHOOL EK-5 45 55 14 4G 36 57 1 13 0 30 91COMMUNITY MENTOR PROGRAM, 1990-91 EK-6 55 45 9 74 17 73 23 22 15 7 363PATTON ENROLLMENT ON DR BY 10/5/90 K-5 50 50 4 11 85 8 1 10 7 13 1026PATTON VALID ROSE 1990/1991 AT SAME SCHOOL K-5 50 50 3 it 86 5 0 7 0 26 353LEP PARENT DENIALS, 1990-91, GRADES K-6 K-6 53 47 1 87 12 81 0 23 21 2 247SERVED LEP STUDENTS, 1990-91, GRADES K-6 K-6 52 48 1 91 9 91 89 21 ii 1 4143TEACH AND REACH, MATH SERVED, 1990-91 K-6 50 50 78 15 6 76 2 22 8 it 636TEACH AND REACH, READING SERVED, 1990-91 K-6 48 52 79 17 4 79 2 22 7 13 678SPECIAL EDUCATION STUDENTS, 1990-91 PK-6 67 33 25 37 39 66 10 36 99 2 4260GIFTED AND TALENTED STUDENTS, 1990-91 2-6 50 50 10 22 69 27 1 6 2 100 4635'89 MIDDLE SCHOOL 61H GRADERS LOW MATH 8 6-8 48 52 32 43 25 56 3 43 3 8 816GIFTED AND TALENTED STUDENTS, 1990-91 6-8 46 54 11 17 71 id 0 5 1 100 3837LEP PARENT DENIALS, 1990-91, GRADES 6-8 6-8 51 49 1 96 4 90 0 60 12 2 187SERVED LEP STUDENTS, 1990-91, GRADES 6-8 6-8 55 45 0 91 8 94 100 60 16 3 621SPECIAL EDUCATION STUDENTS, 1990-91 6-8 68 32 30 32 39 60 6 60 98 3 1576KEALING MAGNET, 1990-91 7-8 53 47 13 13 74 14 0 4 1 100 437BP AUSTIN-BLOCK COURSES, FALL, 1990 9 81 19 10 86 5 71 14 76 5 5 21
QDcn
BP CROCKETT-SUCCESS, FALL, 1990BP JOHNSTON-RENAISSANCE, FALL, 1990
99
6949
3151
926
5263
3912
3761
45
4047
2
91
1
89137
BP LANIER-CONNECTIONS, FALL, 1990 9 77 23 55 27 18 59 5 64 0 0 22PROJECT FIRST AT CROCKETT, 1990-91 9 73 27 10 51 39 35 4 37 2 5 103PROJECT FIRST AT MCCALLUM, 1990-91 9 55 45 37 34 29 42 5 66 17 5 241BP - REAGAN-BLOCK COURSES, FALL, 1990 9-10 67 33 56 26 19 65 0 77 0 0 43BP TRAVIS-EXCEL, FALL, 1990 9-10 43 57 8 74 19 51 2 75 0 0 53CVAE SENIOR HIGH, FALL, 1990 9-12 56 44 24 51 25 41 4 79 19 0 477GIFTED AND TALENTED STUDENTS, 1990-91 9-12 45 55 11 19 70 12 1 8 1 100 5241LEP PARENT DENIALS, 1990-91, GRADES 9-12 9-12 58 42 0 75 24 67 0 71 17 13 264LIBERAL ARTS ACADEMY AT JOHNSTON, 1990-91 9-12 35 65 11 25 64 18 0 8 0 100 226MENTOR HIGH SCHOOLS, FALL, 1990 9-12 47 53 17 44 39 53 8 38 6 25 64PEAK PROGRAM HIGH SCHOOL, FALL, 1990 9-12 59 41 26 41 33 39 2 57 4 4 54PROJECT TOUCH AT CROCKETT, FALL. 1990 9-12 68 32 15 60 25 17 2 55 9 13 53SCIENCE ACADEMY AT LBJ, 1990-91 9-12 56 44 19 13 68 15 1 6 0 100 591 1_4_1
SERVED LEP STIDENTS, 1990-91, GRADES 9 12 9-12 58 42 0 84 16 83 100 70 13 10 630 -A
SPECIAL EDUCAI.ION STUDENTS, 1990-91 9-12 62 38 30 33 37 47 5 72 98 3 1982 -he)m(A MI-' 1'1
1
MI MI !II I= Ell MN INS MI UM all MI IIII MS I= MI
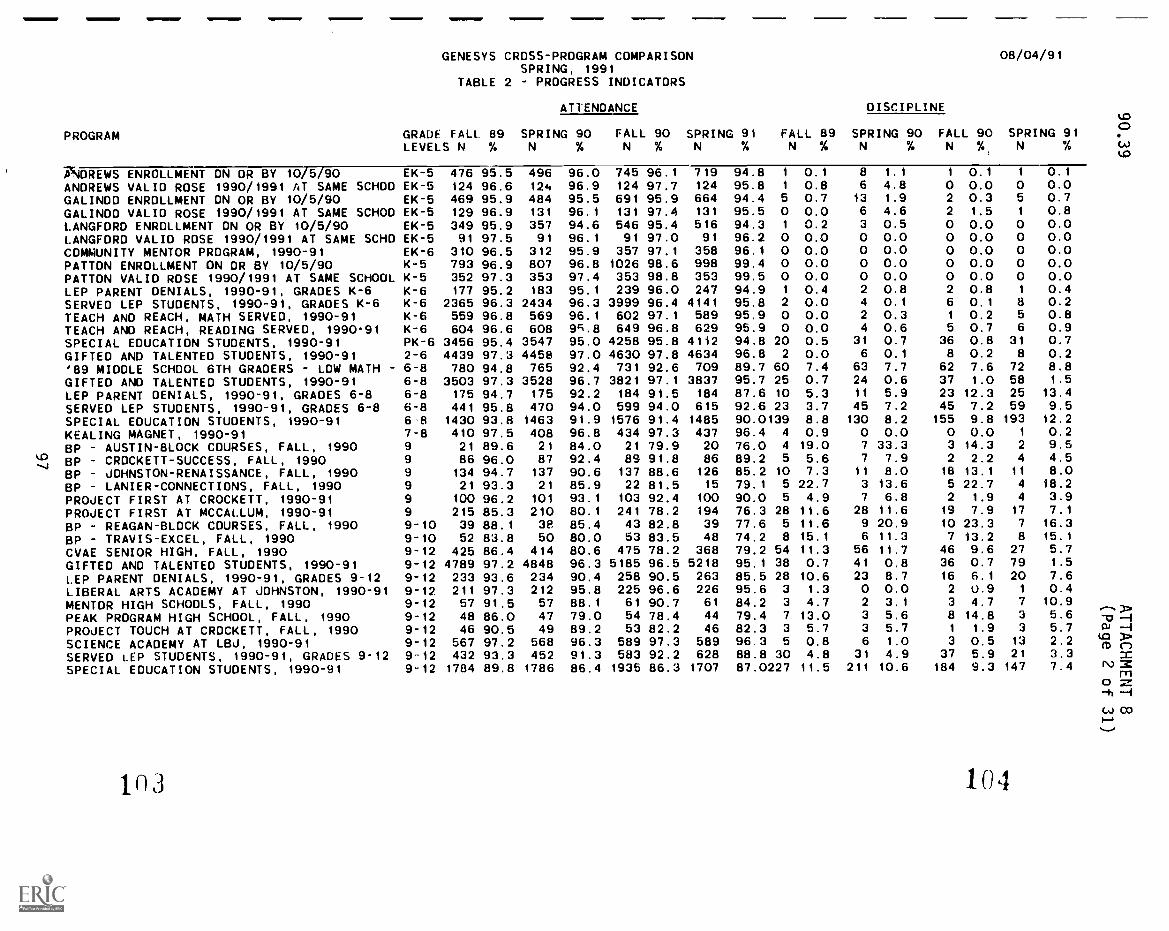
GENESYS CROSS-PROGRAM COMPARISONSPRING, 1991
TABLE 2 - PROGRESS INDICATORS
ATTENDANCE
PROGRAM GRADE FALL 89 SPRING 90 FALL 90 SPRING 91LEVELS N % N N % N
DISCIPLINE
08/04/91
FALL 89 SPRING 90 FALL 90 SPRING 91N % N % N %, N
ADREWS ENROLLMENT ON DR BY 10/5/90 EK-5 476 95.5 496ANDREWS VALID ROSE 1990/1991 AT SAME SCHOD EK-5 124 96.6 124GALINDO ENROLLMENT ON OR BY 10/5/90 EK-5 469 95.9 484GALINDO VALID ROSE 1990/1991 AT SAME SCHOD EK-5 129 96.9 131LANGFORD ENROLLMENT ON OR BY 10/5/90 EK-5 349 95.9 357LANGFORD VALID ROSE 1990/1991 AT SAME SCHO EK-5 91 97.5 91COMMUNITY MENTOR PROGRAM, 1990-91 EK-6 310 96.5 312PATTON ENROLLMENT ON DR BY 10/5/90 K-5 793 96.9 807PATTON VALID ROSE 1990/1991 AT SAME SCHOUL K-5 352 97.3 353LEP PARENT DENIALS, 1990-91, GRADES K-6 K-6 177 95.2 183SERVED LEP STUDENTS, 1990-91, GRADES K-6 K-6 2365 96.3 2434TEACH AND REACH, MATH SERVED, 1990-91 K-6 559 96.8 569TEACH AND REACH, READING SERVED, 1990-91 K-6 604 96.6 608SPECIAL EDUCATION STUDENTS, 1990-91 PK-6 3456 95.4 3547GIFTED AND TALENTED STUDENTS, 1990-91 2-6 4439 97.3 4458'89 MIDDLE SCHOOL 6TH GRADERS LOW MATH - 6-8 780 94.8 765GIFTED AND TALENTED STUDENTS, 1990-91LEP PARENT DENIALS, 1990-91, GRADES 6-8SERVED LEP STUDENTS, 1990-91, GRADES 6-8SPECIAL EDUCATION STUDENTS, 1990-91KEALING MAGNET, 1990-91BP AUSTIN-8LOCK COURSES, FALL, 1990BP - CROCKETT-SUCCESS, FALL, 1990BP JOHNSTON-RENAISSANCE, FALL, 1990Bp - LANIER-CONNECTIONS, FALL, 1990PROJECT FIRST AT CROCKETT, 1990-91PROJECT FIRST AT MCCALLUM, 1990-91BP REAGAN-BLOCK COURSES, FALL, 1990BP - TRAVIS-EXCEL, FALL, 1990CVAE SENIOR HIGH, FALL, 1990GIFTED AND TALENTED STUDENTS, 1990-91LEP PARENT DENIALS, 1990-91, GRADES 9-12LIBERAL ARTS ACADEMY AT JOHNSTON, 1990-91MENTOR HIGH SCHOOLS, FALL, 1990PEAK PROGRAM HIGH SCHOOL, FALL, 1990PROJECT TOUCH AT CROCKETT, FALL, 1990SCIENCE ACADEMY AT LBJ, 1990-91SERVED LEP STUDENTS, 1990-91, GRADES 9-12SPECIAL EDUCATION STUDENTS, 1990-91
6-8 3503 97.3 35286-8 175 94.7 1756-8 441 95.8 4706-8 1430 93.8 14637-8 410 97.5 4089 21 89.6 219 86 96.0 879 134 94.7 1379 21 93.3 21
9 100 96.2 1019 215 85.3 2109-10 39 88.1 389-10 52 83.8 509-12 425 86.4 4149-12 4789 97.2 48489-12 233 93.6 2349-12 211 97.3 2129-12 57 91.5 579-12 48 86.0 479-12 46 90.5 499-12 567 97.2 5689-12 432 93.3 4529-12 1784 89.8 1786
96.0 745 96.1 71996.9 124 97.7 12495.5 691 95.9 66496.1 131 97.4 13194.6 546 95.4 51696.1 91 97.0 9195.9 357 97.1 35896.8 1026 98.6 99897.4 353 98.8 35395.1 239 96.0 24796.3 3999 96.4 414196.1 602 97.1 5899c.8 649 96.8 62995.0 4258 95.8 411297.0 4630 97.8 463492.4 731 92.6 70996.7 3821 97.1 383792.2 184 91.5 18494.0 599 94.0 61591.9 1576 91.4 148596.8 434 97.3 43784.0 21 79.9 2092.4 89 91.8 8690.6 137 88.6 12685.9 22 81.5 15
93.1 103 92.4 10080.1 241 78.2 19485.4 43 82.8 3980.0 53 83.5 4880.6 475 78.2 36896.3 5185 96.5 521890.4 258 90.5 26395.8 225 96.6 22688.1 61 90.7 6179.0 54 78.4 4489.2 53 82.2 4696.3 589 97.3 58991.3 583 92.2 62886.4 1935 86.3 1707
94.8 1 0.195.8 1 0.894.4 5 0.795.5 0 0.094.3 1 0.296.2 0 0.096.1 0 0.099.4 0 0.099.5 0 0.094.9 1 0.495.8 2 0.095.9 0 0.095.9 0 0.094.8 20 0.596.8 2 0.089.7 60 7.495.7 25 0.787.6 10 5.392.6 23 3.790.0139 8.896.4 4 0.976.0 4 19.089.2 5 5.685.2 10 7.379.1 5 22.790.0 5 4.976.3 28 11.677.6 5 11.674.2 8 15.179.2 54 11.395.1 38 0.785.5 28 10.695.6 3 1.384.2 3 4.779.4 7 13.082.3 3 5.796 3 5 0.888.8 30 4.887.0227 11.5
8 1.16 4.8
13 1.96 4.63 0.5O 0.0O 0.0O 0.0O 0.02 0.84 0.12 0.34 0.6
31 0.76 0.1
63 7.724 0.611 5.945 7.2130 8.2O 0.07 33.37 7.9
11 8.03 13.67 6.8
28 11.69 20.96 11.3
56 11.741 0.823 8.7O 0.02 3.13 5.63 5.76 1.0
31 4.9211 10.6
1 0.1 1
O 0.0 02 0.3 5
2 1.5 1
O 0.0 0O 0.0 0O 0.0 0O 0.0 0O 0.0 02 0.8 1
6 0.1 81 0.2 55 0.7 636 0.8 318 0.2 862 7.6 7237 1.0 5823 12.3 2545 7.2 59155 9.8 193O 0.0 1
3 14.3 2
2 2.2 4
18 13.1 11
5 22.7 4
2 1.9 4
19 7.9 17
10 23.3 7
7 13.2 846 9.6 2736 0.7 7916 6.1 202 0.9 1
3 4.7 7
8 14.8 3
1 1.9 33 0.5 1337 5.9 21
184 9.3 147
1n3 104
0.10.00.70.80.00.00.00.00.00.40.20.80.90.70.28.81.5
13.49.512.20.29.54.58.018.23.97.116.315.15.71.57.60.410.95.65.72.23.37.4
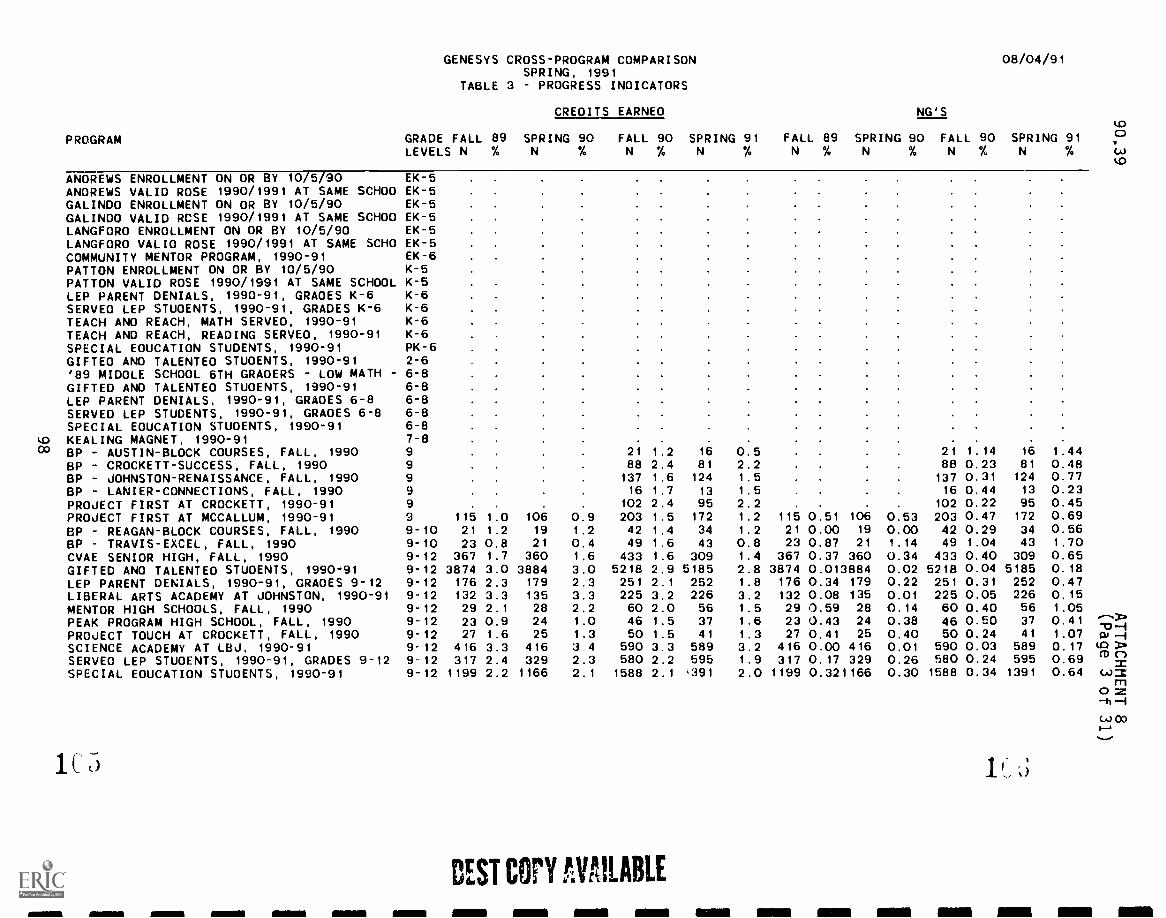
PROGRAM
GENESYS CROSS-PROGRAMSPRING,
TABLE 3 PROGRESS
GRADE FALL 89 SPRINGLEVELS N % N
COMPARISON1991
INDICATORS
CREDITS EARNED
SPRINGN
91 FALL 89 SPRINGN % N
NG'S
90%
08/04/91
SPRING 91N
90 FALLN
90%
90%
FALLN
ANDREWS ENROLLMENT DN DR BY 10/5/90 EK-5ANDREWS VALID ROSE 1990/1991 AT SAME SCHOO EK-5GALINDD ENROLLMENT DN OR BY 10/5/90 EK-5GALINDO VALID RCSE 1990/1991 AT SAME SCHOO EK-5LANGFORD ENROLLMENT ON OR BY 10/5/90 EK-5LANGFORD VALID ROSE 1990/1991 AT SAME SCHO EK-5COMMUNITY MENTOR PROGRAM, 1990-91 EK-6PATTON ENROLLMENT ON OR BY 10/5/90 K-5PATTON VALID ROSE 1990/1991 AT SAME SCHOOL K-5LEP PARENT DENIALS, 1990-91, GRADES K-6 K-6SERVED LEP STUDENTS, 1990-91, GRADES K-6 K-6TEACH AND REACH, MATH SERVED, 1990-91 K-6TEACH AND REACH, READING SERVED, 1990-91 K-6SPECIAL EDUCATION STUDENTS, 1990-91 PK-6GIFTED AND TALENTEO STUDENTS, 1990-91 2-6'89 MIDDLE SCHDOL 6TH GRADERS LOW MATH 6-8GIFTED AND TALENTED STUDENTS, 1990-91 6-8LEP PARENT DENIALS, 1990-91, GRADES 6-8 6-8SERVED LEP STUDENTS, 1990-91, GRADES 6-8 6-8SPECIAL EDUCATIDN STUDENTS, 1990-91 6-8
q) KEALING MAGNET, 1990-91 7-80° BP - AUSTIN-BLOCK COURSES, FALL, 1990 9 21 1.2 16 0.5 21 1.14 16 1.44
BP - CROCKETT-SUCCESS, FALL, 1990 9 88 2.4 81 2.2 88 0.23 81 0.48BP - JOHNSTON-RENAISSANCE, FALL, 1990 9 137 1.6 124 1.5 137 0.31 124 0.77BP LANIER-CONNECTIONS, FALL, 1990 9 16 1.7 13 1.5 16 0.44 13 0.23PROJECT FIRST AT CROCKETT, 1990-91 9 . . 102 2.4 95 2.2 102 0.22 95 0.45PRDJECT FIRST AT MCCALLUM, 1990-91 9 115 1.0 106 0.9 203 1.5 172 1.2 115 0.51 106 0.53 203 0.47 172 0.69BP REAGAN-BLOCK COURSES, FALL, 1990 9-10 21 1.2 19 1.2 42 1.4 34 1.2 21 0.00 19 0.00 42 0.29 34 0.56BP TRAVIS-EXCEL, FALL, 1990 9-10 23 0.8 21 0.4 49 1.6 43 0.8 23 0.87 21 1.14 49 1.04 43 1.70CVAE SENIOR HIGH, FALL, 1990 9-12 367 1.7 360 1.6 433 1.6 309 1.4 367 0.37 360 0.34 433 0.40 309 0.65GIFTED AND TALENTEO STUDENTS, 1990-91 9-12 3874 3.0 3884 3.0 5218 2.9 5185 2.8 3874 0.013884 0.02 5218 0.04 5185 0.18LEP PARENT DENIALS, 1990-91, GRADES 9-12 9-12 176 2.3 179 2.3 251 2.1 252 1.8 176 0.34 179 0.22 251 0.31 252 0.47LIBERAL ARTS ACADEMY AT JOHNSTON, 1990-91 9-12 132 3.3 135 3.3 225 3.2 226 3.2 132 0.08 135 0.01 225 0.05 226 0.15MENTOR HIGH SCHOOLS, FALL, 1990 9-12 29 2.1 28 2.2 60 2.0 56 1.5 29 0.59 28 0.14 60 0.40 56 1.05PEAK PROGRAM HIGH SCHOOL, FALL, 1990PROJECT TOUCH AT CROCKETT, FALL, 1990
9-12 239-12 27
0.91.6
2425
1.01.3
4650
1.51.5
3741
1.61.3
2327
0.43 240.41 25
0.380.40
4650
0.500.24
3741
0.411.07
'3-1
SCIENCE ACADEMY AT LEW, 1990-91 9-12 416 3.3 416 3 4 590 3.3 589 3.2 416 0.00 416 0.01 590 0.03 589 0.17SERVED LEP STUDENTS, 1990-91, GRADES 9-12 9-12 317 2.4 329 2.3 580 2.2 595 1.9 317 0.17 329 0.26 580 0.24 595 0.69 a)
SPECIAL EDUCATION STUDENTS, 1990-91 9-12 1199 2.2 1166 2.1 1588 2.1 391 2.0 1199 0.321166 0.30 1588 0.34 1391 0.64 wnc
1(
REST Cr t:VAILABLE
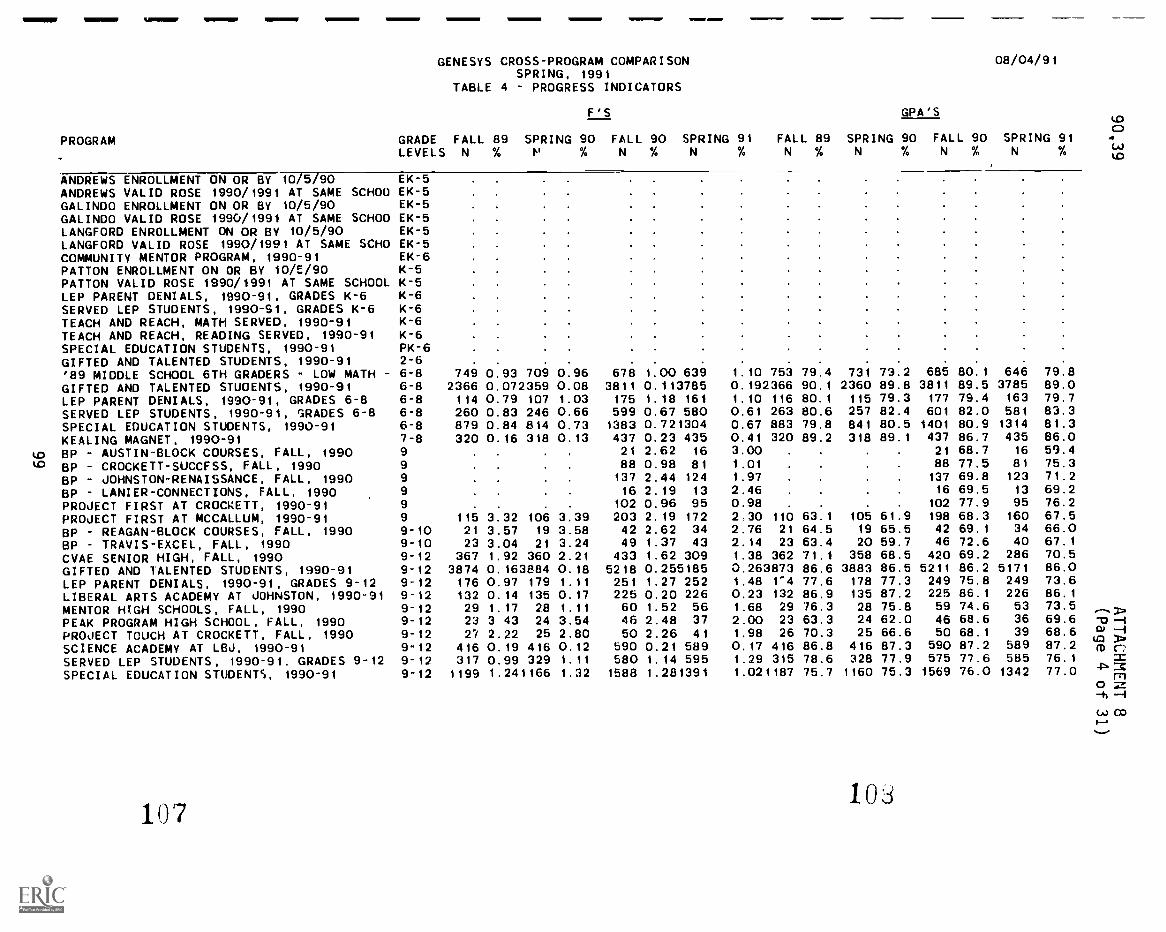
GENESYS CROSS-PROGRAMSPRING, 1991
TABLE 4 PROGRESS
PROGRAM GRADE FALL 89 SPRING 90LEVELS N % P %
COMPARISON
INDICATORS
F'S
90 SPRING% N
91 FALL 89N %
SPRINGN
GPA'S
90%
08/04/91
SPRING 91N
to
cJto
FALLN
90%
FALLN
ANDREWS ENROLLMENT ON OR BY 10/5/90 EK-5ANDREWS VALID ROSE 1990/1991 AT SAME SCHOO EK-5GALINDO ENROLLMENT ON OR BY 10/5/90 EK-5GALINDO VALID ROSE 1990/1991 AT SAME SCHOO EK-5LANGFORD ENROLLMENT ON OR BY 10/5/90 EK-5LANGFORD VALID ROSE 1990/1991 AT SAME SCHO EK-5COMMUNITY MENTOR PROGRAM, 1990-91 EK-6PATTON ENROLLMENT ON OR BY 10/E/90 K-5PATTON VALID ROSE 1990/1991 AT SAME SCHOOL K-5LEP PARENT DENIALS, 1990-91, GRADES K-6 K-6SERVED LEP STUDENTS, 1990-91, GRADES K-6 K-6TEACH AND REACH, MATH SERVED, 1990-91 K-6TEACH AND REACH, READING SERVED, 1990-91 K-6SPECIAL EDUCATION STUDENTS, 1990-91 PK-6GIFTED AND TALENTED STUDENTS, 1990-91 2-6'89 MIDDLE SCHOOL 6TH GRADERS - LOW MATH 6-8 749 0.93 709 0.96 678 1.00 639 1.10 753 79.4 731 73.2 685 80.1 646 79.8
GIFTED AND TALENTED STUDENTS, 1990-91 6-8 2366 0.072359 0.08 3811 0.113785 0.192366 90.1 2360 89.8 3811 89.5 3785 89.0
LEP PARENT DENIALS, 1990-91, GRADES 6-8 6-8 114 0.79 107 1.03 175 1.18 161 1.10 116 80.1 115 79.3 177 79.4 163 79.7
SERVED LEP STUDENTS, 1990-91, GRADES 6-8 6-8 260 0.83 246 0.66 599 0.67 580 0.61 263 80.6 257 82.4 601 82.0 581 83.3SPECIAL EDUCATION STUDENTS, 1990-91 6-8 879 0.84 814 0.73 1383 0.721304 0.67 883 79.8 841 80.5 1401 80.9 1314 81.3
KEALING MAGNET, 1990-91 7-8 320 0.16 318 0.13 437 0.23 435 0.41 320 89.2 318 89.1 437 86.7 435 86.0
to BP - AUSTIN-BLOCK COURSES, FALL, 1990 9 21 2.62 16 3.00 . 21 68.7 16 59.4
UD BP CROCKETT-SUCCFSS, FALL, 1990 9 88 0.98 81 1.01 . 88 77.5 81 75.3
BP JOHNSTON-RENAISSANCE, FALL, 1990 9 137 2.44 124 1.97 . 137 69.8 123 71.2
BP LANIER-CONNECTIONS, FALL, 1990 9 16 2.19 13 2.46 16 69.5 13 69.2PROJECT FIRST AT CROCKETT, 1990-91 9 102 0.96 95 0.98 . . . . 102 77.9 95 76.2
PROJECT FIRST AT MCCALLUM, 1990-91 9 115 3.32 106 3.39 203 2.19 172 2.30 110 63.1 105 61.9 198 68.3 160 67.5
BP REAGAN-BLOCK COURSES, FALL, 1990 9-10 21 3.57 19 3.58 42 2.62 34 2.76 21 64.5 19 65.5 42 69.1 34 66.0
BP TRAVIS-EXCEL, FALL, 1990 9-10 23 3.04 21 3.24 49 1.37 43 2.14 23 63.4 20 59.7 46 72.6 40 67.1
CVAE SENIOR HIGH, FALL, 1990 9-12 367 1.92 360 2.21 433 1.62 309 1.38 362 71.1 358 68.5 420 69.2 286 70.5
GIFTED AND 1ALENTED STUDENTS, 1990-91 9-12 3874 0.163884 0.18 5218 0.255185 0.263873 86.6 3883 86.5 5211 86.2 5171 86.0LEP PARENT DENIALS, 1990-91, GRADES 9-12 9-12 176 0.97 179 1.11 251 1.27 252 1.48 1-4 77.6 178 77.3 249 75.8 249 73.6LIBERAL ARTS ACADEMY AT JOHNSTON, 1990-91 9-12 132 0.14 135 0.17 225 0.20 226 0.23 132 86.9 135 87.2 225 86.1 226 86.1
MENTOR HIGH SCHOOLS, FALL, 1990 9-12 29 1.17 28 1.11 60 1.52 56 1.68 29 76.3 28 75.8 59 74.6 53 73.5
PEAK PROGRAM HIGH SCHOOL, FALL, 1990 9-12 23 3 43 24 3.54 46 2.48 37 2.00 23 63.3 24 62.0 46 68.6 36 69.6
PROJECT TOUCH AT CROCKETT, FALL, 1990 9-12 27 2.22 25
SCIENCE ACADEMY AT LBJ, 1990-91 9-12 416 0.19 4162.800.12
50590
2.26 410.21 589
1.98 260.17 416
70.386.8
25416
66.687.3
50590
68.187.2
39589
68.687.2
0)(C)fD
SERVED LEP STUDENTS, 1990-91. GRADES 9-12 9-12 317 0.99 329 1.11 580 1.14 595 1.29 315 78.6 328 77.9 575 77.6 585 76.1
SPECIAL EDUCATION STUDENTS, 1990-91 9-12 1199 1.241166 1.32 1588 1.281391 1.021187 75.7 1160 75.3 1569 76.0 1342 77.0 30 11M
107103
(A) 03
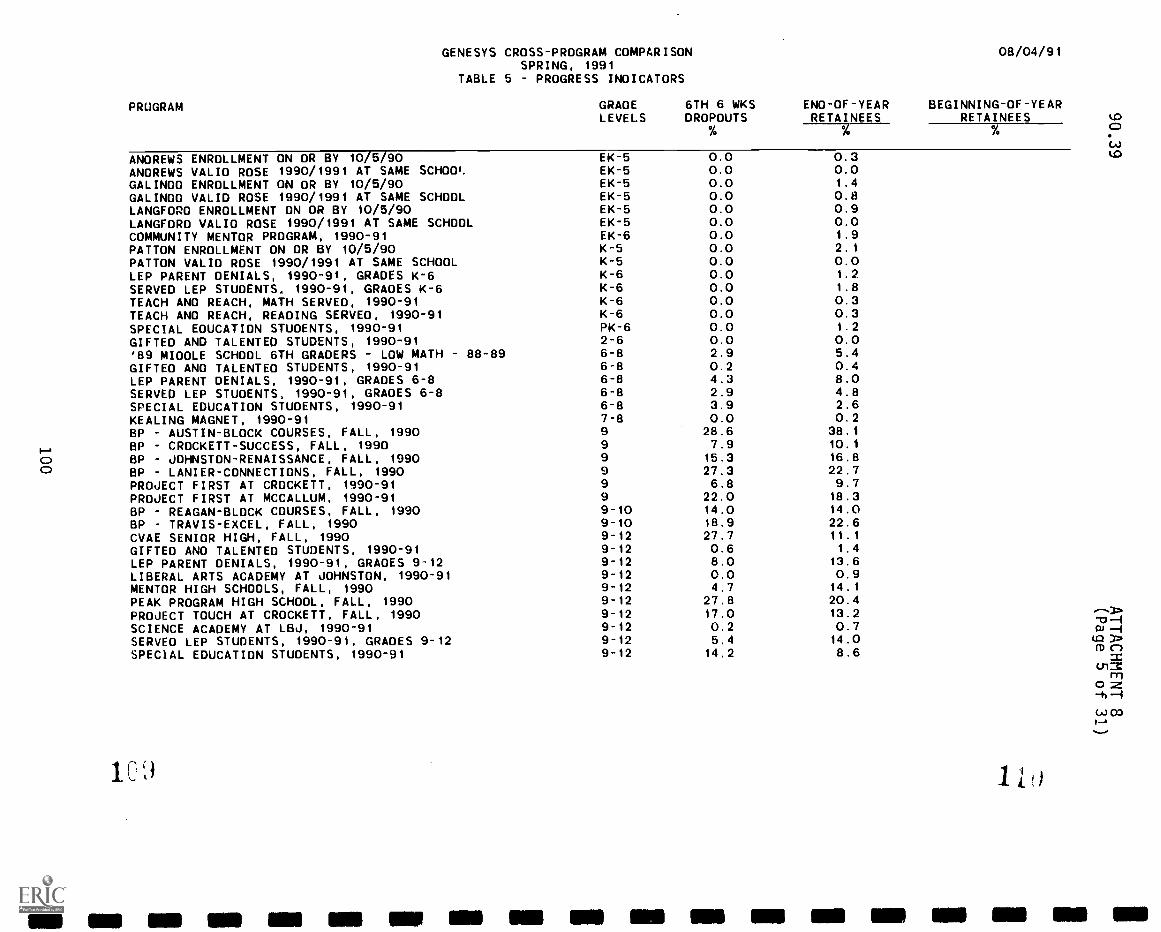
GENESYS CROSS-PROGRAM COMPARISONSPRING, 1991
TABLE 5 - PROGRESS INDICATORS
PROGRAM GRADE 6TH 6 WKSLEVELS DROPOUTS
%
END-OF-YEARRETAINEES
08/04/91
BEGINNING-OF-YEARRETAINEES up
% cp.
ANDREWS ENROLLMENT ON DR BY 10/5/90 EK-5 0.0 0.3 up
ANDREWS VALID ROSE 1990/1991 AT SAME SCH001. EK-5 0.0 0.0GALINDO ENROLLMENT ON DR BY 10/5/90 EK-5 0.0 1.4
GALINDO VALID ROSE 1990/1991 AT SAME SCHOOL EK-5 0.0 0.8LANGFORD ENROLLMENT ON OR BY 10/5/90 EK-5 0.0 0.9LANGFORD VALID ROSE 1990/1991 AT SAME SCHOOL EK-5 0.0 0.0COMMUNITY MENTOR PROGRAM, 1990-91 EK-6 0.0 1.9PATTON ENROLLMENT ON OR BY 10/5/90 K-5 0.0 2.1PATTON VALID ROSE 1990/1991 AT SAME SCHOOL K-5 0.0 0.0LEP PARENT OENIALS, 1990-91, GRADES K-6 K-6 0.0 1.2
SERVED LEP STUOENTS. 1990-91, GRAOES K-6 K-6 0.0 1.8TEACH ANO REACH, MATH SERVED, 1990-91 K-6 0.0 0.3TEACH ANO REACH, REAOING SERVED, 1990-91 K-6 0.0 0.3SPECIAL EDUCATION STUOENTS, 1990-91 PK-6 0.0 1.2
GIFTED AND TALENTED STUDENTS, 1990-91 2-6 0.0 0.0'89 MIDOLE SCHOOL 6TH GRADERS - LOW MATH 88-89 6-8 2.9 5.4GIFTED AND TALENTEO STUDENTS, 1990-91 6-8 0.2 0.4LEP PARENT DENIALS, 1990-91, GRADES 6-8 6-8 4.3 8.0SERVED LEP STUOENTS, 1990-91, GRADES 6-8 6-8 2.9 4.8SPECIAL EDUCATION STUDENTS, 1990-91 6-8 3.9 2.6KEALING MAGNET, 1990-91 7-8 0.0 0.2BP - AUSTIN-BLOCK COURSES, FALL, 1990 9 28.6 38.1BP CROCKETT-SUCCESS, FALL, 1990 9 7.9 10.1
BP JOHNSTON-RENAISSANCE, FALL, 1990 9 15.3 16.8
BP LANIER-CONNECTIONS, FALL, 1990 9 27.3 22.7PROJECT FIRST AT CROCKETT, 1990-91 9 6.8 9.7PROJECT FIRST AT MCCALLUM, 1990-91 9 22.0 18.3BP REAGAN-BLOCK COURSES, FALL, 1990 9-10 14.0 14.0BP TRAVIS-EXCEL, FALL, 1990 9-10 18.9 22.6CVAE SENIOR HIGH, FALL, 1990 9-12 27.7 11.1
GIFTED AND TALENTED STUDENTS, 1990-91 9-12 0.6 1.4
LEP PARENT DENIALS, 1990-91, GRADES 9-12 9-12 8.0 13.6LIBERAL ARTS ACADEMY AT JOHNSTON, 1990-91 9-12 0.0 0.9MENTOR HIGH SCHOOLS, FALL, 1990 9-12 4.7 14.1
PEAK PROGRAM HIGH SCHOOL, FALL, 1990 9-12 27.8 20.4PROJECT TOUCH AT CROCKETT, FALL, 1990 9-12 17.0 13.2
-o-ISCIENCE ACADEMY AT LBJ, 1990-91 9-12 0.2 0.7 Cli -ISERVED LEP STUDENTS, 1990-91, GRADES 9-12 9-12 5.4 14.0 ulpSPECIAL EDUCATION STUDENTS, 1990-91 9-12 14.2 8.6 (D n
mc
1 1 )
MEI EN INN MN Ma III an OM MI EMI EMI Mil MI NE IIIII IIIII
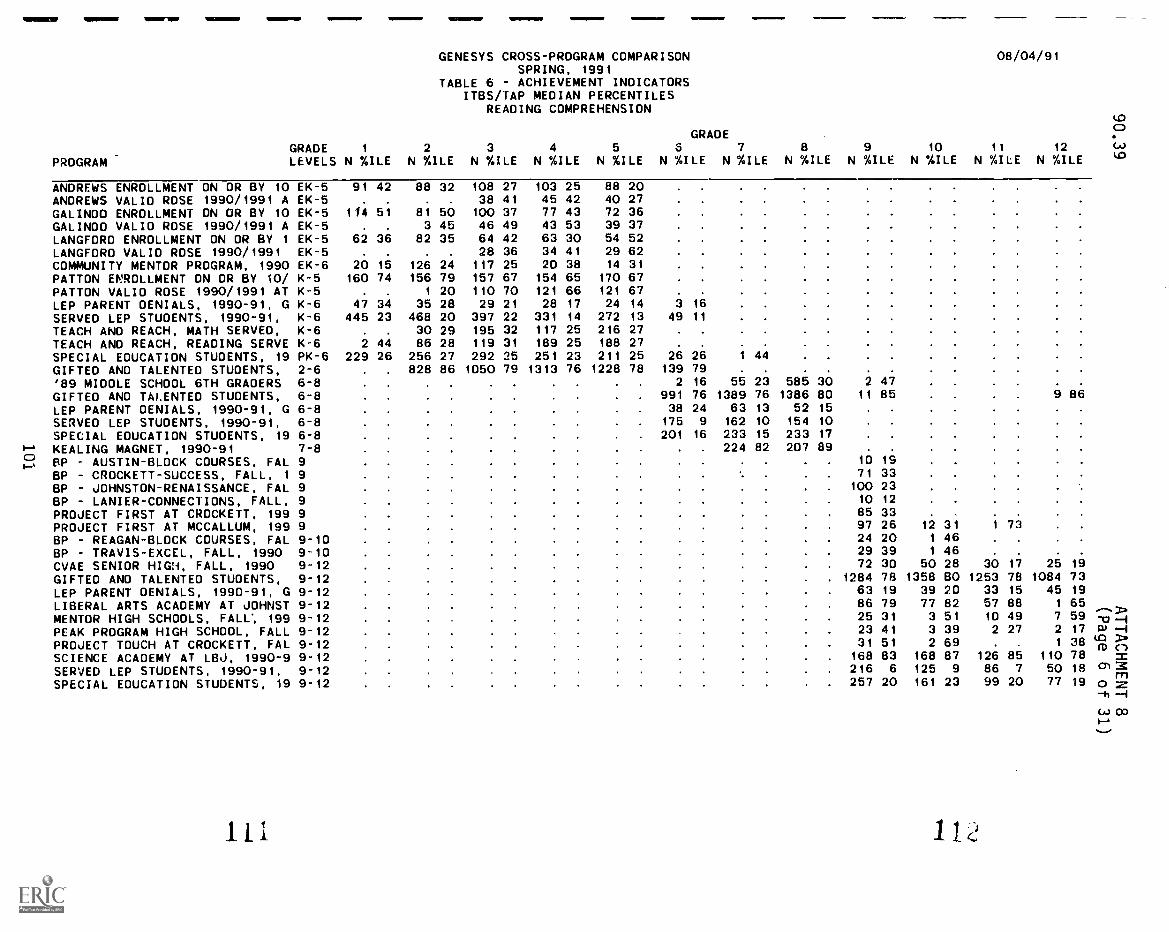
GENESYS CROSS-PROGRAM COMPARISONSPRING, 1991
TABLE 6 - AcHIEVEMENT INDICATORSITBs/TAP MEDIAN PERcENTILES
READING COMPREHENSION
08/04/91
GRADEPROGRAM LEVELS
1
N %ILE2
N %ILE3
N %ILE4
N %ILE5
N %ILE
GRADE8 7
N %ILE N %ILE8
N %ILE9
N %ILE10
N %ILEil
N %ILE12
N %ILE
ANDREWS ENROLLMENT ON OR By 10 EK-5 91 42 88 32 108 27 103 25 88 20ANDREWS VALID ROSE 1990/1991 A EK-5 . . 38 41 45 42 40 27GALINDO ENROLLMENT ON OR By 10 EK-5 5i 81 50 100 37 77 43 72 36GALINDO VALID ROSE 1990/1991 A EK-5 3 45 46 49 43 53 39 37
LANGFORD ENROLLMENT ON DR BY 1 EK-5 62 36 82 35 64 42 63 30 54 52LANGFORD VALID ROSE 1990/1991 EK-5 . . 28 36 34 41 29 62COMMUNITY MENTOR PROGRAM, 1990 EK-6 20 15 126 24 117 25 20 38 14 31
PATTON ENROLLMENT ON OR BY SO/ K-5 160 74 156 79 157 67 154 65 170 67PATTON VALID ROSE 1990/1991 AT K-5 . 1 20 110 70 121 66 121 67 . .
LEP PARENT DENIALS, 1990-91, G K-6 47 34 35 28 29 21 28 17 24 14 3 16
SERVED LEP STUDENTS, 1990-91, K-6 445 23 468 20 397 22 331 14 272 13 49 11
TEACH AND REACH, MATH SERVED, K-6 . 30 29 195 32 117 25 216 27
TEACH AND REACH, READING SERVE K-6 2 44 86 28 119 31 189 25 188 27SPEcIAL EDUCATION STUDENTS, 19 PK-6 229 26 256 27 292 25 251 23 211 25 26 26 1 44
GIFTED AND TALENTED STUDENTS, 2-6 828 86 1050 79 1313 76 1228 78 139 79 . .
'89 MIDDLE SCHOOL 6TH GRADERS 6-8 2 16 55 23 585 30 2 47
GIFTED AND TAvENTED STUDENTS, 6-8 991 76 1389 76 1386 80 11 85 a 86
LEP PARENT DENIALS, 1990-91, G 6-8 38 24 63 13 52 15
SERVED LEP STUDENTS, 1990-91, 6-8 175 9 162 10 154 10
SPECIAL EDUCATION STUDENTS, 19 6-8 201 16 233 15 233 17
KEALING MAGNET, 1990-91 7-8 . 224 82 207 89
SP AUSTIN-BLOCK COURSES, FAL 9 10 19
BP CROCKETT-SUCCESS, FALL, 1 9 71 33
BP JOHNSTON-RENAISSANCE, FAL 9 100 23
BP LANIER-CONNECTIONS, FALL, 9 10 12
PROJEcT FIRST AT CROCKETT, 199 9 85 33PROJECT FIRST AT MCCALLUM, 199 9 97 26 12 31 1
BP - REAGAN-BLOCK COURSES, FAL 9-10 24 20 i 46
BP TRAVis-ExcEL, FALL, 1990 9-10 29 39 1 46cvAE SENIOR HIGH, FALL, 1990 9-12 72 30 50 28 30 17 25 19
GIFTED AND TALENTED STUDENTS, 9-12 1284 78 1358 BO 1253 78 1084 73LEp PARENT DENIALS, 1990-91, G 9-12 63 19 39 20 33 15 45 19
LIBERAL ARTs ACADEMY AT JDHNST 9-12 86 79 77 82 57 88 i 65
MENTOR HIGH SCHOOLS, FALL% 199 9-12 25 31 3 51 io 49 7 59 =j2.1
PEAK PROGRAM HIGH SCHOOL, FALLPROJECT TOUCH AT CROCKETT, FAL
9-129-12
2331
4151
32
3969
2 27 2 17q8
w 1uam
SCIENCE ACADEMY AT LBJ, 1990-9 9-12 168 83 168 87 126 85 110 78 mc
SERVED LEp STUDENTS, 1990-91, 9-12 216 6 125 9 86 7 50 18 401:g
SPEcIAL EDUCATION STUDENTS, 19 9-12 257 20 161 23 99 20 77 19 0
C.4.1 CO

GENESYS CROSS-PROGRAM COMPARISONSPRING, 1991
TABLE 7 ACHIEVEMENT INDICATORSITBS/TAP MEDIAN PERCENTILES
MATH TOTAL
08/04/91
GRADEPROGRAM LEVELS
1
N %ILE2
N %ILE3
N %ILE4
N %ILE5
N %ILE
GRADE6 7
N %ILE N %ILE8
N %ILE9
N %ILE10
N %ILE11
N %ILE12
N %ILE
ANDREWS ENROLLMENT ON OR BY 10 EK-5 92 56 87 47 107 31 101 27 88 22
ANDREWS VALID ROSE 1990/1991 A EK-5 . . 38 43 45 43 40 35GALINDO ENROLLMENT ON OR BY 10 EK-5 114 58 81 70 102 51 77 50 73 39GALINDO VALID ROSE 1990/1991 A EK-5 3 68 46 63 43 51 39 37LANGFORD ENROLLMENT ON OR BY 1 EK-5 61 41 82 43 63 46 63 33 56 41
LANGFORD VALID ROSE 1990/1991 EK-5 . . 27 50 34 39 29 56COMMUNITY MENTOR PROGRAM, 1990 EK-6 22 30 133 38 126 24 22 41 16 31
PATTON ENROLLMENT ON OR BY 10/ K-5 160 75 159 84 157 75 154 70 171 74PATTON VALID ROSE 1990/1991 AT K-5 1 82 110 76 121 69 121 77
LEP PARENT DENIALS, 1990-91, G K-6 48 43 37 48 30 17 29 12 26 21 4 18
SERVED LEP STUDENTS, 1990-91, K-6 545 33 522 44 408 26 343 23 287 24 49 19
TEACH AND REACH, MATH SERVED, K-6 31 39 196 35 119 25 215 27TEACH AND REACH, READING SERVE K-6 2 37 87 36 119 35 191 31 187 28SPECIAL EDUCATION STUDENTS, 19 PK-6 261 30 313 39 346 22 303 21 245 18 28 31 1 4,i
GIFTED AND TALENTCD STUDENTS, 2-6 . 830 93 1052 86 1315 88 1231 85 139 83'89 MIDDLE SCHOOL 6TH GRADERS 6-8 1 1 55 18 580 18 3 11
GIFTED AND TALENTED STUDENTS, 6-8 991 82 1389 77 1379 76 11 78 997LEP PARENT DENIALS, 1990-91, G 6-8 38 27 64 18 52 19
SERVED LEP STUDENTS, 1990-91, 6-8 175 13 165 11 154 13
SPECIAL EDUCATION STUDENTS, 19 6-8 214 14 245 11 229 14
KEALING MAGNET, 1990-91 7-8 226 86 207 87
BP AUSTIN-BLOCK COURSES, FAL 9 11 16
BP CROCKETT-SUCCESS, FALL, 1 9 71 28
BP JOHNSTON-RENAISSANCE, FAL 9 102 20
BP - LANIER-CONNECTIONS, FALL, 9 10 11
PROJECT FIRST AT CROCKETT, 199 9 85 33 . .
PROJECT FIRST AT MCCALLUM, 199 9 22 13 32 149BP REAGAN-BLOCK COURSES, FAL 9-10 25 12 1 69
BP TRAVIS-EXCEL, FALL, 1990 9-10 30 23 1 67
CVAE SENIOR HIGH, FALL, 1990 9-12 76 18 51 21 29 15 25 23
GIFTED AND TALENTED STUDENTS, 9-12 1288 75 1356 79 1252 81 1088 76
LEP PARENT DENIALS, 1990-91, G 9-12 67 19 39 23 34 27 46 34
LIBERAL ARTS ACADEMY AT JOHNST 9-12 87 71 77 70 57 83 1 86
MENTOR HiGH SCHOOLS, FALL, 199 9-12 25 20 3 49 10 42 7 70PEAK PROGRAM HIGH SCHOOL, FALL 9-12 23 20 3 38 2 51 2 7 a, 4
PROJECT TOUCH AT CROCKETT, FALSCIENCE ACADEMY AT LBJ, 1990-9
9-129-12
31168
4883
2
1687187 125 89
1
10833 tO
c-)91
SERVED LEP STUDENTS, 1990-91, 9-12 219 14 126 16 88 24 51 29 -.13SPECIAL EDUCATION STUDENTS, 19 9-12 259 15 164 13 99 16 78 16 0
113 114
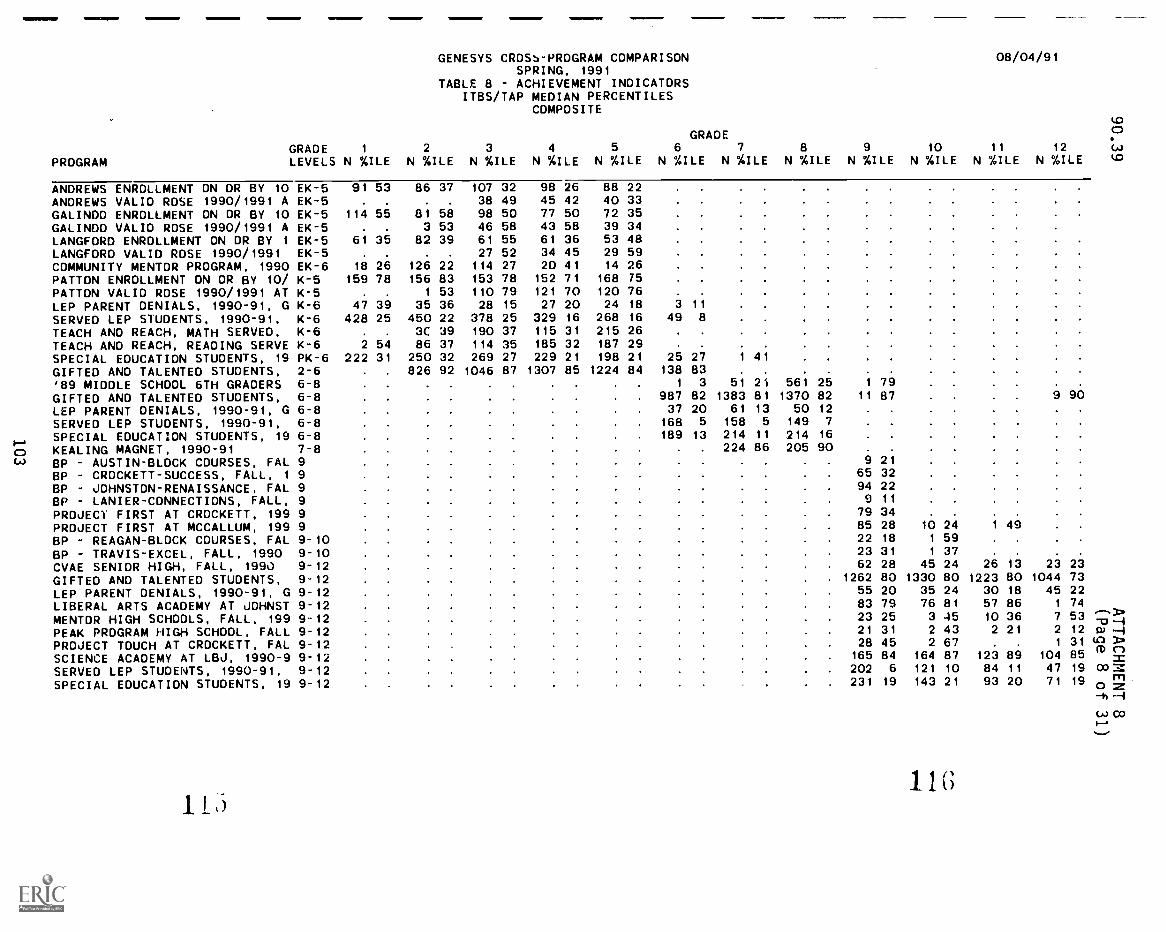
GENESYS CROSbPROGRAM COMPARISONSPRING, 1991
TABLE 8 ACHIEVEMENT INDICATORSITBS/TAP MEDIAN PERCENTILES
COMPOSITE
08/04/91
GRADEPROGRAM LEVELS
1
N %ILE2
N %ILE3
N %ILE4
N %ILE5
N %ILE
GRADE6 7
N %ILE N %ILEa
N %ILE9
N %ILE10
N %ILE11
N %ILE12
N %ILE VO
ANDREWS ENROLLMENT ON DR BY 10 EK-5 91 53 86 37 107 32 98 26 88 22ANDREWS VALID ROSE 1990/1991 A EK-5 38 49 45 42 40 33GALINDO ENROLLMENT ON DR BY 10 EK-5 114 55 81 58 98 50 77 50 72 35
GALINDO VALID ROSE 1990/1991 A EK-5 3 53 46 58 43 58 39 34
LANGFORD ENROLLMENT ON DR BY 1 EK-5 61 35 82 39 61 55 61 36 53 48LANGFORD VALID ROSE 1990/1991 EK-5 27 52 34 45 29 59COMMUNITY MENTOR PROGRAM, 1990 EK-6 18 26 126 22 114 27 20 41 14 26PATTON ENROLLMENT ON DR BY 10/ K-5 159 78 156 83 153 78 152 71 168 75
PATTON VALID ROSE 1990/1991 AT K-5 1 53 110 79 121 70 120 76LEP PARENT DENIALS, 1990-91, G K-6 47 39 35 36 28 15 27 20 24 18 3 11
SERVED LEP STUDENTS, 1990-91, K-6 428 25 450 22 378 25 329 16 268 16 49 8
TEACH AND REACH, MATH SERVED, K-6 3C 39 190 37 115 31 215 26
TEACH AND REACH, READING SERVE K-6 2 54 86 37 114 35 185 32 187 29 . .
SPECIAL EDUCATION STUDENTS, 19 PK-6 222 31 250 32 269 27 229 21 198 21 25 27 1 41
GIFTED AND TALENTED STUDENTS, 2-6 826 92 1046 87 1307 85 1224 84 138 83'89 MIDDLE SCHOOL 6TH GRADERS 6-8 1 3 51 21 561 25 1 79
GIFTED AND TALENTED STUDENTS, 6-8 987 82 1383 81 1370 82 11 87 9 90LEP PARENT DENIALS, 1990-91, G 6-8 37 20 61 13 50 12
SERVED LEP STUDENTS, 1990-91, 6-8 168 5 158 5 149 7
SPECIAL EDUCATION STUDENTS, 19 6-8 189 13 214 11 214 16
KEALING MAGNET, 1990-91 7-8 224 86 205 90BP AUSTINBLOCK COURSES, FAL 9 9 21
BP CROCKETTSUCCESS, FALL, 1 9 65 32
BP JOHNSTONRENAISSANCE, FAL 9 94 22
BP LANIERCONNECTIONS, FALL, 9 9 11
PROJECY FIRST AT CROCKETT, 199 9 79 34
PROJECT FIRST AT MCCALLUM, 199 9 85 28 10 241 49
BP REAGANBLOCK COURSES, FAL 9-10 22 18 1 59
BP TRAVISEXCEL, FALL, 1990 9-10 23 31 1 37
CVAE SENIOR HIGH, FALL, 1990 9-12 62 28 45 24 26 13 23 23
GIFTED AND TALENTED STUDENTS, 9-12 1262 80 1330 80 1223 80 1044 73
LEP PARENT DENIALS, 1990-91, G 9-12 55 20 35 24 30 18 45 22
LIBERAL ARTS ACADEMY AT JOHNST 9-12 83 79 76 81 57 86 1 74
MENTOR HIGH SCHOOLS, FALL, 199 9-12 23 25 3 45 10 36 7 53
PEAK PROGRAM HIGH SCHOOL, FALLPROJECT TOUCH AT CROCKETT, FALSCIENCE ACADEMY AT LBJ, 1990-9
9-129-129-12
2128
165
314584
2
2
164
436787
2
123
21
89
2
1
104
12
3185
(C)
CD
-1
SERVED LEP STUDENTS, 1990-91,SPECIAL EDUCATION STUDENTS, 19
9-129-12
202231
6
19121143
1021
8493
11
204771
1919 o
rn
1 1 G1:)
CoJ CO
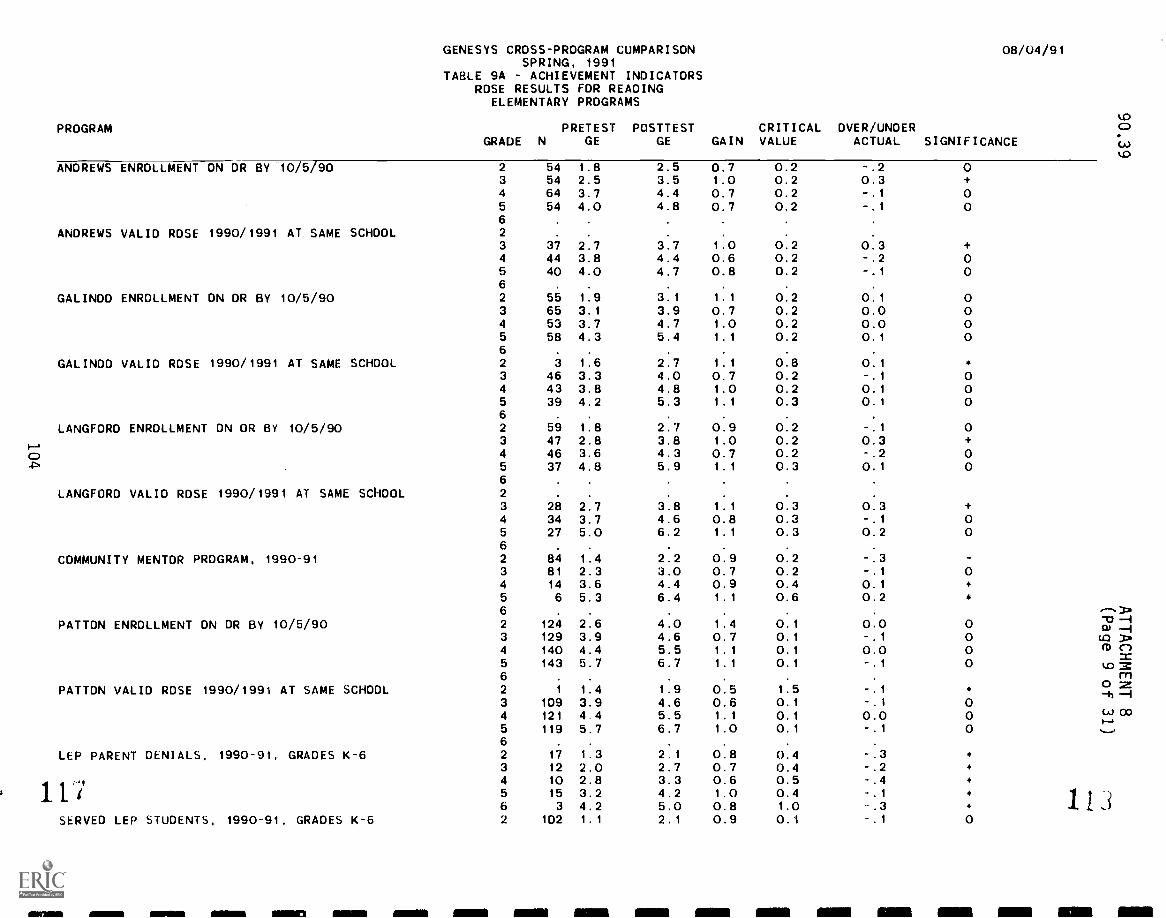
PROGRAM
GENESYS CROSS-PROGRAM CUMPARISONSPRING, 1991
TABLE 9A ACHIEVEMENT INDICATORSROSE RESULTS FOR READING
ELEMENTARY PROGRAMS
08/04/91
MDPRETEST POSTTEST CRITICAL OVER/UNDER CD
GRADE N GE GE GAIN VALUE ACTUAL SIGNIFICANCE
ANDREWS ENROLLMENT ON OR BY 10/5/90 2 54 1.8 2.5 0.7 0.2 -.2 03 54 2.5 3.5 1.0 0.2 0.3 +4 64 3.7 4.4 0.7 0.2 -.1 05 54 4.0 4.8 0.7 0.2 -.1 06
ANDREWS VALID ROSE 1990/1991 AT SAME SCHOOL 2 . .
3 37 2.7 3.7 1.0 0.2 0.3 +4 44 3.8 4.4 0.6 0.2 -.2 05 40 4.0 4.7 0.8 0.2 -.1 06 . .
GALINO0 ENROLLMENT ON OR BY 10/5/90 2 55 1.9 3.1 1.1 0.2 0.1 03 65 3.1 3.9 0.7 0.2 0.0 04 53 3.7 4.7 1.0 0.2 0.0 05 58 4.3 5.4 1.1 0.2 0.1 06 . . .
GALINO0 VALID ROSE 1990/1991 AT SAME SCHOOL 2 3 1.6 2.7 1.1 0.8 0.1 4,
3 46 3.3 4.0 0.7 0.2 -.1 04 43 3.8 4.8 1.0 0.2 0.1 05 39 4.2 5.3 1.1 0.3 0.1 06 . . .
LANGFORD ENROLLMENT ON OR BY 10/5/90 2 59 1.8 2.7 0.9 0.2 -.1 03 47 2.8 3.8 1.0 0.2 0.3 +
c 4 46 3.6 4.3 0.7 0.2 -.2 05 37 4.8 5.9 1.1 0.3 0.1 06
LANGFORD VALID ROSE 1990/1991 AT SAME SCHOOL 2 . . .
3 28 2.7 3.8 1.1 0.3 0.3 +
4 34 3.7 4.6 0.8 0.3 -.1 05 27 5.0 6.2 1.1 0.3 0.2 06 . .
COMMUNITY MENTOR PROGRAM, 1990-91 2 84 1.4 2.2 0.9 0.2 -.33 81 2.3 3.0 0.7 0.2 -.1 04 14 3.6 4.4 0.9 0.4 0.1 *
5 6 5.3 6.4 1.1 0.6 0.2 *
6 . . .
PATTON ENROLLMENT ON OR By 10/5/90 2 124 2.6 4.0 1.4 0.1 0.0 03 129 3.9 4.6 0.7 0.1 -.1 04 140 4.4 5.5 1.1 0.1 0.0 05 143 5.7 6.7 1.1 0.1 -.1 06 . . .
PATTON VALIO ROSE 1990/1991 AT SAME SCHOOL 2 1 1.4 1.9 0.5 1.5 -.1 *
3 109 3.9 4.6 0.6 0.1 -.1 04 121 4.4 5.5 1.1 0.1 0.0 05 119 5.7 6.7 1.0 0.1 -.1 06 . . .
LEP PARENT OENIALS, 1990-91, GRADES K-6 2 17 1.3 2 1 0.8 0.4 -.3 *
3 12 2.0 2.7 0.7 0.4 -.2 *
'
4 10 2.8 3.3 0.6 0.5 -.4 *
11? 5 15 3.2 4.2 1.0 0.4 -.1 *
6 3 4.2 5.0 0.8 1.0 -.3 *
SERVEO LEP STUOENTS, 1990-91, GRAOES K-6 2 102 1.1 2.1 0.9 0.1 -.1 0
,$)
113
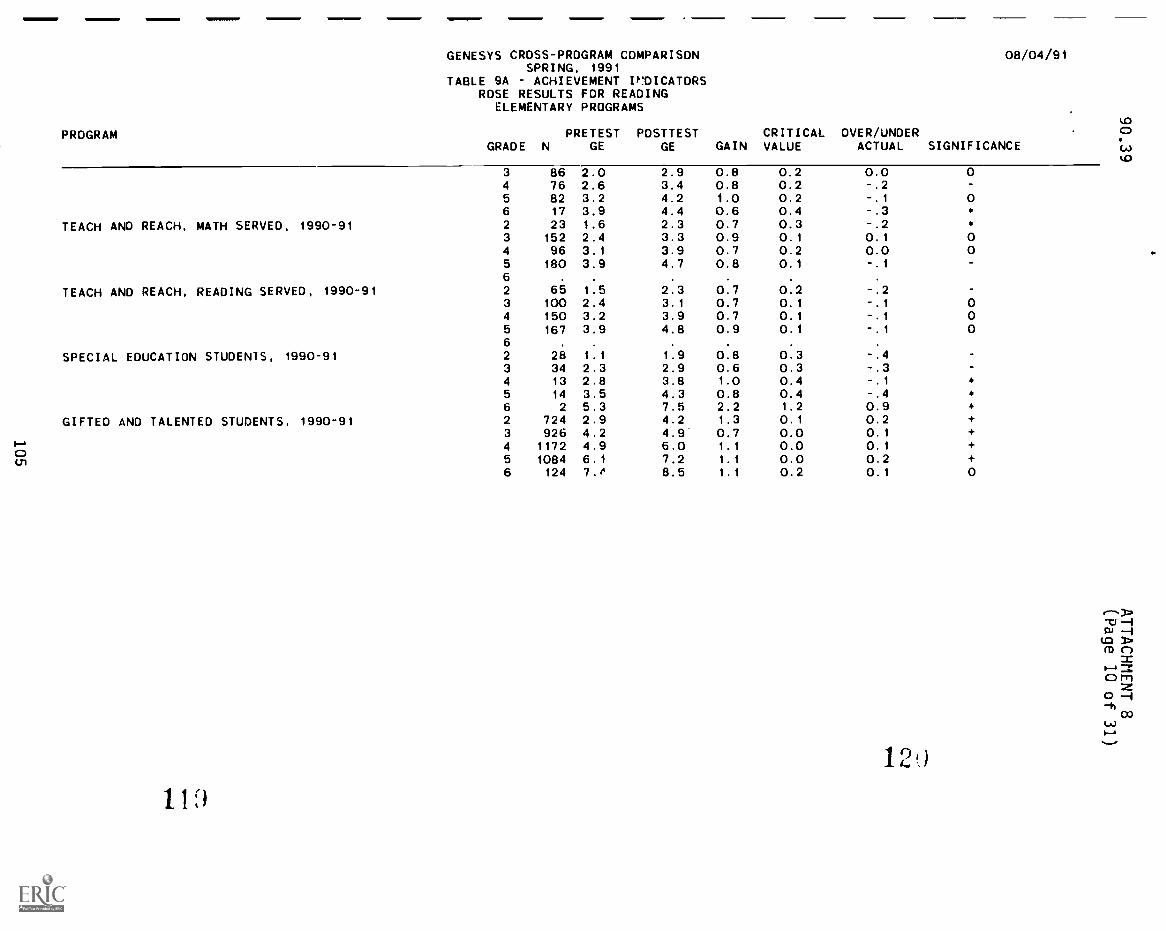
PROGRAM
GENESYS CROSS-PROGRAM COMPARISONSPRING, 1991
TABLE 9A ACHIEVEMENT P!DICATORSROSE RESULTS FOR READING
ELEMENTARY PROGRAMS
08/04/91
PRETEST POSTTEST CRITICAL OVER/UNDER CD
GRADE N GE GE GAIN VALUE ACTUAL SIGNIFICANCE
3 86 2.0 2.9 0.8 0.2 0.0 04 76 2.6 3.4 0.8 0.2 -.25 82 3.2 4.2 1.0 0.2 -.1 06 17 3.9 4.4 0.6 0.4 -.3 *
TEACH AND REACH, MATH SERVED, 1990-91 2 23 1.6 2.3 0.7 0.3 -.2 *
3 152 2.4 3.3 0.9 0.1 0.1 04 96 3.1 3.9 0.7 0.2 0.0 05 180 3.9 4.7 0.8 0.1 -.16 . . . . . .
TEACH AND REACH, READING SERVED, 1990-91 2 65 1.5 2.3 0.7 0.2 -.23 100 2.4 3.1 0.7 0.1 -.1 04 150 3.2 3.9 0.7 0.1 -.1 05 167 3.9 4.8 0.9 0.1 -.1 06 . . . .
SPECIAL EDUCATION STUDENTS, 1990-91 2 28 1.1 1.9 0.8 0.3 -.43 34 2.3 2.9 0.6 0.3 -.3 -
4 13 2.8 3.8 1.0 0.4 -.1 *
5 14 3.5 4.3 0.8 0.4 -.4 *
6 2 5.3 7.5 2.2 1.2 0.9 *
GIFTED AND TALENTED STUDENTS. 1990-91 2 724 2.9 4.2 1.3 0.1 0.2 +
3 926 4.2 4.9. 0.7 0.0 0.1 +o--,
c)(In
4
511721084
4.96.1
6.07.2
1.11.1
0.00.0
0.10.2
+
+
6 124 7.e 8.5 1.1 0.2 0.1 0
l0
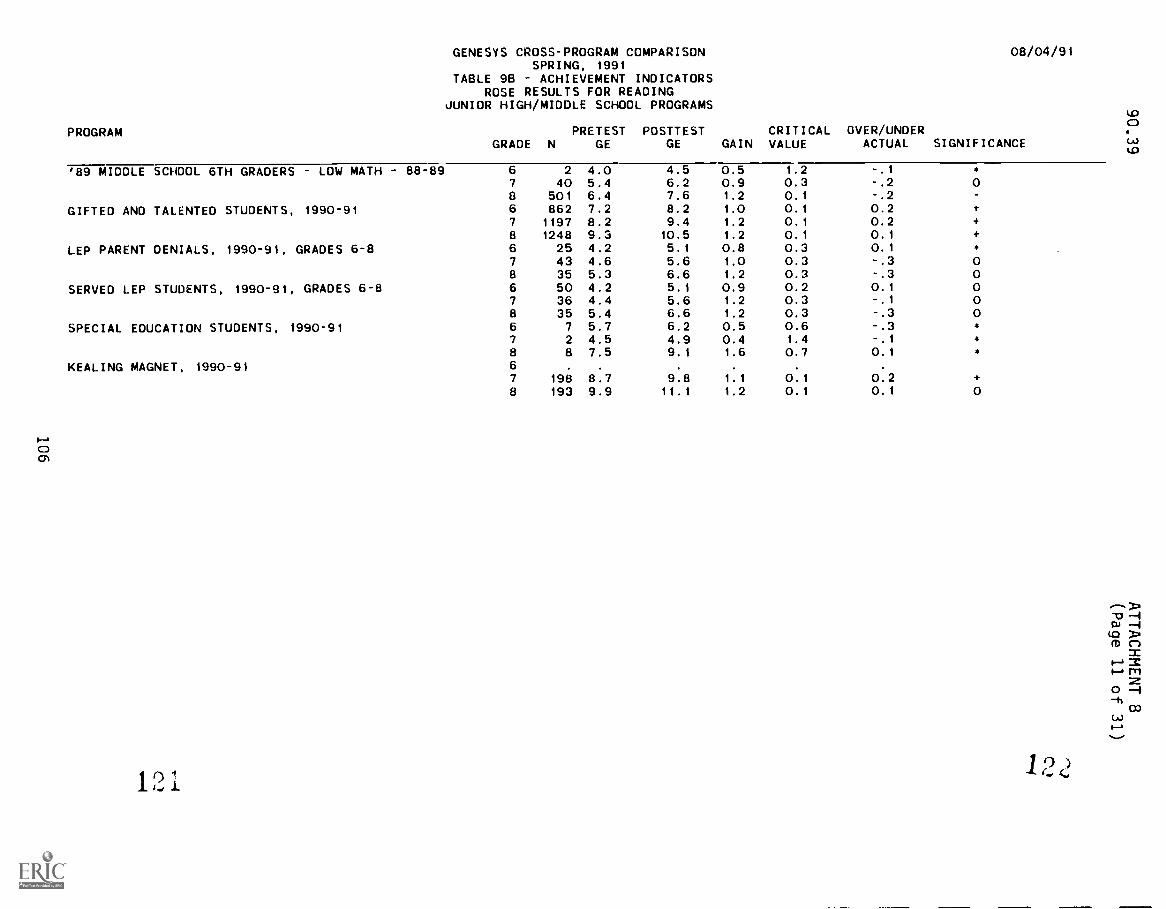
PROGRAM
'89 MIDDLE SCHDOL 6TH GRADERS LOW MATH
GIFTED AND TALENTED STUDENTS, 1990-91
LEP PARENT DENIALS, 1990-91, GRADES 6-8
SERVED LEP STUDENTS, 1990-91, GRADES 6-8
SPECIAL EDUCATION STUDENTS, 1990-91
KEALING MAGNET, 1990-91
1 2
GENESYS CROSS-PROGRAM COMPARISONSPRING, 1991
TABLE 96 ACHIEVEMENT INDICATORSROSE RESULTS FOR READING
08/04/91
JUNIOR HIGH/MIDDLE SCHOOL
PRETESTGRADE N GE
PROGRAMS
POSTTESTGE GAIN
CRITICALVALUE
OVER/UNDERACTUAL SIGNIFICANCE
88-89 6 2 4.0 4.5 0.5 1.2 -.1 *
7 40 5.4 6.2 0.9 0.3 -.2 08 501 6.4 7.6 1.2 0.1 -.26 862 7.2 8.2 1.0 0.1 0.2 +
7 1197 8.2 9.4 1.2 0.1 0.2 +
8 1248 9.3 10.5 1.2 0.1 0.1 +
6 25 4.2 5.1 0.8 0.3 0.1 4
7 43 4.6 5.6 1.0 0.3 -.3 0a 35 5.3 6.6 1.2 0.3 -.3 06 50 4.2 5.1 0.9 0.2 0.1 07 36 4.4 5.6 1.2 0.3 -.1 08 35 5.4 6.6 1.2 0.3 -.3 06 7 5.7 6.2 0.5 0.6 -.3 *
7 2 4.5 4.9 0.4 1.4 -.1 *
a 8 7.5 9.1 1.6 0.7 0.1 4,
6 . . . .
7 198 8.7 9.8 1.1 0.1 0.2 +
a 193 9.9 11.1 1.2 0.1 0.1 0
UDCD
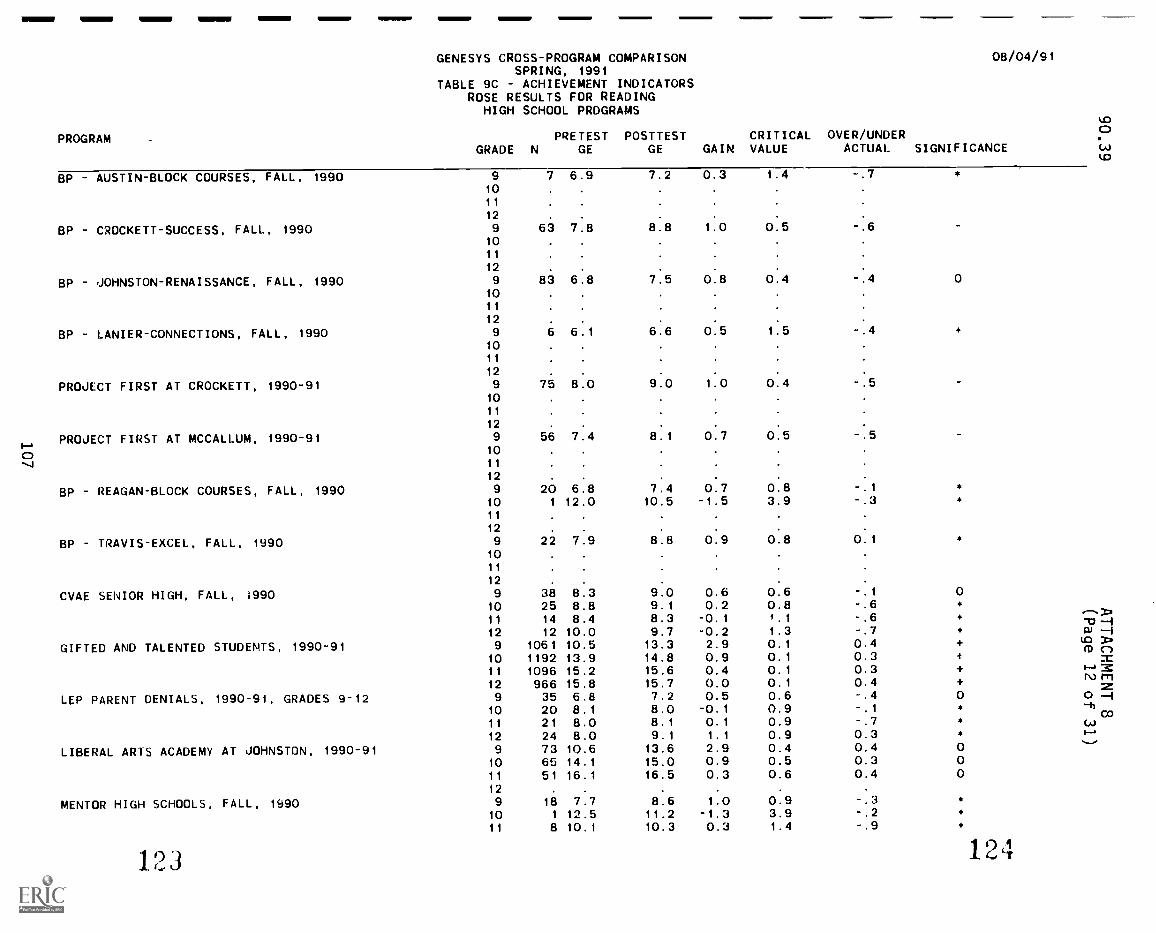
GENESYS CROSS-PROGRAM COMPARISONSPRING, 1991
TABLE 9C ACHIEVEMENT INDICATORSROSE RESULTS FOR READING
08/04/91
PROGRAM
HIGH SCHOOL PROGRAMS
PRETEST POSTTESTGRADE N GE GE GAIN
CRITICALVALUE
OVER/UNDERACTUAL SIGNIFICANCE
CD
BP AUSTIN-BLOCK COURSES, FALL, 1990 9 7 6.9 7.2 0.3 1.4 -.7 *
1011
12
BP CROCKETT-SUCCESS, FALL, 1990 9 63 7.8 8.8 1.0 0.5 -.61011
12
BP JOHNSTON-RENAISSANCE, FALL, 1990 9 83 6.8 7.5 0.8 0.4 -.4 01011
12
BP LANIER-CONNECTIONS, FALL, 1990 9 0 6.1 6.6 0.5 1:5 -.4 *
1011
12
PROJECT FIRST AT CROCKETT, 1990-91 9 70 8.0 9.0 1.0 0.4 -.51011
12
1-4PROJECT FIRST AT MCCALLUM, 1990-91 9 50 7.4 8.1 0:7 0.5 -.5
CD 104 11
12 . .
BP - REAGAN-BLOCK COURSES, FALL, 1990 9 20 6.8 7.4 0.7 0.8 -.1 *
10 1 12.0 10.5 -1.5 3.9 -.3 *
11
12
BP TRAVIS-EXCEL, FALL, 1990 9 22 7.9 8.8 0.9 0.8 0.1 *
1011
12 . . . . .
CVAE SENIOR HIGH, FALL, (990 9 38 8.3 9.0 0.6 0.6 -.1 010 25 8.8 9.1 0.2 0.8 -.6 *
11 14 8.4 8.3 -0.1 1.1 -.6 *.--..
12 12 10.0 9.7 -0.2 1.3 -.7 * Po -I
GIFTED AND TALENTED STUDENTS, 1990-91 9 1061 10.5 13.3 2.9 0.1 0.4 + (0 >M ("I
10 1192 13.9 14.8 0.9 0.1 0.3 + n:11 1096 15.2 15.6 0.4 0.1 0.3 +
12 966 15.8 15.7 0.0 0.1 0.4 +iv rn
IELEP PARENT DENIALS, 1990-91, GRADES 9-12 9 35 6.8 7.2 0.5 0.6 -.4 0 0 -4
10 20 8.1 8.0 -0.1 0.9 -.1 * -h00
11 21 8.0 8.1 0.1 0.9 -.7 * CA
12 24 8.0 9.1 1.1 0.9 0.3 *
LIBERAL AR1S ACADEMY AT JOHNSTON, 1990-91 9 73 10.6 13.6 2.9 0.4 0.4 0...._.,
10 65 14.1 15.0 0.9 0.5 0.3 0
11 51 16.1 16.5 0.3 0.6 0.4 0
12 . . . . .
MENTOR HIGH SCHOOLS, FALL, 1990 9 18 7.7 8.6 1.0 0.9 -.3 *
10 1 12.5 11.2 -1.3 3.9 -.2 *
11 8 10.1 10.3 0.3 1.4 -.9 *
I 2 ,3

PROGRAM
GENESYS CROSS-PROGRAM COMPARISONSPRING, 1991
TABLE 9C ACHIEVEMENT INDICATORSROSE RESULTS FOR READING
HIGH SCHOOL PROGRAMS
08/04/91
PRETEST POSTTEST CRITICAL OVER/UNOERGRADE N GE GE GAIN VALUE ACTUAL SIGNIFICANCE
PEAK PROGRAM HIGH SCHOOL, FALL, 1990
PROJECT TOUCH AT CROCKETT, FALL, 1990
SCIENCE ACAOEMY AT LBJ, 1990-91
SERVED LEP STUDENTS, 1990-91, GRADES 9-12
SPECIAL EOUCATION STUDENTS, 1990-91
12 5 15.9 14.8 -1.1 2.0 -.5 *
9 16 7.8 9.0 1.2 0.9 -.3 *
10 1 7.0 7.6 0.6 3.9 0.2 *
11 . . .
12 1 8.1 10.0 1.9 4.4 1.1 *
9 23 8.7 10.2 1.6 0.8 0.1 *
10 2 12.2 15.0 2.8 2.7 2.3 *
11 . .
12 1 12.7 11.2 -1.5 4.4 -.2 *
9 137 10.8 14.1 3.3 0.3 0.7 +
10 155 14.9 15.9 1.0 0.3 0.3 +
11 118 16.1 16.5 0.3 0.4 0.4 +
12 103 16.9 16.4 -0.5 0.4 0.1 09 22 6.4 7.4 1.0 0.8 0.0 *
10 11 7.5 7.6 0.2 1.2 -.1 *
11 10 i.1 7.3 0.1 1.3 -.5 *
12 16 8.9 8.9 0.1 1.1 -.6 *
9 17 8.5 9.9 1.4 0.9 -.1 *
10 3 12.9 13.4 0.5 2.2 0.4 *
11 . . . .
12 3 11.3 8.2 -3.1 2.6 -.4 *
MIN MN OM MI --MN
--ll MO MEI 1E1 NMI MIN
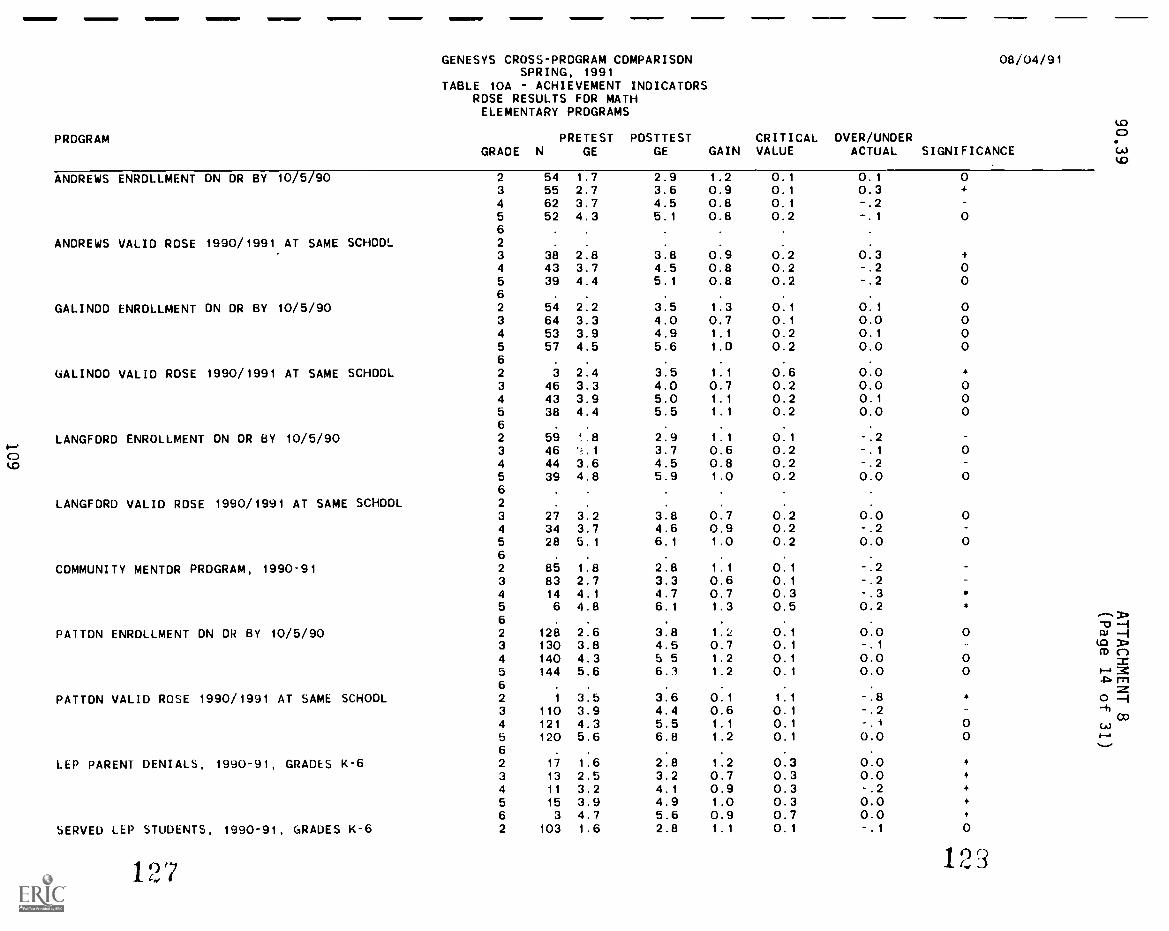
PROGRAM
GENESYS CROSS-PROGRAM COMPARISONSPRING, 1991
TABLE 10A ACHIEVEMENT INDICATORSROSE RESULTS FOR MATHELEMENTARY PROGRAMS
08/04/91
PRETEST POSTTEST CRITICAL OVER/UNDERGRADE N GE GE GAIN VALUE ACTUAL SIGNIFICANCE
ANDREWS ENROLLMENT ON OR BY 10/5/90
ANDREWS VALIO ROSE 1990/1991.AT SAME SCHOOL
GALINDO ENROLLMENT ON OR BY 10/5/90
GALINDO VALID ROSE 1990/1991 AT SAME SCHOOL
LANGFORD ENROLLMENT ON OR BY 10/5/901--,
QMD
LANGFORD VALIO ROSE 1990/1991 AT SAME SCHOOL
COMMUNITY MENTOR PROGRAM, 1990-91
PATTON ENROLLMENT ON OR BY 10/5/90
PATTON VALID ROSE 1990/1991 AT SAME SCHOOL
LEP PARENT DENIALS, 1990-91, GRADES K-6
SERVED LEP STUDENTS, 1990-91, GRADES K-6
2 54 1.7 2.9 1.2 0.1 0.13 55 2.7 3.6 0.9 0.1 0.34 62 3.7 4.5 0.8 0.1 -.25 52 4.3 5.1 0.8 0.2 -.162 . . . .
3 38 2.8 3.8 0.9 0.2 0.34 43 3.7 4.5 0.8 0.2 -.25 39 4.4 5.1 0.8 0.2 -.26 . . .
2 54 2.2 3.5 1.3 0.1 0.13 64 3.3 4.0 0.7 0.1 0.04 53 3.9 4.9 1.1 0.2 0.15 57 4.5 5.6 1.0 0.2 0.06 . .
2 3 2.4 3.5 1.1 0.6 0.03 46 3.3 4.0 0.7 0.2 0.04 43 3.9 5.0 1.1 0.2 0.15 38 4.4 5.5 1.1 0.2 0.06 . . . .
2 59 . 8 2.9 1.1 0.1 -.23 46 'f..1 3.7 0.6 0.2 -.14 44 3.6 4.5 0.8 0.2 -.25 39 4.8 5.9 1.0 0.2 0.062 . . . .
3 27 3.2 3.8 0.7 0.2 0.04 34 3.7 4.6 0.9 0.2 -.25 28 5.1 6.1 1.0 0.2 0.06 . . . .
2 85 1.8 2.8 1.1 0.1 -.23 83 2.7 3.3 0.6 0.1 -.24 14 4.1 4.7 0.7 0.3 -.35 6 4.8 6.1 1.3 0.5 0.26 . . . .
2 128 2.6 3.8 1.2 0.1 0.03 130 3.8 4.5 0.7 0.1 -.1
4 140 4.3 5 5 1.2 0.1 0.05 144 5.6 6.1 1.2 0.1 0.06 .
2 1 3.5 3.6 0.1 1.1 -.83 110 3.9 4.4 0.6 0.1 -.24 121 4.3 5.5 1.1 0.1 -.15 120 5.6 6.8 1.2 0.1 0.06 . . . .
2 17 1.6 2.8 1.2 0.3 0.03 13 2.5 3.2 0.7 0.3 0.04 11 3.2 4.1 0.9 0.3 -.25 15 3.9 4.9 1.0 0.3 0.06 3 4.7 5.6 0.9 0.7 0.02 103 1.6 2.8 1.1 0.1 -.1
0+
0
+
00
0000
*
000
0
0
0
0
*
*
O 0 -Ato >
O M r)=O 0 :C
=* 0 -A
00
.....-.
*
+
*
*
*
0
1 2 31 2 7
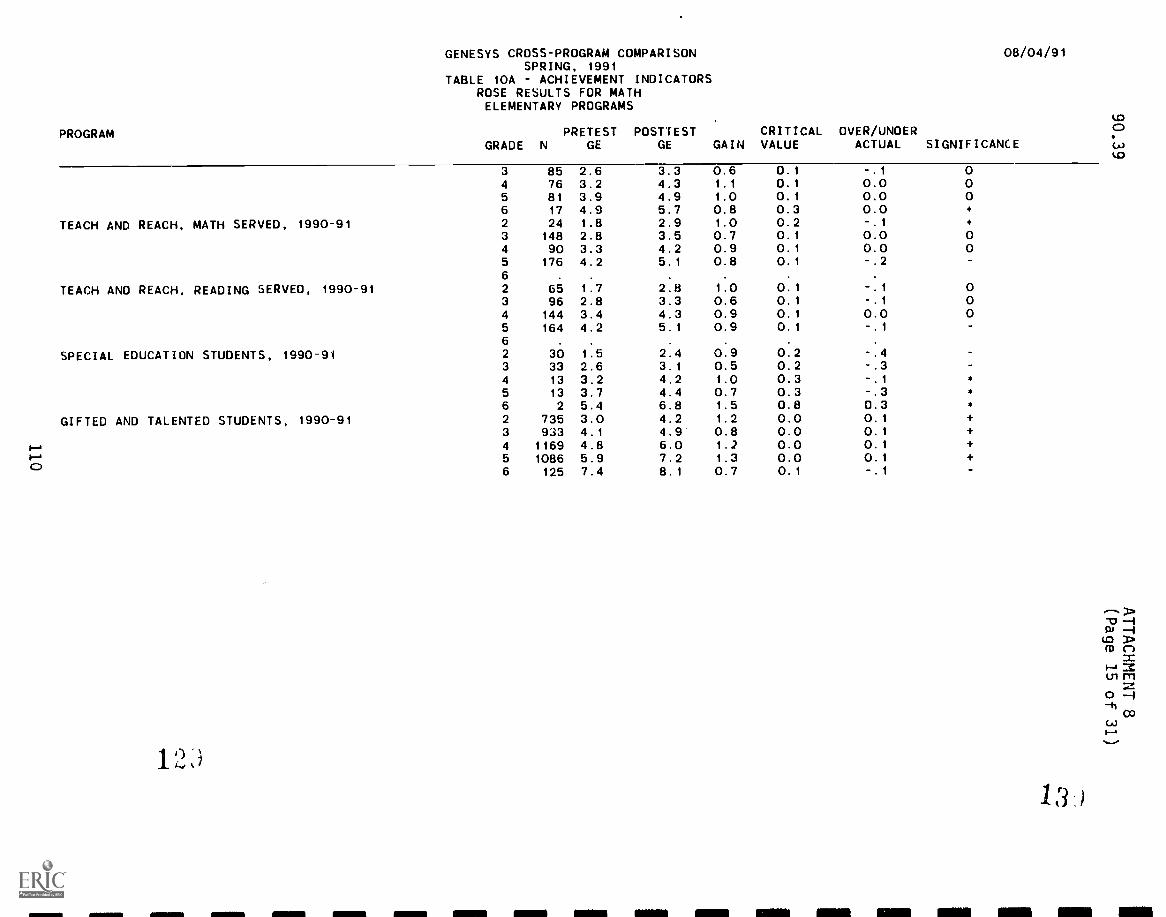
PROGRAM
GENESYS CROSS-PROGRAM COMPARISONSPRING, 1991
TABLE 10A ACHIEVEMENT INDICATORSROSE RESULTS FOR MATHELEMENTARY PROGRAMS
08/04/91
PRETEST POSTTEST CRITICAL OVER/UNDERGRADE N GE GE GAIN VALUE ACTUAL SIGNIFICANCE
3 85 2.6 3.3 0.6 0.1 -.1 04 76 3.2 4.3 1.1 0.1 0.0 05 81 3.9 4.9 1.0 0.1 0.0 06 17 4.9 5.7 0.8 0.3 0.0 *
TEACH AND REACH, MATH SERVED, 1990-91 2 24 1.8 2.9 1.0 0.2 -.1 *
3 148 2.8 3.5 0.7 0.1 0.0 04 90 3.3 4.2 0.9 0.1 0.0 05 176 4.2 5.1 0.8 0.1 -.26 . . . .
TEACH ANO REACH, READING SERVED, 1990-91 2 65 1.7 2.8 1.0 0.1 -.1 03 96 2.8 3.3 0.6 0.1 -.1 04 144 3.4 4.3 0.9 0.1 0.0 05 164 4.2 5.1 0.9 0.1 -.16 . . . .
SPECIAL EDUCATION STUDENTS, 1990-91 2 30 1.5 2.4 0.9 0.2 -.43 33 2.6 3.1 0.5 0.2 -.3 -
4 13 3.2 4.2 1.0 0.3 -.1 *
5 13 3.7 4.4 0.7 0.3 -.3 *
6 2 5.4 6.8 1.5 0.8 0.3 *
GIFTED AND TALENTED STUDENTS, 1990-91 2 735 3.0 4.2 1.2 0.0 0.1 +
3 933 4.1 4.9 0.8 0.0 0.1 +
/..4 4 1169 4.8 6.0 1.2 0.0 0.1 +
5 1086 5.9 7.2 1.3 0.0 0.1 +CD
6 125 7.4 8.1 0.7 0.1 -.1 -
1 3 )
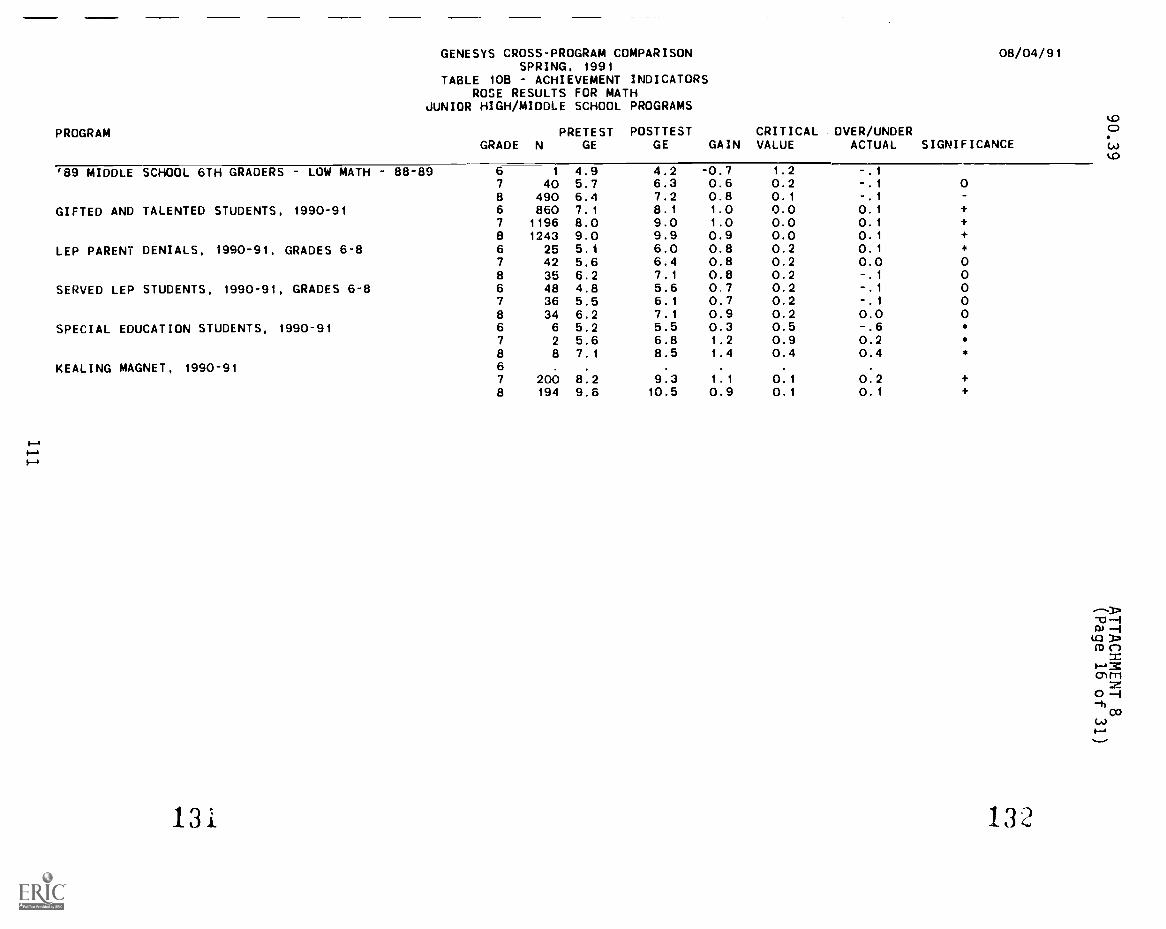
PROGRAM
GENESYS CROSS-PROGRAM COMPARISONSPRING, 1991
TABLE 10B ACHIEVEMENT INDICATORSROSE RESULTS FOR MATH
JUNIOR HIGH/MIDDLE SCHOOL PROGRAMS
08/04/91
PRETEST POSTTEST CRITICAL OVER/UNDERGRADE N GE GE GAIN VALUE ACTUAL SIGNIFICANCE
'89 MIDDLE SCHOOL 6TH GRADERS LOW MATH
GIFTED AND TALENTED STUDENTS, 1990-91
LEP PARENT DENIALS, 1990-91, GRADES 6-8
SERVED LEP STUDENTS, 1990-91, GRADES 6-8
SPECIAL EDUCATION STUDENTS, 1990-91
KEALING MAGNET, 1990-91
131
88-89 6 1 4.9 4.2 -0.7 1.2 -.17 40 5.7 6.3 0.6 0.2 -.1 08 490 6.4 7.2 0.8 0.1 -.16 860 7.1 8.1 1.0 0.0 0.1 +
7 1196 8.0 9.0 1.0 0.0 0.1 +
8 1243 9.0 9.9 0.9 0.0 0.1 +
6 25 5.1 6.0 0.8 0.2 0.1 *
7 42 5.6 6.4 0.8 0.2 0.0 0a 35 6.2 7.1 0.8 0.2 -.1 06 48 4.8 5.6 0.7 0.2 -.1 07 36 5.5 6.1 0.7 0.2 -.1 08 34 6.2 7.1 0.9 0.2 0.0 06 6 5.2 5.5 0.3 0.5 -.6 *
7 2 5.6 6.8 1.2 0.9 0.2 *
a 8 7.1 8.5 1.4 0.4 0.4 *
6 . . . . . .
7 200 8.2 9.3 1.1 0.1 0.2 +
8 194 9.6 10.5 0.9 0.1 0.1 +
132

GENESYS CROSS-PROGRAM COMPARISONSPRING, 1991
PROGRAM
8P AUSTIN-BLOCK COURSES, FALL, 1990
8P CROCKETT-SUCCESS, FALL, 1990
BP JOHNSTON-RENAISSANCE, FALL, 1990
8P LANIER-CONNECTIONS, FALL, 1990
PROJECT FIRST AT CROCKETT, 1990-91
PROJECT FIRST AT MCCALLUM, 1990-91-aI
I-a
N)
BP - REAGAN-BLOCK COURSES, FALL, 1990
8P TRAVIS-EXCEL, FALL, 1990
CVAE SENIOR HIGH, FALL, 1990
GIF1ED AND TALENTED STUDENTS, 1990-91
LEP PARENT DENIALS, 1990-91, GRADES 9-12
LIBERAL ARTS ACADEMY AT JOHNSTDN, 1990-91
MENTOR HIGH SCHOOLS, FALL, 1990
1 3 -,
08/04/91
TABLE 10C - ACHIEVEMENT INDICATORSROSE RESULTS FOR MATHHIGH SCHOOL PROGRAMS
PRETEST POSTTESTGRAOE N GE GE GAIN
CRITICALVALUE
OVER/UNOERACTUAL SIGNIFICANCE
9 8 6.5 7.1 0.7 1.1 0.1 *
1011
12
9 62 8.0 8.8 0.8 0.4 -.71011
)29 83 7.1 8.0 0.9 0.3 0.0 01011
12
9 6 6.2 6.9 0.7 1.2 0.1 *
1011
12
9 74 8.1 9.1 1.0 0.4 -.61011
12
9 56 7. 4 8.1 0.8 0.4 -.41011
12 . . .
9 20 7.0 7.6 0.6 0.7 -.2 *
10 1 14.0 13.4 -0.6 3.5 -.2 *
11
129 23 7.5 8.4 0.9 0.6 0.2 *
1011
12 . . . .
9 40 7.7 8.5 0.8 0.5 0.0 010 25 8.4 8.8 0.4 0.7 -.5 *
11 15 8.2 8.2 0.0 0.9 -.8 *
12 11 10.5 10.9 0.4 1.2 0.1 *
9 1067 9.8 13.1 3.3 0.1 0.3 +
10 1194 13.3 14.6 1.3 0.1 0.2 +
11 1103 14.8 15.5 0.7 0.1 0.3 +
12 971 15.5 15.5 0.0 0.1 0.3 +
9 38 7.1 8.0 0.9 0.5 0.2 010 20 8.3 8.1 -0.2 0.8 -.1 *
11 20 10.1 10.5 0.1 0.8 -.2 *
12 25 11.3 12.5 1.2 0.8 1.0 *
9 76 9.5 12.6 3.0 0.3 0.2 010 65 12.8 13.6 0.8 0.4 -.1 011 52 14.6 15.4 0.7 0.6 0.3 012 . . . .
9 18 7.4 8.8 1.3 0.7 0.2 *
10 1 13.2 13 2 0.0 3.5 -.111 8 9.8 10.1 0.3 1.3 -.9 *
IIIIII NMI
13 1
NM OM Mil Ell IMP NM OM

GENESYS CROSS-PROGRAM COMPARISONSPRING, 1991
TABLE 10C ACHIEVEMENT INDICATORS
PROGRAM
PEAK PROGRAM HIGH SCHOOL, FALL, 1990
PROJECT TOUCH AT CROCKETT, FALL, 1990
SCIENCE ACADEMY AT LBJ, 1990-91
SERVED LEP STUDEN1S, 1990-91, GRADES 9-12
SPECIAL EDUCATION STUDENTS, 1990-91
135
ROSE RESULTS FOR MATHHIGH SCHOOL PROGRAMS
PRETEST POSTTESTGRADE N GE GE GAIN
CRITICALVALUE
OVER/UNDERACTUAL
12 5 15.5 15.2 -0.3 1.8 0.19 16 7.6 7.9 0.3 0.8 -.110 1 6.8 6.8 0.0 3.5 0.011 . . . . .
12 1 8.0 7.4 -0.6 3.9 -.29 21 8.6 10.0 1.4 0.7 -.510 2 12.3 13.9 1.5 2.5 0.411 . . . . . .
12 1 10.2 10.4 0.2 3.9 -.59 139 10.2 14.0 3.7 0.3 0.3
10 156 14.5 16.0 1.4 0.3 0.511 119 15.9 16.5 0.6 0.3 0.312 102 16.9 17.1 0.2 0.4 0.79 24 6.8 7.5 0.7 0.6 0.110 12 7.9 7.9 0.0 1.0 -.a11 10 8.6 9.0 0.4 1.1 -.512 16 10.1 10.0 -0.1 1.0 -.49 17 8.0 8.6 0.6 0.7 -.910 3 11.5 10.3 -1.2 2.0 -.2
11 . . . . . .
12 3 10.3 10.0 -0.2 2.3 -.1
08/04/91
upCD
SIGNIFICANCE (d)
up
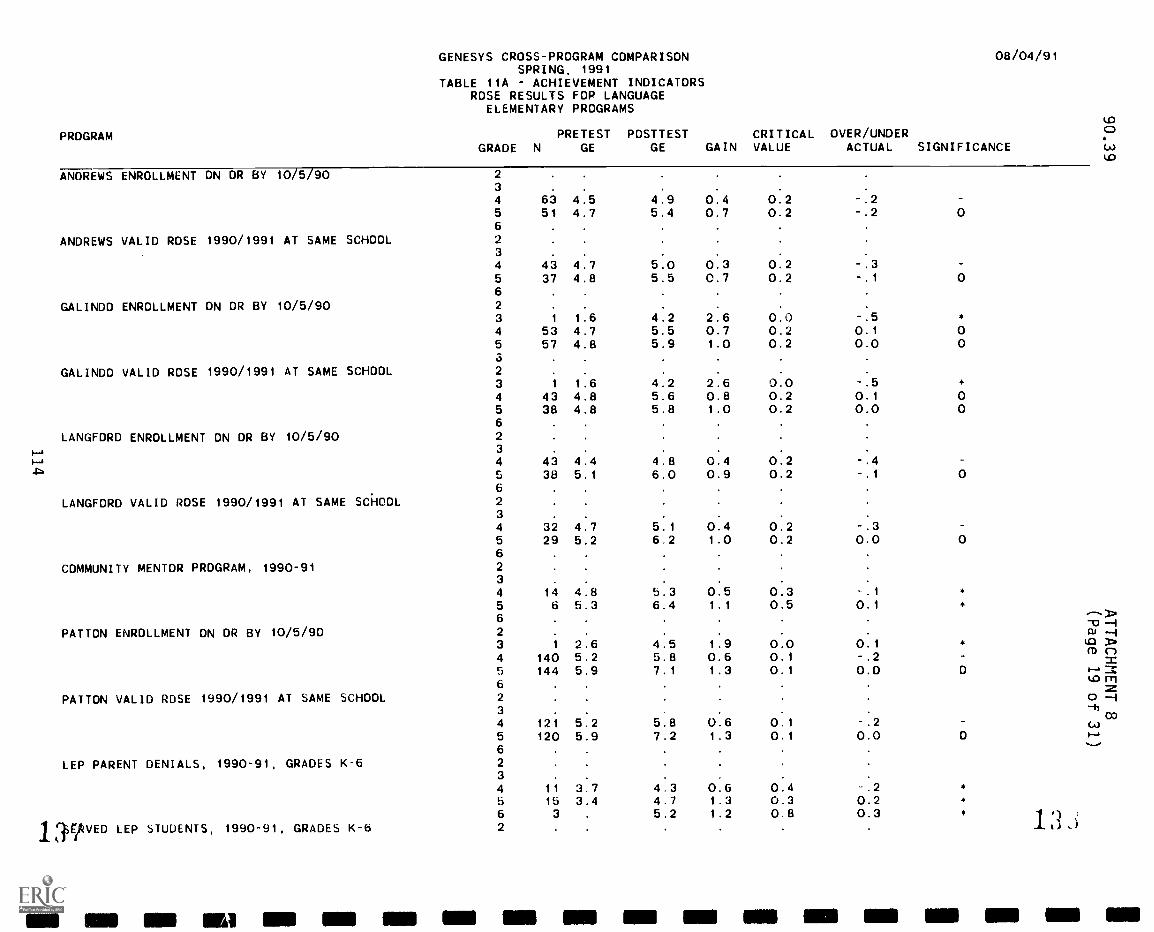
PROGRAM
GENESYS CROSS-PROGRAM COMPARISONSPRING, 1991
TABLE 11A ACHIEVEMENT INDICATORSROSE RESULTS FOP LANGUAGE
ELEMENTARY PROGRAMS
08/04/91
PRETEST POSTTEST CRITICAL OVER/UNDERGRADE N GE GE GAIN VALUE ACTUAL SIGNIFICANCE
ANDREWS ENROLLMENT ON OR BY 10/5/90
ANDREWS VALID ROSE 1990/1991 AT SAME SCHOOL
GALINDO ENROLLMENT ON OR BY 10/5/90
GALINDO VALID ROSE 1990/1991 AT SAME SCHOOL
LANGFORD ENROLLMENT ON OR BY 10/5/90FaFa4=.
LANGFORD VALID ROSE 1990/1991 AT SAME SCHOOL
COMMUNITY MENTOR PROGRAM, 1990-91
PATTON ENROLLMENT ON OR By 10/5/90
PATTON VALID ROSE 1990/1991 AT SAME SCHOOL
LEP PARENT DENIALS, 1990-91, GRADES K-6
IrMAVED LEP STUDENTS, 1990-91, GRADES K-6
2
3 . .
4 63 4.5 4.9 0.4 0.2 -.25 51 4.7 5.4 0.7 0.2 -.2 062
3 .
4 43 4.7 5.0 0.3 0.2 -.35 37 4.8 5.5 0.7 0.2 -.1 062 . . .
3 1 1.6 4.2 2.6 0.0 -.5 *
4 53 4.7 5.5 0.7 0.2 0.1 05 57 4.8 5.9 1.0 0.2 0.0 03
2 . . .
3 1 1.6 4.2 2.6 0.0 -.5 *
4 43 4.8 5.6 0.8 0.2 0.1 05 38 4.8 5.8 1.0 0.2 0.0 062
34 43 4.4 4.8 0.4 0.2 -.4r..) 38 5.1 6.0 0.9 0.2 -.1 0623 .
4 32 4.7 5.1 0.4 0.2 -.35 29 5.2 6.2 1.0 0.2 0.0 062
3 .
4 14 4.8 5.3 0.5 0.3 -.1
5 6 5.3 6.4 1.1 0.5 0.1 *
62 . .
3 1 2.6 4.5 1.9 0.0 0.1 *
4 140 5.2 5.8 0.6 0.1 -.25 144 5.9 7.1 1.3 0.1 0.0 0
62
3
4 121 5.2 5.8 0.6 0.1 -.25 120 5.9 7.2 1.3 0.1 0.0 0
62
3 . . .
4 11 3.7 4.3 0.6 0.4 -.2 *
5 15 3.4 4.7 1.3 0.3 0.26 3 5.2 1.2 0.8 0.3 *
2 1 '3 '
Ell MN IIIII MI OM MI MI MI 1111111
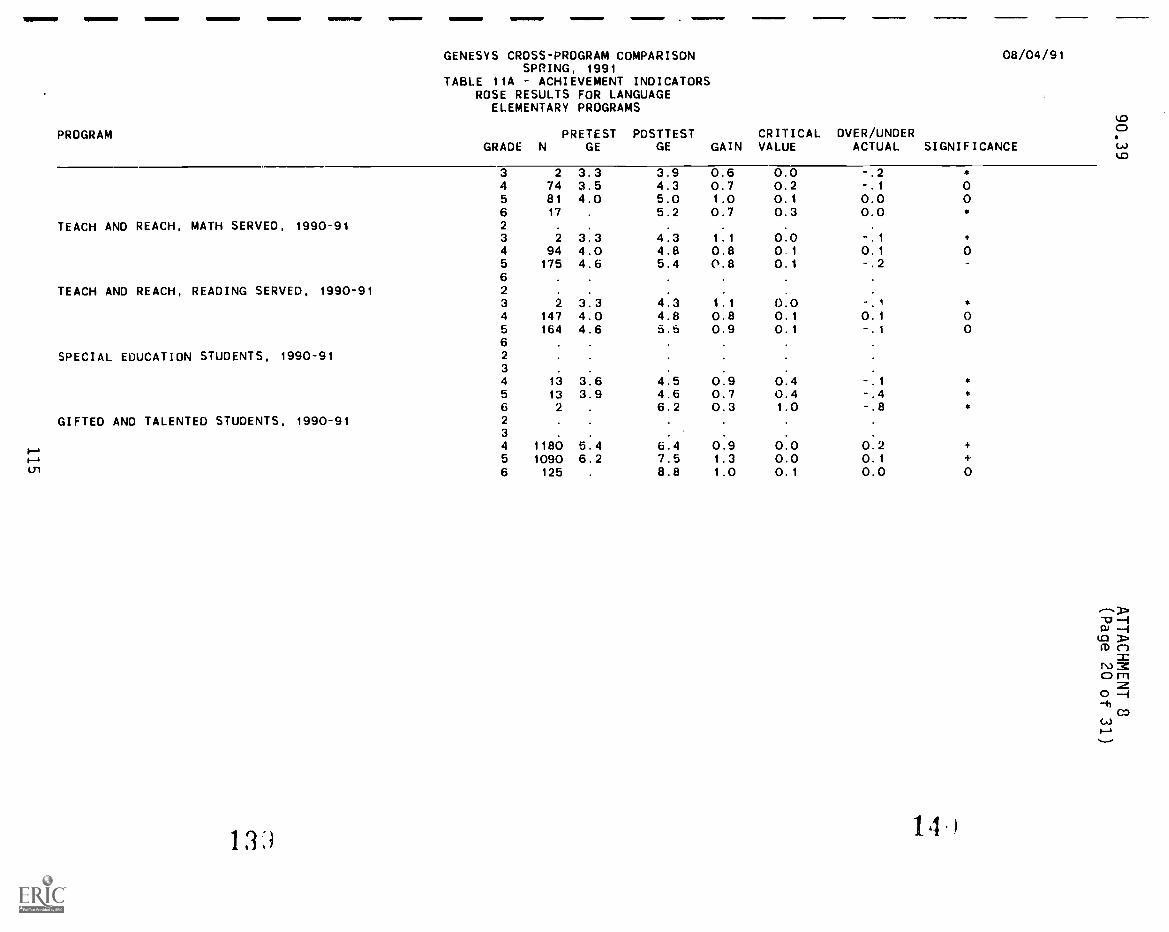
PROGRAM
GENESYS CROSS-PROGRAM COMPARISONSPRING, 1991
TABLE 11A ACHIEVEMENT INDICATORSROSE RESULTS FOR LANGUAGE
ELEMENTARY PROGRAMS
08/04/91
PRETEST PDSTTEST CRITICAL DVER/UNDERGRADE N GE GE GAIN VALUE ACTUAL SIGNIFICANCE
3 2 3.3 3.9 0.6 0.0 -.2 *
4 74 3.5 4.3 0.7 0.2 -.1 05 81 4.0 5.0 1.0 0.1 0.0 06 17 5.2 0.7 0.3 0.0 *
TEACH AND REACH, MATH SERVED, 1990-91 2 m
3 2 3.3 4.3 1.1 0.0 -.1 *
4 94 4.0 4.8 0.8 0.1 0.1 05 175 4.6 5.4 0.8 0.1 -.26
TEACH AND REACH, READING SERVED, 1990-91 2 .
3 2 3.3 4.3 1.1 0.0 1 *
4 147 4.0 4.8 0.8 0.1 0.1 05 164 4.6 5.5 0.9 0.1 -.i 06
SPECIAL EDUCATION STUDENTS, 1990-91 2
3 . . . .
4 13 3.6 4.5 0.9 0.4 -.1 *
5 13 3.9 4.6 0.7 0.4 -.46 2 6.2 0.3 1.0 -.8 *
GIFTED AND TALENTED STUDENTS, 1990-91 2 .
3 .
1,--,4 1180 5.4 6.4 0.9 0.0 0.2 +
r-, 5 1090 6.2 7.5 1.3 0.0 0.1 +(n 6 125 8.8 1.0 0.1 0.0 0
11) 14 )
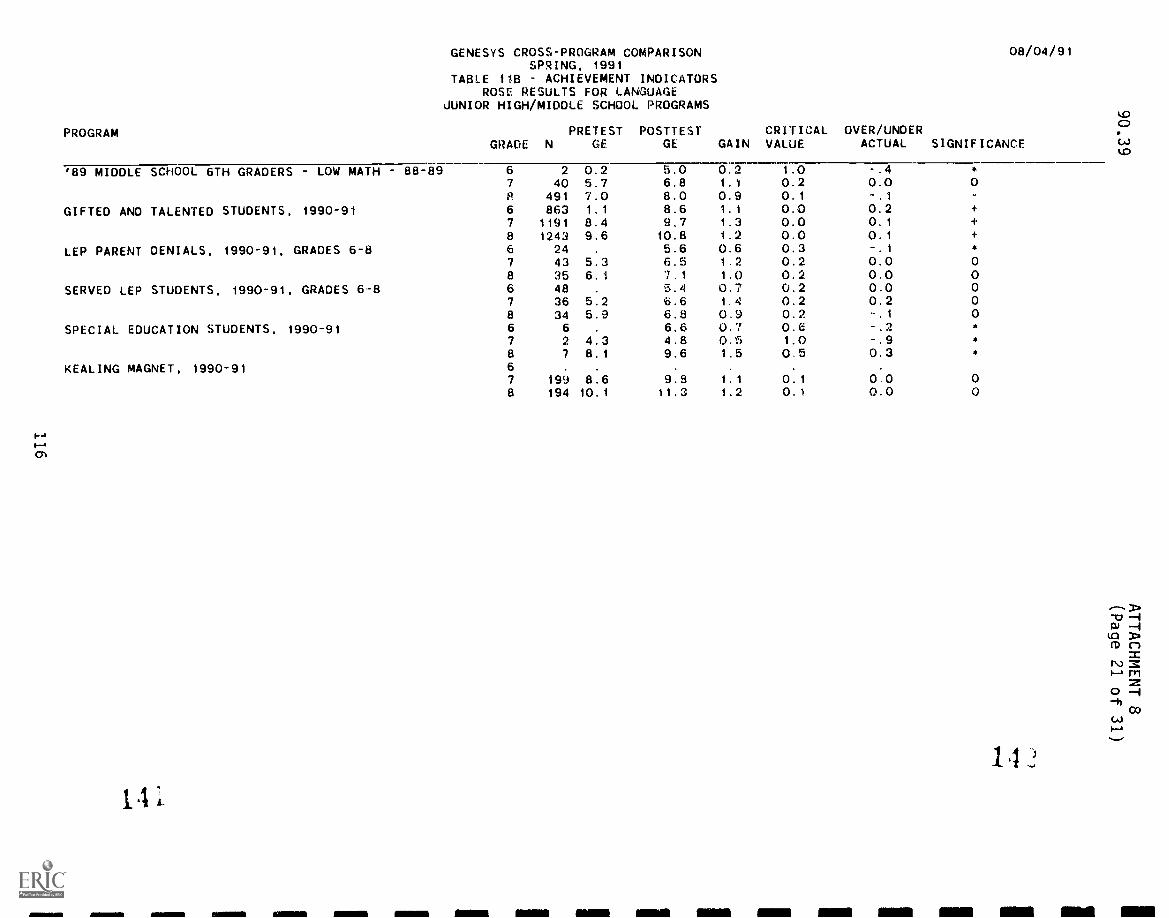
PROGRAM
GENESYS CROSS-PROGRAM COMPARISONSPRING, 1991
TABLE 118 ACHIEVEMENT INDICATORSROSE RESULTS FOR LANGUAGE
JUNIOR HIGH/MIDDLE SCHOOL PROGRAMS
PRETEST POSTTESTGRADE N GE GE GAIN
CRITICALVALUE
OVER/UNDERACTUAL
08/04/91
koCD.
SIGNIFICANCEko
'89 MIDDLE SCHOOL 6TH GRADERS LOW MATH 88-89 6 2 0.2 5.0 0.2 1.0 -.4 *
7 40 5.7 6.8 1.1 0.2 0.0 0El 491 7.0 8.0 0.9 0.1 -.1
GIFTED AND TALENTED STUDENTS, 1990-91 6 863 1.1 8.6 1.1 0.0 0.2 +
7 1191 8.4 9.7 1.3 0.0 0.1 +
8 1243 9.6 10.8 1.2 0.0 0.1 +
LEP PARENT DENIALS, 1990-91, GRADES 6-8 6 24 . 5.6 0.6 0.3 -.1 4
7 43 5.3 8.5 1.2 0.2 0.0 08 35 6.1 7.1 1.0 0.2 0.0 0
SERVED LEP STUDENTS, 1990-91, GRADES 6-8 6 48 . 5.4 0.7 0.2 0.0 07 36 5.2 6.8 1.4 0.2 0.2 08 34 5.9 6.6 O. 0.2 -.1 0
SPECIAL EDUCATION STUDENTS, 1990-91 6 6 . 6.8 0.7 O. -.2 *
7 2 4.3 4.8 O. 1.0 -.9 *
8 7 8.1 9.6 1.5 0.5 0.3 *
KEALING MAGNET, 1990-91 6 . . . .
7 199 8.6 9.8 1.1 0.1 0.0 08 194 10.1 11.3 1.2 O.) 0.0 0
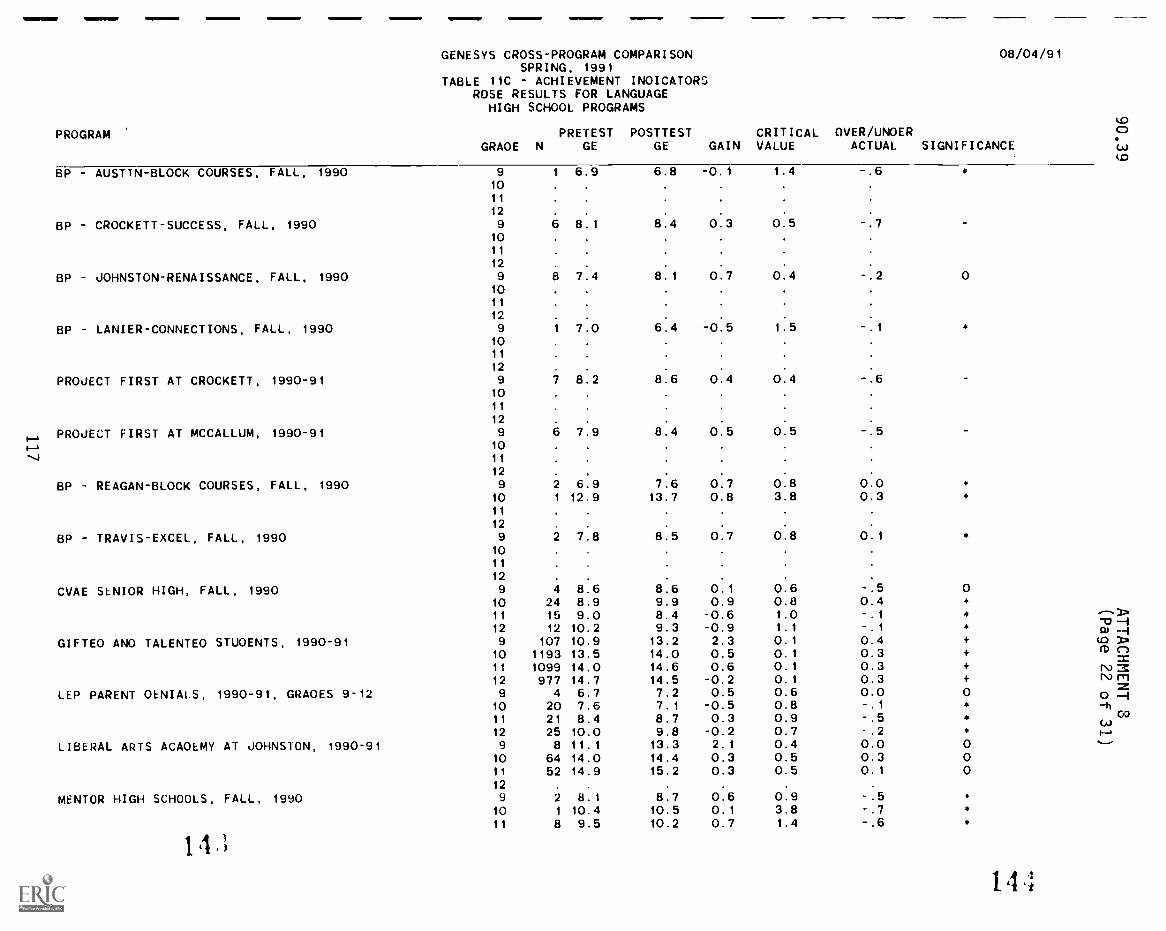
GENESYS CROSS-PROGRAM COMPARISONSPRING, 1991
TABLE 11C ACHIEVEMENT INOICATORSROSE RESULTS FOR LANGUAGE
HIGH SCHOOL PROGRAMS
08/04/91
PROGRAMGRAOE
PRETESTN GE
POSTTESTGE GAIN
CRITICALVALUE
OVER/UNOERACTUAL SIGNIFICANCE
QDCD
°Co
BP - AUSTIN-BLOCK COURSES, FALL, 1990 9 1 6.9 6.8 -0.1 1.4 -.61011
12
BP - CROCKETT-SUCCESS, FALL, 1990 9 6 8:1 8:4 0:3 0:51011
12
BP JOHNSTON-RENAISSANCE, FALL, 1990 9 8 7:4 8:1 0.7 0.4 -.2 01011
12
BP LANIER-CONNECTIONS, FALL, 1990 9 1 7:0 6:4 -0:5 1:5 *
1011
12
PROJECT FIRST AT CROCKETT, 1990-91 9 7 8:2 8:6 0:4 0:4 -.61011
12
1--,PROJECT FIRST AT MCCALLUM, 1990-91 9 6 7.9 8:4 0.5 0:5
1--, 10.4 11
12 .
BP REAGAN-BLOCK COURSES, FALL, 1990 9 2 6.9 7.6 0.7 0.8 0.0 #
10 1 12.9 13.7 0.8 3.8 0.3 *
11
12
BP TRAVIS-EXCEL, FALL, 1990 9 2 7:8 8:5 0:7 0:8 0.1 *
1011
12 . . . . . .
CVAE SENIOR HIGH, FALL, 1990 9 4 8.6 8.6 0.1 0.6 -.5 010 24 8.9 9.9 0.9 0.8 0.4 *
11 15 9.0 8.4 -0.6 1.0 -.1 *..--..
12 12 10.2 9.3 -0.9 1.1 -.1 0 -AGIFTEO ANO TALENTEO STUOENTS, 1990-91 9 107 10.9 13.2 2.3 0.1 0.4 + tO Tm
10 1193 13.5 14.0 0.5 0.1 0.3 + M CI211 1099 14.0 14.6 0.6 0.1 0.3 + N3 -7r
12 977 14.7 14.5 -0.2 0.1 0.3 + N3 rn
LEP PARENT OENIALS, 1990-91, GRAOES 9-12 9 4 6.7 7.2 0.5 0.6 0.0 0 0 -410 20 7.6 7.1 -0.5 0.8 -.1
11 21 8.4 8.7 0.3 0.9 -.5 * 03(A)
12 25 10.0 9.8 -0.2 0.7 -.2
LIBERAL ARTS ACAOEMY AT JOHNSTON, 1990-91 9 8 11.1 13.3 2.1 0.4 0.0 0 ...._...
10 64 14.0 14.4 0.3 0.5 0.3 011 52 14.9 15.2 0.3 0.5 0.1 012 . .
MENTOR HIGH SCHOOLS, FALL, 1990 9 2 8.1 8.7 0.6 0.9 -.5 *
10 1 10.4 10.5 0.1 3.8 -.7 *
11 8 9.5 10.2 0.7 1.4 -.6 *
1 4 3
1 4 ;

GENESYS CROSS-PROGRAM COMPARISONSPRING, 1991
TABLE 11C - ACHIEVEMENT INDICATORSRDSE RESULTS FOR LANGUAGE
HIGH SCHOOL PROGRAMS
PROGRAM
PEAK PRDGRAM HIGH SCHOOL, FALL, 1990
PROJECT TOUCH AT CROCKETT, FALL, 1990
SCIENCE ACADEMY AT LBJ, 1990-91
SERVED LEP STUDENTS, 1990-91, GRADES 9-12
SPECIAL EDUCATION STUDENTS, 1990-91
1 4 5
08/04/91
GRADEPRETEST
N GEPDSTTEST
GE GAINCRITICALVALUE
OVER/UNDERACTUAL SIGNIFICANCE
12 5 14.2 14.1 -0.1 1.7 0.2 *
9 2 8.3 7.8 -0.5 0.9 -.2 *
10 1 6.4 5.5 -0.9 3.8 -.1 *
11 . . . .
12 1 9.8 12.6 2.8 3.7 2.9 *
9 2 9.1 9.5 0.5 0.8 -.6 *
10 2 11.2 12.8 1.6 2.7 1.1 *
11 . . .
12 1 6.3 8.1 1.8 3.7 0.3 *
9 14 11.0 13.7 2.7 0.3 0.6 +
10 156 14.0 14.8 0.9 0.3 0.6 +
11 118 14.5 15.5 0.9 0.4 0.7 +
12 103 15.5 15.5 -0.1 0.4 0.5 +
9 2 7.0 7.4 0.3 0.8 -.3 *
10 12 7.5 6.9 -0.6 1.1 -.2 4.
11 10 7.1 8.2 1.1 1.2 -.2 *
12 16 9.8 9.2 -0.6 0.9 -.7 *
9 2 8.6 8.9 0.4 0.9 -.a *
10 3 13.0 13.0 0.1 2.2 0.4 *
1i . . .
12 3 10.3 11.5 1.2 2.1 0.9 *
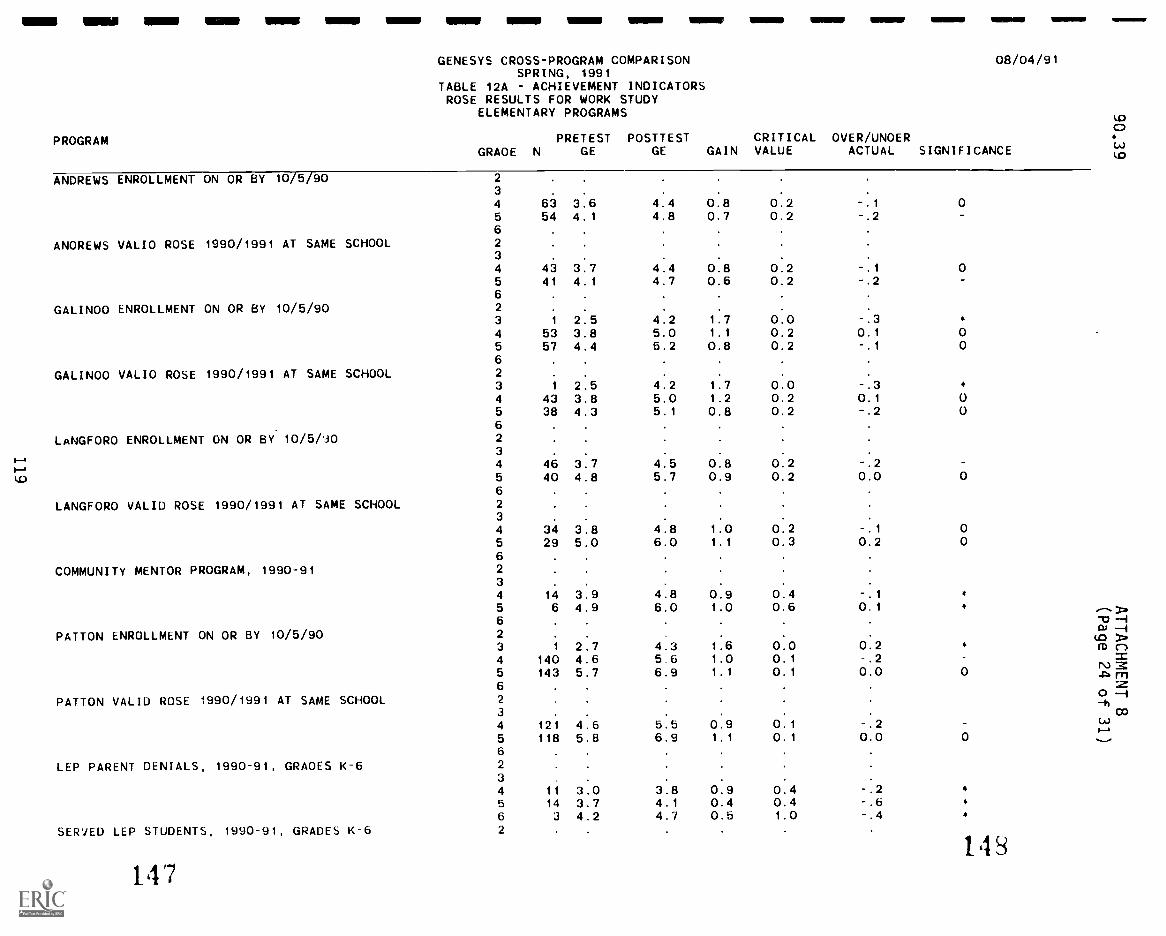
PROGRAM
GENESYS CROSS-PROGRAM COMPARISONSPRING, 1991
TABLE 12A - ACHIEVEMENT INDICATORSROSE RESULTS FOR WORK STUDY
ELEMENTARY PROGRAMS
PRETEST POSTTESTGRAOE N GE GE GAIN
CRITICALVALUE
OB/04/91
toOVER/UNOER
ACTUAL SIGNIFICANCE lo
ANDREWS ENROLLMENT ON OR BY 10/5/90 2
3 .
4 63 3:6 4.4 0.8 0.2 -.1 05 54 4.1 4.8 0.7 0.2 -.26
ANOREWS VALIO ROSE 1990/1991 AT SAME SCHOOL 23 .
4 43 3:7 4.4 0.8 0.2 -.1 05 41 4.1 4.7 0.6 0.2 -.26
GALINO0 ENROLLMENT ON OR BY 10/5/90 2 . .
3 1 2.5 4.2 1.7 0.0 -.3 *
4 53 3.8 5.0 1.1 0.2 0.1 05 57 4.4 5.2 0.8 0.2 -.1 06
GALINO0 VALIO ROSE 1990/1991 AT SAME SCHOOL 2 . . .
3 1 2.5 4.2 1.7 0.0 -.3 *
4 43 3.8 5.0 1.2 0.2 0.1 05 38 4.3 5.1 0.8 0.2 -.2 06
LANGFORO ENROLLMENT ON OR BY. 10/5/30 2
1-3
i-A4 46 3.7 4.5 0.8 0.2 -.2
vo 5 40 4.8 5.7 0.9 0.2 0.0 06
LANGFORO VALID ROSE 1990/1991 AT SAME SCHOOL 2
34 34 3.8 4.8 1.0 0.2 -.1 05 29 5.0 6.0 1.1 0.3 0.2 06
COMMUNITY MENTOR PROGRAM, 1990-91 2
3
4 14 3.9 4.8 0.9 0.4 -.1 *
5 6 4.9 6.0 1.0 0.6 0.1 * T6 17
PATTON ENROLLMENT ON OR BY 10/5/90 2 .
CI)
3 1 2.7 4.3 1.6 0.0 0.2 +CLIM CI
4 140 4.6 5.6 1.0 0.1 -.2 76:
5 143 5.7 6.9 1.1 0.1 0.0 0NJ :C
rn6
PATTON VALID ROSE 1990/1991 AT SAME SCHOOL 2
3 .
0 -I-h
oo
4 121 4.6 5.5 0.9 0.1 -.2 co
5 118 5.8 6.9 1.1 0.1 0.0 06
LEP PARENT DENIALS, 1990-91, GRAOES K-6 2
3 . . .
4 11 3.0 3.8 0.9 0.4 -.2 *
5 14 3.7 4.1 0.4 0.4 -.6 *
6 3 4.2 4.7 0.5 1.0 -.4 *
SERVED LEP STUDENTS, 1990-91, GRADES K-6 2
1 4 S
1 4 7
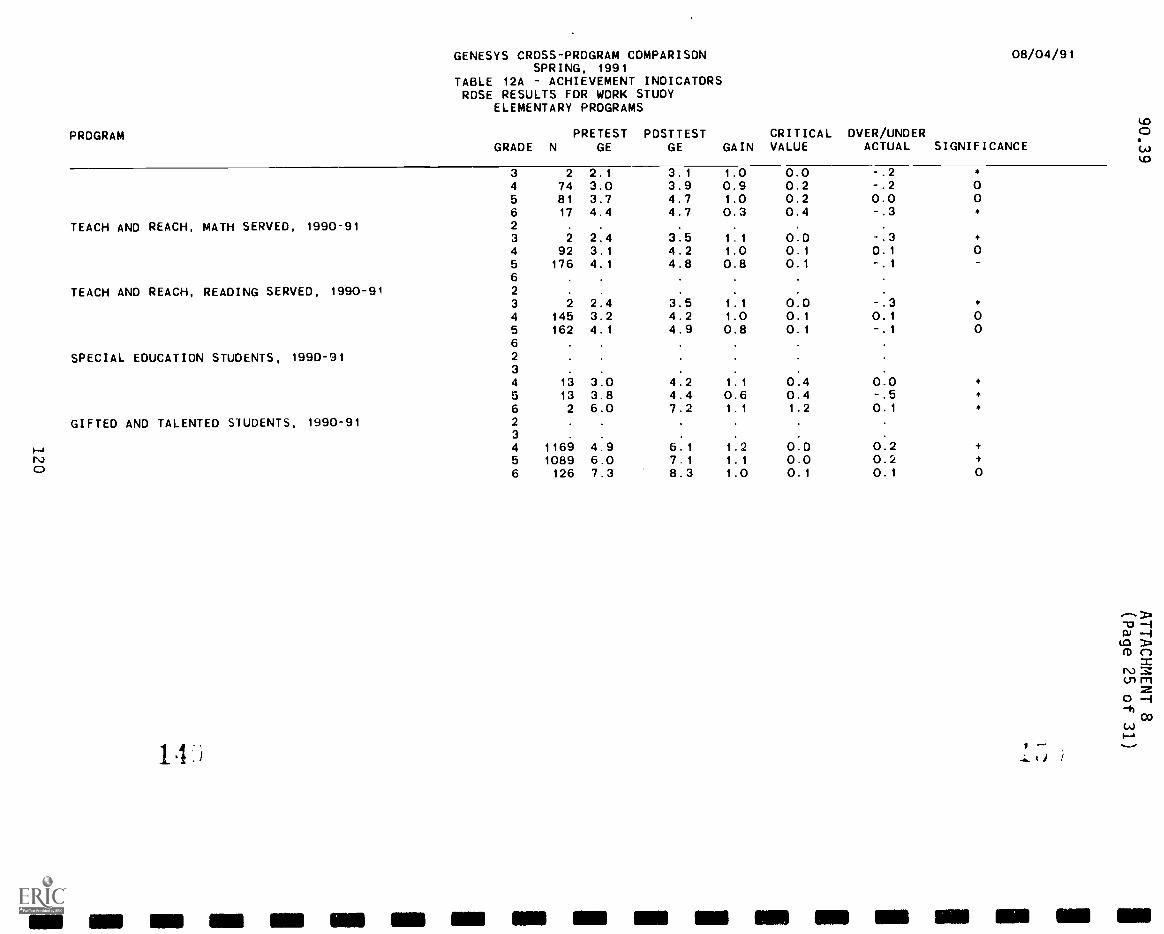
PRDGRAM
GENESYS CROSS-PROGRAM COMPARISONSPRING, 1991
TABLE 12A ACHIEVEMENT INDICATORSROSE RESULTS FOR WORK STUDY
ELEMENTARY PROGRAMS
08/04/91
UDPRETEST POSTTEST CRITICAL OVER/UNDER CD
GRADE N GE GE GAIN VALUE ACTUAL SIGNIFICANCE
3 2 2.1 3.1 1.0 0.0 -.2 *
4 74 3.0 3.9 0.9 0.2 -.2 05 81 3.7 4.7 1.0 0.2 0.0 06 17 4.4 4.7 0.3 0.4 -.3 *
TEACH AND REACH, MATH SERVED, 1990-91 2 . . . .
3 2 2.4 3.5 1.1 0.0 -.3 *
4 92 3.1 4.2 1.0 0.1 0.1 05 176 4.1 4.8 0.8 0.1 -.16
TEACH AND REACH, READING SERVED, 1990-91 2 .
3 2 2.4 3.5 1.1 0.0 -.3 *
4 145 3.2 4.2 1.0 0.1 0.1 05 162 4.1 4.9 0.8 0.1 -.1 06
SPECIAL EDUCATION STUDENTS, 1990-91 2
3 . .
4 13 3.0 4.2 1.1 0.4 0.0 *
5 13 3.8 4.4 0.6 0.4 -.5 *
6 2 6.0 7.2 1.1 1.2 0.1 *
GIFTED AND TALENTED STUDENTS, 1990-91 2
3
,---. 4 1169 4.9 6.1 1.2 0.0 0.2 +
INJ 5 1089 6.0 7.1 1.1 0.0 0.2 +0 6 126 7.3 8.3 1.0 0.1 0.1 0
14 )C.A.)
1
)
co
UM MI NM 11111 NE OM NM 11111 11111 111111 81111 NM MI NM 11111

PkOGRAM
GENESYS CROSS-PROGRAM CDMPARISONSPRING, 1991
TABLE 128 ACHIEVEMENT INDICATDRSROSE RESULTS FOR WDRK STUDY
JUNIDR HIGH/MIDDLE SCHODL PRDGRAMS
08/04/91
PRETEST PDSTTEST CRITICAL DVER/UNDERGRADE N GE GE GAIN VALUE ACTUAL SIGNIFICANCE
'89 MIDDLE SCHDOL 6TH GRADERS LDW MATH 88-89 6 2 4.2 5.5 1.3 1.2 0.87 40 5.2 6.3 1.0 0.3 0.1 08 493 6.3 7.4 1.1 0.1 -.2
GIFTED AND TALENTED STUDENTS, 1990-91 6 865 7.1 8.2 1.1 0.1 0.3 +
7 1198 8.1 9.3 1.2 0.1 0.2 +
8 1247 9.2 10.4 1.2 0.0 0.1 +
LEP PARENT DENIALS, 1990-91, GRADES 6-8 6 25 4.7 5.3 0.5 0.3 0.0 *
7 44 5.2 5.8 0.7 0.3 -.3 08 36 5.4 6.4 1.0 0.3 -.4 -
SERVED LEP STUDENTS, 1990-91, GRADES 6-8 6 49 4.6 5.1 0.4 0.2 -.1 07 36 4.7 5.6 0.9 0.3 -.1 08 35 5.8 6.8 1.0 0.3 -.3 -
SPECIAL EDUCATIDN STUDENTS, 1990-91 6 6 6.1 6.4 0.3 0.7 -.5 *
7 2 4.9 5.8 1.0 1.2 -.5 *
8 8 6.9 8.3 1.5 0.6 0.0 *
KEALING MAGNET, 1990-91 6 . .
7 198 8.4 9.6 1.2 0.1 0.2 +
a 191 9.9 11.0 1.2 0.1 0.1 +
1 5
1 r
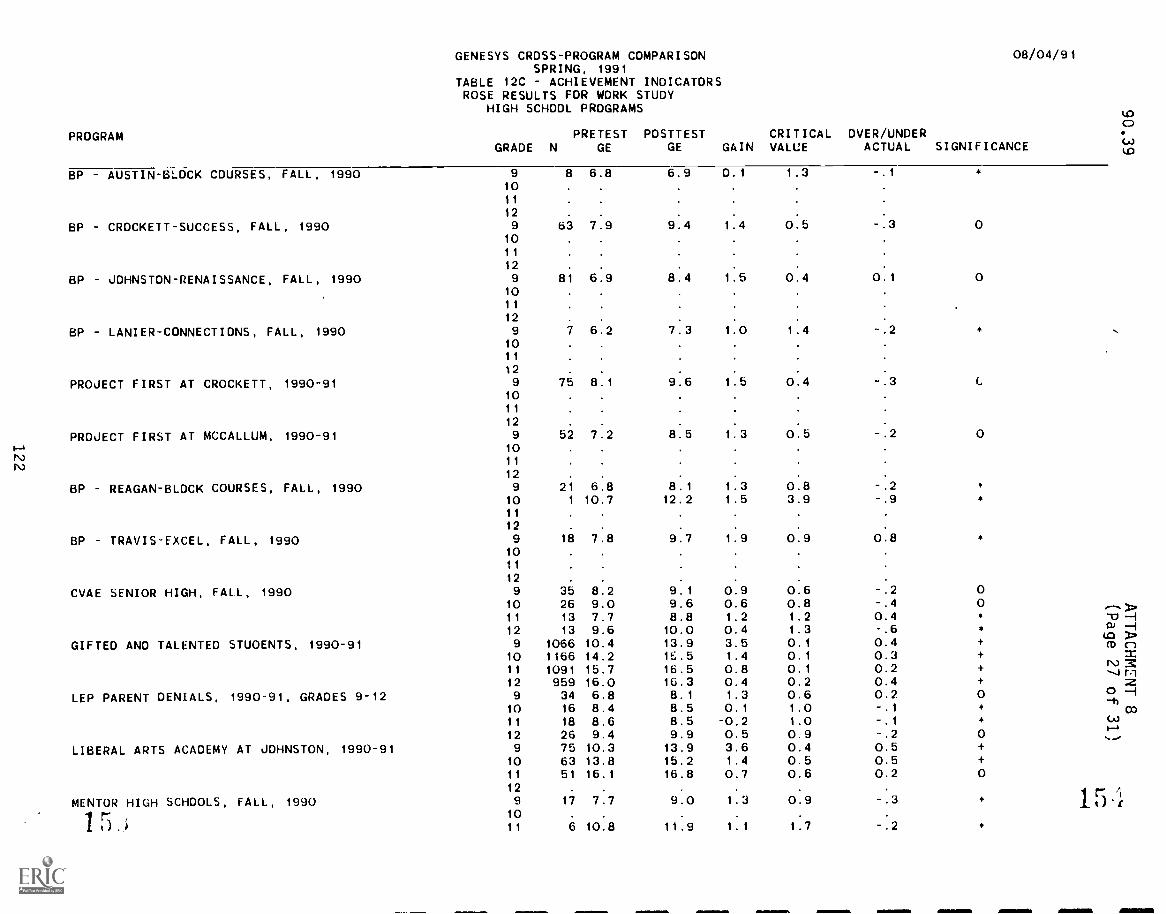
GENESYS CROSS-PROGRAM COMPARISONSPRING, 1991
08/04/91
PROGRAM
TABLE 12C ACHIEVEMENT INDICATORSROSE RESULTS FOR WORK STUDY
HIGH SCHOOL PROGRAMS
PRETEST POSTTESTGRADE N GE GE GAIN
CRITICALVALUE
OVER/UNDERACTUAL SIGNIFICANCE
BP AUSTIN-BLOCK COURSES, FALL, 1990 9 8 6.8 6.9 0.1 1.3 -.1 *
1011
12
BP CROCKETT-SUCCESS, FALL, 1990 9 63 7:9 9.4 1.4 0.5 -.3 01011
12
BP JOHNSTON-RENAISSANCE, FALL, 1990 9 81 6.9 8.4 1:5 0.4 0.1 01011
12
BP LANIER-CONNECTIONS, FALL, 1990 9 7 6.2 7.3 1.0 1.4 -.2 *
1011
12
PROJECT FIRST AT CROCKETT, 1990-91 9 75 8.1 9.6 1.5 0.4 -.3 (..
1011
12
PROJECT FIRST AT MCCALLUM, 1990-91 9 52 7.2 8:5 1:3 0.5 -.2 0e--+ 10IN.)
iv 11
12 . .
BP REAGAN-BLOCK COURSES, FALL, 1990 9 21 6.8 8.1 1.3 0.8 -.2 *
10 1 10.7 12.2 1.5 3.9 -.9 *
11
12
BP TRAVIS-EXCEL, FALL, 1990 9 18 7:8 9:7 1.9 0.9 0.8 *
1011
12 . . . . . .
CVAE SENIOR HIGH, FALL, 1990 9 35 8.2 9.1 0.9 0.6 -.2 010 26 9.0 9.6 0.6 0.8 -.4 011 13 7.7 8.8 1.2 1.2 0.412 13 9.6 10.0 0.4 1.3 -.6 *
GIFTED AND TALENTED STUOENTS, 1990-91 9 1066 10.4 13.9 3.5 0.1 0.4 +
10 1166 14.2 1E.5 1.4 0.1 0.3 +
ii 1091 15.7 16.5 0.8 0.1 0.2 +
12 959 16.0 16.3 0.4 0.2 0.4 +
LEP PARENT DENIALS, 1990-91, GRADES 9-12 9 34 6.8 8.1 1.3 0.6 0.2 010 16 8.4 8.5 0.1 1.0 -.1 *
li 18 8.6 8.5 -0.2 1.0 -.1 *
12 26 9.4 9.9 0.5 0.9 -.2 0LIBERAL ARTS ACADEMY AT JOHNSTON, 1990-91 9 75 10.3 13.9 3.6 0.4 0.5 +
10 63 13.8 15.2 1.4 0.5 0.5 +
11 51 16.1 16.8 0.7 0.6 0.2 012 . . . . . .
MENTOR HIGH SCHOOLS, FALL, 1990 9 17 7.7 9.0 1.3 0.9 -.3 *
15.; 1011 5 :108
.
11.9.
1.1 1:7.
-.2 *
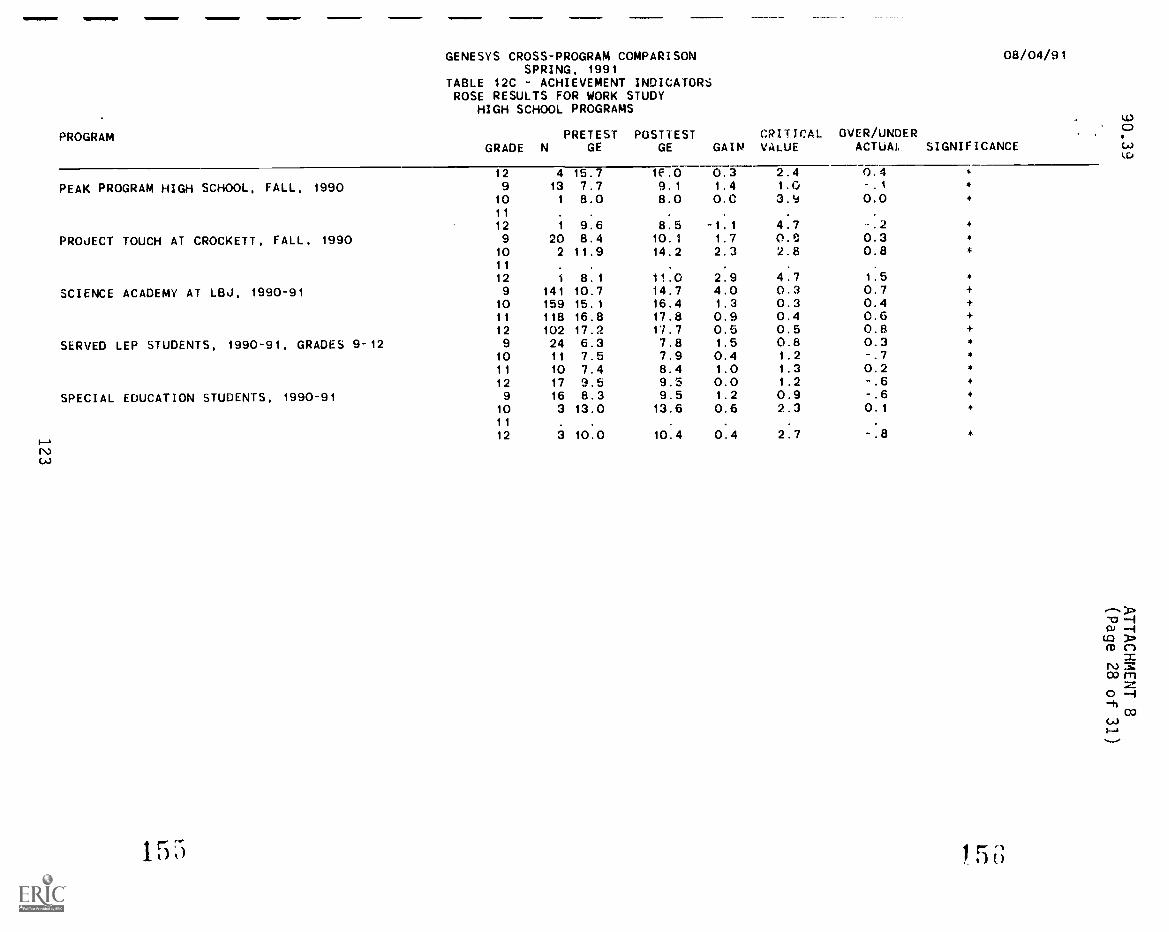
PROGRAM
GENESYS CROSS-PROGRAM COMPARISONSPRING, 1991
TABLE 12C ACHIEVEMENT INDICATORSROSE RESULTS FOR WORK STUDY
HIGH SCHOOL PROGRAMS
08/04/91
PRETEST POSTTEST CRITICAL OVER/UNOERGRADE N GE GE GAIN VALUE ACTUAL SIGNIFICANCE
PEAK PROGRAM HIGH SCHOOL, FALL, 1990
PROJECT TOUCH AT CROCKETT, FALL, 1990
SCIENCE ACADEMY AT LBJ, 1990-91
SERVED LEP STUDENTS, 1990-91, GRADES 9-12
SPECIAL EDUCATION STUDENTS, 1990-91
12 4 15.7 1f.0 0.3 2.4 0.4 4
9 13 7.7 9.1 1.4 1.0 -.1 *
10 1 8.0 8.0 0.0 3.9 0.0 *
11 . .
12 1 9.6 8.5 -1.1 4.7 -.2 *
9 20 8.4 10.1 1.7 O. 0.3 *
10 2 11.9 14.2 2.3 2.8 0.8 *
11 . . .
12 1 8.1 11.0 2.9 4.7 1.5 *
9 141 10.7 14.7 4.0 0.3 0.7 +
10 159 15.1 16.4 1.3 0.3 0.4 +
11 118 16.8 17.8 0.9 0.4 0.6 +
12 102 17.2 11.7 0.5 0.5 0.8 +
9 24 6.3 7.8 1.5 0.8 0.3 *
10 11 7.5 7.9 0.4 1.2 -.7 *
11 10 7.4 8.4 1.0 1.3 0.2 *
12 17 3.5 0.5 0.0 1.2 -.6 *
9 16 8.3 9.5 1.2 0.9 -.6 *
10 3 13.0 13.6 0.6 2.3 0.1 *
11 . . . .
12 3 10.0 10.4 0.4 2.7 -.8
1 5 6
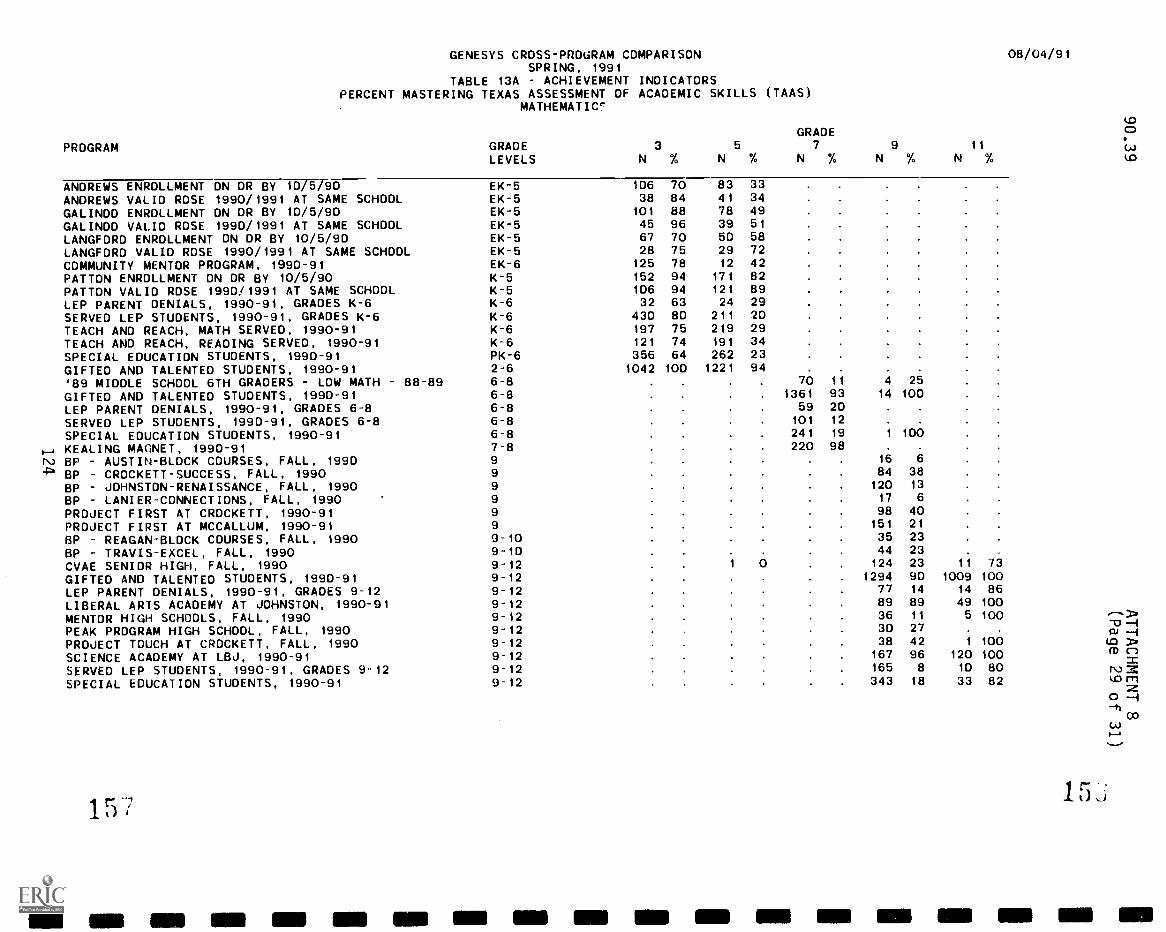
PROGRAM
GENESYS CROSS-PROuRAM COMPARISONSPRING, 1991
TABLE 13A ACHIEVEMENT INDICATORSPERCENT MASTERING TEXAS ASSESSMENT OF ACADEMIC SKILLS (TAAS)
MATHEMATICc
GRADEGRADE 3 5 7 9 11
LEVELS
ANDREWS ENROLLMENT ON OR 8Y 10/5/90 EK-5ANDREWS VALIO ROSE 1990/1991 AT SAME SCHOOL EK-5GALINDO ENROLLMENT ON OR BY 10/5/90 EK-5GALINDO VALID ROSE 1990/1991 AT SAME SCHOOL EK-5LANGFORD ENROLLMENT ON OR BY 10/5/90 EK-5LANGFORD VALID ROSE 1990/1991 AT SAME SCHOOL EK-5COMMUNITY MENTOR PROGRAM, 1990-91 EK-6PATTON ENROLLMENT ON OR BY 10/5/90 K-5PATTON VALID ROSE 1990/1991 AT SAME SCHOOL K-5LEP PARENT DENIALS, 1990-91, GRADES K-6 K-6SERVED LEP STUDENTS, 1990-91, GRADES K-6 K-6TEACH AND REACH, MATH SERVED, 1990-91 K-6TEACH AND REACH, READING SERVED, 1990-91 K-6SPECIAL EDUCATION STUDENTS, 1990-91 PK-6GIFTED AND TALENTED STUDENTS, 1990-91 2-6'89 MIDDLE SCHOOL 6TH GRADERS - LOW MATH 88-89 6-8GIFTED AND TALENTED STUDENTS, 1990-91 6-8LEP PARENT DENIALS, 1990-91, GRADES 6-8 6-8SERVED LEP STUDENTS, 1990-91, GRADES 6-8 6-8SPECIAL EDUCATION STUDENTS, 1990-91 6-8KEALING MAGNET, 1990-91 7-8
r4,0 BP AUSTIN-BLOCK COURSES, FALL, 1990 9
BP CROCKETT-SUCCESS, FALL, 1990 9
BP JOHNSTON-RENAISSANCE, FALL, 1990 9
BP LANIER-CONNECTIONS, FALL, 1990 9
PROJECT FIRST AT CROCKETT, 1990-91 9
PROJECT FIRST AT MCCALLUM, 1990-91 9
BP REAGAN-BLOCK COURSES, FALL, 1990 9-10BP TRAVIS-EXCEL, FALL, 1990 9-10CVAE SENIOR HIGH, FALL, 1990 9-12GIFTED AND TALENTED STUDENTS, 1990-91 9-12LEP PARENT DENIALS, 1990-91, GRADES 9-12 9-12LIBERAL ARTS ACADEMY AT JOHNSTON, 1990-91 9-12MENTOR HIGH SCHOOLS, FALL, 1990 9-12PEAK PROGRAM HIGH SCHOOL, FALL, 1990 9-12PROJECT TOUCH AT CROCKETT, FALL, 1990 9-12SCIENCE ACAOEMY AT LBJ, 1990-91 9-12SERVED LEP STUDENTS, 1990-91, GRADES 9-12 9-12SPECIAL EDUCATION STUDENTS, 1990-91 9-12
N % N % N % N % N
106 70 83 3338 84 41 34
101 88 78 4945 96 39 5167 70 50 5828 75 29 72125 78 12 42152 94 171 82106 94 121 8932 63 24 29
430 80 211 20197 75 219 29121 74 191 34356 64 262 231042 100 1221 94
%
70 11 4 251361 93 14 100
59 20101 12241 19 1 100220 98
16 684 38120 1317 6
98 40151 2135 23
;44124
2323 11
1294 90 100977 14 1489 89 4936 11 530 2738 42 1
167 96 120165 8 10343 18 33
7310086100100
1001008082
08/04/91
EN NMI 1E1 MB MI MI NMI NN1 NIB NM MB MN MB 11111 Ell NIB
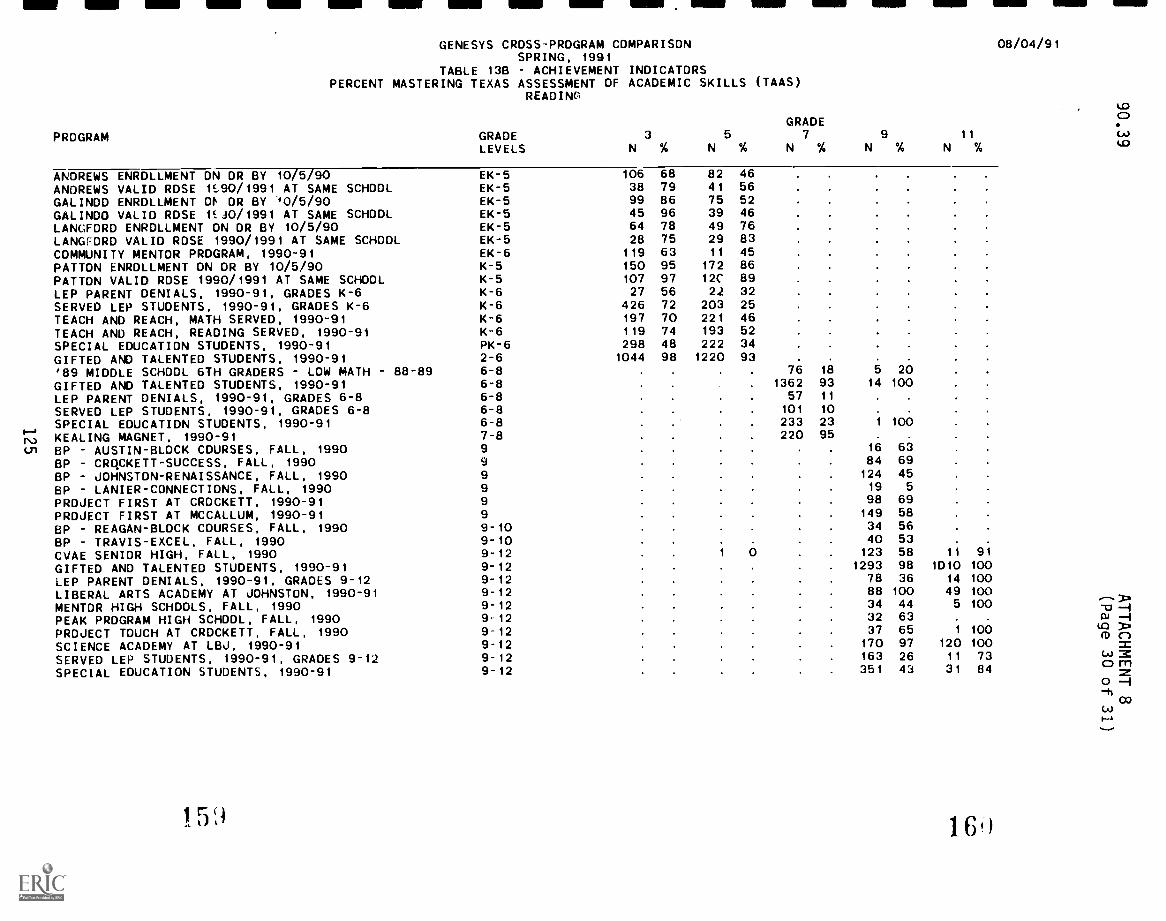
GENESYS CROSS-PROGRAM COMPARISONSPRING, 1991
TABLE 13B ACHIEVEMENT INDICATORSPERCENT MASTERING TEXAS ASSESSMENT OF ACADEMIC SKILLS
READIN(
PROGRAM GRADE 3 5LEVELS N % N %
(TAAS)
GRADE7
N % N9% N
11
%
08/04/91
4.0
4.0
ANDREWS ENROLLMENT ON OR BY 10/5/90 EK-5 106 68 82 46ANDREWS VALID ROSE 1S.,90/1991 AT SAME SCHOOL EK-5 38 79 41 56
GALINDO ENROLLMENT 01A OR BY 40/5/90 EK-5 99 86 75 52GALINDO VALID ROSE 1J0/1991 AT SAME SCHOOL EK-5 45 96 39 46LANGFORD ENROLLMENT ON OR BY 10/5/90 EK-5 64 78 49 76LANGFORD VALID ROSE 1990/1991 AT SAME SCHOOL EK-5 28 75 29 83
COMMUNITY MENTOR PROGRAM, 1990-91 EK-6 119 63 11 45PATTON ENROLLMENT ON OR BY 10/5/90 K-5 150 95 172 86PATTON VALID ROSE 1990/1991 AT SAME SCHOOL K-5 107 97 12C 89LEP PARENT DENIALS, 1990-91, GRADES K-6 K-6 27 56 22 32
SERVED LEP STUDENTS, 1990-91, GRADES K-6 K-6 426 72 203 25TEACH AND REACH, MATH SERVED, 1990-91 K-6 197 70 221 46TEACH AND REACH, READING SERVED, 1990-91 K-6 119 74 193 52
SPECIAL EDUCATION STUDENTS, 1990-91 PK-6 298 48 222 34
GIFTED AND TALENTED STUDENTS, 1990-91 2-6 1044 98 1220 93
'89 MIDDLE SCHOOL 6TH GRADERS LOW MATH 88-89 6-8 76 18 5 20
GIFTED AND TALENTED STUDENTS, 1990-91 6-8 1362 93 14 100
LEP PARENT DENIALS, 1990-91, GRADES 6-8 6-8 57 11
SERVED LEP STUDENTS, 1990-91, GRADES 6-8 6-8 101 10
SPECIAL EDUCATION STUDENTS, 1990-91 6-8 233 23 1 100
na KEALING MAGNET, 1990-91 7-8 220 95un BP AUSTIN-BLOCK COURSES, FALL, 1990 9 16 63
BP CNCKETT-SUCCESS, FALL, 1990 9 84 69
BP JOHNSTON-RENAISSANCE, FALL, 1990 9 124 45
BP LANIER-CONNECTIONS, FALL, 1990 9 19 5
PROJECT FIRST AT CROCKETT, 1990-91 9 98 69
PROJECT FIRST AT MCCALLUM, 1990-91 9 149 58
BP REAGAN-BLOCK COURSES, FALL, 1990 9-10 34 56
BP TRAVIS-EXCEL, FALL, 1990 9-10 40 53
CVAE SENIOR HIGH, FALL, 1990 9-12 123 58 11 91
GIFTED AND TALENTED STUDENTS, 1990-91 9-12 1293 98 1010 100
LEP PARENT DENIALS, 1990-91, GRADES 9-12 9-12 78 36 14 100
LIBERAL ARTS ACADEMY AT JOHNSTON, 1990-91 9-12 88 100 49 100
MENTOR HIGH SCHOOLS, FALL, 1990 9-12 34 44 5 100)71
PEAK PROGRAM HIGH SCHOOL, FALL, 1990 9-12 32 63 5:1)
PROJECT TOUCH AT CROCKETT, FALL, 1990SCIENCE ACADEMY AT LBJ, 1990-91
9-129-12
37170
6597
1
120100100
In D7rt)
SERVED LEP STUDENTS, 1990-91, GRADES 9-12SPECIAL EDUCATION STUDENTS, 1990-91
9-129-12
163351
2643
11
317384 a m
o
IL 5 1 6 )

GENESYS CROSS-PROGRAM COMPARISONSPRING, 1991
08/04/91
TABLE 13C - ACHIEVEMENT INDICATORSPERCENT MASTERING TEXAS ASSESSMENT OF ACADEMIC SKILLS (TAAS)
WRITING
GRADEPROGRAM GRADE 3 5 7
LEVELS N % N % N %9
N %
l0cD
ANDREWS ENROLLMENT ON OR BY 10/5/90 EK-5 105 52 80 55ANDREWS VALID ROSE 1990/1991 AT SAME SCHOOL EK-5 38 68 40 65GALINDO ENROLLMENT ON OR BY 10/5/90 EK-5 99 74 76 87GALINDO VALID ROSE 1990/1991 AT SAME SCHOOL EK-5 45 80 39 92LANGFORD ENROLLMENT ON OR BY 10/5/90 EK-5 65 60 49 84LANGFORD VALID ROSE 1990/1991 AT SAME SCHOOL EK-5 28 68 29 86COMMUNITY MENTOR PROGRAM, 1990-91 EK-6 118 41 11 91
PATTON ENROLLMENT ON OR BY 10/5/90 K-5 152 80 171 94PATTON VALID ROSE 1990/1991 AT SAME SCHOOL K-5 109 83 119 96LEP PARENT DENIALS, 1990-91, GRADES K-6 K-6 29 21 22 59SERVED LEP STUDENTS, 1990-91, GRADES K-6 K-6 425 58 203 58TEACH AND REACH, MATH SERVED, 1990-91 K-6 197 55 217 61
TEACH AND REACH, READING SERVED, 1990-91 K-6 121 52 191 68SPECIAL EDUCATION STUDENTS, 1990-91 PK-6 292 27 218 49GIFTED AND TALENTED STUDENTS, 1990-91 2-6 1048 88 1215 95 . .
'89 MIDDLE SCHOOL 6TH GRADERS LOW MATH 88-89 6-8 71 28 4 25
GIFTCO AND TALENTED STUDENTS, 1990-91 6-8 1349 92 14 86LEP PARENT DENIALS, 1990-91, GRADES 6-8 6-8 56 34SERVED LEP STUDENTS, 1990-91, GRADES 6-8 6-8 102 24
na SPECIAL EDUCATION STUDENTS, 1990-91 6-8 229 24
cr) KEALING MAGNET, 1990-91 7-8 220 93BP AUSTIN-BLOCK COURSES, FALL, 1990 9 14 7
BP - CROCKETT-SUCCESS, FALL, 1990 9 85 29
BP JOHNSTON-RENAISSANCE, FALL, 1990 9 120 26
BP LANIER-CONNECTIONS, FALL, 1990 9 14 7
PROJECT FIRST AT CROCKETT, 1990-91 9 99 31
PROJECT FIRST AT MCCALLUM, 1990-91 9 144 31
BP REAGAN-BLOCK COURSES, FALL, 1990 9-10 35 26
BP TRAVIS-EXCEL, FALL, 1990 9-10 43 37
CVAE SENIOR HIGH, FALL, 1990 9-12 119 28 11 64
GIFTED AND TALENTED STUDENTS, 1990-91 9-12 1293 88 1010 100
LEP PARENT DENIALS, 1990-91, GRADES 9-12 9-12 75 21 14 93
LIBERAL ARTS ACADEMY AT JOHNSTON, 1990-91 9-12 88 93 49 100MENTOR HIGH SCHOOLS, FALL, 1990 9-12 36 28 5 100
PEAK PROGRAM HIGH SCHOOL, FALL, 1990 9-12 31 32 . .
lL)PROJECT TOUCH AT CROCKETT, FALL, 1990 9-12 34 44 1 100
SCIENCE ACADEMY AT LBJ, 1990-91 9-12 170 95 120 100
SERVED LEP STUDENTS, 1990-91, GRADES 9-12 9-12 161 7 11 73 mSPECIAL EDUCATION STUDENTS, 1990-91 9-12 339 21 33 82 o
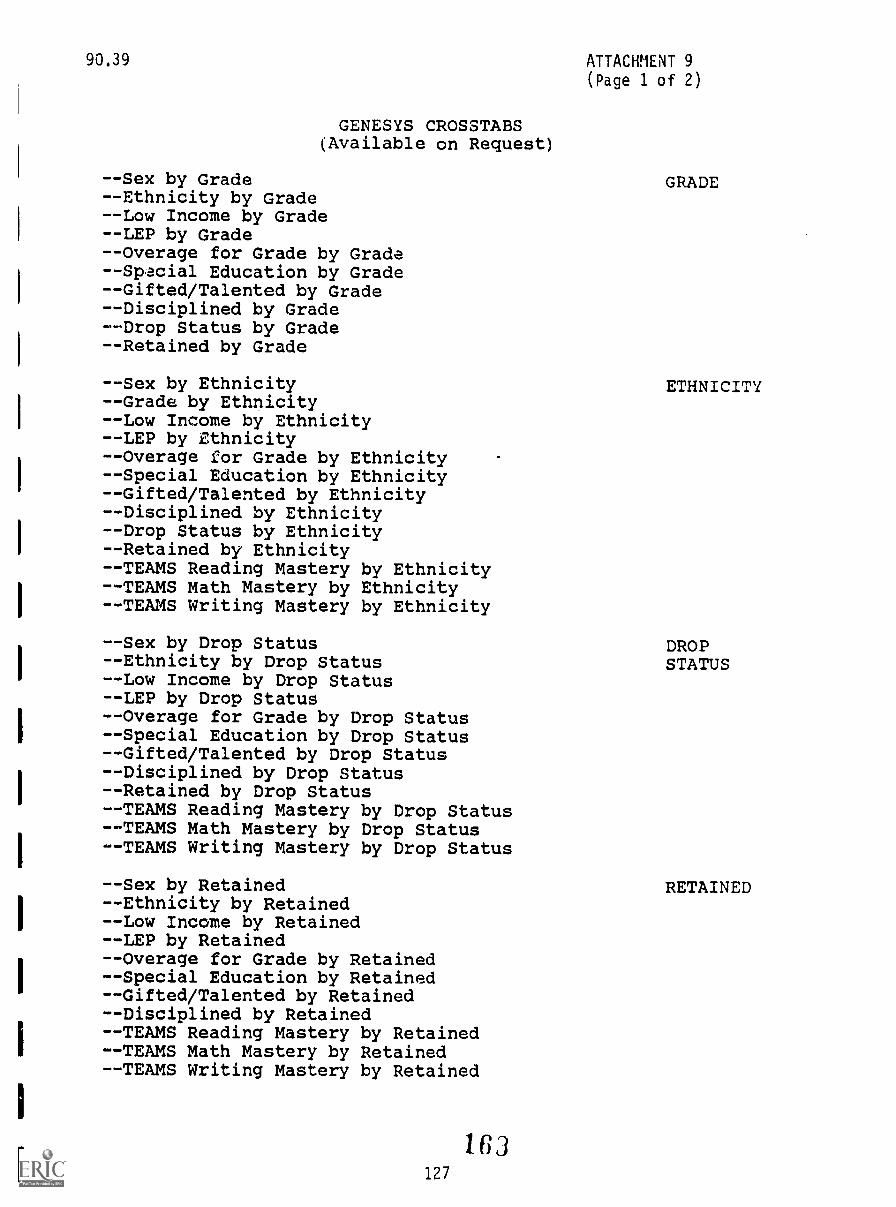
90.39
GENESYS CROSSTABS(Available on Request)
- -Sex by Grade- -Ethnicity by Grade--Low Income by Grade- -LEP by Grade- -Overage for Grade by Grade- -Spacial Education by Grade--Gifted/Talented by Grade- -Disciplined by Grade--Drop Status by Grade--Retained by Grade
- -Sex by Ethnicity- -Grade by Ethnicity- -Low Income by Ethnicity--LEP by Ethnicity- -Overage for Grade by Ethnicity- -Special Education by Ethnicity- -Gifted/Talented by Ethnicity- -Disciplined by Ethnicity- -Drop Status by Ethnicity- -Retained by Ethnicity- -TEAMS Reading Mastery by Ethnicity- -TEAMS Math Mastery by Ethnicity- -TEAMS Writing Mastery by Ethnicity
ATTACHMENT 9(Page 1 of 2)
GRADE
ETHNICITY
- -Sex by Drop Status DROP- -Ethnicity by Drop Status STATUS- -Low Income by Drop Status- -LEP by Drop Status--Overage for Grade by Drop Status- -Special Education by Drop Status- -Gifted/Talented by Drop Status- -Disciplined by Drop Status- -Retained by Drop Status- -TEAMS Reading Mastery by Drop Status- -TEAMS Math Mastery by Drop Status--TEAMS Writing Mastery by Drop Status
- -Sex by Retained--Ethnicity by Retained--Low Income by Retained- -LEP by Retained- -Overage for Grade by Retained--Special Education by Retained- -Gifted/Talented by Retained--Disciplined by Retained- -TEAMS Reading Mastery by Retained- -TEAMS Math Mastery by Retained- -TEAMS Writing Mastery by Retained
RETAINED
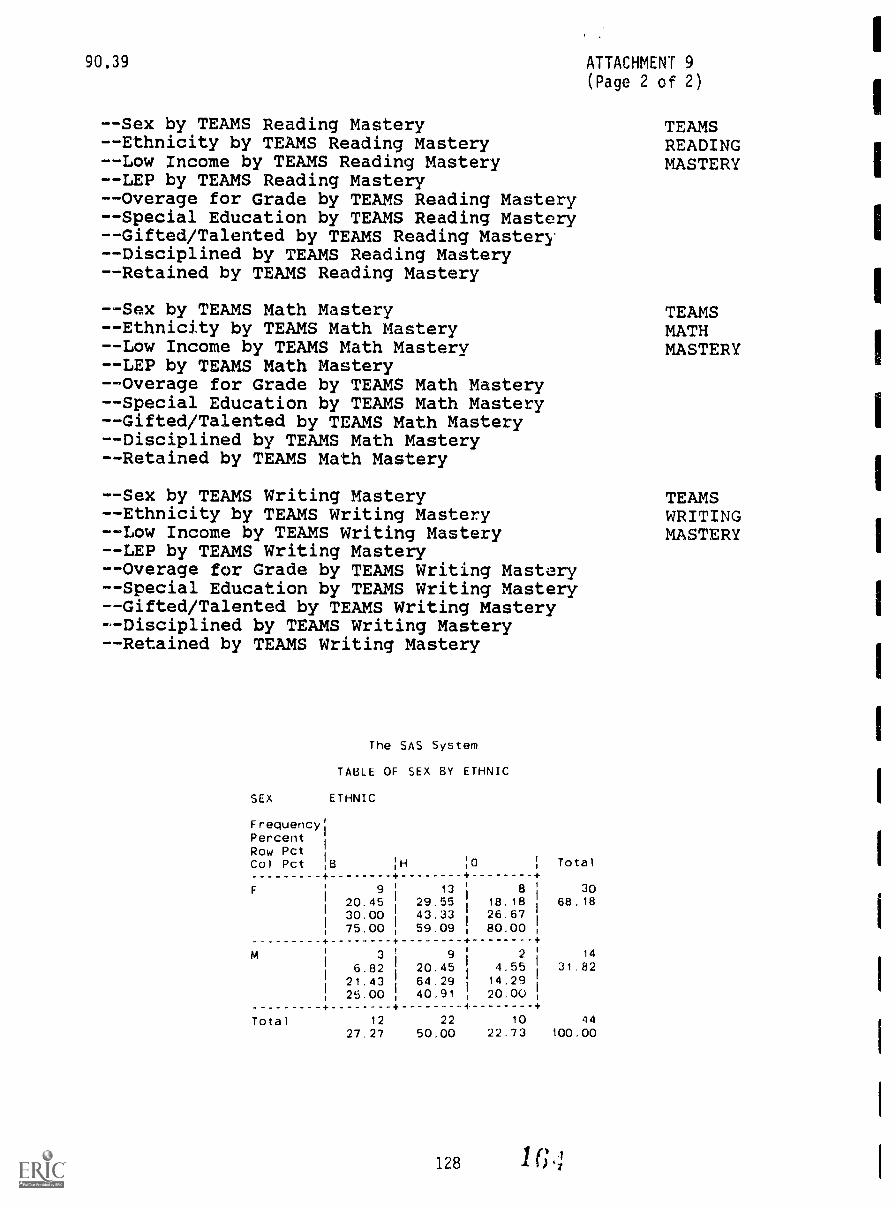
90.39 ATTACHMENT 9(Page 2 of 2)
- -Sex by TEAMS Reading Mastery TEAMS- -Ethnicity by TEAMS Reading Mastery READING--Low Income by TEAMS Reading Mastery MASTERY- -LEP by TEAMS Reading Mastery--Overage for Grade by TEAMS Reading Mastery- -Special Education by TEAMS Reading Mastery- -Gifted/Talented by TEAMS Reading Mastery--Disciplined by TEAMS Reading Mastery- -Retained by TEAMS Reading Mastery
--Sex by TEAMS Math Mastery TEAMS- -Ethnicity by TEAMS Math Mastery MATH--Low Income by TEAMS Math Mastery MASTERY- -LEP by TEAMS Math Mastery--Overage for Grade by TEAMS Math Mastery- -Special Education by TEAMS Math Mastery--Gifted/Talented by TEAMS Math Mastery- -Disciplined by TEAMS Math Mastery- -Retained by TEAMS Math Mastery
--Sex by TEAMS Writing Mastery TEAMS--Ethnicity by TEAMS Writing Mastery WRITING- -Low Income by TEAMS Writing Mastery MASTERY--LEP by TEAMS Writing Mastery--Overage for Grade by TEAMS Writing Mastery--Special Education by TEAMS Writing Mastery--Gifted/Talented by TEAMS Writing Mastery--Disciplined by TEAMS Writing Mastery--Retained by TEAMS Writing Mastery
SEX
Frequency;PercentRow PctCol Pct
F
M
Total
The SAS System
TABLE OF SEX BY ETHNIC
ETHNIC
B IHi i0+ +
9I
13 ;
20.45 18.1:I
29.55I30.00 . 43.33I
26.6775.00 I 59.09
1 180.00
+ +
3 ! 9 1 2
6.82 I 20.45 , 4.5521.43
I
64.29 ! 14.29I25.00 40.91 1 20.00
4
22 10
27.27 50.00 22.73
!
+
i
I
I
1
+
1
.
!
i
1
Total
3068.16
14
31.82
44
100.00
128 1 G
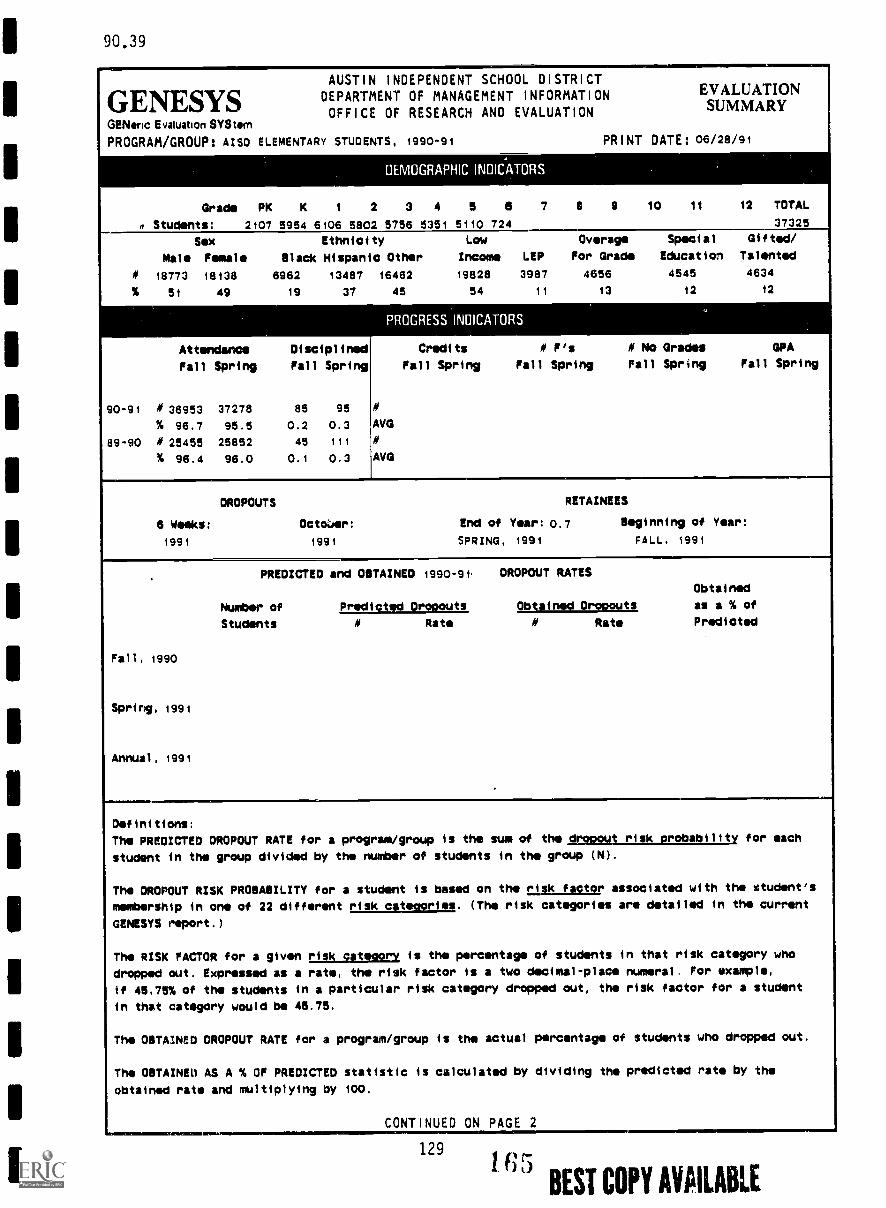
90.39
AUSTIN INDEPENDENT SCHOOL DISTRICT
GENESYS DEPARTMENT OF MANAGEMENT INFORMATION EVALUATION
OFFICE OF RESEARCH AND EVALUATION SUMMARYGENeric Evaluation SYStem
PROGRAM/GROUP: AISD ELEMENTARY STUDENTS, 1990-91 PRINT DATE: 06/28/91
Grade PK K 1
. Students: 2107 5954 6106 5802
DEMOGRAPHIC INDICATORS
2 3 4 5 5 7 8 9 10 11 12 TOTAL
5756 8351 5110 724 37325
Sex Ethnicity Low Overage Special Gifted/
Male Female Black Hispanic Other Income LEP For Grade Education Talented
# 18773 18138 6962 13487 16462 19828 3987 4656 4545 4634
% 51 49 19 37 45 54 11 13 12 12
Attendance Disciplined
Fall Spring Fall Spring
90-91 # 36953 37278 85 95
% 96.7 95.5 0.2 0.3
89-90 # 25455 25852 45 iii
% 96.4 96.0 0.1 0.3
PROGRESS INDICATORS
Credits # F's # No Grades GPA
Fall Spring Fall Spring Fall Spring Fall Spring
#
AVG
#
AVG
DROPOUTS RETAINEES
6 Weeks: OctoUer: End of Year: 0.7 Beginning of Year:
1991 1991 SPRING, 1991 PALL, 1991
PREDICTED and OBTAINED 1990-9t. DROPOUT RATES
Obtained
Number of Predicted Dropouts Obtained Dropouts as a % of
Students # Rate # Rate Predicted
Fall, 1990
Spring, 1991
Annual, 1991
Definitions:
The PREDICTED DROPOUT RATE for a program/group
student in the group divided by the number
The DROPOUT RISK PROBABILITY for a student
membership in one of 22 different risk
is the sum of the risk probability for each
of students in the group (N).
is based on the risk factor associated with the student's
catedories. (The risk categories are detailed in the current
GENESYS report.)
The RISK FACTOR for a given ris cpteoory is the percentage of students in that risk category who
dropped out. Expressed as a rate, the risk factor is a two decimal-place numeral. For example,
if 45.75% of the students in a particular risk category dropped out, the risk factor for a student
in that category would be 45.75.
The OBTAINED DROPOUT RATE for a program/group is the actual percentage of students who dropped out.
The OBTAINED AS A % OF PREDICTED statistic is calculated by dividing the predicted rate by the
obtained rats and multiplying by 100.
...CONTINUED ON PAGE 2m....
129165
BEST COPY AVAILABLE

90.39
PROGRAM/GROUP: AiSO ELEMENTARY STUDENTS, 1990-91 EVALUATION SUMMARY-P.2
GENESYS Grade
Reading Comprehension
Number of Students
--- -.ACHIEVEMENT INDICATORS
PERCENTILES,
3 4 5 5
45 46 49 55
5060 4714 4498 648
7 a 9 10 11 12
IT16S/TAP MEDIAN
2
49 56
5245 5087
Mathsmatics 56 66 53 52 51 59
Number of Students 5377 5187 5120 4768 4534 651
--tomposite 57 61 57 52 52 59
Number of Studkents 5182 5040 4981 4664 4452 646
ROPE, SPRING 1990 TO SPRING 1991 MEAN GRADE EQUIVALENT
Grade 2 3 4 5 6 7 a 9 10 11 12
READING COMPREHENSION
Number of Students 3678 3727 3494 3400 516
1990 Grade Equivalent 2.0 3.2 4.0 5.0 6.3
1991 Grade Equivalent 3.2 4.0 5.0 6.0 7.3 .
Gain 1.2 0.8 1.0 1.1 1.0
Over/Under Predicted 0.0 0.0 0.0 0.0 0.0
Program Effectiveness o 0 0 0 0
Range for 0 (+/-) 0.0 0.0 0.0 0.0 0.0
MATHEMATICS
Number of Students 3686 3728 3476 3394 519
1990 Grade Equiialent 2.1 3.3 4.0 5.0 6.4
1991 Grade Equivalent 3.3 4.0 5.1 6.1 7.3
Gain 1.2 0.7 1.1 1.1 0.9
Over/Under Predicted 0.0 0.0 0.0 0.0 0.0
Program Effectiveness 0 0 0 o 0
Range for 0 (+/-) 0.0 0.0 0.0 0.0 0.0
LANGUAGE
Number of Students 3484 3388 518
1990 Grade Equivalent 4.7 5.3 6.8
1991 Grade Equivalent 5.5 6.4 7.7
Gain 0.8 1.1 0.9
Over/Under Predicted 0.0 0.0 0.0
Program Effectiveness o 0 0
Range for 0 (+/-) 0.0 0.0 0.1
WORK STUDY
Number of Students 3474 3389 520
1990 Grade Equivalent 4.0 5.0 6.4
1991 Grade Equivalent 5.1 6.0 7.2
Gain 1.1 1.0 0.9
Over/Under Predicted 0.0 0.0 0.0
Program Effectiveness o o 0
Range for 0 (+/-) 0.0 0.0 0.1
TAAS PERCENT MASTERING
Grade 3 5 7 s 11KEY
WRITING
Number of Students 4950 4292
Mastery Level 67 Ri !TIM lowe Tests of Basic Skills
Academic Recognition 5 6 TAP Tests of Achievement and
READING Proficiency
Number of Students 4955 4318 ROPE Report On Program
Mastery Level 84 69 Effectiveness
Academic Recognition 48 36 Number of Students is
MATHEMATICS Too Small for Analysis
Number of Students 5018 4361 - Positive Impact
Mastery Level 86 60 - . Negative impact
Academic Recognition 34 19 0 No Impact
PASSING ALL TAAS Texas Assessment of
TESTS TAKEN Academic Skills
Number of Students 5088 4417
Mastery Levl 62 52
Academic Recognition 3 3
130
BEST COPY AVAILABLE

90.39
AUSTIN INDEPENDENT SCHOOL 0 I STRI CT
GENESYS DEPARTMENT OF MANAGEMENT I NFORMAT ION EVALUATION
OFFICE OF RESEARCH AND EVALUATION SUMMARYGENeric Evaivation SYS tem
PROGRAM/GROUP: AISO MIDDLE/JUNIOR H/GH STUDENTS, 1990-9t PRINT DATE: 08/28/91,
OEMOGRAPHIC INDICATORS.
Grade PK K 1 2 3 4 5 11 7 8 9 10 11 12 TOTAL
# Students: 3983 447i 4081 12543
Sex Ethnicity
Mal Female Black Hispanic
# 6412 6129 2628 4278
% 51 49 21 34
.
.
Attendance Disciplined
Fall Spring Fall Spring
90-91 M 12428 12523 688 831
V. 94.8 92.7 5.5 6.6
89-90 M 11087 11234 409 477
% 96.0 94.7 3.3 3.8
Low Overage Special Gifted/
Other Income LEP For Grade Education Talented
5635 5552 591 3248 1421 4161
45 44 5 26 11 33
PROGRESS INDICATORS
Credits # F's # No Grades GPA
Fall Spring Fall Spring Fall Spring Fall Spring
# 12234 11812 12298 11864
AVG 0.51 0.58 84.3 8..1
M 7079 6852 7093 6948
AVG 0.51 0.52 84.1 84.0
DROPOUTS RETAINEES
6th 6 Weeks: 3.4 October: End of Year: 3,7 Beginning of Year:
1991 1991 SPRING, 1991 FALL, 1991
PREDICTED and OBTAINED i990-91 DROPOUT RATES
Obtained
Number of Predicted OPOOOlits Obtained Drppouts as a % of
Students M Rate # Rate Predicted
Fall, 1990 12543
Spring, 1991
Annual, 1991
Definitions:
The PREDICTED DROPOUT RATE for a program/group
student in the group divided by the number
The DROPOUT RISK PROBABILITY for a student
membership in one of 22 different MViciaggrill.GENESYS report.)
The RISK FACTOR for a given risk caproory
is the sum of the dropout risk probability for each
of students in the group (N).
is based on the risk factor associated with the student's
(The risk categories are detailed in the current
is the percentage of students in that risk category who
dropped out. Expressed as a rate, the risk factor Is a two decimal-place numeral. For example,
If 45.75% of the students in a particular risk category dropped out, the risk factor for a student
in that category would be 45,75.
The OBTAINED DROPOUT RATE for a program/group is the actual percentage of students who dropped out.
The OBTAINED AS A % OF PREDICTED statistic is calculated by dividing the predicted rate by the
obtained rate and multiplying by 100.
CONTINUED ON PAGE 2
131
1 7 BEST COPY AVAILABLE
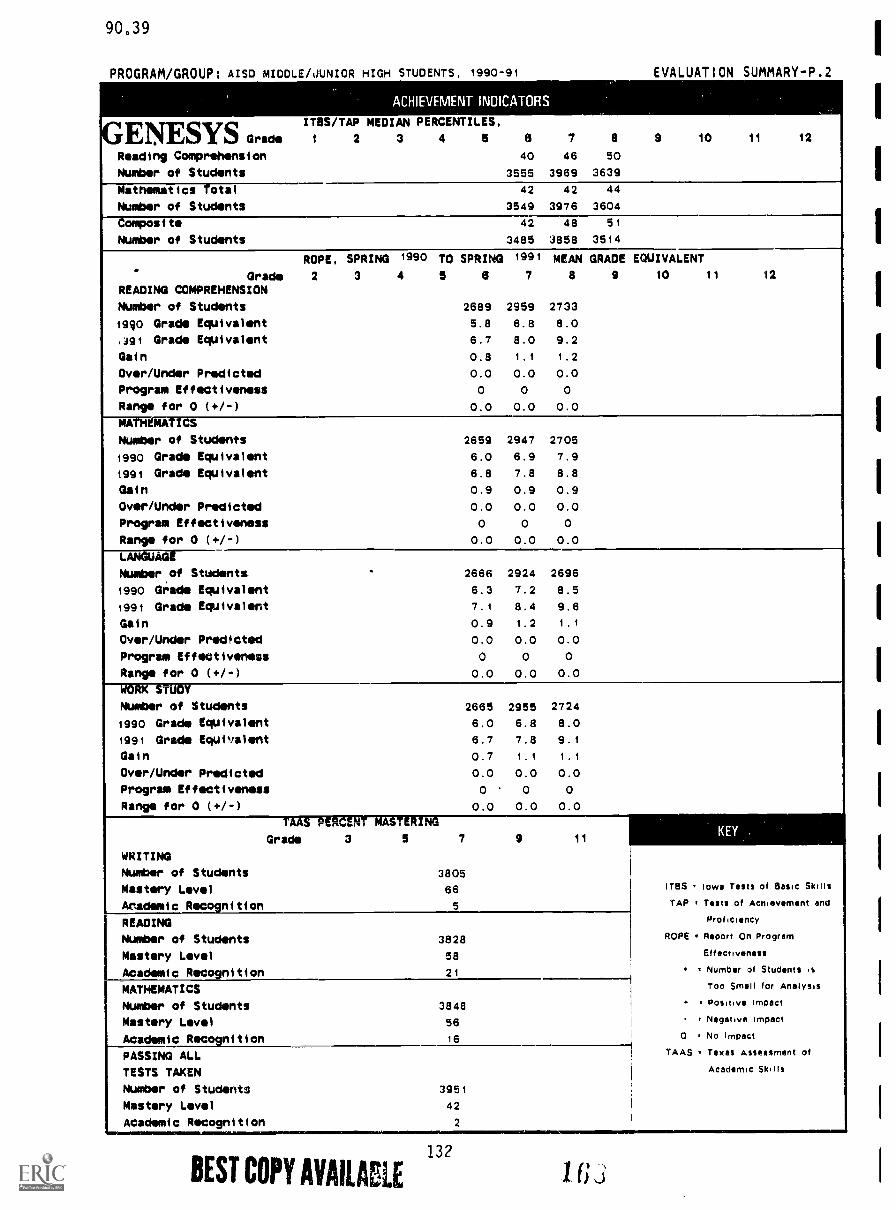
90,39
PROGRAM GROUP: AISO MIDDLE/JUNIOR HIGH STUDENTS, 1990-91 EVALUATION SUMMARY-P.2
ACHIEVEMENTINOICATORS
7 8 9 10 11 12
46 50
3969 3639
GENESYS Grade
TS/TAP MEDIAN PERCENTILES,2 3 4 5 8
Reading Comprehension 40
Number of Students 3555
Mathematics tótáI
Number of Students
42
3549
42 44
3976 3604
--tomposite
Number of Students
42
3485
48 51
3858 3514
ROPE, SPRING 1990 TO SPRING 1991 MEAN GRADE EQUIVALENT
Grade 2 3 4 5 8 7 8 9 10 11 12
READING COMPREHENSION
Number of Students 2689 2959 2733
1910 Grade Equivalent 5.8 6.8 8.0
.391 Grade Equivalent 6.7 8.0 9.2
Gain 0.8 1.1 1.2
Over/Under Predicted 0.0 0.0 0.0
Program Effectiveness 0 0 0
Range for 0 (+/-) 0.0 0.0 0.0
-741W-Tr3MACNumber of Students 2659 2947 2705
1990 Grade Equivalent 6.0 6.9 7.9
19ei Grade Equivalent 6.8 7.8 8.8
Gain 0.9 0.9 0.9
Over/Under Predicted 0.0 0.0 0.0
Program Effectiveness 0 0 0
Range for 0 (+/-) 0.0 0.0 0.0
LANGUAGE
Number.of Students - 2666 2924 2696
1960 Grade Equivalent 6.3 7.2 8.5
1991 Grade Equivalent 7.1 8.4 9.6
Gain 0.9 1.2 1.1
Over/Under Predicted 0.0 0.0 0.0
Program Effectiveness 0 0 0
Range for 0 (+/-) 0.0 0.0 0.0
WORK STUDY
Number of Students 2665 2955 2724
1990 Grade Equivalent 6.0 6.8 8.0
1961 Grade Equivalent 6.7 7.8 9.1
Gain 0.7 1.1 1.1
Over/Under Predicted 0.0 0.0 0.0
Program Effectiveness 0 0 0
Range for 0 (+/-) 0.0 0.0 0.0
TAAS PERCENT MASTERING
Grade 3 5 7 9KEY .
11 .
WRITING
Number of Students 3805
Mastery Level 66 ITBS x Iowe Teets of Basic Skills
Academic Recognition 5 TAP Tests of Achievement and
READING Proficiency
Number of Students 3828 ROPE . Report On Program
Mastery Level 58 Effectiveness
Academic Recognition 21 , Number of Studenti is
MATHEMATICS Too Small for Analysis
Number of Students 3848 Positive impact
Mastery Level 56 Negative impact
Academic Roc- ition 16 0 . No Impact
PASSING ALL TAAS Texas Assessment of
TESTS TAKENI
Academic Skills
Number of Students 3951
Mastery Level 42
Academic Recognition 21
BEST COPY AVAILABLE132
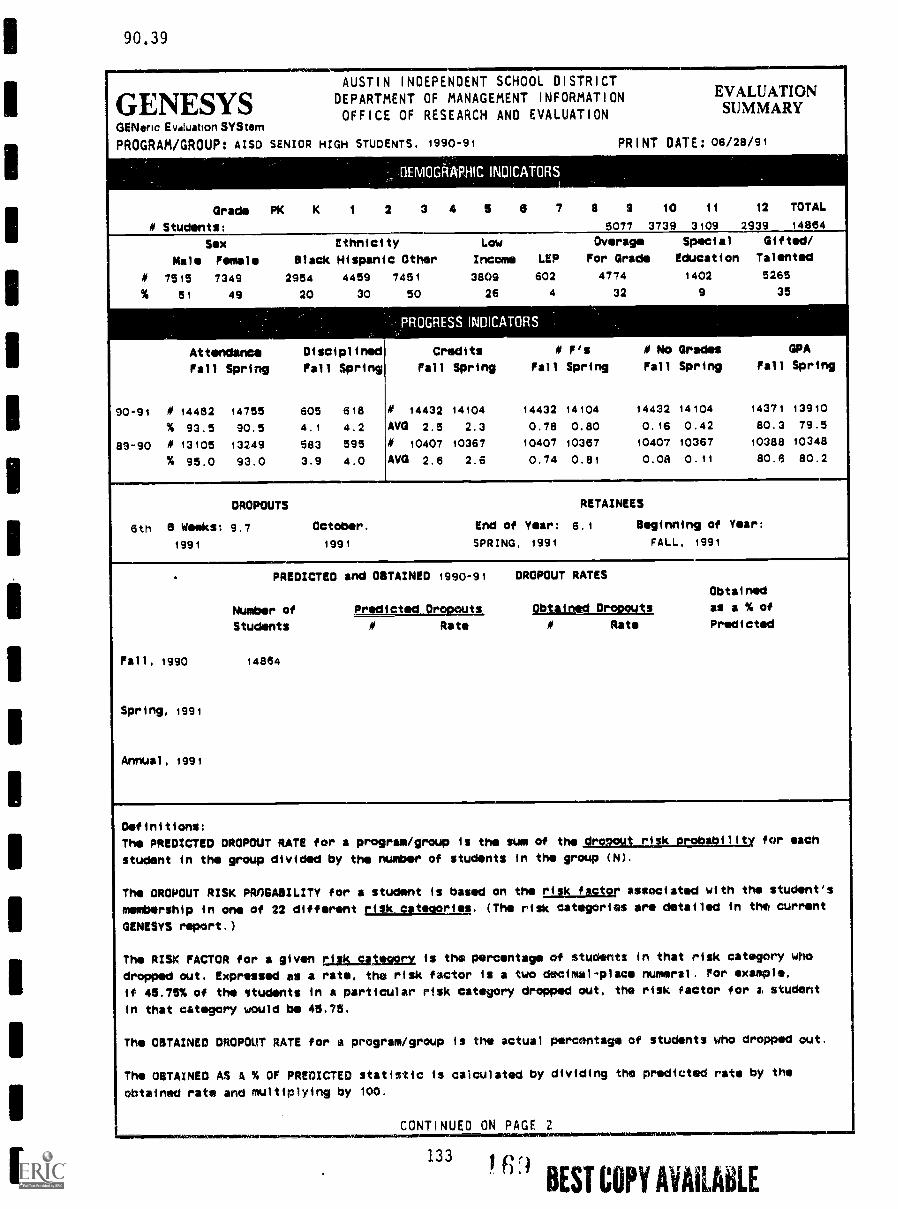
1
90,39
AUSTINDEPARTMENTGENESYS OFFICE
GENeric Evilluation SYStem
PROGRAM/GROUP: AISD SENIOR HIGH STUDENTS,
.
Grade PK K 1
f Students:
INDEPENDENT SCHOOL DISTRICTOF MANAGEMENT INFORMATION
OF RESEARCH AND EVALUATION
EVALUATIONSUMMARY
1990-91 PRINT OATE:06/28/91
UOMOGRAfMCINMCATORS.
2 3 4 5 8 7 8 2 10 11 12 TOTAL
5077 3739 3109 2939 14864
Sex Ethnicity
Male Female Black Hispanic
M 7515 7349 2954 4459
% 51 49 20 30
Attendance Disciplined
Fall Spring Fall Spring
90-91 M 14482 14755 605 618
% 93.5 90.5 4.1 4.2
89-90 M 13105 13249 583 595
% 95.0 93.0 3.9 4.0
Low Overage Special Gifted/
Other Income LEP For Grade Education Talented
7451 3809 602 4774 1402 5265
50 26 4 32 9 35
- PROGRESS INDICATORS
Credits k F's M No Grades GPA
Fall Spring Fall Spring Fall Spring Fall Spring
M 14432 14104 14432 14104 14492 14104 14371 13910
Ava 2.5 2.3 0.78 0.80 0.16 0.42 80.3 79.5
M 10407 10367 10407 10367 10407 10367 10388 10348
AVG 2.6 2.6 0.74 0.81 0,08 0.11 80.6 80.2
DROPOUTS RETAINEES
6th a Weeks: 9.7 October. End of Year: 6,1 Beginning of Year:
1991 1991 SPRING, 1991 FALL, 1991
. PREDICTED and OBTAINED 1990-91 DROPOUT RATES
Obtained
Number of Predicted Dropouts tg)..CUMMO.D1_ as a % of
Students M Rats I/ Rate Predicted
Fall, 1990 14864
Spring, 1991
Annual, 1991
Definitions:The PREDICTED DROPOUT RATE for a program/group is the sum of the sLout_j_l_rorslp_fallItyrob for each
student in the group divided by the number of students in the group (N).
The OROPOUT RISK PRDBABILITY for a student is based on the al_k_LAgI2r associated with the student's
membership in one of 22 different cil_k_salmcam. (The risk categories are detailed in thm current
GENESYS report.)
The RISK FACTOR for a given agh_sitegetx is the percentage of students in that risk category WhO
dropped out. Expressed as a rate, the risk factor is a two decimal-place numeral. For example,
if 45.75% of the students in a particular risk category dropped out, the risk factor for a student
in that category would be 45.73.
The OBTAINED DROPOUT RATE for a program/group is the actual percentage of students who dropped cut.
The OBTAINED AS A % OF PREDICTED statistic is calculated by dividing the predicted rate by the
obtained rata and multiplying by 100.
CONTINUED ON PAGE 2
6 BEST COPY AVAILABLE
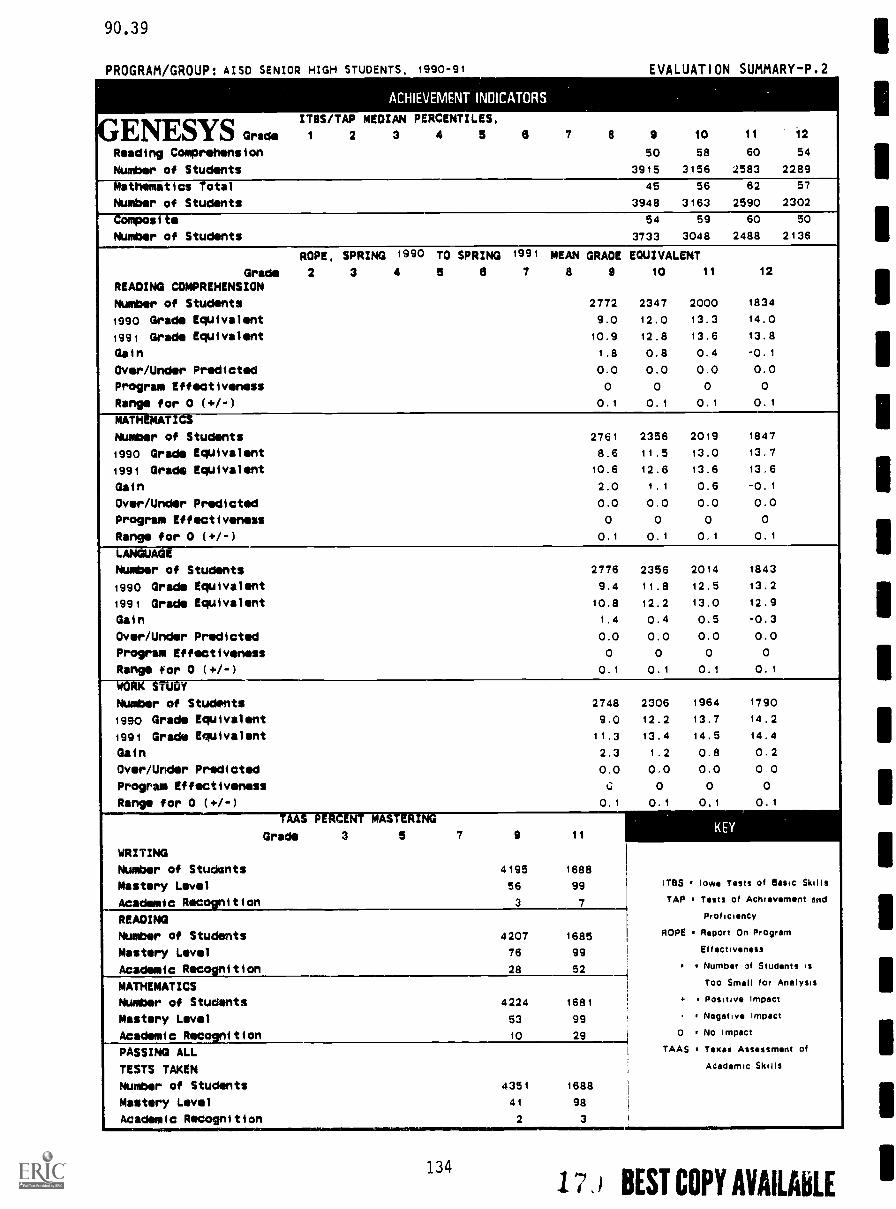
90.39
PROGRAM GROUP: AISO SENIOR HIGH STUDENTS, 1990-31 EVALUATION SUMMARY-P.2
ACHIEVEMENT INOICATORS
GENES1(S Grade
IT1BS/TAP MEDIAN PERCENTILES,
2 3 4 5 a
Reading Comprehension
Number of Students
7 a a 10 11 12
50 58 60 54
3915 3156 2583 2289
Mathematics Total 45 56 62 57
Number of Students 3948 3163 2590 2302
omposi 54 59 60 50
Number of Students 3733 3048 2488 2136
ROPE, SPRING 1990 TO SPRING 1991 MEAN GRADE EQUIVALENT
Grade 2 3 4 a a 7 a 9 10 11 12
READING COMPREHENSION
Number of Students 2772 2347 2000 1834
1990 Grade Equivalent 9.0 12.0 13.3 14.0
1991 Grade Equivalent 10.9 12.8 13.6 13.8
Gain 1.8 0.8 0.4 -0.1
Over/Under Predicted 0.0 0.0 0.0 0.0
Program Effectiveness 0 0 0 0
Range for 0 (+/-) 0.1 0.1 0.1 0.1
MATHEMATICS
Number of Students 2761 2356 2019 1847
1990 Grade Equivalent 8.6 11.5 13.0 13.7
1991 Grade Equivalent 10.6 12.6 13.6 13.6
Gal n 2.0 1.1 0.6 -0.1
Over/Under Predicted 0.0 0.0 0.0 0.0
Program Effectiveness 0 0 0 0
Range for 0 (+/-) 0.1 0.1 0.1 0.1
LANGUAGE
Number of Students 2776 2356 2014 1843
1990 Grade Equivalent 9.4 11.8 12.5 13.2
1991 Grade Equivalent 10.8 12.2 13.0 12.9
Gal n 1,4 0.4 0.5 -0.3
Over/Under Predicted 0.0 0.0 0.0 0.0
Program Effectiveness 0 0 0 0
Range for 0 (+/-) 0.1 0.1 0.1 0.1
WORK STUDY
Number of Students 2748 2306 1964 1790
1990 Grade Equivalent 9.0 12.2 13.7 14.2
1991 Grade Equivalent 11,3 13.4 14.5 14.4
Gain 2.3 1.2 0.8 0.2
Over/Under Predicted 0.0 0.0 0.0 0 0
Program Effectiveness C 0 0 0
Range for 0 (+/-) 0.1 0.1 0,1 0 1
TAAS PERCENT MASTERING
Grade 3 a 7 a 11KEY
WRITING
Number of Studonts 4195 1688
Mastery Level 56 99 !TES Iowa Tests of Basic Skills
Academic Recognition 3 7 TAP Tests of Achievement and
proficIsncyREADING
Number of Students 4207 1685 ROPE r Report On Program
Mastery Level 76 99 Effectiveness
Academic Recognition 28 52 Number of Students is
MATHEMATICS Too Small for Analysis
Number of Students 4224 1681 « Positive Impact
Mastery Level 53 99 Negative Impact
Academic Recognition 10 29 0 No Impact
j
TAAS Texas A merit ofPASSING ALL
TESTS TAKEN Academic Skills
Number of Students 4351 1688
Mastery Level 41 98
Academic Recognition 2 3
134) BEST COPY AVAILABLE
Austin Independent School District
Department of Management InformationDr. Glynn Ligon, Executive Director
Office of Research and EvaluationSystemwide Evaluation
David Wilkinson, Evaluator
Authors:David Wilkinson, Evaluator
Sedra G. SPano, Evaluation Associate
Contributing Staff:Stacy Buffington, Programmer/Analyst
Veda Ralu. Programmer/AnalystLeonila N. Gonzalez, SecretaryLinda Frazer, Research Analyst
Board of Trustees
Bernice Hart, PresideatBob West. Vice President
John Lay, SecretaryNan Clayton
Dr. Beatrlz de la GarzaMelissa Knippa
Dr. Gary R. McKenzie
SuPerintendent of SchoolsDr. Jim B. Hensley
Publication Number 90.39July, 1991
1.7:BEST COPY AVAILABLE