eddata ii education data for decision making (eddata ii ... in nepal.pdf · demonstrated by mr....
TRANSCRIPT

EdData II
Education Data for Decision Making (EdData II): Data for Education Programming in Asia and Middle East (DEP/AME) Nepal Early Grade Reading Assessment (EGRA) Study Report EdData II Technical and Managerial Assistance, Task Number 15 Contract Number: AID-OAA-BC-11-00001 July 21, 2014 This publication was produced for review by the United States Agency for International Development. It was prepared by RTI International.
Education Data for Decision Making (EdData II): Data for Education Programming in Asia and Middle East (DEP/AME) Nepal Early Grade Reading Assessment (EGRA) Study EdData II Task Order No. 15 Prepared for Mitch Kirby/Asia Bureau COR [email protected] USAID/Nepal Prepared by Yasmin Sitabkhan and Joseph DeStefano RTI International 3040 Cornwallis Road Post Office Box 12194 Research Triangle Park, NC 27709-2194 RTI International is a trade name of Research Triangle Institute. The authors’ views expressed in this publication do not necessarily reflect the views of the United States Agency for International Development or the United States Government.

Table of Contents Acknowledgements .................................................................................................................... v
List of Figures ..................................................................................................................... vi
List of Tables .................................................................................................................... vii
Abbreviations ...................................................................................................................viii
I. Project Description and Overview ................................................................................. 1
Objective and Structure of this Report ................................................................... 1
II. Overview of Findings from the EGRA Study................................................................ 2
RQ1: To what extent are students in Grades 2 and 3 learning to read in Nepali? . 2
Average Scores by Region and Ecobelt ................................................................. 5
Average Scores by Gender ..................................................................................... 6
Conclusion Regarding Research Question 1 .......................................................... 7
III. Overview of EGRA and Administration........................................................................ 7
Descriptive Statistics from EGRA ....................................................................... 11
IV. Findings for the Remaining Key Research Questions ................................................. 13
RQ 2: What reading-related skills are students in Grades 2 and 3 acquiring? ..... 13
Conclusion Regarding Research Question 2 ........................................................ 19
RQ 3: What factors—both out-of-school and in-school—may explain student performance on the EGRA? ....................................................................... 19
Out-of-School Factors .......................................................................................... 19
In-School Factors ................................................................................................. 26
Teacher Attitudes and Beliefs .............................................................................. 29
RQ 4: How well do teachers understand a written explanation of a proposed Early Grade Reading Program? ................................................................. 33
V. Conclusions and Implications ...................................................................................... 35
Implications of the Findings of the EGRA Study for Curricula and Instructional Design ........................................................................................................ 36
Implications of the Findings of the EGRA Study for Teacher Professional Development and Instructional Support .................................................... 37
Implications of the Findings of the EGRA Study for Materials Development, Production, and Distribution ...................................................................... 38
Annex A: List of EGRA Adaptation Workshop Participants ..................................... 39
Annex B: EGRA Sampling Plan ................................................................................ 40
Annex C: Anecdotal Findings from Private Schools ................................................. 42
Annex D: EGRA Instruments ..................................................................................... 45

EdData II, DEP/AME Task 15, Nepal EGRA
iv
Annex E: List of Participants—Early Grade Reading Assessment (EGRA) – 2014 Dissemination Seminar ..................................................................... 46

EdData II, DEP/AME Task 15, Nepal EGRA
v
Acknowledgements This study was carried out under a technical assistance contract awarded to RTI International from USAID under the Education Data for Decision Making (EdData II) project. The team that conducted this study consisted of two core partners: RTI International, and New ERA.
RTI acknowledges the support of members of the Ministry of Education (MOE) as well as the Central Line Agencies; in particular, RTI would like to recognize the ongoing support of Mr. Mahashram Sharma, Chief of Planning and Monitoring Section, MOE, as well as Dr. Lava Dev Awasthi, Director General, Department of Education (DOE), both of whom provided leadership during the study design phase. Mr. Jhum Prasad Rai, Under Secretary, MOE, was integral in coordination from the early efforts to plan the study, adapt the instruments, and provide support through the training periods. RTI would also like to thank members of the MOE and DOE who assisted with the monitoring and supervision during the data collection period.
RTI would like to extend our gratitude toward New ERA, in particular the strong leadership demonstrated by Mr. Niranjan Dhungel, Project Coordinator; Dr. Laxman Gnawali, Senior Technical Advisor; and the excellent core team on the project at New ERA. We recognize the team of assessors and field supervisors who gave their time and energy to collecting data across the country, often in hard-to-access locations. Their smiling faces while administering the EGRA instrument made the data collection process much easier for everyone. And, of course, we thank the children in Nepal who consented to taking the EGRA, and the schools and teachers that allowed a disruption in their schedules in order to participate in this important study.

EdData II, DEP/AME Task 15, Nepal EGRA
vi
List of Figures Figure 1: Reading Comprehension Scores ........................................................................ 3
Figure 2: Mean Oral Reading Fluency and Reading Comprehension Scores, Grade 2 ............................................................................................................... 4
Figure 3: Mean Oral Reading Fluency and Reading Comprehension Scores, Grade 3 ............................................................................................................... 4
Figure 4: Mean Oral Reading Fluency by Region ............................................................. 5
Figure 5: Mean Oral Reading Fluency Scores by Grade and Ecobelt ............................... 6
Figure 6: Zero Scores on Oral Reading Fluency by Grade and Ecobelt ........................... 6
Figure 7: Student Age ...................................................................................................... 11
Figure 8: Student Language by Ecobelt .......................................................................... 12
Figure 9: Ecobelts and Regions and Numbers of Schools .............................................. 12
Figure 10: Distribution of the Timed Subtasks for Grade 2 .............................................. 15
Figure 11: Distribution of the Timed Subtasks for Grade 3 .............................................. 15
Figure 12: Reading Passage for the Oral Reading Fluency Subtask ................................. 16
Figure 13: Listening Comprehension Scores .................................................................... 18
Figure 14: Oral Reading Fluency Means by Ecobelt, with and without Zero Scores ............................................................................................................... 21
Figure 15: Reading Fluency by SES Quartile ................................................................... 23
Figure 16: Reading Comprehension by Language Group ................................................. 24
Figure 17: Percentage of Zero-Scoring Students Who Reported Speaking either Nepali or a Local Language at Home .............................................................. 25
Figure 18: Relationship between EMES-TOS Indices and Average Oral Reading Fluency ............................................................................................................. 27
Figure 19: Mother Tongue Language Instruction ............................................................. 31
Figure 20: Student Ability ................................................................................................. 32
Figure 21: Student Engagement ........................................................................................ 32
Figure 22: Reading Instructional Practices........................................................................ 33
Figure 23: Teacher Comprehension of a Short Passage .................................................... 34
EdData II, DEP/AME Task 15, Nepal EGRA
vii
List of Tables Table 1: Mean Oral Reading Fluency and Percent Zero Scores in Grades 2 and
3.......................................................................................................................... 3
Table 2: Sample by Gender ............................................................................................ 11
Table 3: Summary of Reading Performance on All Subtasks........................................ 13
Table 4: Word and Question Correspondence ............................................................... 17
Table 5: Grade 2 Analysis of Correct Responses to Attempted Questions .................... 17
Table 6: Grade 3 Analysis of Correct Responses to Attempted Questions .................... 18
Table 7: Grade 2 Scores by Ecobelt ............................................................................... 20
Table 8: Grade 3 Scores by Ecobelt ............................................................................... 20
Table 9: Listening Comprehension Scores by Home Language .................................... 24
Table 10: Multivariate Model of In-School Factors Shown to Correlate Significantly with Average Oral Reading Fluency .......................................... 28
Table 11: Teacher Attitudes and Beliefs .......................................................................... 29
Table 12: Percent of Teachers Answering Each Question Correctly ............................... 34
EdData II, DEP/AME Task 15, Nepal EGRA
viii
Abbreviations Asia/ME Asia and Middle East clpm correct letters per minute cnwpm correct nonwords per minute cmpm correct matras per minute cwpm correct words per minute DEP-AME Data for Education Programming in Asia and the Middle East EdData Education Data for Decision Making EGR early grade reading EGRA early grade reading assessment EGRP Early Grade Reading Program EMES-TOS Education Management Efficiency Study and Teacher Observation Study Grade Grade HT head teacher MOE Ministry of Education MT mother tongue MTB-MLE mother-tongue-based multi-lingual education ORF oral reading fluency PASEC Programme d’Analyse des Systèmes Educatifs de la Confemen PISA Organisation for Economic Co-Operation and Development’s Programme
for International Student Assessment PPS probability proportional to size PTA parent-teacher association RQ research question RTI RTI International (trade name of Research Triangle Institute) SACMEQ Southern Africa Consortium for the Measurement of Educational Quality SES socioeconomic status TIMSS Trends in International Mathematics and Science Study USAID United States Agency for International Development VDC Village Development Committee wpm words per minute
EdData II, DEP/AME Task 15, Nepal EGRA
1
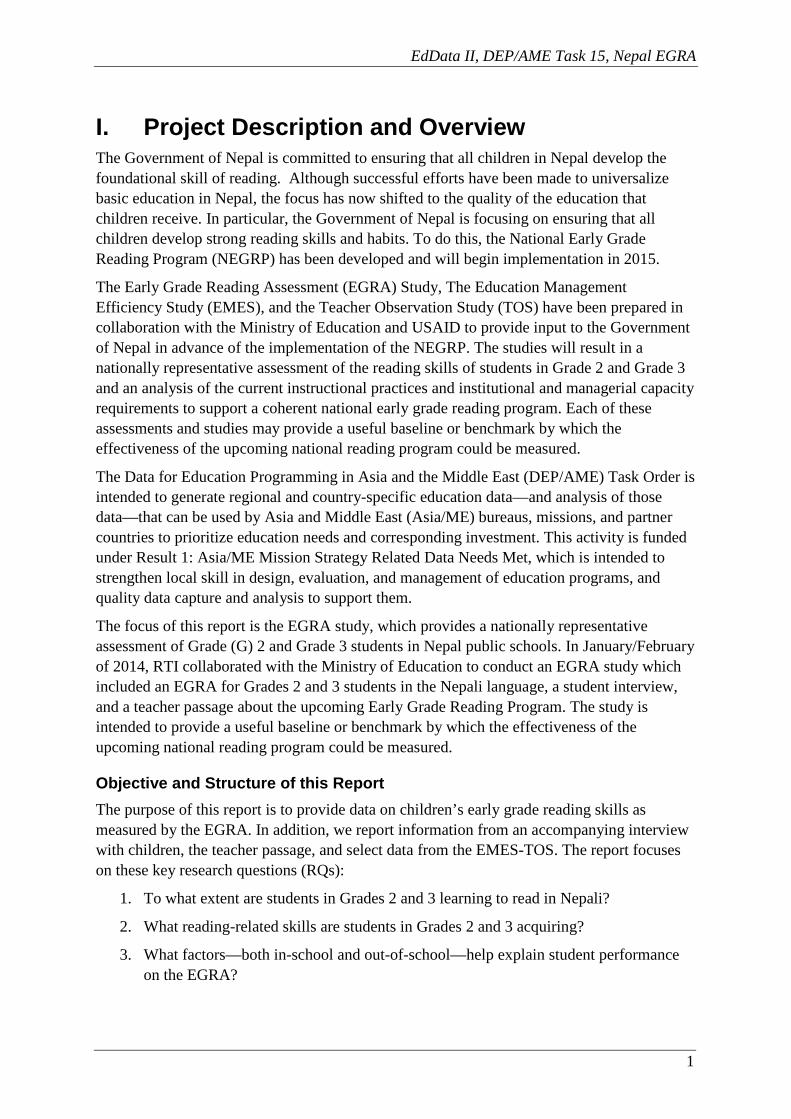
I. Project Description and Overview The Government of Nepal is committed to ensuring that all children in Nepal develop the foundational skill of reading. Although successful efforts have been made to universalize basic education in Nepal, the focus has now shifted to the quality of the education that children receive. In particular, the Government of Nepal is focusing on ensuring that all children develop strong reading skills and habits. To do this, the National Early Grade Reading Program (NEGRP) has been developed and will begin implementation in 2015.
The Early Grade Reading Assessment (EGRA) Study, The Education Management Efficiency Study (EMES), and the Teacher Observation Study (TOS) have been prepared in collaboration with the Ministry of Education and USAID to provide input to the Government of Nepal in advance of the implementation of the NEGRP. The studies will result in a nationally representative assessment of the reading skills of students in Grade 2 and Grade 3 and an analysis of the current instructional practices and institutional and managerial capacity requirements to support a coherent national early grade reading program. Each of these assessments and studies may provide a useful baseline or benchmark by which the effectiveness of the upcoming national reading program could be measured.
The Data for Education Programming in Asia and the Middle East (DEP/AME) Task Order is intended to generate regional and country-specific education data—and analysis of those data—that can be used by Asia and Middle East (Asia/ME) bureaus, missions, and partner countries to prioritize education needs and corresponding investment. This activity is funded under Result 1: Asia/ME Mission Strategy Related Data Needs Met, which is intended to strengthen local skill in design, evaluation, and management of education programs, and quality data capture and analysis to support them.
The focus of this report is the EGRA study, which provides a nationally representative assessment of Grade (G) 2 and Grade 3 students in Nepal public schools. In January/February of 2014, RTI collaborated with the Ministry of Education to conduct an EGRA study which included an EGRA for Grades 2 and 3 students in the Nepali language, a student interview, and a teacher passage about the upcoming Early Grade Reading Program. The study is intended to provide a useful baseline or benchmark by which the effectiveness of the upcoming national reading program could be measured.
Objective and Structure of this Report The purpose of this report is to provide data on children’s early grade reading skills as measured by the EGRA. In addition, we report information from an accompanying interview with children, the teacher passage, and select data from the EMES-TOS. The report focuses on these key research questions (RQs):
1. To what extent are students in Grades 2 and 3 learning to read in Nepali?
2. What reading-related skills are students in Grades 2 and 3 acquiring?
3. What factors—both in-school and out-of-school—help explain student performance on the EGRA?

EdData II, DEP/AME Task 15, Nepal EGRA
2
4. How well do teachers understand a written explanation of a proposed Early Grade Reading Program?
This analysis is guided through the prism of the core research questions that were developed and agreed upon in consultation with the Ministry of Education (MOE) and its stakeholders. This report presents data that address each of the research questions and draws conclusions based on those data. The report also identifies additional areas for further research or exploration that could be useful for decision makers.
To get started, results from the first research questions are presented, providing an overview of the core findings from the EGRA. A brief description of the EGRA and the survey administration follows, as well as some descriptive characteristics of the study. After this, an in-depth analysis for each of the remaining three key research questions is presented. The report finishes with conclusions and recommendations.
II. Overview of Findings from the EGRA Study EGRA uses research-based measures of oral reading fluency (ORF), such as accuracy, speed, and comprehension. Other subtests, as outlined below, measure underlying skills leading to fluency—phonemic awareness, decoding, listening comprehension—and can be useful for understanding more specifically what children can and cannot do, and thus explaining reading and comprehension outcomes. The findings from these subtests are covered in more detail in Section IV of this report. This section provides a quick overview of the two subtests (oral reading fluency and reading comprehension) that show whether students can read automatically enough to understand a short passage of text and thus provides a response to the first research question, namely:
RQ1: To what extent are students in Grades 2 and 3 learning to read in Nepali? Being able to read means a child can process connected text (essentially a short story) and not just recognize or read words in isolation. To measure how well children are reading, we rely on the measure of how fluently (or easily) they read a short passage and how well they comprehend what they read. The reading fluency subtest is timed; children read as much as they can in 60 seconds, and then are asked to stop and answer questions corresponding only to how much of the passage they completed. The oral reading fluency is the number of words they correctly read in those 60 seconds. Table 1 below displays the mean oral reading fluency and percentage of students with zero scores in Grades 2 and 3. We include zero scores because they indicate the proportion of students who could not read any of the passage correctly, which is usually indicative of either a lack of sufficient foundational literacy skills, problems processing the language of the test, or in some cases students flummoxed by the process of being tested in a manner that is completely unfamiliar to them. The mean oral reading fluency for Grade 2 was 14.2 correct words per minute (cwpm), and for Grade 3 it was 27.2 cwpm. There were significant portions of the students in both grades that were unable to read a single word correctly in the passage, thus obtaining a zero score: 37% of Grade 2 students and 19% in Grade 3.

EdData II, DEP/AME Task 15, Nepal EGRA
3
Table 1: Mean Oral Reading Fluency and Percent Zero Scores in Grades 2 and 3
Grade 2 Grade 3
Mean Standard
Error % Zero Mean Standard
Error % Zero
ORF (correct words per min of text) 14.2 1.0 37% 27.2 1.4 19%
In addition to the reading passage, students were asked up to six comprehension questions. The number of questions was determined by how far students read in the passage. Figure 1 below shows the distribution of students in Grades 1 and 2 according to the number of questions they responded to correctly. We can see that in Grade 2, half the students could not answer any questions correctly, either because they were unable to read the passage or because no matter how much text they read, they did not comprehend it enough to answer the questions. For Grade 3 students, the percentage not able to answer any questions was much lower, about 27%. And the proportions of those in Grade 3 able to answer 4, 5, or 6 questions were much higher than in Grade 2.
Figure 1: Reading Comprehension Scores Looking at the relationship between reading comprehension and oral reading fluency provides further insight into the extent to which students in Grades 2 and 3 are actually learning to read. Figures 2 and 3 display the range of oral reading fluency scores for students with different levels of comprehension in Grades 2 and 3 respectively. For each number of correct responses we see the range of reading
fluency scores, with the median indicated by the thick horizontal bar. For example, students who answered no questions correctly (0 on the horizontal axis) had oral reading fluency scores ranging from zero up to around 40 cwpm, with one outlier at about 50 cwpm. However the median score was just above zero. This means that half the students were not able to answer any questions because they could not read any of the passage. Another portion could read some of the story, but still had no comprehension.
0%10%20%30%40%50%60%70%80%90%
100%
0 1 2 3 4 5 6
% o
f stu
dent
s
Number of correct questions
Grade 2
Grade 3

EdData II, DEP/AME Task 15, Nepal EGRA
4
Figure 2: Mean Oral Reading Fluency and Reading Comprehension Scores, Grade 2
For students answering 5 questions correctly, we see that oral reading fluency scores ranged from about 35 to 75 cwpm, with the median falling at about 50 cwpm.
A similar pattern is evident for Grade 3 students, shown in Figure 3 below. As you move from left to right on the horizontal axis, the ranges and mean/median oral reading fluency scores increase. This is in part an artifact of the way the assessment is structured. As mentioned above, students have to read to a certain point in the passage to get asked each subsequent question. The underlying relationship between reading fluency and comprehension is also what explains the pattern evident in these two figures.
Figure 3: Mean Oral Reading Fluency and Reading Comprehension Scores, Grade 3
0
15
30
45
60
75
90
105
120
135O
ral R
eadi
ng F
luen
cy
0 1 2 3 4 5 6
Reading Comprehension Score
0
15
30
45
60
75
90
105
120
135
Ora
l Rea
ding
Flu
ency
0 1 2 3 4 5 6
Reading Comprehension Score
EdData II, DEP/AME Task 15, Nepal EGRA
5
Students have to read fluently enough to be able to easily process and recall the information in the text. We see from the Grade 3 data that to comprehend most of the text (say getting at least 5 out of 6 of the questions correct), students had to be reading above 30 or 35 cwpm, with most students who achieved at least 80% comprehension reading around 60 words per minute (in Grade 3) and 55 words per minute (in Grade 2). What we see is that the mean oral reading fluency scores for Grades 2 and 3 (14 and 27 cwpm) were well below the levels commensurate with full comprehension. And we see that in Grade 3 only about 30% of students were reaching the levels of oral reading fluency commensurate with full comprehension.
Average Scores by Region and Ecobelt
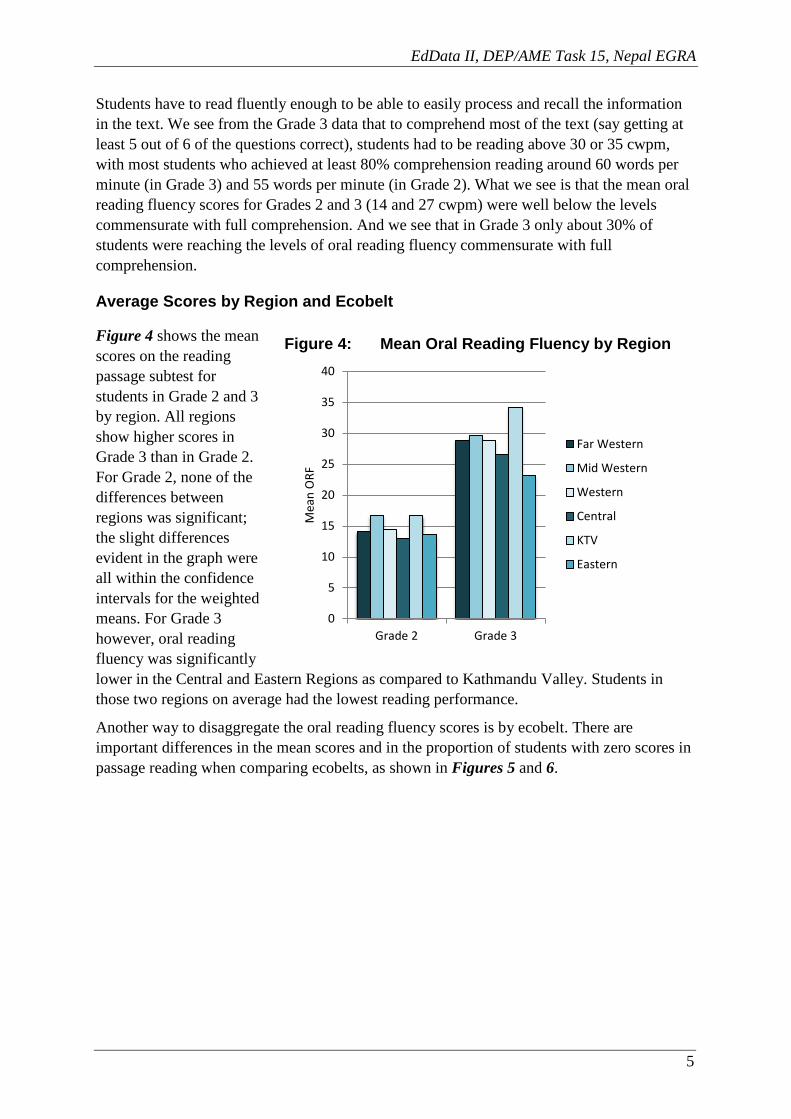
Figure 4 shows the mean scores on the reading passage subtest for students in Grade 2 and 3 by region. All regions show higher scores in Grade 3 than in Grade 2. For Grade 2, none of the differences between regions was significant; the slight differences evident in the graph were all within the confidence intervals for the weighted means. For Grade 3 however, oral reading fluency was significantly lower in the Central and Eastern Regions as compared to Kathmandu Valley. Students in those two regions on average had the lowest reading performance.
Another way to disaggregate the oral reading fluency scores is by ecobelt. There are important differences in the mean scores and in the proportion of students with zero scores in passage reading when comparing ecobelts, as shown in Figures 5 and 6.
Figure 4: Mean Oral Reading Fluency by Region
0
5
10
15
20
25
30
35
40
Grade 2 Grade 3
Mea
n O
RF
Far Western
Mid Western
Western
Central
KTV
Eastern

EdData II, DEP/AME Task 15, Nepal EGRA
6
Figure 5: Mean Oral Reading Fluency Scores by Grade and Ecobelt
Mean reading fluency in Terai was much lower than in the other ecobelts for both Grades 2 and 3. Students in the Terai were on average reading 9 cwpm fewer than their peers in the Mountain region in Grade 2 and 12 cwpm fewer than students in the Kathmandu Valley in Grade 3.
Similarly, in Grade 3 in Terai the proportion of students who scored zero was statistically significantly higher than the proportions scoring zero in the other ecobelts. This was not the case in Grade 2, where the differences in zero scores across ecobelts were less pronounced. This would seem to indicate that students in other ecobelts saw greater improvement between
Grade 2 and 3 than those in Terai. In fact, the mean number of words Grade 3 students in the Terai ecobelt read correctly (22.5) was only slightly higher than the mean reading fluency of students in Grade 2 (20.5) in the Mountain ecobelt. The percentage of zero scores in the Mountain ecobelt in Grade 2 (26%) was about the same as the percentage of Grade 3 students who scored zero in the Terai ecobelt (24%).
Average Scores by Gender Differences between genders on the story reading and comprehension were not significant. The mean oral reading fluency for girls was 20.9 words per minutes. The mean oral reading fluency for boys was 20.3 words per minute. Girls and boys performed equally well, with
0
5
10
15
20
25
30
35
40
Grade 2 Grade 3
Ora
l Rea
ding
Flu
ency
Mountain
Hill
Terai
KTV
Figure 6: Zero Scores on Oral Reading Fluency by Grade and Ecobelt
0%10%20%30%40%50%60%70%80%90%
100%
Grade 2 Grade 3
% o
f stu
dent
s w
ith z
ero
scor
es
Mountain
Hill
Terai
KTV

EdData II, DEP/AME Task 15, Nepal EGRA
7
average scores on all subtasks showing no statistically significant difference. The only exception to this were zero scores on the letter sound subtask in grade 2, where zero scores for girls (10%) were higher than for boys (6%). In light of these results, we do not report disaggregated data by gender.
Conclusion Regarding Research Question 1 By Grade 3, most students were demonstrating basic reading skills. However 19% of third graders still could not read a single word of a short passage. For Grade 2, a much larger share was not reading: 37%.
Average reading fluency in Grade 3 was much higher than in Grade 2, indicating that a year in school is associated with an increase in reading skill. However, the level of reading ability being attained by the majority of Grade 3 students was still at an emergent level, with more than 50% not able to understand even half of what they are reading (i.e., answering fewer than 3 out of 6 questions correctly). Ideally, students would achieve in Grade 1 the reading levels currently seen in Grade 3.
Boys and girls performed at about the same level, but students living in different parts of the country did not achieve the same levels. In particular, the Terai ecobelt had the lowest mean scores and the highest zero scores compared to all other ecobelts. Possible reasons for this are explored in Section IV. In that section we examine how factors relate such as family socio-economic status and language spoken at home relate to student performance. We also look at the relationship between school characteristics (school management, the availability of materials, instructional practice) and student performance in reading.
III. Overview of EGRA and Administration Why Test Early Grade Reading? The ability to read and understand connected text is one of the most fundamental skills a child can learn. Without basic literacy there is little chance that a child can escape the intergenerational cycle of poverty. Furthermore, evidence indicates it is important to learn to read both early and at a sufficient rate. A substantial body of research documents the fact that students can learn to read by the end of Grade 2, and indeed need to be able to read by the end of Grade 2 to be successful in school. Students who do not learn to read in the early grades (Grades 1–3) are likely to fall behind in reading and other subjects, repeat grades, and eventually drop out of school.
When students are first learning to read, they must learn the letters of a language and the forms of those letters, learn the sounds associated with each letter, and apply this knowledge to decode (or “sound out”) new words. At the same time, they are gaining familiarity, or automaticity, with words that they can then read by sight, without having to decode them. By the end of this first phase of reading development, students on a normal development trajectory develop sufficient speed and accuracy in decoding and word recognition to be able to read connected text easily enough to allow focus to shift from identifying individual words to comprehending the meaning of words, phrases, sentences, and eventually passages. As students are able to read text faster and with greater ease, they begin to read orally with speed and expression similar to their speech.
EdData II, DEP/AME Task 15, Nepal EGRA
8
Purpose and Uses of EGRA: Evidence regarding students’ learning performance in primary school, when available, indicates that average student learning in most low-income countries is quite low. A recent evaluation of World Bank education lending showed that improvements in student learning lag significantly behind improvements in access to schooling, while results from those few low-income countries that participate in international assessments such as PISA or TIMSS (and inferring from the results of regional assessments such as PASEC and SACMEQ)1 indicate that the median child in a low-income country performs at about the third percentile of a high-income country distribution (i.e., worse than 97% of students who were tested in the high-income country). From these results, one can tell what low-income country students do not know, but cannot ascertain what they do know (often because they scored so poorly that the test could not pinpoint their location on the knowledge continuum). Furthermore, because most national and international assessments are paper-and-pencil tests (that is, they assume students can read and write), it is not always possible to tell from the results of these tests whether students score poorly because they lack the knowledge tested by the assessments, or because they lack basic reading and comprehension skills.2
In the context of these questions about student learning and continued investment in education for all, EGRA was developed to report on the foundation levels of student learning, including assessment of the first steps students take in learning to read: recognizing letters of the alphabet, reading simple words, and understanding sentences and paragraphs. A simple instrument that can be adapted for use in low-income countries and for any language, EGRA systematically measures how well students in the early grades of primary school are acquiring reading skills, in order to spur more effective efforts to improve performance in these core learning skills.3
Because they focus directly on the foundational and teachable skills required for reading, the results of an assessment such as EGRA can be used to inform ministries of education, donors, teachers, and parents about primary students’ reading skills as well as to assist education systems in setting standards and planning curricula to best meet students’ needs in learning to read.
What EGRA Measures: The EGRA instrument is composed of a variety of subtasks designed to assess foundational reading skills that are crucial to becoming a fluent reader. EGRA is designed to be a method-independent approach to assessment—that is, the instrument does not reflect a particular method of reading instruction (e.g., “whole language” or “phonics-based”). Rather, EGRA measures basic skills that a child must have to eventually be able to read fluently and with comprehension—the ultimate goal of reading. The EGRA subtasks are based on research for a comprehensive approach to reading acquisition across languages. The EGRA subtasks included in the Nepal instrument are described in the
1 Organisation for Economic Co-Operation and Development’s Programme for International Student Assessment (PISA); Trends in International Mathematics and Science Study (TIMSS); Programme d’Analyse des Systèmes Educatifs de la Confemen (PASEC); Southern Africa Consortium for the Measurement of Educational Quality (SACMEQ). 2 RTI International. (2009). Early Grade Reading Assessment Toolkit, 2009. Prepared for the World Bank, Office of Human Development. p. 1. Available at: https://www.eddataglobal.org/documents/index.cfm?fuseaction=pubDetail&id=149 3 RTI 2009. Available at: https://www.eddataglobal.org/documents/index.cfm?fuseaction=pubDetail&id=149

EdData II, DEP/AME Task 15, Nepal EGRA
9
following section of this report, and full copies of EGRA and corresponding instruments can be found in Annex D of this report. 4
EGRA Adaptation and Administration: The following five EGRA subtasks (all in Nepali language) were administered.
• Listening comprehension is considered to be a critical skill for reading comprehension because it shows the ability to make sense of oral language. In this subtask, the examiner read a short passage to the students. Students were then orally asked three questions about that passage. The listening comprehension score was the total correct answers, with a maximum possible score of 3.
• Letter knowledge assessed students’ automaticity in letter recognition. In Nepali, the names of most letters are the same as their sounds, though there are some exceptions. This was a timed subtask, in which students were shown a chart containing 10 rows of 10 random letters. Students were asked to name as many letters as they could within one minute, yielding a score of correct letters per minute (clpm).
• Matra knowledge assessed students’ automaticity in their knowledge of the matras (or syllables). This was a timed subtask in which students were shown a chart containing 10 rows each with 10 matras arranged randomly, yielding a total of 100 matras. Students were asked to produce the sounds associated with each matra as quickly and accurately as they could within one minute, yielding a score of correct matras per minute (cmpm).
• Nonword decoding assessed students’ skill at applying letter-sound correspondence rules to decode (i.e., sound out) unfamiliar words. To ensure that students were applying their knowledge of the relationships between sounds and symbols rather than reading words from memory, a chart of 50 pronounceable nonwords—words that followed legal spelling patterns in Nepali but had no meaning in the language—was shown to students. Students were asked to sound out as many nonwords as they could within one minute, yielding a score of cwpm.
• Oral passage reading assessed students’ fluency in reading a passage of grade-level text aloud and their ability to understand what they had read. This subtask consisted of two parts: − Oral reading fluency: The ability to read passages fluently is considered a
necessary component for reading comprehension. In this subtask, students were given a 61-word story and were asked to read it aloud in one minute. The oral reading fluency score for each story was the number of cwpm.
− Reading comprehension: After students read as much of an assigned passage as they could within one minute, those who were able to read at least one word correctly were asked to respond to orally presented questions that corresponded to the parts of the story that were read. Because the number of words read in the minute varied by student, so did the number of questions given. Questions were both literal, requiring students to directly recall information from the story, and
4 Additional EGRA subtasks not used in this project include measures of phonological processing ability, print awareness, and vocabulary. A description of all available EGRA subtasks can be found in the EGRA Toolkit, available at: https://www.eddataglobal.org/documents/index.cfm?fuseaction=pubDetail&id=149

EdData II, DEP/AME Task 15, Nepal EGRA
10
inferential, requiring students to combine information from the story with their background knowledge to derive a correct answer. Students’ reading comprehension scores were recorded as the number of correct responses provided. The reading comprehension score was the number of correct answers, with a maximum possible score of 6.
Administering the full EGRA instrument required approximately 15 minutes per student. The reading assessment was supplemented by a student questionnaire to capture the demographic and social context in which students were learning to read.
The EGRA administration was designed to make students feel comfortable during the assessment. Before administering EGRA, administrators read explicit information about the test to the students to explain how it would be used and that it would not impact their grades. Also, students were asked to provide verbal assent to participate in the assessment before it began. In addition, EGRA administration included an “early stop” rule, which required assessors to discontinue the administration of a subtask if a child was unable to respond correctly to any of the items in the first line of a subtask (e.g., the first 10 letters, the first five words, or the first line of the oral reading fluency story). This rule was established to avoid frustrating students who did not understand the subtask or lacked the skills to respond. If a subtask needed to be discontinued, the EGRA administrator marked a box indicating that the subtask was discontinued because the child had no correct answers in the first line.
Teacher Passage: A teacher passage that described the proposed Early Grade Reading Program was developed at the adaptation workshop. After reading the passage, teachers were asked to answer multiple choice questions about the passage. The results of this survey will show how well teachers understand the objectives of a national Early Grade Reading Program as well as shed some light on how well teachers are able to read and understand Nepali text targeted to a secondary level.
EGRA Adaptation Workshop: A workshop to adapt the EGRA instrument, the student interview, and an instrument for teachers was held January 21–22, 2014, in Kathmandu, Nepal. Representatives from the MOE, Department of Education, Curriculum Development Center, National Center for Education Development, and National Assessment of Student Achievement as well as international nongovernmental organizations attended the workshop. See Annex A for a complete list of attendees. Over the course of the three days, attendees developed and agreed upon the subtasks of the EGRA instrument, adapted the student interview, and created the teacher instrument. Included was a half-day of field testing at a local school.
EGRA Assessor Training: Assessor training for baseline data collection occurred January 26 to 30, 2014, in Kathmandu, Nepal. A total of 72 assessors and supervisors were trained; most assessors were experienced trainers contracted by New Era and had significant survey experience. A representative from MOE attended the beginning of the training and spoke to assessors about their role in the upcoming Early Grade Reading Program.
EGRA Sampling: We drew a sample of 269 schools and over 5,000 students (split roughly equally between Grades 2 and 3) using a four-stage process to ensure representation across regions and ecobelts. The sampling process is described in Annex B. A breakdown of schools and students by ecobelt and region is shown on the maps below in Figure 9.

EdData II, DEP/AME Task 15, Nepal EGRA
11
EGRA Data Collection: The local nongovernmental organization, New Era, was contracted to manage the field data collection, which was carried out in each of the 33 selected districts from February 10 to March 31, 2014. Two assessors were sent to each district, with five supervisors roaming between the districts and performing quality checks. Use of the tablet devices and Tangerine software enabled RTI statisticians to monitor data collection throughout the field operations, controlling for quality and consistency. The use of electronic data collection eliminated the need for separate data entry and increased data accuracy.
EGRA Dissemination Seminar: A seminar was held on June 18, 2014, in Kathmandu, Nepal, to present the results of the EGRA study. The seminar was attended by MOE officials, representatives from the corresponding Central Line Agencies, donors, and international nongovernmental organizations. See Annex E for a full list of participants.
Descriptive Statistics from EGRA
Table 2 displays the characteristics of the 5,083 student sample.
Figure 7 shows the ages of children in Grades 2 and 3 (as reported by the children themselves). The majority of children were older than the average age expected in these grades; 63% of Grade 2 students were 8 years old or older and 69% of Grade 3 students were 9 years old or older.
Students were also asked what language they speak most often at home; 52% of students in Grade 2 reported speaking Nepali at home, with 45% reporting that they spoke a local language at home. For Grade 3, 51% reported speaking Nepali, and 47% a local language. Figure 8 shows the breakdown of reported languages spoken at home by ecobelt.
Table 2: Sample by Gender
G 2 G 3 Total
Girls 1,271 1,352 2,623
Boys 1,299 1,161 2,460
Total 2,570 2, 513 5,083
Figure 7: Student Age
0%
20%
40%
60%
80%
100%
5 6 7 8 9 10 Don’t know
% o
f stu
dent
s
Age
Grade 2
Grade 3

EdData II, DEP/AME Task 15, Nepal EGRA
12
The majority of students in the Terai ecobelt (70%) reported speaking a language other than Nepali at home. In fact, this percentage is almost equal to the percentage of students that reported speaking Nepali in the Mountain (66%), Hill (73%), and Kathmandu Valley (64%) ecobelts. Only 27% of students in the Terai ecobelt reported speaking Nepali at home.
The maps in Figure 9 display the districts and show the number of schools that were included in the sample according to region and ecobelt.
Figure 9: Ecobelts and Regions and Numbers of Schools
Figure 8: Student Language by Ecobelt
0%
20%
40%
60%
80%
100%
Nepali Local Language
% o
f stu
dent
s
Mountain
Hill
Terai
KTV

EdData II, DEP/AME Task 15, Nepal EGRA
13
IV. Findings for the Remaining Key Research Questions
RQ 2: What reading-related skills are students in Grades 2 and 3 acquiring? In this section, we look across all subtasks to understand how students are performing on the skills considered essential to learning how to read. Table 3 below contains the mean scores for each subtask, the standard error associated with the mean, and the percentage of students scoring zero across all subtasks for Grades 2 and 3.
Table 3: Summary of Reading Performance on All Subtasks
Grade 2 Grade 3
Mean Standard
Error % Zero Mean Standard
Error % Zero
Letter sound knowledge
(correct letters/min) 28.6 1.0 8% 39.9 1.1 4%
Matra reading
(correct matras/min in isolation) 15.8 1.1 31% 27.9 1.4 16%
Nonword reading
(correct words/min in isolation) 6.6 0.5 34% 11.7 0.6 19%
ORF
(correct words/min of text) 14.2 1.0 37% 27.2 1.4 19%
Oral reading comprehension
(# correct out of 6 questions) 1.3 0.1 50% 2.4 0.1 27%
Listening comprehension
(# correct out of 3 questions) 1.8 0.1 11% 2.0 0.0 6%

EdData II, DEP/AME Task 15, Nepal EGRA
14
On all subtasks, mean scores were significantly higher in Grade 3 than in Grade 2. In addition, the percentage of students who scored zero on a task, either because they did not answer a signal item correct or because they did not attempt a single item, were significantly lower in Grade 3 compared to Grade 2.
However, despite the higher scores in Grade 3, the results showed a generally high percentage of students scoring zero across almost all the tasks and grades, with the exceptions of letter sound knowledge and listening comprehension. While the mean score on letter sound knowledge was reasonable in Grade 2, many students in Grade 2 appeared to lack other important building block skills, such as matra reading (31% scored zero) and nonword reading (decoding), on which 34% scored zero. A much lower percentage of Grade 3 students had zero scores on these important subtasks.
Distributions of Scores on Timed Subtasks In order to understand more about the character of students’ performance across the subtasks, the distributions are shown below. Included is a more detailed explanation of the results on each subtask, for both Grades 2 and 3.
Letter sounds. In this subtask, students were presented with a 10 x 10 grid of 100 Nepali letters. Students were asked to identify the letter sound. In Nepali, most of the letters have the same sound and name. If a student skipped a letter, or incorrectly identified the sound, the item was marked wrong. After one minute, students were asked to stop, and a score was calculated based on how many correct letters they identified per minute (clpm).
The first bar in Figures 10 and 11 below show the percentages of children according to how many letters were identified correctly. In Grade 2, 8% of students scored zero, identifying no letters correctly. In Grade 3, 4% of students scored zero. Most of second graders correctly identified 40 or fewer letters per minute, and the majority of Grade 3 students correctly identified 60 or fewer letters per minute. We would expect, certainly by Grade 2 and in fact even earlier, that all students could identify letter sounds with fluency and accuracy, as this skill is essential to becoming a fluent reading. If letter sound correspondence were being taught well from the beginning of primary school (in pre-school and Grade 1), then we would expect this skill to be much more automatic by Grade 2 and 3, and these distributions would then include much greater shares of students in the upper ranges of performance (e.g., more than 60 letter sounds per minute).

EdData II, DEP/AME Task 15, Nepal EGRA
15
Figure 10: Distribution of the Timed Subtasks for Grade 2
Figure 11: Distribution of the Timed Subtasks for Grade 3
Matras. In this subtask, students were presented with a grid of 100 matras, which are combinations of two letters, a consonant and a vowel. When certain combinations of letters are put together, they form new characters that are called matras. Each row of the grid had 10 matras. Students were asked to identify the matra by correctly pronouncing the sound associated with it. If a student skipped a matra, or incorrectly identified the matra, the item was marked wrong. After one minute, students were asked to stop, and a score was calculated based on how many correct matras they identified per minute (cmpm).
On this subtask, 31% of second graders and 16% of third grades scored zero, which means that these students were either unable to attempt the subtask, or they identified all the matras attempted incorrectly. Most second graders correctly identified 20 or fewer matras per minute; for third graders, most identified 40 or fewer. As identifying matras is a core skill in learning how to read new words in Nepali, it is expected that all students in Grade 3 should be able to identify matras fluently. Correctly pronouncing matras at a rate of 60 per minute would equate to one per second, which seems like a reasonable baseline for a fully automatic skill, meaning we would expect students to score at that level or higher if they were demonstrating fluency in this ability.
0%
20%
40%
60%
80%
100%
% o
f stu
dent
s Letter Sounds Matras Non-words ORF
0%
20%
40%
60%
80%
100%
% o
f stu
dent
s
Letter Sounds Matras Non-words ORF
EdData II, DEP/AME Task 15, Nepal EGRA
16
Nonwords. In this subtask, students were presented with a grid of 50 nonwords, which are words that follow the rules of the language but do not mean anything. The nonwords subtask targets the key skill of “decoding”, or using what you know about letter sounds and matras to sound out unfamiliar words. Each row of the grid had 5 nonwords. Students were asked to read the words. If a student skipped a nonword, or incorrectly identified the nonword, the item was marked wrong. After one minute, students were asked to stop, and a score was calculated based on how many correct nonwords they identified per minute (cnwpm).
Nonwords was the most difficult subtask for students in both grades; 34% of second graders and 19% of third grades scored zero, which means that these students were either unable to attempt the subtask, or they identified all the nonwords attempted incorrectly. Majorities of students in both grades read from 1 to 20 nonwords correctly per minute. Decoding is a core skill needed in order to read the new and unfamiliar words students will encounter when reading increasingly complex texts. For this reason, the nonwords subtask shows whether students can quickly sound-out (decode) words they have never encountered, The distributions above show that only 8% of Grade 2 and 20% of Grade 3 students were reaching rates of decoding that could be considered automatic (20–40 cnwpm)
Oral reading fluency. In order to become competent readers, students must be able to read with both speed and accuracy, which we call fluency. Fluency is essential for children to comprehend what they are reading. When children read too slowly, or with frequent mistakes, their cognitive resources are concentrated on the actual reading (i.e., trying to read the words), and they then cannot concentrate on making meaning from the passage as a whole.
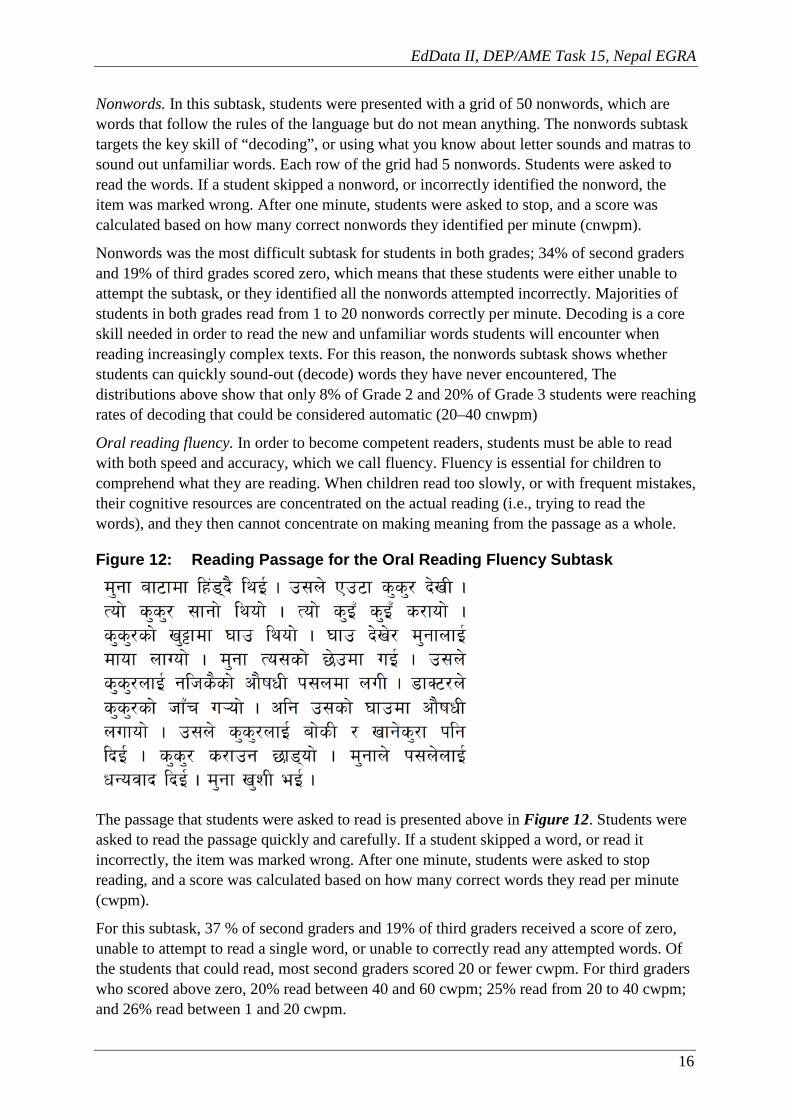
Figure 12: Reading Passage for the Oral Reading Fluency Subtask
The passage that students were asked to read is presented above in Figure 12. Students were asked to read the passage quickly and carefully. If a student skipped a word, or read it incorrectly, the item was marked wrong. After one minute, students were asked to stop reading, and a score was calculated based on how many correct words they read per minute (cwpm).
For this subtask, 37 % of second graders and 19% of third graders received a score of zero, unable to attempt to read a single word, or unable to correctly read any attempted words. Of the students that could read, most second graders scored 20 or fewer cwpm. For third graders who scored above zero, 20% read between 40 and 60 cwpm; 25% read from 20 to 40 cwpm; and 26% read between 1 and 20 cwpm.

EdData II, DEP/AME Task 15, Nepal EGRA
17
Distributions of Scores on Untimed Subtasks Below are the distributions for the untimed subtasks, reading comprehension and listening comprehension.
Reading comprehension. Reading comprehension questions were asked directly after the child finished reading the story passage. Four questions were literal, or text-based, where the answer was explicitly stated in the text. Two questions were inferential, where the answers were implied, and the student had to use what he or she knew about the passage to answer the question. For reading comprehension, recall that students were only asked questions according to how many words they read in the
reading passage. Table 4 lists the number of words students needed to read in order to trigger the question. If a child read 26 words, for example, he or she would be asked questions 1, 2, and 3.
Figure 1 in Section I displays the percentage of students that answered 0, 1, 2, 3, 4, 5, or 6 questions correctly. As noted, very few children answered 5 or 6 questions correctly. However, this may be because they either attempted all 6 but answered incorrectly, or they did not read far enough in the passage to trigger the questions. Because all students did not receive all the questions, it is important to understand how many questions students answered correctly of the ones they attempted. Further analysis as depicted below shows the percent of questions answered correctly in relation to the number of questions attempted.
Each row in the table corresponds to the number of questions attempted, and each column shows the percentage of students who got that number of responses correct. For example, we see that for Grade 2 students who only read to the point in the text that corresponded to the first question, 72% got it wrong and 28% answered it correctly. Of those who read far enough to attempt all six questions, 49% got them all right, 22% got 5 out of 6, 12% got 4 out of 6, and the
remainder got half or fewer right. The blue or dark background illustrates better performance (i.e., more than half the questions correctly answered), while the white background represents poorer performance (half or fewer correct). We see that beginning at the point where students attempted three questions, the majority of students got most of the questions correct. This reinforces the important underlying relationship between reading fluency and comprehension. Table 6 provides the same data for Grade 3 students.
Table 4: Word and Question Correspondence
Word number Question number 7 1 11 2 24 3 33 4 54 5 60 6
Table 5: Grade 2 Analysis of Correct Responses to Attempted Questions
Grade 2
# Attempted
# Correct 0 1 2 3 4 5 6
0 1 72% 28% 2 34% 29% 37% 3 12% 20% 34% 35% 4 3% 6% 9% 23% 59% 5 1% 0% 9% 12% 29% 51% 6 1% 0% 1% 16% 12% 22% 49%

EdData II, DEP/AME Task 15, Nepal EGRA
18
The pattern for Grade 3 is consistent with what was seen for Grade 2, with majorities of students answering more than half the questions correctly provided they read far enough to attempt at least three questions.
Listening comprehension. The listening comprehension subtask is included in the EGRA as it measures students’ oral language proficiency. In order to read fluently with comprehension, students need to be able to
comprehend the language they are reading in. In this subtask, the assessor read a short story aloud to the child, and then asked all children three questions about the story. Two questions were literal, and one question was inferential. Figure 13 lists the number of questions students answered correctly, out of three possible questions.
Figure 13: Listening Comprehension Scores
For this subtask, 11% of second graders and 6% of third graders received a score of zero, meaning they were either unable to answer a single question, or they attempted to answer questions but were incorrect. The percentage of children answering 1, 2, or 3 questions correctly varied; 29% of second graders answered all questions correctly, and for third grade, the percentage was higher, at 38%, but still short of a majority. Since the listening comprehension test used a short passage with very familiar vocabulary—words that Grades 2 and 3 students should be hearing and using regularly—it is a concern that not more students could answer all the questions correctly. If students were not at all accustomed to being asked to respond to questions regarding a passage of text they heard read aloud to them, or if the assessors read the text with an accent unfamiliar to the students, that could explain in part why less than half in both grades could answer all three questions.
0%
20%
40%
60%
80%
100%
0 1 2 3
% o
f stu
dent
s
Number of correct questions
Grade 2 Grade 3
Table 6: Grade 3 Analysis of Correct Responses to Attempted Questions
Grade 3
# Attempted
# Correct 0 1 2 3 4 5 6
0 1 72% 28% 2 25% 32% 43% 3 10% 15% 28% 47% 4 2% 4% 8% 21% 65% 5 0% 2% 7% 10% 33% 48% 6 0% 0% 2% 10% 19% 30% 39%

EdData II, DEP/AME Task 15, Nepal EGRA
19
Conclusion Regarding Research Question 2 Overall, by third grade, most students were developing some basic skills such as listening comprehension. As children spend additional time in classrooms where Nepali is the language of instruction, we should expect their skills in oral Nepali to improve. Another basic skill that we saw reasonable performance on was letter sounds. For both of these subtasks, scores increased between Grades 2 and 3. However, students in both grades were struggling with the matra and nonwords subtasks; with high zero scores and low mean scores in both grades. These skills, the knowledge of the sounds of the matras and the ability to decode unfamiliar words, are essential for students to become fluent readers. And evidence of low performance in these areas indicates that students were not receiving adequate instruction in these critical reading skills. Furthermore, the lack of mastery of these basic skills explains why oral reading fluency and comprehension scores were as low as they were. The majority of students were not reading Nepali fluently enough or with enough comprehension to ensure that they could read and understand content across the curriculum. A stronger foundation of basic reading skills should be in place by Grade 3.
RQ 3: What factors—both out-of-school and in-school—may explain student performance on the EGRA? This section presents results pertaining to factors that may explain student performance as described above. Scores are disaggregated by such out-of-school factors as ecobelt, student socioeconomic status, and student home language. In-school factors include a number of variables that relate to school management and governance and to in-school instructional practices.
Out-of-School Factors
Ecobelt As seen in section I, the differences in oral reading fluency and reading comprehension across ecobelts were significant, with students in the Terai ecobelt performing consistently lower. In this section, first, the results across all subtasks on the EGRA are presented by ecobelt. Second, mean scores on the reading passage are presented, both with and without zero scores in each ecobelt, in order to understand the character of reading levels among the children who were reading.
The tables below display the mean scores and % zeros across all subtasks by ecobelt. Table 7 displays scores for Grade 2. Table 8 presents scores for Grade 3.

EdData II, DEP/AME Task 15, Nepal EGRA
20
Table 7: Grade 2 Scores by Ecobelt
Mountain Hill Terai Kathmandu
Valley
Means
% Zero Means
% Zero Means
% Zero Means
% Zero
Letter sound knowledge
(correct letters/min) 36.0 5% 32.8 6% 24.5 12% 31.0 7%
Matra reading
(correct matras/min in isolation) 20.8 21% 18.5 24% 13.1 36% 16.1 28%
Nonword reading
(correct words/min in isolation) 8.5 26% 7.4 29% 5.9 39% 7.1 38%
ORF
(correct words/min of text) 20.5 26% 17.0 31% 11.5 42% 16.7 35%
Oral reading comprehension
(# correct out of 6 questions) 2.0 31% 1.6 42% 1.0 57% 1.6 42%
Listening comprehension
(# correct out of 3 questions) 1.8 7% 1.9 8% 1.7 16% 2.1 4%
Table 8: Grade 3 Scores by Ecobelt
Mountain Hill Terai Kathmandu
Valley
Means
% Zero Means
% Zero Means
% Zero Means
% Zero
Letter sound knowledge
(correct letters/min) 45.0 3% 45.5 2% 35.1 5% 45.2 2%
Matra reading
(correct matras/min in isolation) 33.2 14% 32.5 10% 23.6 20% 29.8 14%
Nonword reading
(correct words/min in isolation) 13.3 19% 12.5 15% 10.9 22% 12.6 21%
ORF
(correct words/min of text) 33.6 15% 32.4 12% 22.5 24% 34.5 15%
Oral reading comprehension
(# correct out of 6 questions) 3.0 17% 2.8 17% 1.9 36% 3.1 20%
Listening comprehension
(# correct out of 3 questions) 2.1 1% 2.3 2% 1.9 10% 2.2 2%
Grade 2 students in the Mountain ecobelt score higher in all the subtasks (except listening comprehension). However, for students in Grade 3, the Hill and Kathmandu Valley ecobelts scored about as high the Mountain ecobelt in letter sound knowledge, matra reading, nonword reading, and oral reading fluency.

EdData II, DEP/AME Task 15, Nepal EGRA
21
For almost all subtasks, the means and percentages of zero scores in the Terai ecobelt were significantly lower than those in the other ecobelts.5 This pattern is consistent in Grade 2 and 3. For example, the percentage of students who scored zero on listening comprehension in Terai in Grade 2 and 3 was much higher than in the other ecobelts. For Grade 2, 16% of students in the Terai ecobelt could not answer one listening comprehension question correctly, as compared to 4–8% in the other ecobelts. In Grade 3, 10% of students in the Terai ecobelt could not answer any questions, as compared to 1–2% in the other regions. This suggests that, for some students, home language was an important factor in the Terai, a factor that will be explored in more detail below.
It is important to look at how students who were reading were progressing in each ecobelt and grade. In order to do this, we remove the students who scored zero on the passage reading portion of the EGRA and recalculate the mean for students who scored above zero. Figure 14 shows the mean oral reading fluency scores by ecobelt presented alongside mean oral reading fluency scores without zero scores, first for Grade 2, then for Grade 3.
Figure 14: Oral Reading Fluency Means by Ecobelt, with and without Zero Scores
Grade 2 Grade 3
First, the mean scores on the passage reading when zero scores are taken out were much higher for all ecobelts in both Grades 2 and 3. For those students who could read at least one word correctly, the average oral reading fluency across the ecobelts in Grade 2 ranges from 20 (Terai) to 28 (Mountain) cwpm. In Grade 3, averages without zero sores in each ecobelt move up so that the range is from 30 to 41 cwpm. Students who could read in the Terai still had the lowest reading fluency scores in both grades. On average students who could read in KTV and Mountain ecobelts reached levels of fluency that were approaching, albeit still falling short of, what the data in Figures 2 and 3 indicate are commensurate with fuller comprehension of text.
5 with exceptions for zero scores on nonwords for Grades 2 and 3, and letter sounds for Grade 3
0
5
10
15
20
25
30
35
40
45
Mountain Hill Terai KTV
Mea
n O
RF
With zero scores Without zero scores
0
5
10
15
20
25
30
35
40
45
Mountain Hill Terai KTV
Mea
n O
RF
With zero scores Without zero scores
EdData II, DEP/AME Task 15, Nepal EGRA
22
However, in the Terai ecobelt, although the mean number of words read per minute increased without zero scores, the results were still lower than in the other ecobelts, and suggest that even in Grade 3, students who were reading were not doing it very well. The mean oral reading fluency for students in Grade 3 without zero scores in Terai was approximately the same as the mean oral reading fluency including zero scores in the Hill region. In Grade 2, the mean oral reading fluency without zero scores in Terai was close to the mean oral reading fluency with zero scores in all other ecobelts.
Socioeconomic Status (SES) Using data from interviews with each child after the EGRA instrument was administered; a composite index was created for relative socioeconomic status. We asked children about certain possessions they may or may not have at home, a methodology used in many countries as a proxy for comparing the relative wealth of households. The list of possessions about which students were asked was determined in consultation with Nepali researchers during the adaptation workshop. Principle component analysis was used to determine how possession of various objects within households varies and to understand which objects tend to cluster together (i.e., if a family owns a television, then the family likely has electricity). Principle component analysis tells us which of these possessions are most important in determining the overall scores for SES that would be associated with each student. The analysis revealed that a student’s answers regarding a television, a toilet, electricity, and a computer were the possessions that grouped together to determine relative socioeconomic status levels. Once each student was given a socioeconomic status score, the distribution of SES scores was then ranked and sub-divided into four relatively equal categories (quartiles) ranging from the lowest SES ranking to the highest. Note that these rankings are not absolute, but represent how the households of children compare to each other. Quartiles are ranked with the lowest first and the highest fourth. We then calculate the mean oral reading fluency for each socioeconomic status category of students. Figure 15 shows the mean oral reading fluency for Grades 2 and 3 students in each SES quartile.

EdData II, DEP/AME Task 15, Nepal EGRA
23
Figure 15: Reading Fluency by SES Quartile
Quartile 4 consistently had higher mean oral reading fluency scores than quartiles 1, 2, and 3. These differences are significant. In fact, the mean score for second graders in the fourth quartile (22.3) was just lower than the mean score for third graders in quartiles 1, 2, and 3. The widest gulf was between the highest (4) and the lowest (1) quartiles. Grade 2 students from households in quartile 4 on average had oral reading fluency scores that were 78% higher than quartile 1 students. For Grade 3, fourth quartile students on average had oral reading fluency scores 41% higher than the students in the first quartile. The lowest SES students were more disadvantaged in earlier grades, but the gap between them and the highest SES students diminished between second and third grade. However, students in the lowest SES quartile were still almost one full year/grade behind the highest SES students (the average oral reading fluency for quartile 1 in Grade 3 is only slightly higher than the average oral reading fluency for quartile 4 in Grade 2).
Language As reported above, students were asked what language they speak most often at home; 52% of Grade 2 students and 51% of Grade 3 students reported speaking Nepali at home. There were differences in ecobelts, with the highest share, 70% of students, in the Terai ecobelt reporting speaking a language other than Nepali at home. Table 9 below displays scores on the listening comprehension subtask according to reported home language. Listening comprehension is an important subtask to investigate as it assesses oral language fluency, one of the foundations for learning how to read.
12.5 14.6 15.1
22.3 25.6
28.4 26.9
36.1
0
5
10
15
20
25
30
35
40
1 2 3 4Socioeconomic Quartiles
Average ORF
G2 G3 G2 G3 G2 G3 G2 G3
EdData II, DEP/AME Task 15, Nepal EGRA
24
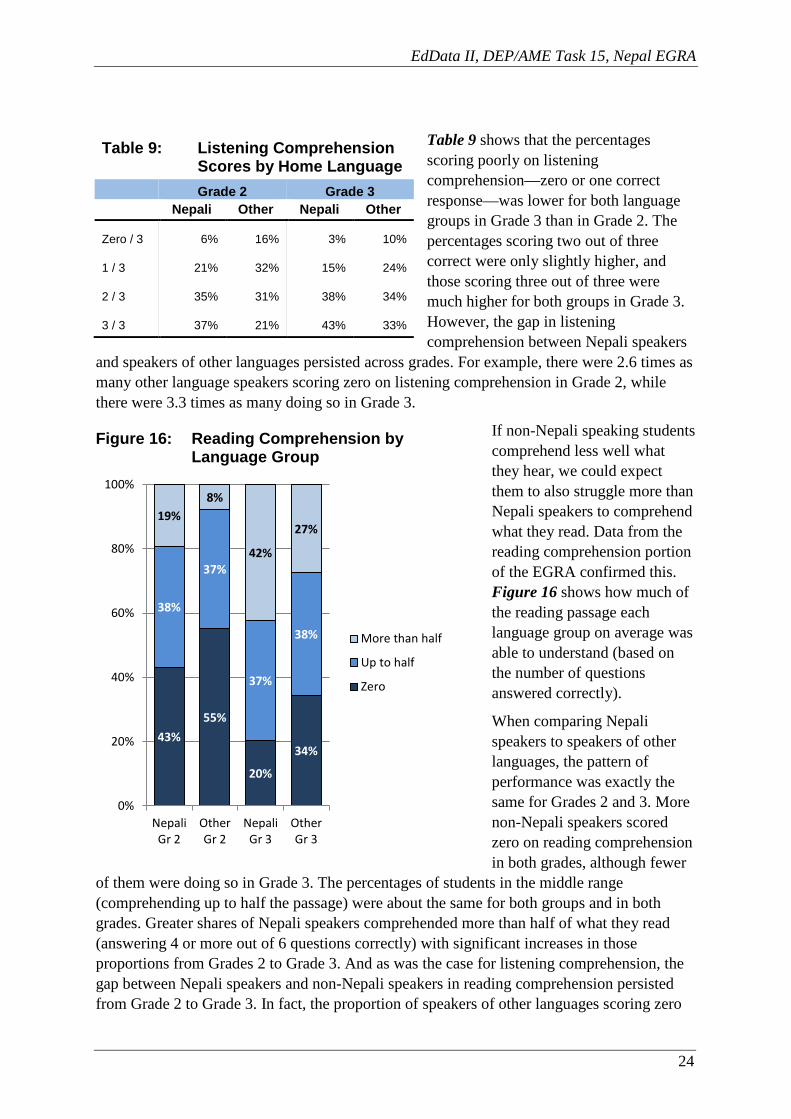
Table 9 shows that the percentages scoring poorly on listening comprehension—zero or one correct response—was lower for both language groups in Grade 3 than in Grade 2. The percentages scoring two out of three correct were only slightly higher, and those scoring three out of three were much higher for both groups in Grade 3. However, the gap in listening comprehension between Nepali speakers
and speakers of other languages persisted across grades. For example, there were 2.6 times as many other language speakers scoring zero on listening comprehension in Grade 2, while there were 3.3 times as many doing so in Grade 3.
If non-Nepali speaking students comprehend less well what they hear, we could expect them to also struggle more than Nepali speakers to comprehend what they read. Data from the reading comprehension portion of the EGRA confirmed this. Figure 16 shows how much of the reading passage each language group on average was able to understand (based on the number of questions answered correctly).
When comparing Nepali speakers to speakers of other languages, the pattern of performance was exactly the same for Grades 2 and 3. More non-Nepali speakers scored zero on reading comprehension in both grades, although fewer
of them were doing so in Grade 3. The percentages of students in the middle range (comprehending up to half the passage) were about the same for both groups and in both grades. Greater shares of Nepali speakers comprehended more than half of what they read (answering 4 or more out of 6 questions correctly) with significant increases in those proportions from Grades 2 to Grade 3. And as was the case for listening comprehension, the gap between Nepali speakers and non-Nepali speakers in reading comprehension persisted from Grade 2 to Grade 3. In fact, the proportion of speakers of other languages scoring zero
Table 9: Listening Comprehension Scores by Home Language
Grade 2 Grade 3
Nepali Other Nepali Other
Zero / 3 6% 16% 3% 10%
1 / 3 21% 32% 15% 24%
2 / 3 35% 31% 38% 34%
3 / 3 37% 21% 43% 33%
Figure 16: Reading Comprehension by Language Group
43% 55%
20%
34%
38%
37%
37%
38%
19% 8%
42%
27%
0%
20%
40%
60%
80%
100%
NepaliGr 2
OtherGr 2
NepaliGr 3
OtherGr 3
More than half
Up to half
Zero

EdData II, DEP/AME Task 15, Nepal EGRA
25
was 28% greater than the proportion of Nepali speakers doing so in Grade 2. And that proportion was 70% greater in Grade 3. This was in contrast to the gap between low SES and high SES students, which diminished in Grade 3.
We further analyzed whether, across all subtasks, more non-Nepali speaking students than Nepali-speaking students were scoring zero. Figure 17 below displays the percentage of zero-scoring students by language on all the subtasks. The results reveal that the majority of students who scored zero reported speaking a local language at home, and that this pattern was consistent for all of the subtasks. For example, 65% of students scoring zero on the letter sounds subtask were non-Nepali speakers. However, the analysis also reveals that there remains a group of children who scored zero and do speak Nepali at home. For nonwords, 46% of the students who were unable to read a single nonword correctly were Nepali speakers. In sum, although home language does explain some of the zero scores, it does not account for all of the scores and suggests that other factors must be considered.
Figure 17: Percentage of Zero-Scoring Students Who Reported Speaking either Nepali or a Local Language at Home
0%
25%
50%
75%
100%
listeningcomp
lettersounds
matra nonwords ORF readingcomp
Local Language Nepali

EdData II, DEP/AME Task 15, Nepal EGRA
26
In-School Factors School Management and Teacher Practices The evaluation of the current status of the teaching and learning of literacy in Nepal also included an EMES-TOS. The EMES-TOS comprises 12 distinct survey instruments designed to obtain quantitative and qualitative data at each level of the education system, from schools and classrooms to resource centers, districts, and education training centers, to the MOE and its central level agencies. The purpose of these surveys was to determine the preparedness of the education system to implement a national reading program. The EMES-TOS also included administration of EGRA in Grade 2, making it possible to examine the extent to which early grade reading performance in a school relates to the school management, governance, and teaching and learning factors for which data were collected. The EMES-TOS includes hundreds of data points. To make analysis of those data points more manageable, indices that combine several variables were created, including the following.6
• School leadership and management index − whether school-based management practices demonstrate a priority for early grade
reading • Reading instructional practice index
− whether observed lessons include best-practice approaches to literacy instruction • Child-centered instruction index
− whether observed lessons exhibit child-centered practices • Remediation practices index
− whether schools offer and students participate in supplemental or remedial programs
• Teaching and learning materials index − whether a variety of teaching and learning materials are available
To determine how these indices and the variables that make them up relate to early grade reading outcomes, two types of analyses were conducted. The first examines the extent to which a school’s score on each index and its score on each of the component variables in an index relate to the average oral reading fluency of the students in Grade 2 of that school. Figure 18 below shows the increase in average oral reading fluency associated with a better score on the index, as well as the additional number of correct words per minute associated with responses to certain variables that make up the index. Note that not all indices are included here, nor are all variables within the indices included. Only those that showed a significant relationship (p < .1, .05, or .01) are included and discussed.
6 For further understanding of the EMES-TOS see the report prepared for USAID by RTI, “Nepal Early Grade Reading Assessment, Education Management Efficiency Study and Teacher Observation Study,” Ed Data II Project, Data for Education Programming in Asia and the Middle East, April 2014.

EdData II, DEP/AME Task 15, Nepal EGRA
27
Figure 18: Relationship between EMES-TOS Indices and Average Oral Reading Fluency
This chart shows that the teaching and learning materials index, the remediation practices index, and the reading instructional practice index all had significant relationships with average oral reading fluency. The two other indices—leadership and management and child-centered practices—did not. We see that about 2.5 additional words per minute (wpm) in the average oral reading fluency of Grade 2 was associated with every additional point in a school’s score on the teaching and learning materials index. Each additional point on the remediation practices index was associated with about 3 additional wpm. For the leadership and management index, there was no significant relationship to reading fluency. However, one variable within that index—whether the PTA raised funds for reading improvement—was significant. Schools where the PTA did this had on average reading fluency scores that were 8 wpm higher than those that did not.
As that example illustrates, Figure 18 also shows the specific variables within each index that had significant relationships themselves with average oral reading fluency. For example, offering extra or remedial classes for struggling students is associated with higher average ORF in a school of almost 12 cwpm. Higher average oral reading fluency was associated with pupils having Nepali exercise books, teachers having guides in Nepali and English, and schools having a library that included elementary level materials. A school that had such a library on average had Grade 2 oral reading fluency almost 9 wpm greater than a school that did not. Regarding instructional practices, pupils reading aloud, pupils writing answers to questions, and pupils whose teachers allowed them to express themselves all showed positive, significant correlations with oral reading fluency.
Schools that had adequate and varied materials that were making the effort to support struggling students, that exhibited some of the good practices known to improve reading, and that had PTAs that were mobilized to support reading were not surprisingly the schools that had on average better reading outcomes. What this analysis does not tell us is how such characteristics combined at the school level to support improved reading, nor does it tell us
0 2 4 6 8 10 12
Teaching and learning materials indexPupils have exercise book for Nepali
Teacher has reference/guide for NepaliTeacher has reference/guide for English
School has library with elementary level materials
Remediation practices indexschool offers extra or remedial classes for readingHT thinks attention should go to struggling pupils
Teacher thinks attention should go to struggling pupils
Reading instructional practices indexStudents read aloud
Pupils write answers to questionsTeacher thinks pupils should express themselves
Leadership & management indexPTA raises funds for reading improvement
Additional words per minute of oral reading fluency

EdData II, DEP/AME Task 15, Nepal EGRA
28
whether those characteristics were simply found in Nepali schools with better than average resources. That aspect of the relationship between in-school factors and reading performance is explored below.
In addition to the above discussed analysis, we also examined how the variables included in the EMES-TOS indices combine to explain the variation in average oral reading fluency in evidence among schools. A step-wise approach to building a linear regression model was taken to identify the variables that significantly correlate with oral reading fluency. Students’ oral reading fluency was related to the characteristics of their classrooms and schools, based on the variables of all five of the EMES-TOS indices—those dealing with school leadership and management, reading instructional practices, child-centered instructional practices, school approaches to remediation of reading skills, and the availability and use of teaching and learning materials. All told, 46 different variables make up these five indices, all of which we iteratively tested in a model combining index variables as predictors of a student’s oral reading fluency score. The results of the model are presented in Table 10.
Table 10: Multivariate Model of In-School Factors Shown to Correlate Significantly with Average Oral Reading Fluency
Outcome Variable = Average ORF Number of Observations = 4,503
R-squared = 0.1176
Independent Variables Coefficients t-value (P>|t|)
Linearized standard
error
If all or most of the students have an exercise book for Nepali language 8.042
3.46
(.003)** 2.324
If the school works with the PTA to raise funds for reading improvement 6.017
2.13
(.048)* 2.824
If the Head Teacher does not think instructional attention should be focused on the best performing students 8.191
3.38
(.004)** 2.423
If the teacher thinks students who are struggling should get the most instructional attention 5.919
2.37
(.030)* 2.502
If the teacher has reference books or a teachers’ guide for Nepali 6.376 2.52
(.022)* 2.535
If students write answers to questions (as part of a lesson) 6.707 3.54
(.003)** 1.897
Intercept 1.886 .062
(.542) 3.030
Note: asterisks (*, **, ***) correspond to significance at the 90, 95 and 99 percent levels
The variables included in the model are only those that maintained a significant relationship with oral reading fluency. In combination, these variables account for about 12% of the variation in student scores (R-squared = 0.1176). The in-school factors that are of interest relate to teachers’ and students’ having materials for Nepali, whether the PTA works with the school to raise funds to put in place programs to improve reading, and the attitudes of the Head Teacher and teachers regarding where instructional attention should be focused
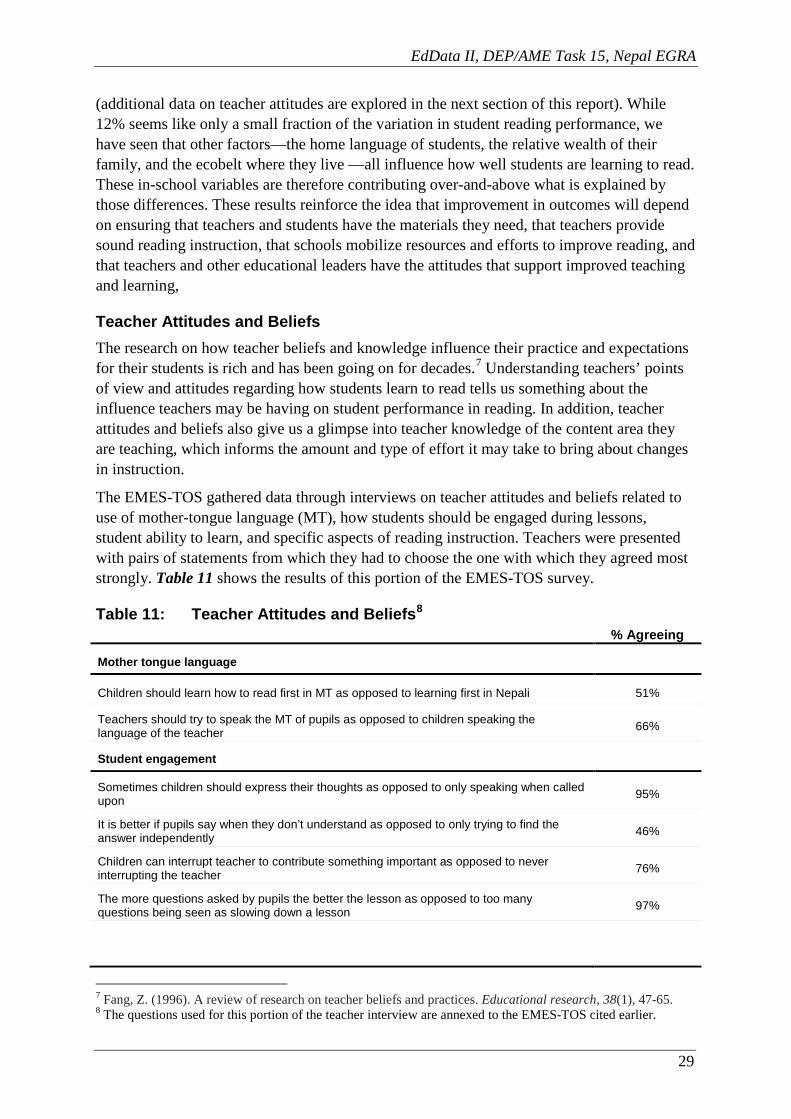
EdData II, DEP/AME Task 15, Nepal EGRA
29
(additional data on teacher attitudes are explored in the next section of this report). While 12% seems like only a small fraction of the variation in student reading performance, we have seen that other factors—the home language of students, the relative wealth of their family, and the ecobelt where they live —all influence how well students are learning to read. These in-school variables are therefore contributing over-and-above what is explained by those differences. These results reinforce the idea that improvement in outcomes will depend on ensuring that teachers and students have the materials they need, that teachers provide sound reading instruction, that schools mobilize resources and efforts to improve reading, and that teachers and other educational leaders have the attitudes that support improved teaching and learning,
Teacher Attitudes and Beliefs The research on how teacher beliefs and knowledge influence their practice and expectations for their students is rich and has been going on for decades.7 Understanding teachers’ points of view and attitudes regarding how students learn to read tells us something about the influence teachers may be having on student performance in reading. In addition, teacher attitudes and beliefs also give us a glimpse into teacher knowledge of the content area they are teaching, which informs the amount and type of effort it may take to bring about changes in instruction.
The EMES-TOS gathered data through interviews on teacher attitudes and beliefs related to use of mother-tongue language (MT), how students should be engaged during lessons, student ability to learn, and specific aspects of reading instruction. Teachers were presented with pairs of statements from which they had to choose the one with which they agreed most strongly. Table 11 shows the results of this portion of the EMES-TOS survey.
Table 11: Teacher Attitudes and Beliefs8 % Agreeing
Mother tongue language
Children should learn how to read first in MT as opposed to learning first in Nepali 51%
Teachers should try to speak the MT of pupils as opposed to children speaking the language of the teacher 66%
Student engagement
Sometimes children should express their thoughts as opposed to only speaking when called upon 95%
It is better if pupils say when they don’t understand as opposed to only trying to find the answer independently 46%
Children can interrupt teacher to contribute something important as opposed to never interrupting the teacher 76%
The more questions asked by pupils the better the lesson as opposed to too many questions being seen as slowing down a lesson 97%
7 Fang, Z. (1996). A review of research on teacher beliefs and practices. Educational research, 38(1), 47-65. 8 The questions used for this portion of the teacher interview are annexed to the EMES-TOS cited earlier.

EdData II, DEP/AME Task 15, Nepal EGRA
30
% Agreeing Student ability
It is important for all children to learn to read as opposed to thinking it is not important for some children 95%
All children have the ability to learn to read as opposed to thinking some do not have the ability 55%
Pupils’ learning to read depends on the teacher’s skill as opposed to depending on how clever the child is 77%
Reading instruction
Children should be encouraged to read outside school as opposed to reading only in school 96%
Children should read books at their ability level as opposed to at their grade level 80%
To learn to read pupils must learn characters/syllables/sounds and combine them as opposed to memorizing lots of words 91%
Reading with expression indicates understanding as opposed to pronouncing the words correctly being the indicator of understanding 72%
Children should read independently beginning in G 1 as opposed to beginning in G 2 77%
Students who are struggling should get the most attention as opposed to the pupils who are doing well getting the most attention 96%
Children should learn to read and write at the same time as opposed to learning to read first then write 53%
Assessment is important to determine the level of support students need as opposed to determining pupils’ marks or grades 73%
Regarding language of instruction, we see that just half the teachers agreed that children should learn how to read first in their mother tongue as opposed to in Nepali. This will have implications for implementation of a mother tongue-based, multilingual reading curriculum in Nepal. Encouragingly, almost two-thirds of teachers did agree that the teacher should try to speak the language of his/her pupils.
The prevalence of child-centered pedagogy in Nepal surfaces in teachers’ responses to statements related to student engagement. More than 90% of teaches agreed that students should express themselves and agreed that it is good for students to ask questions during a lesson. Teachers were split about 50-50 between those who thought students should ask the teacher when they don’t understand and those who thought students should work to find the answer themselves.
The overwhelming majority of teachers agreed that all children should learn to read, but only 55% thought all children have the ability to do so. More than three-quarters of teachers recognized that a student’s learning to read depends on the teacher’s skill rather than on how clever the child is.
The majority of teachers agreed with many of the statements relating to best practice for reading instruction, with vast majorities concurring that children should read outside school; that students need to learn characters, syllables, and sounds to learn to read; and that struggling students should get most of their attention. However, only 53% agreed that

EdData II, DEP/AME Task 15, Nepal EGRA
31
students should learn to read and write at the same time—with the other 47% thinking, as is commonly misunderstood, that students should learn to read first, then to write.
Indices that summarize the results of the attitudes and beliefs survey allow us to further investigate how individual teachers think about the four areas of interest mentioned above. The indices place teachers on a continuum for each of the four components: mother tongue instruction, student engagement, student ability, and reading instructional practices. The index awards teachers points for statements from above that reflect the ends of the continuum; points are then compiled, and teachers are placed at a point on the continuum. Figures 19 to 22 show the percentages of teachers at points along the continuum for each index.
Figure 19: Mother Tongue Language Instruction
The mother tongue langauge instruction probes teacher beliefs around language of instruction in the teaching of early grade reading.The ends of the continuum range from teachers who did not view mother tongue instruction as key to the teaching of reading, seen on the left of the graph above, to teachers who did see mother tongue instruction as key to teaching reading, seen on the right of the graph above. According to this scale, 46% of teachers thought that mother tongue instruction is important when teaching early grade reading; 26% believed that mother tongue instruction is not key, and that students should learn to read in Nepali regardless of their mother tongue. 28% of teachers fell somewhere in-between, where they may have thought certain aspects of mother tongue instruction helpful, but other aspects not.
0%
20%
40%
60%
80%
100%
Do not view MT instruction askey to teaching reading
View MT instruction as key toteaching reading
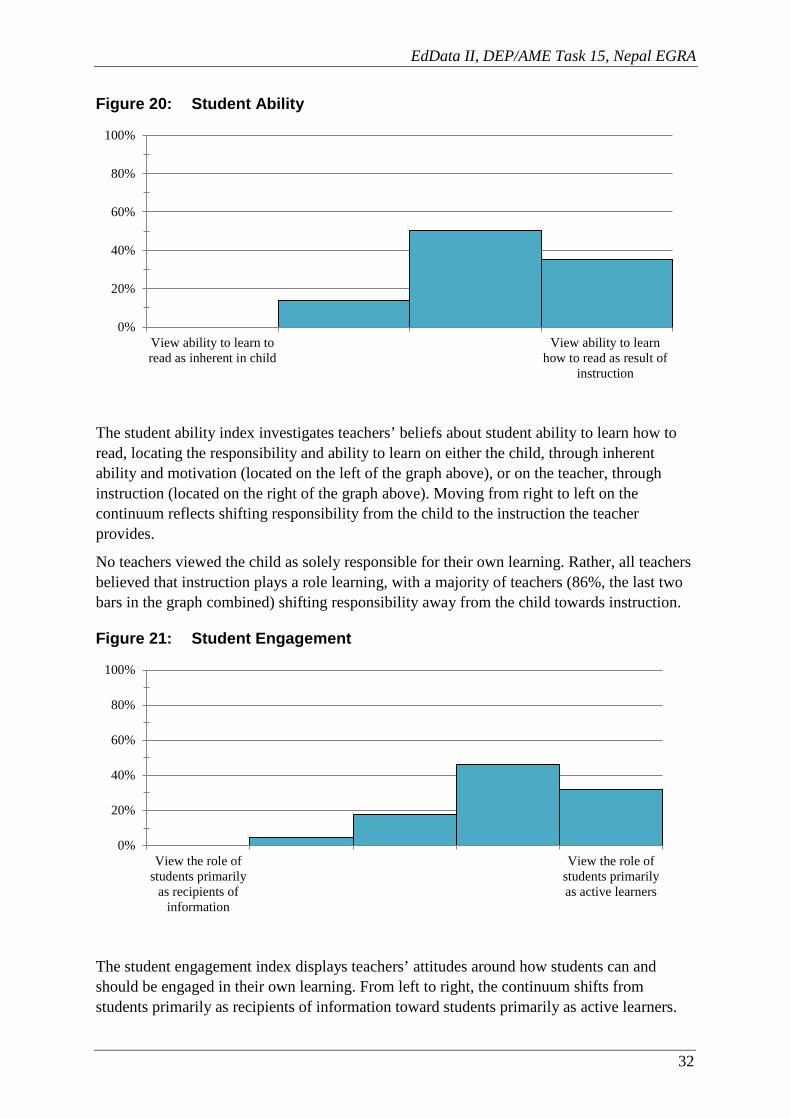
EdData II, DEP/AME Task 15, Nepal EGRA
32
Figure 20: Student Ability
The student ability index investigates teachers’ beliefs about student ability to learn how to read, locating the responsibility and ability to learn on either the child, through inherent ability and motivation (located on the left of the graph above), or on the teacher, through instruction (located on the right of the graph above). Moving from right to left on the continuum reflects shifting responsibility from the child to the instruction the teacher provides.
No teachers viewed the child as solely responsible for their own learning. Rather, all teachers believed that instruction plays a role learning, with a majority of teachers (86%, the last two bars in the graph combined) shifting responsibility away from the child towards instruction.
Figure 21: Student Engagement
The student engagement index displays teachers’ attitudes around how students can and should be engaged in their own learning. From left to right, the continuum shifts from students primarily as recipients of information toward students primarily as active learners.
0%
20%
40%
60%
80%
100%
View ability to learn toread as inherent in child
View ability to learnhow to read as result of
instruction
0%
20%
40%
60%
80%
100%
View the role ofstudents primarily
as recipients ofinformation
View the role ofstudents primarilyas active learners

EdData II, DEP/AME Task 15, Nepal EGRA
33
No teachers believed that students should primarily be passive learners, absorbing information that teachers may give them in school. A majority of teachers fell to the right of the continuum, increasingly viewing the role of students as active learners. Interestingly, the largest group of teachers (46%) placed towards the right, but not at the end of the continuum, suggesting that although teachers believed that students should be active, they also saw a role for students to receive instruction from the teacher.
Figure 22: Reading Instructional Practices
The reading instructional practice index measured teacher beliefs that were either attuned or not attuned to research-based best practices for reading instruction, such as using leveled texts, phonics instruction, and concurrent reading and writing instruction. A move from left to right on the continuum reflects beliefs that were increasingly aligned with current research.
No teachers placed at either end of the continuum; all teachers were in-between the two endpoints. A majority of teachers were towards the right, reflecting increasing alignment with research-based practices.
Several analytical approaches were tested to see what if any relationship exists between how teachers responded to the attitudes and beliefs portion of the EMES-TOS and their students’ performance on the EGRA. However, no statistically significant relationships emerged from these data. This may be mostly because of the limited number of teachers for whom we have both attitude and beliefs data and EGRA scores.
RQ 4: How well do teachers understand a written explanation of a proposed Early Grade Reading Program? Teachers were asked to silently read a short paragraph in Nepali that describes the objectives and intentions of MOE’s national reading program. The reading passage, developed in conjunction with ministry officials during the EGRA adaptation workshop, was geared to a secondary school reading level. To gauge how well teachers read and understood the text, we also asked them to respond to five multiple choice comprehension questions. Questions were coded for correct/incorrect and Figure 23 below shows the percentage of teachers who answered 0, 1, 2, 3, 4, or 5 questions correctly.
0%
20%
40%
60%
80%
100%
Lessattuned to
bestpractices for
reading
Moreattuned to
bestpractices for
reading
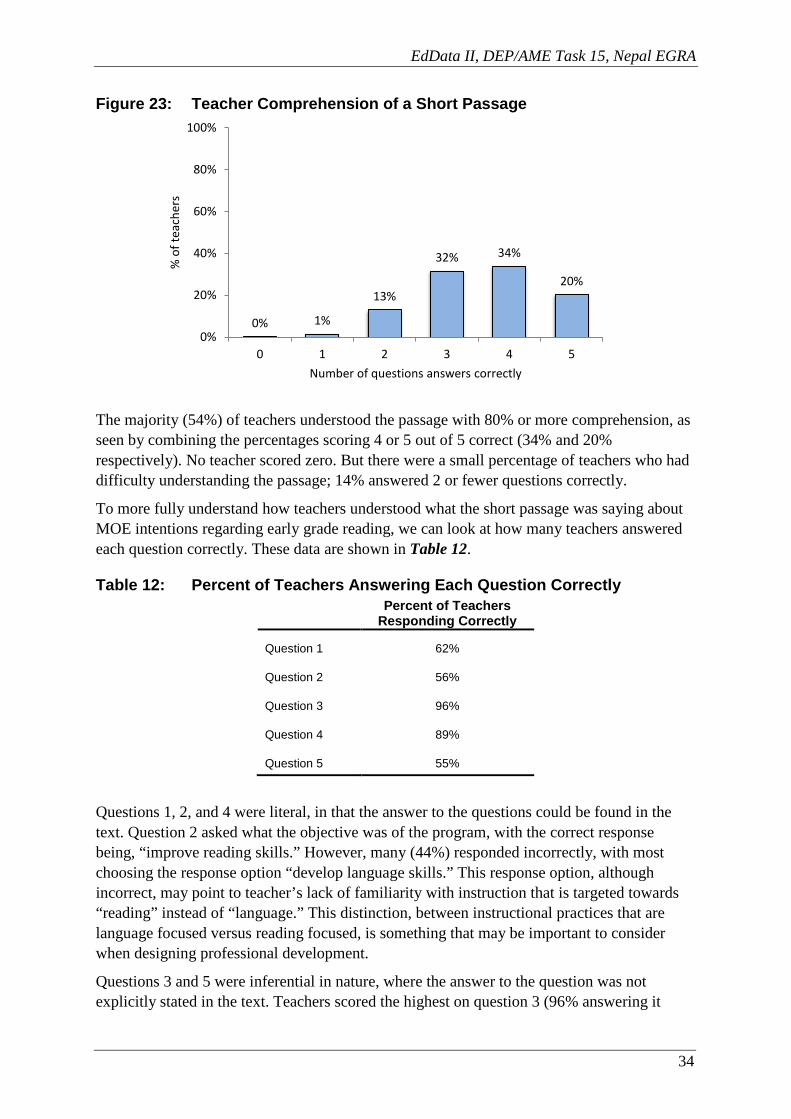
EdData II, DEP/AME Task 15, Nepal EGRA
34
Figure 23: Teacher Comprehension of a Short Passage
The majority (54%) of teachers understood the passage with 80% or more comprehension, as seen by combining the percentages scoring 4 or 5 out of 5 correct (34% and 20% respectively). No teacher scored zero. But there were a small percentage of teachers who had difficulty understanding the passage; 14% answered 2 or fewer questions correctly.
To more fully understand how teachers understood what the short passage was saying about MOE intentions regarding early grade reading, we can look at how many teachers answered each question correctly. These data are shown in Table 12.
Table 12: Percent of Teachers Answering Each Question Correctly Percent of Teachers
Responding Correctly
Question 1 62%
Question 2 56%
Question 3 96%
Question 4 89%
Question 5 55%
Questions 1, 2, and 4 were literal, in that the answer to the questions could be found in the text. Question 2 asked what the objective was of the program, with the correct response being, “improve reading skills.” However, many (44%) responded incorrectly, with most choosing the response option “develop language skills.” This response option, although incorrect, may point to teacher’s lack of familiarity with instruction that is targeted towards “reading” instead of “language.” This distinction, between instructional practices that are language focused versus reading focused, is something that may be important to consider when designing professional development.
Questions 3 and 5 were inferential in nature, where the answer to the question was not explicitly stated in the text. Teachers scored the highest on question 3 (96% answering it
0% 1%
13%
32% 34%
20%
0%
20%
40%
60%
80%
100%
0 1 2 3 4 5
% o
f tea
cher
s
Number of questions answers correctly

EdData II, DEP/AME Task 15, Nepal EGRA
35
correctly), which asked who the recipients of the reform were. Question 5 had considerably fewer correct responses than question 3. It asked what other national initiative the early grade reading program might align with, requiring teachers to think of another national program that could support early grade reading; 55% did answer question 5 correctly.
Most teachers understood quite well the written explanation of the proposed national reading program. Therefore, distributing written explanations could be a viable channel for communicating about that program. However, for some teachers (around 14%), other channels besides written communication should be considered. It may be important to explicitly show links between such a program and other initiatives and efforts in the sector. Additionally, attention to helping teachers see how explicit instruction in reading differs from existing practice should also be a feature of future communications about the national reading program.
V. Conclusions and Implications The purpose of this report is to provide key results from a national study measuring the reading skills of students in Grades 2 and 3 in Nepali across all ecobelts. The report is structured around four key research questions. Below, high-level conclusions are provided for each research question. We then discuss the implications of the study for three key areas: curricula and instructional design, teacher professional development and instructional support, and materials development, production, and distribution.
Research question 1 asked, to what extent are students in Grade 2 and 3 learning to read in Nepali? In general, students were demonstrating emergent reading skills by Grade 3. There were increases in mean scores between Grades 2 and 3 on all subtasks and in all ecobelts. Girls and boys performed equally well across all subtasks, showing no significant gender disparity in teaching and learning in typical Nepali classrooms in the early grades.
Research question 2 asked, what reading-related skills are students in Grades 2 and 3 acquiring? Students in Grades 2 and 3 performed well on the letter sound knowledge subtask, which means they were acquiring the understanding of the alphabetic principle that is the foundation for reading. However, student performance in both grades on matra and nonwords subtasks was lower than expected for the grade level. In addition, there remained large percentages of students, especially in Grade 2, that were scoring zero on the matra and nonword subtask. Poor performance in these skill areas usually indicates that instruction does not sufficiently emphasize syllable (matra) reading or decoding (nonword reading).
There are large disparities in student achievement by ecobelt, with Grade 3 students in the Terai region performing at levels similar to Grade 2 students in the Mountain, Hill, and KTV ecobelts. For students in the Terai ecobelt, home language was an important factor that may have held back their acquisition of literacy in Nepali. The majority of students in the Terai ecobelt reported speaking a language other than Nepali. Those students read fewer words correctly per minute of the reading passage and answered fewer questions correctly on the listening and reading comprehension subtasks.
Research question 3 explored the factors, both in-school and out-of-school, that help explain student performance on the EGRA. As already mentioned, an important out-of-school factor is where students reside/go to school, with Terai ecobelt demonstrating lower scores across

EdData II, DEP/AME Task 15, Nepal EGRA
36
all subtasks and grades. Linked to ecobelt residency is the other issue already mentioned—home language. While this may be of particular concern in Terai, in general students whose first language was not Nepali were not performing as well as those who came to school speaking the language of instruction.
The other out-of-school factor that correlates with reading performance is the relative SES- of a child’s family. Grade 2 students in the lowest socioeconomic quartile had a mean oral reading fluency score equivalent to half of the mean score of those in the highest quartile. The difference in those mean oral reading fluency scores was lower in Grade 3.
Several in-school factors also demonstrated significant positive correlations with reading performance. These included aspects of teachers’ reading instructional practices, schools’ practices that support reading remediation, PTA support for reading, and the availability of teaching and learning materials. These findings suggest that certain aspects of school management, instruction, and school support from communities are important factors to address when rolling out an Early Grade Reading Program.
Another in-school indicator, teachers’ having reference materials or teachers’ guides, correlates with students having mean oral reading fluency scores higher than students whose teachers did not. This may reflect a more general relationship between availability of materials and student performance in reading. Further research could explore the types of materials that contribute most to improved reading outcomes.
Schools that had staffs that recognized that attention must be focused on struggling students and that in general put more effort into supporting remediation also had higher mean reading fluency scores than those that did not. And when communities contributed to efforts to improve reading, the students in those schools performed better.
Another in-school factor concerns what teachers thought and believed about several aspects of the teaching and learning of reading. Teacher attitudes and beliefs were measured, and results revealed patterns of beliefs amongst teachers with regard to mother-tongue instruction, reading instructional practices, student ability, and student engagement. In general, most teacher attitudes and beliefs fell in the middle of the ranges of the continua used in this survey.
The fourth research question asked how well teachers understand a written explanation of a proposed early grade reading program. Results show that a majority of teachers were able to read the passage and successfully answer most of the questions asked about it. This shows that most teachers had reading and comprehension abilities that would enable them to process information written at a secondary school level. However, a small minority of teachers seemed to need help processing overly complex written information.
Implications of the Findings of the EGRA Study for Curricula and Instructional Design More time on task is needed on foundational reading skills, such as phonics, decoding, and explicit instruction on comprehension strategies. The mean scores achieved in Grade 3 are more indicative of emergent reading ability rather than the more secure level of skill one would expect after three years of schooling. These results suggest that more focused

EdData II, DEP/AME Task 15, Nepal EGRA
37
instruction is needed early in the primary cycle to more quickly build literacy-related skills and reading ability.
Effort should be directed towards struggling students in Grades 2 and 3 in addition to all students in Grade 1. The results show that once students gain the foundational skills needed to begin reading, general achievement rises. Instruction in Grades 1 and 2 should target these basic skills, with particular attention paid to learning the matras and learning how to decode unfamiliar words. Students may benefit from explicit instruction in the sounds of the matras, using similar strategies that have been used to teach the letter sounds, which, results indicate, have been largely successful. Students should receive instruction in comprehension strategies beginning in Grade 1 through oral comprehension stories.
In addition, adequate time at the beginning of schooling should be given to ensuring the development of Nepali oral language skills, especially for non-native Nepali speakers and students from low SES families. Given the differences in results by ecobelt and region, extra support and attention should be paid to students in the Terai ecobelt. Strategies that explicitly help children bridge from their maternal languages to Nepali may be needed. An alternative may be mother-tongue instruction for students in this region, given the significant percentages of children who reported using a home language other than Nepali who had low listening comprehension scores. Although this presents several challenges, the Terai ecobelt may be fertile ground for a pilot program in mother-tongue reading instruction.
While it is a good sign that more time in school was helping students from less wealthy families begin to catch up to better off students, schools may need to recognize the needs of disadvantaged students earlier and intervene to help address the challenges those students face. Interestingly, while the gap in reading scores between Nepali and non-Nepali speakers diminished between Grades 2 and 3, the gap between students from the lowest and highest SES quartiles diminished even more. With that in mind, in addition to intervening early or providing instruction in the mother tongue as mentioned above, it may be worthwhile to offer specific additional learning opportunities to students who continue to struggle with oral comprehension of Nepali.
Other important factors for improving reading are parental and community support for reading, and opportunities for supplemental and remedial instruction. School staff that recognize and prioritize these factors is important as well. These two findings suggest that building up greater awareness of the need to focus on assisting struggling students and mobilizing and supporting local initiatives related to reading improvement could be useful features of a national reading program.
Implications of the Findings of the EGRA Study for Teacher Professional Development and Instructional Support Teacher attitudes are supportive of best practices in reading instruction, but they may lack the specific skills, knowledge, and materials to translate their attitudes into consistent practice. For example, classrooms in which students were frequently asked to read aloud had a mean oral reading fluency score greater than the mean of students who were not asked to read aloud. In general, teachers who adhered to instructional practices that align more with recognized best practice and research on literacy instruction had students who were performing better. Although making such practices widespread is one fundamental challenge

EdData II, DEP/AME Task 15, Nepal EGRA
38
that a national reading program will need to confront, the majority of teachers’ beliefs are in alignment with these practices.
Professional development should focus on providing teachers with instructional strategies for building foundational reading skills, such as phonics, decoding, and comprehension strategies. Although ample attention in the sector is paid to child-centered/active learning pedagogies, in the future these pedagogies should be embedded in content-specific instructional practices.
Professional development should also focus on supporting teachers in developing best practices for teaching reading to non-Nepali speaking children, such as oral language development, pre-teaching, vocabulary development, use of visuals, and making connections across languages (code switching when necessary). In addition, teachers should learn best practices for remedial instruction, such as varying pedagogy, teaching to different learning modalities, and providing ample time for skills practice.
Implications of the Findings of the EGRA Study for Materials Development, Production, and Distribution The results show that availability of teaching and learning materials matters for improved student reading levels. However, not all schools have sufficient access to materials. Schools should have enough textbooks so that each child can have a copy.
In addition, supplemental materials that are appropriately leveled for pre-emergent, emergent, beginner and independent readers must be available. Students should have ample opportunities to read multiple books at their reading level.
There is promise of designing written materials and professional development courses to introduce new instructional strategies for the teaching of reading, as the majority of teachers already are able to read well with comprehension. Materials in which teachers are asked to read and implement a lesson can be designed with confidence in teachers’ ability to comprehend the instructions and the lessons. Guides for teachers can also provide explicit strategies for teachers when they have students who are non-native Nepali speakers.

EdData II, DEP/AME Task 15, Nepal EGRA
39
Annex A: List of EGRA Adaptation Workshop
Participants List of Adaptation Workshop (EGRA) Participants
January 20-22, 2014
S.N. Name Designation Office/Organization 1. Diwakar Dhungel Executive Director CDC 2. Madhu Timilsina Member S.S. (Teacher) CDC 3. Chandra Kanta Bhusal Deputy Director CDC 4. Gopini Pandey Education Specialist Save the Children 5. Rajani Dhimal Curriculum Officer CDC 6. Uma Budathoki Section Officer NCED 7. Pramila Bakhati Deputy Director NCED 8. Ramesh Bhattarai Subject Committee M. CDC (T.U.) 9. Ganesh Prasad Bhattarai Deputy Director CDC 10. Balaram Timalsina Deputy Director DOE 11. Prahlad Aryal Deputy Controller OCE 12. Damodar Regmi Section Officer DOE, Sanothimi 13. Mukunda Mani Khanal Under Secretary MOE 14. Jhum Prasad Rai Under Secretary MOE/EPC 15. Raj Kumar Gandharba Project Manager VSO 16. Basanta Pd. Koirala Under Secretary MOE/BEMS 17. Devi Ram Acharya Section Officer MOE/ERO 18. Anup Tiwari Manager Room to Read 19. Uddab Bhattarai Project Officer Room to Read 20. Anjila Dahal Project Assistant Room to Read 21. Tej Prasad Parajuli Roster Teacher SHSS 22. Kabi Raj Maharjan Teacher Minnath Adarsh S.S. 23. Dasharath Bhattarai Teacher Patan Higher Secondary
School 24. Kalika Adhikari Teacher Tej Binayak S.S. 25. Ram Prasad Bhandari Resource Person DEO Kathmandu 26. Kavita Deoja (Dahal) Teacher GFSS

EdData II, DEP/AME Task 15, Nepal EGRA
40
Annex B: EGRA Sampling Plan The sample was drawn through four stages:
1) Selection of districts within strata formed by the cross-classification of regions and ecobelts.
2) Selection of Village Development Committees (VDC) within districts. 3) Selection of schools within VDCs. 4) Selection of students within schools.
For the first three stages, the sample was drawn with probability proportional to size (PPS). The size measure is the number of learners in Grades 2 and 3. At the fourth stage, field teams selected 10 Grade 2 learners and 10 Grade 3 learners at each school. If there were fewer than 10 learners available in a grade, then all students in that grade were tested.
Stage 1: 30–35 of the 75 districts in the country were selected. Stratification was based on the cross-classification of regions and ecobelts. Table B-1 shows the stratification scheme and district counts for each of the 15 strata. Note that the Kathmandu Valley forms its own stratum, and note that the {Ecobelt = Mountain, Region = Mid-Western} and {Ecobelt = Mountain, Region = Western} cells in the cross-classification have been combined to form a single stratum.
Table B-1. District Sample Sizes Region
TOTAL Far-
Western Mid-
Western Western Central Eastern Kathmandu
Valley
Ecobelt Mountain 2/3 1/7 1/3 1/3 5/16
Hill 2/4 2/7 3/11 2/6 2/8 3/3 14/39
Terai 1/2 2/3 2/3 6/7 3/5 14/20
TOTAL 5/9 10/31 9/16 6/16 3/3 33/75
Stage 2: This stage was used for all selected districts except the three in the Kathmandu Valley. Eight schools were then chosen in each selected district. To keep the costs down, clusters of schools were formed. In some districts, travel was costlier than in others. For those districts where travel was especially costly, two clusters of schools were selected, and four schools were selected within each selected cluster. In other districts, four clusters of schools were selected, and two schools were selected within each selected cluster. Table B-2 shows which districts were considered more costly and which were considered less costly. In more costly districts, two clusters were selected. In less costly districts, four clusters were selected.
Table B-2. More Costly and Less Costly Districts Region Far-Western, Mid-Western, or Western Central or East
Ecobelt Mountain More costly More costly
Hill More costly Less costly
Terai Less costly Less costly

EdData II, DEP/AME Task 15, Nepal EGRA
41
Clusters consisted of VDCs. For the most part, each VDC was a cluster. However, VDCs with a small number of schools were joined with neighboring VDCs to form “super-VDCs.” In the more costly districts, VDCs with fewer than four schools were joined with neighboring VDCs. In the less costly districts, VDCs with fewer than two schools were joined with neighboring VDCs.
Stage 3: Outside the Kathmandu Valley, the selection of schools took place as described in the Stage 2 section above. Four schools were selected from super-VDCs in more costly strata, and two schools were selected from super-VDCs in less costly strata.
Inside the Kathmandu Valley, the school sample sizes were as listed in Table B-3. Stratification was by district and no clusters of schools were formed.
Table B-3. School Sample Sizes in the KV Region G2 and G3 Learners # Schools
District Number Percentage Population Sample
Bhaktapur 11,536 13.6 301 6
Kathmandu 54,106 63.6 1,077 26
Lalitpur 19,427 22.8 386 10
Total 85,069 100.0 1,764 42
Stage 4: In each school, 10 second grade learners and 10 third grade learners were selected at random.

EdData II, DEP/AME Task 15, Nepal EGRA
42
Annex C: Anecdotal Findings from Private Schools
Purpose, Overview, and Limitations to the Private School Sample The Nepal EMES/TOS and EGRA surveyed nine private schools in three urban districts of Bhaktapur, Syanja, and Chitwan. The purpose of surveying a small number of private schools was to convey an anecdotal sense of selected private schools’ practices and performance. Because this sample of private schools included so few schools, which were chosen based on the convenience of their location to the ward or district center, the results are not in any way generalizable for any population of private schools in Nepal. Rather, the results are relevant only to those schools that were actually surveyed. For this reason, we detail the range of results for each of the private schools as opposed to providing summary mean scores and responses. Nor do we attempt to correlate relationships between EMES/TOS findings and EGRA results. Any differences to the EGRA and EMES/TOS results from the broader sample of community schools should not be construed as statistically significant. Therefore no such comparison is given.
Grade 2 and Grade 3 EGRA Results for Private Schools A total of 10 Grade 2 and 10 Grade 3 learners were tested using the same EGRA protocol administered in the broader sample of community schools. The scores of the individual students are summarized as an average for the school. The minimum and maximum schools’ averages for each subtest are provided in Table C-1.
This table should be interpreted accordingly: the lowest Grade 2 school average score for correct letter sounds per minute was 33.6 letter sounds per minute. The highest school average score was 56.9 correct letter sounds per minute. Schools that achieved at the higher ends of these ranges performed well across all subtests in both grades. Those at the lower end of the spectrum had relatively low scores in matra sounds, nonwords, and reading comprehension.
Table C-1. Range of School Mean Scores for Grade 2 and Grade 3 EGRA Results
Subtest Grade 2 Grade 3
Minimum Maximum Minimum Maximum
Letter sounds 33.6 56.9 41.6 69.7
Matra sounds 13.6 55.2 22.6 62.6
Nonwords 6.1 24.8 8.9 29.7
Oral reading fluency 24.7 55.2 30.7 70.9
Reading comprehension 2.8 4.5 2.8 5.5
Listening comprehension 2.0 2.8 1.8 2.9

EdData II, DEP/AME Task 15, Nepal EGRA
43
Figure C-1 arrays the set of nine schools’ based on their average oral reading fluency scores, from lowest (left) to highest (right). The dashed line represents the average oral reading fluency score for the nine schools and is provided only as a reference point for these schools (i.e., to show how they compare to each other). These results show that letter sounds, matras, and nonwords all have a fairly co-linear relationship with oral reading fluency. The schools that performed above average (the right hand side of the chart) tended to do so in all subtests. Of the nine schools, only one school (School 8) performed above average on Grade 2 oral reading fluency and performed below average on Grade 3. Conversely, only one school (School 4) performed below average in Grade 2 and above average in Grade 3.
Figure C-1. Grade 2 and Grade 3 EGRA Results by Private School
Selected EMES/TOS Results A modified version of the EMES-TOS was conducted with these nine private schools—lessons were observed, and head teachers and teachers were interviewed. All of the classrooms were observed during a Nepali language lesson, and all but one were in Grade 2. A more limited set of the questions was asked of these schools than was asked of the broader sample of public schools. Table C-2 highlights the frequency of “yes” responses and observations to a selected set of research questions examined under the EMES/TOS survey. The private schools all were reasonably close to the district administrative centers. The school closest to the District Education Office was 0.5 kilometers; the furthest was 35 kilometers.
0
20
40
60
80
School 7 School 4 School 9 School 3 School 1 School 6 School 2 School 8 School 5
Grade 2 EGRA Results by Private School
LISTCOMP
READCOMP
NONWPM
MPM
ORF
CLSPM
AVE_ORF
0
20
40
60
80
School 3 School 7 School 8 School 9 School 1 School 2 School 5 School 4 School 6
Grade 3 EGRA Results by Private School
LISTCOMP
READCOMP
NONWPM
MPM
ORF
CLSPM
AVE_ORF

EdData II, DEP/AME Task 15, Nepal EGRA
44
Table C-2. Responses to Selected EMES-TOS Questions
EMES/TOS Item “YES” Responses and Observations
Leadership and Management
Does the school keep records of student performance? 4 out of 9 schools
Do student report cards include reading or literacy indicators? 3 out of 9 schools
Do schools employ literacy coaches or teaching assistants? 4 out of 9 schools
Did the head teacher never observe teachers in the classroom (teacher reported)? 1 out of 9 schools
Teaching, Assessment and Remediation Practices
Does the teacher teach phonemic awareness or phonics? 1 out of 9 schools
Does the school offer remedial support to struggling learners (HT reported)? 8 out of 9 schools
Does the school offer supplemental language classes (teacher reported)? 4 out of 9 schools
Do teachers routinely assess learners using written tests? 7 out of 9 schools
Do students take end-of-term and end-of-year tests? 5 out of 9 schools
Teaching and Learning Materials
Does the school have libraries with grade-level appropriate materials? 9 out of 9 schools
Does the school have book corners in its G 2 classroom? 5 out of 9 schools

EdData II, DEP/AME Task 15, Nepal EGRA
45
Annex D: EGRA Instruments

EdData II, DEP/AME Task 15, Nepal EGRA
46
Annex E: List of Participants—Early Grade Reading
Assessment (EGRA) – 2014 Dissemination Seminar
June 18, 2014 Kathmandu, Nepal
S.No. Name of Participants Designation Institution/Address
1 Aail S. Mishra Under Secretary Ministry of Education 2 Anup Tiwari Consultant RTI 3 Badri Bahadur Pathak Under Secretary Ministry of Education 4 Baikuntha Prasad Aryal Deputy Director NCED 5 Bandha Raj Niraula Under Secretary Ministry of Education 6 Bhoj Raj Kafle Under Secretary Ministry of Education 7 Bhoj Raj Shrestha Under Secretary Ministry of Education 8 Bhuban Raja Bajcharya Consultant ADB 9 Christopher Bane Regional Partnership Mg. VSO-Sanepa 10 Devi Prasad Subedi Under Secretary Ministry of Education 11 Dharma Raj Kuikel Under Secretary Ministry of Education 12 Dilli Ram Rimal Joint Secretary Ministry of Education 13 Dilliswor Pradhan Under Secretary Ministry of Education 14 Dipu Shakya Education Consultant UNICEF 15 Ganesh Prasad Bhattarai Deputy Director CDC 16 Gopini Pandey Education Specialist AIN 17 Guru Prasad Mainali Under Secretary Ministry of Education 18 Hari Lamsal Joint Secretary Ministry of Education 19 Harito Shionata PM Save the Children 20 Helen Sharpa Country Director World Education 21 Hem Lamsal National Specialist World Vision International 22 Jayanti Subba Education Specialist USAID/Nepal 23 Jhum Prasad. Rai Under Secretary Ministry of Education 24 Karna Bahadur Bhumaji Under Secretary Ministry of Education 25 Keshab Adhikary Under Secretary Ministry of Education 26 Khagaraj Baral Executive Director NCED 27 Khagaraj Poudyal Under Secretary Ministry of Education 28 Khagendra K. Prasai Under Secretary Ministry of Education 29 Kishor K.C. Program Con. USAID 30 Krishna Dhungana Under Secretary Ministry of Education 31 Lava Dev Awasthi Director General DOE 32 Laxmi Khadka Under Secretary Ministry of Education 33 Mahashram Sharma Joint Secretary Ministry of Education 34 Maneka Gurung USAID/Nepal AID Dev. Assistant Officer 35 Marian Hongkin Education Specialist UNICEF 36 Marityn Hour Chief of Education UNICEF 37 Mukunda Mani Khanal Under Secretary Ministry of Education 38 Mukunda Prasad Niroula Joint Secretary Ministry of Education 39 Narayan Kafle Education Specialist Save the Children

EdData II, DEP/AME Task 15, Nepal EGRA
47
S.No. Name of Participants Designation Institution/Address 40 Nawal Yadav ED Aaruman-Nepal 41 Netra Dahal Manager Room to Read 42 Niwli Paul Country Rep. INTERVITA 43 Pramila Ghimire Program Coordinator WFP 44 Rajkumar Gandharba Sr. Program Manager VSO Nepal 45 Raju Karki Account & Admin Officer Aide et Action Nepal 46 Rameshwor P. Lamichhane Under Secretary Ministry of Education 47 Shova Adhikari Under Secretary Ministry of Education 48 Shree Prasad Gurung Under Secretary Ministry of Education 49 Sidhartha Man Tuladhar Executive Director New ERA 50 Siena Fleischer USAID/Nepal Education Team Leader 51 Sudarshan Ghimire Associate Editor Shikshak Mag. 52 Uddhab Karki Program Manager European Union 53 Usha Hamal Under Secretary Ministry of Education 54 Uttar Kumar Parajuli Under Secretary ERO 55 Vishnu Karki Consultant 56 Yagya Raj Pant Professor Free lancer 57 Yuba Raj Laulari Senior Trainer Samunnat Nepal 58 Yubraj Dahal Section Officer Ministry of Education