eden: enforcing location privacy through re-identification
TRANSCRIPT

HAL Id: hal-03274635https://hal.archives-ouvertes.fr/hal-03274635
Submitted on 12 Jul 2021
HAL is a multi-disciplinary open accessarchive for the deposit and dissemination of sci-entific research documents, whether they are pub-lished or not. The documents may come fromteaching and research institutions in France orabroad, or from public or private research centers.
L’archive ouverte pluridisciplinaire HAL, estdestinée au dépôt et à la diffusion de documentsscientifiques de niveau recherche, publiés ou non,émanant des établissements d’enseignement et derecherche français ou étrangers, des laboratoirespublics ou privés.
EDEN: Enforcing Location Privacy throughRe-identification Risk Assessment: A Federated
Learning ApproachBesma Khalfoun, Sonia Ben Mokhtar, Sara Bouchenak, Vlad Nitu
To cite this version:Besma Khalfoun, Sonia Ben Mokhtar, Sara Bouchenak, Vlad Nitu. EDEN: Enforcing Location Privacythrough Re-identification Risk Assessment: A Federated Learning Approach. Proceedings of theACM on Interactive, Mobile, Wearable and Ubiquitous Technologies , ACM, 2021, 5 (2), pp.68.�10.1145/3463502�. �hal-03274635�
EDEN: Enforcing LocationPrivacy through Re-identification
Risk Assessment: A FederatedLearning Approach
Besma Khalfoun, Sonia Ben Mokhtar, Sara Bouchenak,Vlad Nitu.
1
Abstract
Crowd sensing applications have demonstrated their usefulness in many real-life sce-narios (e.g., air quality monitoring, traffic and noise monitoring). Preserving theprivacy of crowd sensing app users is becoming increasingly important as the collectedgeo-located data may reveal sensitive information about these users (e.g., home, workplaces, political, religious, sexual preferences). In this context, a large variety of Lo-cation Privacy Protection Mechanisms (LPPMs) have been proposed. However, eachLPPM comes with a given set of configuration parameters. The value of these pa-rameters impacts not only the privacy level but also the utility of the resulting data.Choosing the right LPPM and the right configuration for reaching a satisfactory pri-vacy vs. utility tradeoff is generally a difficult problem mobile app developers haveto face. Solving this problem is commonly done by relying on a trusted proxy serverto which raw geo-located traces are sent and privacy vs. utility assessment is per-formed enabling the selection of the best LPPM for each trace. In this paper wepresent EDEN , the first solution that selects automatically the best LPPM and itscorresponding configuration without sending raw geo-located traces outside the user’sdevice. We reach this objective by relying on a federated learning approach. The eval-uation of EDEN on five real-world mobility datasets shows that EDEN outperformsstate-of-the-art LPPMs reaching a better privacy vs. utility tradeoff.
Keywords: Location Privacy, Crowd Sensing Applications, Protection Mechanism,Re-identification Attack, Mobility Data, Data utility, Federated Learning

1 Introduction
The wide propagation of connected devices (75 billion in 2025 as forecast by variousstudies1) equipped with increasingly rich sensory capabilities and connected to fastnetworks (e.g., 5G) have contributed to the apparition of a wide variety of crowd sens-ing applications [13]. These applications offer useful services to their users (e.g., trafficcongestion monitoring [5], noise level monitoring in urban areas [37], air quality mon-itoring [19] or assessing the radioactivity level near nuclear sites [12]). The principlebehind a crowd sensing application is that a set of (paid or volunteer) users carry adevice equipped with a GPS and an environmental sensor (e.g., an NO2 sensor), whichcould be their own smartphone or a dedicated device. Along their journey, the appli-cation collects timestamped, geo-located traces with the corresponding environmentalmeasurements (e.g., pollution measurements). Then, it periodically sends this data toa central server called the Mobile Crowd sensing Server (MCS), which aggregates thecollected data and provides updated maps to its clients (e.g., live pollution monitoringmaps). The downside of these applications is that the collected data may constitute aserious threat to the participants’ privacy if this data falls between the hands of curi-ous/malicious adversaries. Indeed, various studies have shown that location data mayleak sensitive information about their originating user [33, 61]. For instance, mobilitydata may very well reveal a user’s home and workplace, health status or even religiousor sexual preferences if the latter regularly visits health centers, worship places orlibertine places respectively [27, 21]. Furthermore, the disclosure of a user’s identityis also jeopardized by re-identification attacks, i.e., attacks where an anonymous mo-bility trace is re-associated to its originating user based on previously collected data[39, 53, 23]. For example, the journalists from The New York Times were able tore-identify and track the whereabouts of ex-president Trump from a dataset of morethan 50 billion location pings from more than 12 million user mobile devices [59].
To overcome the above threats, the research community has been actively propos-ing Location Privacy Protection Mechanisms (LPPMs). Examples of proposed LPPMsinclude Geo-indistinguishability [3], which enforces differential privacy [20] by addingspacial noise to a user’s GPS coordinates, Promesse [54], which removes places wherethe user stops for a significant period of time and Trilateration [29], which generatesdummy locations to obfuscate the user’s real location. In this context, a problem thatmobile app developers aiming at enforcing privacy-by-design have to solve is : ”howto objectively compare the privacy vs. utility tradeoff offered by differentLPPMs and choose the right one ?” For instance, how to decide whether anLPPM enforcing k-anonymity [57] (with a given value of k) is better than another oneenforcing ε-differential privacy [20] (with a given value of ε)? To answer this question,the regulator (e.g., the EU General Data Protection Regulation in article 35) requiresto carry out privacy risk assessment, which in our context translates into assessing
1https://www.statista.com/statistics/471264/iot-number-of-connected-devices-worldwide/
2
1 Introduction 3
which solution yields the smallest re-identification risk. In practice, solutions thathave been explored in the literature to select among a set of LPPMs generally rely onre-identification attacks [31, 56]. Specifically, these solutions apply various LPPMs ona given trace and choose the LPPM (and its corresponding configuration) that betterresists a given set of re-identification attacks [23, 53, 39]. The role of these attacksis to link anonymous traces to past user data. However, to reach this objective, theproposed solutions assume a trusted proxy server as existing re-identification attacksare centralized: they build user profiles using past unprotected mobility data and usethem to estimate to whom a given protected trace belongs to.
In this paper, we overcome this assumption and propose EDEN , the first effectiveprivacy-preserving solution for mobility data that performs re-identification risk as-sessment without requiring to send raw data to a remote server and that provides highdata utility. Specifically, EDEN operates in two phases: (1) a phase on which a re-identification risk assessment model called FURIA is periodically trained on the users’devices and (2) a second phase where the latest computed FURIA model is used alongwith utility metrics to choose the best LPPM (among a set of off-the-shelf LPPMsand corresponding configurations) each time a user wants to send a geo-located traceto the MCS. To avoid centralizing raw data in a trusted proxy server, we design FU-RIA using a Federated Learning (FL) paradigm [8]: a relatively new machine learningtechnique which proposes to distributively train the models right where the data iscreated, i.e., on the user mobile devices.
We extensively evaluate EDEN using three real-world mobility datasets. We com-pare the performance of EDEN , both in terms of privacy and utility to the one ofthree off-the-shelf LPPMs using three configurations for each LPPM to cover the spec-trum from strong privacy guarantees (despite the resulting impact on data utility) tostrong utility objectives (with weaker privacy guarantees). For measuring the privacyoffered by EDEN , we implement three state-of-the-art re-identification attacks (i.e.,POI-attack [53], PIT-attack [23] and AP-attack [39]) and combine them in a single,stronger attack that relies on majority voting. This attack is run on the MCS (consid-ered as an adversary) and is different from the re-identification risk assessment modeltrained by EDEN . For measuring utility, we use two types of metrics: a quantitativemetric and a qualitative metric. The quantitative metric, i.e., area coverage, evaluateshow far the area covered by a protected mobility data overlaps with the one of the orig-inal data. The qualitative metric captures the degradation in pollution measurementstaken from a fourth real-world air pollution dataset [6]. An additional qualitativemetric is considered, i.e., range queries. It counts the number of users going throughregions. This metric is useful for analyzing traffic congestion in a city, and it is takenfrom a fifth cab drivers mobility dataset in the city of San Francisco. In addition tocomparing EDEN to state-of-the-art LPPMs, we consider two extreme solutions: aPrivacy Oracle, which knows the attack run by the MCS and chooses the best LPPMaccordingly and a Utility Oracle (referred to as NOBF in the paper), which sendspseudonymized raw data to the MCS. The results show that EDEN provides a bettertradeoff between privacy and data utility compared to individual LPPMs. To ease thereproducibility of our results, our code, the implemented LPPMs and attacks code aswell as the scripts used to run the experiments are available as open source 2.
The remaining of this paper is structured as follows. First, we present the necessarybackground and related work and illustrate our research problem in Section 2. Then,we describe the system model and an overview of our solution in Section 3. Further, in
2https://github.com/MobDataPriv/EDEN
2 Background and Related Work 4
Section 4, we present a detailed description of EDEN and FURIA. An experimentalevaluation of our solution is then presented in Section 5 and finally, we conclude thepaper in Section 6.
2 Background and Related Work
In crowd sensing applications, users contribute geo-located data, which contains theuser ID (e.g., the device MAC address), the user location (i.e., GPS latitude and lon-gitude), the time at which the data has been collected, and the actual environmentalmeasurement (e.g., explosion alert, NO2 measurements). Despite the pseudonymiza-tion of the user identity (i.e., replacing the user ID with a pseudonym) and techniquesto hide the IP address of the originating device (e.g., by using anonymous communica-tion protocols such as TOR [55]), sharing geo-located data may still leak informationabout users as discussed in the following section.
2.1 User Re-Identification Attacks
User mobility data is a fingerprint that can be used to perform user re-identificationattacks [18]. A user re-identification attack (or a de-anonymization attack) aims atassociating an anonymized (and/or obfuscated) mobility trace to its originating user,based on a previously collected background knowledge from which the attack builds aset of user profiles. Each time an anonymous mobility trace is received by the attacker,the latter tries to re-associate it to the closest previously built user profile. Various userre-identification attacks have been proposed in the literature. What distinguishes theseattacks is the way they represent user profiles. For instance, POI-attack [53], uses a setof Points Of Interest (POIs) to represent user profiles. POIs are locations where usersspend a significant amount of time such as at home. PIT-attack [23] uses MobilityMarkov Chains to synthesize mobility traces. In this attack, nodes represent POIswhile edges represent the transition probability between POIs. Finally, AP-attack [39]represents user profiles as a heatmap. A heatmap is an aggregate representation ofmobility data inspired by [46]. To construct the heatmap, first, the world map isdivided into cells (i.e., geographical regions) of relatively equal size. Then, for eachcell, the probability of visiting the cell for a mobility trace T is computed. Moreprecisely, it corresponds to the number of records in T present in the cell divided bythe total number of records in T . At the end, we obtain for each user, a probabilitydistribution of visited cells.
User re-identification attacks are generally used as a privacy metric to compareLPPMs. However, existing attacks are generally centralized as they need to collectpast users’ data to build user profiles. In this paper, we propose a federated way toconduct re-identification risk assessment for comparing LPPMs and thus choosingautomatically the right one, i.e., the one which passes the re-identification test.
2.2 Related Work on Location Privacy ProtectionMechanisms
Mitigating threats affecting location privacy has attracted the interest of many re-searchers. As a result, various Location Privacy Protection Mechanisms (LPPMs)have been proposed in the literature [1, 2, 29, 3, 54, 52]. An LPPM can be defined as

2 Background and Related Work 5
a function which takes as input one or multiple mobility records of a given user andproduces as output an obfuscated version of this data.
LPPMs can be classified in two categories according to the data they need toprotect a given mobility trace: (1) those that need knowledge about the mobility ofother users and (2) those that do not need any external knowledge. The first categoryof LPPMs leverage the mobility of other users either to obfuscate a mobility tracea way that makes it closer to the profile of another user than the originating user[38], this is known as a profile conversion technique, or to achieve formal guaranteessuch as k-anonymity [57, 1, 2]. The concept of k-anonymity is first introduced bySweeney [57]. It states that a user is hidden among at least k − 1 other users withsimilar properties. In the context of location privacy, this translates to cloak a givenuser exact location in a geographical zone (called cloaking region) where there are atleast k − 1 other users. Numerous LPPMs that enforce k-anonymity are proposedin the state-of-the-art, among them, CliqueCloak [25], Casper [44] which computecloaking regions on each geo-located point without considering a mobility trace as awhole. Alternatively, NeverWalkAlone [1] and its extension W4M (Wait for Me) [2]extend the concept of k-anonymity to k-δ-anonymity. They ensure that a user mobilitytrajectory is always hidden among k− 1 other trajectories inside a cylindrical volumeof radius δ where users move. Furthermore, solutions enforcing k-anonymity have beencriticized as sensitive information can be leaked if the k users are co-located in thesame semantically sensitive location (e.g., a hospital). For this reason, l-diversity ingeneral and location diversity in particular are introduced [62, 36]. The latter statesthat in a given cloaking region, there should be at least l different semantic locations.One of the major limitations of these LPPMs is that they rely on a centralized trustedproxy server, since they need to access the overall raw data. Another limitation is thatthey lack an actual privacy risk assessment before sharing the data with the MCS.
In contrast, the second category of LPPMs are implemented on the user-side asthey do not need an external knowledge to protect a given trace. For instance, Huang etal. [29] propose Trilateration (TRL), a new way to achieve k-anonymity by generatingdummy location data on the user’s device. For each real location l of the user, itrandomly generates three locations l1, l2 and l3 in a range of r from the real one. Thefake locations are sent to the MCS instead of the real position. Dwork introduces theconcept of differential privacy as a formal privacy guarantee [20] for database systems.The idea is that an aggregate result over a database is not affected by the presence orabsence of a single element in the table. Andres et al. [3] adapt this concept in thecontext of location privacy. They propose Geo-indistinguishably (Geoi), a mechanismthat perturbs the spatial information of data by adding Laplacian spatial noise to eachGPS coordinate. The amount of noise is calibrated by a privacy budget ε (the lowerthe ε, the higher the privacy level). This perturbation is done on the user-side withoutthe implication of any external proxy server. In the same direction, PROMPTS [10],exploits the coresets theory, another specific privacy guarantee that helps users toevaluate their privacy exposure locally, before sharing their geo-located data. Promesse(PROM ) [54] uses a speed smoothing technique to erase user POIs from the mobilitytrace. This ensures that spatiotemporal points in the obfuscated mobility trace areequidistant thanks to a parameter α which tunes this distance. FOUGERE includesseveral LPPMs that can be chosen by the users [41], but it does not provide anymeans for selecting the most appropriate LPPM nor its proper configuration. Thismay result in under protected data, or in low data utility. Finally, these solutionsare applied blindly without any privacy risk assessment. Thus, other existing systemsaim at combining existing LPPMs to propose a personalized protection approach with

2 Background and Related Work 6
privacy risk assessment. For example, MooD is a user-centric fine-grained protectionsystem based on the combination of multiple off-the-shelf LPPMs to protect a mobilitydataset in front of re-identification attacks [31]. ALP is a framework that enables anautomatic configuration of the LPPM parameters using optimization algorithms suchas simulated annealing [51]. PULP is another system, which automatically configuresLPPMs according to users’ objectives in terms of privacy and utility [14]. For thesame purpose, authors in [56] leverage machine learning techniques (i.e., GANs) toobfuscate mobility data. They use a generator network to produce noise for mobilitydata perturbation, and a discriminator classifier to evaluate the re-identification of theperturbed data. However, these systems follow a centralized approach with a trustedthird party since they need to access the overall raw data. In contrast, EDEN doesnot require a trusted third party, and finds for each mobility data the best LPPM andits configuration among various LPPMs, thanks to FURIA risk and utility assessment.
2.3 Problem Illustration
Consider an app developer, say Bob, who has to integrate privacy-by-design in a crowdsensing application. Bob needs to choose an LPPM with the appropriate configurationto protect users’ mobility data before sharing it with a MCS. Bob does not want toimplement yet another LPPM as there already exists a variety of LPPMs proposed bythe research community. However, the actual level of privacy offered by each LPPMand the impact of the latter on data utility can dramatically vary according to howthese LPPMs are configured.
0 20 40 60 80 100Utility (%)
0
20
40
60
80
100
Priv
acy
(%)
NOBF Geoi-0.005 TRL-2km PROM-100m Privacy Oracle
Fig. 1: Impact of LPPMs on Privacy vs. Utility on PrivaMov Dataset illustra-tion.
To better illustrate this problem, we perform (on behalf of Bob) an experimenton the PrivaMov Dataset [45], a real world mobility dataset. In this experiment, wecompare the privacy vs. utility tradeoff offered by three state-of-the-art LPPMs :Geo-Indistinguishability[3], Trilateration[29] and Promesse[54] noted Geoi, TRL andPROM, respectively. In order to find a satisfactory compromise between privacy andutility, we configure each of these LPPMs for enforcing an average privacy level, i.e., ε= 0.005, r = 2km and α = 100m for Geoi, TRL and PROM, respectively. We providemore details about further configurations in Section 5.3.4. In addition to these threeLPPMs, we also evaluate two alternatives: NOBF, which represents pseudonymizedraw data without any additional obfuscation and Privacy Oracle, which is an oracle

3 System Model 7
that selects the best LPPM for each individual trace (the LPPM which prevents re-identification and maximizes the data utility).
We measure privacy as the ratio of user mobility data which is not re-identified bythe MCS-side attacker over the overall mobility data. The attacker applies a majorityvoting over three state-of-the-art attacks, namely, (1) POI-Attack [53], (2) PIT-Attack[23] and (3) AP-Attack [39]. We refer to this attack as Mv-Attack. On the otherhand, we evaluate utility with the Area Coverage (AC) metric, which computes theoverlap between the obfuscated and the original mobility trace using F-score [51]. InFigure 1, an aggregate value of AC is depicted in the x-axis. It is computed as inEquation 1; where F =
(0 0.25 0.5 0.75 1
)refers to the vector of utility factors and
U =(u0 u0.25 u0.5 u0.75 u1
)refers to the data proportion with AC = 0 or AC ∈
]0 0.25] , ]0.25 0.5] , ]0.5 0.75] and ]0.75 1] of the raw mobility data, respectively.
Utility = FT .U (1)
Note that Equation 2 is verified: ∑i∈F
ui = 1 (2)
If no LPPM protects against Mv-Attack, the Privacy Oracle chooses to drop thedata instead of sending it to the MCS. Privacy Oracle constitutes the best choice thatcan be done (from a privacy perspective) if Mv-attack is known by the defender and ifall the data is centralized in a trusted proxy server. On the other side of the spectrum,NOBF is the best choice that can be done to preserve the data utility.
Results are depicted in Figure 1. In these results, we can observe that the PrivacyOracle protects 100% of the data and provides 65% of AC, which is better both interms of privacy and data utility compared to individual LPPMs. In practice, thePrivacy Oracle finds an LPPM resisting the attack for 96% of the traces and drops4% of the remaining traces.
Therefore, we conclude that a Privacy Oracle has the potential to outperform allother state-of-the-art LPPMs in terms of privacy vs. utility tradeoff. However, thelatter assesses the privacy using the Mv-Attack, which needs to centralize the raw datato a proxy server. The goal of this paper is to design a solution that is as close aspossible to the Privacy Oracle without centralizing the raw data in a proxy server.
3 System Model
In this section, we first introduce federated learning (Section 3.1). Then, we providean overview of EDEN (Section 3.2) and present the threat model (Section 3.3).
3.1 Overview of Federated Learning
Federated learning (FL) is a machine learning paradigm where many clients (i.e., work-ers) collaboratively train a model under the coordination of a central server, also knownas the federator [40]. Each client’s raw data is stored locally at the client side, andit is not transmitted to any other party. In a traditional FL protocol, the federatorserver initializes the global model and sends it to the clients. A client trains his localmodel based on his local data, and then the model gradients (i.e., weights) from theindividual models are sent to the central server, that aggregates the gradients and up-dates the global model. The latter is sent back to the clients’ devices and the trainingprocess can then be repeated until a desired level of accuracy is attained. It also exists

3 System Model 8
more advanced FL protocols where a central server is not required and the model isdecentralized over multiple parties where a Secure Multiparty Computation (SMC)is made to update the global model [30]. Nowadays, federated learning has severalapplications such as Google Gboard [28, 16, 63].
3.2 EDEN Overview
EDEN is a user-side mobility data protection system for crowd sensing applications,which operates as depicted in Figure 2. Let us consider Alice (depicted in the centerof the figure), a participant of a crowd sensing campaign. Along her journey, Alicecollects geo-located environmental measurements. At a given point in time, the crowdsensing application decides to send the collected data (depicted at the bottom of thefigure) to the MCS. Before sending this data to the MCS, EDEN automaticallysanitizes the data without the implication of Alice. It applies a given LPPM amonga set of available choices. For each LPPM, various configurations are considered byEDEN going from configurations that enforce strong privacy to configurations thatrather try to preserve data utility.
Specifically, EDEN applies each LPPM to the raw trace and evaluates both :(1) the re-identification risk of the trace using this LPPM and (2) the correspondingdata utility. For evaluating the re-identification risk, EDEN uses FURIA, a federatedlearning model, which is trained as depicted in the left part of Figure 2. When Alice’sdevice fulfills a set of predefined requirements to participate in the FURIA trainingprocess (e.g., her device is idle, charging and connected to WiFi), it downloads froma server called the FURIA Master Server, the latest FURIA global model, trains themodel using its locally collected data and sends the updated model back to the server.Once the server receives a predefined number of user responses, it aggregates theminto a new version of FURIA global model. This way, FURIA continuously learns anddynamically improves its global knowledge with new discriminating mobility patternsof users. The training process of FURIA is performed by night independently fromthe process of protecting mobility traces using EDEN which is depicted on the rightpart of Figure 2. In this part of the figure, EDEN prepares batches of protectedmobility data and sends a batch periodically (if any) to the MCS. This batch of geo-located data has been protected by using an LPPM for which the re-identification riskassessment performed using FURIA passed; i.e., FURIA could not re-identify Aliceas the originating user of this trace. If two LPPMs (or two variants of the sameLPPM) pass the risk assessment, the one that has the best data utility is chosen. Ifno LPPM passes the FURIA risk assessment, then EDEN makes a decision accordingto a given configuration policy. For instance, it would drop the data if it is configuredwith a conservative policy. We describe other policies than the conservative one inSection 4.2.1. In EDEN , The configuration policy choice can be set by the participantaccording to her preferences.
In this paper, we focus on three state-of-the-art LPPMs each having three config-urations and we use three utility metrics as further described in Section 5. Though,EDEN is not tight to a given set of LPPMs or utility metrics. More LPPMs, withtheir corresponding configurations and more utility metrics whether quantitative orapplication-dependent can be easily integrated in EDEN .

3 System Model 9
AliceFURIAMaster Server
MCS Server
UPDATING FURIA USING EDEN
Pollution Map
Model Update
FURIA ModelTraining FURIA
Protected Data
Raw Data
Fig. 2: System Architecture
3.3 Threat Model
As depicted in Figure 2, EDEN uses FURIA to assess the re-identification risk of aprotected trace. FURIA is designed following a traditional federated learning protocolas presented in Section 3.1 using a master server. The communication channels be-tween the clients and this server are encrypted. This server never accesses users’ rawdata, but rather aggregates model updates coming from various users.
Furthermore, we assume that users’ devices are trusted, and that the data pro-tected by EDEN is sent anonymously to the MCS (e.g., using an anonymous com-munication protocol such as TOR [55]). We consider the MCS as an adversary andwe assume it to be honest-but-curious (i.e., semi-honest [50]). Specifically, the MCScollects and processes geo-located environmental measurements to produce aggregatedata to its clients. It performs this task honestly, i.e., without deleting or altering thereceived data. However, it is curious because he may exploit the received data to learnvaluable private information which may interest him or any third party (to whom hemight sell the data for advertising purposes). For instance, the adversary may con-duct inference attacks on the received data and consequently reveal the user identityor other sensitive attributes (e.g., POIs, social links, etc.), even if the participant isusing the application anonymously [32]. In particular, we assume that the MCS triesto link the received data to previous user profiles he has built from leaked backgroundknowledge. To reach this objective, we consider that the MCS implements the latestavailable user re-identification attacks he finds in the literature. In this paper, weassume that the MCS combines the three attacks described in Section 2, namely, AP-Attack, POI-Attack and PIT-Attack. The attacker runs these attacks by relying onuser profiles built from past mobility data of the participating users. Then upon re-ceiving a trace protected by EDEN , it runs the three attacks and performs a majorityvoting between the predicted values of these attacks and returns the identity label thatreceived more votes. Finally, complementary techniques can be applied with EDENin order to counter attacks that attempt to leak information from model updates infederated learning [26, 48], or to counter malicious users that poison data to introduce

4 EDEN Detailed Description 10
a backdoor into the global model [22, 4].
4 EDEN Detailed Description
In this section, we dive into a detailed description of how the re-identification riskassessment is done with FURIA and how mobility traces are protected with EDEN.
4.1 Re-identification Risk Assessment with FURIA
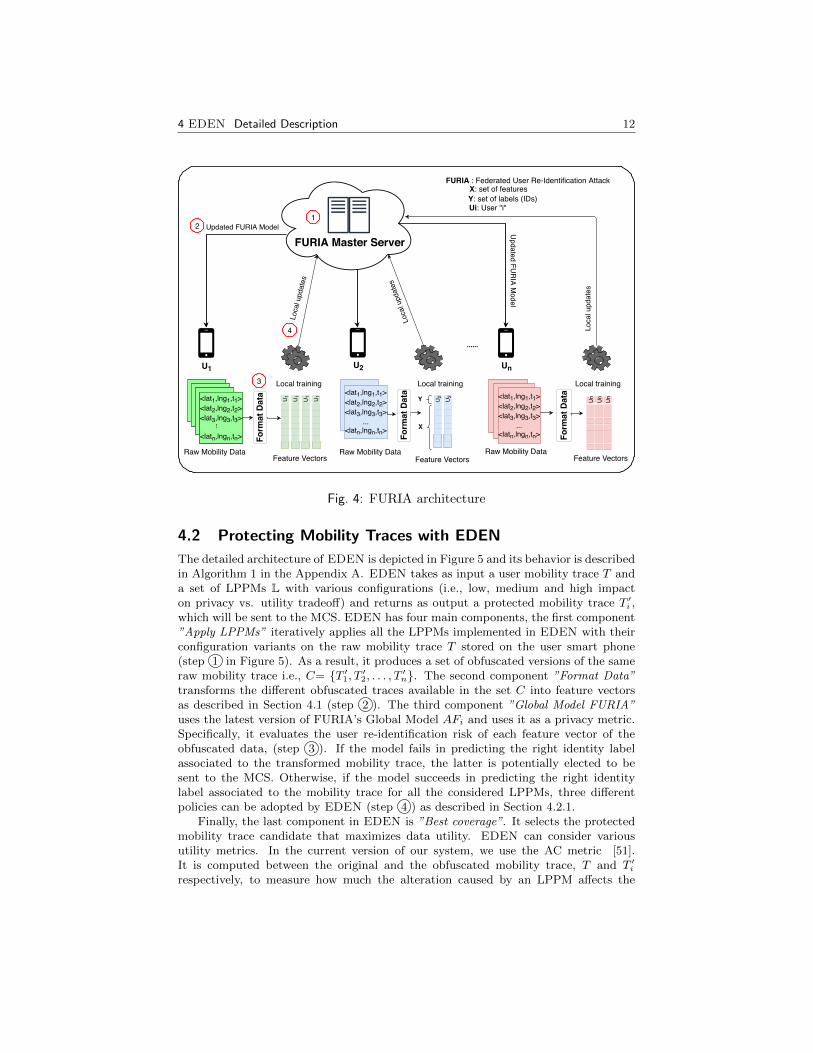
FURIAS’s global model is a crucial part of our solution. It applies federated learningto build a re-identification risk assessment model. The latter learns discriminatingmobility patterns that uniquely identify users and help our system to assess LPPMsin a privacy-preserving way. As depicted in Figure 4, FURIA involves two par-ties: (1) mobile user devices where raw mobility data is stored and where modelupdates are computed, (2) the FURIA Master Server where model updates pro-vided by various users are aggregated. FURIA operates as follows. First, the FURIAMaster Server initializes a classification algorithm with random values. In this pa-per we use Logistic Regression, a simple yet effective classification model that satisfiesvery well our objectives, after an empirical experiment. Precisely, we compare threemethods of classification, namely, Logistic Regression (LR) [42], Random Forest (RF)[11] and a multi-layer perceptron Neural Network (NN) [47]. Figure 3(a) shows there-identification rate over three unprotected datasets: Geolife, MDC and PrivaMov,described in Section 5.2. LR is slightly better than RF with +3% of re-identificationrate in Geolife and both LR and RF are better than NN with up to +11%. Thus, theretained model for the rest of our work is LR.
The FURIA Master server sends this model to all participants (step 1 and 2in Figure 4). This model is denoted as AF0 (Attack Federated). Each participant Uj
transforms its raw mobility data of the day to feature vectors (step 3 ) and trains themodel AF0 locally on the generated feature vectors. Once all participants have finishedthe first learning round, they send their local updates (i.e., gradients) of their currentlocal models to the FURIA Master Server, (step 4 ). Upon receiving model updates,the FURIA Master Server aggregates users’ gradients and produces an updated model,denoted AF1, ready to use at the following day. This process is iteratively doneand generally takes place at night time in order to avoid any interference with otherapplications running on the user’s device. Indeed, model updates are computed whenthe user’s device is idle, plugged in and connected to WIFI, which is generally the caseat night time. FURIA processing is inspired by active/online learning where dailymobility data is unrolling between the train set of the current learning round and thetesting set of the following one.
In FURIA, three types of features are considered: (1) spatial features (2) temporalfeatures and (3) aggregated features. Spatial features. To synthetically capturespatial information, records (i.e. lat and lng) are projected on a heatmap. A heatmapis a set of cells of equal size. For each cell, the proportion of mobility records in agiven trace T that belongs to that cell is computed. This corresponds to the cell visitrate. Temporal features. The temporal information is considered to differentiatesimilar mobility patterns between day-night shifts, e.g., a user living near the workingplace of another user. If temporal information is not taken into account, the abovetwo users would have similar heatmaps but at different times of the day. In FURIA weuse a simple, yet effective temporal information, which is the average time of the day

4 EDEN Detailed Description 11
of all the records in a given trace T . This is convenient in the case of crowd sensingapplications, where mobility traces are generally in the order of minutes or hourslength without exceeding a day. Aggregated features. Other types of informationare extracted to enrich the user mobility profile. For instance, the number of mobilitydata records available in the trace T is considered. This allows to represent serviceusage intensity. We also extract the centroid of the mobility trace T (i.e., centroid’slatitude and centroid’s longitude), to capture a central position of the user’s mobilityin a map.
The spatial features are usually considered in related work [39, 35, 46]. In additionto this type of features, we explore several other types of features (e.g., temporal andaggregated features) and evaluate their benefits for a user re-identification attack, aspresented in Figure 3(b). The results show that temporal and aggregated featuresimprove the re-identification rate of the attack. Specifically, the use of combinedspatial, temporal and aggregated features increases the re-identification success ratewith +2%, +7% and +8% in comparison to the use of only spatial features in Privamov,Geolife and MDC datasets, respectively.
Privamov Geolife MDC0
20
40
60
80
100
Re-id
entif
icatio
n ra
te (%
) 73%
47%
41%
73%
44%
39%
69%
33% 35%
LR RF NN
(a) Model variation
Privamov Geolife MDC0
20
40
60
80
100Re
-iden
tifica
tion
rate
(%) 71
.0%
40.0
%
33.0
%
71.0
%
44.0
%
33.0
%
73.0
%
47.0
%
41.0
%
Spatial featuresSpatio-Temporal featuresSpatio-Temporal and aggregate features
(b) Feature variation
Fig. 3: Empirical experiments.
4 EDEN Detailed Description 12
<lat1,lng1,t1><lat2,lng2,t2><lat3,lng3,t3>
<latn,lngn,tn>
...
Raw Mobility Data
......
<lat1,lng1,t1><lat2,lng2,t2><lat3,lng3,t3>
<latn,lngn,tn>
U2 Un
<lat1,lng1,t1><lat2,lng2,t2><lat3,lng3,t3>
<latn,lngn,tn> ...
<lat1,lng1,t1><lat2,lng2,t2><lat3,lng3,t3>
<latn,lngn,tn>
<lat1,lng1,t1><lat2,lng2,t2><lat3,lng3,t3>
...<latn,lngn,tn>
Un
Un
Un
Form
at D
ata
Local training
Raw Mobility Data
<lat1,lng1,t1><lat2,lng2,t2><lat3,lng3,t3>
...<latn,lngn,tn>
<lat1,lng1,t1><lat2,lng2,t2><lat3,lng3,t3>
<latn,lngn,tn>
...
<lat1,lng1,t1><lat2,lng2,t2><lat3,lng3,t3>
<latn,lngn,tn>
...
<lat1,lng1,t1><lat2,lng2,t2><lat3,lng3,t3>
<latn,lngn,tn>
...
Updated FURIA Model Updated FU
RIA M
odel
FURIA : Federated User Re-Identification AttackX: set of featuresY: set of labels (IDs)Ui: User "i"
Local training
Form
at D
ata
Local training
Feature Vectors
U1U1U1
U1
Feature Vectors
U2 U2Y
X
1
Loca
l upd
ates
Loca
l upd
ates
Loca
l upd
ates
FURIA Master Server
U1
3
2
Raw Mobility Data
Form
at D
ata
4
Feature Vectors
Fig. 4: FURIA architecture
4.2 Protecting Mobility Traces with EDEN
The detailed architecture of EDEN is depicted in Figure 5 and its behavior is describedin Algorithm 1 in the Appendix A. EDEN takes as input a user mobility trace T anda set of LPPMs L with various configurations (i.e., low, medium and high impacton privacy vs. utility tradeoff) and returns as output a protected mobility trace T ′i ,which will be sent to the MCS. EDEN has four main components, the first component”Apply LPPMs” iteratively applies all the LPPMs implemented in EDEN with theirconfiguration variants on the raw mobility trace T stored on the user smart phone(step 1 in Figure 5). As a result, it produces a set of obfuscated versions of the sameraw mobility trace i.e., C= {T ′1, T ′2, . . . , T ′n}. The second component ”Format Data”transforms the different obfuscated traces available in the set C into feature vectorsas described in Section 4.1 (step 2 ). The third component ”Global Model FURIA”uses the latest version of FURIA’s Global Model AFi and uses it as a privacy metric.Specifically, it evaluates the user re-identification risk of each feature vector of theobfuscated data, (step 3 ). If the model fails in predicting the right identity labelassociated to the transformed mobility trace, the latter is potentially elected to besent to the MCS. Otherwise, if the model succeeds in predicting the right identitylabel associated to the mobility trace for all the considered LPPMs, three differentpolicies can be adopted by EDEN (step 4 ) as described in Section 4.2.1.
Finally, the last component in EDEN is ”Best coverage”. It selects the protectedmobility trace candidate that maximizes data utility. EDEN can consider variousutility metrics. In the current version of our system, we use the AC metric [51].It is computed between the original and the obfuscated mobility trace, T and T ′irespectively, to measure how much the alteration caused by an LPPM affects the

4 EDEN Detailed Description 13
regions visited by a user (step 5 ). We provide more details about AC metric in Section5.3.1. Finally, the obfuscated mobility trace that better resists the re-identificationtest performed by FURIA and that has the best utility is sent to the MCS. The latterprocesses the received data and produces useful information to users (step 6 ).
4.2.1 EDEN Policies
Three policies are considered by EDEN if a mobility trace is re-identified by FURIA.The first policy is EDEN-pessimistic (EDEN-pes): this policy is the most conserva-tive policy as it simply deletes a mobility trace that FURIA is able to re-identify. Therationale behind this policy is that if FURIA is able to re-identify a mobility trace, anexternal attacker could very well reach the same result. The downside of this solutionis that it causes data loss from the application perspective.
The second policy considered in EDEN is EDEN-optimistic (EDEN-opt): anopposite solution to the previous one where the mobility traces that FURIA is ableto re-identify are also sent to the MCS without applying any LPPM or by applyinga default LPPM. We use this policy as a baseline to assess the impact of sendingtraces despite the red flag raised by FURIA regarding the re-identification risk ofsome mobility traces.
The third and last intermediary solution is EDEN-balanced where sending ordropping mobility traces is based on a local metric evaluating how a given mobilitytrace under consideration is similar to past mobility traces of the same user. Towardsthis purpose, we use the Topsoe divergence metric [15]. The latter is computed betweentwo probability distributions : (1) the heatmap of the current raw mobility trace Tand the heatmap corresponding to the past mobility data of the same user, which isstored on the user’s device, (see Equation 3). It is a derived symmetric version of theKullback Leibler divergence [15] which measures the information deviation betweenthe user past mobility and the current one. If the deviation is high (greater than athreshold empirically set to 0.8), the mobility trace is sent to the MCS, otherwise itwill be deleted. The set value of the threshold fits well the distribution of Topsoedeviation values.
dTopsoe(P,Q) =∑i
[Pi ln (
2Pi
Pi +Qi) +Qi ln (
2Qi
Pi +Qi)
](3)
<lat1,lng1,t1><lat2,lng2,t2><lat3,lng3,t3>
<latn,lngn,tn>
...
Glo
bal M
odel
FUR
IA<lat2,lng2,t2><lat3,lng3,t3>
<latn,lngn,tn>
...
L1(T)=T'1
Prot
ecte
d
<lat2,lng2,t2><lat3,lng3,t3>
<latn,lngn,tn>
L2(T)=T'2Ln(T)=T'n
Bes
t Cov
erag
e
<lat1,lng1,t1><lat2,lng2,t2>
...<latn,lngn,tn>
Not
pro
tect
ed
Form
at D
ata
User Device
App
ly L
PPM
s
Set of LPPMs
Ln
L1
L2
V1 Vn...
Feature vectors
MCS server
<T'i + Message>
1
< Information >
<lat1,lng1,t1><lat2,lng2,t2><lat3,lng3,t3>
<latn,lngn,tn>
EDEN
pol
icie
s
2 3
5
4
6
Fig. 5: EDEN architecture

5 Experimental Evaluation 14
5 Experimental Evaluation
We start this section by describing our experimental setup (Section 5.1), the mobilitydatasets we use to evaluate EDEN (Section 5.2), and our evaluation scenario (Sec-tion 5.3). Then, our evaluation answers the following questions: (1) how does EDENcompare to state-of-the-art LPPMs against an attack performed by the MCS? (Sec-tion 5.4); (2) what is the impact of EDEN on data utility compared to state-of-the-artLPPMs? (Section 5.5); (3) what is the privacy vs. utility tradeoff reached by EDEN(Section 5.6)? After answering these questions, our evaluation dives into a fine-grainedanalysis of EDEN and its configuration policies (Section 5.7) and finishes with therun-time overhead of EDEN and training FURIA (Section 5.8).
5.1 Experimental Setup
All the experiments related to the MCS attacker are carried out on a server running anUbuntu 14.04 OS with 50GB of RAM and 16 cores of 1.2GHz each. Both EDEN andFURIA are developed in Python using the Pytorch library 3. We used S2Geometrylibrary 4 for the decomposition of the map into cells of approximately equal size. Thecell edge length ranges from 212m to 296m . To accelerate the training process of ourfederated learning model, we use a machine with NVIDIA TESLA V100 GPU. Partic-ipating users are simulated by considering the data coming from real-world mobilitydatasets.
5.2 Mobility Datasets
In our experiments, we use three real-world publicly available mobility datasets witha summary given in Table 1. These datasets are : (1) Geolife [64] that contains themobility of users in the city of Beijing; (2) MDC [34] that contains the mobility ofusers in the city of Lausanne and Privamov [45] that contains the mobility of users inthe city of Lyon. In our experiments, we extract only the most active month (i.e., 30days) of each dataset for a fair comparison. In the context of location privacy, thesedatasets are used by many state-of-the-art LPPMs in order to assess the effectivenessof their approach [54, 31, 38, 53]. That is why, we decide to evaluate our approach onthese datasets to be in line with the community.
Tab. 1: Description of datasetsName Geolife MDC Privamov# users 42 144 48location Beijing Geneva Lyon# records 1,468,989 904,282 774,401area (km2) 16,808 41.37 47.87
3https://www.pytorch.org4https://www.s2geometry.io
5 Experimental Evaluation 15
5.3 Evaluation Scenario
We simulate mobile users that correspond to the users of the three datasets described inSection 5.2. We assume that the data corresponding to the first 15 days of each datasethave been leaked to the MCS. Using this data, the MCS builds user profiles. To be inthe same conditions as the adversary, the same data is used to train the first FURIAmodel (i.e., AF0). The remaining 15 days of each dataset is then used as a test set.Specifically, FURIA is inspired by active/online machine learning. Its training/testingmobility data is unrolled with a time window of 24 hours. For example, the 16th daymobility data is used to test AF0 and to train AF1, the 17th day mobility is used totest AF1 and train AF2 and so on. It means that our training set of mobility data isincremented day by day and many phases of test occur on each newly trained FURIAmodel AFi.
Moreover, as sharing data with the MCS in real time is energy-consuming [24, 60],we assume that the user’s crowd sensing application prepares batches of 30 minuteslength to be as close as real-time data transmission use cases, protects this data usingEDEN and periodically sends it to the MCS.
Upon receiving a geo-located trace, the MCS uses this trace to update its targetmap. Simultaneously, the MCS tries to re-associate the received trace to one of theuser profiles it has previously built. To this end, it uses Mv-Attack. We compareEDEN to cases where the considered LPPMs are applied blindly on user mobilitydata or assisted with a Privacy Oracle.
5.3.1 Utility Metrics
To evaluate the impact of EDEN and its competitors on the quality of the generateddata, there are two categories of utility metrics, proposed in the literature [52]. (1)Data-centric or quantitative utility metrics which measure the distortion between theoriginal and the obfuscated mobility data. Examples of such metrics include spatialdistortion [54], spatiotemporal distortion [38] where a spatial error is computed undera temporal constraint and finally the AC metric [51]. In this paper, as previouslymentioned in Section 4.2, we use the AC metric. To recall, it computes the overlapbetween the obfuscated and the original mobility trace using the F-score. This metricis able to capture the degradation in data utility caused both by LPPMs that removedata points (e.g., PROM), and the degradation caused by LPPMs that add data pointsor move them spatially (e.g., TRL and Geoi). Thus, this metric can be used in variousapplications, such as in transportation mobile applications where a data analyst canuse the AC metric to adapt the availability of public transportation in areas accordingto visiting user density. The AC utility metric can also be used in the context of apandemic, where a non-infected user can be aware of an area that she visits at thesame time as other infected users.
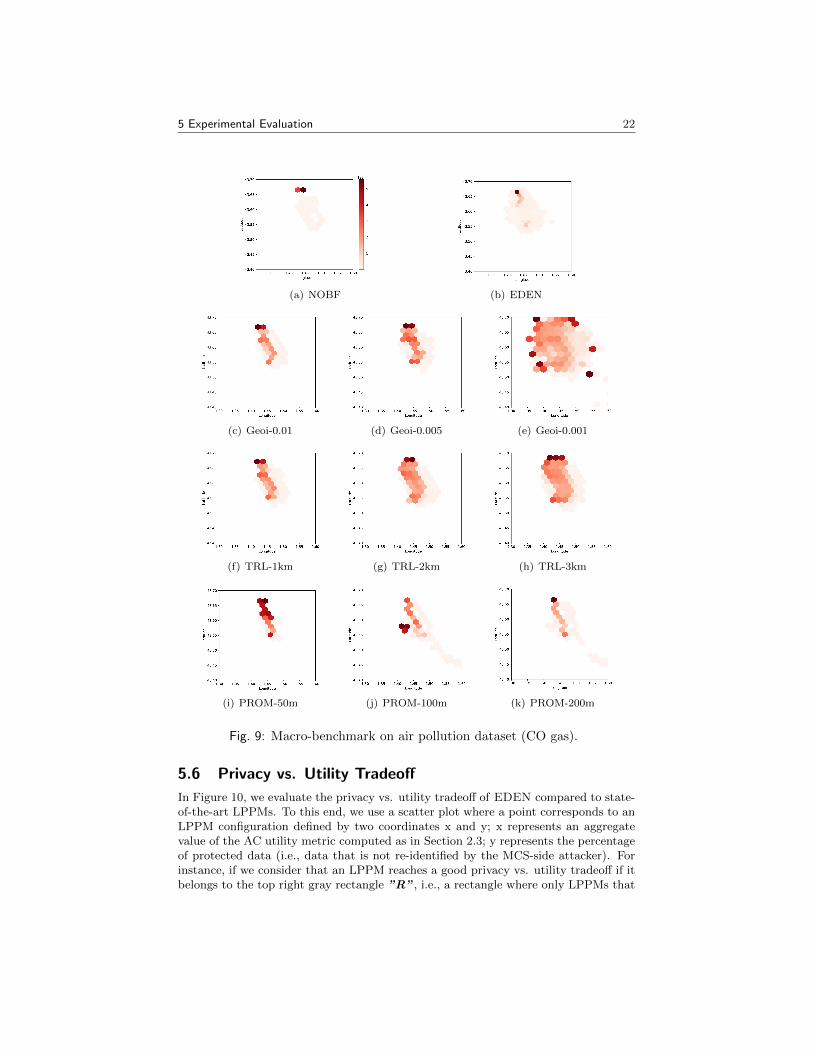
(2) Application-centric or qualitative utility metrics, which compare the result ofa given application before and after applying an LPPM for a specific application. Inthis paper, we consider two real-world use cases. In the first use case, we visualize theair pollution degradation map before and after the application of EDEN and state-of-the-art LPPMs on a crowd sensing air pollution dataset [6]. This map allows todetect areas where the level of gaseous pollutants is high (NO2, CO) (i.e., hotspots).This dataset is described in Section 5.5.2. In the second use case, we use rangequeries metric, a classical operation which compares the number of unique users who gothrough areas during a time window before and after obfuscation [54]. An illustrative

5 Experimental Evaluation 16
example is provided in Figure 6, where two range queries Q1 and Q2 of different radiusare performed (the temporal dimension is not represented). Before the obfuscationprocess, Q1 and Q2 return 3 and 1 users, respectively, whereas after obfuscation,Q1 and Q2 return 1 and 3 users. Thus, the utility is measured as the range querydistortion defined in [2]. In our example, the distortion of Q1 is |3−1|
3= 2
3and the
distortion of Q2 is |1−3|1
= 2. Then, the average query distortion is computed, i.e.,23+2
2≈ 1.333.
User A User B User C User D
Q1
Q2
(a) Before obfuscation
User A User B User C User D
Q1
Q2
(b) After obfuscation
Fig. 6: Illustrative example of range queries metric.
5.3.2 FURIA Configuration
To build FURIA’s global models, we opt for the multi-class logistic regression algo-rithm. The training of our global model is done over multiple rounds (Ri). Eachround represents a 1-day training, except the first round (R0) where a training set of15 days is used. The latter is considered as historical data stored on the user deviceand previously leaked to the adversary (i.e., Mv-Attack has access to 50% of the mo-bility dataset to construct user profiles). Thus, we decide to start the training processwith the same knowledge of the adversary to be in the same conditions. We assumethat users train the model at the end of the day (every night) with the data collectedduring that day in order to prepare the model of the next day. Thus, the model isactively trained by incoming mobility data and improves its global view day by day.In each round, we run 100 epochs/user with a variable batch size. We tune the batchsize according to the number of collected traces per user participating in the givenround. In addition, we use the Stochastic Gradient Descent (SGD) algorithm with alearning rate of 0.001. These values are fixed after several experiments.
5.3.3 User Re-identification Attack Configuration
Mv-Attack is made by the combination of three state-of-the-art attacks, namely: AP-Attack [39], POI-Attack [53] and PIT-Attack [23]. By combining three state-of-the artattacks, we obtain an attack that is stronger than considering the attacks separatelyas the adversary gets more confidence about the result of the re-identification process.Each attack has a set of parameters, described below. POI-Attack and PIT-Attackhave two parameters for the extraction of POIs from mobility traces, [65]. These pa-rameters are the diameter of the clustering area and the minimum time spent inside a

5 Experimental Evaluation 17
POI. These parameters are respectively set to 500 meters and 5 minutes to accommo-date small traces. AP-Attack has a configuration parameter that corresponds to thesquare cell size. It was set to 800 meters (default value).
5.3.4 Competitors
To evaluate EDEN, we select three LPPMs from the state-of-the-art: (1) Geo-Indistinguishably(Geoi) [3], (2) Trilateration (TRL) [29] and (3) Promesse (PROM) [54]. We selectthese LPPMs because they can be run on the user side (i.e., without external knowl-edge) and they provide diverse guarantees: differential privacy, dummy-based obfusca-tion and POI erasure, respectively. These LPPMs are described in Section 2.2. EachLPPM has its own configuration parameters. These parameters have an impact onthe balance between privacy and data utility. In our experiments, for Geoi, we setthe privacy parameter ε to 0.01, 0.005 and 0.001. A lower value of ε leads to a higherlevel of noise added to mobility records and consequently ensures a higher privacyguarantee). For TRL, there is a circular region with a radius of r, that surrounds thereal location of the user. The chosen values of this parameter are 1km, 2km and 3km.A higher value of r generates a bigger region for location dummies and consequentlyensures a higher protection level. And finally, for PROM, which has a parameter αthat specifies the distance between two locations points, we set α to 50, 100 and 200meters. A higher value of α leads to a larger distance between locations in a mobilitytrace and thus ensures a higher protection level. However, the latter can cause seriousdata loss especially if a mobility trace is recorded in a short distance over a short pe-riod of time. In addition to the above three LPPMs and corresponding configurations,we also evaluate two baselines: a Utility-centric baseline, referred to as NOBF, whichcorresponds to sending the data to the MCS without obfuscation (i.e., sending raw,pseudonymized data); and a Privacy-centric baseline, referred to as Privacy Oracle.This baseline is only used in the evaluation of the privacy vs. utility tradeoff. Itrepresents a solution where the selection of the best LPPM is driven by the attackperformed by the adversary. As such, perfect privacy can be reached but the chosenLPPMs can still degrade data utility.
5.4 EDEN vs. Competitors
In this section, we evaluate the effectiveness of EDEN in terms of privacy, in compari-son to state-of-the-art LPPMs. For that purpose, we measure the data protection rateof EDEN ’s variants and its competitors against Mv-Attack. To recall from Section2.3, data protection rate is the percentage of mobility data that is not re-identified bythe MCS. Results are depicted in Figure 7. From this figure, we observe that on thePrivamov Dataset, (Figure 7(a)), 55% of the data sent without obfuscation (NOBF )is not re-identified by the MCS. This percentage is the same when Geoi-0.01 is usedand slightly increases when Geoi-0.005 and Geoi-0.001 are used, i.e., 56% and 64% ofprotected data, respectively. The most privacy-protective LPPMs from the literatureare TRL with an increased range r or PROM with a large distance α between pointsin the trajectory. The proportion of protected traces reach up to 74% when TRL-3kmis used and 91% when PROM-200m is used. In the case of EDEN , 85%, 86% and87% of protected mobility data are recorded with the optimistic, balanced and pes-simistic variants of EDEN , respectively. We notice that PROM-200m outperformsEDEN ’s variants with +5% on average, this is due to the fact that PROM is basedon the re-sampling of mobility traces by suppressing points. Thus, if a mobility trace
5 Experimental Evaluation 18
does not exceed 50m, 100m or 200m of traveling distance, the latter will be deleted.The deleted data is not sent to the MCS provider and is thus considered as protected.However, this dramatically degrades data utility as further discussed in Section 5.5.
In the Geolife Dataset, (Figure 7(b)), 61% of mobility data is naturally protectedagainst the Mv-attack. The application of Geoi and TRL with their different con-figurations does not improve the protection rate compared to the baseline. UsingPROM-50m, PROM-100m and PROM-200m increases the protection rate with +4%,+6% and +10%, respectively. This is also due to the suppression of chunks where themobility does not exceed 50m, 100m, or 200m in a laps of 30 minutes. On this dataset,using EDEN significantly improves the data protection rate reaching 87 % and 90% ofprotected mobility data with EDEN-balanced and EDEN-pes, respectively. Finally, inthe MDC Dataset, (Figure 7(c)), 68 % of the mobility data is naturally protected. Theapplication of EDEN ’ variants improves the protection rate with +10% on averagecompared to the NOBF baseline. This result has the same trend for the other LPPMsexcept with promesse (PROM-50m, PROM-100m and PROM-200m) which providesa higher protection rate (+4 % in average). This result is due to the suppression ofmobility traces.
Here, we notice that PROM-50m provides a better protection with the MDCdataset in comparison with Privamov and Geolife datasets. MDC involves 144 usersin a quite small area (around 41 km2). Such a high population density naturallyreduces user uniqueness which, thus, enables higher protection. In contrast, the Pri-vamov dataset has three times less users than MDC, and the Geolife dataset has only42 users in a large geographical area (16,808 km2). This makes users in these twodatasets more distinguishable and, thus, harder to protect.
5.5 Impact of EDEN on Data Utility
As described in Section 5.3.1, we measure the data utility using two types of utilitymetrics : a quantitative metric which is AC metric (Section 5.5.1) and a qualitativemetric where we capture the degradation in pollution measurements taken from a real-world air pollution dataset [6] (Section 5.5.2). In addition, we measure the numberof cab drivers going through regions taken from a real-world mobility dataset [49](Section 5.5.3).
5.5.1 Utility Evaluation Using AC Metric
In Figure 8, we evaluate the data quality of sent/not sent data to the MCS (theprivacy dimension is not considered in this figure). In this figure, an AC equal to 0corresponds either to the data deleted by the LPPM (e.g., in the case of promesse)or to protected data that has no intersection with the original data. Further, we splitArea Coverage in four intervals. The best LPPMs are solutions that maximize AC inthe interval [0.75, 1] while minimizing the data loss, i.e., AC = 0.
In the Privamov Dataset, we notice that EDEN’s heuristics produce a balanceddata quality. Specifically, EDEN-opt, EDEN-balanced and EDEN-pes loose an averageof 21.4 % of mobility data and produce an average of 46 % of the generated data withan AC ¡ 0.75. And finally, an average of 32 % of the generated mobility traces hasan utility value greater than 0.75. However, PROM with its different configurationshas predominately darker bars. Specifically, with PROM-100m and PROM-200m,respectively, 50 % 74 % of the generated mobility data has AC = 0. Promesse choosesto not share with the MCS a large proportion of the generated data. In contrast,

5 Experimental Evaluation 19
NOBF
Geoi
-0.0
1
Geoi
-0.0
05
Geoi
-0.0
01
TRL-
1km
TRL-
2km
TRL-
3km
PROM
-50m
PROM
-100
m
PROM
-200
m
EDEN
-opt
EDEN
-bal
ance
d
EDEN
-pes
LPPMs
0
20
40
60
80
100
Data
pro
tect
ion
rate
(%)
55%
55%
56%
64%
59%
68% 74
%
70%
80%
91%
85%
86%
87%
(a) Privamov
NOBF
Geoi
-0.0
1
Geoi
-0.0
05
Geoi
-0.0
01
TRL-
1km
TRL-
2km
TRL-
3km
PROM
-50m
PROM
-100
m
PROM
-200
m
EDEN
-opt
EDEN
-bal
ance
d
EDEN
-pes
LPPMs
0
20
40
60
80
100
Data
pro
tect
ion
rate
(%)
61%
60%
60%
59% 61%
59%
60% 65
% 67% 71
%
69%
87% 90
%
(b) Geolife
NOBF
Geoi
-0.0
1
Geoi
-0.0
05
Geoi
-0.0
01
TRL-
1km
TRL-
2km
TRL-
3km
PROM
-50m
PROM
-100
m
PROM
-200
m
EDEN
-opt
EDEN
-bal
ance
d
EDEN
-pes
LPPMs
0
20
40
60
80
100Da
ta p
rote
ctio
n ra
te (%
)
68%
69%
70%
79%
72% 77
% 80%
81% 84
% 87%
77%
78% 80%
(c) MDC
Fig. 7: Mv-Attack evaluation on EDEN vs. LPPM competitors.
the data chosen to be shared closely mirror the original mobility data: up to 65 % ofprotected mobility data by PROM-50m has an AC ¿ 0.75. Geoi and TRL degradethe quality of almost all generated data. Specifically, in Geoi-0.01, Geoi-0.005, Geoi-0.001, an average of 92 % of the resulting mobility data has an AC ¡ 0.75. Even worstwith TRL where an average of 95 % of mobility data have an AC ¡ 0.5.
In the Geolife Dataset, the difference between EDEN’s policies is more prominent.The data loss is reduced from 41 % in EDEN-opt to around 10 % in EDEN-pes. Morethan 79 %, 58 % and 48 % of the data generated by EDEN-opt, EDEN-balanced andEDEN-pes, respectively, have an AC ¿ 0.75. However, PROM with 50m, 100m and200m cause a data loss of 10 %, 16 % and 25 %, respectively. The remaining data(i.e., 85 %, 76 % and 62 %) have an AC ¿ 0.75 of the original data. In this dataset, weobserve that PROM has a better AC than EDEN . The reason for this is that EDENhas better results in terms of privacy in this dataset. Finally, Geoi and TRL withtheir different configurations generate on average 89 % and near 98 % of mobility datawith an AC ¡ 0.75. Only 26 % of the generated data by Geoi-0.01 has an AC ¿ 0.75.
In the MDC Dataset, Unlike PROM with its different configurations which causes32 %, 41 % and 50 % of data loss, EDEN’s policies reduce these amounts to 7 %, 8% and 10 % with EDEN-opt, EDEN-balanced and EDEN-pes, respectively. EDEN’sheuristics outperform all other LPPMs in terms of AC. It protects an average of 67% of all data with AC ¿ 0.75 in comparison to an average of 0 %, 14 % and 39 % ofthe data obfuscated by TRL, Geoi and PROM, respectively.

5 Experimental Evaluation 20
5.5.2 Macro-benchmark on Air Pollution Measurements
We study the impact of LPPMs on quality of air pollution data using a dataset [6]. Inaddition to mobility data, two application-specific measurements are collected : theconcentration of NO2 and CO. This dataset involves 13 metropolitan bikes whichhave been equipped with pollution monitoring sensors for a duration of 112 days.
We compute the average CO measures over the duration when the NO2 value isabove 40µg/m3 which is the toxicity threshold as defined by the WHO5.
In Figure 9, we show the average CO measurement results when using the raw data(NOBF baseline), and after the application of EDEN and its LPPM competitors. Wecan observe that Geoi and TRL spread the measurements and, as the noise or therange increases, they create additional hotspots, i.e., areas where the CO is high. Theapplication of PROM-50m creates around 6 new hotspots where the level of CO isnow above the toxicity threshold. Thus, although the good privacy vs. utility tradeoffprovided by PROM-50m on synthetic mobility data (shown in Section 5.6), includingthe CO measurements yields to a poor performance. The use of PROM-100m can beharmful to public health because it eliminates existing high pollution hotspots fromthe original data. However, the application of EDEN is able to closely mirror the COmeasurements of NOBF; only one hotspot is missed.
NOBF
Geoi
-0.0
1
Geoi
-0.0
05
Geoi
-0.0
01
TRL-
1km
TRL-
2km
TRL-
3km
PROM
-50m
PROM
-100
m
PROM
-200
m
EDEN
-opt
EDEN
-bal
ance
d
EDEN
-pes
LPPMs
0
20
40
60
80
100
Mob
ility
data
util
ity (%
)
AC ∈ [0.75 1]AC ∈ [0.5 0.75]
AC ∈ [0.25 0.5] AC ∈ [0 0.25]
AC = 0AC ∈ [0.75 1]AC ∈ [0.5 0.75]
AC ∈ [0.25 0.5] AC ∈ [0 0.25]
AC = 0
(a) PrivaMov
NOBF
Geoi
-0.0
1
Geoi
-0.0
05
Geoi
-0.0
01
TRL-
1km
TRL-
2km
TRL-
3km
PROM
-50m
PROM
-100
m
PROM
-200
m
EDEN
-opt
EDEN
-bal
ance
d
EDEN
-pes
LPPMs
0
20
40
60
80
100
Mob
ility
data
util
ity (%
)
AC ∈ [0.75 1]AC ∈ [0.5 0.75]
AC ∈ [0.25 0.5] AC ∈ [0 0.25]
AC = 0AC ∈ [0.75 1]AC ∈ [0.5 0.75]
AC ∈ [0.25 0.5] AC ∈ [0 0.25]
AC = 0
(b) Geolife
NOBF
Geoi
-0.0
1
Geoi
-0.0
05
Geoi
-0.0
01
TRL-
1km
TRL-
2km
TRL-
3km
PROM
-50m
PROM
-100
m
PROM
-200
m
EDEN
-opt
EDEN
-bal
ance
d
EDEN
-pes
LPPMs
0
20
40
60
80
100
Mob
ility
data
util
ity (%
)
AC ∈ [0.75 1]AC ∈ [0.5 0.75]
AC ∈ [0.25 0.5] AC ∈ [0 0.25]
AC = 0AC ∈ [0.75 1]AC ∈ [0.5 0.75]
AC ∈ [0.25 0.5] AC ∈ [0 0.25]
AC = 0
(c) MDC
Fig. 8: Impact of EDEN vs. LPPM competitors on the utility of the mobilitydata using AC metric.
5.5.3 Macro-benchmark on the number of cab drivers in San Francisco city
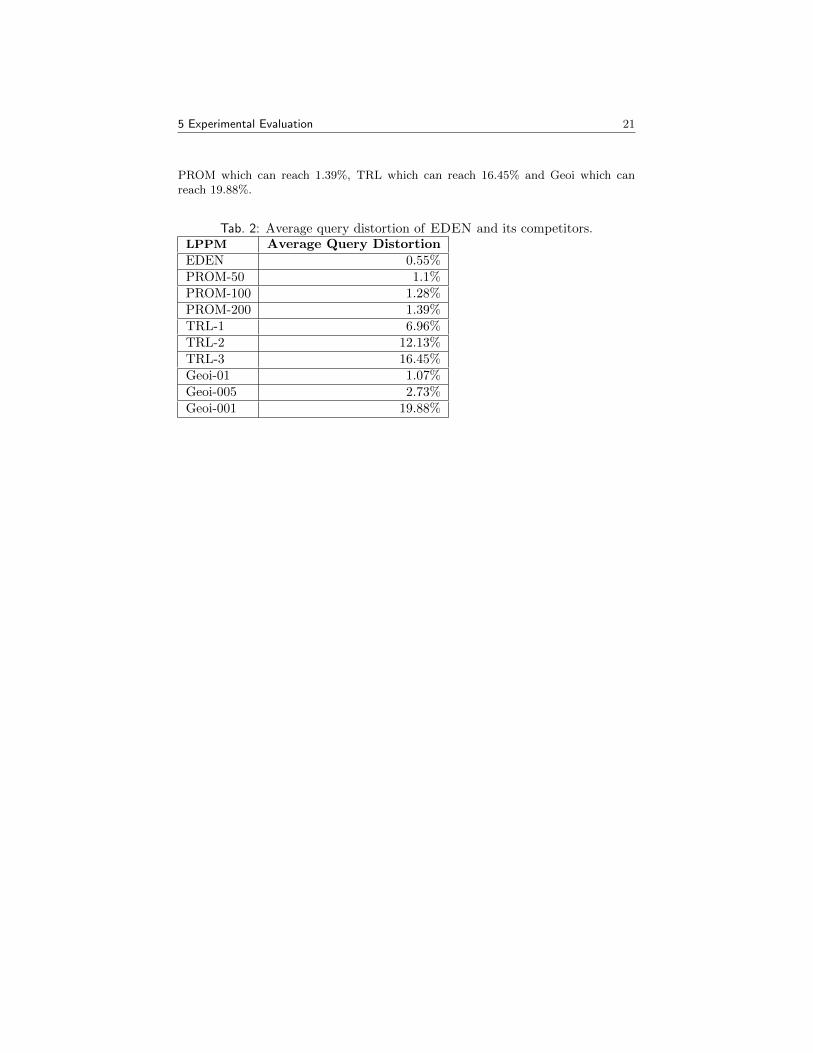
We study the impact of EDEN and LPPM competitors on the mobility of 50 cabdrivers from the Cabspotting dataset [49]. The objective, for example is to find bot-tleneck locations where cab drivers go through in the city of San Francisco. For thatpurpose, we use range queries metric, previously defined in Section 5.3.1. It countshow many unique users cross an area during a time window. We choose time windowsranging from 2 hours to 8 hours and circle areas whose radius range from 500m to5,000m. We report about the average query distortion in Table 2, which is the aver-age distortion over 1,000 randomly generated queries. The results show that EDENprovides the smallest average distortion with 0.55% in comparison to, respectively,
5https://www.who.int/fr/news-room/fact-sheets/detail/ambient-(outdoor)-air-quality-and-health
5 Experimental Evaluation 21
PROM which can reach 1.39%, TRL which can reach 16.45% and Geoi which canreach 19.88%.
Tab. 2: Average query distortion of EDEN and its competitors.LPPM Average Query DistortionEDEN 0.55%PROM-50 1.1%PROM-100 1.28%PROM-200 1.39%TRL-1 6.96%TRL-2 12.13%TRL-3 16.45%Geoi-01 1.07%Geoi-005 2.73%Geoi-001 19.88%
5 Experimental Evaluation 22
(a) NOBF (b) EDEN
(c) Geoi-0.01 (d) Geoi-0.005 (e) Geoi-0.001
(f) TRL-1km (g) TRL-2km (h) TRL-3km
(i) PROM-50m (j) PROM-100m (k) PROM-200m
Fig. 9: Macro-benchmark on air pollution dataset (CO gas).
5.6 Privacy vs. Utility Tradeoff
In Figure 10, we evaluate the privacy vs. utility tradeoff of EDEN compared to state-of-the-art LPPMs. To this end, we use a scatter plot where a point corresponds to anLPPM configuration defined by two coordinates x and y; x represents an aggregatevalue of the AC utility metric computed as in Section 2.3; y represents the percentageof protected data (i.e., data that is not re-identified by the MCS-side attacker). Forinstance, if we consider that an LPPM reaches a good privacy vs. utility tradeoff if itbelongs to the top right gray rectangle ”R”, i.e., a rectangle where only LPPMs that

5 Experimental Evaluation 23
have a protection rate greater than 80 % with an AC greater than 40 % are considered.We represented the Privacy Oracle in order to show the maximum utility that can beattained by a specific dataset when all mobility traces are protected. In the same vein,NOBF represents the maximum privacy that can be attained by a specific datasetwhen no mobility trace is obfuscated.
In the Privamov Dataset, Figure 10(a), EDEN ’s heuristics (illustrated by purplestars) provide the best privacy vs. utility tradeoff. All three EDEN heuristics belong to”R” whereas only PROM-100 (illustrated by a green square) belongs to the low borderof ”R”. In the Geolife Dataset, Figure 10(b), only EDEN-pes and EDEN-balancedbelong to ”R”. However, the rest of the LPPMs have a privacy value concentratedaround 62 % and an utility varying from 26 % to 88 %. Finally, in the MDC Dataset,Figure 10(c), EDEN-pes and PROM with its different configurations are inside ”R”.However, all EDEN’s heuristics achieve a better privacy vs. utility tradeoff with aprivacy close to PROM but an utility close to Privacy Oracle. To conclude, in thethree considered datasets, EDEN achieves a better privacy vs. utility tradeoff thanany other individual LPPMs with at least one of EDEN’s heuristics belonging to thetarget rectangle ”R”.
0 20 40 60 80 100Utility (%)
0
20
40
60
80
100
Priv
acy
(%)
(a) PrivaMov
0 20 40 60 80 100Utility (%)
0
20
40
60
80
100
Priv
acy
(%)
(b) Geolife
0 20 40 60 80 100Utility (%)
0
20
40
60
80
100
Priv
acy
(%)
NOBFGeoi-0.01
Geoi-0.005Geoi-0.001
TRL-1kmTRL-2km
TRL-3kmPROM-50m
PROM-100mPROM-200m
EDEN-optEDEN-balanced
EDEN-pesPrivacy Oracle
(c) MDC
Fig. 10: Privacy vs. Utility tradeoff.
5.7 Fine-Grained Analysis of EDEN
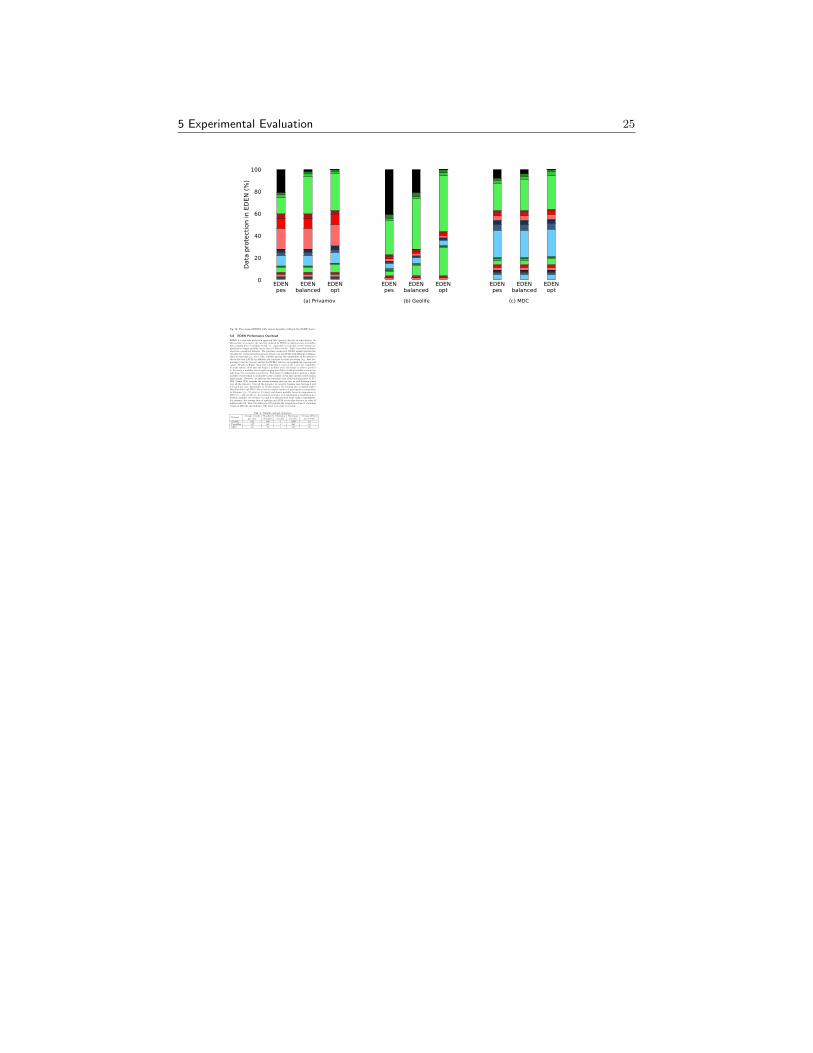
In this section, we perform a fine-grained analysis of EDEN and its heuristics. Unlikethe other LPPMs which are applied individually on the whole mobility data, EDENprotects users’ mobility traces in a fine-grained way by choosing the most appropriateLPPM for each trace. In Figure 11, we represent EDEN ’s heuristics with multi-colorbars where the hashed part is the re-identified proportion of the mobility data and theplain part is the proportion of the data protected against the Mv-Attack. The colorblack represents the mobility data that FURIA is always able to re-identify regardless

5 Experimental Evaluation 24
the chosen LPPM. This data is deleted and considered as data loss from the MCS’ pointof view. Each LPPM is represented with a different color and its intensity expressesthe strength of the LPPM’s configuration: darker colors are used for stronger LPPMconfigurations. From this figure, we observe that the dominant color is orange whichrefers to NOBF. Indeed, when FURIA is not able to identify a raw mobility trace,EDEN prioritizes this choice because it provides the maximum utility.
By focusing on the Geolife Dataset, we observe that the data loss of EDEN-pes isabout 31% (i.e., mobility traces that are always re-identified by FURIA). On the otherextreme, EDEN-opt sends this portion of data without any protection or with a defaultLPPM. Roughly, 10 % of mobility data is protected with the chosen LPPM while 20% of them are re-identified. However, we highlight that EDEN-opt ensures zero dataloss. Finally, the balanced solution shows a tradeoff between data suppression and datapublishing with a gain of +7 % of protection and a raise of +3 % of re-identificationwhile the data loss is reduced to 21 %.
Concerning the MDC Dataset, the effect of EDEN’s policies is not visible in thisdataset because the amount of data that FURIA is always able to re-identify is negligi-ble (4 %). In the Privamov Dataset, the colors distribution is more balanced: around20 %, 11 %, 8 %, 3 % of data are naturally protected, or protected with PROM, TRLand Geoi, respectively. However the effect of EDEN’s policies is as the same as in theMDC dataset, with around 3 % of re-identified mobility data. A similar evaluation isdone where the choice of NOBF is excluded and the default LPPM used to send datain case FURIA is always able to re-identify the mobility trace is PROM-50m. Resultsare depicted in Figure 12. In PrivaMov and MDC datasets, LPPMs with low config-urations (TRL-1km, Geoi-0,01 and PROM-50m) replaces NOBF choice over EDEN’svariants and the choice of PROM-50m as a default LPPM in EDEN-opt and EDEN-balanced does not impact the re-identification rate. However, in Geolife dataset, thechoice of PROM-50m to protect the 41 % of deleted data in EDEN-pes increases there-identification rate with +20 % and the protection rate with +21 %. EDEN-balancedimproves these values with only +5 % of the former and +15 % of the latter.
EDENpes
EDENbalanced
EDENopt
EDENpes
EDENbalanced
EDENopt
EDENpes
EDENbalanced
EDENopt
(a) Privamov (b) Geolife (c) MDC
0
20
40
60
80
100
Data
pro
tect
ion
in E
DEN
(%)
NOBFGeoi-0.01
Geoi-0.005Geoi-0.001
TRL-1kmTRL-2km
TRL-3kmPROM-50m
PROM-100mPROM-200m
DeletedReidentified
Fig. 11: Fine-grained EDEN with various heuristics.
5 Experimental Evaluation 25
EDENpes
EDENbalanced
EDENopt
EDENpes
EDENbalanced
EDENopt
EDENpes
EDENbalanced
EDENopt
(a) Privamov (b) Geolife (c) MDC
0
20
40
60
80
100
Data
pro
tect
ion
in E
DEN
(%)
Geoi-0.01Geoi-0.005
Geoi-0.001TRL-1km
TRL-2kmTRL-3km
PROM-50mPROM-100m
PROM-200mDeleted
Reidentified
Fig. 12: Fine-grained EDEN with various heuristics without the NOBF choice.
5.8 EDEN Performance Overhead
EDEN is a user-side protection approach that operates directly on edge devices. Inthis section, we measure the run-time induced by EDEN on different sizes of mobilitydata ranging from 1 mobility record, i.e., equivalent to real-time crowd sensing ap-plications to longer mobility traces (up to 1,600 records). Table 3 provides statisticsabout the considered datasets. The run-time overhead of EDEN mainly includes therun-time for (1) the protection process where a set of LPPMs with different configura-tions are executed (i.e., Geoi, TRL, PROM ) and (2) the computation of AC metric tochoose the best LPPM. In addition, the run-time for data processing (e.g., data for-matting to feature vectors) and for the FURIA risk test are insignificant (nanosecondrange). Results in Figure 13(a) with a logarithmic scale on the y-axis (for readabilityof small values), show that the longer a mobility trace, the longer it takes to protectit. Precisely, a mobility trace length ranging from 200 to 1,600 of mobility records cantake from 3 to 9 seconds to protect it. This takes 15 milliseconds to protect a singlemobility record which is acceptable in the context of real-time mobile crowd sensingapplications. Moreover, we measure the execution time of the training phase in FU-RIA. Figure 13(b) presents the average training time per user in each learning roundover all the datasets. Over all the datasets, we record a training time between 2 and4 seconds per user. Specifically, in Geolife dataset, the training time is slightly higherthan PrivaMov and MDC, this is due to a higher number of participant in comparisonto Privamov (i.e., 19 users vs. 13 users) and denser mobility traces in comparison toMDC (i.e., 323 records vs. 46 records in average). Our experiment is conducted on adesktop machine (see Section 5.1) and it is still practical while using a smartphone.For instance, the average time of applying an LPPM on an edge device is in order ofmilliseconds [10]. Also, the authors in [17] evaluate the computation time of a learninground on different smartphones. The latter is in order of seconds.
Tab. 3: Mobility dataset statistics.
DatasetAverage records
per userStandarddeviation
Minimumrecords
Maximumrecords
Average #Usersper round
Geolife 323 288 1 1,800 19
PrivaMov 117 60 1 180 13
MDC 46 43 1 412 95

6 Conclusion 26
1 200 400 800 1600Data size (#records)
10−2
10−1
100
101
102
Data
pro
tect
ion
run
time
(s)
PROM Geoi TRL AC metric
(a) EDEN protection run time
R1 R2 R3 R4 R5 R6 R7 R8 R9 R10 R11 R12 R13 R14Round (#days)
0
2
4
6
8
10
Trai
ning
tim
e pe
r use
r (s)
Geolife MDC PrivaMov
(b) FURIA’s model training time
Fig. 13: EDEN run-time overhead.
6 Conclusion
In this paper we presented EDEN a user-side approach for protecting mobility databy choosing the best among a set of LPPMs and without relying on a trusted proxy.EDEN relies on federated learning to train a decentralized user re-identification riskassessment model called FURIA. This model is then used on the user’s device inorder to locally compare LPPMs for each mobility trace to protect and select the onewhich is resilient against FURIA. EDEN also relies on an utility metric to ensure agood quality of the resulting data.
We evaluated EDEN by performing a set of experiments on real-world mobilitytraces. Results show that EDEN outperforms individual LPPMs both in terms ofprivacy measured in terms of the resilience against a strong attack combining state-of-the-art re-identification attacks and in terms of data utility measured using ACmetric. In addition, EDEN was also evaluated on a crowd sensed air pollution dataset[6]. The results show that EDEN better preserves the distribution of gaseous pol-lutant in comparison with the other individual LPPMs. Our solution is promisingas the re-identification risk assessment actively and incrementally learns new discrim-inative mobility patterns over time with incoming users updates without accessingraw data. This model can be improved by investigating new features such as theregularity of users mobility, speed and direction of travel, social links or the seman-tic of visited places, which we shall investigate in our future work. In conclusion,this work opens interesting perspectives where EDEN could be combined with otherstate-of-the-art orthogonal techniques in order to face untrusted users that aim to in-troduce a backdoor in the model [4, 58, 7], or to counter model information leakageattacks [9, 26, 43]. This work benefited from the support of the French NationalResearch Agency (ANR), through the SIBIL-Lab project (ANR-17-LCV2-0014), andthe PRIMaTE project (ANR-17-CE25-0017).
References
[1] Osman Abul, Francesco Bonchi, and Mirco Nanni. Never walk alone: Uncertaintyfor anonymity in moving objects databases. In 2008 IEEE 24th internationalconference on data engineering, pages 376–385. Ieee, 2008.

6 Conclusion 27
[2] Osman Abul, Francesco Bonchi, and Mirco Nanni. Anonymization of moving ob-jects databases by clustering and perturbation. Information systems, 35(8):884–910, 2010.
[3] Miguel E Andres, Nicolas E Bordenabe, Konstantinos Chatzikokolakis, andCatuscia Palamidessi. Geo-indistinguishability: Differential privacy for location-based systems. In Proceedings of the 2013 ACM SIGSAC conference on Computer& communications security, pages 901–914, 2013.
[4] Eugene Bagdasaryan, Andreas Veit, Yiqing Hua, Deborah Estrin, and VitalyShmatikov. How to backdoor federated learning. In International Conference onArtificial Intelligence and Statistics, pages 2938–2948. PMLR, 2020.
[5] Noam Bardin. https://www.waze.com, 2008.
[6] Christophe Bertero. Perception of the urban environment with the help of a fleet ofsensors on bicycles. Application to air pollution. PhD thesis, Toulouse University,Toulouse University, France, 2020.
[7] Arjun Nitin Bhagoji, Supriyo Chakraborty, Prateek Mittal, and Seraphin Calo.Analyzing federated learning through an adversarial lens. In International Con-ference on Machine Learning, pages 634–643. PMLR, 2019.
[8] Keith Bonawitz, Hubert Eichner, Wolfgang Grieskamp, Dzmitry Huba, Alex In-german, Vladimir Ivanov, Chloe Kiddon, Jakub Konecny, Stefano Mazzocchi,H Brendan McMahan, et al. Towards federated learning at scale: System design.arXiv preprint arXiv:1902.01046, 2019.
[9] Keith Bonawitz, Vladimir Ivanov, Ben Kreuter, Antonio Marcedone, H BrendanMcMahan, Sarvar Patel, Daniel Ramage, Aaron Segal, and Karn Seth. Practicalsecure aggregation for privacy-preserving machine learning. In Proceedings ofthe 2017 ACM SIGSAC Conference on Computer and Communications Security,pages 1175–1191, 2017.
[10] Ioannis Boutsis and Vana Kalogeraki. Location privacy for crowdsourcing ap-plications. In Proceedings of the 2016 ACM International Joint Conference onPervasive and Ubiquitous Computing, pages 694–705, 2016.
[11] Leo Breiman. Random forests. Machine learning, 45(1):5–32, 2001.
[12] Azby Brown, Pieter Franken, Sean Bonner, Nick Dolezal, and Joe Moross. Safe-cast: successful citizen-science for radiation measurement and communicationafter fukushima. Journal of Radiological Protection, 36(2):S82, 2016.
[13] Andrea Capponi, Claudio Fiandrino, Burak Kantarci, Luca Foschini, DzmitryKliazovich, and Pascal Bouvry. A survey on mobile crowdsensing systems: Chal-lenges, solutions, and opportunities. IEEE Commun. Surv. Tutorials, 21(3):2419–2465, 2019.
[14] Sophie Cerf, Vincent Primault, Antoine Boutet, Sonia Ben Mokhtar, RobertBirke, Sara Bouchenak, Lydia Y Chen, Nicolas Marchand, and Bogdan Robu.Pulp: achieving privacy and utility trade-off in user mobility data. In 2017 IEEE36th Symposium on Reliable Distributed Systems (SRDS), pages 164–173. IEEE,2017.
[15] Sung-Hyuk Cha. Comprehensive survey on distance/similarity measures betweenprobability density functions. City, 1(2):1, 2007.
[16] Mingqing Chen, Rajiv Mathews, Tom Ouyang, and Francoise Beaufays. Federatedlearning of out-of-vocabulary words. arXiv preprint arXiv:1903.10635, 2019.

6 Conclusion 28
[17] Georgios Damaskinos, Rachid Guerraoui, Anne-Marie Kermarrec, Vlad Nitu,Rhicheek Patra, and Francois Taıani. Fleet: Online federated learning via stal-eness awareness and performance prediction. In Dilma Da Silva and RudigerKapitza, editors, Middleware ’20: 21st International Middleware Conference,Delft, The Netherlands, December 7-11, 2020, pages 163–177. ACM, 2020.
[18] Yves-Alexandre De Montjoye, Cesar A Hidalgo, Michel Verleysen, and Vincent DBlondel. Unique in the crowd: The privacy bounds of human mobility. Scientificreports, 3:1376, 2013.
[19] Srinivas Devarakonda, Parveen Sevusu, Hongzhang Liu, Ruilin Liu, Liviu Iftode,and Badri Nath. Real-time air quality monitoring through mobile sensing inmetropolitan areas. In Proceedings of the 2nd ACM SIGKDD international work-shop on urban computing, pages 1–8, 2013.
[20] Cynthia Dwork. Differential privacy: A survey of results. In International confer-ence on theory and applications of models of computation, pages 1–19. Springer,2008.
[21] Lorenzo Franceschi-Bicchierai. Redditor cracks anonymous data trove to pin-point muslim cab drivers. Online at: http://mashable. com/2015/01/28/redditor-muslim-cab-drivers, 2015.
[22] Clement Fung, Chris J. M. Yoon, and Ivan Beschastnikh. Mitigating sybils infederated learning poisoning. CoRR, abs/1808.04866, 2018.
[23] Sebastien Gambs, Marc-Olivier Killijian, and Miguel Nunez del Prado Cortez.De-anonymization attack on geolocated data. Journal of Computer and SystemSciences, 80(8):1597–1614, 2014.
[24] Raghu K Ganti, Fan Ye, and Hui Lei. Mobile crowdsensing: current state andfuture challenges. IEEE communications Magazine, 49(11):32–39, 2011.
[25] Bugra Gedik and Ling Liu. Location privacy in mobile systems: A personalizedanonymization model. In 25th IEEE International Conference on DistributedComputing Systems (ICDCS’05), pages 620–629. IEEE, 2005.
[26] Robin C Geyer, Tassilo Klein, and Moin Nabi. Differentially private federatedlearning: A client level perspective. arXiv preprint arXiv:1712.07557, 2017.
[27] Philippe Golle and Kurt Partridge. On the anonymity of home/work locationpairs. In International Conference on Pervasive Computing, pages 390–397.Springer, 2009.
[28] Andrew Hard, Kanishka Rao, Rajiv Mathews, Swaroop Ramaswamy, FrancoiseBeaufays, Sean Augenstein, Hubert Eichner, Chloe Kiddon, and Daniel Ra-mage. Federated learning for mobile keyboard prediction. arXiv preprintarXiv:1811.03604, 2018.
[29] Yan Huang, Zhipeng Cai, and Anu G Bourgeois. Search locations safely andaccurately: A location privacy protection algorithm with accurate service. Journalof Network and Computer Applications, 103:146–156, 2018.
[30] Peter Kairouz, H Brendan McMahan, Brendan Avent, Aurelien Bellet, MehdiBennis, Arjun Nitin Bhagoji, Keith Bonawitz, Zachary Charles, Graham Cor-mode, Rachel Cummings, et al. Advances and open problems in federated learn-ing. arXiv preprint arXiv:1912.04977, 2019.

6 Conclusion 29
[31] Besma Khalfoun, Mohamed Maouche, Sonia Ben Mokhtar, and Sara Bouchenak.Mood: Mobility data privacy as orphan disease: Experimentation and deploy-ment paper. In Proceedings of the 20th International Middleware Conference,Middleware 2019, Davis, CA, USA, December 9-13, 2019, pages 136–148. ACM,2019.
[32] John Krumm. Inference attacks on location tracks. In International Conferenceon Pervasive Computing, pages 127–143. Springer, 2007.
[33] John Krumm. A survey of computational location privacy. Personal and Ubiqui-tous Computing, 13(6):391–399, 2009.
[34] Juha K Laurila, Daniel Gatica-Perez, Imad Aad, Olivier Bornet, Trinh-Minh-TriDo, Olivier Dousse, Julien Eberle, Markus Miettinen, et al. The mobile datachallenge: Big data for mobile computing research. Technical report, 2012.
[35] Huaxin Li, Haojin Zhu, Suguo Du, Xiaohui Liang, and Xuemin Shen. Privacyleakage of location sharing in mobile social networks: Attacks and defense. IEEETransactions on Dependable and Secure Computing, 15(4):646–660, 2016.
[36] Ashwin Machanavajjhala, Daniel Kifer, Johannes Gehrke, and Muthuramakr-ishnan Venkitasubramaniam. l-diversity: Privacy beyond k-anonymity. ACMTransactions on Knowledge Discovery from Data (TKDD), 1(1):3–es, 2007.
[37] Nicolas Maisonneuve, Matthias Stevens, Maria E Niessen, and Luc Steels. Noise-tube: Measuring and mapping noise pollution with mobile phones. In Informationtechnologies in environmental engineering, pages 215–228. Springer, 2009.
[38] Mohamed Maouche, Sonia Ben Mokhtar, and Sara Bouchenak. Hmc: Robust pri-vacy protection of mobility data against multiple re-identification attacks. Pro-ceedings of the ACM on Interactive, Mobile, Wearable and Ubiquitous Technolo-gies, 2(3):1–25, 2018.
[39] Mohamed Maouche, Sonia Ben Mokhtar, and Sara Bouchenak. Ap-attack: anovel user re-identification attack on mobility datasets. In Proceedings of the 14thEAI International Conference on Mobile and Ubiquitous Systems: Computing,Networking and Services, pages 48–57, 2017.
[40] Brendan McMahan, Eider Moore, Daniel Ramage, Seth Hampson, andBlaise Aguera y Arcas. Communication-efficient learning of deep networks fromdecentralized data. In Artificial Intelligence and Statistics, pages 1273–1282.PMLR, 2017.
[41] Lakhdar Meftah, Romain Rouvoy, and Isabelle Chrisment. Empowering mobilecrowdsourcing apps with user privacy control. Journal of Parallel and DistributedComputing, 147:1–15, 2020.
[42] Scott Menard. Applied logistic regression analysis, volume 106. Sage, 2002.
[43] Fan Mo and Hamed Haddadi. Efficient and private federated learning using tee.In EuroSys, 2019.
[44] Mohamed F Mokbel, Chi-Yin Chow, and Walid G Aref. The new casper: Queryprocessing for location services without compromising privacy. In Proceedings ofthe 32nd international conference on Very large data bases, pages 763–774, 2006.
[45] Sonia Ben Mokhtar, Antoine Boutet, Louafi Bouzouina, Patrick Bonnel, OlivierBrette, Lionel Brunie, Mathieu Cunche, Stephane D’Alu, Vincent Primault,Patrice Raveneau, et al. Priva’mov: Analysing human mobility through multi-sensor datasets. In NetMob 2017, 2017.

6 Conclusion 30
[46] Farid M Naini, Jayakrishnan Unnikrishnan, Patrick Thiran, and Martin Vetterli.Where you are is who you are: User identification by matching statistics. IEEETransactions on Information Forensics and Security, 11(2):358–372, 2015.
[47] Sankar K. Pal and Sushmita Mitra. Multilayer perceptron, fuzzy sets, and clas-sification. IEEE Trans. Neural Networks, 3(5):683–697, 1992.
[48] Nicolas Papernot, Shuang Song, Ilya Mironov, Ananth Raghunathan, Kunal Tal-war, and Ulfar Erlingsson. Scalable private learning with pate. arXiv preprintarXiv:1802.08908, 2018.
[49] Michal Piorkowski, Natasa Sarafijanovic-Djukic, and Matthias Grossglauser.Crawdad data set epfl/mobility (v. 2009-02-24), 2009.
[50] Layla Pournajaf, Daniel A Garcia-Ulloa, Li Xiong, and Vaidy Sunderam. Par-ticipant privacy in mobile crowd sensing task management: A survey of methodsand challenges. ACM Sigmod Record, 44(4):23–34, 2016.
[51] Vincent Primault, Antoine Boutet, Sonia Ben Mokhtar, and Lionel Brunie. Adap-tive location privacy with alp. In 2016 IEEE 35th Symposium on Reliable Dis-tributed Systems (SRDS), pages 269–278. IEEE, 2016.
[52] Vincent Primault, Antoine Boutet, Sonia Ben Mokhtar, and Lionel Brunie. Thelong road to computational location privacy: A survey. IEEE CommunicationsSurveys & Tutorials, 21(3):2772–2793, 2018.
[53] Vincent Primault, Sonia Ben Mokhtar, Cedric Lauradoux, and Lionel Brunie.Differentially private location privacy in practice. arXiv preprint arXiv:1410.7744,2014.
[54] Vincent Primault, Sonia Ben Mokhtar, Cedric Lauradoux, and Lionel Brunie.Time distortion anonymization for the publication of mobility data with highutility. In 2015 IEEE Trustcom/BigDataSE/ISPA, volume 1, pages 539–546.IEEE, 2015.
[55] Nick Mathewson Roger Dingledine. The TOR Project:https://www.torproject.org, 2006.
[56] Marco Romanelli, Catuscia Palamidessi, and Konstantinos Chatzikokolakis. Gen-erating optimal privacy-protection mechanisms via machine learning. arXivpreprint arXiv:1904.01059, 2019.
[57] Pierangela Samarati. Protecting respondents identities in microdata release.IEEE transactions on Knowledge and Data Engineering, 13(6):1010–1027, 2001.
[58] Ziteng Sun, Peter Kairouz, Ananda Theertha Suresh, and H Brendan McMahan.Can you really backdoor federated learning? arXiv preprint arXiv:1911.07963,2019.
[59] Stuart A. Thompson and Charlie Warzel. How to Track President Trump, 2019.
[60] Jiangtao Wang, Yasha Wang, Daqing Zhang, and Sumi Helal. Energy savingtechniques in mobile crowd sensing: Current state and future opportunities. IEEECommunications Magazine, 56(5):164–169, 2018.
[61] Marius Wernke, Pavel Skvortsov, Frank Durr, and Kurt Rothermel. A clas-sification of location privacy attacks and approaches. Personal and ubiquitouscomputing, 18(1):163–175, 2014.
[62] Mingqiang Xue, Panos Kalnis, and Hung Keng Pung. Location diversity: En-hanced privacy protection in location based services. In International Symposiumon Location-and Context-Awareness, pages 70–87. Springer, 2009.
6 Conclusion 31
[63] Timothy Yang, Galen Andrew, Hubert Eichner, Haicheng Sun, Wei Li, NicholasKong, Daniel Ramage, and Francoise Beaufays. Applied federated learning: Im-proving google keyboard query suggestions. arXiv preprint arXiv:1812.02903,2018.
[64] Yu Zheng, Xing Xie, Wei-Ying Ma, et al. Geolife: A collaborative social net-working service among user, location and trajectory. IEEE Data Eng. Bull.,33(2):32–39, 2010.
[65] Changqing Zhou, Dan Frankowski, Pamela Ludford, Shashi Shekhar, and LorenTerveen. Discovering personal gazetteers: an interactive clustering approach.In Proceedings of the 12th annual ACM international workshop on Geographicinformation systems, pages 266–273, 2004.

A Appendix 32
A Appendix
Algorithm 1 EDEN algorithm.
INPUT: TU - mobility trace, L - a set of LPPMs, AFi - ”i”th FURIA model,AC - utility metric,policy - {EDEN-opt,EDEN-pes, EDEN-balanced}, H - past user data, δ -deviation threshold.OUTPUT: T ′ - a protected mobility trace.
1: function EDEN (TU ,L,AFi,AC, policy, H,δ)2: Candidates← ∅3: for Lin L do . Apply LPPMs4: T ′ ← L(TU )5: V ′ ← FormatData(T ′) . Transform T’ to a Feature vector V’6: if AFi(V
′) 6= U then Candidates← Candidates ∪ {T ′} .Re-identification Risk assessment
7: end for8: if Candidates 6= ∅ then9: return { arg max
T ′∈Candidates(AC(TU , T
′))[0]}
10: else . EDEN Policies11: if policy =”EDEN-pes” then return ∅12: if policy =”EDEN-opt” then return TU .13: if policy =”EDEN-balanced” then14: P ← Heatmap(TU )15: Q← Heatmap(H)16: deviation← dTopsoe(P,Q)17: if deviation > δ then18: return TU19: else20: return ∅21: end if22: end if23: end if24: end function