edexcel unit title estimated hours -...
TRANSCRIPT

1
Unit Title
EDEXCEL
Estimated
hours
1
a Calculations, checking and rounding 4
b Indices, roots, reciprocals and hierarchy of operations 4
c Factors, multiples, primes, standard form and surds 7
2
a Algebra: the basics, setting up, rearranging and solving
equations 10
b Sequences 4
3 a Averages and range 4
b Representing and interpreting data and scatter graphs 5
4 a Fractions and percentages 12
b Ratio and proportion 6
5 a Polygons, angles and parallel lines 6
b Pythagoras’ Theorem and trigonometry 6
6
a Graphs: the basics and real-life graphs 6
b Linear graphs and coordinate geometry 8
c Quadratic, cubic and other graphs 6
7
a Perimeter, area and circles 5
b 3D forms and volume, cylinders, cones and spheres 7
c Accuracy and bounds 5
8 a Transformations 6
b Constructions, loci and bearings 7
9 a Solving quadratic and simultaneous equations 7
b Inequalities 6
10 Probability 8
11 Multiplicative reasoning 8
12 Similarity and congruence in 2D and 3D 6
13 a Graphs of trigonometric functions 6
b Further trigonometry 9
14 a Collecting data 4
b Cumulative frequency, box plots and histograms 6
15 Quadratics, expanding more than two brackets, sketching
graphs, graphs of circles, cubes and quadratics 7
16 a Circle theorems 5
b Circle geometry 5
17
Changing the subject of formulae (more complex), algebraic
fractions, solving equations arising from algebraic fractions,
rationalising surds, proof
7
18 Vectors and geometric proof 9
19
a Reciprocal and exponential graphs; Gradient and area under
graphs 7
b Direct and inverse proportion 7

2
GCSE (9 – 1) Mathematics Two Year Scheme of Work Higher Tier
Year 10 Units 1 – 12
Aut 1 Units 1-2
Aut 2 Units 3-4
Spr 1 Units 5-6
Spr 2 Units 7-8
Sum 1 Units 9-10
Sum 2 Units 11-12
Year 11 Units 13-19
Aut 1 Units 13-14
Aut 2 Units 15-16
Spr1 Units 17-18
Spr 2 UnIt 19 then Revision
Sum 1 Revision
For each unit there will be one teacher assessed WRITE task
and one peer assessed end of unit test.

3
UNIT 1: Powers, decimals, HCF and LCM, positive and negative, roots,
rounding, reciprocals, standard form, indices and surds (9 Sessions)
MI Carry out surd calculations, and simplifications of combinations of fractional
and negative indices powers and roots.
Return to Overview
SPECIFICATION REFERENCES
N2 Stage 7 P2/3 apply the four operations, including formal written methods, to
integers, decimals … both positive and negative; understand and use place value
(e.g. working with very large or very small numbers, and when calculating with
decimals)
N3 Stage 7 P5 / Stage 9 P5 recognise and use relationships between operations,
including inverse operations (e.g. cancellation to simplify calculations and
expressions); use conventional notation for priority of operations, including
brackets, powers, roots and reciprocals
N4 Stage 7 P3 / Stage 8 P3 use the concepts and vocabulary of prime numbers,
factors (divisors), multiples, common factors, common multiples, highest common
factor, lowest common multiple, prime factorisation, including using product
notation and the unique factorisation theorem
N5 apply systematic listing strategies including use of the product rule for
counting (i.e. if there are m ways of doing one task and for each of these,
there are n ways of doing another task, then the total number of ways the
two tasks can be done is m × n ways)
N6 Stage 7 P3 use positive integer powers and associated real roots (square, cube
and higher), recognise powers of 2, 3, 4, 5; estimate powers and roots of any
given positive number
N7 calculate with roots and with integer and fractional indices
N8 calculate exactly with … surds; … simplify surd expressions involving squares
(e.g. √12 = √(4 × 3) = √4 × √3 = 2√3)
N9 Stage 8 P1/ Stage 9 P1 calculate with and interpret standard form A x 10n,
where 1 ≤ A < 10 and n is an integer.
N14 Stage 9 P1 estimate answers; check calculations using approximation and
estimation, including answers obtained using technology
N15 Stage 6 P1 Stage 9 P1 round numbers and measures to an appropriate degree of
accuracy (e.g. to a specified number of decimal places or significant figures); …
PRIOR KNOWLEDGE
It is essential that students have a firm grasp of place value and be able to order
integers and decimals and use the four operations.
Students should have knowledge of integer complements to 10 and to 100,
multiplication facts to 10 × 10, strategies for multiplying and dividing by 10, 100 and
1000.
Students will have encountered squares, square roots, cubes and cube roots and have
knowledge of classifying integers.
KEYWORDS
Integer, number, digit, negative, decimal, addition, subtraction, multiplication, division,
remainder, operation, estimate, power, roots, factor, multiple, primes, square, cube,
even, odd, surd, rational, irrational standard form, simplify

4
1a. Calculations, checking and rounding (N2, N3, N5, N14,
N15) Estimated 4 hours
Objectives Possible Success Criteria
By the end of the sub-unit, students should be able to:
Add, subtract, multiply and divide decimals, whole numbers including any number
between 0 and 1;
Put digits in the correct place in a decimal calculation and use one calculation to find the
answer to another;
Use the product rule for counting (i.e. if there are m ways of doing one task and for each
of these, there are n ways of doing another task, then the total number of ways the two
tasks can be done is m × n ways);
Round numbers to the nearest 10, 100, 1000, the nearest integer, to a given number of
decimal places and to a given number of significant figures;
Estimate answers to one- or two-step calculations, including use of rounding numbers and
formal estimation to 1 significant figure: mainly whole numbers and then decimals.
Given 5 digits, what is the largest even number, largest odd
number, or largest or smallest answers when subtracting a
two-digit number from a three-digit number?
Given 2.6 × 15.8 = 41.08 what is 26 × 0.158? What is 4108
÷ 26?
Opportunities for reasoning/problem solving Common Misconceptions
Problems that include providing reasons as to whether an answer is an overestimate or
underestimate.
Missing digits in calculations involving the four operations.
Questions such as: Phil states 3.44 × 10 = 34.4, and Chris states 3.44 × 10 = 34.40.
Who is correct?
Show me another number with 3, 4, 5, 6, 7 digits that includes a 6 with the same value
as the “6” in the following number 36 754.
Significant figure and decimal place rounding are often
confused.
Some pupils may think 35 934 = 36 to two significant
figures.
Notes Suggested Activities
The expectation for Higher tier is that much of this work will be reinforced throughout
the course.
Particular emphasis should be given to the importance of clear presentation of work.
Formal written methods of addition, subtraction and multiplication work from right to left,
whilst formal division works from left to right.
Any correct method of multiplication will still gain full marks, for example, the grid
method, the traditional method, Napier’s bones.
Encourage the exploration of different calculation methods.
Amounts of money should always be rounded to the nearest penny.
Make sure students are absolutely clear about the difference between significant figures
and decimal places.
5
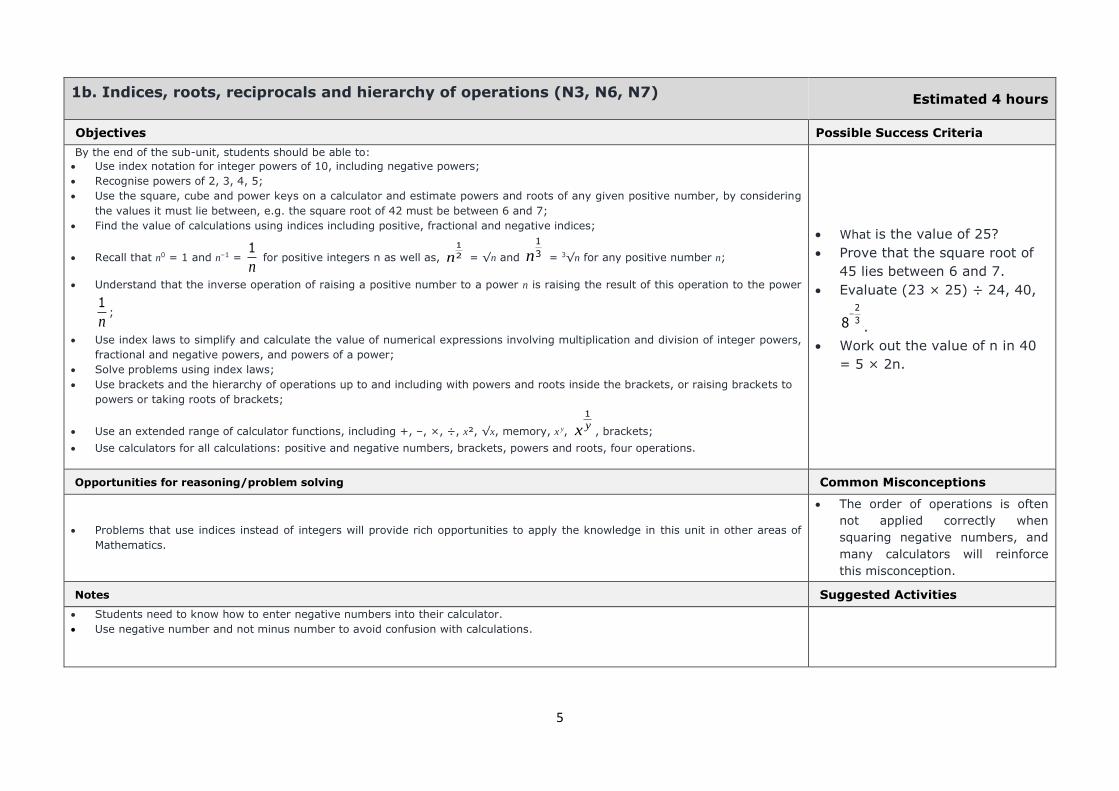
1b. Indices, roots, reciprocals and hierarchy of operations (N3, N6, N7) Estimated 4 hours
Objectives Possible Success Criteria
By the end of the sub-unit, students should be able to:
Use index notation for integer powers of 10, including negative powers;
Recognise powers of 2, 3, 4, 5;
Use the square, cube and power keys on a calculator and estimate powers and roots of any given positive number, by considering
the values it must lie between, e.g. the square root of 42 must be between 6 and 7;
Find the value of calculations using indices including positive, fractional and negative indices;
Recall that n0 = 1 and n–1 = 1
n for positive integers n as well as,
1
2n = √n and
1
3n = 3√n for any positive number n;
Understand that the inverse operation of raising a positive number to a power n is raising the result of this operation to the power
1
n;
Use index laws to simplify and calculate the value of numerical expressions involving multiplication and division of integer powers,
fractional and negative powers, and powers of a power;
Solve problems using index laws;
Use brackets and the hierarchy of operations up to and including with powers and roots inside the brackets, or raising brackets to
powers or taking roots of brackets;
Use an extended range of calculator functions, including +, –, ×, ÷, x², √x, memory, x y,
1
yx , brackets;
Use calculators for all calculations: positive and negative numbers, brackets, powers and roots, four operations.
What is the value of 25?
Prove that the square root of
45 lies between 6 and 7.
Evaluate (23 × 25) ÷ 24, 40,
2
38
.
Work out the value of n in 40
= 5 × 2n.
Opportunities for reasoning/problem solving Common Misconceptions
Problems that use indices instead of integers will provide rich opportunities to apply the knowledge in this unit in other areas of
Mathematics.
The order of operations is often
not applied correctly when
squaring negative numbers, and
many calculators will reinforce
this misconception.
Notes Suggested Activities
Students need to know how to enter negative numbers into their calculator.
Use negative number and not minus number to avoid confusion with calculations.

6
1c. Factors, multiples, primes, standard form and surds (N3, N4, N8, N9) Estimated 7 hours
Objectives Possible Success Criteria
By the end of the sub-unit, students should be able to:
Identify factors, multiples and prime numbers;
Find the prime factor decomposition of positive integers – write as a product using index notation;
Find common factors and common multiples of two numbers;
Find the LCM and HCF of two numbers, by listing, Venn diagrams and using prime factors – include
finding LCM and HCF given the prime factorisation of two numbers;
Solve problems using HCF and LCM, and prime numbers;
Understand that the prime factor decomposition of a positive integer is unique, whichever factor pair
you start with, and that every number can be written as a product of prime factors;
Convert large and small numbers into standard form and vice versa;
Add, subtract, multiply and divide numbers in standard form;
Interpret a calculator display using standard form and know how to enter numbers in standard form;
Understand surd notation, e.g. calculator gives answer to sq rt 8 as 4 rt 2;
Simplify surd expressions involving squares (e.g. √12 = √(4 × 3) = √4 × √3 = 2√3).
Know how to test if a number up to 120 is
prime.
Understand that every number can be written
as a unique product of its prime factors.
Recall prime numbers up to 100.
Understand the meaning of prime factor.
Write a number as a product of its prime
factors.
Use a Venn diagram to sort information.
Write 51080 in standard form.
Write 3.74 x 10⁻⁶ as an ordinary number.
Simplify √8.
Convert a ‘near miss’, or any number, into
standard form; e.g. 23 × 107.
Opportunities for reasoning/problem solving Common Misconceptions
Evaluate statements and justify which answer is correct by providing a counter-argument by way of a
correct solution.
Links with other areas of Mathematics can be made by using surds in Pythagoras and when using
trigonometric ratios.
1 is a prime number.
Particular emphasis should be made on the
definition of “product” as multiplication, as
many students get confused and think it
relates to addition.
Some students may think that any number
multiplied by a power of ten qualifies as a
number written in standard form.
When rounding to significant figures some
students may think, for example, that 6729
rounded to one significant figure is 7.

7
Notes Suggested Activities
Use a number square to find primes (Eratosthenes sieve).
Using a calculator to check the factors of large numbers can be useful.
Students need to be encouraged to learn squares from 2 × 2 to 15 × 15 and cubes of 2,
3, 4, 5 and 10, and corresponding square and cube roots.
Standard form is used in science and there are lots of cross-curricular opportunities.
Students need to be provided with plenty of practice in using standard form with
calculators.
Rationalising the denominator is covered later in unit 17.

8
UNIT 2: Expressions, substituting into simple formulae, expanding and factorising,
equations, sequences and inequalities, simple proof (8 sessions)
MI Manipulate and apply equations, generate/describe geometric and arithmetic series.
Return to Overview
SPECIFICATION REFERENCES
N1 Stage 7 P1 / Stage 8 P1… use the symbols =, ≠, <, >, ≤, ≥
N3 Stage 7 P3 / Stage 9 P5 recognise and use relationships between operations, including inverse
operations (e.g. cancellation to simplify calculations and expressions); use conventional notation
for priority of operations, including brackets, powers, roots and reciprocals
N8 Stage 7 P2 3 4 Stage 8 P2 3 4 calculate exactly with fractions …
N9 Stage 8 P1 Stage 9 P1 calculate with and interpret standard form A × 10n, where 1 ≤ A < 10 and n is an
integer.
A1 Stage 7-9 use and interpret algebraic notation, including:
ab in place of a × b
3y in place of y + y + y and 3 × y
a2 in place of a × a, a3 in place of a × a × a, a2b in place of a × a × b
a
b in place of a ÷ b
coefficients written as fractions rather than as decimals
brackets
A2 Stage 6-9 P5 substitute numerical values into formulae and expressions, including scientific formulae
A3 Stage 6-9 P5 understand and use the concepts and vocabulary of expressions, equations, formulae,
identities, inequalities, terms and factors
A4 Stage 9 P3 5 simplify and manipulate algebraic expressions … by:
collecting like terms
multiplying a single term over a bracket
taking out common factors
expanding products of two … binomials
factorising quadratic expressions of the form x2 + bx + c, including the difference of two squares; …
simplifying expressions involving sums, products and powers, including the laws of indices
A5 Stage 9 P5 understand and use standard mathematical formulae; rearrange formulae to change the subject
A6 know the difference between an equation and an identity; argue mathematically to show algebraic
expressions are equivalent, and use algebra to support and construct arguments and proofs
A7 where appropriate, interpret simple expressions as functions with inputs and outputs; …
A17 solve linear equations in one unknown algebraically …;
A20 Stage 9 P 5 find approximate solutions to equations numerically using iteration
A21 translate simple situations or procedures into algebraic expressions or formulae; derive an equation …, solve
the equation and interpret the solution
A23 generate terms of a sequence from either a term-to-term or a position-to-term rule
A24 recognise and use sequences of triangular, square and cube numbers, simple arithmetic progressions,
Fibonacci type sequences and simple geometric progressions (rn where n is an integer, and r is a rational
number > 0), recognise and use other sequences or a surd)
A25 Stage 8 P5 deduce expressions to calculate the nth term of linear sequences.
PRIOR KNOWLEDGE
Students should have prior knowledge of some of these topics, as they are encountered at Key Stage 3:
the ability to use negative numbers with the four operations and recall and use hierarchy of operations and
understand inverse operations;
dealing with decimals and negatives on a calculator;
using index laws numerically.
KEYWORDS
Expression, identity, equation, formula, substitute, term, ‘like’ terms, index, power, negative and fractional
indices, collect, substitute, expand, bracket, factor, factorise, quadratic, linear, simplify, approximate, arithmetic,
geometric, function, sequence, nth term, derive
9
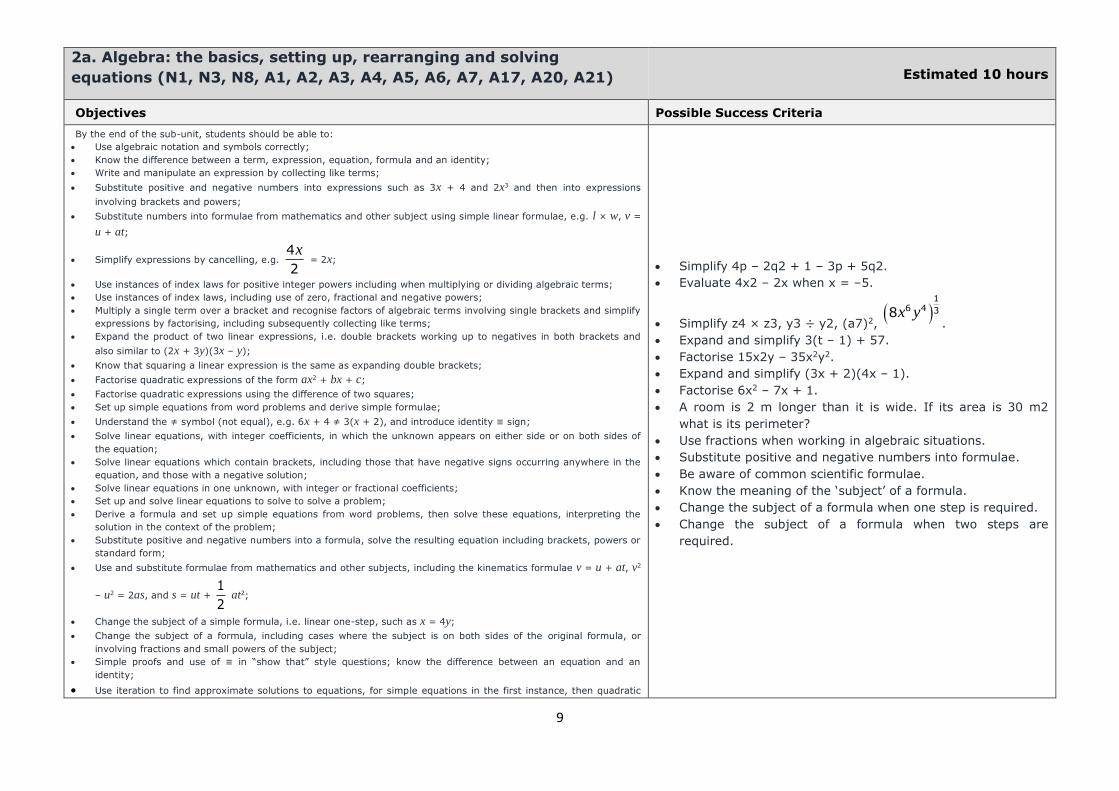
2a. Algebra: the basics, setting up, rearranging and solving
equations (N1, N3, N8, A1, A2, A3, A4, A5, A6, A7, A17, A20, A21) Estimated 10 hours
Objectives Possible Success Criteria
By the end of the sub-unit, students should be able to:
Use algebraic notation and symbols correctly;
Know the difference between a term, expression, equation, formula and an identity;
Write and manipulate an expression by collecting like terms;
Substitute positive and negative numbers into expressions such as 3x + 4 and 2x3 and then into expressions
involving brackets and powers;
Substitute numbers into formulae from mathematics and other subject using simple linear formulae, e.g. l × w, v =
u + at;
Simplify expressions by cancelling, e.g. 4
2
x = 2x;
Use instances of index laws for positive integer powers including when multiplying or dividing algebraic terms;
Use instances of index laws, including use of zero, fractional and negative powers;
Multiply a single term over a bracket and recognise factors of algebraic terms involving single brackets and simplify
expressions by factorising, including subsequently collecting like terms;
Expand the product of two linear expressions, i.e. double brackets working up to negatives in both brackets and
also similar to (2x + 3y)(3x – y);
Know that squaring a linear expression is the same as expanding double brackets;
Factorise quadratic expressions of the form ax2 + bx + c;
Factorise quadratic expressions using the difference of two squares;
Set up simple equations from word problems and derive simple formulae;
Understand the ≠ symbol (not equal), e.g. 6x + 4 ≠ 3(x + 2), and introduce identity ≡ sign;
Solve linear equations, with integer coefficients, in which the unknown appears on either side or on both sides of
the equation;
Solve linear equations which contain brackets, including those that have negative signs occurring anywhere in the
equation, and those with a negative solution;
Solve linear equations in one unknown, with integer or fractional coefficients;
Set up and solve linear equations to solve to solve a problem;
Derive a formula and set up simple equations from word problems, then solve these equations, interpreting the
solution in the context of the problem;
Substitute positive and negative numbers into a formula, solve the resulting equation including brackets, powers or
standard form;
Use and substitute formulae from mathematics and other subjects, including the kinematics formulae v = u + at, v2
– u2 = 2as, and s = ut + 1
2 at2;
Change the subject of a simple formula, i.e. linear one-step, such as x = 4y;
Change the subject of a formula, including cases where the subject is on both sides of the original formula, or
involving fractions and small powers of the subject;
Simple proofs and use of ≡ in “show that” style questions; know the difference between an equation and an
identity;
Use iteration to find approximate solutions to equations, for simple equations in the first instance, then quadratic
Simplify 4p – 2q2 + 1 – 3p + 5q2.
Evaluate 4x2 – 2x when x = –5.
Simplify z4 × z3, y3 ÷ y2, (a7)2,
16 4 38x y
.
Expand and simplify 3(t – 1) + 57.
Factorise 15x2y – 35x2y2.
Expand and simplify (3x + 2)(4x – 1).
Factorise 6x2 – 7x + 1.
A room is 2 m longer than it is wide. If its area is 30 m2
what is its perimeter?
Use fractions when working in algebraic situations.
Substitute positive and negative numbers into formulae.
Be aware of common scientific formulae.
Know the meaning of the ‘subject’ of a formula.
Change the subject of a formula when one step is required.
Change the subject of a formula when two steps are
required.

10
and cubic equations.
Opportunities for reasoning/problem solving Common Misconceptions
Forming and solving equations involving algebra and other areas of mathematics such as
area and perimeter.
Evaluate statements and justify which answer is correct by providing a counter-argument
by way of a correct solution.
When expanding two linear expressions, poor number skills
involving negatives and times tables will become evident.
Hierarchy of operations applied in the wrong order when
changing the subject of a formula.
a0 = 0.
3xy and 5yx are different “types of term” and cannot be
“collected” when simplifying expressions.
The square and cube operations on a calculator may not be
similar on all makes.
Not using brackets with negative numbers on a calculator.
Not writing down all the digits on the display.
Notes Suggested Activities
Some of this will be a reminder from Key Stage 3 and could be introduced through
investigative material such as handshake, frogs etc.
Practise factorisation where more than one variable is involved. NB More complex
quadratics are covered in a later unit.
Plenty of practice should be given for factorising, and reinforce the message that making
mistakes with negatives and times tables is a different skill to that being developed.
Encourage students to expand linear sequences prior to simplifying when dealing with
“double brackets”.
Emphasise good use of notation.
Students need to realise that not all linear equations can be solved by observation or trial
and improvement, and hence the use of a formal method is important.
Students can leave their answer in fraction form where appropriate. Emphasise that
fractions are more accurate in calculations than rounded percentage or decimal
equivalents.
Use examples involving formulae for circles, spheres, cones and kinematics when
changing the subject of a formula.
For substitution use the distance–time–speed formula, and include speed of light given in
standard form.
Students should be encouraged to use their calculator effectively by using the replay and
ANS/EXE functions; reinforce the use of brackets and only rounding their final answer
with trial and improvement.

11
2b. Sequences (N9, A23, A24, A25) Estimated 4 hours
Objectives Possible Success Criteria
By the end of the sub-unit, students should be able to:
Recognise simple sequences including at the most basic level odd, even, triangular, square and cube
numbers and Fibonacci-type sequences;
Generate sequences of numbers, squared integers and sequences derived from diagrams;
Describe in words a term-to-term sequence and identify which terms cannot be in a sequence;
Generate specific terms in a sequence using the position-to-term rule and term-to-term rule;
Find and use (to generate terms) the nth term of an arithmetic sequence;
Use the nth term of an arithmetic sequence to decide if a given number is a term in the sequence, or
find the first term above or below a given number;
Identify which terms cannot be in a sequence by finding the nth term;
Continue a quadratic sequence and use the nth term to generate terms;
Find the nth term of quadratic sequences;
Distinguish between arithmetic and geometric sequences;
Use finite/infinite and ascending/descending to describe sequences;
Recognise and use simple geometric progressions (rn where n is an integer, and r is a rational number
> 0 or a surd);
Continue geometric progression and find term to term rule, including negative, fraction and decimal
terms;
Solve problems involving sequences from real life situations.
Functions, function machines, function notation, composite functions.
Given a sequence, ‘which is the 1st term greater
than 50?’
Be able to solve problems involving sequences
from real-life situations, such as:
1 grain of rice on first square, 2 grains on
second, 4 grains on third, etc (geometric
progression), or person saves £10 one week,
£20 the next, £30 the next, etc;
What is the amount of money after x months
saving the same amount, or the height of tree
that grows 6 m per year;
Compare two pocket money options, e.g.
same number of £ per week as your age from
5 until 21, or starting with £5 a week aged 5
and increasing by 15% a year until 21.
Opportunities for reasoning/problem solving Common Misconceptions
Evaluate statements about whether or not specific numbers or patterns are in a sequence and justify
the reasons.
Students struggle to relate the position of the
term to “n”.
Notes Suggested Activities
Emphasise use of 3n meaning 3 x n.
Students need to be clear on the description of the pattern in words, the difference between the terms
and the algebraic description of the nth term.
12
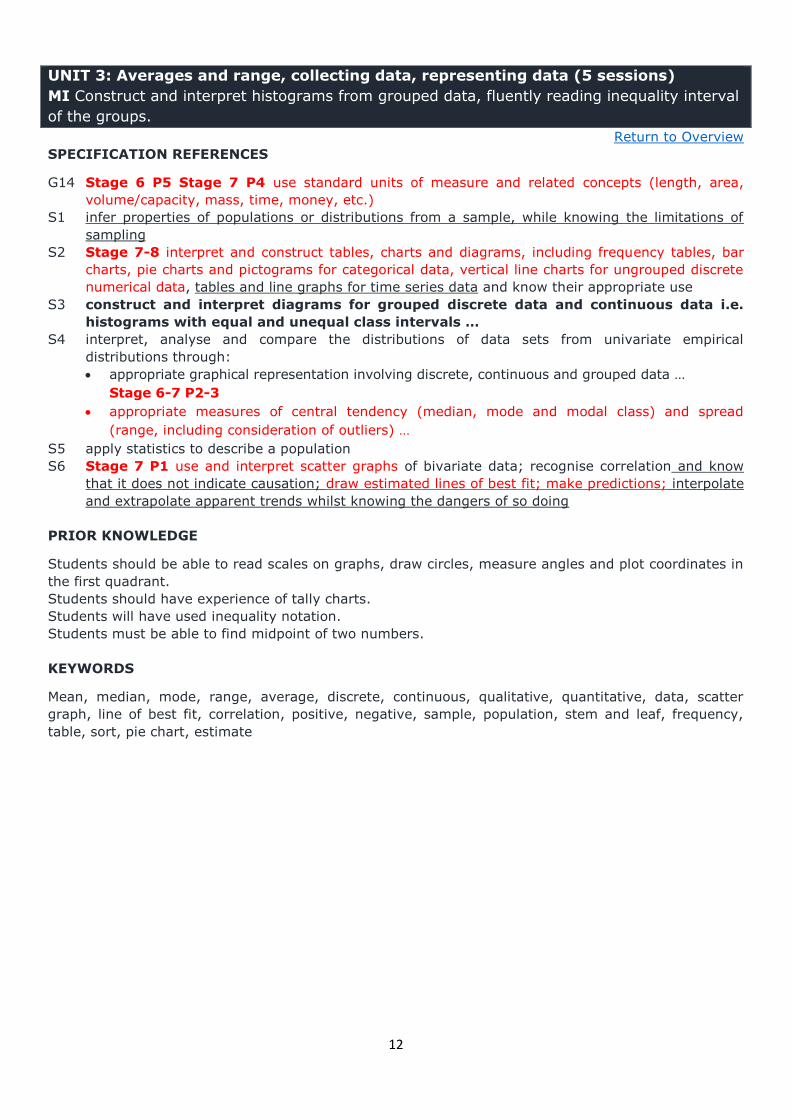
UNIT 3: Averages and range, collecting data, representing data (5 sessions)
MI Construct and interpret histograms from grouped data, fluently reading inequality interval
of the groups.
Return to Overview
SPECIFICATION REFERENCES
G14 Stage 6 P5 Stage 7 P4 use standard units of measure and related concepts (length, area,
volume/capacity, mass, time, money, etc.)
S1 infer properties of populations or distributions from a sample, while knowing the limitations of
sampling
S2 Stage 7-8 interpret and construct tables, charts and diagrams, including frequency tables, bar
charts, pie charts and pictograms for categorical data, vertical line charts for ungrouped discrete
numerical data, tables and line graphs for time series data and know their appropriate use
S3 construct and interpret diagrams for grouped discrete data and continuous data i.e.
histograms with equal and unequal class intervals …
S4 interpret, analyse and compare the distributions of data sets from univariate empirical
distributions through:
appropriate graphical representation involving discrete, continuous and grouped data …
Stage 6-7 P2-3
appropriate measures of central tendency (median, mode and modal class) and spread
(range, including consideration of outliers) …
S5 apply statistics to describe a population
S6 Stage 7 P1 use and interpret scatter graphs of bivariate data; recognise correlation and know
that it does not indicate causation; draw estimated lines of best fit; make predictions; interpolate
and extrapolate apparent trends whilst knowing the dangers of so doing
PRIOR KNOWLEDGE
Students should be able to read scales on graphs, draw circles, measure angles and plot coordinates in
the first quadrant.
Students should have experience of tally charts.
Students will have used inequality notation.
Students must be able to find midpoint of two numbers.
KEYWORDS
Mean, median, mode, range, average, discrete, continuous, qualitative, quantitative, data, scatter
graph, line of best fit, correlation, positive, negative, sample, population, stem and leaf, frequency,
table, sort, pie chart, estimate

13
3a. Averages and range (G14, S2, S3, S4, S5) Estimated 4 hours
Objectives Possible Success Criteria
By the end of the sub-unit, students should be able to:
Design and use two-way tables for discrete and grouped data;
Use information provided to complete a two-way table;
Sort, classify and tabulate data and discrete or continuous quantitative data;
Calculate mean and range, find median and mode from a small data set;
Use a spreadsheet to calculate mean and range, and find median and mode;
Recognise the advantages and disadvantages between measures of average;
Construct and interpret stem and leaf diagrams (including back-to-back diagrams):
find the mode, median, range, as well as the greatest and least values from stem
and leaf diagrams, and compare two distributions from stem and leaf diagrams
(mode, median, range);
Calculate the mean, mode, median and range from a frequency table (discrete data);
Construct and interpret grouped frequency tables for continuous data:
for grouped data, find the interval which contains the median and the modal
class;
estimate the mean with grouped data;
understand that the expression ‘estimate’ will be used where appropriate, when
finding the mean of grouped data using mid-interval values.
Be able to state the median, mode, mean and
range from a small data set.
Extract the averages from a stem and leaf
diagram.
Estimate the mean from a table.
Opportunities for reasoning/problem solving Common Misconceptions
Students should be able to provide reasons for choosing to use a specific average to
support a point of view.
Given the mean, median and mode of five positive whole numbers, can you find the
numbers?
Students should be able to provide a correct solution as a counter-argument to
statements involving the “averages”, e.g. Susan states that the median is 15, she is
wrong. Explain why.
Students often forget the difference between
continuous and discrete data.
Often the ∑(m × f) is divided by the number of
classes rather than ∑f when estimating the mean.

14
Notes Suggested Activities
Encourage students to cross out the midpoints of each group once they have used
these numbers to in m × f. This helps students to avoid summing m instead of f.
Remind students how to find the midpoint of two numbers.
Emphasise that continuous data is measured, i.e. length, weight, and discrete data
can be counted, i.e. number of shoes.
Designing and using data collection is no longer in the specification, but may remain
a useful topic as part of the overall data handling process.

15
3b. Representing and interpreting data and scatter graphs (S1, S2, S3, S4, S6) Estimated 5 hours
Objectives Possible Success Criteria
By the end of the sub-unit, students should be able to:
Know which charts to use for different types of data sets;
Produce and interpret composite bar charts;
Produce and interpret comparative and dual bar charts;
Produce and interpret pie charts:
find the mode and the frequency represented by each sector;
compare data from pie charts that represent different-sized samples;
Produce and interpret frequency polygons for grouped data:
from frequency polygons, read off frequency values, compare distributions, calculate total population,
mean, estimate greatest and least possible values (and range);
Produce frequency diagrams for grouped discrete data:
read off frequency values, calculate total population, find greatest and least values;
Produce histograms with equal class intervals:
estimate the median from a histogram with equal class width or any other information, such as the number
of people in a given interval;
Produce line graphs:
read off frequency values, calculate total population, find greatest and least values;
Construct and interpret time–series graphs, comment on trends;
Compare the mean and range of two distributions, or median or mode as appropriate;
Recognise simple patterns, characteristics relationships in bar charts, line graphs and frequency polygons;
Draw and interpret scatter graphs in terms of the relationship between two variables;
Draw lines of best fit by eye, understanding what these represent;
Identify outliers and ignore them on scatter graphs;
Use a line of best fit, or otherwise, to predict values of a variable given values of the other variable;
Distinguish between positive, negative and zero correlation using lines of best fit, and interpret correlation in
terms of the problem;
Understand that correlation does not imply causality, and appreciate that correlation is a measure of the
strength of the association between two variables and that zero correlation does not necessarily imply ‘no
relationship’ but merely ‘no linear correlation’;
Explain an isolated point on a scatter graph;
Use the line of best fit make predictions; interpolate and extrapolate apparent trends whilst knowing the
dangers of so doing.
Use a time–series data graph to
make a prediction about a future
value.
Explain why same-size sectors on
pie charts with different data sets
do not represent the same number
of items, but do represent the
same proportion.
Make comparisons between two
data sets.
Be able to justify an estimate they
have made using a line of best fit.
Identify outliers and explain why
they may occur.
Given two sets of data in a table,
model the relationship and make
predictions.

16
Opportunities for reasoning/problem solving Common Misconceptions
Many real-life situations that give rise to two variables provide opportunities for students to
extrapolate and interpret the resulting relationship (if any) between the variables.
Choose which type of graph or chart to use for a specific data set and justify its use.
Evaluate statements in relation to data displayed in a graph/chart.
Students often forget the
difference between continuous and
discrete data.
Lines of best fit are often
forgotten, but correct answers still
obtained by sight.
Notes Suggested Activities
Interquartile range is covered in unit 14.
Misleading graphs are a useful activity for covering AO2 strand 5: Critically evaluate a given way of
presenting information.
When doing time–series graphs, use examples from science, geography.
NB Moving averages are not explicitly mentioned in the programme of study but may be worth
covering too. Students need to be constantly reminded of the importance of drawing a line of best fit.
A possible extension includes drawing the line of best fit through the mean point (mean of x, mean
of y).
17
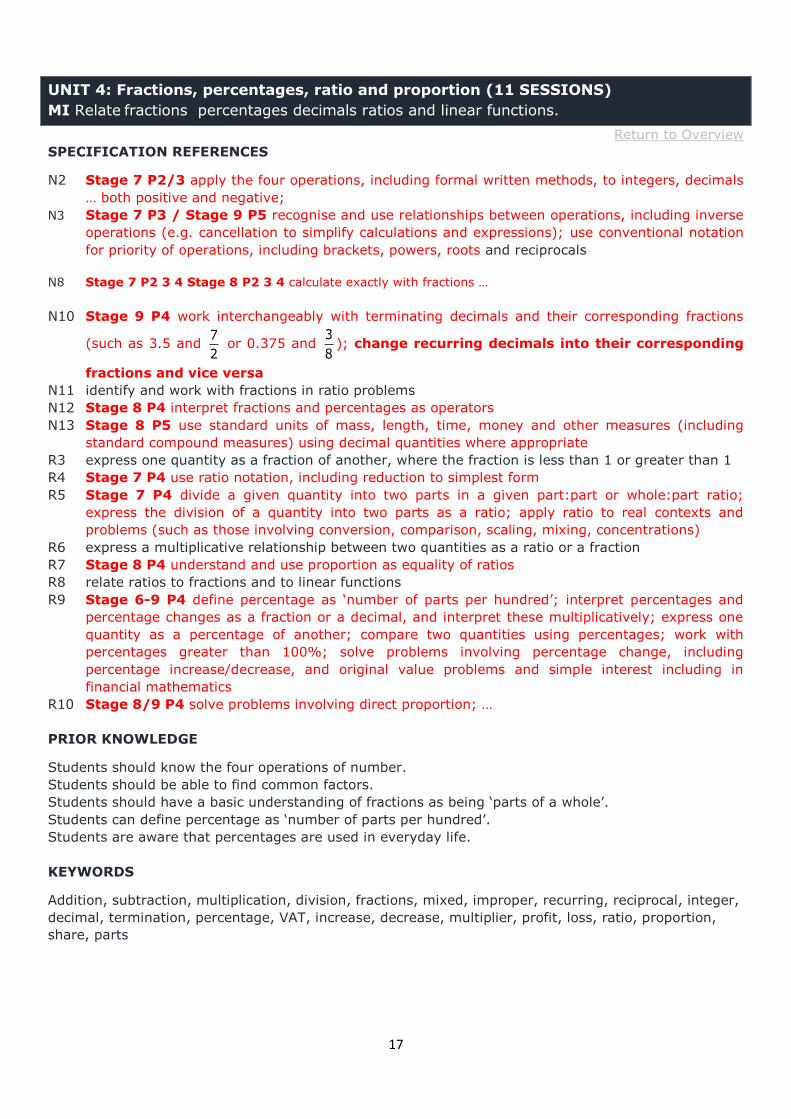
UNIT 4: Fractions, percentages, ratio and proportion (11 SESSIONS)
MI Relate fractions percentages decimals ratios and linear functions.
Return to Overview
SPECIFICATION REFERENCES
N2 Stage 7 P2/3 apply the four operations, including formal written methods, to integers, decimals
… both positive and negative;
N3 Stage 7 P3 / Stage 9 P5 recognise and use relationships between operations, including inverse
operations (e.g. cancellation to simplify calculations and expressions); use conventional notation
for priority of operations, including brackets, powers, roots and reciprocals
N8 Stage 7 P2 3 4 Stage 8 P2 3 4 calculate exactly with fractions …
N10 Stage 9 P4 work interchangeably with terminating decimals and their corresponding fractions
(such as 3.5 and 7
2 or 0.375 and
3
8); change recurring decimals into their corresponding
fractions and vice versa
N11 identify and work with fractions in ratio problems
N12 Stage 8 P4 interpret fractions and percentages as operators
N13 Stage 8 P5 use standard units of mass, length, time, money and other measures (including
standard compound measures) using decimal quantities where appropriate
R3 express one quantity as a fraction of another, where the fraction is less than 1 or greater than 1
R4 Stage 7 P4 use ratio notation, including reduction to simplest form
R5 Stage 7 P4 divide a given quantity into two parts in a given part:part or whole:part ratio;
express the division of a quantity into two parts as a ratio; apply ratio to real contexts and
problems (such as those involving conversion, comparison, scaling, mixing, concentrations)
R6 express a multiplicative relationship between two quantities as a ratio or a fraction
R7 Stage 8 P4 understand and use proportion as equality of ratios
R8 relate ratios to fractions and to linear functions
R9 Stage 6-9 P4 define percentage as ‘number of parts per hundred’; interpret percentages and
percentage changes as a fraction or a decimal, and interpret these multiplicatively; express one
quantity as a percentage of another; compare two quantities using percentages; work with
percentages greater than 100%; solve problems involving percentage change, including
percentage increase/decrease, and original value problems and simple interest including in
financial mathematics
R10 Stage 8/9 P4 solve problems involving direct proportion; …
PRIOR KNOWLEDGE
Students should know the four operations of number.
Students should be able to find common factors.
Students should have a basic understanding of fractions as being ‘parts of a whole’.
Students can define percentage as ‘number of parts per hundred’.
Students are aware that percentages are used in everyday life.
KEYWORDS
Addition, subtraction, multiplication, division, fractions, mixed, improper, recurring, reciprocal, integer,
decimal, termination, percentage, VAT, increase, decrease, multiplier, profit, loss, ratio, proportion,
share, parts

18
4a. Fractions and percentages (N2, N3, N8, N10 ,N12, N13, R3, R9) Estimated 12 hours
Objectives
Possible Success Criteria
By the end of the sub-unit, students should be able to:
Express a given number as a fraction of another;
Find equivalent fractions and compare the size of fractions;
Write a fraction in its simplest form, including using it to simplify a calculation,
e.g. 50 ÷ 20 = 50
20 =
5
2 = 2.5;
Find a fraction of a quantity or measurement, including within a context;
Convert a fraction to a decimal to make a calculation easier;
Convert between mixed numbers and improper fractions;
Add and subtract fractions, including mixed numbers;
Multiply and divide fractions, including mixed numbers and whole numbers and vice versa;
Understand and use unit fractions as multiplicative inverses;
By writing the denominator in terms of its prime factors, decide whether fractions can be converted to recurring
or terminating decimals;
Convert a fraction to a recurring decimal and vice versa;
Find the reciprocal of an integer, decimal or fraction;
Convert between fractions, decimals and percentages;
Express a given number as a percentage of another number;
Express one quantity as a percentage of another where the percentage is greater than 100%
Find a percentage of a quantity;
Find the new amount after a percentage increase or decrease;
Work out a percentage increase or decrease, including: simple interest, income tax calculations, value of profit or loss,
percentage profit or loss;
Compare two quantities using percentages, including a range of calculations and contexts such as those involving time or
money;
Find a percentage of a quantity using a multiplier and use a multiplier to increase or decrease by a percentage in any scenario
where percentages are used;
Find the original amount given the final amount after a percentage increase or decrease (reverse percentages), including VAT;
Use calculators for reverse percentage calculations by doing an appropriate division;
Use percentages in real-life situations, including percentages greater than 100%;
Describe percentage increase/decrease with fractions, e.g. 150% increase means 1
22
times as big;
Understand that fractions are more accurate in calculations than rounded percentage or decimal equivalents, and choose
fractions, decimals or percentages appropriately for calculations.
Express a given number as a fraction
of another, including where the
fraction is, for example, greater than
1, e.g. 120
100 =
2110
= 1
15
.
Answer the following: James delivers
56 newspapers. 3
8 of the
newspapers have a magazine. How
many of the newspapers have a
magazine?
Prove whether a fraction is
terminating or recurring.
Convert a fraction to a decimal
including where the fraction is
greater than 1.
Be able to work out the price of a
deposit, given the price of a sofa is
£480 and the deposit is 15% of the
price, without a calculator.
Find fractional percentages of
amounts, with and without using a
calculator.
Convince me that 0.125 is 1
8.
19
Opportunities for reasoning/problem solving Common Misconceptions
Many of these topics provide opportunities for reasoning in real-life contexts, particularly
percentages:
Calculate original values and evaluate statements in relation to this value justifying
which statement is correct.
The larger the denominator, the larger the
fraction.
Incorrect links between fractions and decimals,
such as thinking that
1
5 = 0.15, 5% = 0.5,
4% = 0.4, etc.
It is not possible to have a percentage greater
than 100%.
Notes Suggested Activities
Ensure that you include fractions where only one of the denominators needs to be
changed, in addition to where both need to be changed for addition and subtraction.
Include multiplying and dividing integers by fractions.
Use a calculator for changing fractions into decimals and look for patterns.
Recognise that every terminating decimal has its fraction with a 2 and/or 5 as a common
factor in the denominator.
Use long division to illustrate recurring decimals.
Amounts of money should always be rounded to the nearest penny.
Encourage use of the fraction button.
Students should be reminded of basic percentages.
Amounts of money should always be rounded to the nearest penny, except where
successive calculations are done (i.e. compound interest, which is covered in a later unit).
Emphasise the use of percentages in real-life situations.

20
4b. Ratio and proportion (N11, N12, N13, R3, R4, R5, R6, R7, R8, R10) Estimated 6 hours
Objectives Possible Success Criteria
By the end of the sub-unit, students should be able to:
Express the division of a quantity into a number parts as a ratio;
Write ratios in form 1 : m or m : 1 and to describe a situation;
Write ratios in their simplest form, including three-part ratios;
Divide a given quantity into two or more parts in a given part : part or part : whole ratio;
Use a ratio to find one quantity when the other is known;
Write a ratio as a fraction and as a linear function;
Identify direct proportion from a table of values, by comparing ratios of values;
Use a ratio to compare a scale model to real-life object;
Use a ratio to convert between measures and currencies, e.g. £1.00 = €1.36;
Scale up recipes;
Convert between currencies.
Write/interpret a ratio to describe a situation such as 1
blue for every 2 red …, 3 adults for every 10 children …
Recognise that two paints mixed red to yellow 5 : 4 and
20 : 16 are the same colour.
When a quantity is split in the ratio 3:5, what fraction
does each person get?
Find amounts for three people when amount for one
given.
Express the statement ‘There are twice as many girls as
boys’ as the ratio 2 : 1 or the linear function y = 2x,
where x is the number of boys and y is the number of
girls.
Opportunities for reasoning/problem solving Common Misconceptions
Problems involving sharing in a ratio that include percentages rather than specific numbers such
can provide links with other areas of Mathematics:
In a youth club the ratio of the number of boys to the number of girls is 3 : 2 . 30% of the
boys are under the age of 14 and 60% of the girls are under the age of 14. What percentage of
the youth club is under the age of 14?
Students often identify a ratio-style problem and then
divide by the number given in the question, without fully
understanding the question.
Notes Suggested Activities
Three-part ratios are usually difficult for students to understand.
Also include using decimals to find quantities.
Use a variety of measures in ratio and proportion problems.
Include metric to imperial and vice versa, but give them the conversion factor,
e.g. 5 miles = 8 km, 1 inch = 2.4 cm – these aren’t specifically in the programme of study but
are still useful.

21
UNIT 5: Angles, polygons, parallel lines; Right-angled triangles: Pythagoras and
trigonometry (7 SESSIONS)
MI Use exact trig ratio to solve right angle triangle problems
Return to Overview
SPECIFICATION REFERENCES
N7 Calculate with roots and with integer and fractional indices
N8 calculate exactly with fractions and surds …
N15 Stage 6-9 P1 round numbers and measures to an appropriate degree of accuracy (e.g. to a
specified number of decimal places or significant figures); …
A4 Stage 6/7 P2 simplify and manipulate algebraic expressions (including those involving surds) by
collecting like terms …
G1 Stage 7/8 P2 use conventional terms and notations: points, lines, vertices, edges, planes,
parallel lines, perpendicular lines, right angles, polygons, regular polygons and polygons with
reflection and/or rotation symmetries; …
G3 Stage 7/8 P2 … understand and use alternate and corresponding angles on parallel lines; derive
and use the sum of angles in a triangle (e.g. to deduce and use the angle sum in any polygon,
and to derive properties of regular polygons)
G4 Stage 8 P2 derive and apply the properties and definitions of: special types of quadrilaterals,
including square, rectangle, parallelogram, trapezium, kite and rhombus; …
G6 Stage 8/9 P2/5 apply angle facts, triangle congruence, similarity and properties of
quadrilaterals to conjecture and derive results about angles and sides, including Pythagoras’
theorem and the fact that the base angles of an isosceles triangle are equal, and use known
results to obtain simple proofs
G11 solve geometrical problems on coordinate axes
G20 Stage 8/9 P2/5 know the formulae for: Pythagoras’ theorem a2 + b2 = c2, and the
trigonometric ratios sine, cosine and tan; apply them to find angles and lengths in right-angled
triangles … and in two dimensional figures
G21 know the exact values of sin θ and cos θ for θ = 0°, 30°, 45°, 60° and 90°; know the exact value
of tan θ for θ = 0°, 30°, 45° and 60°
PRIOR KNOWLEDGE
Students should be able to rearrange simple formulae and equations, as preparation for rearranging
trig formulae.
Students should recall basic angle facts.
Students should understand that fractions are more accurate in calculations than rounded percentage
or decimal equivalents.
KEYWORDS
Quadrilateral, angle, polygon, interior, exterior, proof, tessellation, symmetry, parallel, corresponding,
alternate, co-interior, vertices, edge, face, sides, Pythagoras’ Theorem, sine, cosine, tan, trigonometry,
opposite, hypotenuse, adjacent, ratio, elevation, depression, segment, length

22
5a. Polygons, angles and parallel lines(G1, G3, G4, G6, G11) Estimated 6 hours
Objectives Possible Success Criteria
By the end of the sub-unit, students should be able to:
Classify quadrilaterals by their geometric properties and distinguish between scalene, isosceles and
equilateral triangles;
Understand ‘regular’ and ‘irregular’ as applied to polygons;
Understand the proof that the angle sum of a triangle is 180°, and derive and use the sum of angles in
a triangle;
Use symmetry property of an isosceles triangle to show that base angles are equal;
Find missing angles in a triangle using the angle sum in a triangle AND the properties of an isosceles
triangle;
Understand a proof of, and use the fact that, the exterior angle of a triangle is equal to the sum of the
interior angles at the other two vertices;
Explain why the angle sum of a quadrilateral is 360°; use the angle properties of quadrilaterals and the
fact that the angle sum of a quadrilateral is 360°;
Understand and use the angle properties of parallel lines and find missing angles using the properties of
corresponding and alternate angles, giving reasons;
Use the angle sums of irregular polygons;
Calculate and use the sums of the interior angles of polygons, use the sum of angles in a triangle to
deduce and use the angle sum in any polygon and to derive the properties of regular polygons;
Use the sum of the exterior angles of any polygon is 360°;
Use the sum of the interior angles of an n-sided polygon;
Use the sum of the interior angle and the exterior angle is 180°;
Find the size of each interior angle, or the size of each exterior angle, or the number of sides of a
regular polygon, and use the sum of angles of irregular polygons;
Calculate the angles of regular polygons and use these to solve problems;
Use the side/angle properties of compound shapes made up of triangles, lines and quadrilaterals,
including solving angle and symmetry problems for shapes in the first quadrant, more complex
problems and using algebra;
Use angle facts to demonstrate how shapes would ‘fit together’, and work out interior angles of shapes
in a pattern.
Name all quadrilaterals that have a
specific property.
Given the size of its exterior angle, how
many sides does the polygon have?
What is the same, and what is different
between families of polygons?

23
Opportunities for reasoning/problem solving Common Misconceptions
Multi-step “angle chasing”-style problems that involve justifying how students have found a
specific angle will provide opportunities to develop a chain of reasoning.
Geometrical problems involving algebra whereby equations can be formed and solved allow
students the opportunity to make and use connections with different parts of mathematics.
Some students will think that all trapezia
are isosceles, or a square is only square if
‘horizontal’, or a ‘non-horizontal’ square is
called a diamond.
Pupils may believe, incorrectly, that:
Perpendicular lines have to be
horizontal/vertical; all triangles have
rotational symmetry of order 3; all
polygons are regular.
Incorrectly identifying the ‘base angles’
(i.e. the equal angles) of an isosceles
triangle when not drawn horizontally.
Notes Suggested Activities
Demonstrate that two line segments that do not meet could be perpendicular – if they are
extended and they would meet at right angles.
Students must be encouraged to use geometrical language appropriately, ‘quote’ the
appropriate reasons for angle calculations and show step-by-step deduction when solving
multi-step problems.
Emphasise that diagrams in examinations are seldom drawn accurately.
Use tracing paper to show which angles in parallel lines are equal.
Students must use co-interior, not supplementary, to describe paired angles inside parallel
lines. (NB Supplementary angles are any angles that add to 180, not specifically those in
parallel lines.)
Use triangles to find angle sums of polygons; this could be explored algebraically as an
investigation.
24
5b. Pythagoras’ Theorem and trigonometry (A4, N7, N8, N15, G6, G20, G21) Estimated 6 hours
Objectives ( Possible Success Criteria
By the end of the sub-unit, students should be able to:
Understand, recall and use Pythagoras’ Theorem in 2D;
Given three sides of a triangle, justify if it is right-angled or not;
Calculate the length of the hypotenuse in a right-angled triangle (including decimal lengths
and a range of units);
Find the length of a shorter side in a right-angled triangle;
Calculate the length of a line segment AB given pairs of points;
Give an answer to the use of Pythagoras’ Theorem in surd form;
Understand, use and recall the trigonometric ratios sine, cosine and tan, and apply them to
find angles and lengths in general triangles in 2D figures;
Use the trigonometric ratios to solve 2D problems;
Find angles of elevation and depression;
Know the exact values of sin θ and cos θ for θ = 0°, 30°, 45°, 60° and 90°; know the exact
value of tan θ for θ = 0°, 30°, 45° and 60°.
Does 2, 3, 6 give a right-angled triangle?
Justify when to use Pythagoras’ Theorem
and when to use trigonometry.
Opportunities for reasoning/problem solving Common Misconceptions
Combined triangle problems that involve consecutive application of Pythagoras’ Theorem or a
combination of Pythagoras’ Theorem and the trigonometric ratios.
In addition to abstract problems, students should be encouraged to apply Pythagoras’
Theorem and/or the trigonometric ratios to real-life scenarios that require them to evaluate
whether their answer fulfils certain criteria, e.g. the angle of elevation of 6.5 m ladder cannot
exceed 65°. What is the greatest height it can reach?
Answers may be displayed on a calculator
in surd form.
Students forget to square root their final
answer, or round their answer
prematurely.

25
Notes Suggested Activities
Students may need reminding about surds.
Drawing the squares on the three sides will help when deriving the rule.
Scale drawings are not acceptable.
Calculators need to be in degree mode.
To find in right-angled triangles the exact values of sin θ and cos θ for θ = 0°, 30°, 45°, 60°
and 90°, use triangles with angles of 30°, 45° and 60°.
Use a suitable mnemonic to remember SOHCAHTOA.
Use Pythagoras’ Theorem and trigonometry together.

26
UNIT 6: Real-life and algebraic linear graphs, quadratic and cubic graphs, the
equation of a circle, plus rates of change and area under graphs made from straight
lines (11 SESSIONS)
MI Find the tangent gradient and area under the line for curved graphs.
Return to Overview
SPECIFICATION REFERENCES
N13 Stage 8 P5 use standard units of mass, length, time, money and other measures (including
standard compound measures) using decimal quantities where appropriate
N15 Stage 6-9 P1 round numbers and measures to an appropriate degree of accuracy (e.g. to a
specified number of decimal places or significant figures); …
A8 Stage 6-9 P5 work with coordinates in all four quadrants
A9 Stage 6-8 P5 plot graphs of equations that correspond to straight-line graphs in the coordinate
plane; use the form y = mx + c to identify parallel and perpendicular lines; find the equation
of the line through two given points, or through one point with a given gradient
A10 Stage 6-8 P5 identify and interpret gradients and intercepts of linear functions graphically and
algebraically
A11 identify and interpret roots, intercepts, turning points of quadratic functions graphically; …
A12 Stage 9 P5 recognise, sketch and interpret graphs of linear functions, quadratic functions,
simple cubic functions, the reciprocal function 1
yx
with x ≠ 0, …
A14 plot and interpret … graphs of non-standard functions in real contexts to find approximate
solutions to problems such as simple kinematic problems involving distance, speed and
acceleration
A15 calculate or estimate gradients of graphs and areas under graphs (including quadratic
and non-linear graphs) and interpret results in cases such as distance–time graphs,
velocity–time graphs … (this does not include calculus)
A16 recognise and use the equation of a circle with centre at the origin; find the equation of
a tangent to a circle at a given point
A17 Stage 6-7 P5 solve linear equations in one unknown … (including those with the unknown on
both sides of the equation); find approximate solutions using a graph
R1 Stage 8 P2 change freely between related standard units (e.g. time, length, area,
volume/capacity, mass) and compound units (e.g. speed, rates of pay, prices, density, pressure)
in numerical and algebraic contexts
R8 relate ratios to fractions and to linear functions
R10 Stage 6 P5 solve problems involving direct … proportion, including graphical … representations
R11 Stage 8 P2 use compound units such as speed, … unit pricing, …
PRIOR KNOWLEDGE
Students can identify coordinates of given points in the first quadrant or all four quadrants.
Students can use Pythagoras’ Theorem and calculate the area of compound shapes.
Students can use and draw conversion graphs for these units.
Students can use function machines and inverse operations.
KEYWORDS
Coordinate, axes, 3D, Pythagoras, graph, speed, distance, time, velocity, quadratic, solution, root,
function, linear, circle, cubic, approximate, gradient, perpendicular, parallel, equation
27
6a. Graphs: the basics and real-life graphs (N13, N15, A8, A10, A14, A15, R1,
R11) Estimated 6 hours
Objectives Possible Success Criteria
By the end of the sub-unit, students should be able to:
Identify and plot points in all four quadrants;
Draw and interpret straight-line graphs for real-life situations, including ready reckoner
graphs, conversion graphs, fuel bills, fixed charge and cost per item;
Draw distance–time and velocity–time graphs;
Use graphs to calculate various measures (of individual sections), including: unit price
(gradient), average speed, distance, time, acceleration; including using enclosed areas by
counting squares or using areas of trapezia, rectangles and triangles;
Find the coordinates of the midpoint of a line segment with a diagram given and coordinates;
Find the coordinates of the midpoint of a line segment from coordinates;
Calculate the length of a line segment given the coordinates of the end points;
Find the coordinates of points identified by geometrical information.
Find the equation of the line through two given points.
Interpret a description of a journey into a
distance–time or speed–time graph.
Calculate various measures given a
graph.
Calculate an end point of a line segment
given one coordinate and its midpoint.
Opportunities for reasoning/problem solving Common Misconceptions
Speed/distance graphs can provide opportunities for interpreting non-mathematical problems
as a sequence of mathematical processes, whilst also requiring students to justify their
reasons why one vehicle is faster than another.
Calculating the length of a line segment provides links with other areas of mathematics.
Where line segments cross the y-axis,
finding midpoints and lengths of
segments is particularly challenging as
students have to deal with negative
numbers.
28
Notes Suggested Activities
Careful annotation should be encouraged: it is good practice to label the axes and check that
students understand the scales.
Use various measures in the distance–time and velocity–time graphs, including miles, kilometres,
seconds, and hours, and include large numbers in standard form.
Ensure that you include axes with negative values to represent, for example, time before present
time, temperature or depth below sea level.
Metric-to-imperial measures are not specifically included in the programme of study, but it is a
useful skill and ideal for conversion graphs.
Emphasise that velocity has a direction.
Coordinates in 3D can be used to extend students.

29
6b. Linear graphs and coordinate geometry (A9, A10, A12, A17, R8, R10) Estimated 8 hours
Objectives Possible Success Criteria
By the end of the unit, students should be able to:
Plot and draw graphs of y = a, x = a, y = x and y = –x, drawing and recognising lines parallel
to axes, plus y = x and y = –x;
Identify and interpret the gradient of a line segment;
Recognise that equations of the form y = mx + c correspond to straight-line graphs in the
coordinate plane;
Identify and interpret the gradient and y-intercept of a linear graph given by equations of the
form y = mx + c;
Find the equation of a straight line from a graph in the form y = mx + c;
Plot and draw graphs of straight lines of the form y = mx + c with and without a table of values;
Sketch a graph of a linear function, using the gradient and y-intercept (i.e. without a table of
values);
Find the equation of the line through one point with a given gradient;
Identify and interpret gradient from an equation ax + by = c;
Find the equation of a straight line from a graph in the form ax + by = c;
Plot and draw graphs of straight lines in the form ax + by = c;
Interpret and analyse information presented in a range of linear graphs:
use gradients to interpret how one variable changes in relation to another;
find approximate solutions to a linear equation from a graph;
identify direct proportion from a graph;
find the equation of a line of best fit (scatter graphs) to model the relationship between
quantities;
Explore the gradients of parallel lines and lines perpendicular to each other;
Interpret and analyse a straight-line graph and generate equations of lines parallel and
perpendicular to the given line;
Select and use the fact that when y = mx + c is the equation of a straight line, then the
gradient of a line parallel to it will have a gradient of m and a line perpendicular to this line
will have a gradient of 1
m .
Find the equation of the line passing
through two coordinates by calculating
the gradient first.
Understand that the form y = mx + c or
ax + by = c represents a straight line.

30
Opportunities for reasoning/problem solving Common Misconceptions
Given an equation of a line provide a counter argument as to whether or not another
equation of a line is parallel or perpendicular to the first line.
Decide if lines are parallel or perpendicular without drawing them and provide reasons.
Students can find visualisation of a
question difficult, especially when dealing
with gradients resulting from negative
coordinates.
Notes Suggested Activities
Encourage students to sketch what information they are given in a question – emphasise that
it is a sketch.
Careful annotation should be encouraged – it is good practice to label the axes and check
that students understand the scales.
31
6c. Quadratic, cubic and other graphs (A11, A12, A16) Estimated 6 hours
Objectives
Possible Success Criteria
By the end of the sub-unit, students should be able to:
Recognise a linear, quadratic, cubic, reciprocal and circle graph from its shape;
Generate points and plot graphs of simple quadratic functions, then more general quadratic
functions;
Find approximate solutions of a quadratic equation from the graph of the corresponding
quadratic function;
Interpret graphs of quadratic functions from real-life problems;
Draw graphs of simple cubic functions using tables of values;
Interpret graphs of simple cubic functions, including finding solutions to cubic equations;
Draw graphs of the reciprocal function 1
yx
with x ≠ 0 using tables of values;
Draw circles, centre the origin, equation x2 + y2 = r2.
Select and use the correct mathematical
techniques to draw linear, quadratic,
cubic and reciprocal graphs.
Identify a variety of functions by the
shape of the graph.
Opportunities for reasoning/problem solving Common Misconceptions
Match equations of quadratics and cubics with their graphs by recognising the shape or by
sketching.
Students struggle with the concept of
solutions and what they represent in
concrete terms.
Notes Suggested Activities
Use lots of practical examples to help model the quadratic function, e.g. draw a graph to
model the trajectory of a projectile and predict when/where it will land.
Ensure axes are labelled and pencils used for drawing.
Graphical calculations or appropriate ICT will allow students to see the impact of changing
variables within a function.

32
UNIT 7: Perimeter, area and volume, plane shapes and prisms, circles, cylinders,
spheres, cones; Accuracy and bounds (10 SESSIONS)
MI Estimate and calculate the perimeter area and volume of composite shapes (including
sectors segments and frustums).
Return to Overview
SPECIFICATION REFERENCES
N8 Stage 9 P3 calculate exactly with … multiples of π; …
N14 Stage 9 P1 estimate answers; check calculations using approximation and estimation, including
answers obtained using technology
N15 Stage 6-9 P1 round numbers and measures to an appropriate degree of accuracy (e.g. to a
specified number of decimal places or significant figures); use inequality notation to specify
simple error intervals due to truncation or rounding
N16 Stage 9 P1 apply and interpret limits of accuracy, including upper and lower bounds
R1 Stage 8 P5 change freely between related standard units (e.g. time, length, area,
volume/capacity, mass) … in numerical and algebraic contexts
G1 Stage 7/8 P2 use conventional terms and notations: points, lines, vertices, edges, planes,
parallel lines, perpendicular lines, right angles, polygons, regular polygons and polygons with
reflection and/or rotation symmetries; …
G9 Stage 9 P3 identify and apply circle definitions and properties, including: centre, radius, chord,
diameter, circumference, tangent, arc, sector and segment
G12 Stage 8 P2 identify properties of the faces, surfaces, edges and vertices of: cubes, cuboids,
prisms, cylinders, pyramids, cones and spheres
G13 Stage 8 P5 Stage 9 P1 construct and interpret plans and elevations of 3D shapes.
G14 Stage 8 P5 use standard units of measure and related concepts (length, area, volume/capacity,
mass, time, money, etc)
G16 Stage 8 P3 know and apply formulae to calculate: area of triangles, parallelograms, trapezia;
volume of cuboids and other right prisms (including cylinders)
G17 Stage 8 P3 know the formulae: circumference of a circle = 2πr = πd, area of a circle = πr2;
calculate: perimeters of 2D shapes, including circles; areas of circles and composite shapes;
surface area and volume of spheres, pyramids, cones and composite solids
G18 Stage 9 P3 calculate arc lengths, angles and areas of sectors of circles
PRIOR KNOWLEDGE
Students should know the names and properties of 3D forms.
The concept of perimeter and area by measuring lengths of sides will be familiar to students.
Students should be able to substitute numbers into an equation and give answers to an appropriate
degree of accuracy.
Students should know the various metric units.
KEYWORDS
Triangle, rectangle, parallelogram, trapezium, area, perimeter, formula, length, width, prism,
compound, measurement, polygon, cuboid, volume, nets, isometric, symmetry, vertices, edge, face,
circle, segment, arc, sector, cylinder, circumference, radius, diameter, pi, composite, sphere, cone,
capacity, hemisphere, segment, frustum, bounds, accuracy, surface area
33
7a. Perimeter, area and circles (N8, N14, N15, R1, G1, G9, G14, G16, G17, G18) Estimated 5 hours
Objectives Possible Success Criteria
By the end of the unit, students should be able to:
Recall and use the formulae for the area of a triangle, rectangle, trapezium and parallelogram using a
variety of metric measures;
Calculate the area of compound shapes made from triangles, rectangles, trapezia and parallelograms
using a variety of metric measures;
Find the perimeter of a rectangle, trapezium and parallelogram using a variety of metric measures;
Calculate the perimeter of compound shapes made from triangles and rectangles;
Estimate area and perimeter by rounding measurements to 1 significant figure to check reasonableness
of answers;
Recall the definition of a circle and name and draw parts of a circle;
Recall and use formulae for the circumference of a circle and the area enclosed by a circle (using circumference
= 2πr = πd and area of a circle = πr2) using a variety of metric measures;
Use π ≈ 3.142 or use the π button on a calculator;
Calculate perimeters and areas of composite shapes made from circles and parts of circles (including
semicircles, quarter-circles, combinations of these and also incorporating other polygons);
Calculate arc lengths, angles and areas of sectors of circles;
Find radius or diameter, given area or circumference of circles in a variety of metric measures;
Give answers in terms of π;
Form equations involving more complex shapes and solve these equations.
Calculate the area and/or perimeter of
shapes with different units of measurement.
Understand that answers in terms of π are
more accurate.
Calculate the perimeters and/or areas of
circles, semicircles and quarter-circles given
the radius or diameter and vice versa.
Opportunities for reasoning/problem solving Common Misconceptions
Using compound shapes or combinations of polygons that require students to subsequently interpret
their result in a real-life context.
Know the impact of estimating their answers and whether it is an overestimate or underestimate in
relation to a given context.
Multi-step problems, including the requirement to form and solve equations, provide links with other
areas of mathematics.
Students often get the concepts of area
and perimeter confused.
Shapes involving missing lengths of sides
often result in incorrect answers.
Diameter and radius are often confused,
and recollection of area and
circumference of circles involves incorrect
radius or diameter.
34
Notes Suggested Activities
Encourage students to draw a sketch where one isn’t provided.
Emphasise the functional elements with carpets, tiles for walls, boxes in a larger box, etc.
Best value and minimum cost can be incorporated too.
Ensure that examples use different metric units of length, including decimals.
Emphasise the need to learn the circle formulae; “Cherry Pie’s Delicious” and “Apple Pies are
too” are good ways to remember them.
Ensure that students know it is more accurate to leave answers in terms of π, but only when
asked to do so.

35
7b. 3D forms and volume, cylinders, cones and spheres (N8, N15, G12, G13,
G14, G16, G17) Estimated 7 hours
Objectives Possible Success Criteria
By the end of the sub-unit, students should be able to:
Find the surface area of prisms using the formulae for triangles and rectangles, and other
(simple) shapes with and without a diagram;
Draw sketches of 3D solid and identify planes of symmetry of 3D solids, and sketch planes of
symmetry;
Recall and use the formula for the volume of a cuboid or prism made from composite 3D
solids using a variety of metric measures;
Convert between metric measures of volume and capacity, e.g. 1 ml = 1 cm3;
Use volume to solve problems;
Estimating surface area, perimeter and volume by rounding measurements to 1 significant
figure to check reasonableness of answers;
Use π ≈ 3.142 or use the π button on a calculator;
Find the volume and surface area of a cylinder;
Recall and use the formula for volume of pyramid;
Find the surface area of a pyramid;
Use the formulae for volume and surface area of spheres and cones;
Solve problems involving more complex shapes and solids, including segments of circles and
frustums of cones;
Find the surface area and volumes of compound solids constructed from cubes, cuboids,
cones, pyramids, spheres, hemispheres, cylinders;
Give answers in terms of π;
Form equations involving more complex shapes and solve these equations.
Given dimensions of a rectangle and a
pictorial representation of it when folded,
work out the dimensions of the new
shape.
Work out the length given the area of the
cross-section and volume of a cuboid.
Understand that answers in terms of π
are more accurate.
Given two solids with the same volume
and the dimensions of one, write and
solve an equation in terms of π to find the
dimensions of the other, e.g. a sphere is
melted down to make ball bearings of a
given radius, how many will it make?
Opportunities for reasoning/problem solving Common Misconceptions
Combinations of 3D forms such as a cone and a sphere where the radius has to be calculated
given the total height.
Students often get the concepts of
surface area and volume confused.
36
Notes Suggested Activities
Encourage students to draw a sketch where one isn’t provided.
Use lots of practical examples to ensure that students can distinguish between surface area
and volume. Making solids using multi-link cubes can be useful.
Solve problems including examples of solids in everyday use.
Scaffold drawing 3D shapes by initially using isometric paper.
Whilst not an explicit objective, it is useful for students to draw and construct nets and show
how they fold to make 3D solids, allowing students to make the link between 3D shapes and
their nets. This will enable students to understand that there is often more than one net that
can form a 3D shape.
Formulae for curved surface area and volume of a sphere, and surface area and volume of a
cone will be given on the formulae page of the examinations.
Ensure that students know it is more accurate to leave answers in terms of π but only when
asked to do so.

37
7c. Accuracy and bounds (N15, N16) Estimated 5 hours
Objectives Possible Success Criteria
By the end of the sub-unit, students should be able to:
Calculate the upper and lowers bounds of numbers given to varying degrees of accuracy;
Calculate the upper and lower bounds of an expression involving the four operations;
Find the upper and lower bounds in real-life situations using measurements given to
appropriate degrees of accuracy;
Find the upper and lower bounds of calculations involving perimeters, areas and volumes of
2D and 3D shapes;
Calculate the upper and lower bounds of calculations, particularly when working with
measurements;
Use inequality notation to specify an error bound.
Round 16,000 people to the nearest
1000.
Round 1100 g to 1 significant figure.
Work out the upper and lower bounds of a
formula where all terms are given to 1
decimal place.
Be able to justify that measurements to
the nearest whole unit may be inaccurate
by up to one half in either direction.
Opportunities for reasoning/problem solving Common Misconceptions
This sub-unit provides many opportunities for students to evaluate their answers and provide
counter-arguments in mathematical and real-life contexts, in addition to requiring them to
understand the implications of rounding their answers.
Students readily accept the rounding for
lower bounds, but take some convincing
in relation to upper bounds.
Notes Suggested Activities
Students should use ‘half a unit above’ and ‘half a unit below’ to find upper and lower
bounds.
Encourage use a number line when introducing the concept.

38
UNIT 8: Transformations; Constructions: triangles, nets, plan and elevation, loci,
scale drawings and bearings (Edexcel guidance 8 SESSIONS)
MI Apply and or identify Combinations of transformations (including centred fractional /
negative indices enlargements.)
Return to Overview
SPECIFICATION REFERENCES
R2 Stage 9 P1 use scale factors, scale diagrams and maps
R6 express a multiplicative relationship between two quantities as a ratio or a fraction
G1 … draw diagrams from written description
G2 Stage 9 P1 use the standard ruler and compass constructions (perpendicular bisector of a line
segment, constructing a perpendicular to a given line from/at a given point, bisecting a given
angle); use these to construct given figures and solve loci problems; know that the perpendicular
distance from a point to a line is the shortest distance to the line
G3 Stage 7/8 P2 apply the properties of angles at a point, angles at a point on a straight line,
vertically opposite angles; understand and use alternate and corresponding angles on parallel
lines; derive and use the sum of angles in a triangle (e.g. to deduce and use the angle sum in
any polygon, and to derive properties of regular polygons)
G5 Stage 9 P1 use the basic congruence criteria for triangles (SSS, SAS, ASA, RHS)
G6 apply angle facts, triangle congruence, similarity and properties of quadrilaterals to conjecture
and derive results about angles and sides, …
G7 Stage 6 P5 Stage 8 P5 identify, describe and construct congruent and similar shapes, including
on a coordinate axis, by considering rotation, reflection, translation and enlargement (including
fractional and negative scale factors)
G8 describe the changes and invariance achieved by combinations of rotations, reflections
and translations
G12 Stage 8 P2 identify properties of the faces, surfaces, edges and vertices of: cubes, cuboids,
prisms, cylinders, pyramids, cones and spheres
G13 Stage 8 P5 Stage 9 P1 construct and interpret plans and elevations of 3D shapes
G15 measure line segments and angles in geometric figures, including interpreting maps and scale
drawings and use of bearings
G19 apply the concepts of congruence and similarity, including the relationships between lengths … in
similar figures
G24 Stage 8 P5 describe translations as 2D vectors
G25 apply addition and subtraction of vectors, multiplication of vectors by a scalar, and diagrammatic
and column representations of vectors; …
PRIOR KNOWLEDGE
Students should be able to recognise 2D shapes.
Students should be able to plot coordinates in four quadrants and linear equations parallel to the
coordinate axes.
KEYWORDS
Rotation, reflection, translation, transformation, enlargement, scale factor, vector, centre, angle,
direction, mirror line, centre of enlargement, describe, distance, congruence, similar, combinations,
single, corresponding, constructions, compasses, protractor, bisector, bisect, line segment,
perpendicular, loci, bearing
39
8a. Transformations (R6, G5, G6, G7, G8, G24, G25) Estimated 6 hours
Objectives Possible Success Criteria
By the end of the sub-unit, students should be able to:
Distinguish properties that are preserved under particular transformations;
Recognise and describe rotations – know that that they are specified by a centre and an
angle;
Rotate 2D shapes using the origin or any other point (not necessarily on a coordinate grid);
Identify the equation of a line of symmetry;
Recognise and describe reflections on a coordinate grid – know to include the mirror line as a
simple algebraic equation, x = a, y = a, y = x, y = –x and lines not parallel to the axes;
Reflect 2D shapes using specified mirror lines including lines parallel to the axes and also
y = x and y = –x;
Recognise and describe single translations using column vectors on a coordinate grid;
Translate a given shape by a vector;
Understand the effect of one translation followed by another, in terms of column vectors (to
introduce vectors in a concrete way);
Enlarge a shape on a grid without a centre specified;
Describe and transform 2D shapes using enlargements by a positive integer, positive
fractional, and negative scale factor;
Know that an enlargement on a grid is specified by a centre and a scale factor;
Identify the scale factor of an enlargement of a shape;
Enlarge a given shape using a given centre as the centre of enlargement by counting
distances from centre, and find the centre of enlargement by drawing;
Find areas after enlargement and compare with before enlargement, to deduce multiplicative
relationship (area scale factor); given the areas of two shapes, one an enlargement of the
other, find the scale factor of the enlargement (whole number values only);
Use congruence to show that translations, rotations and reflections preserve length and
angle, so that any figure is congruent to its image under any of these transformations;
Describe and transform 2D shapes using combined rotations, reflections, translations, or
enlargements;
Describe the changes and invariance achieved by combinations of rotations, reflections and
translations.
Recognise similar shapes because they
have equal corresponding angles and/or
sides scaled up in same ratio.
Understand that translations are specified
by a distance and direction (using a
vector).
Recognise that enlargements preserve
angle but not length.
Understand that distances and angles are
preserved under rotations, reflections and
translations so that any shape is
congruent to its image.
Understand that similar shapes are
enlargements of each other and angles
are preserved.

40
Opportunities for reasoning/problem solving Common Misconceptions
Students should be given the opportunity to explore the effect of reflecting in two parallel
mirror lines and combining transformations.
Students often use the term
‘transformation’ when describing
transformations instead of the required
information.
Lines parallel to the coordinate axes often
get confused.
Notes Suggested Activities
Emphasise the need to describe the transformations fully, and if asked to describe a ‘single’
transformation students should not include two types.
Find the centre of rotation, by trial and error and by using tracing paper. Include centres on
or inside shapes.
Area of similar shapes is covered in unit 12.
41
8b. Constructions, loci and bearings (R2, G1, G2, G3, G12, G13, G15, G19) Estimated 7 hours
Objectives Possible Success Criteria
By the end of the sub-unit, students should be able to:
Draw 3D shapes using isometric grids;
Understand and draw front and side elevations and plans of shapes made from simple solids;
Given the front and side elevations and the plan of a solid, draw a sketch of the 3D solid;
Use and interpret maps and scale drawings, using a variety of scales and units;
Read and construct scale drawings, drawing lines and shapes to scale;
Estimate lengths using a scale diagram;
Understand, draw and measure bearings;
Calculate bearings and solve bearings problems, including on scaled maps, and find/mark
and measure bearings
Use the standard ruler and compass constructions:
bisect a given angle;
construct a perpendicular to a given line from/at a given point;
construct angles of 90°, 45°;
perpendicular bisector of a line segment;
Construct:
a region bounded by a circle and an intersecting line;
a given distance from a point and a given distance from a line;
equal distances from two points or two line segments;
regions which may be defined by ‘nearer to’ or ‘greater than’;
Find and describe regions satisfying a combination of loci, including in 3D;
Use constructions to solve loci problems including with bearings;
Know that the perpendicular distance from a point to a line is the shortest distance to the
line.
Able to read and construct scale
drawings.
When given the bearing of a point A from
point B, can work out the bearing of B
from A.
Know that scale diagrams, including
bearings and maps, are ‘similar’ to the
real-life examples.
Able to sketch the locus of point on a
vertex of a rotating shape as it moves
along a line, of a point on the
circumference and at the centre of a
wheel.
Opportunities for reasoning/problem solving Common Misconceptions

42
Interpret a given plan and side view of a 3D form to be able to produce a sketch of the form.
Problems involving combinations of bearings and loci can provide a rich opportunity to link
with other areas of mathematics and allow students to justify their findings.
Correct use of a protractor may be an
issue.
Notes Suggested Activities
Drawings should be done in pencil.
Relate loci problems to real-life scenarios, including mobile phone masts and coverage.
Construction lines should not be erased.

43
UNIT 9: Algebra: Solving quadratic equations and inequalities, solving simultaneous
equations algebraically (Edexcel guidance 8 SESSIONS)
MI Recognise plot and interpret a linear, quadratic, cubic, reciprocal and circle
graph.
Return to Overview
SPECIFICATION REFERENCES
N1 Stage 7 P1 / Stage 8 P1 order positive and negative integers, decimals and fractions; use the
symbols =, ≠, <, >, ≤, ≥
N8 calculate exactly with … surds; … simplify surd expressions involving squares
(e.g. √12 = √(4 × 3) = √4 × √3 = 2√3)
A4 Stage 9 P3 simplify and manipulate algebraic expressions (including those involving surds …)
by: … factorising quadratic expressions of the form ax2 + bx + c
A9 … find the equation of the line through two given points, or through one point with a given
gradient
A11 identify and interpret roots … of quadratic functions algebraically …
A18 solve quadratic equations (including those that require rearrangement) algebraically by
factorising, by completing the square and by using the quadratic formula; …
A19 Stage 9 P2/P5 solve two simultaneous equations in two variables (linear/linear or
linear/quadratic) algebraically; find approximate solutions using a graph
A21 … derive an equation (or two simultaneous equations), solve the equation(s) and interpret the
solution.
A22 Stage 8 P5 solve linear inequalities in one or two variable(s), and quadratic inequalities in
one variable; represent the solution set on a number line, using set notation and on a graph
PRIOR KNOWLEDGE
Students should understand the ≥ and ≤ symbols.
Students can substitute into, solve and rearrange linear equations.
Students should be able to factorise simple quadratic expressions.
Students should be able to recognise the equation of a circle.
KEYWORDS
Quadratic, solution, root, linear, solve, simultaneous, inequality, completing the square, factorise,
rearrange, surd, function, solve, circle, sets, union, intersection
44
9a. Solving quadratics and simultaneous equations (N8, A4, A9, A11, A18, A19,
A21) Estimated 7 hours
Objectives Possible Success Criteria
By the end of the sub-unit, students should be able to:
Factorise quadratic expressions in the form ax2 + bx + c;
Set up and solve quadratic equations;
Solve quadratic equations by factorisation and completing the square;
Solve quadratic equations that need rearranging;
Solve quadratic equations by using the quadratic formula;
Find the exact solutions of two simultaneous equations in two unknowns;
Use elimination or substitution to solve simultaneous equations;
Solve exactly, by elimination of an unknown, two simultaneous equations in two unknowns:
linear / linear, including where both need multiplying;
linear / quadratic;
linear / x2 + y2 = r2;
Set up and solve a pair of simultaneous equations in two variables for each of the above
scenarios, including to represent a situation;
Interpret the solution in the context of the problem;
Solve 3x2 + 4 = 100.
Know that the quadratic formula can be
used to solve all quadratic equations, and
often provides a more efficient method
than factorising or completing the square.
Have an understanding of solutions that
can be written in surd form.
Opportunities for reasoning/problem solving Common Misconceptions
Problems that require students to set up and solve a pair of simultaneous equations in a
real-life context, such as 2 adult tickets and 1 child ticket cost £28, and 1 adult ticket and 3
child tickets cost £34. How much does 1 adult ticket cost?
Using the formula involving negatives can
result in incorrect answers.
If students are using calculators for the
quadratic formula, they can come to rely
on them and miss the fact that some
solutions can be left in surd form.
45
Notes Suggested Activities
Remind students to use brackets for negative numbers when using a calculator, and remind them of the
importance of knowing when to leave answers in surd form.
Link to unit 2, where quadratics were solved algebraically (when a = 1).
The quadratic formula must now be known; it will not be given in the exam paper.
Reinforce the fact that some problems may produce one inappropriate solution which can be ignored.
Clear presentation of working out is essential.
Link with graphical representations.

46
9b. Inequalities (N1, A22) Estimated 6 hours
Objectives Possible Success Criteria
By the end of the sub-unit, students should be able to:
Show inequalities on number lines;
Write down whole number values that satisfy an inequality;
Solve simple linear inequalities in one variable, and represent the solution set on a number
line;
Solve two linear inequalities in x, find the solution sets and compare them to see which value
of x satisfies both solve linear inequalities in two variables algebraically;
Use the correct notation to show inclusive and exclusive inequalities.
Use inequality symbols to compare
numbers.
Given a list of numbers, represent them
on a number line using the correct
notation.
Solve equations involving inequalities.
Opportunities for reasoning/problem solving Common Misconceptions
Problems that require student to justify why certain values in a solution can be ignored.
When solving inequalities students often
state their final answer as a number
quantity, and exclude the inequality or
change it to =.
Some students believe that –6 is greater
than –3.
Notes Suggested Activities
Emphasise the importance of leaving their answer as an inequality (and not changing it to =).
Link to units 2 and 9a, where quadratics and simultaneous equations were solved.
Students can leave their answers in fractional form where appropriate.
Ensure that correct language is used to avoid reinforcing misconceptions: for example, 0.15
should never be read as ‘zero point fifteen’, and 5 > 3 should be read as ‘five is greater than
3’, not ‘5 is bigger than 3’.
47
UNIT 10: Probability (Edexcel guidance 5 SESSIONS)
MI Work out probability and conditional probability for
independent and dependent events using probability
diagrams and Venn diagrams.
Return to Overview
SPECIFICATION REFERENCES
N5 Stage 8 P4 apply systematic listing strategies, including use of the product rule for
counting …
P1 Stage 8 P4 record, describe and analyse the frequency of outcomes of probability experiments
using tables and frequency trees
P2 Stage 8 P4 apply ideas of randomness, fairness and equally likely events to calculate expected
outcomes of multiple future experiments
P3 Stage 8 P4 relate relative expected frequencies to theoretical probability, using appropriate
language and the 0–1 probability scale
P4 Stage 7 P 2 apply the property that the probabilities of an exhaustive set of outcomes sum to
one; apply the property that the probabilities of an exhaustive set of mutually exclusive events
sum to one
P5 understand that empirical unbiased samples tend towards theoretical probability distributions,
with increasing sample size
P6 enumerate sets and combinations of sets systematically, using tables, grids, Venn diagrams and
tree diagrams
P7 Stage 8 P4 construct theoretical possibility spaces for single and combined experiments with
equally likely outcomes and use these to calculate theoretical probabilities
P8 Stage 8 P4 / Stage 9 P4 calculate the probability of independent and dependent combined
events, including using tree diagrams and other representations, and know the underlying
assumptions
P9 Stage 9 P4 calculate and interpret conditional probabilities through representation
using expected frequencies with two-way tables, tree diagrams and Venn diagrams
PRIOR KNOWLEDGE
Students should understand that a probability is a number between 0 and 1, and distinguish between
events which are impossible, unlikely, even chance, likely, and certain to occur.
Students should be able to mark events and/or probabilities on a probability scale of 0 to 1. Students should know how to add and multiply fractions and decimals.
Students should have experience of expressing one number as a fraction of another number.
KEYWORDS
Probability, mutually exclusive, conditional, tree diagrams, sample space, outcomes, theoretical,
relative frequency, Venn diagram, fairness, experimental
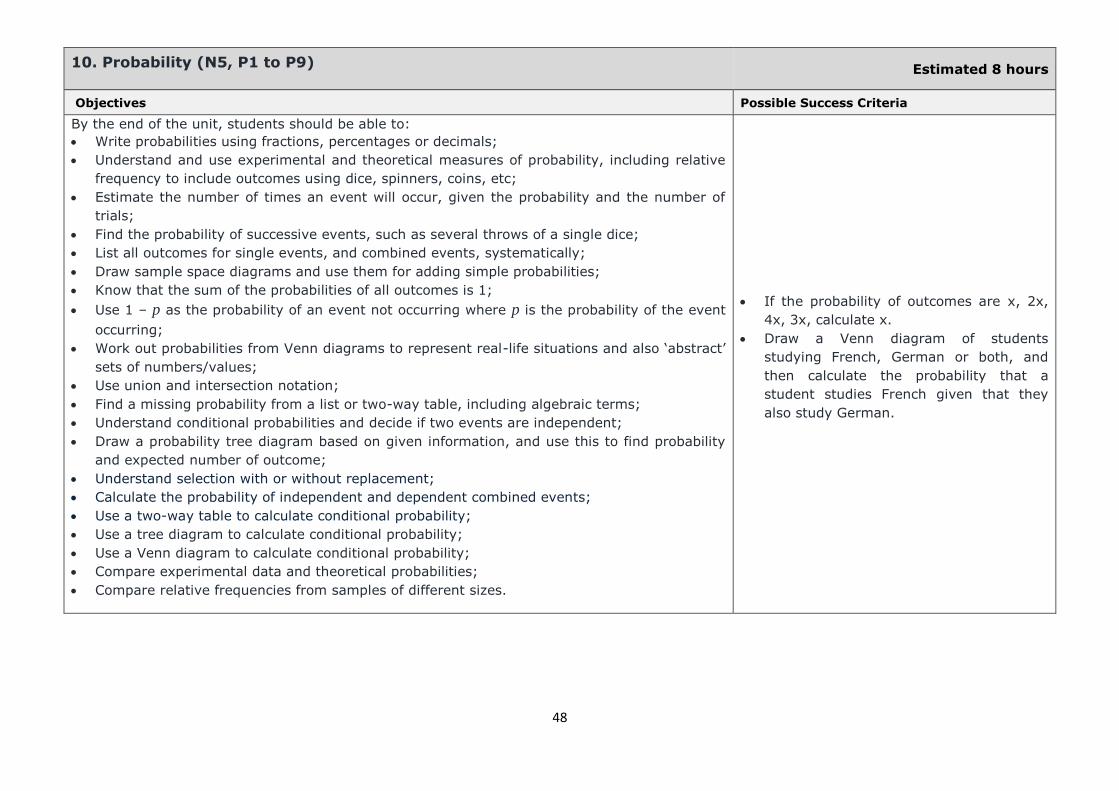
48
10. Probability (N5, P1 to P9) Estimated 8 hours
Objectives Possible Success Criteria
By the end of the unit, students should be able to:
Write probabilities using fractions, percentages or decimals;
Understand and use experimental and theoretical measures of probability, including relative
frequency to include outcomes using dice, spinners, coins, etc;
Estimate the number of times an event will occur, given the probability and the number of
trials;
Find the probability of successive events, such as several throws of a single dice;
List all outcomes for single events, and combined events, systematically;
Draw sample space diagrams and use them for adding simple probabilities;
Know that the sum of the probabilities of all outcomes is 1;
Use 1 – p as the probability of an event not occurring where p is the probability of the event
occurring;
Work out probabilities from Venn diagrams to represent real-life situations and also ‘abstract’
sets of numbers/values;
Use union and intersection notation;
Find a missing probability from a list or two-way table, including algebraic terms;
Understand conditional probabilities and decide if two events are independent;
Draw a probability tree diagram based on given information, and use this to find probability
and expected number of outcome;
Understand selection with or without replacement;
Calculate the probability of independent and dependent combined events;
Use a two-way table to calculate conditional probability;
Use a tree diagram to calculate conditional probability;
Use a Venn diagram to calculate conditional probability;
Compare experimental data and theoretical probabilities;
Compare relative frequencies from samples of different sizes.
If the probability of outcomes are x, 2x,
4x, 3x, calculate x.
Draw a Venn diagram of students
studying French, German or both, and
then calculate the probability that a
student studies French given that they
also study German.

49
Opportunities for reasoning/problem solving Common Misconceptions
Students should be given the opportunity to justify the probability of events happening or not
happening in real-life and abstract contexts.
Probability without replacement is best
illustrated visually and by initially working
out probability ‘with’ replacement.
Not using fractions or decimals when
working with probability trees.
Notes Suggested Activities
Encourage students to work ‘across’ the branches, working out the probability of each
successive event. The probability of the combinations of outcomes should = 1.
Use problems involving ratio and percentage, similar to:
A bag contains balls in the ratio 2 : 3 : 4. A ball is taken at random. Work out the
probability that the ball will be … ;
In a group of students 55% are boys, 65% prefer to watch film A, 10% are girls who
prefer to watch film B. One student picked at random. Find the probability that this is a
boy who prefers to watch film A (P6).
Emphasise that, were an experiment repeated, it will usually lead to different outcomes, and
that increasing sample size generally leads to better estimates of probability and population
characteristics.

50
UNIT 11: Multiplicative reasoning: direct and inverse proportion,
relating to graph form for direct, compound measures, repeated
proportional change (Edexcel guidance 5 SESSIONS)
MI Apply multiplicative reasoning between two quantities as a
ratio or fraction. Set up and use formulas where quantities are in
direct proportion or inversely proportional.
Return to Overview
SPECIFICATION REFERENCES
N3 Stage 7 P3 Stage 9 P5 recognise and use relationships between operations, including inverse
operations (e.g. cancellation to simplify calculations and expressions); …
N12 Stage 8 P4 interpret fractions and percentages as operators
N13 Stage 8 P5 use standard units of mass, length, time, money and other measures (including
standard compound measures) using decimal quantities where appropriate
R1 Stage 8 P2 change freely between related standard units (e.g. time, length, area,
volume/capacity, mass) and compound units (e.g. speed, rates of pay, prices, density, pressure)
in numerical and algebraic contexts
R6 express a multiplicative relationship between two quantities as a ratio or a fraction
R10 Stage 8/9 P4 solve problems involving direct and inverse proportion, including graphical and
algebraic representations
R11 Stage 8 P2 use compound units such as speed, rates of pay, unit pricing, density and pressure
R14 Stage 9 P4 … recognise and interpret graphs that illustrate direct and inverse proportion
R16 Stage 8/9 P4 set up, solve and interpret the answers in growth and decay problems, including
compound interest and work with general iterative processes
PRIOR KNOWLEDGE
Students should be able to find a percentage of an amount and relate percentages to decimals.
Students should be able to rearrange equations and use these to solve problems.
Knowledge of speed = distance/time, density = mass/volume.
KEYWORDS
Ration, proportion, best value, unitary, proportional change, compound measure, density, mass,
volume, speed, distance, time, density, mass, volume, pressure, acceleration, velocity, inverse, direct,
constant of proportionality

51
11. Multiplicative Reasoning (N3, N12, N13, R1, R6, R10, R11, R14, R16) Estimated 8 hours
Objectives Possible Success Criteria
By the end of the unit, students should be able to:
Express a multiplicative relationship between two quantities as a ratio or a fraction, e.g.
when A:B are in the ratio 3:5, A is 3
5B. When 4a = 7b, then a =
7
4
b or a:b is 7:4;
Solve proportion problems using the unitary method;
Work out which product offers best value and consider rates of pay;
Work out the multiplier for repeated proportional change as a single decimal number;
Represent repeated proportional change using a multiplier raised to a power, use this to solve
problems involving compound interest and depreciation;
Understand and use compound measures and:
convert between metric speed measures;
convert between density measures;
convert between pressure measures;
Use kinematics formulae from the formulae sheet to calculate speed, acceleration, etc (with
variables defined in the question);
Calculate an unknown quantity from quantities that vary in direct or inverse proportion;
Recognise when values are in direct proportion by reference to the graph form, and use a
graph to find the value of k in y = kx;
Set up and use equations to solve word and other problems involving direct proportion (this
is covered in more detail in unit 19);
Relate algebraic solutions to graphical representation of the equations;
Recognise when values are in inverse proportion by reference to the graph form;
Set up and use equations to solve word and other problems involving inverse proportion, and
relate algebraic solutions to graphical representation of the equations.
Change g/cm3 to kg/m3, kg/m2 to g/cm2,
m/s to km/h.
Solve word problems involving direct and
inverse proportion.
Understand direct proportion as: as x
increases, y increases.
Understand inverse proportion as: as x
increases, y decreases.
Opportunities for reasoning/problem solving Common Misconceptions
Speed/distance type problems that involve students justifying their reasons why one vehicle
is faster than another.
Calculations involving value for money are a good reasoning opportunity that utilise different
skills.
Working out best value of items using different currencies given an exchange rate.
52
Notes Suggested Activities
Include fractional percentages of amounts with compound interest and encourage use of
single multipliers.
Amounts of money should be rounded to the nearest penny, but emphasise the importance
of not rounding until the end of the calculation if doing in stages.
Use a formula triangle to help students see the relationship for compound measures – this
will help them evaluate which inverse operations to use.
Help students to recognise the problem they are trying to solve by the unit measurement
given, e.g. km/h is a unit of speed as it is speed divided by a time.
Kinematics formulae involve a constant acceleration (which could be zero).
Encourage students to write down the initial equation of proportionality and, if asked to find a
formal relating two quantities, the constant of proportionality must be found.

53
UNIT 12: Similarity and congruence in 2D and 3D
(Edexcel guidance 4SESSIONS)
MI Identify congruence similarity and scale factors (linear
area and volume), and apply the proportionality to find
unknown dimensions.
Back to Overview
SPECIFICATION REFERENCES
R6 express a multiplicative relationship between two quantities as a ratio or a fraction
R12 Stage 9 P5 compare lengths, areas and volumes using ratio notation; make links to similarity
(including trigonometric ratios) and scale factors
G5 Stage 9 P1 use the basic congruence criteria for triangles (SSS, SAS, ASA, RHS)
G6 apply angle facts, triangle congruence, similarity and properties of quadrilaterals to conjecture
and derive results about angles and sides, including … the fact that the base angles of an
isosceles triangle are equal, and use known results to obtain simple proofs
G17 Stage 8 P3 … calculate: surface area and volume of spheres, pyramids, cones and composite
solids
G19 Stage 8 P4 apply the concepts of congruence and similarity, including the relationships between
lengths, areas and volumes in similar figures
PRIOR KNOWLEDGE
Students should be able to recognise and enlarge shapes and calculate scale factors.
Students should have knowledge of how to calculate area and volume in various metric measures.
Students should be able to measure lines and angles, and use compasses, ruler and protractor to
construct standard constructions.
KEYWORDS
Congruence, side, angle, compass, construction, shape, volume, length, area, volume, scale factor,
enlargement, similar, perimeter, frustum

54
12. Similarity and congruence in 2D and 3D (R6, R12, G5, G6, G17, G19) Estimated 4 hours
Objectives Possible Success Criteria
By the end of the unit, students should be able to:
Understand and use SSS, SAS, ASA and RHS conditions to prove the congruence of triangles
using formal arguments, and to verify standard ruler and pair of compasses constructions;
Solve angle problems by first proving congruence;
Understand similarity of triangles and of other plane shapes, and use this to make geometric
inferences;
Prove that two shapes are similar by showing that all corresponding angles are equal in size
and/or lengths of sides are in the same ratio/one is an enlargement of the other, giving the
scale factor;
Use formal geometric proof for the similarity of two given triangles;
Understand the effect of enlargement on angles, perimeter, area and volume of shapes and
solids;
Identify the scale factor of an enlargement of a similar shape as the ratio of the lengths of
two corresponding sides, using integer or fraction scale factors;
Write the lengths, areas and volumes of two shapes as ratios in their simplest form;
Find missing lengths, areas and volumes in similar 3D solids;
Know the relationships between linear, area and volume scale factors of mathematically
similar shapes and solids;
Use the relationship between enlargement and areas and volumes of simple shapes and
solids;
Solve problems involving frustums of cones where you have to find missing lengths first
using similar triangles.
Recognise that all corresponding angles in
similar shapes are equal in size when the
corresponding lengths of sides are not.
Understand that enlargement does not
have the same effect on area and volume.
Understand, from the experience of
constructing them, that triangles
satisfying SSS, SAS, ASA and RHS are
unique, but SSA triangles are not.
Opportunities for reasoning/problem solving Common Misconceptions
Multi-step questions which require calculating missing lengths of similar shapes prior to
calculating area of the shape, or using this information in trigonometry or Pythagoras
problems.
Students commonly use the same scale
factor for length, area and volume.
55
Notes Suggested Activities
Encourage students to model consider what happens to the area when a 1 cm square is
enlarged by a scale factor of 3.
Ensure that examples involving given volumes are used, requiring the cube root being
calculated to find the length scale factor.
Make links between similarity and trigonometric ratios.
56
UNIT 13: Sine and cosine rules, 1
2ab sin C, trigonometry and Pythagoras’ Theorem in
3D, trigonometric graphs, and accuracy and bounds (Edexcel guidance 9 SESSIONS)
MI Apply the Sine rule, cosine rule, and sine area formulae.
Return to Overview
SPECIFICATION REFERENCES
N16 Stage 9 P1 apply and interpret limits of accuracy, including upper and lower bounds
A8 Stage 6 P5 work with coordinates in all four quadrants
A12 Stage 9 P 5 recognise, sketch and interpret graphs of linear functions, quadratic functions,
simple cubic functions, the reciprocal function 1
yx
with x ≠ 0, exponential, functions
y = kx for positive values of k,
and the trigonometric functions (with arguments in degrees) y = sin x, y = cos x and y =
tan x for angles of any size
A13 sketch translations and reflections of a given function
G11 solve geometrical problems on coordinate axes
G20 Stage 9 P5 know the formulae for: Pythagoras’ Theorem a2 + b2 = c2 and the trigonometric
ratios, sine, cosine and tan; apply them to find angles and lengths in right-angled triangles and,
where possible, general triangles in two and three dimensional figures
G21 know the exact values of sin θ and cos θ for θ = 0°, 30°, 45° , 60° and 90°; know the exact
value of tan θ for θ = 0°, 30°, 45° and 60°
G22 know and apply the sine rule a
sin A =
b
sin B =
c
sin C, and cosine rule
a2 = b2 + c2 – 2bc cos A, to find unknown lengths and angles
G23 know and apply Area = 1
2ab sin C to calculate the area, sides or angles of any triangle
PRIOR KNOWLEDGE
Students should be able to use axes and coordinates to specify points in all four quadrants.
Students should be able to recall and apply Pythagoras’ Theorem and trigonometric ratios.
Students should be able to substitute into formulae.
KEYWORDS
Axes, coordinates, sine, cosine, tan, angle, graph, transformations, side, angle, inverse, square root,
2D, 3D, diagonal, plane, cuboid
57
13a. Graphs of trigonometric functions (A8, A12, A13, G21) Estimated 6 hours
Objectives Possible Success Criteria
By the end of the sub-unit, students should be able to:
Recognise, sketch and interpret graphs of the trigonometric functions (in degrees)
y = sin x, y = cos x and y = tan x for angles of any size.
Know the exact values of sin θ and cos θ for θ = 0°, 30°, 45° , 60° and 90° and exact value
of tan θ for θ = 0°, 30°, 45° and 60° and find them from graphs.
Apply to the graph of y = f(x) the transformations y = –f(x), y = f(–x) for sine, cosine and tan
functions f(x).
Apply to the graph of y = f(x) the transformations y = f(x) + a, y = f(x + a)
for sine, cosine and tan functions f(x).
Match the characteristic shape of the
graphs to their functions and
transformations.
Opportunities for reasoning/problem solving Common Misconceptions
Match a given list of events/processes with their graph.
Calculate and justify specific coordinates on a transformation of a trigonometric function.
Notes Suggested Activities
Translations and reflections of functions are included in this specification, but not rotations or
stretches.
This work could be supported by the used of graphical calculators or suitable ICT.
Students need to recall the above exact values for sin, cos and tan.
58
13b. Further trigonometry (N16, G11, G20, G22, G23 ) Estimated 9 hours
Objectives Possible Success Criteria
By the end of the sub-unit, students should be able to:
Know and apply Area = 1
2ab sin C to calculate the area, sides or angles of any triangle.
Know the sine and cosine rules, and use to solve 2D problems (including involving bearings).
Use the sine and cosine rules to solve 3D problems.
Understand the language of planes, and recognise the diagonals of a cuboid.
Solve geometrical problems on coordinate axes.
Understand, recall and use trigonometric relationships and Pythagoras’ Theorem in right-
angled triangles, and use these to solve problems in 3D configurations.
Calculate the length of a diagonal of a cuboid.
• Find the angle between a line and a plane.
Find the area of a segment of a circle
given the radius and length of the chord.
Justify when to use the cosine rule, sine
rule, Pythagoras’ Theorem or normal
trigonometric ratios to solve problems.
Opportunities for reasoning/problem solving Common Misconceptions
Triangles formed in a semi-circle can provide links with other areas of mathematics.
Not using the correct rule, or attempting
to use ‘normal trig’ in non-right-angled
triangles.
When finding angles students will be
unable to rearrange the cosine rule or fail
to find the inverse of cos θ.
59
Notes Suggested Activities
The cosine rule is used when we have SAS and used to find the side opposite the ‘included’
angle or when we have SSS to find an angle.
Ensure that finding angles with ‘normal trig’ is refreshed prior to this topic.
Students may find it useful to be reminded of simple geometrical facts, i.e. the shortest side
is always opposite the shortest angle in a triangle.
The sine and cosine rules and general formula for the area of a triangle are not given on the
formulae sheet.
In multi-step questions emphasise the importance of not rounding prematurely and using
exact values where appropriate.
Whilst 3D coordinates are not included in the programme of study, they provide a visual
introduction to trigonometry in 3D.

60
UNIT 14: Statistics and sampling, cumulative frequency and histograms (Edexcel guidance 6 SESSIONS)
MI Draw and interpret cumulative frequency diagrams and box plots.
Return to Overview
SPECIFICATION REFERENCES
S1 infer properties of populations or distributions from a sample, whilst knowing the limitations of
sampling apply statistics to describe a population
S3 interpret and construct diagrams for grouped discrete data and continuous data, i.e.
histograms with equal and unequal class intervals and cumulative frequency graphs,
and know their appropriate use
S4 interpret, analyse and compare the distributions of data sets from univariate empirical
distributions through:
Appropriate graphical representation involving discrete, continuous and grouped data,
including box plots
appropriate measures of central tendency (median, mean, mode and modal class) and spread
(range, including consideration of outliers, quartiles and inter-quartile range)
PRIOR KNOWLEDGE
Students should understand the different types of data: discrete/continuous.
Students should have experience of inequality notation.
Students should be able to multiply a fraction by a number.
Students should understand the data handling cycle.
KEYWORDS
Sample, population, fraction, decimal, percentage, bias, stratified sample, random, cumulative
frequency, box plot, histogram, frequency density, frequency, mean, median, mode, range, lower
quartile, upper quartile, interquartile range, spread, comparison, outlier

61
14a. Collecting data (S1) Estimated 6 hours
Objectives Possible Success Criteria
By the end of the sub-unit, students should be able to:
Specify the problem and plan:
decide what data to collect and what analysis is needed;
understand primary and secondary data sources;
consider fairness;
Understand what is meant by a sample and a population;
Understand how different sample sizes may affect the reliability of conclusions drawn;
Identify possible sources of bias and plan to minimise it;
Write questions to eliminate bias, and understand how the timing and location of a survey
can ensure a sample is representative (see note);
Explain why a sample may not be
representative of a whole population.
Carry out their own statistical
investigation and justify how sources of
bias have been eliminated.
Opportunities for reasoning/problem solving Common Misconceptions
When using a sample of a population to solve contextual problem, students should be able to
justify why the sample may not be representative the whole population.
Notes Suggested Activities
Emphasise the difference between primary and secondary sources and remind students about
the difference between discrete and continuous data.
Discuss sample size and mention that a census is the whole population (the UK census takes
place every 10 years in a year ending with a 1 – the next one is due in 2021).
Specifying the problem and planning for data collection is not included in the programme of
study, but is a prerequisite to understanding the context of the topic.
Writing a questionnaire is also not included in the programme of study, but remains a good
topic for demonstrating bias and ways to reduce bias in terms of timing, location and
question types.
62
14b. Cumulative frequency, box plots and histograms (S1, S3, S4) Estimated 6 hours
Objectives
Possible Success Criteria
By the end of the sub-unit, students should be able to:
Use statistics found in all graphs/charts in this unit to describe a population;
Know the appropriate uses of cumulative frequency diagrams;
Construct and interpret cumulative frequency tables, cumulative frequency graphs/diagrams
and from the graph:
estimate frequency greater/less than a given value;
find the median and quartile values and interquartile range;
Compare the mean and range of two distributions, or median and interquartile range, as
appropriate;
Interpret box plots to find median, quartiles, range and interquartile range and draw
conclusions;
Produce box plots from raw data and when given quartiles, median and identify any outliers;
Know the appropriate uses of histograms;
Construct and interpret histograms from class intervals with unequal width;
Use and understand frequency density;
From histograms:
complete a grouped frequency table;
understand and define frequency density;
Estimate the mean and median from a histogram with unequal class widths or any other
information from a histogram, such as the number of people in a given interval.
Construct cumulative frequency graphs,
box plots and histograms from frequency
tables.
Compare two data sets and justify their
comparisons based on measures
extracted from their diagrams where
appropriate in terms of the context of the
data.
Opportunities for reasoning/problem solving Common Misconceptions
Interpret two or more data sets from box plots and relate the key measures in the context of
the data.
Given the size of a sample and its box plot calculate the proportion above/below a specified
value.
Labelling axes incorrectly in terms of the
scales, and also using ‘Frequency’ instead
of ‘Frequency Density’ or ‘Cumulative
Frequency’.
Students often confuse the methods
involved with cumulative frequency,
estimating the mean and histograms
when dealing with data tables.
63
Notes Suggested Activities
Ensure that axes are clearly labelled.
As a way to introduce measures of spread, it may be useful to find mode, median, range and
interquartile range from stem and leaf diagrams (including back-to-back) to compare two
data sets.
As an extension, use the formula for identifying an outlier, (i.e. if data point is below
LQ – 1.5 × IQR or above UQ + 1.5 × IQR, it is an outlier). Get them to identify outliers in the
data, and give bounds for data.

64
UNIT 15: Quadratics, expanding more than two brackets,
sketching graphs, graphs of circles, cubes and quadratics
(Edexcel guidance 4 SESSIONS)
MI Expand up three linear brackets, identify roots y intercept
and turning points from the equation in the appropriate form.
Apply quadratic knowledge to solving quadratic inequalities and
simultaneous equations where one equation is linear and one is
quadratic.
Return to Overview
SPECIFICATION REFERENCES
N8 Calculate exactly with … surds …
A4 Stage 9 Pillar 3 simplify and manipulate algebraic expressions … by: expanding products of two
or more binomials
A11 identify and interpret roots, intercepts, turning points of quadratic functions graphically; …
identify turning points by completing the square
A12 Stage 9 Pillar 3 recognise, sketch and interpret graphs of … quadratic functions, simple cubic
functions …
A18 solve quadratic equations (including those that require rearrangement) …; find approximate
solutions using a graph
A19 Stage 9 P2/5 solve two simultaneous equations in two variables (linear/linear or
linear/quadratic) algebraically; find approximate solutions using a graph
A20 find approximate solutions to equations numerically using iteration
A21 … derive an equation (or two simultaneous equations), solve the equation(s) and interpret the
solution.
A22 Stage 8 P5 solve linear inequalities in one or two variable(s), and quadratic inequalities in
one variable; represent the solution set on a number line, using set notation and on a graph
PRIOR KNOWLEDGE
Students should be able to solve quadratics and linear equations.
Students should be able to solve simultaneous equations algebraically.
KEYWORDS
Sketch, estimate, quadratic, cubic, function, factorising, simultaneous equation, graphical, algebraic

65
15: Quadratics, expanding more than two brackets, sketching graphs, graphs
of circles, cubes and quadratics (N8, A4, A11, A12, A18 to A22) Estimated 7 hours
Objectives Possible Success Criteria
By the end of the unit, students should be able to:
Sketch a graph of a quadratic function, by factorising or by using the formula, identifying
roots and y-intercept, turning point;
Be able to identify from a graph if a quadratic equation has any real roots;
Find approximate solutions to quadratic equations using a graph;
Expand the product of more than two linear expressions;
Sketch a graph of a quadratic function and a linear function, identifying intersection points;
Sketch graphs of simple cubic functions, given as three linear expressions;
Solve simultaneous equations graphically:
find approximate solutions to simultaneous equations formed from one linear function and
one quadratic function using a graphical approach;
find graphically the intersection points of a given straight line with a circle;
solve simultaneous equations representing a real-life situation graphically, and interpret
the solution in the context of the problem;
Solve quadratic inequalities in one variable, by factorising and sketching the graph to find
critical values;
Represent the solution set for inequalities using set notation, i.e. curly brackets and ‘is an
element of’ notation;
for problems identifying the solutions to two different inequalities, show this as the
intersection of the two solution sets, i.e. solution of x² – 3x – 10 < 0 as {x: –3 < x < 5};
Solve linear inequalities in two variables graphically;
Show the solution set of several inequalities in two variables on a graph;
Use iteration with simple converging sequences.
Expand x(x – 1)(x + 2).
Expand (x – 1)3.
Expand (x + 1)(x + 2)(x – 1).
Sketch y = (x + 1)2(x – 2).
Interpret a pair of simultaneous equations
as a pair of straight lines and their
solution as the point of intersection.
Be able to state the solution set of x² – 3x
– 10 < 0 as {x: x < -3} {x: x > 5}.

66
Opportunities for reasoning/problem solving Common Misconceptions
Match equations to their graphs and to real-life scenarios.
“Show that”-type questions will allow students to show a logical and clear chain of reasoning.
When estimating values from a graph, it
is important that students understand it is
an ‘estimate’.
It is important to stress that when
expanding quadratics, the x terms are
also collected together.
Quadratics involving negatives sometimes
cause numerical errors.
Notes Suggested Activities
The extent of algebraic iteration required needs to be confirmed.
You may want to extend the students to include expansions of more than three linear
expressions.
Practise expanding ‘double brackets’ with all combinations of positives and negatives.
Set notation is a new topic.
67
UNIT 16: Circle theorems and circle geometry (Edexcel guidance 6 SESSIONS)
MI Apply the circle theorems, and the arc and sector formulae.
Return to Overview
SPECIFICATION REFERENCES
A16 recognise and use the equation of a circle with centre at the origin; find the equation of
a tangent to a circle at a given point
G9 Stage 9 P3 identify and apply circle definitions and properties, including: centre, radius, chord,
diameter, circumference, tangent, arc, sector and segment
G10 apply and prove the standard circle theorems concerning angles, radii, tangents and
chords, and use them to prove related results
PRIOR KNOWLEDGE
Students should have practical experience of drawing circles with compasses.
Students should recall the words, centre, radius, diameter and circumference.
Students should recall the relationship of the gradient between two perpendicular lines.
Students should be able to find the equation of the straight line, given a gradient and a coordinate.
KEYWORDS
Radius, centre, tangent, circumference, diameter, gradient, perpendicular, reciprocal, coordinate,
equation, substitution, chord, triangle, isosceles, angles, degrees, cyclic quadrilateral, alternate,
segment, semicircle, arc, theorem

68
16a. Circle theorems (G9, G10) Estimated 5 hours
Objectives Possible Success Criteria
By the end of the sub-unit, students should be able to:
Recall the definition of a circle and identify (name) and draw parts of a circle, including
sector, tangent, chord, segment;
Prove and use the facts that:
the angle subtended by an arc at the centre of a circle is twice the angle subtended at
any point on the circumference;
the angle in a semicircle is a right angle;
the perpendicular from the centre of a circle to a chord bisects the chord;
angles in the same segment are equal;
alternate segment theorem;
opposite angles of a cyclic quadrilateral sum to 180°;
Understand and use the fact that the tangent at any point on a circle is perpendicular to the
radius at that point;
Find and give reasons for missing angles on diagrams using:
circle theorems;
isosceles triangles (radius properties) in circles;
the fact that the angle between a tangent and radius is 90°;
the fact that tangents from an external point are equal in length.
Justify clearly missing angles on diagrams
using the various circle theorems.
Opportunities for reasoning/problem solving Common Misconceptions
Problems that involve a clear chain of reasoning and provide counter-arguments to
statements.
Can be linked to other areas of mathematics by incorporating trigonometry and Pythagoras’
Theorem.
Much of the confusion arises from mixing
up the diameter and the radius.
Notes Suggested Activities
Reasoning needs to be carefully constructed and correct notation should be used throughout.
Students should label any diagrams clearly, as this will assist them; particular emphasis
should be made on labelling any radii in the first instance.
69
16b. Circle geometry (A16) Estimated 5 hours
Objectives Possible Success Criteria
By the end of the sub-unit, students should be able to:
Select and apply construction techniques and understanding of loci to draw graphs based on
circles and perpendiculars of lines;
Find the equation of a tangent to a circle at a given point, by:
finding the gradient of the radius that meets the circle at that point (circles all centre the
origin);
finding the gradient of the tangent perpendicular to it;
using the given point;
Recognise and construct the graph of a circle using x2 + y2 = r2 for radius r centred at the
origin of coordinates.
Find the gradient of a radius of a circle
drawn on a coordinate grid and relate this
to the gradient of the tangent.
Justify the relationship between the
gradient of a tangent and the radius.
Produce an equation of a line given a
gradient and a coordinate.
Opportunities for reasoning/problem solving Common Misconceptions
Justify if a straight-line graph would pass through a circle drawn on a coordinate grid.
Students find it difficult working with
negative reciprocals of fractions and
negative fractions.
Notes Suggested Activities
Work with positive gradients of radii initially and review reciprocals prior to starting this topic.
It is useful to start this topic through visual proofs, working out the gradient of the radius
and the tangent, before discussing the relationship.

70
UNIT 17: Changing the subject of formulae (more complex),
algebraic fractions, solving equations arising from algebraic
fractions, rationalising surds, proof
(Edexcel guidance 4 SESSIONS)
MI Manipulate complex equations including: algebraic fractions,
rationalising surds, and using function notation (including for
inverse functions); use these skills to reason a proof.
Return to Overview
SPECIFICATION REFERENCES
N8 … simplify surd expressions involving squares (e.g. √12 = √(4 × 3) = √4 × √3
= 2√3) and rationalise denominators
A4 Stage 9 P3 5 simplify and manipulate algebraic expressions (including those involving surds and
algebraic fractions) by:
collecting like terms
multiplying a single term over a bracket
taking out common factors
expanding products of two or more binomials
factorising quadratic expressions of the form x2 + bx + c, including the difference of two
squares; factorising quadratic expressions of the form ax2 + bx + c
simplifying expressions involving sums, products and powers, including the laws of indices
A5 Stage 9 P5… rearrange formulae to change the subject
A6 … argue mathematically to show algebraic expressions are equivalent, and use algebra to support
and construct arguments and proofs
A7 where appropriate, interpret simple expressions as functions with inputs and outputs; interpret
the reverse process as the ‘inverse function’; interpret the succession of two functions
as a ‘composite function’ (the use of formal function notation is expected)
A18 solve quadratic equations (including those that require rearrangement) algebraically by
factorising, …
PRIOR KNOWLEDGE
Students should be able to simplify surds.
Students should be able to use negative numbers with all four operations.
Students should be able to recall and use the hierarchy of operations.
KEYWORDS
Rationalise, denominator, surd, rational, irrational, fraction, equation, rearrange, subject, proof,
function notation, inverse, evaluate
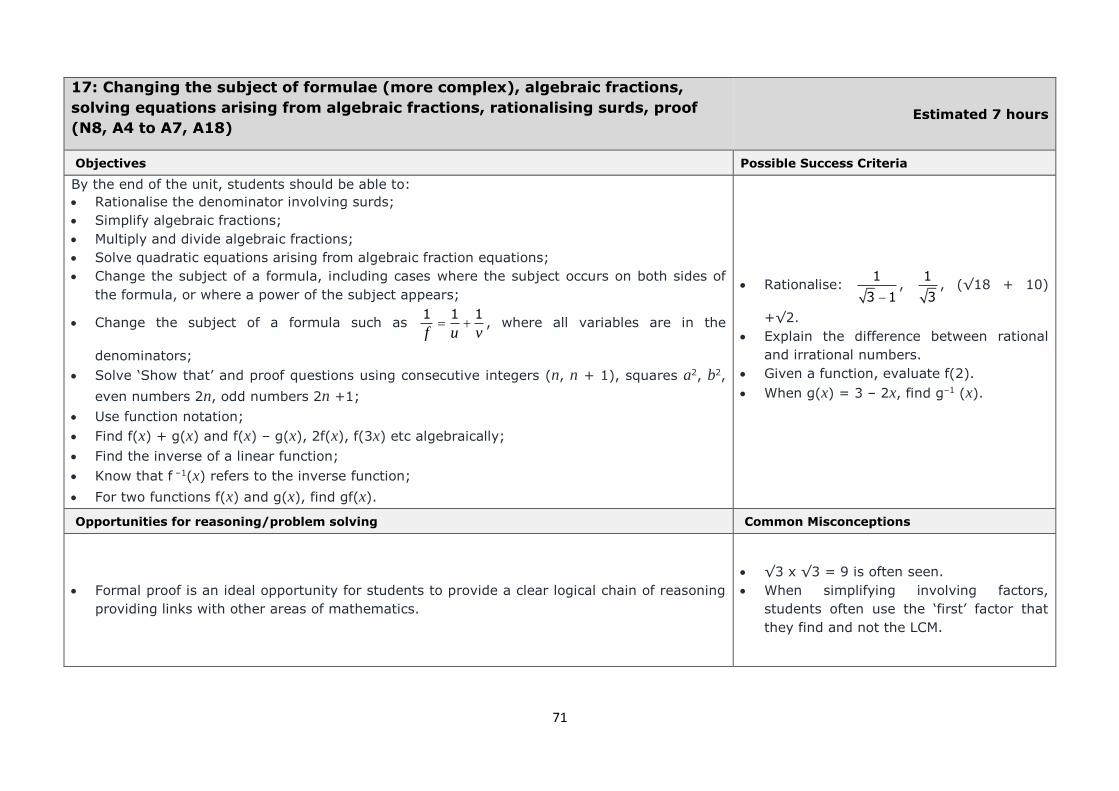
71
17: Changing the subject of formulae (more complex), algebraic fractions,
solving equations arising from algebraic fractions, rationalising surds, proof
(N8, A4 to A7, A18) Estimated 7 hours
Objectives Possible Success Criteria
By the end of the unit, students should be able to:
Rationalise the denominator involving surds;
Simplify algebraic fractions;
Multiply and divide algebraic fractions;
Solve quadratic equations arising from algebraic fraction equations;
Change the subject of a formula, including cases where the subject occurs on both sides of
the formula, or where a power of the subject appears;
Change the subject of a formula such as 1 1 1
f u v , where all variables are in the
denominators;
Solve ‘Show that’ and proof questions using consecutive integers (n, n + 1), squares a2, b2,
even numbers 2n, odd numbers 2n +1;
Use function notation;
Find f(x) + g(x) and f(x) – g(x), 2f(x), f(3x) etc algebraically;
Find the inverse of a linear function;
Know that f –1(x) refers to the inverse function;
For two functions f(x) and g(x), find gf(x).
Rationalise: 1
3 1,
1
3, (√18 + 10)
+√2.
Explain the difference between rational
and irrational numbers.
Given a function, evaluate f(2).
When g(x) = 3 – 2x, find g–1 (x).
Opportunities for reasoning/problem solving Common Misconceptions
Formal proof is an ideal opportunity for students to provide a clear logical chain of reasoning
providing links with other areas of mathematics.
√3 x √3 = 9 is often seen.
When simplifying involving factors,
students often use the ‘first’ factor that
they find and not the LCM.

72
Notes Suggested Activities
It is useful to generalise √m × √m = m.
Revise the difference of two squares to show why we use, for example, (√3 – 2) as the
multiplier to rationalise (√3 + 2).
Link collecting like terms to simplifying surds (Core 1 textbooks are a good source for
additional work in relation to simplifying surds).
Practice factorisation where the factor may involve more than one variable.
Emphasise that, by using the LCM for the denominator, the algebraic manipulation is easier.

73
18: Vectors and geometric proof
(Edexcel guidance 5 SESSIONS) MI Add subtract and scale vectors represented as column
vectors and diagrammatically, hence use vectors to construct geometric arguments and proof.
Return to Overview
SPECIFICATION REFERENCES
G25 apply addition and subtraction of vectors, multiplication of vectors by a scalar, and diagrammatic
and column representations of vectors; use vectors to construct geometric arguments and
proof
PRIOR KNOWLEDGE
Students will have used vectors to describe translations and will have knowledge of Pythagoras’
Theorem and the properties of triangles and quadrilaterals.
KEYWORDS
Vector, direction, magnitude, scalar, multiple, parallel, collinear, proof, ratio, column vector
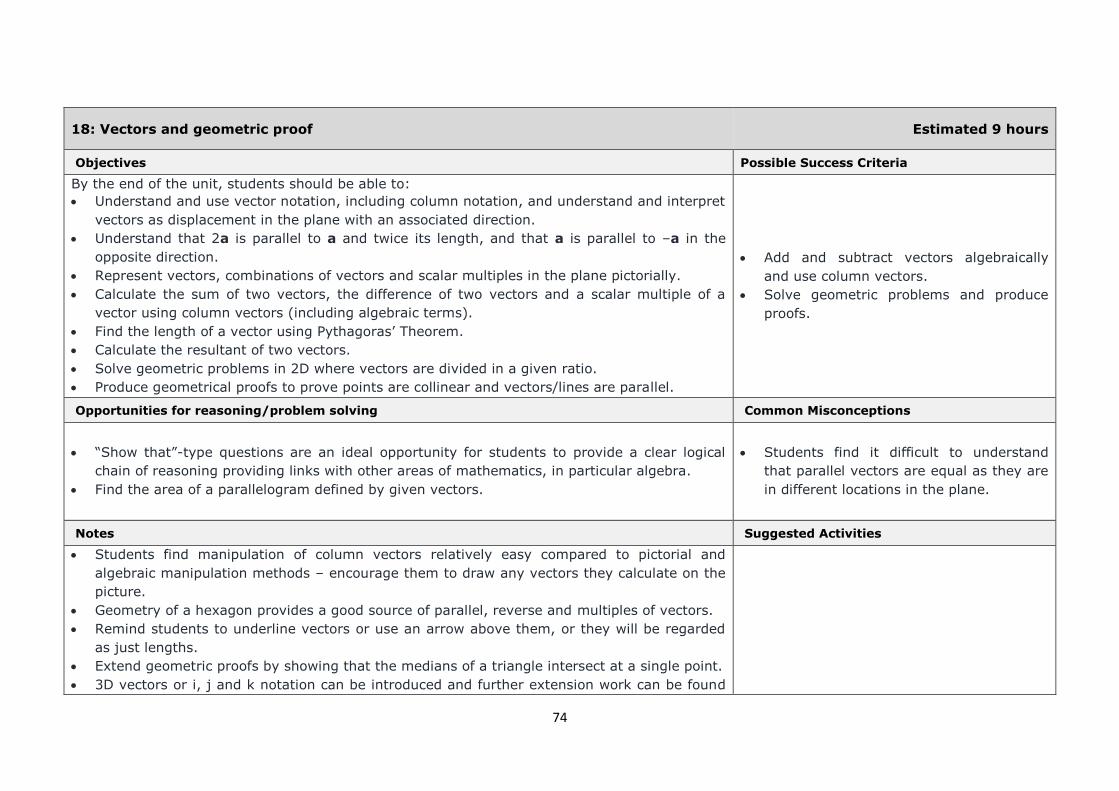
74
18: Vectors and geometric proof Estimated 9 hours
Objectives Possible Success Criteria
By the end of the unit, students should be able to:
Understand and use vector notation, including column notation, and understand and interpret
vectors as displacement in the plane with an associated direction.
Understand that 2a is parallel to a and twice its length, and that a is parallel to –a in the
opposite direction.
Represent vectors, combinations of vectors and scalar multiples in the plane pictorially.
Calculate the sum of two vectors, the difference of two vectors and a scalar multiple of a
vector using column vectors (including algebraic terms).
Find the length of a vector using Pythagoras’ Theorem.
Calculate the resultant of two vectors.
Solve geometric problems in 2D where vectors are divided in a given ratio.
Produce geometrical proofs to prove points are collinear and vectors/lines are parallel.
Add and subtract vectors algebraically
and use column vectors.
Solve geometric problems and produce
proofs.
Opportunities for reasoning/problem solving Common Misconceptions
“Show that”-type questions are an ideal opportunity for students to provide a clear logical
chain of reasoning providing links with other areas of mathematics, in particular algebra.
Find the area of a parallelogram defined by given vectors.
Students find it difficult to understand
that parallel vectors are equal as they are
in different locations in the plane.
Notes Suggested Activities
Students find manipulation of column vectors relatively easy compared to pictorial and
algebraic manipulation methods – encourage them to draw any vectors they calculate on the
picture.
Geometry of a hexagon provides a good source of parallel, reverse and multiples of vectors.
Remind students to underline vectors or use an arrow above them, or they will be regarded
as just lengths.
Extend geometric proofs by showing that the medians of a triangle intersect at a single point.
3D vectors or i, j and k notation can be introduced and further extension work can be found

75
in GCE Mechanics 1 textbooks.
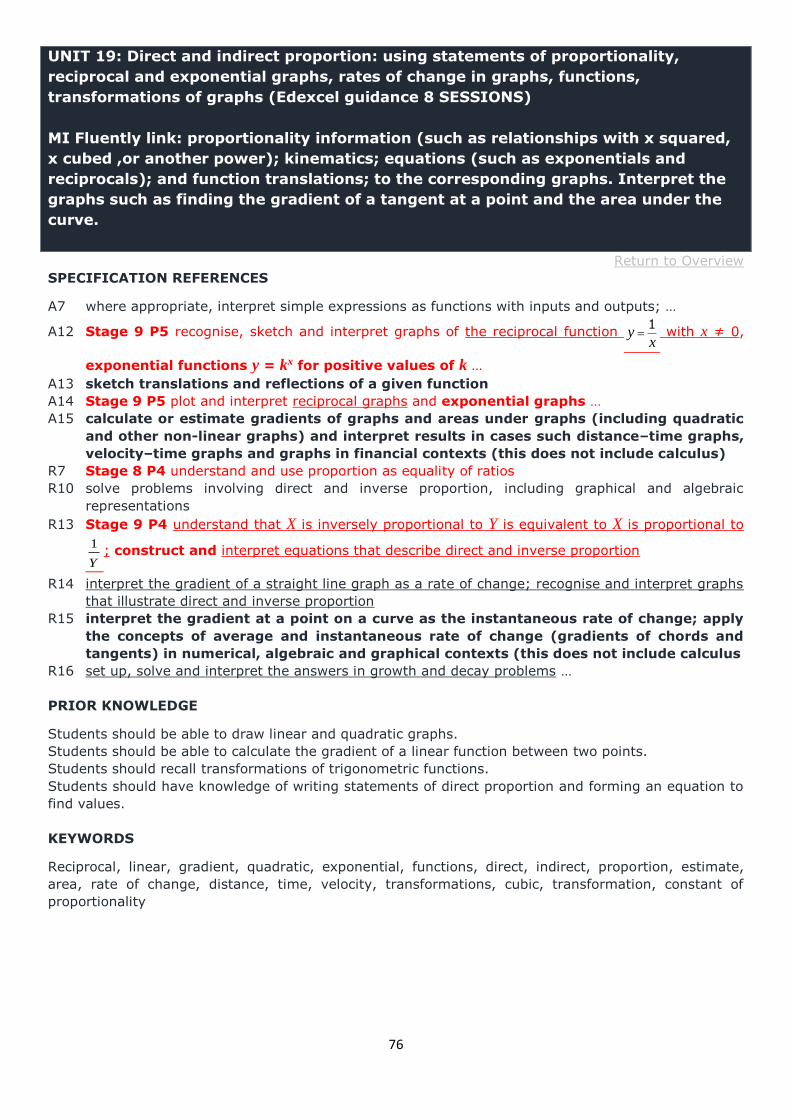
76
UNIT 19: Direct and indirect proportion: using statements of proportionality,
reciprocal and exponential graphs, rates of change in graphs, functions,
transformations of graphs (Edexcel guidance 8 SESSIONS)
MI Fluently link: proportionality information (such as relationships with x squared,
x cubed ,or another power); kinematics; equations (such as exponentials and
reciprocals); and function translations; to the corresponding graphs. Interpret the
graphs such as finding the gradient of a tangent at a point and the area under the
curve.
Return to Overview
SPECIFICATION REFERENCES
A7 where appropriate, interpret simple expressions as functions with inputs and outputs; …
A12 Stage 9 P5 recognise, sketch and interpret graphs of the reciprocal function 1
yx
with x ≠ 0,
exponential functions y = kx for positive values of k …
A13 sketch translations and reflections of a given function
A14 Stage 9 P5 plot and interpret reciprocal graphs and exponential graphs …
A15 calculate or estimate gradients of graphs and areas under graphs (including quadratic
and other non-linear graphs) and interpret results in cases such distance–time graphs,
velocity–time graphs and graphs in financial contexts (this does not include calculus)
R7 Stage 8 P4 understand and use proportion as equality of ratios
R10 solve problems involving direct and inverse proportion, including graphical and algebraic
representations
R13 Stage 9 P4 understand that X is inversely proportional to Y is equivalent to X is proportional to
1
Y; construct and interpret equations that describe direct and inverse proportion
R14 interpret the gradient of a straight line graph as a rate of change; recognise and interpret graphs
that illustrate direct and inverse proportion
R15 interpret the gradient at a point on a curve as the instantaneous rate of change; apply
the concepts of average and instantaneous rate of change (gradients of chords and
tangents) in numerical, algebraic and graphical contexts (this does not include calculus
R16 set up, solve and interpret the answers in growth and decay problems …
PRIOR KNOWLEDGE
Students should be able to draw linear and quadratic graphs.
Students should be able to calculate the gradient of a linear function between two points.
Students should recall transformations of trigonometric functions.
Students should have knowledge of writing statements of direct proportion and forming an equation to
find values.
KEYWORDS
Reciprocal, linear, gradient, quadratic, exponential, functions, direct, indirect, proportion, estimate,
area, rate of change, distance, time, velocity, transformations, cubic, transformation, constant of
proportionality
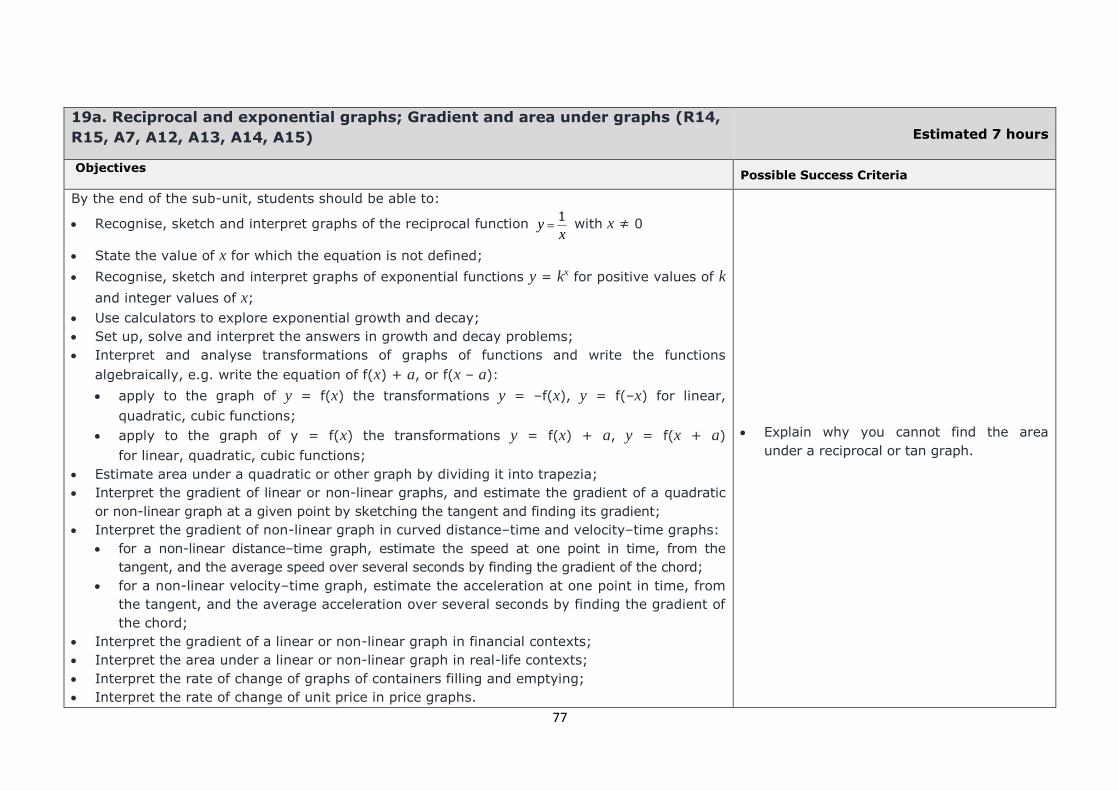
77
19a. Reciprocal and exponential graphs; Gradient and area under graphs (R14,
R15, A7, A12, A13, A14, A15) Estimated 7 hours
Objectives
Possible Success Criteria
By the end of the sub-unit, students should be able to:
Recognise, sketch and interpret graphs of the reciprocal function 1
yx
with x ≠ 0
State the value of x for which the equation is not defined;
Recognise, sketch and interpret graphs of exponential functions y = kx for positive values of k
and integer values of x;
Use calculators to explore exponential growth and decay;
Set up, solve and interpret the answers in growth and decay problems;
Interpret and analyse transformations of graphs of functions and write the functions
algebraically, e.g. write the equation of f(x) + a, or f(x – a):
apply to the graph of y = f(x) the transformations y = –f(x), y = f(–x) for linear,
quadratic, cubic functions;
apply to the graph of y = f(x) the transformations y = f(x) + a, y = f(x + a)
for linear, quadratic, cubic functions;
Estimate area under a quadratic or other graph by dividing it into trapezia;
Interpret the gradient of linear or non-linear graphs, and estimate the gradient of a quadratic
or non-linear graph at a given point by sketching the tangent and finding its gradient;
Interpret the gradient of non-linear graph in curved distance–time and velocity–time graphs:
for a non-linear distance–time graph, estimate the speed at one point in time, from the
tangent, and the average speed over several seconds by finding the gradient of the chord;
for a non-linear velocity–time graph, estimate the acceleration at one point in time, from
the tangent, and the average acceleration over several seconds by finding the gradient of
the chord;
Interpret the gradient of a linear or non-linear graph in financial contexts;
Interpret the area under a linear or non-linear graph in real-life contexts;
Interpret the rate of change of graphs of containers filling and emptying;
Interpret the rate of change of unit price in price graphs.
Explain why you cannot find the area
under a reciprocal or tan graph.

78
Opportunities for reasoning/problem solving Common Misconceptions
Interpreting many of these graphs in relation to their specific contexts. The effects of transforming functions is
often confused.
Notes Suggested Activities
Translations and reflections of functions are included in this specification, but not rotations or
stretches.
Financial contexts could include percentage or growth rate.
When interpreting rates of change with graphs of containers filling and emptying, a steeper
gradient means a faster rate of change.
When interpreting rates of change of unit price in price graphs, a steeper graph means larger
unit price.

79
19b. Direct and inverse proportion (R7, R10, R013, R16) Estimated 7 hours
Objectives Possible Success Criteria
By the end of the sub-unit, students should be able to:
Recognise and interpret graphs showing direct and indirect proportion;
Identify direct proportion from a table of values, by comparing ratios of values, for
x squared and x cubed relationships;
Write statements of proportionality for quantities proportional to the square, cube or other
power of another quantity;
Set up and use equations to solve word and other problems involving direct proportion;
Use y = kx to solve direct proportion problems, including questions where students find k,
and then use k to find another value;
Solve problems involving inverse proportion using graphs by plotting and reading values from
graphs;
Solve problems involving inverse proportionality;
Set up and use equations to solve word and other problems involving direct proportion or
inverse proportion.
Understand that when two quantities are
in direct proportion, the ratio between
them remains constant.
Know the symbol for ‘is proportional to’.
Opportunities for reasoning/problem solving Common Misconceptions
Justify and infer relationships in real-life scenarios to direct and inverse proportion such as
ice cream sales and sunshine.
Direct and inverse proportion can get
mixed up.
Notes Suggested Activities
Consider using science contexts for problems involving inverse proportionality, e.g. volume of
gas inversely proportional to the pressure or frequency is inversely proportional to
wavelength.