edinburgh research explorer · edinburgh research explorer ... pb & wellcome trust case control...
TRANSCRIPT

Edinburgh Research Explorer
Genome-wide association study identifies eight loci associatedwith blood pressureCitation for published version:Newton-Cheh, C, Johnson, T, Gateva, V, Tobin, MD, Bochud, M, Coin, L, Najjar, SS, Zhao, JH, Heath, SC,Eyheramendy, S, Papadakis, K, Voight, BF, Scott, LJ, Zhang, F, Farrall, M, Tanaka, T, Wallace, C,Chambers, JC, Khaw, K-T, Nilsson, P, van der Harst, P, Polidoro, S, Grobbee, DE, Onland-Moret, NC, Bots,ML, Wain, LV, Elliott, KS, Teumer, A, Luan, J, Lucas, G, Kuusisto, J, Burton, PR, Hadley, D, McArdle, WL,Brown, M, Dominiczak, A, Newhouse, SJ, Samani, NJ, Webster, J, Zeggini, E, Beckmann, JS, Bergmann,S, Lim, N, Song, K, Vollenweider, P, Waeber, G, Waterworth, DM, Yuan, X, Groop, L, Orho-Melander, M,Allione, A, Di Gregorio, A, Guarrera, S, Panico, S, Ricceri, F, Romanazzi, V, Sacerdote, C, Vineis, P,Barroso, I, Sandhu, MS, Luben, RN, Crawford, GJ, Jousilahti, P, Perola, M, Boehnke, M, Bonnycastle, LL,Collins, FS, Jackson, AU, Mohlke, KL, Stringham, HM, Valle, TT, Willer, CJ, Bergman, RN, Morken, MA,Döring, A, Gieger, C, Illig, T, Meitinger, T, Org, E, Pfeufer, A, Wichmann, HE, Kathiresan, S, Marrugat, J,O'Donnell, CJ, Schwartz, SM, Siscovick, DS, Subirana, I, Freimer, NB, Hartikainen, A-L, McCarthy, MI,O'Reilly, PF, Peltonen, L, Pouta, A, de Jong, PE, Snieder, H, van Gilst, WH, Clarke, R, Goel, A, Hamsten,A, Peden, JF, Seedorf, U, Syvänen, A-C, Tognoni, G, Lakatta, EG, Sanna, S, Scheet, P, Schlessinger, D,Scuteri, A, Dörr, M, Ernst, F, Felix, SB, Homuth, G, Lorbeer, R, Reffelmann, T, Rettig, R, Völker, U, Galan,P, Gut, IG, Hercberg, S, Lathrop, GM, Zelenika, D, Deloukas, P, Soranzo, N, Williams, FM, Zhai, G,Salomaa, V, Laakso, M, Elosua, R, Forouhi, NG, Völzke, H, Uiterwaal, CS, van der Schouw, YT, Numans,ME, Matullo, G, Navis, G, Berglund, G, Bingham, SA, Kooner, JS, Connell, JM, Bandinelli, S, Ferrucci, L,Watkins, H, Spector, TD, Tuomilehto, J, Altshuler, D, Strachan, DP, Laan, M, Meneton, P, Wareham, NJ,Uda, M, Jarvelin, M-R, Mooser, V, Melander, O, Loos, RJF, Elliott, P, Abecasis, GR, Caulfield, M, Munroe,PB & Wellcome Trust Case Control Consortium 2009, 'Genome-wide association study identifies eight lociassociated with blood pressure' Nature Genetics, vol 41, no. 6, pp. 666-76. DOI: 10.1038/ng.361
Digital Object Identifier (DOI):10.1038/ng.361
Link:Link to publication record in Edinburgh Research Explorer
Document Version:Peer reviewed version
Published In:Nature Genetics
Publisher Rights Statement:© 2009 Nature Publishing Group, a division of Macmillan Publishers Limited. All Rights Reserved.
General rightsCopyright for the publications made accessible via the Edinburgh Research Explorer is retained by the author(s)and / or other copyright owners and it is a condition of accessing these publications that users recognise andabide by the legal requirements associated with these rights.

Eight blood pressure loci identified by genome-wide associationstudy of 34,433 people of European ancestry
Christopher Newton-Cheh1,2,3,94, Toby Johnson4,5,6,94, Vesela Gateva7,94, Martin DTobin8,94, Murielle Bochud5, Lachlan Coin9, Samer S Najjar10, Jing Hua Zhao11,12, Simon CHeath13, Susana Eyheramendy14,15, Konstantinos Papadakis16, Benjamin F Voight1,3,Laura J Scott7, Feng Zhang17, Martin Farrall18,19, Toshiko Tanaka20,21, Chris Wallace22,23,John C Chambers9, Kay-Tee Khaw12,24, Peter Nilsson25, Pim van der Harst26, SilviaPolidoro27, Diederick E Grobbee28, N Charlotte Onland-Moret28,29, Michiel L Bots28, LouiseV Wain8, Katherine S Elliott19, Alexander Teumer30, Jian’an Luan11, Gavin Lucas31,
Correspondence to: Gonçalo Abecasis, Center for Statistical Genetics, Department of Biostatistics, University of Michigan School ofPublic Health, 1420 Washington Heights, Ann Arbor, MI 48109, Phone 734 763 4901, Fax 734 615 8322, Email:[email protected], Mark Caulfield, Clinical Pharmacology, William Harvey Research Institute, Barts and The London,Charterhouse Square, London, EC1M 6BQ, Tel: 02078823402, Fax: 02078823408, Email: [email protected], PatriciaMunroe, Clinical Pharmacology, William Harvey Research Institute, Barts and The London, Charterhouse Square, London, EC1M6BQ, Tel: 02078823410, Fax: 02078823408, email: [email protected], Christopher Newton-Cheh, Center for GeneticResearch, Cardiovascular Research Center, Massachusetts General Hospital, 185 Cambridge Street, CPZN 5.242, Boston, MA 02114,Tel: +1 617 643 3615, Fax: 617 249 0127, Email: [email protected] authors contributed equally.95These authors contributed equally.
Author contributions (alphabetical)Project conception, design, management: ARYA: M.L.B., C.S.U.; BLSA: L.F.; B58C-T1DGC: D.P.S.; B58C-WTCCC: D.P.S.;BRIGHT: M.Brown, M.C., J.M.C., A. Dominiczak, M.F., P.B.M., N.J.S., J.W.; CoLaus: J.S.B., S.Bergmann, M.Bochud, V.M. (PI),P.Vollenweider (PI), G.W., D.M.W.; DGI: D.A., C.N.-C., L.G.; EPIC-Norfolk-GWAS: I.B., P.D., R.J.F.L., M.S.S., N.J.W., J.H.Z.EPIC-Italy: S. Polidoro, P.Vineis. Fenland Study: R.J.F.L., N.G. F., N.J.W.; Finrisk97: L.P., V.S.; FUSION: R.N.B., M Boehnke,F.S.C., K.L.M., L.J.S., T.V., J.T.; InCHIANTI: S. Bandinelli., L.F.; KORA: A. Döring, C.G., T.I., M.L., T.M., E.O., H.E.W. (PI);LOLIPOP: J.C.C., P.E., J.S.K. (PI); MDC-CC: G.B., O.M.; MPP: G.B., O.M.; MIGen: D.A., R.E., S.K., J.M., O.M., C.J.O., V.S.,S.M.S., D.S.S.; METSIM: J.K., M.L.; NFBC1966: P.E., M.-R.J.; PREVEND: P.E.d.J. (PI), G.N., W.H.v.G.; PROCARDIS: R.C.,M.F., A.H., J.F.P., U.S., G.T., H.W.(PI); PROSPECT-EPIC. N.C.O.-M., Y.T.v.d.S.; SardiNIA: E.G.L., D.S.; SHIP: M.D., S.B.F.,G.H., R.L., T.R., R.R., U.V., H.V.; SUVIMAX: P.M.; TwinsUK: P.D., T.D.S. (PI); UHP: D.E.G., M.E.N.Phenotype collection, data management: ARYA: M.L.B., C.S.U.; B58C-T1DGC: D.H., W.L.M., D.P.S.; B58C-WTCCC: D.H.,K.P., D.P.S.; BRIGHT: M. Brown, M.C., J.M.C., A.Dominiczak, M.F., P.B.M., N.J.S., J.W.; CoLaus: G.W.; DGI: L.G., O.M.;EPIC-Italy: P. Vineis (PI); Finrisk97: P.J., M.P., V.S.;FUSION: J.T., T.V.; KORA: A. Doring, C.G., T.I.; MDC-CC: O.M.; MPP:O.M., P.N.; MIGen: D.A., R.E., S.K., J.M., O.M., C.J.O., S.M.S., D.S.S., V.S.; NFBC1966: A.-L.H., M.-R.J., A.P.; PREVEND:P.E.d.J., G.N., P.v.d.H., W.H.v.G.; PROCARDIS: R.C., A.H., U.S., G.T.; PROSPECT-EPIC. N.C.O.-M., Y.T.v.d.S.; SardiNIA:S.S.N., A.S.; SHIP: M.D., R.L., R.R., H.V.; SUVIMAX: P.G., S.H.; TwinsUK: F.M.W.; UHP: D.E.G., M.E.N.Genome-wide, validation genotyping: B58C-T1DGC: W.L.M.; B58C-WTCCC: W.L.M.; DGI: D.A., O.M., M.O.-M.; EPIC-Norfolk-GWAS: I.B., P.D., N.J.W., J.H.Z.; EPIC-Norfolk-replication: S.A.B., K.-T.K., R.J.F.L., R.N.L., N.J.W.; EPIC-Italy:G.M.; EPIC-Italy: A.A., A.d.G., S.G., V.R.; Finrisk97: G.J.C., C.N.-C.; FUSION: L.L.B., M.A.M.; KORA: T.I., T.M., E.O., A.P.;MDC-CC: O.M., M.O.-M.; MPP: O.M., M.O.-M.; NFBC1966: P.E., N.B.F., M.-R.J., M.I.M., L.P. ; PREVEND: G.N., P.v.d.H. ;W.H.v.G.; PROCARDIS: S.C.H., G.M.L., A.-C.S.; SardiNIA: M.U.; SHIP: F.E., G.H., A.T., U.V.; SUVIMAX: I.G.G., S.C.H.,G.M.L., D.Z.; TwinsUK: P.D.Data analysis: BLSA: T.T.; B58C-T1DGC: D.H., S.H., D.P.S.; B58C-WTCCC: P.R.B., D.H., K.P., D.P.S, M.D.T.; B58C-T1DGC:D.H., S.H., D.P.S.; BRIGHT: S.J.N., C.W., E.Z.; CoLaus: S. Bergmann, M. Bochud, T.J., N.L., K.S., X.Y., DGI: O.M., C.N.-C.,M.O.-M., B.F.V.; EPIC-Norfolk-GWAS: R.J.F.L., J.H.Z.; EPIC-Norfolk-replication: S.A.B., K.-T.K., R.J.F.L., R.N.L., N.J.W.;EPIC-Italy: S.G., G.M., S. Panico, S. Polidoro, F.R., C.S., P. Vineis; Fenland Study: J.L.; Finrisk97: C.N.-C.; FUSION: A.U.J.,L.J.S., H.M.S., C.J.W.; InCHIANTI: T.T.; KORA: S.E., C.G., M.L., E.O.; LOLIPOP: J.C.C.; MDC-CC: O.M., M.O.-M.; MPP:O.M., M.O.-M.; MIGen: R.E., G.L., I.S., B.F.V.; NFBC1966: L.C., P.F.O.; PREVEND: H.S., P.v.d.H.; PROCARDIS: M.F., A.G.,J.F.P.; SardiNIA: V.G., S.S., P.S.; SHIP: F.E., G.H., A.T., U.V.; SUVIMAX: S.C.H., T.J., P.M.; TwinsUK: N.S., F.Z., G.Z.Analysis group. G.R.A., M.C., V.G., T.J., P.B.M., C.N.-C., M.D.T., L.V.W.Writing group: G.R.A., M.C., P.E., V.G., T.J., P.B.M., C.N.-C., M.D.T.
COMPETING INTERESTS STATEMENTThe following authors declare the following potential conflicts of interest: N.L., V.M., K.S., D.M.W. and X.Y. are all full-timeemployees at GlaxoSmithKline. P. Vollenweider and G.W received financial support from GlaxoSmithKline to assemble the CoLausstudy. No other authors reported conflicts of interest.
NIH Public AccessAuthor ManuscriptNat Genet. Author manuscript; available in PMC 2010 September 21.
Published in final edited form as:Nat Genet. 2009 June ; 41(6): 666–676. doi:10.1038/ng.361.
NIH
-PA Author Manuscript
NIH
-PA Author Manuscript
NIH
-PA Author Manuscript

Johanna Kuusisto32, Paul R Burton8, David Hadley16, Wendy L McArdle33, Wellcome TrustCase Control Consortium34, Morris Brown35, Anna Dominiczak36, Stephen J Newhouse22,Nilesh J Samani37, John Webster38, Eleftheria Zeggini19,39, Jacques S Beckmann4,40, SvenBergmann4,6, Noha Lim41, Kijoung Song41, Peter Vollenweider42, Gerard Waeber42, DawnM Waterworth41, Xin Yuan41, Leif Groop43,44, Marju Orho-Melander25, Alessandra Allione27,Alessandra Di Gregorio27,45, Simonetta Guarrera27, Salvatore Panico46, Fulvio Ricceri27,Valeria Romanazzi27,45, Carlotta Sacerdote47, Paolo Vineis9,27, Inês Barroso12,39, ManjinderS Sandhu11,12,24, Robert N Luben12,24, Gabriel J. Crawford3, Pekka Jousilahti48, MarkusPerola48,49, Michael Boehnke7, Lori L Bonnycastle50, Francis S Collins50, Anne UJackson7, Karen L Mohlke51, Heather M Stringham7, Timo T Valle52, Cristen J Willer7,Richard N Bergman53, Mario A Morken50, Angela Döring15, Christian Gieger15, ThomasIllig15, Thomas Meitinger54,55, Elin Org56, Arne Pfeufer54, H Erich Wichmann15,57, SekarKathiresan1,2,3, Jaume Marrugat31, Christopher J O’Donnell58,59, Stephen M Schwartz60,61,David S Siscovick60,61, Isaac Subirana31,62, Nelson B Freimer63, Anna-Liisa Hartikainen64,Mark I McCarthy19,65,66, Paul F O’Reilly9, Leena Peltonen39,49, Anneli Pouta64,67, Paul E deJong68, Harold Snieder69, Wiek H van Gilst26, Robert Clarke70, Anuj Goel18,19, AndersHamsten71, John F Peden18,19, Udo Seedorf72, Ann-Christine Syvänen73, GiovanniTognoni74, Edward G Lakatta10, Serena Sanna75, Paul Scheet76, David Schlessinger77,Angelo Scuteri78, Marcus Dörr79, Florian Ernst30, Stephan B Felix79, Georg Homuth30,Roberto Lorbeer80, Thorsten Reffelmann79, Rainer Rettig81, Uwe Völker30, Pilar Galan82,Ivo G Gut13, Serge Hercberg82, G Mark Lathrop13, Diana Zeleneka13, Panos Deloukas12,39,Nicole Soranzo17,39, Frances M Williams17, Guangju Zhai17, Veikko Salomaa48, MarkkuLaakso32, Roberto Elosua31,62, Nita G Forouhi11, Henry Völzke80, Cuno S Uiterwaal28,Yvonne T van der Schouw28, Mattijs E Numans28, Giuseppe Matullo27,45, Gerjan Navis68,Göran Berglund25, Sheila A Bingham12,83, Jaspal S Kooner84, Andrew D Paterson85, JohnM Connell36, Stefania Bandinelli86, Luigi Ferrucci21, Hugh Watkins18,19, Tim D Spector17,Jaakko Tuomilehto52,87,88, David Altshuler1,3,89,90, David P Strachan16, Maris Laan56, PierreMeneton91, Nicholas J Wareham11,12, Manuela Uda75, Marjo-Riitta Jarvelin9,67,92, VincentMooser41, Olle Melander25, Ruth JF Loos11,12, Paul Elliott9,95, Goncalo R Abecasis93,95,Mark Caulfield22,95, and Patricia B Munroe22,95
1 Center for Human Genetic Research, Massachusetts General Hospital, 185 Cambridge Street,Boston, MA 02114, USA 2 Cardiovascular Research Center, Massachusetts General Hospital,Boston, Massachusetts 02114, USA 3 Program in Medical and Population Genetics, BroadInstitute of Harvard and Massachusetts Institute of Technology, Cambridge, Massachusetts,02142, USA 4 Department of Medical Genetics, University of Lausanne, 1005 Lausanne,Switzerland 5 University Institute for Social and Preventative Medicine, Centre HospitalierUniversitaire Vaudois (CHUV) and University of Lausanne, 1005 Lausanne, Switzerland 6 SwissInstitute of Bioinformatics, Switzerland 7 Department of Biostatistics and Center for StatisticalGenetics, University of Michigan, Ann Arbor, MI 48109, USA 8 Departments of Health Sciences &Genetics, Adrian Building, University of Leicester, University Road, Leicester LE1 7RH 9Department of Epidemiology and Public Health, Imperial College London, St Mary’s Campus,Norfolk Place, London W2 1PG, UK 10 Laboratory of Cardiovascular Science, IntramuralResearch Program, National Institute on Aging, National Institutes of Health, Baltimore, Maryland,USA 21224 11 MRC Epidemiology Unit, Institute of Metabolic Science, Addenbrooke’s Hospital,Cambridge CB2 0QQ, UK 12 Cambridge - Genetics of Energy Metabolism (GEM) Consortium,Cambridge, UK 13 Centre National de Génotypage, 2 rue Gaston Crémieux, CP 5721, 91 057Evry Cedex, France 14 Pontificia Universidad Catolica de Chile, Vicuna Mackenna 4860, Facultadde Matematicas, Casilla 306, Santiago 22, Chile, 7820436 15 Institute of Epidemiology, HelmholtzZentrum München, German Research Centre for Environmental Health, 85764 Neuherberg,Germany 16 Division of Community Health Sciences, St George’s, University of London, LondonSW17 0RE, UK 17 Dept of Twin Research & Genetic Epidemiology, King’s College London,
Newton-Cheh et al. Page 2
Nat Genet. Author manuscript; available in PMC 2010 September 21.
NIH
-PA Author Manuscript
NIH
-PA Author Manuscript
NIH
-PA Author Manuscript

London SE1 7EH 18 Dept. Cardiovascular Medicine, University of Oxford 19 The Wellcome TrustCentre for Human Genetics, Roosevelt Drive, Oxford, OX3 7BN, UK 20 Medstar ResearchInstitute, 3001 S. Hanover Street, Baltimore, MD 21250, USA 21 Clinical Research Branch,National Institute on Aging, Baltimore, MD, 21250 USA 22 Clinical Pharmacology and TheGenome Centre, William Harvey Research Institute, Barts and The London School of Medicineand Dentistry, Queen Mary University of London, London EC1M 6BQ 23 JDRF/WT Diabetes andInflammation Laboratory, Cambridge Institute for Medical Research University of Cambridge,Wellcome Trust/MRC Building, Addenbrooke’s Hospital Cambridge, CB2 0XY 24 Department ofPublic Health and Primary Care, Institute of Public Health, University of Cambridge, CambridgeCB2 2SR, UK 25 Department of Clinical Sciences, Lund University, Malmö University Hospital,SE-20502 Malmö, Sweden 26 Department of Cardiology University Medical Center Groningen,University of Groningen, Hanzeplein 1, 9700 RB Groningen, The Netherlands 27 ISI Foundation(Institute for Scientific Interchange), Villa Gualino, Torino, 10133, Italy 28 Julius Center for HealthSciences and Primary Care, University Medical Center Utrecht, STR 6.131, PO Box 85500, 3508GA Utrecht, The Netherlands 29 Complex Genetics Section, Department of Medical Genetics -DBG, University Medical Center Utrecht, STR 2.2112, PO Box 85500, 3508 GA Utrecht, TheNetherlands 30 Interfaculty Institute for Genetics and Functional Genomics, Ernst-Moritz-Arndt-University Greifswald, 17487 Greifswald, Germany 31 Cardiovascular Epidemiology and Genetics,Institut Municipal d’Investigació Mèdica, Barcelona, Spain 32 Department of Medicine University ofKuopio 70210 Kuopio, Finland 33 ALSPAC Laboratory, Department of Social Medicine, Universityof Bristol, BS8 2BN, UK 34 A full list of authors is provided in the supplementary methods online 35
Clinical Pharmacology Unit, University of Cambridge, Addenbrookes Hospital, Cambridge, UKCB2 2QQ 36 BHF Glasgow Cardiovascular Research Centre, University of Glasgow, Glasgow,UK G12 8TA 37 Dept of Cardiovascular Science, University of Leicester, Glenfield Hospital, GrobyRoad, Leicester, LE3 9QP, UK 38 Aberdeen Royal Infirmary, Aberdeen, UK 39 Wellcome TrustSanger Institute, Wellcome Trust Genome Campus, Hinxton, Cambridge CB10 1SA, UK 40
Service of Medical Genetics, Centre Hospitalier Universitaire Vaudois (CHUV), Lausanne, 1011,Switzerland 41 Genetics Division, GlaxoSmithKline, King of Prussia, PA 19406, USA 42
Department of Internal Medicine, Centre Hospitalier Universitaire Vaudois (CHUV) 1011Lausanne, Switzerland 43 Department of Clinical Sciences, Diabetes and EndocrinologyResearch Unit, University Hospital, Malmö 44 Lund University, Malmö S-205 02, Sweden 45
Department of Genetics, Biology and Biochemistry, University of Torino, Torino, 10126, Italy 46
Department of Clinical and Experimental Medicine, Federico II University, Naples, 80100, Italy 47
Unit of Cancer Epidemiology, University of Turin and Centre for Cancer Epidemiology andPrevention (CPO Piemonte), Turin, 10126, Italy 48 National Institute for Welfare and Health P.O.Box 30, FI-00271 Helsinki, Finland 49 Institute for Molecular Medicine Finland FIMM, University ofHelsinki and National Public Health Institute 50 Genome Technology Branch, National HumanGenome Research Institute, Bethesda, MD 20892, USA 51 Department of Genetics, University ofNorth Carolina, Chapel Hill, NC 27599, USA 52 Diabetes Unit, Department of Epidemiology andHealth Promotion, National Public Health Institute, 00300 Helsinki, Finland 53 Physiology andBiophysics USC School of Medicine 1333 San Pablo Street, MMR 626 Los Angeles, California90033 54 Institute of Human Genetics, Helmholtz Zentrum Munchen, German Research Centrefor Environmental Health, 85764 Neuherberg, Germany 55 Institute of Human Genetics,Technische Universität München, 81675 Munich, Germany 56 Institute of Molecular and CellBiology, University of Tartu, 51010 Tartu, Estonia 57 Ludwig Maximilians University, IBE, Chair ofEpidemiology, Munich 58 Cardiovascular Research Center and Cardiology Division,Massachusetts General Hospital, Boston, Massachusetts 02114, USA 59 Framingham HeartStudy and National, Heart, Lung, and Blood Institute, Framingham, Massachusetts 01702, USA 60
Cardiovascular Health Research Unit, Departments of Medicine and Epidemiology, University ofWashington, Seattle, Washington, 98101 USA 61 Department of Epidemiology, University ofWashington, Seattle, Washington, 98195 USA 62 CIBER Epidemiología y Salud Pública,
Newton-Cheh et al. Page 3
Nat Genet. Author manuscript; available in PMC 2010 September 21.
NIH
-PA Author Manuscript
NIH
-PA Author Manuscript
NIH
-PA Author Manuscript

Barcelona, Spain 63 Center for Neurobehavioral Genetics, Gonda Center, Room 3506, 695Charles E Young Drive South, Box 951761, UCLA, Los Angeles, CA 90095 64 Department ofClinical Sciences/Obstetrics and Gynecology, P.O. Box 5000 Fin-90014, University of Oulu,Finland 65 Oxford Centre for Diabetes, Endocrinology and Metabolism, University of Oxford,Churchill Hospital, Old Road, Headington, Oxford OX3 7LJ, UK 66 Oxford NIHR BiomedicalResearch Centre, Churchill Hospital, Old Road, Headington, Oxford, UK OX3 7LJ 67 Departmentof Child and Adolescent Health, National Public Health Institute (KTL), Aapistie 1, P.O. Box 310,FIN-90101 Oulu, Finland 68 Division of Nephrology, Department of Medicine University MedicalCenter Groningen, University of Groningen, Hanzeplein 1, 9700 RB Groningen, The Netherlands69 Unit of Genetic Epidemiology and Bioinformatics, Department of Epidemiology UniversityMedical Center Groningen, University of Groningen, Hanzeplein 1, 9700 RB Groningen, TheNetherlands 70 Clinical Trial Service Unit and Epidemiological Studies Unit (CTSU), University ofOxford, Richard Doll Building, Roosevelt Drive, Oxford, OX3 7LF, UK 71 AtherosclerosisResearch Unit, Department of Medicine Solna, Karolinska Institutet, Karolinska UniversityHospital Solna, Building L8:03, S-17176 Stockholm, Sweden 72 Leibniz-Institut fürArterioskleroseforschung an der Universität Münster, Domagkstr. 3, D-48149, Münster, Germany73 Molecular Medicine, Dept. Medical Sciences, Uppsala University, SE-751 85 Uppsala, Sweden74 Consorzio Mario Negri Sud, Via Nazionale, 66030 Santa Maria Imbaro (Chieti), Italy 75 Istitutodi Neurogenetica e Neurofarmacologia, CNR, Monserrato, 09042 Cagliari, Italy 76 Department ofEpidemiology, Univ. of Texas M. D. Anderson Cancer Center, Houston, TX 77030 77 Laboratoryof Genetics, Intramural Research Program, National Institute on Aging, National Institutes ofHealth, Baltimore, Maryland, USA 21224 78 Unitá Operativa Geriatria, Istituto Nazionale Ricoveroe Cura per Anziani (INRCA) IRCCS, Rome, Italy 79 Department of Internal Medicine B, Ernst-Moritz-Arndt-University Greifswald, 17487 Greifswald, Germany 80 Institute for CommunityMedicine, Ernst-Moritz-Arndt-University Greifswald, 17487 Greifswald, Germany 81 Institute ofPhysiology, Ernst-Moritz-Arndt-University Greifswald, 17487 Greifswald, Germany 82 U557 InstitutNational de la Sante et de la Recherche Médicale, U1125 Institut National de la RechercheAgronomique, Université Paris 13, 74 rue Marcel Cachin, 93017 Bobigny Cedex, France 83 MRCDunn Human Nutrition Unit, Wellcome Trust/MRC Building, Cambridge CB2 0XY, U.K 84 NationalHeart and Lung Institute, Imperial College London SW7 2AZ 85 Program in Genetics and GenomeBiology, Hospital for Sick Children, Toronto, Canada, Dalla Lana School of Public Health,University of Toronto, Toronto, Canada M5T 3M7 86 Geriatric Rehabilitation Unit, AziendaSanitaria Firenze (ASF), 50125, Florence, Italy 87 Department of Public Health, University ofHelsinki, 00014 Helsinki, Finland 88 South Ostrobothnia Central Hospital, 60220 Seinäjoki,Finland 89 Department of Medicine and Department of Genetics, Harvard Medical School, Boston,Massachusetts 02115, USA 90 Diabetes Unit, Massachusetts General Hospital, Boston,Massachusetts 02114, USA 91 U872 Institut National de la Santét de la Recherche Médicale,Faculté de Médecine Paris Descartes, 15 rue de l’Ecole de Medé0cine, 75270 Paris Cedex,France 92 Institute of Health Sciences and Biocenter Oulu, Aapistie 1, FIN-90101, University ofOulu, Finland 93 Center for Statistical Genetics, Department of Biostatistics, University ofMichigan, Ann Arbor, Michigan 48109 USA
AbstractElevated blood pressure is a common, heritable cause of cardiovascular disease worldwide. Todate, identification of common genetic variants influencing blood pressure has proven challenging.We tested 2.5m genotyped and imputed SNPs for association with systolic and diastolic bloodpressure in 34,433 subjects of European ancestry from the Global BPgen consortium and followedup findings with direct genotyping (N≤71,225 European ancestry, N=12,889 Indian Asianancestry) and in silico comparison (CHARGE consortium, N=29,136). We identified associationbetween systolic or diastolic blood pressure and common variants in 8 regions near the CYP17A1(P=7×10⁻²⁴), CYP1A2 (P=1×10⁻²³), FGF5 (P=1×10⁻²¹), SH2B3 (P=3×10⁻¹⁸), MTHFR
Newton-Cheh et al. Page 4
Nat Genet. Author manuscript; available in PMC 2010 September 21.
NIH
-PA Author Manuscript
NIH
-PA Author Manuscript
NIH
-PA Author Manuscript

(P=2×10⁻¹³), c10orf107 (P=1×10⁻⁹), ZNF652 (P=5×10⁻⁹) and PLCD3 (P=1×10⁻⁸) genes. Allvariants associated with continuous blood pressure were associated with dichotomoushypertension. These associations between common variants and blood pressure and hypertensionoffer mechanistic insights into the regulation of blood pressure and may point to novel targets forinterventions to prevent cardiovascular disease.
The World Health Organization estimated that, in 2005, the annual death toll fromcardiovascular disease reached 17.5 million worldwide1–3. Increases in systolic anddiastolic blood pressure (SBP, DBP), even within the normal range, have a continuous andgraded impact on cardiovascular disease risk and are major contributors in half of allcardiovascular deaths 2,3. Lifestyle influences, including dietary sodium intake, alcoholexcess, elevated body mass index and lack of exercise, are known to increase bloodpressure4. Studies of familial aggregation suggest that there is also a substantial heritablecomponent to blood pressure5. Studies of rare Mendelian disorders of hypertension andhypotension have produced the most significant progress toward understanding the heritablebasis of blood pressure, showing that mutations in genes influencing renal salt handling canhave a severe impact on blood pressure6. Detailed study of these genes has identified rarevariants (minor allele frequency [MAF] <0.1%) that impact blood pressure in the generalpopulation7 and evolving evidence suggests a potential role for common variation in someof the same genes8–10.
Identification of common variants affecting blood pressure using genome-wide associationstudies (GWAS) has proved challenging, compared to other common complexdisorders11,12. However, meta-analysis of multiple studies with large total sample sizes hasthe potential to facilitate detection of variants with modest effects. We therefore formed theGlobal Blood Pressure Genetics (Global BPgen) consortium and conducted meta-analysis ofGWAS in 34,433 individuals of European ancestry with SBP and DBP measurements (stage1), followed by large-scale direct genotyping (stage 2a) and in silico (stage 2b) analyses(Supplementary Figure 1). Our analyses identified eight loci demonstrating genome-widesignificant association with systolic or diastolic blood pressure, with each locus alsoproviding substantial evidence for association with hypertension.
RESULTSGenome-wide association for blood pressure
Global BPgen includes 17 cohorts of European ancestry ascertained through population-based sampling or case-control studies. In our primary analysis (stage 1), we examinedindividuals aged ≤70 years from 13 population-based studies and from control groups from4 case-control studies (Table 1). Individuals treated for hypertension were imputed to have15 mm Hg higher SBP and 10 mm Hg higher DBP than the observed measurementsas thishas been shown to reduce bias and improve statistical power13. SBP and (separately) DBPmeasures were each adjusted for age, age2, body mass index and any study-specificgeographic covariates within cohort- and gender-specific regression analyses. Genome-wideSNP genotyping was performed on a variety of platforms and subjected to standard qualitycontrol measures (Methods, Supplementary Table 1). Genotypes for ~2.5M autosomal SNPsin the HapMap CEU sample were then imputed in each study and tested for associationunder an additive genetic model with SBP and DBP separately. Test statistics fromassociation analysis of SBP and DBP from each cohort were adjusted using genomiccontrol14 to avoid inflation of results due to inter-individual relatedness or residualpopulation stratification, and to ensure good calibration of test statistics. Meta-analysis ofresults was performed using inverse variance weights. Test statistic inflation post-meta-analysis was modest (λGC = 1.08 SBP; λGC = 1.07 DBP); genomic control correction was
Newton-Cheh et al. Page 5
Nat Genet. Author manuscript; available in PMC 2010 September 21.
NIH
-PA Author Manuscript
NIH
-PA Author Manuscript
NIH
-PA Author Manuscript

applied again. The plots of test statistics against expectations under the null suggest anexcess of extreme values (cohort-specific and meta-analysis quantile-quantile plots arepresented in Supplementary Figure 2).
On meta-analysis of results from 34,433 individuals in stage 1, we observed 11 independentsignals with P < 10−5 for SBP and 15 for DBP, with two results attaining P < 5×10⁻⁸,corresponding to genome-wide significance when adjusting for ~1m independent commonvariant tests estimated for samples of European ancestry (Supplementary Figure 3)15.
Follow-up of strongest SBP and DBP signals in additional samplesTo strengthen support for association we undertook two analyses. First, we selected 12 SNPsfor follow-up genotyping in up to 71,225 individuals drawn from 13 cohorts of Europeanancestry and up to 12,889 individuals of Indian Asian ancestry from one cohort (stage 2a,Table 1, Supplementary Figure 1, Supplementary Table 2). Second, we performed areciprocal exchange of association results for 10 independent signals each for SBP and DBP(stage 2b, Supplementary Figure 1, Supplementary Table 3) with colleagues from theCohorts for Heart and Aging Research in Genome Epidemiology (CHARGE) blood pressureconsortium who had recently meta-analyzed GWAS data for SBP and DBP in 29,136individuals, independent of Global BPgen (Table 1). Meta-analysis of the stage 1 GlobalBPgen GWAS and stage 2a direct and stage 2b in-silico association results identifiedgenome-wide significant (P < 5×10⁻⁸) associations at eight loci: 1p36 in MTHFR, 10q24near CYP17A1 and 17q21 in PLCD3 with SBP, 4q21 near FGF5, 10q21 in C10orf107,12q24 near SH2B3, 15q24 near CYP1A2, and 17q21 near ZNF652 with DBP (Table 2,Figure 1, Supplementary Table 2, Supplementary Table 3, Supplementary Figure 3). Threeof these loci overlap with genome-wide significant loci identified in the CHARGE analyses(10q24 for SBP and 12q24 and 15q24 for DBP).
For SBP, the strongest evidence for association was at 10q24 (rs11191548, MAF = 0.09,1.16 mm Hg higher per major allele, P = 7×10⁻²⁴, Table 2, Figure 1b). This SNP is part of alarge cluster of associated SNPs spanning a ~430Kb region at 10q24 showing association inour GWAS meta-analysis. The locus includes six genes, most notably CYP17A1, whichencodes the cytochrome P450 enzyme CYP17A1 (also known as P450c17) that mediatessteroid 17α-hydroxylase and 17,20-lyase activity. The first enzymatic action is a key step inthe biosynthesis of mineralocorticoids and glucocorticoids that affect sodium handling in thekidney and the second is involved in sex-steroid biosynthesis. Missense mutations inCYP17A1 cause one form of adrenal hyperplasia characterized by hypertension,hypokalemia, and reduced plasma renin and aldosterone levels16,17. None of the five othergenes/transcripts in the region (Figure 1b) is an obvious candidate for blood pressureregulation.
The second locus associated with SBP was at 1p36 (rs17367504, MAF 0.14, 0.85 mm Hglower SBP/minor allele, P = 2×10⁻¹³, Table 2, Figure 1a). This SNP is located in an intronof the MTHFR (methylenetetrahydrofolate reductase) gene in a region with many plausiblecandidate genes, including: MTHFR, CLCN6, NPPA, NPPB, and AGTRAP. The strongestsignal in the locus is 6.4kb away from and uncorrelated with rs1801133 (C677T, A222V r2
CEU = 0.06), a coding variant that has been related to higher plasma homocysteineconcentration18, pre-eclampsia19, and variably hypertension20. In Global BPgen rs1801133was associated with 0.08 mm Hg higher SBP/T allele (P = 0.56), 0.24 mm Hg higher DBP(P = 0.01) and an odds ratio for hypertension of 1.00 (95% CI 0.94-1.05, P = 0.90).
The natriuretic peptides encoded by NPPA and NPPB, also located within the 1p36associated interval, have vasodilatory and natriuretic properties and the NPPA knockoutmouse has salt-sensitive hypertension21. A recent study found that the minor allele of
Newton-Cheh et al. Page 6
Nat Genet. Author manuscript; available in PMC 2010 September 21.
NIH
-PA Author Manuscript
NIH
-PA Author Manuscript
NIH
-PA Author Manuscript
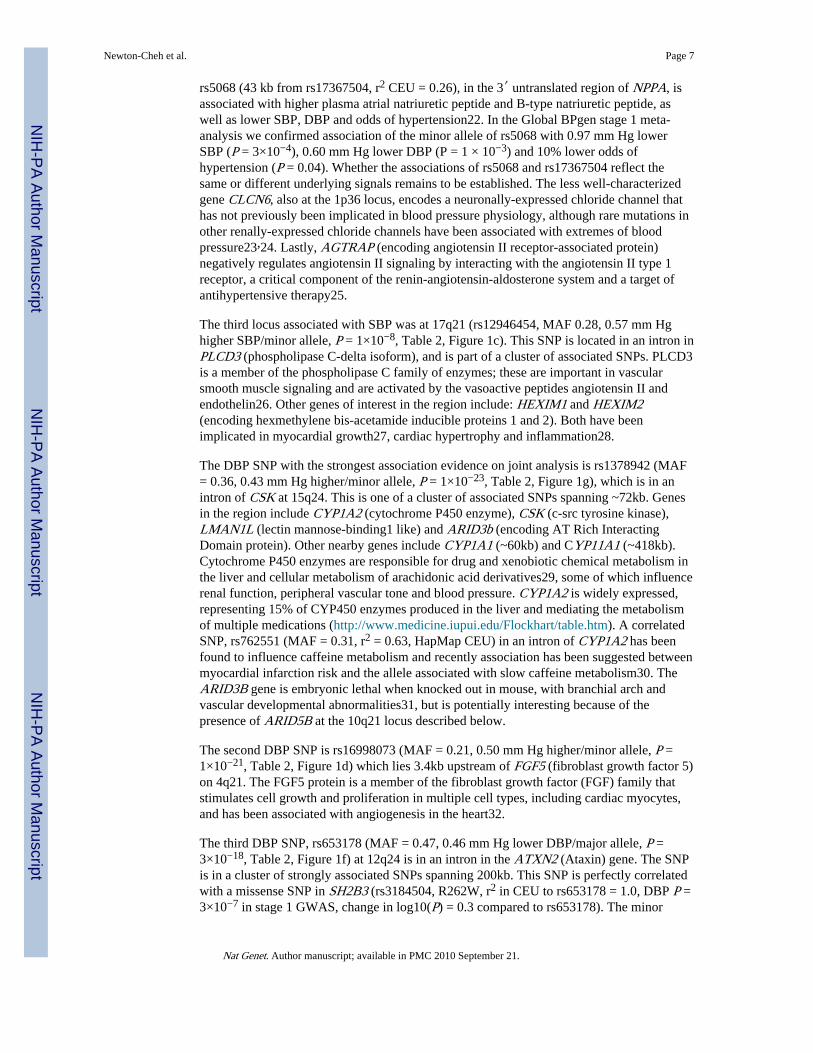
rs5068 (43 kb from rs17367504, r2 CEU = 0.26), in the 3′ untranslated region of NPPA, isassociated with higher plasma atrial natriuretic peptide and B-type natriuretic peptide, aswell as lower SBP, DBP and odds of hypertension22. In the Global BPgen stage 1 meta-analysis we confirmed association of the minor allele of rs5068 with 0.97 mm Hg lowerSBP (P = 3×10⁻⁴), 0.60 mm Hg lower DBP (P = 1 × 10⁻³) and 10% lower odds ofhypertension (P = 0.04). Whether the associations of rs5068 and rs17367504 reflect thesame or different underlying signals remains to be established. The less well-characterizedgene CLCN6, also at the 1p36 locus, encodes a neuronally-expressed chloride channel thathas not previously been implicated in blood pressure physiology, although rare mutations inother renally-expressed chloride channels have been associated with extremes of bloodpressure23,24. Lastly, AGTRAP (encoding angiotensin II receptor-associated protein)negatively regulates angiotensin II signaling by interacting with the angiotensin II type 1receptor, a critical component of the renin-angiotensin-aldosterone system and a target ofantihypertensive therapy25.
The third locus associated with SBP was at 17q21 (rs12946454, MAF 0.28, 0.57 mm Hghigher SBP/minor allele, P = 1×10⁻⁸, Table 2, Figure 1c). This SNP is located in an intron inPLCD3 (phospholipase C-delta isoform), and is part of a cluster of associated SNPs. PLCD3is a member of the phospholipase C family of enzymes; these are important in vascularsmooth muscle signaling and are activated by the vasoactive peptides angiotensin II andendothelin26. Other genes of interest in the region include: HEXIM1 and HEXIM2(encoding hexmethylene bis-acetamide inducible proteins 1 and 2). Both have beenimplicated in myocardial growth27, cardiac hypertrophy and inflammation28.
The DBP SNP with the strongest association evidence on joint analysis is rs1378942 (MAF= 0.36, 0.43 mm Hg higher/minor allele, P = 1×10⁻²³, Table 2, Figure 1g), which is in anintron of CSK at 15q24. This is one of a cluster of associated SNPs spanning ~72kb. Genesin the region include CYP1A2 (cytochrome P450 enzyme), CSK (c-src tyrosine kinase),LMAN1L (lectin mannose-binding1 like) and ARID3b (encoding AT Rich InteractingDomain protein). Other nearby genes include CYP1A1 (~60kb) and CYP11A1 (~418kb).Cytochrome P450 enzymes are responsible for drug and xenobiotic chemical metabolism inthe liver and cellular metabolism of arachidonic acid derivatives29, some of which influencerenal function, peripheral vascular tone and blood pressure. CYP1A2 is widely expressed,representing 15% of CYP450 enzymes produced in the liver and mediating the metabolismof multiple medications (http://www.medicine.iupui.edu/Flockhart/table.htm). A correlatedSNP, rs762551 (MAF = 0.31, r2 = 0.63, HapMap CEU) in an intron of CYP1A2 has beenfound to influence caffeine metabolism and recently association has been suggested betweenmyocardial infarction risk and the allele associated with slow caffeine metabolism30. TheARID3B gene is embryonic lethal when knocked out in mouse, with branchial arch andvascular developmental abnormalities31, but is potentially interesting because of thepresence of ARID5B at the 10q21 locus described below.
The second DBP SNP is rs16998073 (MAF = 0.21, 0.50 mm Hg higher/minor allele, P =1×10⁻²¹, Table 2, Figure 1d) which lies 3.4kb upstream of FGF5 (fibroblast growth factor 5)on 4q21. The FGF5 protein is a member of the fibroblast growth factor (FGF) family thatstimulates cell growth and proliferation in multiple cell types, including cardiac myocytes,and has been associated with angiogenesis in the heart32.
The third DBP SNP, rs653178 (MAF = 0.47, 0.46 mm Hg lower DBP/major allele, P =3×10⁻¹⁸, Table 2, Figure 1f) at 12q24 is in an intron in the ATXN2 (Ataxin) gene. The SNPis in a cluster of strongly associated SNPs spanning 200kb. This SNP is perfectly correlatedwith a missense SNP in SH2B3 (rs3184504, R262W, r2 in CEU to rs653178 = 1.0, DBP P =3×10⁻⁷ in stage 1 GWAS, change in log10(P) = 0.3 compared to rs653178). The minor
Newton-Cheh et al. Page 7
Nat Genet. Author manuscript; available in PMC 2010 September 21.
NIH
-PA Author Manuscript
NIH
-PA Author Manuscript
NIH
-PA Author Manuscript

allele of rs3184504, which is associated with higher DBP, has recently been associated withincreased odds of type 1 diabetes33,34, celiac disease33,34, and most recently witheosinophil count, myocardial infarction, with a weak association with hypertension35. TheSH2B3 protein (also known as lymphocyte-specific adapter protein, LNK) is one of asubfamily of SH2 domain-containing proteins and is implicated in growth factor, cytokine,and immunoreceptor signaling. In mice, it is primarily expressed in hematopoietic precursorcells, brain, testis and muscle36. There is some support for hypertension having aninflammatory component, possibly involving the adaptive immune system37. There are noprior studies linking blood pressure with type 1 diabetes or celiac disease. To explore thisfurther, we looked up SNPs reported to be associated with T1D, celiac disease or myocardialinfarction in the Global BPgen GWAS results and failed to find convincing association otherthan that for the SH2B3 missense SNP (data not shown). It is possible that the SH2B3missense SNP impacts blood pressure through an action specific to cells outside of theimmune system and that no direct link between blood pressure and autoimmune diseasesexists.
The fourth DBP SNP, rs1530440 (MAF = 0.19, 0.39 mm Hg lower/minor allele, P =1×10⁻⁹, Table 2, Figure 1e) at 10q21 is intronic and one of a cluster of SNPs in C10orf107,an open reading frame of unknown function. Nearby genes include ARID5B (AT richinteractive domain 5B (MRF1 like)), TMEM26 (transmembrane protein 26), RTKN2 (RhoAGTPase effector, rhotekin-2) and RHOBTB1 (RhoBTB GTPase). The Rho family ofGTPases converts guanine triphosphate to inactive guanine diphosphate. The actions ofother GTP-modulating enzymes may modulate salt-sensitive hypertension38,39. TheARID5B gene is a member of the AT-rich interaction domain family of transcription factorsand is highly expressed in cardiovascular tissue and involved in smooth muscle celldifferentiation40.
The fifth DBP SNP, rs16948048 (MAF 0.39, 0.34 mm Hg higher DBP/minor allele, P =5×10⁻⁹, Table 2, Figure 1h) at 17q21 is upstream of ZNF652 (zinc finger protein 652) andPHB (prohibitin). Neither gene has previously been implicated in hypertension or othercardiovascular phenotypes.
We observed no significant interaction between the eight genome-wide significant SNPs andgender (P > 0.01, Supplementary Table 5). There was also no evidence of heterogeneity ofeffect across the samples examined for the eight SNPs (Q-statistic P > 0.05).
While we describe here promising candidates at each locus identified, the causal gene couldbe any of the genes around the association signal in each locus (Figure 1). Fine mapping andresequencing will be required to refine each association signal and to identify likely causalgenetic variants which could be studied further in humans and in animal models.
All variants are related to both blood pressure traitsIt remains to be clarified whether SBP or DBP is the better target for genetic investigation ofblood pressure. The two traits are correlated and heritable, and both show strong increaseswith age, with DBP starting to plateau and in some individuals fall at ages above 60–65.Some have advocated the study of pulse pressure (SBP-DBP), which increases withadvancing age, and is correlated positively with SBP and negatively with DBP and alsoshows evidence of heritability. In our GWAS and follow up, we chose a priori to considerSBP and DBP as separate traits. Thus, validation was only attempted for either SBP or DBP,according to the trait for which the stage 1 P value was lowest. Because SBP and DBP arecorrelated (r~0.50–0.70), it is perhaps not surprising to see that all eight genome-widesignificant SNPs are associated with both SBP and DBP with the same directions of effect(Table 3, Figure 2). Thus, our presentation of results as SBP- or DBP-associated is
Newton-Cheh et al. Page 8
Nat Genet. Author manuscript; available in PMC 2010 September 21.
NIH
-PA Author Manuscript
NIH
-PA Author Manuscript
NIH
-PA Author Manuscript

somewhat arbitrary. The observation that each SNP shows stronger association with one traitor the other (typically by 1–2 orders of magnitude) could reflect sampling variation, smalleffect sizes or true differences in the underlying biologic basis of one trait or the other. Astudy designed to examine pulse pressure would be expected to show weaker (if any)association signals for the variants identified which all showed concordant effects on SBPand DBP.
All variants are related to hypertensionWe did not perform a global GWAS of hypertension, which is expected to be underpoweredto detect common variants of modest incremental effects on continuous blood pressure. Forthe eight SNPs that were genome-wide significant in continuous trait analysis, we examinedthe association with hypertension (SBP ≥ 140 mm Hg or DBP ≥ 90 mm Hg orantihypertensive medication use) compared to normotension (SBP ≤ 120 mm Hg and DBP ≤85 mm Hg and no antihypertensive medication use) in planned secondary analyses (N range= 57,410 – 99,802). All alleles associated with continuous blood pressure were alsoassociated with odds of hypertension in directions consistent with the continuous trait effect(Table 4, Figure 2). The relative yields of the two approaches remain to be fully evaluatedand will only become clearer upon completion of large ongoing GWA studies ofdichotomous hypertension case-control samples. However, when we examined thehypertension association of each of the 8 SNPs genome-wide significantly associated withcontinuous SBP or DBP in just the stage 1 Global BPgen samples, 4 had 0.01 < P ≤ 0.10.These SNPs would not have been selected for follow-up genotyping had these tests beenconducted as part of a hypertension GWAS. Thus, the study of continuous blood pressureallowed us to identify effects on risk of hypertension that would not have been readilydiscovered in a GWAS of hypertension drawn from these samples.
Extension to non-European samplesTo date, the majority of complex disease association signals reaching genome-widesignificance have been concentrated in populations of European ancestry, and it remainsunclear whether these findings will transfer to individuals with other genetic backgrounds.We genotyped all stage 2a SNPs (four of which were not confirmed in the Europeanancestry analyses) in a separate Indian Asian sample of up to 12,889 individuals. Wereplicated the association of the SNP at 4q21 near FGF5 (rs16998073, P = 5×10⁻⁴,Supplementary Table 2) and the SNP at 10q24 near CYP17A1 (rs11191548, P = 0.008,Supplementary Table 2). We did not replicate association of the SNP rs1378942 at CYP1A2(P = 0.17, same direction), which could reflect limited power to detect the modest effectsize, differences in linkage disequilibrium patterns in Indian Asians compared to Europeans,or simply lack of association in individuals of Indian Asian ancestry. The marked allelefrequency differences between the European samples (C allele frequency ~0.35), the IndianAsian samples (0.77) and HapMap YRI (1.00) suggest distinct patterns of genetic variationat this locus across populations. A signal of positive selection has been suggested at thelocus41 raising the potential functional importance of genetic variation in the region.
DISCUSSIONThe eight loci described here and the additional loci reported by our colleagues in theCHARGE consortium are among the first confirmed associations between common geneticvariants and blood pressure. Each association explains only a very small proportion of thetotal variation in SBP or DBP (~0.05–0.10%, approximately 1 mm Hg/allele SBP or 0.5 mmHg/allele DBP, Table 2). However, the variants identified here have an aggregate effect onblood pressure, acting throughout the range of values (not just hypertensive), which has beenshown to produce meaningful population changes in cardiovascular and stroke risk. For
Newton-Cheh et al. Page 9
Nat Genet. Author manuscript; available in PMC 2010 September 21.
NIH
-PA Author Manuscript
NIH
-PA Author Manuscript
NIH
-PA Author Manuscript

example, 2 mm Hg lower SBP, across the range of observed values, has been estimated totranslate into 6% less stroke and 4% less coronary heart disease.42
Given the modest effects observed here and the limited power of this study to detect sucheffects, it is likely that many more common variants exist with weak effects upon bloodpressure. This study illustrates the value of well-powered meta-analysis and follow-upgenotyping, accompanied by in silico analysis, requiring the coordinated efforts ofinvestigators across multiple studies, to establish definitively the relationship of these lociwith blood pressure regulation in the general population.
In a companion paper, the CHARGE consortium reports as genome-wide significant 3 of the8 loci that reached genome-wide significance in our Global BPgen joint analysis of stages1+2. CHARGE also reports common variants at 5 additional genome-wide significant lociat: 11p15 (Global BPgen P = 0.009), 3p22 (P = 0.01), 12q21 (P = 0.008), 12q24 (P = 0.05),and 10p12 (P = 0.004, see companion CHARGE paper). While these SNPs did not appearamong our top 10 SNPs for either blood pressure trait, the Global BPgen results from insilico exchange and for the same alleles are clearly consistent with the conclusions of theCHARGE investigators. Among the 10 SBP and 10 DBP loci at the top of the Global BPgenresults, five loci were represented in the CHARGE top 10 results (Supplementary Table 3).With the modest effect sizes we observed, it is not surprising that the top 10 loci for eachblood pressure trait would exhibit only partial overlap.
We acknowledge that some limitations apply to our study. The participants in the individualstudies comprising Global BPgen and our follow-up cohorts were ascertained using diversecriteria, had their blood pressure measured in a variety of ways, and exhibited a broad rangeof age and treatment profiles. Even small differences in these factors could reduce power todetect the association of genetic variants with modest effect, although such heterogeneityshould not increase the false-positive rate. Even though SBP and DBP are dynamicphenotypes resulting from multiple competing influences, estimates of the test-retestreliability of blood pressure measurements are approximately 0.65–0.75 in studies focusedon blood pressure43,44. Moreover, a graded relationship between BP measures andcardiovascular risk has been consistently observed, despite variability in BP measures2. Atthe individual level, genetically-determined alteration of 1 mm Hg SBP or 0.5 mm Hg DBPwould be difficult to detect in the clinic, but large sample sizes use group-level differencesin means to detect small genetic effects.
Exposures such as dietary sodium and potassium intake or excessive alcohol use alsocontribute to inter-individual differences in blood pressure. These were measured in aminority of our samples and thus we could not meaningfully adjust for these in our study.Under the assumption that these do not alter blood pressure systematically by genotype, wewould only expect this omission to reduce power slightly.
We chose a priori to adjust for body mass index, which explains ~6–8% of the total variationin SBP and DBP, with the goal of reducing potential non-genetic contributions to bloodpressure variability. Genetic variants could influence blood pressure acting through BMI asan intermediate, but such variants are best identified through BMI GWA studies such asthose recently reported by Loos et al45 and Willer et al46.
We adjusted for use of antihypertensive therapy by adding 15 mm Hg and 10 mm Hg to SBPand DBP, respectively. This approach has been shown to be superior to ignoringantihypertensive treatment or to excluding individuals on therapy13. However, it is clearthat factors such as medication number and dosage, and variation in prescription patterns indifferent countries and time periods make this adjustment scheme an oversimplification.Again, such effects should generally bias our findings toward the null.
Newton-Cheh et al. Page 10
Nat Genet. Author manuscript; available in PMC 2010 September 21.
NIH
-PA Author Manuscript
NIH
-PA Author Manuscript
NIH
-PA Author Manuscript

There are many classes of widely used therapies with strong antihypertensive effects. Weexamined the association of common variants at the loci extending 100kb on either side ofthe genes encoding the targets for thiazide diuretics (NCCT), loop diuretics (NKCC2), ACEinhibitors (ACE), angiotensin II receptor type 1 blockers (AGTR1), beta adrenoreceptorblockers (ADRB1, ADRB2), alpha adrenoreceptor antagonists (ADRA1A, ADRA1B,ADRA1D), calcium channel blockers (CACNA1S, CACNA1C, CACNA1D, CACNA1F),and aldosterone antagonists (CYP11B2). No results exceeded chance expectations. Thisdoes not exclude the existence of variants of weaker effects or variants that were missedbecause they were not covered by existing arrays. Obviously, it would be interesting toexamine the impact of common variants in these genes on individual responses to therapies,which we have not done.
Moreover, the strength of association of variation in a gene with a trait (or lack thereof) saysnothing about the potential strength of a drug designed to agonize or antagonize the productof that gene. For example, a common variant in HMGCR has only a modest effect on fastinglipids,47 yet statin therapy, which inhibits the HMGCR enzyme to lower LDL cholesterol,substantially lowers risk of cardiovascular disease. Thus, the implication of modest commonvariant genetic effects is not just a function of the ability to identify tendency toward higheror lower blood pressure in carriers of alternate alleles, but also the ability to recognizerelevant targets for therapy that have defined in vivo relevance in human beings.
While targeted pharmacotherapy has theoretical appeal, clinical trials to demonstrate theutility and cost-effectiveness of such approaches will be required before such personalizedmedicine could be endorsed. The association signals identified here will need to be refinedthrough fine mapping, and resequencing will be needed to define more fully the allelicspectrum of variants at each locus that contributes to inter-individual differences in bloodpressure. Our findings offer initial insights into the genetic basis of a problem of globalproportions and the potential for an improved understanding of blood pressure regulation.These loci may point to new targets for blood pressure reduction and ultimately additionalopportunities to prevent the growing public health burden of cardiovascular disease.
METHODSOverall study design
An expanded description of the methods is provided in the Supplementary Methods. Thestudy comprised two staged analyses performed separately for SBP and DBP. Stage 1 was ameta-analysis of directly genotyped and imputed SNPs from individuals of Europeandescent in 17 samples drawn from population-based or control samples in case-controlstudies in the Global BPgen consortium. In stage 2a, we selected 12 SNPs for genotyping inup to 71,225 individuals of European descent from 13 studies and up to 12,889 individualsof Indian Asian ancestry from one study. In stage 2b, we selected 20 SNPs (10 SBP, 10DBP) for in silico analysis in 29,136 individuals of European descent from the CHARGEconsortium (stage 2b, see Supplementary Figure 1).
Stage 1 samplesThe Global BPgen consortium comprises 17 GWAS studies: the Baltimore LongitudinalStudy of Aging (BLSA), British 1958 Birth Cohort (B58C-T1DGC and B58C-WTCCC),Cohorte Lausannoise (CoLaus), Diabetes Genetics Initiative (DGI), European ProspectiveInvestigation of Cancer-Norfolk-Genome Wide Association Study (EPIC-Norfolk-GWAS),Fenland Study, Finland-United States Investigation of NIDDM Genetics (FUSION) study,Invecchiare in Chianti (InCHIANTI), Kooperative Gesundheitsforschung in der RegionAugsburg (KORA), the Myocardial Infarction Genetics Consortium (MIGen), Northern
Newton-Cheh et al. Page 11
Nat Genet. Author manuscript; available in PMC 2010 September 21.
NIH
-PA Author Manuscript
NIH
-PA Author Manuscript
NIH
-PA Author Manuscript

Finland Birth Cohort of 1966 (NFBC1966), SardiNIA, Study of Health in Pomerania(SHIP), the Precocious Coronary Artery Disease (PROCARDIS), Supplementation enVitamines et Mineraux Antioxydants (SU.VI.MAX), and TwinsUK. We excludedindividuals >70 years of age and individuals ascertained on case status for type 1 or 2diabetes (DGI, FUSION), coronary artery disease (MIgen, PROCARDIS) or hypertension(BRIGHT), leaving 34,433 individuals for analysis (Table 1). A detailed description of thestudy design and phenotype measurement for all cohorts can be found in the SupplementaryMethods.
Genome-wide genotypingGenotyping arrays and quality control filters are provided in Supplementary Table 1.
ImputationImputation of allele dosage of ungenotyped SNPs in HapMap CEU v21a or v22 wasperformed using MACH48 or IMPUTE49 with parameters and pre-imputation filters asspecified in Supplementary Table 1. SNPs were excluded from analysis if the cohort-specific imputation quality as assessed by r2.hat (MACH) or .info (IMPUTE) metrics was<0.30. In total, up to 2,497,993 genotyped or imputed autosomal SNPs were analyzed.
Phenotype modelingIn individuals taking antihypertensive therapies, blood pressure was imputed by adding 15mm Hg and 10 mm Hg for SBP and DBP, respectively13. Continuous SBP and DBP wereadjusted for age, age2, body mass index, and any study-specific geographic covariates ingender-specific linear regression models. In FUSION and SardiNIA, which included family-based samples, gender-pooled linear regression was performed with the addition of genderas a covariate. Residuals on the mm Hg scale were used as univariate traits in genotype-phenotype analysis.
In secondary analyses, hypertension was defined by the presence of SBP ≥ 140 mm Hg ordiastolic blood pressure ≥90 mm Hg or self-report of taking a medication for the treatmentof hypertension. Normotensive controls were defined as individuals not taking any anti-hypertensives and having a SBP ≤120 mm Hg and a DBP ≤85 mm Hg.
Genotype-phenotype association analysisGenotype-phenotype association of SBP and DBP residuals was performed under anadditive model using software as specified in Supplementary Table 1. Analysis ofhypertension for eight genome-wide significant continuous blood pressure loci wasperformed using logistic regression to adjust for age, age2, gender, body mass index.
Meta-analysis of stage 1 samplesAll cohort-specific effect estimates and coded alleles were oriented to the forward strand ofthe NCBI35 reference sequence of the human genome, using the alphabetically higher alleleas the coded allele. For example, for a G/T SNP coded GG=0, GT=1, TT=2, the coded allelewould be T. To capture the power loss due to imperfect imputation, we estimated “Neffective”, which was the sum of the sample-specific products of the imputation qualitymetric and the sample size. No filtering on minor allele frequency was used. Genomiccontrol14 was performed on cohort- and gender-specific test statistics. Lambda estimates aregiven in Supplementary Table 1; quantile-quantile plots are shown in Supplementary Figure2. Meta-analysis in stage 1 was performed using inverse variance weights. Stage 1 meta-analysis results were genomic controlled.
Newton-Cheh et al. Page 12
Nat Genet. Author manuscript; available in PMC 2010 September 21.
NIH
-PA Author Manuscript
NIH
-PA Author Manuscript
NIH
-PA Author Manuscript
Selection of SNPs for stage 212 SNPs were selected for follow-up in stage 2a from among the results with P < 10−5
during interim analyses. For in silico exchange with the CHARGE consortium (stage 2b),we identified the top independent loci to select 10 SBP and 10 DBP SNPs. If a SNP in onetop 10 list was also among the top 10 for the alternate blood pressure trait, we kept the locuswith the lower p-value and went to the next locus on the list for the alternate blood pressuretrait. Because a SNP at the 3q26 locus (MDS1) was selected in an interim analysis for directgenotyping, it was retained as the tenth locus for DBP even though its significance wasreduced in the final stage 1 DBP GWAS analysis.
Stage 2a samplesWe genotyped 12 SNPs in up to 71,225 individuals of European descent from 13 studies –Utrecht Atherosclerosis Risk in Young Adults (ARYA), British Genetics of Hypertension(BRIGHT), EPIC-Italy, EPIC-Norfolk-REP, Finrisk97, FUSION2, London Life SciencesPopulation (LOLIPOP), Malmö Diet and Cancer-Cardiovascular Cohort (MDC-CC),Metabolic Syndrome in Men (METSIM), Malmo Preventive Project (MPP), The Preventionof REnal and Vascular ENd stage Disease (PREVEND), Prospect-EPIC, and the UtrechtHealth Project (UHP) – and in up to 12,889 individuals of Indian Asian ancestry from theLOLIPOP study. Summary demographics are shown in Table 1 and cohort information inthe Supplementary Methods).
Stage 2a follow-up genotypingFor genotyping methods and platforms see Supplementary Methods.
Stage 2b in silico samplesWe obtained results based on the analysis of the Cohorts for Heart and Aging Research inGenome Epidemiology (CHARGE) consortium, which comprises 29,136 samples from fivepopulation-based cohorts.
Pooled analysis of first and second stage samplesMeta-analysis of stage 1, 2a and 2b results was performed using inverse variance weighting.Standard errors were multiplied by the square root of the lambda estimate for genomiccontrol and are presented throughout the text. Nominal P values after genomic control14 arepresented. We considered associations genome-wide significant if they exceeded P =5×10⁻⁸, a Bonferroni correction for the estimated 1M independent common variant tests inthe human genome of European-derived individuals14,15.
Supplementary MaterialRefer to Web version on PubMed Central for supplementary material.
AcknowledgmentsThe authors would like to thank the many colleagues who contributed to collection and phenotypic characterizationof the clinical samples, as well as genotyping and analysis of the GWA data. They would also especially like tothank those who agreed to participate in the studies. Major funding for the work described in the paper comes from(alphabetically): Academy of Finland (124243, 129322, 129494, 118065), AGAUR (SGR 2005/00577), AlbertPåhlsson Research Foundation, Alexander-von-Humboldt Foundation (V-Fokoop-1113183), American DiabetesAssociation, AstraZeneca AB, AVIS Torino blood donor organization, Barts and The London Charity, Biocenter ofUniversity of Oulu, Board of the UMC Utrecht, British Heart Foundation (PG02/128, FS/05/061/19501, SP/04/002), Burroughs Wellcome Fund, CamStrad, Cancer Research United Kingdom, CIBER Epidemiología y SaludPública, Commissariat à l’Energie Atomique, Compagnia di San Paolo to the ISI Foundation (Torino, Italy),Conservatoire National des Arts et Métiers, Crafoord Foundation, Donovan Family Foundation, Doris Duke
Newton-Cheh et al. Page 13
Nat Genet. Author manuscript; available in PMC 2010 September 21.
NIH
-PA Author Manuscript
NIH
-PA Author Manuscript
NIH
-PA Author Manuscript

Charitable Foundation, Dutch Kidney Foundation (E033), Dutch College of Healthcare Insurance Companies,Dutch Ministry of Health, Dutch Organisation of Health Care Research, ENGAGE (HEALTH-F4-2007-201413),Ernhold Lundstroms Research Foundation, Estonian Ministry of Education and Science (0182721s06), EURO-BLCS, European Commission (QLG1-CT-2000-01643, LSHM-CT-2007-037273), European Commission-EuropeAgainst Cancer (AEP/90/05), European Union (FP-6 LSHM-CT-2003-503041, FP-6 LSHM CT 2006 037697),European Society for the Study of Diabetes, Faculty of Biology and Medicine of Lausanne, Switzerland, Fannie E.Rippel Foundation, Finnish Foundation for Cardiovascular Research, FIS (CP05/00290), German Federal Ministryof Education and Research (01ZZ9603, 01ZZ0103, 01ZZ0403, 03ZIK012, 01EZ0874), German National GenomeResearch Network, German Research Center for Environmental Health, (Neuherberg, Germany), Giorgi-CavaglieriFoundation, GlaxoSmithKline, Guy’s & St Thomas’ NHS Foundation Trust, Health Research and DevelopmentCouncil of the Netherlands (2100.0008, 2100.0042), Helmholtz Zentrum Munchen, Hulda and Conrad MossfeltFoundation, Institut National de la Recherche Agronomique, Institut National de la Sante et de la RechercheMedicale, Italian Association for Research on Cancer, Italian Ministry of Health (110.1RS97.71), Italian NationalResearch Council, Juvenile Diabetes Research Fund, King Gustaf V and Queen Victoria Foundation, King’sCollege London and King’s College Hospital NHS Foundation Trust, Knut and Alice Wallenberg Foundation,Lennart Hanssons Memorial Fund, LK Research Funds, Massachusetts General Hospital Cardiovascular ResearchCenter and Department of Medicine, Medical Faculty of Lund University and Malmö University Hospital, MedicalResearch Council of the UK (G0000934, G0501942, G9521010D), Medical Research Council-GlaxoSmithKline(85374), MedStar Research Institute, Ministerio de Sanidad y Consumo, Instituto de Salud Carlos III (RD06/0009),Ministry of Cultural Affairs and Social Ministry (Federal State of Mecklenburg-West Pomerania), National Institutefor Health Research (NIHR), National Institute for Health Research Cambridge Biomedical Research Centre,Novartis Institute for Biomedical Research, NWO VENI (916.76.170), Province of Utrecht, Region Skane, SiemensHealthcare (Erlangen, Germany), Sigrid Juselius Foundation, Stockholm County Council (562183), Support forScience Funding programme, Swedish Heart and Lung Foundation, Swedish Medical Research Council, SwedishNational Research Council, Swedish Research Council (8691), Swiss National Science Foundation(33CSO-122661, 310030-112552, 3100AO-116323/1, PROSPER 3200BO-111362/1, 3233BO-111361/1), UNIL,University of Utrecht, US National Institutes of Health (U01DK062418, K23HL80025, DK062370, DK072193,U54DA021519, 1Z01HG000024, N01AG-916413, N01AG-821336, 263MD916413, 263MD821336, IntramuralNIA, R01HL087676, K23HL083102, U54RR020278, R01HL056931, P30ES007033, R01HL087679,RL1MH083268, 263-MA-410953, NO1-AG-1-2109, N01-HD-1-3107), WCRF (98A04, 2000/30), Wellcome Trust(068545/Z/02, 076113/B/04/Z, 079895, 070191/Z/03/Z, 077016/Z/05/Z, WT088885/Z/09/Z).
References1. Ezzati M, Lopez AD, Rodgers A, Vander Hoorn S, Murray CJ. Selected major risk factors and
global and regional burden of disease. Lancet. 2002; 360:1347–60. [PubMed: 12423980]
2. Lewington S, Clarke R, Qizilbash N, Peto R, Collins R. Age-specific relevance of usual bloodpressure to vascular mortality: a meta-analysis of individual data for one million adults in 61prospective studies. Lancet. 2002; 360:1903–1913. [PubMed: 12493255]
3. The world health report 2002. Reducing risks, promoting healthy life. World Health Organization;2002.
4. Whelton PK, et al. Primary prevention of hypertension: clinical and public health advisory from TheNational High Blood Pressure Education Program. Jama. 2002; 288:1882–8. [PubMed: 12377087]
5. Havlik RJ, et al. Blood pressure aggregation in families. Am J Epidemiol. 1979; 110:304–12.[PubMed: 474567]
6. Lifton RP, Gharavi AG, Geller DS. Molecular mechanisms of human hypertension. Cell. 2001;104:545–556. [PubMed: 11239411]
7. Ji W, et al. Rare independent mutations in renal salt handling genes contribute to blood pressurevariation. Nat Genet. 2008; 40:592–9. [PubMed: 18391953]
8. Newhouse SJ, et al. Haplotypes of the WNK1 gene associate with blood pressure variation in aseverely hypertensive population from the British Genetics of Hypertension study. Hum Mol Genet.2005; 14:1805–14. [PubMed: 15888480]
9. Tobin MD, et al. Association of WNK1 gene polymorphisms and haplotypes with ambulatory bloodpressure in the general population. Circulation. 2005; 112:3423–9. [PubMed: 16301342]
10. Tobin MD, et al. Common variants in genes underlying monogenic hypertension and hypotensionand blood pressure in the general population. Hypertension. 2008; 51:1658–64. [PubMed:18443236]
11. Genome-wide association study of 14 000 cases of seven common diseases and 3,000 sharedcontrols. Nature. 2007; 447:661–678. [PubMed: 17554300]
Newton-Cheh et al. Page 14
Nat Genet. Author manuscript; available in PMC 2010 September 21.
NIH
-PA Author Manuscript
NIH
-PA Author Manuscript
NIH
-PA Author Manuscript

12. Levy D, et al. Framingham Heart Study 100K Project: genome-wide associations for bloodpressure and arterial stiffness. BMC Med Genet. 2007; 8(Suppl 1):S3. [PubMed: 17903302]
13. Tobin MD, Sheehan NA, Scurrah KJ, Burton PR. Adjusting for treatment effects in studies ofquantitative traits: antihypertensive therapy and systolic blood pressure. Stat Med. 2005; 24:2911–35. [PubMed: 16152135]
14. Devlin B, Roeder K. Genomic control for association studies. Biometrics. 1999; 55:997–1004.[PubMed: 11315092]
15. Pe’er I, Yelensky R, Altshuler D, Daly MJ. Estimation of the multiple testing burden forgenomewide association studies of nearly all common variants. Genet Epidemiol. 2008; 32:381–385. [PubMed: 18348202]
16. Martin RM, et al. P450c17 deficiency in Brazilian patients: biochemical diagnosis throughprogesterone levels confirmed by CYP17 genotyping. J Clin Endocrinol Metab. 2003; 88:5739–46. [PubMed: 14671162]
17. Geller DH, Auchus RJ, Mendonca BB, Miller WL. The genetic and functional basis of isolated17,20-lyase deficiency. Nat Genet. 1997; 17:201–5. [PubMed: 9326943]
18. Kluijtmans LA, et al. Molecular genetic analysis in mild hyperhomocysteinemia: a commonmutation in the methylenetetrahydrofolate reductase gene is a genetic risk factor for cardiovasculardisease. Am J Hum Genet. 1996; 58:35–41. [PubMed: 8554066]
19. Sohda S, et al. Methylenetetrahydrofolate reductase polymorphism and pre-eclampsia. J MedGenet. 1997; 34:525–6. [PubMed: 9192280]
20. Qian X, Lu Z, Tan M, Liu H, Lu D. A meta-analysis of association between C677T polymorphismin the methylenetetrahydrofolate reductase gene and hypertension. Eur J Hum Genet. 2007;15:1239–45. [PubMed: 17726486]
21. John SW, et al. Genetic decreases in atrial natriuretic peptide and salt-sensitive hypertension.Science. 1995; 267:679–681. [PubMed: 7839143]
22. Newton-Cheh C, et al. Association of Common Variants in NPPA and NPPB with CirculatingNatriuretic Peptides and Blood Pressure. Nature Genetics. 2009 In Press.
23. Simon DB, et al. Genetic heterogeneity of Bartter’s syndrome revealed by mutations in the K+channel, ROMK. Nat Genet. 1996; 14:152–6. [PubMed: 8841184]
24. Simon DB, et al. Gitelman’s variant of Bartter’s syndrome, inherited hypokalaemic alkalosis, iscaused by mutations in the thiazide-sensitive Na-Cl cotransporter. Nat Genet. 1996; 12:24–30.[PubMed: 8528245]
25. Daviet L, et al. Cloning and characterization of ATRAP, a novel protein that interacts with theangiotensin II type 1 receptor. J Biol Chem. 1999; 274:17058–62. [PubMed: 10358057]
26. Suh PG, et al. Multiple roles of phosphoinositide-specific phospholipase C isozymes. BMB Rep.2008; 41:415–34. [PubMed: 18593525]
27. Montano MM, et al. Mutation of the HEXIM1 gene results in defects during heart and vasculardevelopment partly through downregulation of vascular endothelial growth factor. Circ Res. 2008;102:415–22. [PubMed: 18079413]
28. Dey A, Chao SH, Lane DP. HEXIM1 and the control of transcription elongation: from cancer andinflammation to AIDS and cardiac hypertrophy. Cell Cycle. 2007; 6:1856–63. [PubMed:17671421]
29. Nebert DW, Dalton TP. The role of cytochrome P450 enzymes in endogenous signalling pathwaysand environmental carcinogenesis. Nat Rev Cancer. 2006; 6:947–60. [PubMed: 17128211]
30. Cornelis MC, El-Sohemy A, Kabagambe EK, Campos H. Coffee, CYP1A2 genotype, and risk ofmyocardial infarction. JAMA. 2006; 295:1135–41. [PubMed: 16522833]
31. Takebe A, et al. Microarray analysis of PDGFR alpha+ populations in ES cell differentiationculture identifies genes involved in differentiation of mesoderm and mesenchyme includingARID3b that is essential for development of embryonic mesenchymal cells. Dev Biol. 2006;293:25–37. [PubMed: 16530748]
32. Vatner SF. FGF induces hypertrophy and angiogenesis in hibernating myocardium. Circ Res.2005; 96:705–7. [PubMed: 15831820]
33. Todd JA, et al. Robust associations of four new chromosome regions from genome-wide analysesof type 1 diabetes. Nat Genet. 2007; 39:857–64. [PubMed: 17554260]
Newton-Cheh et al. Page 15
Nat Genet. Author manuscript; available in PMC 2010 September 21.
NIH
-PA Author Manuscript
NIH
-PA Author Manuscript
NIH
-PA Author Manuscript

34. Hunt KA, et al. Newly identified genetic risk variants for celiac disease related to the immuneresponse. Nat Genet. 2008; 40:395–402. [PubMed: 18311140]
35. Gudbjartsson DF, et al. Sequence variants affecting eosinophil numbers associate with asthma andmyocardial infarction. Nat Genet. 2009
36. Velazquez L, et al. Cytokine signaling and hematopoietic homeostasis are disrupted in Lnk-deficient mice. J Exp Med. 2002; 195:1599–611. [PubMed: 12070287]
37. Rodriguez-Iturbe B, Vaziri ND, Herrera-Acosta J, Johnson RJ. Oxidative stress, renal infiltrationof immune cells, and salt-sensitive hypertension: all for one and one for all. Am J Physiol RenalPhysiol. 2004; 286:F606–16. [PubMed: 15001451]
38. Du YH, Guan YY, Alp NJ, Channon KM, Chen AF. Endothelium-specific GTP cyclohydrolase Ioverexpression attenuates blood pressure progression in salt-sensitive low-renin hypertension.Circulation. 2008; 117:1045–54. [PubMed: 18268143]
39. Zheng JS, et al. Gene transfer of human guanosine 5′-triphosphate cyclohydrolase I restoresvascular tetrahydrobiopterin level and endothelial function in low renin hypertension. Circulation.2003; 108:1238–45. [PubMed: 12925450]
40. Watanabe M, et al. Regulation of smooth muscle cell differentiation by AT-rich interaction domaintranscription factors Mrf2alpha and Mrf2beta. Circ Res. 2002; 91:382–9. [PubMed: 12215486]
41. Voight BF, Kudaravalli S, Wen X, Pritchard JK. A map of recent positive selection in the humangenome. PLoS Biol. 2006; 4:e72. [PubMed: 16494531]
42. Stamler J, et al. INTERSALT study findings. Public health and medical care implications.Hypertension. 1989; 14:570–7. [PubMed: 2807518]
43. Dyer AR, Shipley M, Elliott P. Urinary electrolyte excretion in 24 hours and blood pressure in theINTERSALT Study. I. Estimates of reliability. The INTERSALT Cooperative Research Group.Am J Epidemiol. 1994; 139:927–39. [PubMed: 8166143]
44. Variability of blood pressure and the results of screening in the hypertension detection and follow-up program. J Chronic Dis. 1978; 31:651–67. [PubMed: 730822]
45. Loos RJ, et al. Common variants near MC4R are associated with fat mass, weight and risk ofobesity. Nat Genet. 2008; 40:768–75. [PubMed: 18454148]
46. Willer CJ, et al. Six new loci associated with body mass index highlight a neuronal influence onbody weight regulation. Nat Genet. 2009; 41:25–34. [PubMed: 19079261]
47. Kathiresan S, et al. Six new loci associated with blood low-density lipoprotein cholesterol, high-density lipoprotein cholesterol or triglycerides in humans. Nat Genet. 2008; 40:189–197.[PubMed: 18193044]
48. Li Y, Abecasis GR. Mach 1.0: Rapid haplotype reconstruction and missing genotype inference.Am J Hum Genet. 2006; S79:2290.
49. Marchini J, Howie B, Myers S, McVean G, Donnelly P. A new multipoint method for genome-wide association studies by imputation of genotypes. Nat Genet. 2007; 39:906–913. [PubMed:17572673]
50. Myers S, Bottolo L, Freeman C, McVean G, Donnelly P. A fine-scale map of recombination ratesand hotspots across the human genome. Science. 2005; 310:321–4. [PubMed: 16224025]
Newton-Cheh et al. Page 16
Nat Genet. Author manuscript; available in PMC 2010 September 21.
NIH
-PA Author Manuscript
NIH
-PA Author Manuscript
NIH
-PA Author Manuscript

Figure 1.Regional association plots of eight blood pressure loci. For each locus, we show the regionextending to within 500kb of a SNP with P < 10−4 on either side. Statistical significance ofassociated SNPs at each locus are illustrated on the - log10(P) scale as a function ofchromosomal position (NCBI Build 35). The sentinel SNP at each locus is shown in red.The correlation of the sentinel SNP to other SNPs at the locus is shown on a scale fromminimal (gray and blue), to maximal (red). The meta-analysis result for stage 1 is shownwith a red square. The joint analysis result (combined P) for stage 1+2a+2b is shown with anarrow. Fine-scale recombination rate from Myers et al50 is plotted in aqua.
Newton-Cheh et al. Page 17
Nat Genet. Author manuscript; available in PMC 2010 September 21.
NIH
-PA Author Manuscript
NIH
-PA Author Manuscript
NIH
-PA Author Manuscript
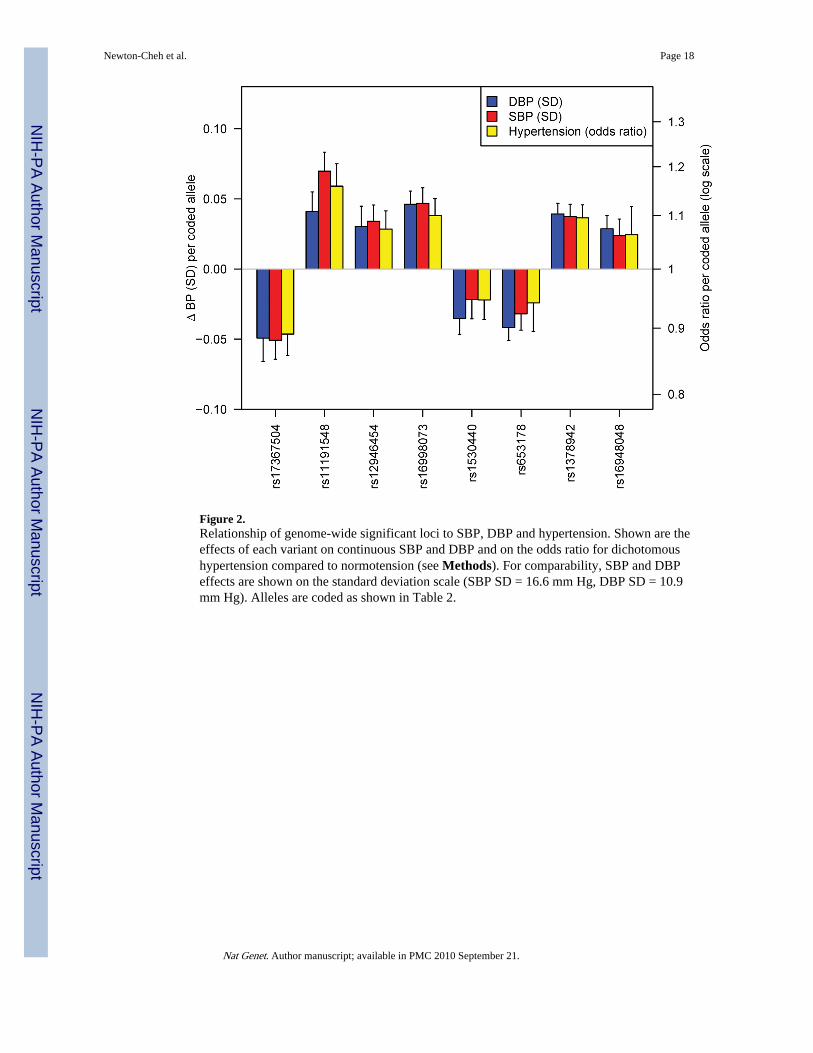
Figure 2.Relationship of genome-wide significant loci to SBP, DBP and hypertension. Shown are theeffects of each variant on continuous SBP and DBP and on the odds ratio for dichotomoushypertension compared to normotension (see Methods). For comparability, SBP and DBPeffects are shown on the standard deviation scale (SBP SD = 16.6 mm Hg, DBP SD = 10.9mm Hg). Alleles are coded as shown in Table 2.
Newton-Cheh et al. Page 18
Nat Genet. Author manuscript; available in PMC 2010 September 21.
NIH
-PA Author Manuscript
NIH
-PA Author Manuscript
NIH
-PA Author Manuscript

NIH
-PA Author Manuscript
NIH
-PA Author Manuscript
NIH
-PA Author Manuscript
Newton-Cheh et al. Page 19
Tabl
e 1
Stud
y sa
mpl
e ch
arac
teri
stic
s
Stud
y ch
arac
teri
stic
s ar
e sh
own
for
coho
rt s
ampl
es e
xam
ined
in s
tage
1 m
eta-
anal
ysis
(po
pula
tion-
base
d an
d co
ntro
ls f
rom
cas
e-co
ntro
l stu
dies
), s
tage
2a
(dir
ect g
enot
ypin
g fo
llow
-up)
and
sta
ge 2
b (i
n si
lico
follo
w-u
p w
ith th
e C
HA
RG
E c
onso
rtiu
m).
Pop
ulat
ion
Coh
orts
: The
Bal
timor
e L
ongi
tudi
nal S
tudy
of
Agi
ng (
BL
SA),
Bri
tish
1958
Bir
th C
ohor
t- W
ellc
ome
Tru
st C
ase
Con
trol
Con
sort
ium
(B
58C
-WT
CC
C),
Bri
tish
1958
Bir
th C
ohor
t – T
ype
1 D
iabe
tes
Gen
etic
s C
onso
rtiu
m (
B58
C-T
1DG
C),
Coh
orte
Lau
sann
oise
(C
oLau
s), E
urop
ean
Pros
pect
ive
Inve
stig
atio
n of
Can
cer-
Nor
folk
-Gen
ome
Wid
eA
ssoc
iatio
n St
udy
(EPI
C-N
orfo
lk-G
WA
S), F
enla
nd S
tudy
(Fe
nlan
d), I
nvec
chia
re in
Chi
anti
(InC
HIA
NT
I), K
oope
rativ
e G
esun
dhei
tsfo
rsch
ung
in d
erR
egio
n A
ugsb
urg
(KO
RA
), N
orth
ern
Finl
and
Bir
th C
ohor
t of
1966
(N
FBC
1966
), S
ardi
NIA
, Stu
dy o
f H
ealth
in P
omer
ania
(SH
IP),
Sup
plem
enta
tion
enV
itam
ines
et M
inér
aux
Ant
ioxy
dant
s (S
U.V
I.M
AX
) an
d T
win
sUK
. Con
trol
s fr
om c
ase-
cont
rol s
tudi
es: D
iabe
tes
Gen
etic
s In
itiat
ive
(DG
I), F
inla
nd-
Uni
ted
Stat
es I
nves
tigat
ion
of N
IDD
M G
enet
ics
(FU
SIO
N),
the
Myo
card
ial I
nfar
ctio
n G
enet
ics
Con
sort
ium
(M
IGen
), th
e Pr
ecoc
ious
Cor
onar
y A
rter
yD
isea
se (
PRO
CA
RD
IS)
stud
y. D
irec
t gen
otyp
ing:
The
Utr
echt
Ath
eros
cler
osis
Ris
k in
You
ng A
dults
(A
YR
A),
Bri
tish
Gen
etic
s of
Hyp
erte
nsio
n st
udy
–hy
pert
ensi
on c
ases
(B
RIG
HT
-HT
N),
BR
IGH
T s
tudy
nor
mot
ensi
ve c
ontr
ols
(BR
IGH
T-N
T),
EPI
C-I
taly
, EPI
C-N
orfo
lk-R
eplic
atio
n co
hort
(E
PIC
-N
orfo
lk-R
EP)
, Fin
risk
97, F
USI
ON
sta
ge 2
con
trol
s (F
USI
ON
2), L
ondo
n L
ife
Scie
nces
Pop
ulat
ion
(LO
LIP
OP)
, Mal
mö
Die
t and
Can
cer
Car
diov
ascu
lar
Coh
ort (
MD
C),
Mal
mö
Prev
entiv
e Pr
ojec
t (M
PP),
Pre
vent
ion
of R
Ena
l and
Vas
cula
r E
Nd
stag
e D
isea
se (
PRE
VE
ND
), M
etab
olic
Syn
drom
e in
Men
Stud
y (M
ET
SIM
), P
rosp
ect-
EPI
C c
ohor
t, U
trec
ht H
ealth
Pro
ject
(U
HP)
. NA
= n
ot a
vaila
ble.
HT
N =
hyp
erte
nsio
n
Stud
yN
% w
omen
Age
(SD
) ye
ars
SBP
(SD
) m
m H
gD
BP
(SD
) m
m H
gB
MI
(SD
) kg
/m2
% H
TN
#%
ant
i-hy
pert
ensi
ve t
hera
py
Stag
e 1
– G
WA
S
Pop
ulat
ion-
base
d co
hort
s
BL
SA70
844
42.4
(13
.2)
119.
5 (1
5.0)
77.3
(10.
2)24
.5(3
.6)
23.2
5.2
B58
C –
T1D
GC
*2,
580
5144
.3 (
0.3)
121.
7 (1
5.3)
79.4
(10
.5)
27.4
(4.
9)20
.54.
7
B58
C –
WT
CC
C*
1,47
350
44.9
(0.
4)12
6.7
(15.
2)79
.1(1
0.2)
27.4
(4.7
)17
.44.
2
CoL
aus
4,96
953
51.7
(9.
5)12
7.3
(17.
4)79
.4(1
0.8)
25.8
(4.6
)33
.916
EPI
C-
Nor
folk
- G
WA
S2,
100
5457
.2 (
7.8)
136.
7 (1
9.1)
83.9
(11.
9)26
.3(3
.9)
45.6
16
Fenl
and
1,40
156
45.0
(7.
3)12
2.8
(16.
3)75
.5 (
10.7
)27
.1 (
4.9)
18.8
5.5
InC
HIA
NT
I56
255
56.9
(14
.5)
138.
4 (2
0.1)
81.4
(10.
1)27
.1(4
.2)
59.6
23.7
KO
RA
1,64
451
52.5
(10
.1)
133.
4 (1
8.5)
81.8
(10.
9)27
.3(4
.1)
20.9
17
NFB
C19
66*
4,76
152
31*
125.
2 (1
3.8)
77.5
(11.
7)24
.6(4
.2)
21.7
2
Sard
iNIA
3,99
857
40.8
(15
.3)
128.
7 (2
8.4)
79.7
(17.
3)25
.1(4
.6)
29.5
10
SHIP
3,31
053
45.0
(13
.9)
133.
1 (2
0.2)
83.5
(11.
3)26
.9 (
4.7)
40.9
16.3
SUV
IMA
X1,
823
6050
.5 (
6.2)
120.
9 (1
2.3)
78.0
(8.1
)23
.5(3
.3)
19.0
0
Tw
insU
K87
310
045
.8 (
11.9
)12
2.9
(15.
4)78
.2(1
0.3)
24.8
(4.6
)27
.322
Con
trol
s fr
om c
ase-
cont
rol s
tudi
es
DG
I co
ntro
ls1,
277
5156
.1 (
8.7)
133.
3 (1
8.4)
80.1
(10.
0)26
.7(3
.8)
41.4
18
Nat Genet. Author manuscript; available in PMC 2010 September 21.

NIH
-PA Author Manuscript
NIH
-PA Author Manuscript
NIH
-PA Author Manuscript
Newton-Cheh et al. Page 20
Stud
yN
% w
omen
Age
(SD
) ye
ars
SBP
(SD
) m
m H
gD
BP
(SD
) m
m H
gB
MI
(SD
) kg
/m2
% H
TN
#%
ant
i-hy
pert
ensi
ve t
hera
py
FUSI
ON
NG
T c
ontr
ols
1,03
849
58.2
(10
.7)
139.
4 (1
9.3)
81.5
(10.
3)27
.1(4
.0)
51.8
21
MIG
en c
ontr
ols
1,12
138
48.9
(8.
3)12
7.1
(17.
8)80
.2 (
11.6
)27
.1 (
5.2)
36.4
13.4
PRO
CA
RD
IS c
ontr
ols
795
3758
.9 (
6.9)
134.
7 (1
8.6)
82.8
(10.
0)25
.9(3
.70)
15.0
2
Stag
e 2-
follo
w u
p
2a. C
ohor
ts w
ith
dire
ct g
enot
ypin
g da
ta
AR
YA
736
5257
.0 (
6.0)
125.
0 (1
3.0)
72.0
(8.0
)25
.0(4
.0)
15.8
1
BR
IGH
T-H
TN
2,44
559
57.1
(10
.8)
153.
9 (2
0.8)
94.0
(11
.0)
27.4
(3.
8)10
091
.2
BR
IGH
T-N
T67
377
55.5
(8.
5)11
1.1
(6.9
)71
.2 (
6.6)
24.4
(3.
2)0
0
EPI
C-I
taly
3,90
937
49.0
(7.
6)13
2.5
(15.
5)83
.7(9
.0)
26.0
(3.6
)43
.112
.7
EPI
C-N
orfo
lk-R
EP
15,8
5848
56.2
(7.
6)13
3.8
(17.
5)82
.3 (
11.0
)26
.3 (
3.8)
4415
Finr
isk9
77,
023
5147
.1 (
12.4
)13
4.9
(19.
4)82
.3 (
11.3
)26
.6 (
4.5)
45.5
12.4
FUSI
ON
21,
162
3757
.5 (
6.8)
138.
2 (1
9.5)
83.9
(10
.1)
26.8
(3.
8)8.
91
Lol
ipop
(E
urop
eans
)6,
006
3551
.2 (
10.3
)13
0.4
(19.
1)79
.6 (
10.6
)27
.5 (
5.1)
39.9
20
Lol
ipop
(In
dian
Asi
ans)
12,8
2336
48.8
(9.
9)12
9.9
(19.
1)80
.8 (
10.8
)27
.4 (
4.5)
42.9
25
MD
C-C
C5,
330
5857
.4 (
5.9)
141.
0 (1
9.0)
87.0
(9.5
)25
.7(4
.0)
63.8
17
ME
TSI
M5,
934
058
.1 (
6.0)
142.
0 (1
7.9)
89.8
(10
.2)
27.3
(4.
2)69
.640
.5
MPP
**14
,249
3445
.3 (
7.1)
125.
0 (1
4.0)
83.0
(9.1
)24
.4(3
.4)
34.8
4
PRE
VE
ND
7,27
251
47.5
(11
.4)
127.
7 (1
9.3)
73.6
(9.
7)25
.9 (
4.2)
22.0
13.7
Pros
pect
-EPI
C1,
680
100
57.0
(6.
0)13
3.0
(20.
0)79
.0(1
1.0)
26.0
(4.0
)42
.4N
A
Utr
echt
Hea
lth P
roje
ct2,
829
5240
.0 (
12)
128.
0 (1
9.0)
79.0
(11
.0)
25.0
(4.
0)32
.9N
A
2b. C
ohor
ts w
ith
in s
ilico
dat
a
CH
AR
GE
***
29,1
36
* Subj
ects
fro
m th
e N
orth
Fin
land
Bir
th C
ohor
t 196
6 w
ere
exam
ined
at a
ge 3
1 an
d fr
om th
e B
ritis
h 19
58 B
irth
Coh
ort s
ampl
es w
ere
exam
ined
at a
ges
44–4
5.
**T
he M
alm
ö Pr
even
tive
Proj
ect s
ampl
e ex
clud
es a
ll in
divi
dual
s w
ho c
ontr
ibut
ed to
the
Mal
mö
Die
t and
Can
cer
Car
diov
ascu
lar
Arm
(M
DC
-CC
)
*** Fu
ll ch
arac
teri
stic
s of
CH
AR
GE
con
stitu
ent c
ohor
ts a
re p
rese
nted
in m
anus
crip
t sub
mitt
ed b
y C
HA
RG
E.
# Glo
bal B
Pgen
def
initi
on o
f hy
pert
ensi
on is
SB
P ≥
140m
m H
g or
DB
P ≥
90m
m H
g or
taki
ng a
nti-
hype
rten
sive
med
icat
ion.
Nat Genet. Author manuscript; available in PMC 2010 September 21.
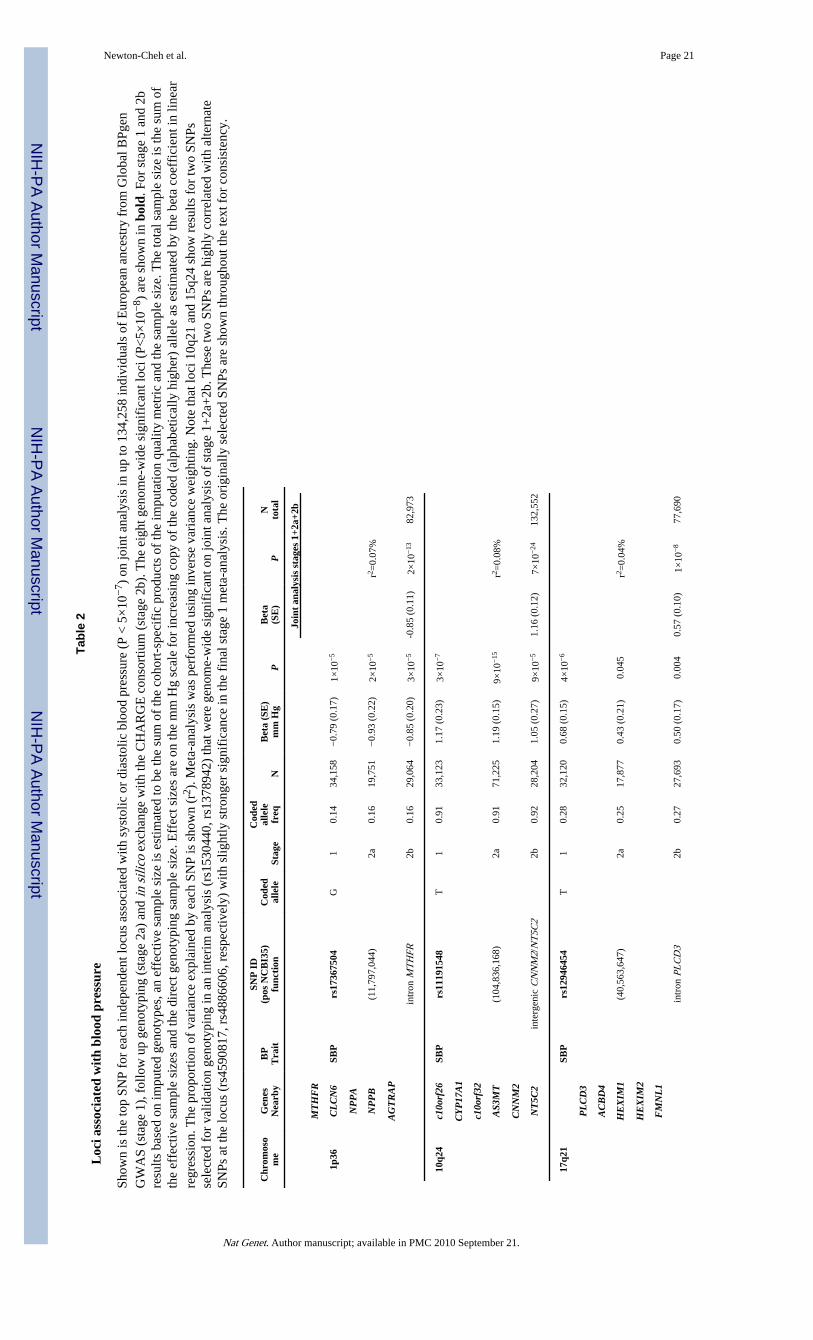
NIH
-PA Author Manuscript
NIH
-PA Author Manuscript
NIH
-PA Author Manuscript
Newton-Cheh et al. Page 21
Tabl
e 2
Loc
i ass
ocia
ted
wit
h bl
ood
pres
sure
Show
n is
the
top
SNP
for
each
inde
pend
ent l
ocus
ass
ocia
ted
with
sys
tolic
or
dias
tolic
blo
od p
ress
ure
(P <
5×
10−
7 ) o
n jo
int a
naly
sis
in u
p to
134
,258
indi
vidu
als
of E
urop
ean
ance
stry
fro
m G
loba
l BPg
enG
WA
S (s
tage
1),
fol
low
up
geno
typi
ng (
stag
e 2a
) an
d in
sili
co e
xcha
nge
with
the
CH
AR
GE
con
sort
ium
(st
age
2b).
The
eig
ht g
enom
e-w
ide
sign
ific
ant l
oci (
P<5×
10−
8 ) a
re s
how
n in
bol
d. F
or s
tage
1 a
nd 2
bre
sults
bas
ed o
n im
pute
d ge
noty
pes,
an
effe
ctiv
e sa
mpl
e si
ze is
est
imat
ed to
be
the
sum
of
the
coho
rt-s
peci
fic
prod
ucts
of
the
impu
tatio
n qu
ality
met
ric
and
the
sam
ple
size
. The
tota
l sam
ple
size
is th
e su
m o
fth
e ef
fect
ive
sam
ple
size
s an
d th
e di
rect
gen
otyp
ing
sam
ple
size
. Eff
ect s
izes
are
on
the
mm
Hg
scal
e fo
r in
crea
sing
cop
y of
the
code
d (a
lpha
betic
ally
hig
her)
alle
le a
s es
timat
ed b
y th
e be
ta c
oeff
icie
nt in
line
arre
gres
sion
. The
pro
port
ion
of v
aria
nce
expl
aine
d by
eac
h SN
P is
sho
wn
(r2 )
. Met
a-an
alys
is w
as p
erfo
rmed
usi
ng in
vers
e va
rian
ce w
eigh
ting.
Not
e th
at lo
ci 1
0q21
and
15q
24 s
how
res
ults
for
two
SNPs
sele
cted
for
val
idat
ion
geno
typi
ng in
an
inte
rim
ana
lysi
s (r
s153
0440
, rs1
3789
42)
that
wer
e ge
nom
e-w
ide
sign
ific
ant o
n jo
int a
naly
sis
of s
tage
1+
2a+
2b. T
hese
two
SNPs
are
hig
hly
corr
elat
ed w
ith a
ltern
ate
SNPs
at t
he lo
cus
(rs4
5908
17, r
s488
6606
, res
pect
ivel
y) w
ith s
light
ly s
tron
ger
sign
ific
ance
in th
e fi
nal s
tage
1 m
eta-
anal
ysis
. The
ori
gina
lly s
elec
ted
SNPs
are
sho
wn
thro
ugho
ut th
e te
xt f
or c
onsi
sten
cy.
Chr
omos
om
eG
enes
Nea
rby
BP
Tra
it
SNP
ID
(pos
NC
BI3
5)fu
ncti
onC
oded
alle
leSt
age
Cod
edal
lele
freq
NB
eta
(SE
)m
m H
gP
Bet
a(S
E)
PN
tota
l
Join
t an
alys
is s
tage
s 1+
2a+2
b
MT
HF
R
1p36
CL
CN
6SB
Prs
1736
7504
G1
0.14
34,1
58−
0.79
(0.
17)
1×10
−5
NP
PA
NP
PB
(11,
797,
044)
2a0.
1619
,751
−0.
93 (
0.22
)2×
10−
5r2 =
0.07
%
AG
TR
AP
intr
on M
TH
FR2b
0.16
29,0
64−
0.85
(0.
20)
3×10
−5
-0.8
5 (0
.11)
2×10
−13
82,9
73
10q2
4c1
0orf
26SB
Prs
1119
1548
T1
0.91
33,1
231.
17 (
0.23
)3×
10−
7
CY
P17
A1
c10o
rf32
AS3
MT
(104
,836
,168
)2a
0.91
71,2
251.
19 (
0.15
)9×
10−
15r2 =
0.08
%
CN
NM
2
NT
5C2
inte
rgen
ic C
NN
M2/
NT
5C2
2b0.
9228
,204
1.05
(0.
27)
9×10
−5
1.16
(0.
12)
7×10
−24
132,
552
17q2
1SB
Prs
1294
6454
T1
0.28
32,1
200.
68 (
0.15
)4×
10−
6
PL
CD
3
AC
BD
4
HE
XIM
1(4
0,56
3,64
7)2a
0.25
17,8
770.
43 (
0.21
)0.
045
r2 =0.
04%
HE
XIM
2
FM
NL
1
intr
on P
LC
D3
2b0.
2727
,693
0.50
(0.
17)
0.00
40.
57 (
0.10
)1×
10−
877
,690
Nat Genet. Author manuscript; available in PMC 2010 September 21.
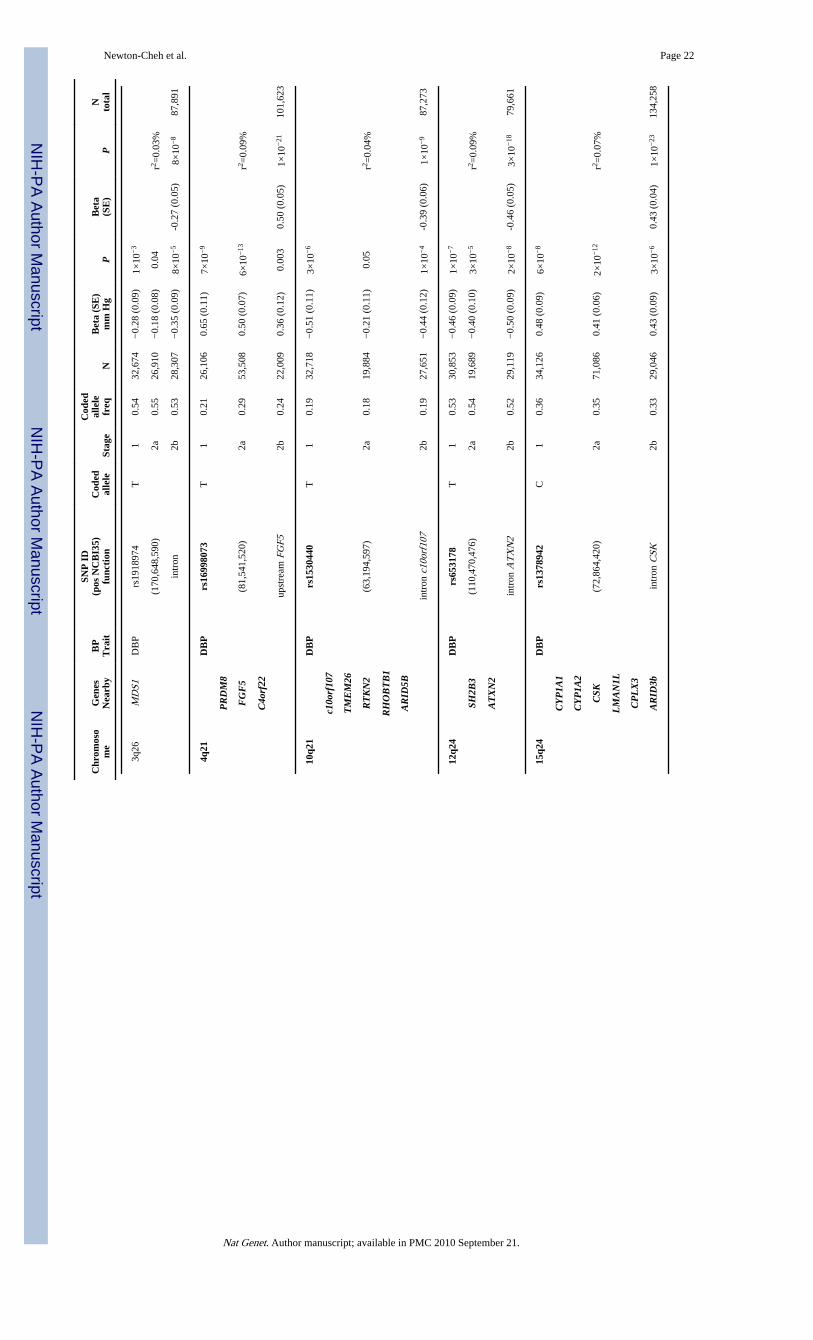
NIH
-PA Author Manuscript
NIH
-PA Author Manuscript
NIH
-PA Author Manuscript
Newton-Cheh et al. Page 22
Chr
omos
om
eG
enes
Nea
rby
BP
Tra
it
SNP
ID
(pos
NC
BI3
5)fu
ncti
onC
oded
alle
leSt
age
Cod
edal
lele
freq
NB
eta
(SE
)m
m H
gP
Bet
a(S
E)
PN
tota
l
3q26
MD
S1D
BP
rs19
1897
4T
10.
5432
,674
−0.
28 (
0.09
)1×
10−
3
(170
,648
,590
)2a
0.55
26,9
10−
0.18
(0.
08)
0.04
r2 =0.
03%
intr
on2b
0.53
28,3
07−
0.35
(0.
09)
8×10
−5
-0.2
7 (0
.05)
8×10
−8
87,8
91
4q21
DB
Prs
1699
8073
T1
0.21
26,1
060.
65 (
0.11
)7×
10−
9
PR
DM
8
FG
F5
(81,
541,
520)
2a0.
2953
,508
0.50
(0.
07)
6×10
−13
r2 =0.
09%
C4o
rf22
upst
ream
FG
F52b
0.24
22,0
090.
36 (
0.12
)0.
003
0.50
(0.
05)
1×10
−21
101,
623
10q2
1D
BP
rs15
3044
0T
10.
1932
,718
−0.
51 (
0.11
)3×
10−
6
c10o
rf10
7
TM
EM
26
RT
KN
2(6
3,19
4,59
7)2a
0.18
19,8
84−
0.21
(0.
11)
0.05
r2 =0.
04%
RH
OB
TB
1
AR
ID5B
intr
on c
10or
f107
2b0.
1927
,651
−0.
44 (
0.12
)1×
10−
4-0
.39
(0.0
6)1×
10−
987
,273
12q2
4D
BP
rs65
3178
T1
0.53
30,8
53−
0.46
(0.
09)
1×10
−7
SH2B
3(1
10,4
70,4
76)
2a0.
5419
,689
−0.
40 (
0.10
)3×
10−
5r2 =
0.09
%
AT
XN
2
intr
on A
TX
N2
2b0.
5229
,119
−0.
50 (
0.09
)2×
10−
8-0
.46
(0.0
5)3×
10−
1879
,661
15q2
4D
BP
rs13
7894
2C
10.
3634
,126
0.48
(0.
09)
6×10
−8
CY
P1A
1
CY
P1A
2
CSK
(72,
864,
420)
2a0.
3571
,086
0.41
(0.
06)
2×10
−12
r2 =0.
07%
LM
AN
1L
CP
LX
3
AR
ID3b
intr
on C
SK2b
0.33
29,0
460.
43 (
0.09
)3×
10−
60.
43 (
0.04
)1×
10−
2313
4,25
8
Nat Genet. Author manuscript; available in PMC 2010 September 21.

NIH
-PA Author Manuscript
NIH
-PA Author Manuscript
NIH
-PA Author Manuscript
Newton-Cheh et al. Page 23
Chr
omos
om
eG
enes
Nea
rby
BP
Tra
it
SNP
ID
(pos
NC
BI3
5)fu
ncti
onC
oded
alle
leSt
age
Cod
edal
lele
freq
NB
eta
(SE
)m
m H
gP
Bet
a(S
E)
PN
tota
l
17q2
1D
BP
rs16
9480
48G
10.
3934
,052
0.40
(0.
09)
5×10
−6
ZN
F65
2(4
4,79
5,46
5)2a
0.37
19,7
520.
23 (
0.10
)0.
02r2 =
0.04
%
PH
B
upst
ream
ZN
F652
2b0.
3728
,637
0.29
(0.
09)
0.00
20.
31 (
0.05
)5×
10−
982
,441
Nat Genet. Author manuscript; available in PMC 2010 September 21.
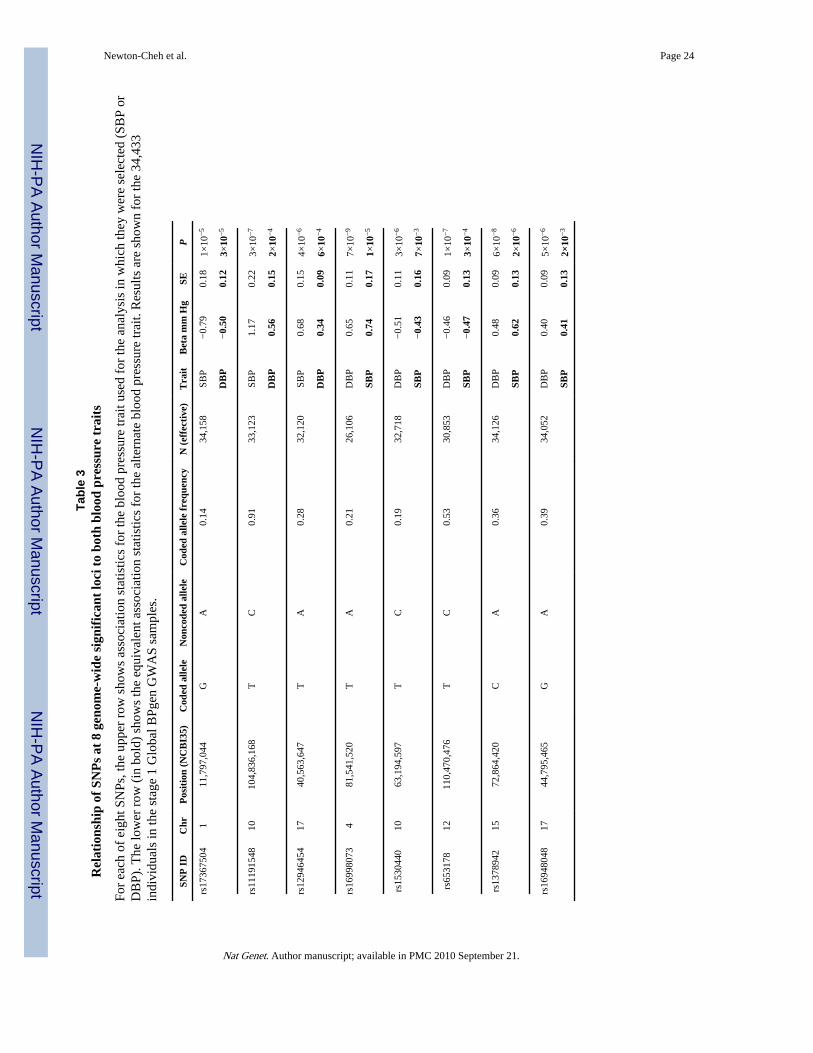
NIH
-PA Author Manuscript
NIH
-PA Author Manuscript
NIH
-PA Author Manuscript
Newton-Cheh et al. Page 24
Tabl
e 3
Rel
atio
nshi
p of
SN
Ps
at 8
gen
ome-
wid
e si
gnif
ican
t lo
ci t
o bo
th b
lood
pre
ssur
e tr
aits
For
each
of
eigh
t SN
Ps, t
he u
pper
row
sho
ws
asso
ciat
ion
stat
istic
s fo
r th
e bl
ood
pres
sure
trai
t use
d fo
r th
e an
alys
is in
whi
ch th
ey w
ere
sele
cted
(SB
P or
DB
P). T
he lo
wer
row
(in
bol
d) s
how
s th
e eq
uiva
lent
ass
ocia
tion
stat
istic
s fo
r th
e al
tern
ate
bloo
d pr
essu
re tr
ait.
Res
ults
are
sho
wn
for
the
34,4
33in
divi
dual
s in
the
stag
e 1
Glo
bal B
Pgen
GW
AS
sam
ples
.
SNP
ID
Chr
Pos
itio
n (N
CB
I35)
Cod
ed a
llele
Non
code
d al
lele
Cod
ed a
llele
fre
quen
cyN
(ef
fect
ive)
Tra
itB
eta
mm
Hg
SEP
rs17
3675
041
11,7
97,0
44G
A0.
1434
,158
SBP
−0.
790.
181×
10−
5
DB
P−
0.50
0.12
3×10
−5
rs11
1915
4810
104,
836,
168
TC
0.91
33,1
23SB
P1.
170.
223×
10−
7
DB
P0.
560.
152×
10−
4
rs12
9464
5417
40,5
63,6
47T
A0.
2832
,120
SBP
0.68
0.15
4×10
−6
DB
P0.
340.
096×
10−
4
rs16
9980
734
81,5
41,5
20T
A0.
2126
,106
DB
P0.
650.
117×
10−
9
SBP
0.74
0.17
1×10
−5
rs15
3044
010
63,1
94,5
97T
C0.
1932
,718
DB
P−
0.51
0.11
3×10
−6
SBP
−0.
430.
167×
10−
3
rs65
3178
1211
0,47
0,47
6T
C0.
5330
,853
DB
P−
0.46
0.09
1×10
−7
SBP
−0.
470.
133×
10−
4
rs13
7894
215
72,8
64,4
20C
A0.
3634
,126
DB
P0.
480.
096×
10−
8
SBP
0.62
0.13
2×10
−6
rs16
9480
4817
44,7
95,4
65G
A0.
3934
,052
DB
P0.
400.
095×
10−
6
SBP
0.41
0.13
2×10
−3
Nat Genet. Author manuscript; available in PMC 2010 September 21.

NIH
-PA Author Manuscript
NIH
-PA Author Manuscript
NIH
-PA Author Manuscript
Newton-Cheh et al. Page 25
Tabl
e 4
Ass
ocia
tion
of
8 SB
P-
and
DB
P-a
ssoc
iate
d lo
ci w
ith
hype
rten
sion
Show
n ar
e th
e re
sults
for
the
top
SNP
from
eac
h ge
nom
e-w
ide
sign
ific
ant S
BP
or D
BP
locu
s fr
om a
logi
stic
reg
ress
ion
anal
ysis
of
the
odds
of
hype
rten
sion
com
pare
d to
nor
mot
ensi
on (
see
Met
hods
). F
or c
ompa
riso
n, th
e ef
fect
of
the
code
d al
lele
on
the
cont
inuo
us b
lood
pre
ssur
e tr
ait i
s sh
own.
The
inve
rse-
vari
ance
-wei
ghte
d m
eta-
anal
ysis
res
ults
are
sho
wn.
BP
= b
lood
pre
ssur
e, O
R =
odd
s ra
tio.
SNP
ID
Chr
posi
tion
(N
CB
I35)
Con
tinu
ous
Tra
itC
oded
alle
leC
oded
alle
le f
requ
ency
Con
tinu
ous
BP
eff
ect
HT
N O
RH
TN
95%
CI
HT
N P
N
rs17
3675
041
11,7
97,0
44SB
PG
0.14
↓0.
890.
86 –
0.9
32×
10−
962
,803
rs11
1915
4810
104,
836,
168
SBP
T0.
91↑
1.16
1.11
– 1
.21
3×10
−13
99,1
53
rs12
9464
5417
40,5
63,6
47SB
PT
0.28
↑1.
071.
04 –
1.1
12×
10−
557
,410
rs16
9980
734
81,5
41,5
20D
BP
T0.
19↑
1.10
1.07
– 1
.13
7×10
−10
73,7
56
rs15
3044
010
63,1
94,5
97D
BP
T0.
19↓
0.95
0.91
– 0
.98
2×10
−3
83,1
56
rs65
3178
1211
0,47
0,47
6D
BP
T0.
53↓
0.93
0.91
– 0
.96
8×10
−7
60,0
30
rs13
7894
215
72,8
64,4
20D
BP
C0.
37↑
1.10
1.07
– 1
.12
2×10
−14
99,8
02
rs16
9480
4817
44,7
95,4
65D
BP
G0.
39↑
1.06
1.03
– 1
.09
1×10
−4
62,4
11
Nat Genet. Author manuscript; available in PMC 2010 September 21.