edit the text with mwi laboratories - keysight testing: powders, ceramic, oils, & other...
TRANSCRIPT

Edit the text with
your own short
phrases.
The animation is
already done for
you; just copy and
paste the slide
into your existing
presentation.
2014
MWI Laboratories
1002 E. Vista Del Cerro Dr. Tempe, AZ 85281
480-478-9398 www.mwilab.com
Presented By: Jeffrey Peebles, CO-Founder 1
Non-destructive testing: powders, ceramic, oils, & other composite materials

Edit the text with
your own short
phrases.
The animation is
already done for
you; just copy and
paste the slide
into your existing
presentation.
Objective
Objective
- Introduce Gaussian Beam Technologies
- Describe how they can save the user TIME and MONEY in a variety
of Non-destructive (NDT) applications.
- Laboratory Quality Assurance (QA)
- In-process Quality Control (QC)
- Maintenance & Repair
- Understand theories of material measurement in a NDT application
- Find the suitable solution for your application and its benefits
2

Edit the text with
your own short
phrases.
The animation is
already done for
you; just copy and
paste the slide
into your existing
presentation.
Agenda
Agenda
Introduction of MWI Lab’s Gaussian Beam capability
Customer Benefits
Competition
Microwave {0.7 – 50 GHz} Non-destructive / Non-contact Technology
Antenna design
Application Implementation
Solutions
UHF / VHF Non-destructive Epod & MEpod
Antenna design
Application Implementation
Solutions
Dielectric Powder Testing
Theory of design
Application Implementation
Solution
References 3

Edit the text with
your own short
phrases.
The animation is
already done for
you; just copy and
paste the slide
into your existing
presentation.
Pain of our Customer
Customer Pain
Needs to test the actual deliverable composite part
Needs Non-Destructive (NDT) inspection capabilities
Needs real time & tighter In process Quality Control
Determining Composite material variability & Uniformity
Product cure verification of anisotropic material
Needs to reduce scrap / waste while increasing Production efficiencies
Needs real-time Material Properties
In liquid state
In powder state
In-process high temp conditions
In solids; pre or post “cooking”
Needs to inspect for defect;
Moister Levels
Surface; dents, strikes, F.O.D.
Composite material repair quality
4

Edit the text with
your own short
phrases.
The animation is
already done for
you; just copy and
paste the slide
into your existing
presentation.
Typical Material Vs Freq.
Typical
Material
40Hz 1MHz 50 MHz 100 MHz 500 MHz 1GHz 10GHz 20GHz 30GHz 40GHz 50GHz
5
Powders Powders {release early 2015}
Plastics {Films, Solids, Webs}
Moister Level {Food, drug, and related packaging …etc.}
Ceramics {Tiles, mesh and webs}
Composite structures {Radomes, Air foils, propeller blades …etc.}
Foams, Non-conductive & Conductive {Radome, EMC / RF absorbers}
Honeycomb cores, Non-conductive & Conductive {Radome, EMC / RF absorbers}
Films / webs, Non-conductive & Conductive {Fiber glass, Kapton, Kevlar…etc.}
Plastics; Ceramic, Teflon, Lexan, Rexolite, Glass Epoxy, Resin, Quartz Glass, Silicon dioxide, Si02…..etc. Powders; Talcum, Salt, Potash, Additives, Sugar, Quartz, Ceramics, Drug mixtures….etc.

Edit the text with
your own short
phrases.
The animation is
already done for
you; just copy and
paste the slide
into your existing
presentation.
Equip. Selection Vs Freq.
MWI LAB
Equip Solution
40Hz 1MHz 50 MHz 100 MHz 500 MHz 1GHz 10GHz 20GHz 30GHz 40GHz 50GHz
6
Capacitor {QA}
MEpod {QA, QC, Hand held}
Large Tunnel {QA}
High Temp. Test Capability
Hand Held Reflectometers
In Process 3D Test/ Scan Capability
Mini / Micro Arch {QA, QC, Robotic}
Mini / Micro Tunnels {QA, QC, Robotic}
QA = Quality Assurance Application QC = Quality Control / In Process Applications
Epod {QA, QC, Hand held}
Large Arch {QA}
Non-Contact / Non-destructive Applications Non-destructive Application

Edit the text with
your own short
phrases.
The animation is
already done for
you; just copy and
paste the slide
into your existing
presentation.
MWI Lab Solutions
MWI Lab
Solutions
7
Engineering Services
Design & Implement -Custom Test systems -System Evaluation -Control Software
QA Lab Equipment
QC In-process Equipment
Material Test Services
Edit the text with
your own short
phrases.
The animation is
already done for
you; just copy and
paste the slide
into your existing
presentation.
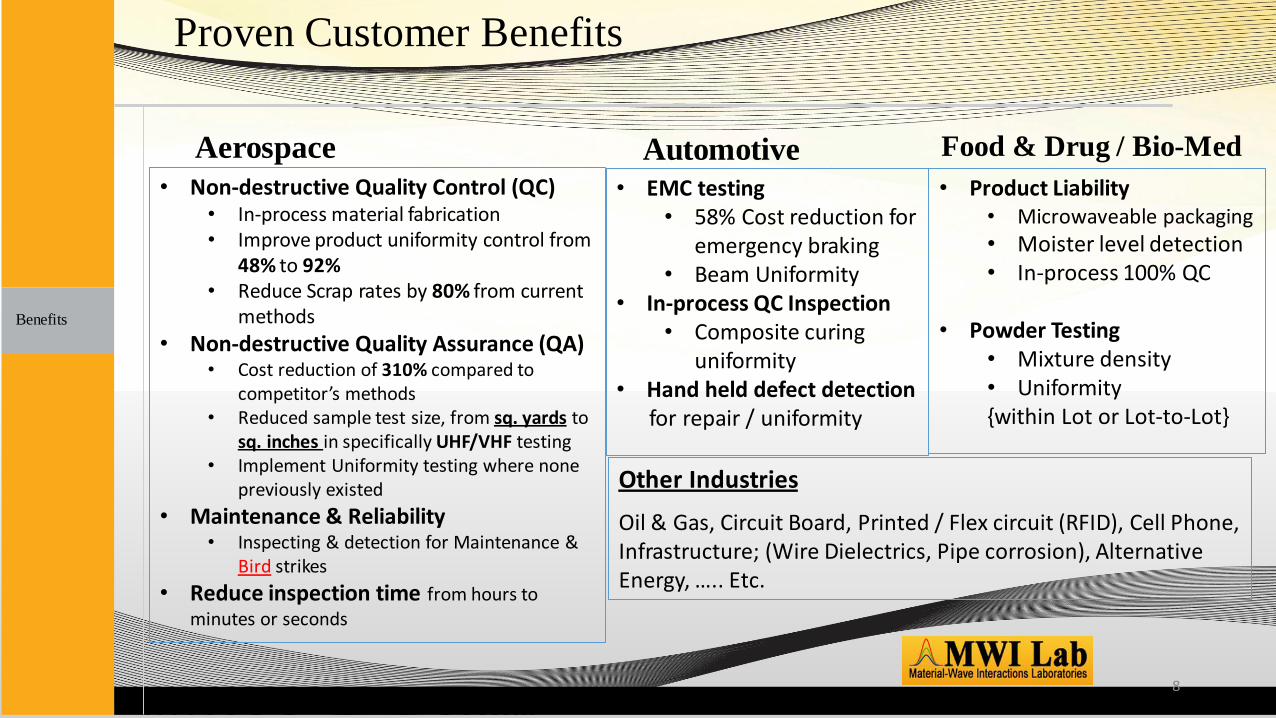
Proven Customer Benefits
Aerospace
Benefits
Automotive Food & Drug / Bio-Med
• Product Liability • Microwaveable packaging • Moister level detection • In-process 100% QC
• Powder Testing
• Mixture density • Uniformity {within Lot or Lot-to-Lot}
• EMC testing • 58% Cost reduction for
emergency braking • Beam Uniformity
• In-process QC Inspection • Composite curing
uniformity • Hand held defect detection for repair / uniformity
• Non-destructive Quality Control (QC) • In-process material fabrication • Improve product uniformity control from
48% to 92% • Reduce Scrap rates by 80% from current
methods
• Non-destructive Quality Assurance (QA) • Cost reduction of 310% compared to
competitor’s methods • Reduced sample test size, from sq. yards to
sq. inches in specifically UHF/VHF testing • Implement Uniformity testing where none
previously existed
• Maintenance & Reliability • Inspecting & detection for Maintenance &
Bird strikes
• Reduce inspection time from hours to minutes or seconds
8
Other Industries
Oil & Gas, Circuit Board, Printed / Flex circuit (RFID), Cell Phone, Infrastructure; (Wire Dielectrics, Pipe corrosion), Alternative Energy, ….. Etc.
Edit the text with
your own short
phrases.
The animation is
already done for
you; just copy and
paste the slide
into your existing
presentation.
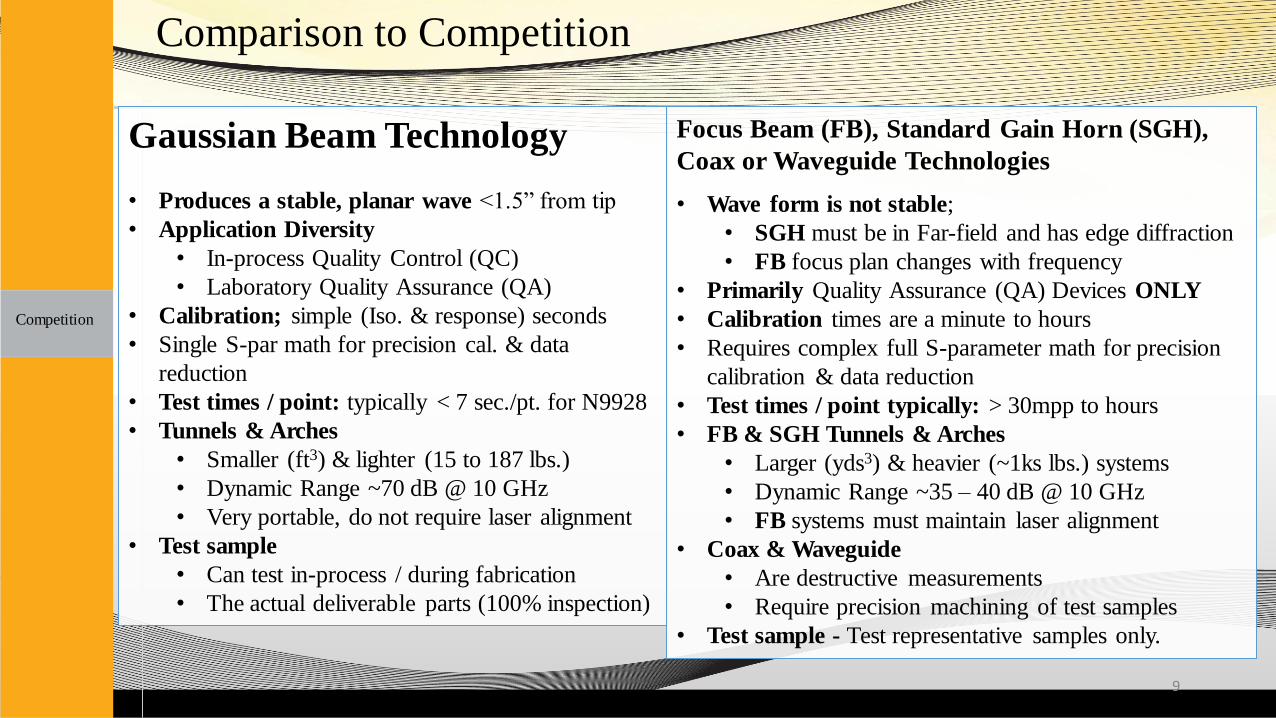
Comparison to Competition
Competition
Gaussian Beam Technology
• Produces a stable, planar wave <1.5” from tip
• Application Diversity
• In-process Quality Control (QC)
• Laboratory Quality Assurance (QA)
• Calibration; simple (Iso. & response) seconds
• Single S-par math for precision cal. & data
reduction
• Test times / point: typically < 7 sec./pt. for N9928
• Tunnels & Arches
• Smaller (ft3) & lighter (15 to 187 lbs.)
• Dynamic Range ~70 dB @ 10 GHz
• Very portable, do not require laser alignment
• Test sample
• Can test in-process / during fabrication
• The actual deliverable parts (100% inspection)
9
Focus Beam (FB), Standard Gain Horn (SGH),
Coax or Waveguide Technologies
• Wave form is not stable;
• SGH must be in Far-field and has edge diffraction
• FB focus plan changes with frequency
• Primarily Quality Assurance (QA) Devices ONLY
• Calibration times are a minute to hours
• Requires complex full S-parameter math for precision
calibration & data reduction
• Test times / point typically: > 30mpp to hours
• FB & SGH Tunnels & Arches
• Larger (yds3) & heavier (~1ks lbs.) systems
• Dynamic Range ~35 – 40 dB @ 10 GHz
• FB systems must maintain laser alignment
• Coax & Waveguide
• Are destructive measurements
• Require precision machining of test samples
• Test sample - Test representative samples only.
Edit the text with
your own short
phrases.
The animation is
already done for
you; just copy and
paste the slide
into your existing
presentation.
Our Technology
Our primary devices use free space, Gaussian Beam Technology for performing
non-destructive testing (NDT) and include but are not limited to Admittance
Tunnels, NRL Reflection Loss Arches, hand held Reflectometer.
New revolutionary family of sensors called the E-pods or Electro-Magnetic
Linear Polarized Resonate Sensors and ME-pods for Multi-Resonate Sensors.
New / unique powder test capability, using the E4990A Impedance analyzer
combined with the 16451B fixture. Early 2015, to release E4991B Impedance
analyzer combined with the 16453A fixture.
Technology
10

Gaussian Beam Antennas
R. E. Diaz, J. W. Peebles, R. LeBaron
Arizona State University
11

Motivation
• The Gaussian Beam Antennas fills the need for a stable, narrow, uniform beam that does not change with frequency when testing for material properties at microwave frequencies.
• Focus beam (FB) test systems have an inherent issues that the beam’s focusing spot size and position changes with frequency.
• Standard Gain Horns (SGH) require very large systems in order to be in the far field for achieving a planar wave. They typically over illuminate the sample being tested. Requires an iris plate.
• Typical Iris / reflective test system have issues with beam scattering / diffraction due to sample over illumination.
12

High Fidelity Admittance Tunnel
Why not a focusing lensed tunnel? •The field on the focal plane contains a longitudinal E-field that can be as high as 30% of the desired transverse field.
•Focal plane changes with frequency. - It can be before or after the material
plane. - Thus requiring additional S-par math
for calibration correction and data reduction.
•Spot shrinks proportional to the frequency, sampling less and less of the material.
•Over focusing causes a split beam effect.
13
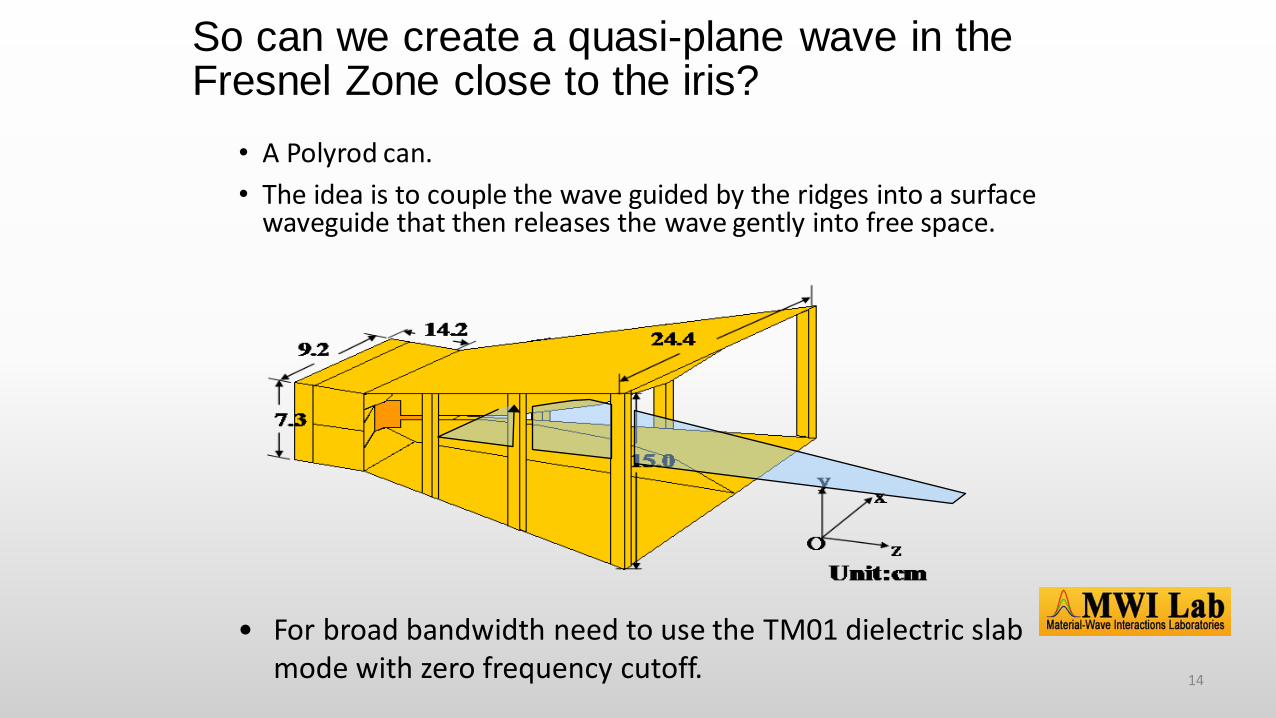
So can we create a quasi-plane wave in the Fresnel Zone close to the iris?
• A Polyrod can.
• The idea is to couple the wave guided by the ridges into a surface waveguide that then releases the wave gently into free space.
• For broad bandwidth need to use the TM01 dielectric slab mode with zero frequency cutoff. 14
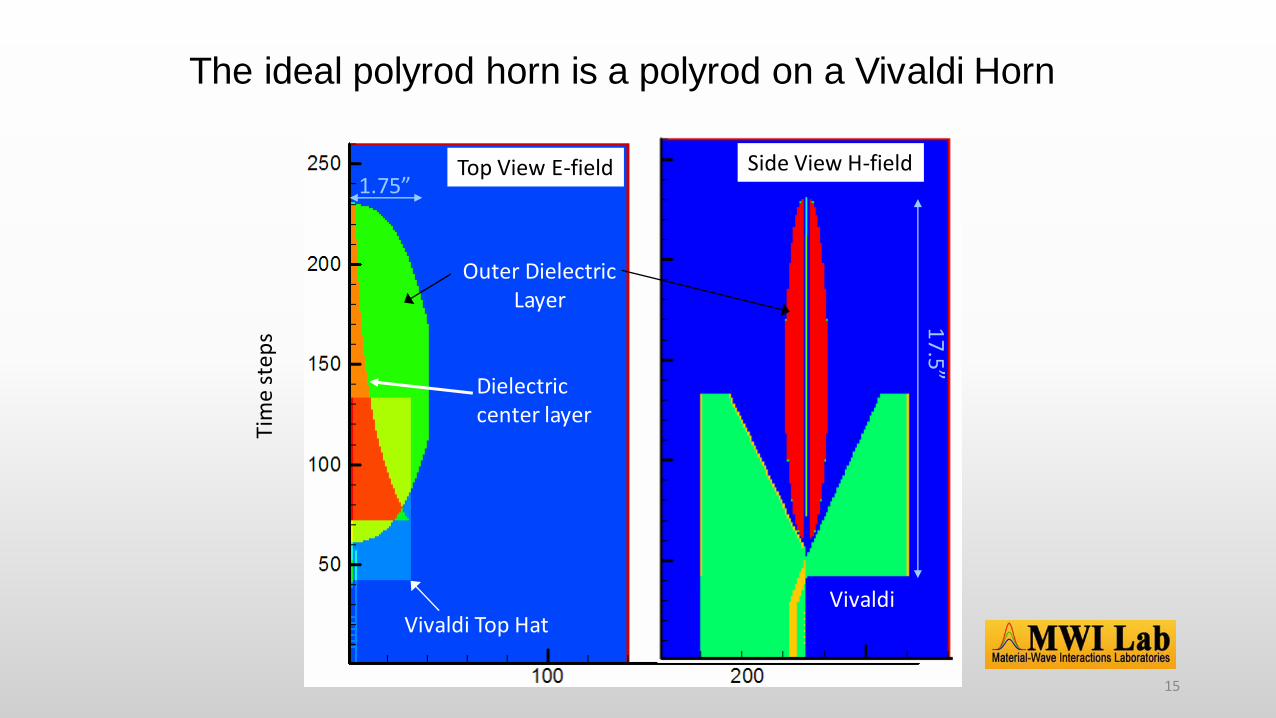
The ideal polyrod horn is a polyrod on a Vivaldi Horn
Top View E-field Side View H-field
Vivaldi Top Hat Vivaldi
Dielectric center layer
Outer Dielectric Layer
1.75”
17.5”
15
Tim
e s
tep
s

Time history t=182dt to 546dt
• Top view, E-field 16
Tim
e s
tep
s

Time history t=364dt to 546dt
• Side view, H-field 17
Tim
e s
tep
s
250
200 150
100
50

4 2 0 2 40
0.024
0.048
0.072
0.096
0.120.12
0
F12ik
F11ik
F10ik
F09ik
F08ik
3.63.3 Positionik
The concentration of field on axis can occur as low as 165 MHz
• E-plane beam profile produced by the polyrod horn
• (c) 8 GHz, 9 GHz, 10 GHz, 11 GHz,12 GHz.
• (d) 13 GHz, 15 GHz, 17 GHz, 19 GHz, 20 GHz
4 2 0 2 40
0.024
0.048
0.072
0.096
0.120.12
0
F20ik
F19ik
F17ik
F15ik
F13ik
3.63.3 Position ik
(c) (d)
7”
7”
18
Edit the text with
your own short
phrases.
The animation is
already done for
you; just copy and
paste the slide
into your existing
presentation.
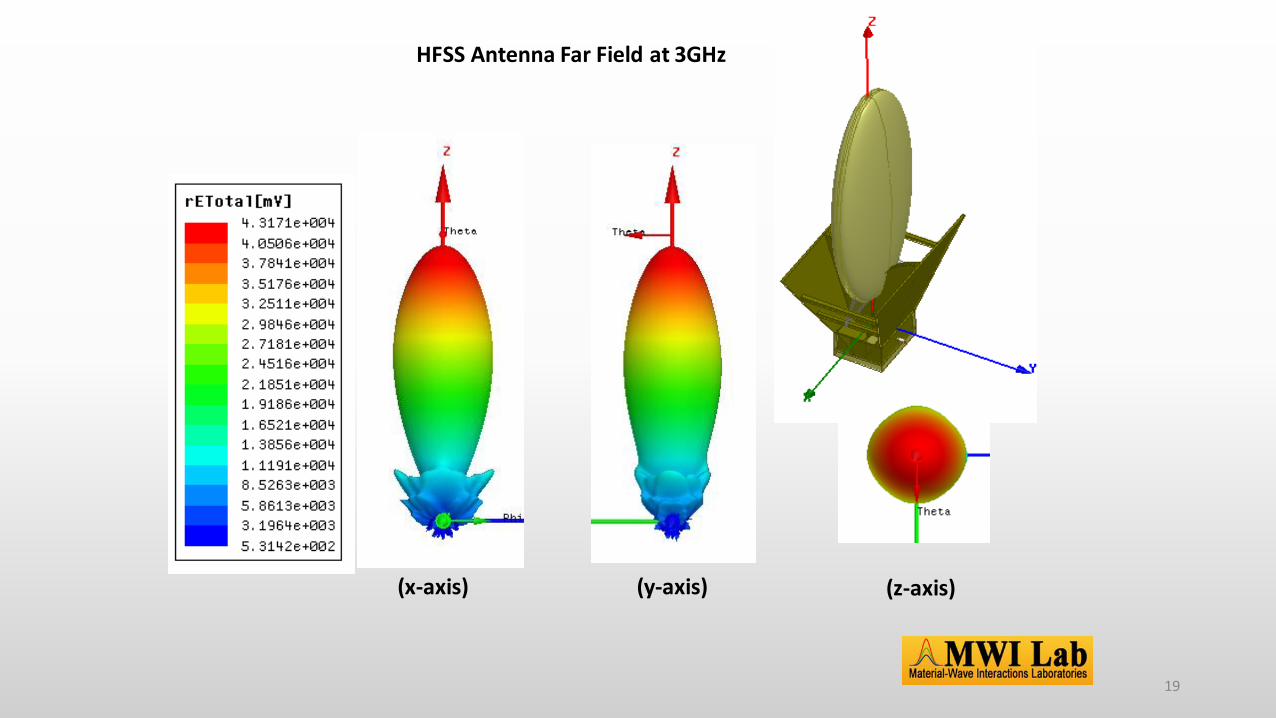
HFSS Antenna Far Field at 3GHz
(x-axis) (y-axis) (z-axis)
19

20
The aperture: •Chokes the wave at low frequency. •Diffraction adds non-plane wave interference
The admittance tunnel is one of the most important material measurement tools
Measurement of Amplitude, Phase as f(polarization,w) plus material thickness yields
complex e,m
The incident wave is not plane

The polyrod design enables a very compact tunnel, increasing the Dynamic Range
Thru Response
Isolation
50MHz 20 GHz
Below 2GHz: 50 dB
70 dB
21

Polyrods 1ft tip to tip yield measurement results equivalent to horn antennas 6ft apart
• A slab of rexolite from Cal Plastics 3.5mm thick. No Iris
0 2 4 6 8 10 12 14 16 18 202
2.1
2.2
2.3
2.4
2.5
2.6
2.7
2.8
2.9
3
Rexolite (gated in empty)
Re
al p
art
of P
erm
itti
vit
y
3 .0
2.0
0
2.55
epr3 i
200 fGHz i
0 2 4 6 8 10 12 14 16 18 201
0.8
0.6
0.4
0.2
0
0.2
0.4
0.6
0.8
1
Imag
. pa
rt o
f P
erm
itti
vity
1
1
edp3 i
200 fGHz i
Result from Horn antennas Result from Horn-Polyrods
22

23
Poly-probe Antenna
• Analysis Shows • Spot size is less than (2.5” x 2.5”)
• Conical beam pattern
• Scalable to any size of waveguide
Near Field Far Field

Edit the text with
your own short
phrases.
The animation is
already done for
you; just copy and
paste the slide
into your existing
presentation.
Gaussian Beam Tunnels
Large & Mini / Micro
Tunnel Tunnels
24

Edit the text with
your own short
phrases.
The animation is
already done for
you; just copy and
paste the slide
into your existing
presentation.
Large Tunnel
Applications Specifications
Tunnels
• Laboratory QA environments • Mobility for program areas use • Material testing ranges
• Low loss / Low Dielectric materials
• Radomes • Webs; S-glass, Kevlar, etc. • Honeycomb cores • FR4 type foams
• Absorbing structures • Lossy / Conductive material • Resistive films / R-cards • Absorbers • Magrams
• Uniformity testing
• Frequency from 0.7 to 16 GHz
• Beam Size 12.5"@10 GHz
• 70 dB dynamic range @ 10 GHz
• Off-angle (45o) Insertion Loss Capable
• Dimensions 40” x 40” x 84“
• Sample size depends upon desired freq. range of test.
• Low diffraction sample table
• TMACS Supports all Keysight PNAs, and Field Foxes… PXI-VNA & ENA coming soon.
25

Edit the text with
your own short
phrases.
The animation is
already done for
you; just copy and
paste the slide
into your existing
presentation.
Mini & Micro Tunnel
Specifications Applications
Tunnels
• Frequency range is banded from 7 to 50 GHz and is dependent on PRA antennas ordered
• Beam Size range; 1” to 2.5" dia
• Off-Angle (60o) insertion Loss capable
• Minimum sample is 3.0” for normal or 6.0” for off-angle.
• Dimensions; • Mini =26x 40 x 36“ Micro =12x 24 x 36”
• Optional probe mounts • Dual Polarity /Multi Probe for freq.
• TMACS Supports all Keysight PNAs, and Field Foxes… PXI-VNA & ENA coming soon.
• Laboratory QA environments • Table Top / Mobility for program areas • Material testing ranges
• Low loss / Low Dielectric materials
• Radomes • Webs; S-glass, Kevlar, etc. • Honeycomb cores • FR4 type foams
• Absorbing structures • Lossy / Conductive material • Resistive films / R-cards • Absorbers • Magrams
• Uniformity testing • FOD & Defect Detection
26

Edit the text with
your own short
phrases.
The animation is
already done for
you; just copy and
paste the slide
into your existing
presentation.
Gaussian Beam Reflection Arches
Arches
27

Edit the text with
your own short
phrases.
The animation is
already done for
you; just copy and
paste the slide
into your existing
presentation.
Large Arch
Applications Specifications
Arches
• Laboratory QA environments • Mobility for program areas • Material testing ranges
• Low loss / Low Dielectric materials
• Radomes • Webs; S-glass, Kevlar, etc. • Honeycomb cores • FR4 type foams
• Absorbing structures • Lossy / Conductive material • Resistive films / R-cards • Absorbers • Magrams
• Uniformity testing
• Frequency from 0.7 to 16 GHz
• Beam Size 12.5"@10 GHz
• Angle range (TE & TM) • +10º to +85º • Cross talk reduction baffle
• Dimensions 50” x 40” x 84“
• Sample size depends upon desired freq. range of test.
• Low diffraction sample table
• TMACS Supports all Keysight PNAs, and Field Foxes… PXI-VNA & ENA coming soon.
28
Options available • Customized sample tables • Automated positioning &
calibration • Space saving applications

Edit the text with
your own short
phrases.
The animation is
already done for
you; just copy and
paste the slide
into your existing
presentation.
Mini Arch
Applications Specifications
Arches
• Laboratory QA environments • Table Top / Mobility for program areas • Material testing ranges
• Low loss / Low Dielectric materials
• Radomes • Webs; S-glass, Kevlar, etc. • Honeycomb cores • FR4 type foams
• Absorbing structures • Lossy / Conductive material • Resistive films / R-cards • Absorbers • Magrams
• Uniformity testing • FOD & Defect Detection
• Frequency range is banded from 7 to 50 GHz and is dependent on PRA antennas
• Beam Size range; 1 to 2.5" dia • Angle range (TE & TM)
• +5º to +85º • Cross talk reduction baffle
• Minimum sample is 3.0” for 0 – 25o or 6.0” for full range of reflection angles.
• Dimensions; 26” x 30” x 36“ table top • Options
• Probe mounts for Dual Polarity / Multi Probe for freq.
• Automated Positioning
• TMACS Supports all Keysight PNAs, and Field Foxes… PXI-VNA & ENA coming soon.
29

Edit the text with
your own short
phrases.
The animation is
already done for
you; just copy and
paste the slide
into your existing
presentation.
Epods & MEpods Table
Epods
Epod is a single resonate frequency probe
MEpod is a multi-resonate frequency probe
30

Fieldable inspection tools operating at the frequency of
use for risk reduction of composite structural
platforms, from manufacturing through
repair
R. E. Diaz, J. W. Peebles, R. Le Baron Arizona State University
31

The electromagnetic properties of absorbers are frequency dependent, thus they must be measured at the frequency of use
• RF absorbing structures incorporating resistive films depend for their per-formance not only on the accuracy with which the components hit the targeted design value but also on their uniformity.
• Therefore their statistical variation from manufacture through their final incorporation into composite parts and even after repair must be measured.
• This characterization is only meaningful when performed at the intended frequency of use.
Log (Freq GHz)
Log (Freq GHz)
(manufacturing variation)
32

How small a spot-size can a wave be focused
in order to inspect a material? • Since the antenna aperture and focal spot must be
proportional to l, focused waves are viable only in the GHz range.
• When conventional waveguide methods are employed to “certify” materials at the frequency of use, say VHF, the waveguide structures can be as large as 4 feet in cross section by 20 feet long. Of necessity the material properties certified in those fixtures are the average properties of the sample over that large area.
• Yet we know that sub-wavelength inhomogeneities in an absorbing material will produce undesired scattering that can raise the noise floor of the design.
33

A linearly polarized eddy-current probe operating at VHF
• Resolution of approximately 1” at ~200MHz.
• Sidesteps the issue of the wavelength by operating in the reactive near field of a higher-order multipole antenna.
• Because its electric field is induced electrodynamically, it is not blocked by intervening dielectric skins.
• Its linear polarization implies that it can readily detect the well known anisotropy of loaded honeycomb.
• Resonant operation makes it very sensitive.
-10-20
-10
0
+10
-6dB -20dB
-10-20
-10
0
+10
-6dB -20dB
Hot spot ~ 20mm by 30mm where a mostly linearly polarized electrodynamic field is created.
E-Field
34

• A commercially available process deposits a very uniform carbon coating on plastic substrates.
• A stripe was measured and then damaged with 4 X-Acto Knife cuts:
2”, 1”, 0.5” and 0.25” long.
• The X-Band measurement just sees system noise variation before and after (~0.2dB)
What about detecting localized defects?
X-Band
35

• We can even detect cuts at 45 and 80 degrees to the field, scratches, and a damaging fold of the R-Card.
The VHF Probe clearly sees all cuts.
E-Field perpendicular to cuts
This is being measured through 0.09” of plexiglas, so measuring through a “skin” is no problem
Fold
80o
45o
scratch
Possible handling damage 36

Conclusion
• The linearly polarized eddy current probe constitutes a new family of sensors that can be applied to monitor the quality of RF absorbing structural materials from “cradle to grave” at the frequency of use.
• Applications range from in-line statistical process control monitoring systems through post-repair inspection tools in the field.
• Both the VHF and GHz probes used in these demonstrations are robust enough to be used in a depot environment or incorporated into a robotic in-process inspection system.
37

Edit the text with
your own short
phrases.
The animation is
already done for
you; just copy and
paste the slide
into your existing
presentation.
EPODs
Applications Specifications • Laboratory QA environments • In-process QC environments • Hand held repair • Material testing ranges
• Low loss / Low Dielectric materials • Radomes • Webs; S-glass, Kevlar, etc.
• Absorbing structures • Lossy / Conductive material • Resistive films / R-cards
• Uniformity testing • FOD & Defect detection • RF power field probing
• Resonate frequency range • Epod; Any single resonate freq.
from 90 MHz to 1.5 GHz • MEpod; Up to 12 Multi-resonate
freq. from 40 MHz to 600 MHz
• Resonate Beam Size 1.5" dia. x2“ tall
• Dimensions; • Epod = 6 x 4 x 4“ • MEpod = 4 x 4 x 4”
• TMACS Supports all Keysight PNAs, and
Field Foxes… PXI-VNA & ENA coming soon.
38

Edit the text with
your own short
phrases.
The animation is
already done for
you; just copy and
paste the slide
into your existing
presentation.
EPODs
Dual Epod Table
Applications Specifications
• Resonate frequency range • Epod 90 MHz to 1.5 GHz • MEpod 40 MHz to 600 MHz
• Resonate Beam Size 1.5" dia. x2“ tall
• Dimensions; 30 x 36 x 60“
• TMACS Supports all Keysight PNAs,
and Field Foxes… PXI-VNA & ENA coming soon.
• Laboratory QA environments • Mobility for program areas • Material testing ranges
• Low loss / Low Dielectric materials
• Radomes • Webs; S-glass, Kevlar, etc.
• Absorbing structures • Lossy / Conductive material • Resistive films / R-cards • Absorbers
• Uniformity testing • FOD & Defect detection
39

Edit the text with
your own short
phrases.
The animation is
already done for
you; just copy and
paste the slide
into your existing
presentation.
On-line Scanners & Sensors
40

Non-Destructive / Non-Contact
• Target contacts • QA Managers • Production Managers • Program Leads
• Competing tech. Methods • Destructive; 4-point probes, Pin-tables • Non-Destructive; Coax Probe, Slotted
Waveguide, Stripline, Twin-lead, Eddy current probe, Std. gain horn, X-ray, photo-bit map for defect detection
• MWI Advantages • Testing actual deliverables
• Reduced sample waist by >85%
• Increased uniformity by >92%
• Production ready software (SPC)
• Sample prep. Reduction
• No stopping line for QA sample
• No waist due to restarts
• Control Uniformity at freq. interest
• Down / Cross Web variability
• Anisotropic materials
41
In Process QC Test Services
• Gaussian Beam Test method – Freq. Range
• Broad band (0.7-16 GHz) • Banded (7 - 50 GHz) • Higher Freq. upon request
– Non-contact test Methods • (Insertion Loss) - Tunnel • Reflection Loss - Arch • XYZ- Scanners / Uniformity
– Operating Temperature (Room ~ 130 of) {3,000 of under development}
• Production Test Quality – Full-automation – Collection Speed (2 – 30sec.) – SPC run charts – Real-time data output – Collection Data
• dB & Phase / Smith Chart
– Calculation / Data Reduction • Permittivity, Permeability,
Ohms/sq., Zo, C, L, R

Non-Destructive Low Frequency
42
In Process QC Test Services • Open Cavity Resonator method
– Agilent Equipment • Field Fox, PXI-VNA • PNA or ENA
– Freq. Range • Single point (0.01- 3.5 GHz) • Multi-point band • Swept Frequency • Higher Freq. upon request
– Near Proximity test Methods • Sheet admittance • Material Uniformity • Defect Detection • XYZ- Scanners / Uniformity
• Production Test Quality – Full-automation – Collection Speed (0.1 – 30sec.) – SPC run charts (Avg, min., max) – Real-time data output – Collection Data
• dB & Phase / Smith Chart
– Calculation / Data Reduction • Admittance, Conductance, Ohms/sq., Zo, C, L, R
• Target contacts – QA Managers – Production Managers – Program Leads
• Competing tech. Methods • Destructive; 4-point probes, Pin-tables,
Split-post resonator, Cavity Resonator • Non-Destructive; Eddy current probes,
X-ray, Dielectric probe
• MWI Advantages • Testing actual deliverable • Reduced sample waist by >85%
• Increased uniformity by >92%
• Production ready software (SPC)
• Sample prep. Reduction
• No stopping line for QA sample
• No waist due to restarts
• Control Uniformity at UHF/VHF freq.
• Down / Cross Web variability
• Anisotropic materials

Engineer Services – “In Process QC”
We have the ability to model any RF test device and system that interacts with RF
energy.
• High Frequency Selective Surfaces (HFSS) • Finite Difference Time Domain (FDTD) • PHD support staff from ASU • Experienced Machine shop capability •Proven “Gen-5” Prototyping process
Customer problem: Develop high speed test method for product Liability testing of microwaveable food containers burning up. Support Provided: • Evaluate customer product & determine pass / fail criteria for container’s defects.
• Recommend implementation of in-process test system that can test for defects & pass / fail decision in less than 2 seconds.
• Develop customized prototype system for a minimum of 7 production lines and 62 different produces.
43
In-process QC

Edit the text with
your own short
phrases.
The animation is
already done for
you; just copy and
paste the slide
into your existing
presentation.
Hand-Held Devices
Hand-Held Configurations
Applications
Specifications
• Repair, Defect, and FOD inspection • Material testing ranges Low loss / Low Dielectric materials
• Radomes • Webs; S-glass, Kevlar, etc.
• Absorbing structures • Lossy / Conductive material • Resistive films / R-cards
• Uniformity testing • FOD & Defect detection
• Resonate frequency range • Epod; Any single resonate freq. from 90 MHz to 1.5 GHz • MEpod; Up to 12 Multi-resonate freq. from 40 MHz to 600 MHz
• Dimensions; • Epod = 6” x 4” x 4“ , MEpod = 4” x 4” x 4” • Reflectometers = 6” x 6” x 12” and wt. < 3 lbs
• Supports all Keysight; Field Fox NA or PNAs
44

Measuring Dielectric Properties Using Impedance Analyzers
Speaker Name Jeff Peebles
Updated July 17, 2014

Keysight E4990A & 16451B fixture with MWI dielectric sample holder
46
Dielectric sample holder

Edit the text with
your own short
phrases.
The animation is
already done for
you; just copy and
paste the slide
into your existing
presentation.
Powder Testing
Dielectric Powder Testing
Applications
Equip. Specifications
• QA Powder measurements for incoming inspection • Material testing ranges
• Aerospace Composite High Temp. Ceramics • Food & Drug Low loss / Low Dielectric additives • Earth soaked with oils
• Uniformity testing • Lot to Lot and within a lot • mixtures
• E4990A Combined with the 16451B test fixture • Frequency range; 30 Hz to 30MHz • E4991B Combined with the 16453A test fixture Coming in early 2015
• Frequency range; 1MHz to ~1-2 GHz
• Dimensions; • 16451B, Sample size = 2.5 in3 • 16453A, Sample size = 1.5 in3
47
Page
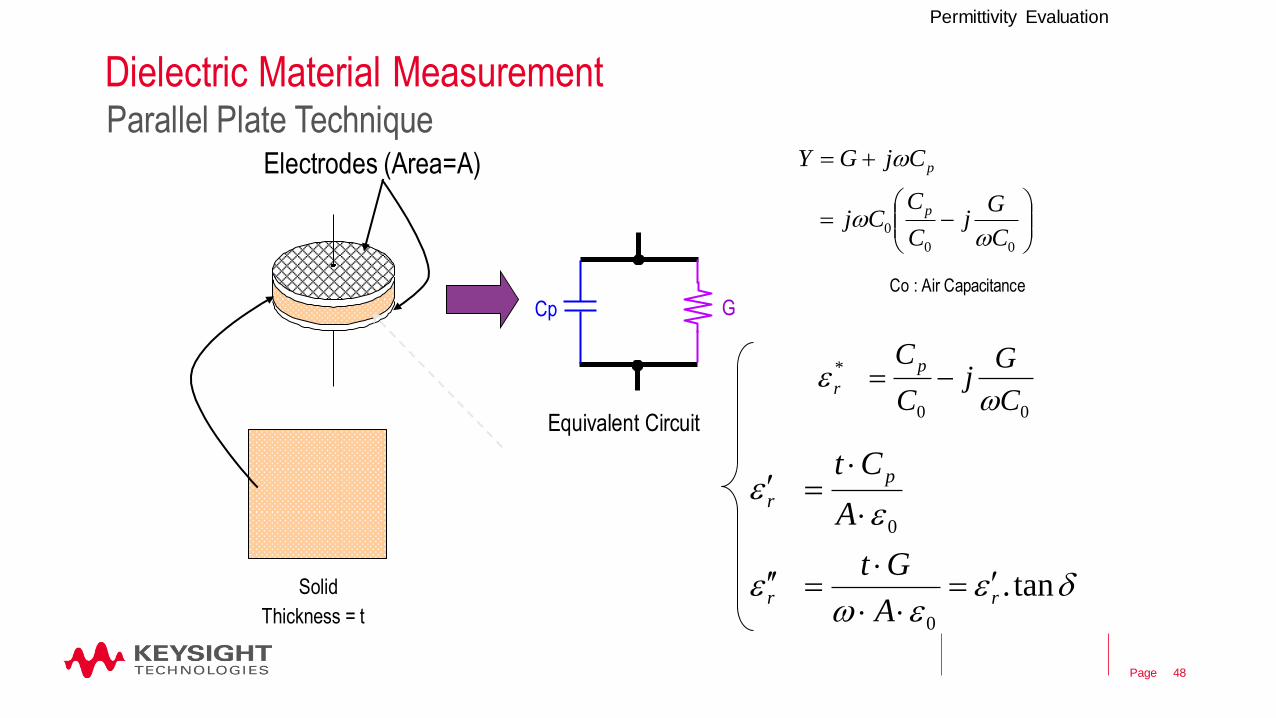
Solid
Cp G
Equivalent Circuit
Thickness = t
Electrodes (Area=A)
Permittivity Evaluation
Co : Air Capacitance
00
0C
Gj
C
CCj
CjGY
p
p
ww
w
00
*
C
Gj
C
C p
rw
e
eew
e
ee
tan.0
0
rr
p
r
A
Gt
A
Ct
Dielectric Material Measurement Parallel Plate Technique
48

Page
Dielectric Material Measurement Guard Electrode & Dielectric Technique
Lines of Electric Field Lines of Electric Field
Edge capacitance Guard
+ +
– –
Permittivity Evaluation
49
Lines of Electric Field
Stay inside Fixture
MWI Lab
Fixture
+
–

The holder’s volumes of the circuit model are represented by the regions below:
Region 1: Bottom of Dish
Region 2: Variable thickness dish lid
Reg
ion
3: D
ish
sid
e-w
alls
Region 4: Variable depth of powder dish
The electric field is assumed to be vertical and contained by the four regions.
50
The side walls are in parallel with three series capacitors: lid, powder and dish bottom respectively.

Air Filled Volume
Powder Filled Volume
There are undetermined differences between the Simulation Model and the Real fixture.
• We accurately remove the unknowns from both real and simulated fixtures.
• backing out the capacitance of the surrounding environment, feed cables, and test fixture.
• The post-processed capacitance remaining is due to an ideal air volume between the electrodes, partially filled with powder.
Fringing is removed
• The Morphology function is back to the ideal case, air and powder, only, and the flux is contained!
51

Edit the text with
your own short
phrases.
The animation is
already done for
you; just copy and
paste the slide
into your existing
presentation.
The simulation model of the Dielectric test fixture
Powder Volume
More details of this model are shown in the online Presentation. 52

Edit the text with
your own short
phrases.
The animation is
already done for
you; just copy and
paste the slide
into your existing
presentation.
MWI Lab’s Morphology measured Results
.0001 .001 .01 .1 1 .00001
1
1.5
2.0
2.5
3.0
3.5
4.0
Air
Quartz @ 75of
(at 27 MHz)
er
= tan er’ er”
Sulfur @75of
Fluorite @ 75of
Sugar @75of
Salt-non-iodized @ 75of
Salt-iodized @ 75of
Result Match from other published methods www.Honeywell.com www.cnt.com www.deltacnti.com
Alumina (granulated) @ 75of
53

Edit the text with
your own short
phrases.
The animation is
already done for
you; just copy and
paste the slide
into your existing
presentation.
Dielectric Mixture Test Results {Oil/Salt/Air}
2
2.5
3
3.5
4
4.5
5
5.5
0 2 4 6 8 10 12 14
Oil 83/0/17
Salt 0/86/14
49/51/0
42/53/5
20/80/0
87/6/7
85/13/2
81/19/1
74/25/1
68/30/2
62/38/0
55/45/0
I suspect error in the results were caused by problems with accurately measuring the volume of salt particles (salt was falling into the interior of the scale) as well as the air bubbles need to be removed.
54

Edit the text with
your own short
phrases.
The animation is
already done for
you; just copy and
paste the slide
into your existing
presentation. Test Material ε' effective ε" effective ε' ε" ε' ε"
Number Name (Measured) (Measured) (Morphology Method) (Morphology Method) (Capacitance Method) (Capacitance Method)
1 Control_Dish 1.0000 0.0000 1.0000 0.0000 0.9004 0.0119
2 Control_Dish 1.0000 0.0000 1.0000 0.0000 0.8994 0.0118
3 Control_Dish 1.0000 0.0000 1.0000 0.0000 0.9088 0.0113
4 Control_Air 1.0000 0.0000 1.0000 0.0000 1.0000 0.0114
5 Air 1.0001 0.0002 1.0001 0.0002 1.0001 0.0112
6 MaterialX 1.1420 0.0017 1.1469 0.0018 1.0467 0.0119
7 MaterialX 1.2498 0.0032 1.2633 0.0034 1.1494 0.0123
8 MaterialX 1.3305 0.0037 1.3553 0.0041 1.2403 0.0126
Sensitivity comparison between MWI Lab’s Morphology verses traditional Capacitive method.
Losses differences between the
dielectric and air are not
distinguishable (in the noise)
Losses differences between the
dielectric and air are distinguished
Low dielectric/loss material are differentiated from air with Morphology Reduction Method
X= Baby Powder
55

Edit the text with
your own short
phrases.
The animation is
already done for
you; just copy and
paste the slide
into your existing
presentation.
0 5 10 15 20 25 300.89
0.90.910.920.930.940.950.960.970.980.99
11.011.021.03
0 5 10 15 20 25 300.89
0.90.910.920.930.940.950.960.970.980.99
11.011.021.03
0 5 10 15 20 25 300.89
0.90.910.920.930.940.950.960.970.980.99
11.011.021.03
0 5 10 15 20 25 300.89
0.90.910.920.930.940.950.960.970.980.99
11.011.021.03
Frequency (MHz) Frequency (MHz)
Per
mit
tivi
ty
Per
mit
tivi
ty
0 5 10 15 20 25 300.89
0.90.910.920.930.940.950.960.970.980.99
11.011.021.03
trace 1
trace 2
trace 3
trace 4
trace 5
trace 6
trace 7
trace 8
A0 A1 A2 A3 A4 A5 A6 A7
0 5 10 15 20 25 300.89
0.90.910.920.930.940.950.960.970.980.99
11.011.021.03
trace 1
trace 2
trace 3
trace 4
trace 5
trace 6
trace 7
trace 8
A0 A1 A2 A3 A4 A5 A6 A7
Four different measurements of the permittivity of the empty powder cup region vs. depth: The error peaks at about 10%. The error tends to decrease
as the air gap decreases (with the exception of A7, depth of ~1mm).
This phenomena may be caused by the electric field flux preferring the side-walls of the dish. 56

Edit the text with
your own short
phrases.
The animation is
already done for
you; just copy and
paste the slide
into your existing
presentation.
0 5 10 15 20 25 300123456789
10
0 5 10 15 20 25 300123456789
10
0 5 10 15 20 25 300123456789
10
0 5 10 15 20 25 300123456789
10
0 5 10 15 20 25 300123456789
10
0 5 10 15 20 25 300123456789
10
0 5 10 15 20 25 300123456789
10
0 5 10 15 20 25 300123456789
10
Here we are concerned with the precision and repeatability of measurements using the Keysight test device with MWI’s
measurement dish. We plot the error in permittivity (or percent difference) with
respect to the first measurement (Test 1). Error between measurements is less than 2% for most of the lids.
A0 A1 A2 A3
A4 A5 A6 A7
Percent Error of Permittivity (y-axis) vs. Frequency (MHz)
Lids A0, A1, and A2 were used on most for powder compression: The error between measurements with these lids is very close to 1%.
Test
2Te
st 3
Test
4
57

Edit the text with
your own short
phrases.
The animation is
already done for
you; just copy and
paste the slide
into your existing
presentation.
We have been reporting primarily on the real part of data reduced, however, the imaginary component of the powder permittivity is
equally important. • There are losses in the system, as well as noise, so there is some error in the measured
imaginary permittivity of the empty dish/holder (should be free space).
Frequency (MHz)
Pe
rmit
tivi
ty (
Ima
gin
ary
)
Noise and Error: Imaginary Component of the Permittivity of Empty Dish
0 5 10 15 20 25 300.89
0.90.910.920.930.940.950.960.970.980.99
11.011.021.03
trace 1
trace 2
trace 3
trace 4
trace 5
trace 6
trace 7
trace 8
A0 A1 A2 A3 A4 A5 A6 A7
Losses have no relationship with depth of empty dish.
0 5 10 15 20 25 300.01
5 103
0
5 103
0.01
0.015
0.02
0.025
0.03
0.035
0.04
0.045
0.05
0.055
0.06
58

Edit the text with
your own short
phrases.
The animation is
already done for
you; just copy and
paste the slide
into your existing
presentation.
0 5 10 15 20 25 300
0.010.020.030.040.050.060.070.080.09
0.10.110.120.130.140.150.160.170.180.19
0.2
The good news is that, when measurable, the imaginary component follows the same trends as the real components.
Empty puck maximum error/noise in the imaginary component of permittivity
0 5 10 15 20 25 300.89
0.90.910.920.930.940.950.960.970.980.99
11.011.021.03
trace 1
trace 2
trace 3
trace 4
trace 5
trace 6
trace 7
trace 8
A0 A1 A2 A3
• Powder data is above the noise across the band. • Imaginary component increases with compression.
Frequency (MHz)
Per
mit
tivi
ty (
Ima
gin
ary
)
Powder Test 3: Baby Power
59
Summary
• For more information on the powder testing or determine if we can help measure your specific materials with a non-destructive method.
• Contact MWI Lab via the following: • MWI Laboratories…… Website: www.mwilab.com
• Email: Sales Product Information [email protected]
60

Page
Web page:
http://www.mwilab.com …Email: Sales Product Info <[email protected]>
http://www.asu.edu/ …….. ASU, dept. Electrical Engineering, Dr. Rodolfo Diaz, Morphology, Dielectric Testing
http://www.keysight.com/find/impedance
http://www.keysight.com/find/materials
5952-1430E:
LCR Meters, Impedance Analyzers,
and Test Fixtures Selection Guide
5950-3000:
Impedance Measurement
Handbook
5965-4792E:
Accessories Selection Guide For
Impedance Measurements
5980-2862EN: Solutions for Measuring Permittivity
and Permeability with LCR Meters and
Impedance Analyzers
References Application Notes and Selection Guides:
61