editing and analyzing an existing power flow case
TRANSCRIPT

I2-1©2008 PowerWorld Corporation
Editing and Analyzing an Existing Power Flow Case
• PowerWorld cases can be easily created from existing text-based power flow cases stored in the following formats:– PTI RAW version 23 - 30
• Used with public cases– FERC 715 cases – NERC MMWG– Files obtained from ISOs and Market Operators
– GE PSLF text format (EPC version 15.X)• Also used with some public cases

I2-2©2008 PowerWorld Corporation
Power Flow Data
• Provides static model of power system• For some studies this model is sufficient• For other studies model needs to be augmented
– Generator cost information – Reactive capability curve– PowerWorld Simulator case options– Interface definitions– Injection group definitions– Contingency Definitions– Etc… and Much more

I2-3©2008 PowerWorld Corporation
Existing Case Flow Chart

I2-4©2008 PowerWorld Corporation
Display/Model Relationships
• Single system model• Power flow data is subset of system model• Text case information displays always
provided.• Multiple onelines can be created, and can be
used with different cases

I2-5©2008 PowerWorld Corporation
Display/Model Relationships
Power FlowData
PowerWorld Simulator Case
One-lineDiagram
One-lineDiagram
Case InformationDisplays
PowerWorld User
BusviewOne-line

I2-6©2008 PowerWorld Corporation
Display/Model Relationships
• Relationship between oneline objects and system model is NOT a one-to-one mapping– multiple oneline objects can be linked to the
same model object• This is a more powerful approach, but
introduces ambiguity when deleting objects– delete just the oneline display object– delete oneline display object and model object

I2-7©2008 PowerWorld Corporation
Midwest Example
• Example: build a oneline for 10,452 bus Midwest case saved in PTI version 24 format.
• Click the Application Button to open the Application Menu and choose Open Case to view open dialog– In Files of type select PTI Raw Data (.raw)– open case Midwest.raw
• When prompted to create a oneline; select Yes.

I2-8©2008 PowerWorld Corporation
Case Information Displays
• Provide text-based view of the case• Select Case Information ribbon tab Case
Description to view an enterable description of the case
PTI format allows 2 lines;PWB format allows unlimitednumber

I2-9©2008 PowerWorld Corporation
Case Summary Dialog
Select for Help, or press F1 key
NOTE: There are no changeable fields on this dialog
Summaryof total caseLoad, shunts,and generation
List of slackbuses

I2-10©2008 PowerWorld Corporation
Area/Zone/Owner Filters
• Allow filtering of most case information display by area, zones, or owners.– This is particularly useful for large cases.
• Select Case Information ribbon tab Area/Zone Filters, or use case information toolbar button.– Left-click on column labels to sort.
• Set all areas to No except for area IP. – Right-click on the Shown Column and choose Toggle
All No– Scroll down to area IP. Change No to Yes in the
Shown column by double clicking on the cell.

I2-11©2008 PowerWorld Corporation
Area/Zone/Owner Filters
Left clickon labels tosort
Double-click tochange thearea’s displayfilter status Total number of
buses in the area
Minimum and maximum busnumbers in area
View areas,zones, or owners

I2-12©2008 PowerWorld Corporation
Power Flow List
• Shows complete power flow information for all buses with Area/Zone/Owner Filter set to Yes.
• To display use Case Information ribbon tab Power Flow List.
• Display has its own local menu. To view right click anywhere on the list.

I2-13©2008 PowerWorld Corporation
Power Flow List
Local Menu of Power Flow List

I2-14©2008 PowerWorld Corporation
Quick Power Flow List
• Similar to Power Flow List, except list can be used to show flow at individual or a set of buses
• To display use Case Information ribbon tabQuick Power Flow List.
• Enter number or range of numbers of buses to view
• Double-click to move to desired bus, or right-click for information.
• Area/Zone/Owner filters are not used.

I2-15©2008 PowerWorld Corporation
Quick Power Flow List
Enter eithera single bus,a set of busesseparated bycommas, or arange of buses
Clears thelist
New busesappear at theend of the list
Format issimilar toPowerFlow ListCircuit
identifier 99indicates anequivalent line

I2-16©2008 PowerWorld Corporation
Bus View
• Designed to replace Quick Power Flow List– Easier to use– Much more powerful approach– Allows user to navigate through buses like web pages
• To Display use Onelines ribbon tab Bus View• Auto-generates oneline diagrams at each bus, one
at a time, showing all devices connected to bus and all flows.
• Operations just like other oneline diagrams in Simulator

I2-17©2008 PowerWorld Corporation
Bus View Oneline
Back and forward buttons
Bus and Flow information
Click on links to jump to new bus
Serial buses are shown automatically
Enter a name or number in Bus to go to a bus
Click Search For…to find a bus

I2-18©2008 PowerWorld Corporation
Bus View Oneline
Bus: COULEES1 (41356)Area: NORTHWES (40)Zone: Central (403)
COLUMBIA
COLCOV11
VANTAGE
COULEES3
ANC LK T
MCKENZIE
ROCKYRH2
COLUMBIA
CKT 1
POTHOLES
MIDWAYB1
MAE VL T
POTHOLES
CKT 1
COULEES2
COULEE
COULEE
WESTBPA2
COULEES3
ROCKYFD
COUL0609
COUL1013
CKT 1 BELCOU31
BELL SO
BELL BPA
BELL MI
ADDBEL11
BELLAN11
BEACON N
BEACON S
CKT 3
COULEE
BELCOU11
KELLER T
COUL2GPD
NILLES C
CKT 1
COUL0105 CKT 1
COULEES1
1.04 pu240.01 KV 88.67 Deg 0.00 $/MWh
40304
41111
41358
46001
46809
46832
40259
112.8 MW -20.9 MVR 114.7 MVA
40261 1.04 pu239.95 KV
41346
46043
40849
232.1 MW -1.7 MVR 232.1 MVA
40851 1.03 pu235.95 KV
40287
40285
41276
41358
46156
41771
41772
88.5 MW 32.9 MVR 94.4 MVA
41357 1.04 pu240.00 KV
41359
40091
40088
40092
40626
48025
48031
83.1 MW 3.2 MVR 83.2 MVA
40090 1.04 pu239.10 KV
40282
41222
46150
47067
0.99 tap
51.8 MW 26.6 MVR 58.2 MVA
40281 1.05 pu120.39 KV
0.99 tap
402.0 MW -40.1 MVR 404.0 MVA
41770 1.04 pu 14.34 KV
Right-click on elements for informationLeft-click on circuit breaker to open/close
Colors are determined by the default drawing values
Symbols show locations of generators, loads, shunts

I2-19©2008 PowerWorld Corporation
Bus View Oneline:Click Options > to reveal
• Number of Tiers – specify 1 or 2• Show Hints
– As you move your cursor over an objectit will show information
• Show Serial Buses– Buses that are in series will be cascaded
• Show Equivalent Lines– Change to hide/show equivalent lines
• Represent Multi Section Line Objects– Show endpoints of MS Lines without intermediate buses
• Open Multiple Bus views– Specify whether to create a new Bus View when a new one is requested.– Choosing Prompt means you will be prompted each time
• Include Field Labels– A description of what each field is will be shown.
• Change Bus Link Color– The fill color of the bus links can be changed

I2-20©2008 PowerWorld Corporation
Bus View OnelineClick Views > to reveal
• Define Custom View– Will discuss next
• Input Data – pre-defined view– Shows information related to input parameters
• System State – pre-defined view– Shows information about the system state
• If Custom Views are defined, they will appear at the bottom of this list

I2-21©2008 PowerWorld Corporation
Bus Views:Input Data and System State
Bus: CLINTON (32346)Nom kV: 345.00Area: IP (57)
Zone: IP (325)
System State
ID 1 ID 1
MAROA W
CKT 1
MAROA E CKT 1
BROKAW2 CKT 1
CLINTON
1.0400 pu358.80 KV -8.98 Deg 0.00 $/MWh
930.000 MW 233.874 Mvar
1.786 MW 0.000 Mvar
153.8 MW
81.1 Mvar 173.9 MVA
A
MVA
323491.0342 pu356.80 KV
276.6 MW
79.8 Mvar 287.9 MVA
A
MVA
323501.0337 pu356.63 KV
497.8 MW
72.9 Mvar 503.2 MVA
A
MVA
324471.0286 pu354.88 KV
Bus: CLINTON (32346)Nom kV: 345.00Area: IP (57)Zone: IP (325)
Input Data
ID 1 ID 1
R=X=G=B=LimA=LimB=LimC=
Number=Nom kV=
MAROA W CKT 1
MAROA E CKT 1
BROKAW2 CKT 1
CLINTON 930.000 MW 0.000 MW
1.786 MW 0.000 Mvar
0.00050 pu0.00610 pu0.00000 pu0.10315 pu1129.00 MVA1297.00 MVA0.00 MVA
32349345.00 KV
0.00050 pu0.00620 pu0.00000 pu0.10417 pu1129.00 MVA1297.00 MVA0.00 MVA
32350345.00 KV
0.00080 pu0.01110 pu0.00000 pu0.19067 pu1129.00 MVA1297.00 MVA0.00 MVA
32447345.00 KVInput Data System State
I2-22©2008 PowerWorld Corporation
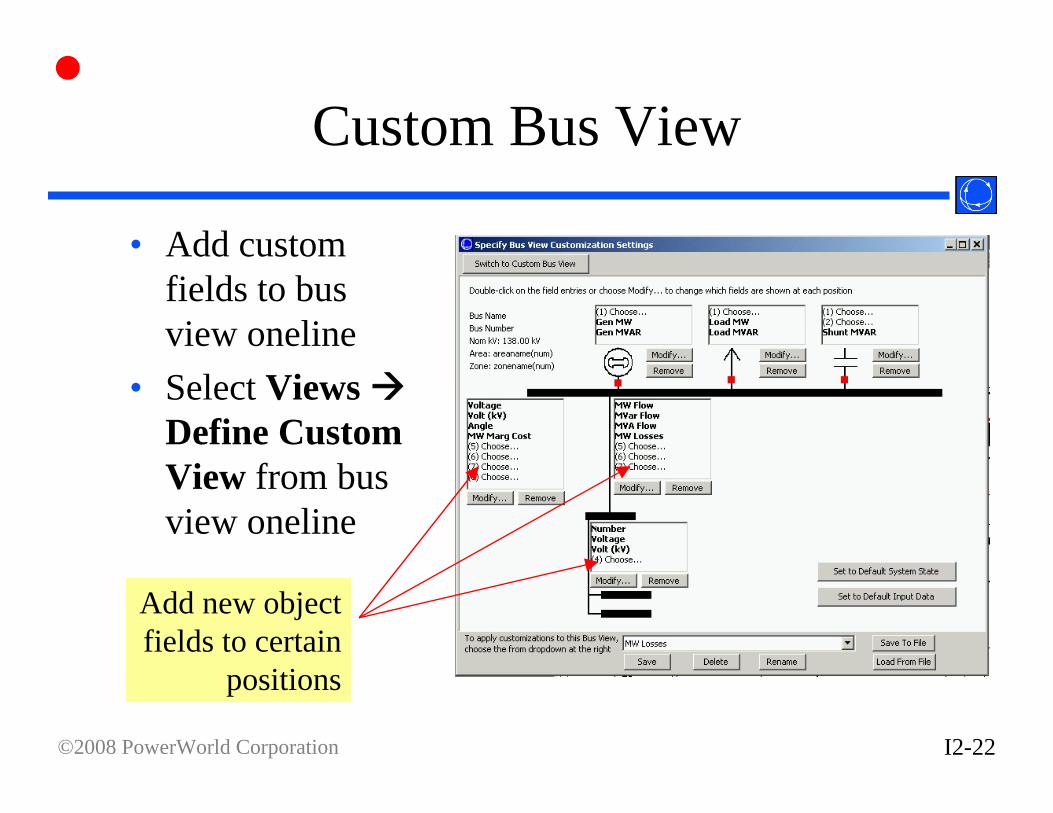
Custom Bus View
• Add custom fields to bus view oneline
• Select Views Define Custom View from bus view oneline
Add new object fields to certain
positions

I2-23©2008 PowerWorld Corporation
Solving the Case
• Show the Message Log to view iterations.• To perform a single power flow solution,
click the Single Solution button on the Tools ribbon tab.– mode is automatically switched to Run– system has initial mismatches because of
voltage truncation in *.raw file– case should converge within several iterations

I2-24©2008 PowerWorld Corporation
Building Onelines
• Case can be modified from text case information displays: we’ll return to those in the next section
• Much easier to visualize results using a onelinediagram.
• Oneline only needs to be created for the desired portion of the system.– Simulator always models the ENTIRE system in
calculations. – For larger system, the oneline diagrams normally only
show a portion of the system• Simulator will automatically link to existing
power system model.

I2-25©2008 PowerWorld Corporation
Building Onelines
• While in Edit Mode, Simulator includes the ability to automatically insert – U.S. state and county borders– Canadian Province borders– Central American Country borders.
• Select Draw ribbon tab Auto Insert Borders– Select Options tab. Adjust line color and
thickness if desired.– Select the borders and map projection (under the
respective tab). Click OK.

I2-26©2008 PowerWorld Corporation
Map Projection
• Simulator supports two projections for representing earth in two-dimensional space– Simple conic
• Suitable for North America only• Latitude lines are curved; longitude lines are radial
– Mercator• Latitude lines are straight, form rectangles with longitude lines
• Once a projection is selected for a oneline, it should be used for all mapping and GIS functions so that objects are drawn in proper relation to one another

I2-27©2008 PowerWorld Corporation
Built-In Geographic Borders

I2-28©2008 PowerWorld Corporation
Built-In Geographic Borders:With US Counties

I2-29©2008 PowerWorld Corporation
Built-In Geographic Borders:Entire World

I2-30©2008 PowerWorld Corporation
Building Onelines
• Zoom in to 100%, approximately centered on Central Illinois
• Show the Bus View, moving it towards the bottom of the screen; show bus 32353 (ADM NRTH).
• Select Draw Network Bus• Click on the oneline towards the top center
– for Bus Number enter 32353– select Find by Number to view bus info; then select
OK to place the bus

I2-31©2008 PowerWorld Corporation
Building Onelines
• Repeat this procedure, entering buses 32370 and 32371.
• Save your case using the default PWB format. The oneline is saved separately as a PWD file.
• Oneline should look similar to the following

I2-32©2008 PowerWorld Corporation
Oneline Showing Three Buses

I2-33©2008 PowerWorld Corporation
Automatic Line Insertion
• Lines between buses can be inserted manually.
• It is easier to use automatic line insertion.• Select Draw Auto Insert Lines
– select default options– click OK– lines joining buses are automatically added,
optionally with circuit breakers and pie charts

I2-34©2008 PowerWorld Corporation
Automatic Line Insertions
Click here to open the Default Drawing Values dialog to set default line values
Set a minimum kV level of lines to be inserted
Set options for branches with very low impedance

I2-35©2008 PowerWorld Corporation
Automatic Load, Generator,and Shunt Insertion
• Loads can be inserted manually using Draw Network Load
• Easier to use automatic load insertion• Select Draw Auto Insert Loads
– Select default options– Click OK to automatically add loads to displayed buses
• Automatic Generator and Switched Shunt Insertion is also available

I2-36©2008 PowerWorld Corporation
Auto Insert Loads

I2-37©2008 PowerWorld Corporation
Panning and Zooming
• Select Onelines Ribbon• Keyboard Shortcuts
– Pan• Arrow Keys (up, down, left, right)• Home, End, Page Up, Page Down (larger steps)
– Zoom-in: Ctrl + Up Arrow, Ctrl-Page Up (larger steps)– Zoom-out: Ctrl + Down Arrow, Ctrl-Page Down (larger steps)
• Keyboard/Mouse Combinations– Zoom-in: Ctrl-Alt + Left Mouse Drag a Region– Zoom-out: Ctrl-Alt + Right Mouse Drag a Region

I2-38©2008 PowerWorld Corporation
Bus Palette
• Pan down and enter buses 32364 and 32372 using the Bus Palette tool.– select Draw Show Insert Palette For Buses– select a displayed bus to see its displayed and undisplayed neighbors
Select displayed bus;see displayed andundisplayed neighbors
Automatically insertundisplayed buses bydragging from thepalette to the oneline

I2-39©2008 PowerWorld Corporation
Bus Palette
• Add buses 32364 and 32372– select Caterpil 138 bus, drag N 27th 138 to
oneline under bus 32370– select Fariespk 138 bus, drag Mt Zion 138 to
oneline under bus 32371
• Insert transmission lines by selecting Draw Auto Insert Lines

I2-40©2008 PowerWorld Corporation
Zooming Portion of Oneline
• To zoom into a specified portion of the one-line, select Zoom In on Area in the Zoom Toolbar.
• Click and drag the mouse to define the zoom area.
• Release left button to zoom.

I2-41©2008 PowerWorld Corporation
Showing Entire One-line
• To view the entire oneline, click the Show Full button on toolbar.
• Zooming level and screen center is immediately changed so all objects on the oneline are visible.

I2-42©2008 PowerWorld Corporation
Adding Background
• To show static background line on the one-line, select Draw Background Background Line– click to start the background line and to add segments.– double click to end
• Use Draw Line/Fill to fill in the background. For this example the background shows Clinton Lake.
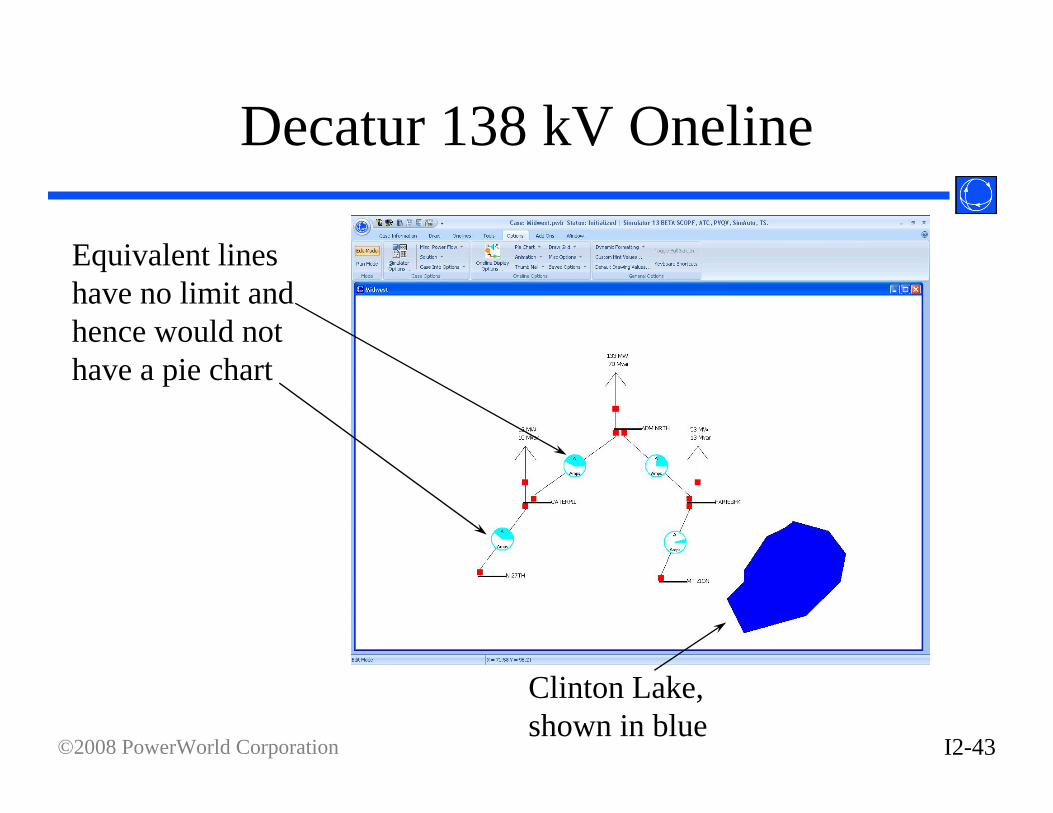
I2-43©2008 PowerWorld Corporation
Decatur 138 kV Oneline
Equivalent lineshave no limit andhence would not have a pie chart
Clinton Lake, shown in blue

I2-44©2008 PowerWorld Corporation
Simulating the Case
• To show animated flows, again use the Oneline Display Options dialog (select Onelines OnelineDisplay Options).
• Save your case.• Go to Run Mode and select Tools
Play. If all worked fine, congratulations! You are simulating a 10,452 bus case.

I2-45©2008 PowerWorld Corporation
Run-time Object Dialogs
• Pause the Simulation• To view/modify parameters for any oneline
object, right-click on the object. • Many of these parameters can be modified,
with the results taken into account when the simulation is resumed.

I2-46©2008 PowerWorld Corporation
Oneline Local Menu
• Right clicking on an empty portion of the oneline displays its local menu. The local menu is used to – print the oneline– save entire screen to file as a bitmap– copy/save oneline in Windows metafile format,
which is more versatile than a bitmap– apply case or oneline template

I2-47©2008 PowerWorld Corporation
Oneline Local Menu
– find buses on the oneline– Pan/Zoom Control– show Oneline Display Options; this display is
used to customize the appearance of the oneline– display the Area Information dialog for the
closest bus to the cursor (covered in a later section)
– Edit screen layers and show layers– perform contouring (covered in a later section)

I2-48©2008 PowerWorld Corporation
Oneline Local Menu
– view difference flows (covered in a later section)
– toggle flow visualization; switch between displaying actual flows and PTDF flows (covered in a later section)
– save/edit/delete view– go to view
I2-49©2008 PowerWorld Corporation
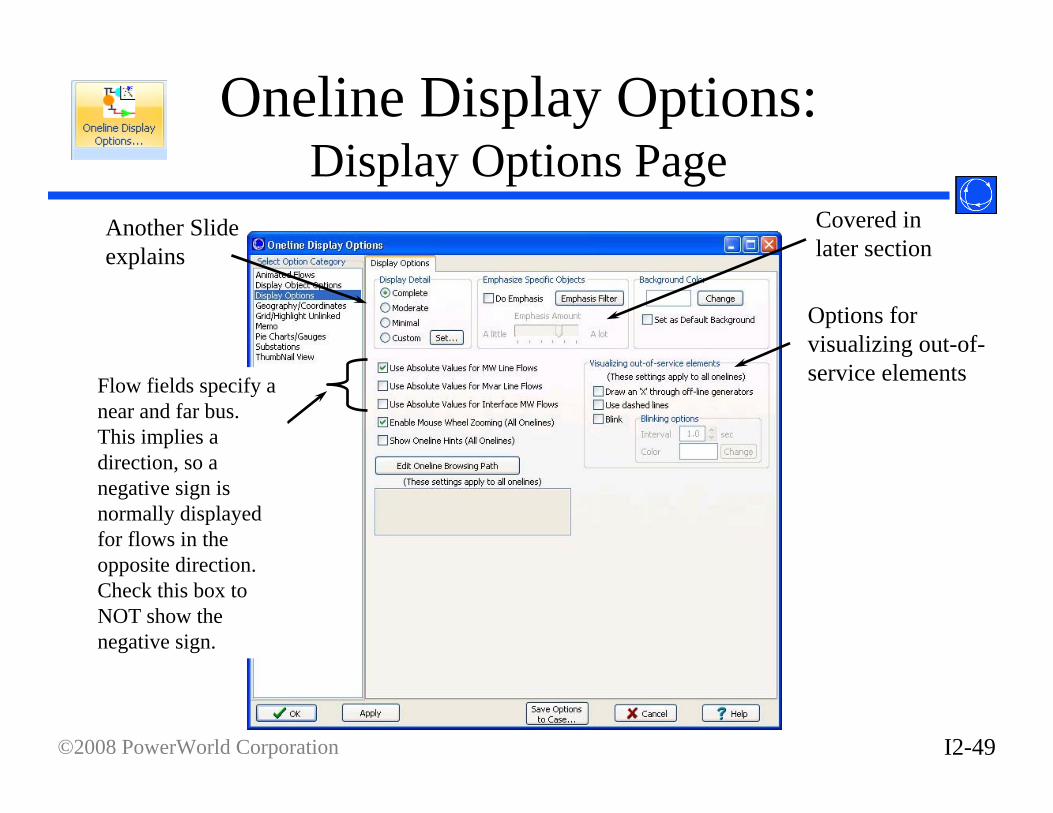
Oneline Display Options:Display Options Page
Another Slide explains
Flow fields specify a near and far bus. This implies a direction, so a negative sign is normally displayed for flows in the opposite direction. Check this box to NOT show the negative sign.
Covered in later section
Options for visualizing out-of-service elements

I2-50©2008 PowerWorld Corporation
Display Object Options:General Options
Only affects Bus Voltage Fields
Each time the display refreshes, the generators “rotor” will rotate this amount
Change appearance of MS Line intermediate buses, relative to end buses
Show selected field inside generator
Choose where to show circuit breakers
1 2
One
102 MW 50 MW

I2-51©2008 PowerWorld Corporation
Display Object Options:Circuit Breakers
Choose outline and fill color for normally open and normally closed circuit breakers
Choose the circuit breaker shape

I2-52©2008 PowerWorld Corporation
Display Options Tab:Set Custom Detail
• Display Detail– Complete: show
everything– Moderate: remove pie
charts and line fields– Minimal: remove pie
charts and all fields except those associated with generators, loads, or shunts
– Custom Detail: opens the Select by Criteria dialog (pictured) to specify a custom display detail by area, zone, layer, and other criteria

I2-53©2008 PowerWorld Corporation
Oneline Display Options:Pie Charts/Gauges Page
Pie chart percentage based on
When values are higher than this percent, the number will appear inside the pie chart
Line flows are different at each end of the line, this specifies to always using Limiting FlowLimiting Flow is normally the higher value, but this can be changed in the Limit Monitoring Settings Specifies the colors
and scales of pie charts when values are higher than the percentage breakpoint.
Gauge value based on
Display percentages in gauge instead of unit values
Separate options for lines and interfaces
Default styles for Generator, LTC, and Shunt and user defined styles (Used with pie chart/gauges other than lines and interfaces)

I2-54©2008 PowerWorld Corporation
Oneline Display Options:Pie Charts/Gauges Page, Lines Tab
Sub tabs allow separate breakpoints for different measurement types
Use same settings as MVA measurements
Special formatting options for open lines
I2-55©2008 PowerWorld Corporation
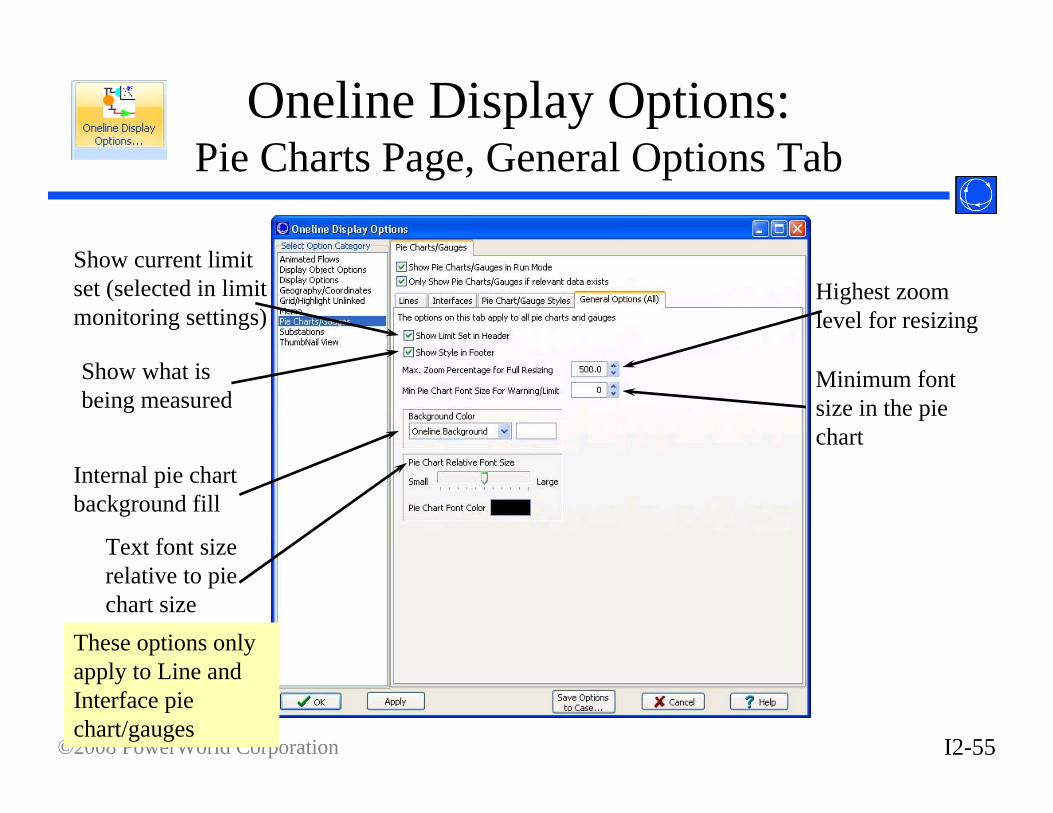
Oneline Display Options:Pie Charts Page, General Options Tab
Show current limit set (selected in limit monitoring settings)
Show what is being measured
Highest zoom level for resizing
Minimum font size in the pie chart
Internal pie chart background fill
Text font size relative to pie chart size
These options only apply to Line and Interface pie chart/gauges

I2-56©2008 PowerWorld Corporation
Pie Charts Options Ribbon
Click Options Pie Chart to reveal
Same Setting

I2-57©2008 PowerWorld Corporation
Background and Pie Chart Color Example
50%
68%
79%
Background Color for Oneline = Yellow
Pie Chart Background Color = White
Warning Percent = 60Warning Color = OrangeWarning Scalar = 1.5
Limit Percent = 70Limit Color = RedLimit Scalar = 2.0
Show Value Percent = 45Normal Color = BlueNormal Scalar = 1.0

I2-58©2008 PowerWorld Corporation
Oneline Display Options:Animated Flows Page
Show Animated Flows
Density and Size of Arrows
Symbol used to show flows. Almost always use Arrows.
Click this button to initialize the arrows to reasonable numbers
Select ObjectsMake Arrows move
Flows are based on these values
Parameters used when Animating Size. See the next slide for more info.
Change to make flows move faster

I2-59©2008 PowerWorld Corporation
How do these parameters affect the Arrow Size and Spacing
• Arrow Size– Arrow Size when NOT Animating Size
– Arrow Size when Animating Size• Actual Flow
– Actual flows higher than 2 times the FlowReference will not appear larger than a flow 2 times the FlowReference
• Percent Flow
• Arrow Spacing
Size~ArrowArea
⎟⎠⎞
⎜⎝⎛
nceFlowRefereentFlowOnElem*Size~ArrowArea
wcentageFloElementPer*Size~ArrowArea
Density1~ngArrowSpaci
Click the button Automatically Set Size, Density, and Parameters for this oneline to get values that look reasonable for your oneline

I2-60©2008 PowerWorld Corporation
Example Variable Flow Size
59 MW
58 MW
43 MW 41 MW
32 MW 32 MW
38 MW
37 MW
79 MW 76 MW
31 MW
32 MW
14 MW
39 MW
40 MW 20 MW 20 MW
40 MW
40 MW
20 MW 20 MW
14 MW 40 MW
110 MW 80 MW
130 MW
200 MW
200 MW
170 MW
200 MW 201 MW
95 MW
102 MW
Animate Size = TRUEReference Size = 200 MVA

I2-61©2008 PowerWorld Corporation
Animated Flow Options Ribbon• Notice that all the settings on the dialog are available
Same Setting
Click Options Animation to reveal

I2-62©2008 PowerWorld Corporation
Oneline Display Options:Thumbnail View Page
• Use to show an overview window for the onelinediagram.

I2-63©2008 PowerWorld Corporation
Thumbnail Example
34 MW 12 MVR
14 MW 6 MVR
24 MW 5 MVR
59 MW 23 MVR
19 MW 9 MVR
37 MW 24 MVR
28 MW 17 MVR
37 MW 13 MVR
52 MW 26 MVR
17 MW 6 MVR
80 MW 32 MVR
8 MW 1 MVR
73 MW 47 MVR
22 MW 12 MVR
23 MW 5 MVR
90 MW 38 MVR
47 MW 23 MVR
76 MW 30 MVR
30 MW 13 MVR
85 MW 47 MVR
70 MW 38 MVR
97 MW 56 MVR
93 MW 46 MVR
68 MW 33 MVR
60 MW 31 MVR
44 MW 10 MVR
167 MW 69 MVR
137 MW 32 MVR
127 MW 45 MVR
5 MW 2 MVR
34 MW 9 MVR
41 MW 18 MVR
44 MW 12 MVR
16 MW 7 MVR
27 MW 9 MVR
26 MW 17 MVR
21 MW 7 MVR
41 MW 12 MVR
39 MW 24 MVR
55 MW 31 MVR
72 MW 25 MVR
26 MW 12 MVR
52 MW 19 MVR
27 MW 9 MVR
22 MW 9 MVR
26 MW 5 MVR
20 MW 5 MVR
16 MW 7 MVR
19 MW 9 MVR
44 MW 12 MVR
38 MW 16 MVR
16 MW 8 MVR
15 MW 13 MVR
9 MW 0 MVR
15 MW 7 MVR
32 MW 12 MVR
28 MW 11 MVR
36 MW 21 MVR
17 MW 6 MVR
38 MW 14 MVR
59 MW 15 MVR
57 MW 16 MVR
52 MW 16 MVR
55 MW 11 MVR
37 MW 13 MVR
50 MW 23 MVR
39 MW 8 MVR
51 MW 23 MVR
1 MW 1 MVR
30 MW 12 MVR
27 MW 14 MVR
22 MW 8 MVR
50 MW 11 MVR
10 MW 5 MVR
49 MW 9 MVR
65 MW 26 MVR
39 MW 13 MVR
25 MW 10 MVR
48 MW 19 MVR
30 MW 14 MVR
30 MW 12 MVR
30 MW 11 MVR
37 MW 9 MVR
51 MW 19 MVR
3 MW 2 MVR
55 MW 23 MVR
45 MW 15 MVR
51 MW 22 MVR 34 MW
14 MVR
16 MW 3 MVR
48 MW 13 MVR
6 MW 3 MVR
22 MW 7 MVR
12 MW 5 MVR
19 MW 5 MVR
12 MW 4 MVR
72 MW 28 MVR
32 MW 10 MVR
22 MW 7 MVR

I2-64©2008 PowerWorld Corporation
Thumbnail View Options Toolbar
• Right Click in the toolbar region and Choose the ThumbNailView Options Toolbar to make it visible if needed
• Notice that all the settings on the dialog are availableSame Setting
Click Options Thumb Nailto reveal

I2-65©2008 PowerWorld Corporation
Saving Views
• Save favorite settings of oneline locations and zoom levels– right-click, save/edit/delete view, or toolbar button– identified by a specified name– accept current settings, or specify your own
• Quickly move around the oneline by using the list of saved views– right-click, go to view, or toolbar dropdown list

I2-66©2008 PowerWorld Corporation
Finding Buses on Onelines
• On large onelines, sometimes it is time consuming to find a particular bus. Rather, you can use the Find Object on Onelineoption from the local-menu.
• This displays the Zoom, Pan and Find Objects dialog.

I2-67©2008 PowerWorld Corporation
Finding Buses on Onelines
• To find a particular bus– set Object Type to Buses– use advanced search engine to locate the
desired bus by number or name– select Pan to Object on Oneline to center the
oneline on the specified bus• Find does not change the current zoom
level, unless Auto-Zoom when Panning is checked.

I2-68©2008 PowerWorld Corporation
Start from An Existing Onelinewith a New Power System Case
• You’ve already put together a detailed oneline of your system and it matches up with a case you use
• A year later, a new power system case is created and you want to make sure it matches up with your oneline– System elements are reconfigured– Bus numberings change– More detail or less detail in the case

I2-69©2008 PowerWorld Corporation
Integrating an old Oneline with a new Case
• Open the new power system case• Choose Open Oneline from the Application
Button to open up your old oneline• Now, find out if all the elements on the oneline are
still linked up with the case• Choose Onelines List Display Unlinked
Display Objects– This gives you a list of display objects that have no
corresponding data in the case
I2-70©2008 PowerWorld Corporation
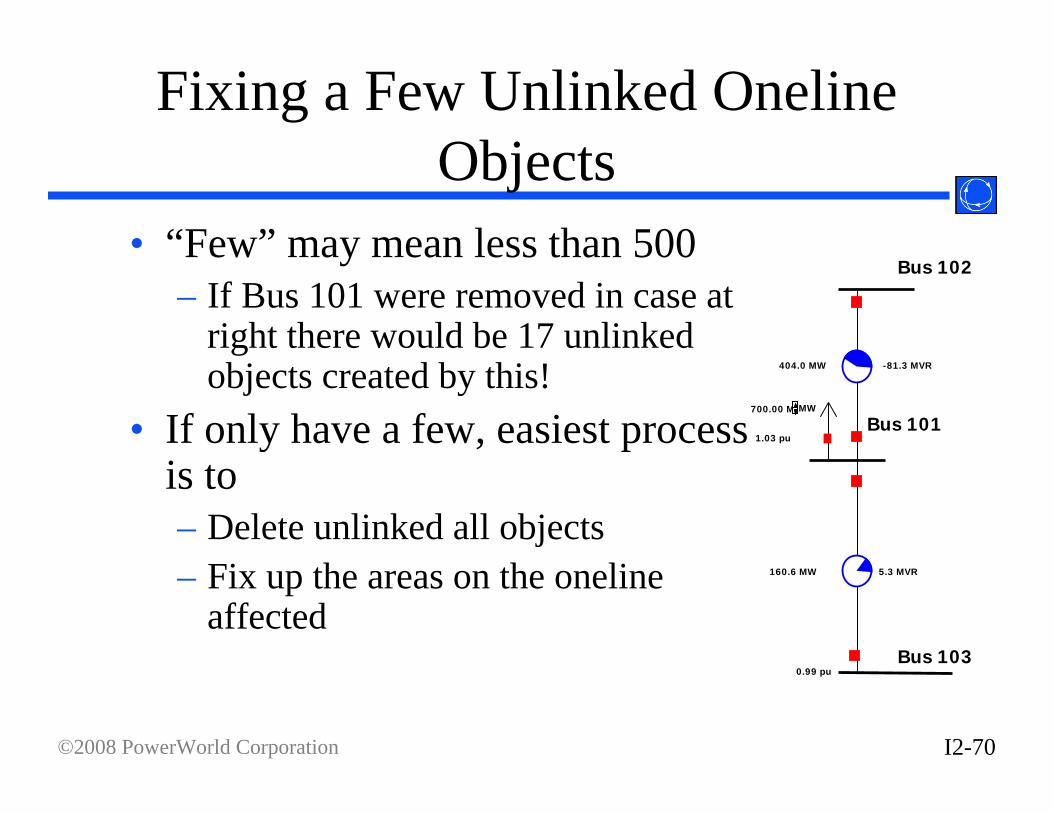
Fixing a Few Unlinked OnelineObjects
• “Few” may mean less than 500– If Bus 101 were removed in case at
right there would be 17 unlinked objects created by this!
• If only have a few, easiest process is to– Delete unlinked all objects– Fix up the areas on the oneline
affected
Bus 101
Bus 102
Bus 103
1.03 pu
700.00 MWMW
0.99 pu
404.0 MW -81.3 MVR
160.6 MW 5.3 MVR

I2-71©2008 PowerWorld Corporation
Fixed A Lot of Unlinked Objects:Bus Renumbering
• If you have a lot of unlinked objects, then the case bus numberings have probably changed
• Best option is to attempt to “renumber” the buses on the oneline

I2-72©2008 PowerWorld Corporation
Bus Renumbering
• Open the old oneline with the OLD CASE• In Edit Mode, choose Tools Renumber
Renumber Buses• Select Load Only Buses on Oneline and press the
Setup Bus Swap List button• Right Click on the table and choose Save As
Auxiliary File…– Select a name such as (oldscheme.aux)
• Close Renumber Buses dialog

I2-73©2008 PowerWorld Corporation
Bus Renumbering (cont)• Open the NEW CASE and the old oneline• Choose Tools Renumber Renumber Buses• Select Freshen Current Oneline and specify the
file you saved (oldscheme.aux)• Click the Setup Swap List Button
– Simulator will match the old numbering scheme used in the oneline with elements in the new case by BUS NAME and KV.
– Tie breakers will use the BUS AREA NAME– If it still can’t figure it out, it puts in both options
I2-74©2008 PowerWorld Corporation
Bus Renumbering (cont)
• Go through the new list and make sure you want to swap as they are listed
• Change the Swap? field for those you want to switch
• When you’ve selected what you want to swap, click Change Bus Numbers at the bottom of the form
• NOTE: It will take a long time to renumber a big oneline

I2-75©2008 PowerWorld Corporation
Integrated Bus Renumbering
• When saving a diagram (*.pwd) file, Simulator automatically includes a table inside this file which stores data necessary to do the renumbering routine
• This allows you to perform the renumbering automatically when you open the diagram– Choose Open Oneline from the Application Button– Change Files of type to Oneline Display File (Name_KV
linking)– Choose the file to open
• This automatically renumbers the diagram.– BE CAREFUL. If the case does not have unique “name-
nominal kV” values this can cause incorrect linking.

I2-76©2008 PowerWorld Corporation
One-line Diagrams for FERC 715
• Our affiliate, Energy Visuals, provides geographic-based one-line diagrams as a subscription service– Updated annually– Let them worry about bus renumbering!
• +1 (217) 398-8035, Tim Born• http://www.energyvisuals.com• Energy Visuals also provides generator cost
models for use with Optimal Power Flow (OPF)