edition 1 9 robo report™ first quarter 2021 wcontinuation
TRANSCRIPT

E D I T I O N 1 9
Robo Report™ First Quarter 2021
e are proud to publish the 19th edition of the Robo Report™ covering the first quarter of 2021. �is Report is a continuation of an ongoing study that monitors well-knownW
robo advisors. We strive to provide a reliable resource for both investors and professionals interested in the digital advice industry.
Highlights:
Shifting tides favoring value stocks rewarded Schwab robo investors while Titanand Morgan Stanley Robotics held on to top spots (pg. 5)
Pandemic pushes robo assets to new highs as Betterment, Schwab, Vanguard, andM1 show impressive AUM growth (pg. 14)
Tax-loss harvesting study: which robos took your tax bill seriously? (pg. 12 )
New platforms from Goldman Sachs, Stash, and Walmart heat up the U.S.marketplace (pg. 14)
Chinese robo advisor BangNiTou crosses 1 million users (pg. 15)
Interview with CEO Brandon Krieg explains how Stash plans to improve thefinancial lives of over 5 million users on its platform (pg. 18)

Table of Contents
2
Executive Summary . . . . . . . . . . . . . . . . . . . . . . . . . . . . . . . . . . . . . . . . . . . . . 3
Taxable Top Performers . . . . . . . . . . . . . . . . . . . . . . . . . . . . . . . . . . . . . . . . . 4
Performance Commentary . . . . . . . . . . . . . . . . . . . . . . . . . . . . . . . . . . . . . . . 5
SRI Performance Chart . . . . . . . . . . . . . . . . . . . . . . . . . . . . . . . . . . . . . . . . . 10
Taxable Total Performance Chart . . . . . . . . . . . . . . . . . . . . . . . . . . . . . . . . . 11
Tax-Loss Harvesting Study . . . . . . . . . . . . . . . . . . . . . . . . . . . . . . . . . . . . . . . 12
Industry Trends and Outloo k . . . . . . . . . . . . . . . . . . . . . . . . . . . . . . . . . . . . . 14
Interview with Stash CEO Brandon Krieg . . . . . . . . . . . . . . . . . . . . . . . . . . 18
Charts and Tables . . . . . . . . . . . . . . . . . . . . . . . . . . . . . . . . . . . . . . . . . . . . . . 22
AUM Statistics . . . . . . . . . . . . . . . . . . . . . . . . . . . . . . . . . . . . . . . . . . . 22
Taxable Returns . . . . . . . . . . . . . . . . . . . . . . . . . . . . . . . . . . . . . . . . . . 23
Retirement Returns . . . . . . . . . . . . . . . . . . . . . . . . . . . . . . . . . . . . . . . 3 0
Taxable Account Facts . . . . . . . . . . . . . . . . . . . . . . . . . . . . . . . . . . . . . 32
Retirement Account Facts . . . . . . . . . . . . . . . . . . . . . . . . . . . . . . . . . . 39
International Allocation . . . . . . . . . . . . . . . . . . . . . . . . . . . . . . . . . . 41
Risk Statistics . . . . . . . . . . . . . . . . . . . . . . . . . . . . . . . . . . . . . . . . . . . 42
Normalized Benchmark . . . . . . . . . . . . . . . . . . . . . . . . . . . . . . . . . . . . . . . . 47
Terms of Use and Disclosures . . . . . . . . . . . . . . . . . . . . . . . . . . . . . . . . . . . . 51

Executive Summary
This edition of the Robo Report™ tracks 91 accounts at 42 di�erent providers, the most comprehensive analysis of robo advisors available.
First Quarter Gives New Hope toValue-Oriented Robos
After the overwhelming outperformance of growth-style investing in 2020, value stocks outperformed in the �rst quarter of 2021. As the energy and industrial sectors enjoyed the tailwinds of an economy expanding in light of coronavirus vaccines, Schwab’s Domestic Focus and standard portfolios were top performers due to their tilt towards value. If investors believe we are in a new regime, these robos may be compelling options for the future.
Titan & Morgan Stanley RoboticsAre Top Performers over the 1-YearPeriod
Titan Invest had less-than-stellar performance in the �rst quarter of 2021. However, its equity holdings still reported over 71% returns during the trailing 1-year period, in part due to a favorable allocation to technology stocks. Similarly, Morgan Stanley’s Robotics-themed portfolio demonstrated top-tier performance over the last year. It has yet to be seen if these technology-oriented portfolios will continue to perform so well in 2021.
Wells Fargo, Zacks Advantage, andMorgan Stanley SRI Lead 3-YearReturns
Morgan Stanley’s Socially Responsible Investing option won the top total-portfolio performer award for the 3-year period. This portfolio stands out for its commitment to allocating capital towards ESG-oriented funds for its equity allocation. Interestingly, the portfolio
o�ering a low-cost ETF portfolio that tracksmarket indices, it also o�ers socially responsibleand smart-beta options for furthercustomization.
Another notable entrant is Stash Smart Portfolios. Stash is a micro-investing brokerage platform that boasts over 5 million customers.
3
demonstrated stellar returns despite higher-than-average fund fees. Meanwhile, when looking at top 3-year equity performance, Zacks Advantage and Wells Fargo Intuitive Investor were dominant. Both robos favored domestic stocks, which bolstered performance.
Robo Advisors Expand Rapidly - IsThis the New Normal?
If the last twelve months are indicative of the future, robo advisors are not only here to stay but also expanding rapidly. One of the leading independent robo advisors, Betterment, increased its assets under management from approximately$18 billion to $28 billion over the last 12 months, according to the ADV Schwab Intelligent Portfolios, M1 Finance, Ellevest, and Titan Invest have all experienced rapid growth over the past year. Walmart’s new Hazel service has the opportunity to bring robo advisor services to its global demographic of over 240 million weekly customers. Finally, BangNiTou, a Vanguard and Ant-backed robo in China, just crossed 1 million users, marking what may be a global rise in robo investing.
New Options for our Money - Marcus & Stash
Goldman Sachs released its highly anticipated robo advisor, Marcus Invest, last quarter. The Marcus brand already has a compelling consumer-loan but it now has a fully equipped robo advisor. In addition to

Taxable Top Performers
Year-to-Date Top Performers
Best 2nd 3rd
Total Portfolio Schwab Domestic FocusTD AmeritradeManaged Risk Wealthfront
Equity Schwab Domestic Focus Schwab Qapital
Fixed Income Fidelity Go Fifth Third Bank OptiFi Betterment Income
Produced by Backend Benchmarking for BackendB.com
1-Year Trailing Top Performers
Best 2nd 3rd
Total Portfolio Titan Invest Morgan Stanley RoboticsWells Fargo Intuitive
Investor
Equity Titan Invest Morgan Stanley Robotics Schwab Domestic Focus
Fixed Income
Interactive Advisors LeggMason Global Growth
and IncomeTIAA PersonalPortfolio SRI M1 Finance
Produced by Backend Benchmarking for BackendB.com
3-Year Trailing Top Performers
Best 2nd 3rd
Total Portfolio Morgan Stanley SRIWells Fargo Intuitive
Investor Axos Invest
Equity Zacks AdvantageWells Fargo Intuitive
Investor Morgan Stanley SRI
Fixed Income E*Trade Core Axos Invest SigFig & Wealthfront
Produced by Backend Benchmarking for BackendB.com
5-Year Trailing Top Performers
Best 2nd 3rdTotal Portfolio SigFig Axos Invest Vanguard P.A.S.
Equity SigFig Vanguard P.A.S. Axos InvestFixed Income Schwab SigFig Axos Invest
Produced by Backend Benchmarking for BackendB.comTotal Portfolio winners are based on the portfolio's return vs. the Normalized Benchmark. Returns are net of fees and are as of 03/31/2021.
4

Performance Commentary
Market Recap
After an unprecedented year in �nancial markets,U.S. equities continued to climb higher in the�rst quarter of 2021. The S&P 500 Index rose6.17% over the quarter to �nish near an all-timehigh. A strengthening labor market, a healthy risein consumer spending, and a growing deploymentof vaccines provided investors with greater clarityinto the country’s economic recovery. However,the drivers of performance in the �rst quarterwere di�erent from those in 2020, whentechnology and growth-related namesoutperformed the broader market. The energy,�nancial, and industrial sectors were the primarydrivers of performance during the quarter. Value
stocks outperformed growthstocks by a wide margin in theperiod, extending theiroutperformance from thefourth quarter of last year.
The rally in value has closed the growth-valuedivide over the one-year trailing period, in areversal of previous periods when growthdominated. Additionally, the improvingeconomic conditions particularly boostedsmall-cap stocks, which are more sensitive toeconomic �uctuations but tend to fare betterduring recoveries. As such, small caps led the wayduring the quarter, followed by mid caps andthen large caps.
On the international front, both developed andemerging market equities posted positive returnsfor the quarter but fell short of U.S. markets. TheMSCI EAFE Index, which tracks equities in
developed markets, saw a quarterly gain of 3.63%despite new lockdown measures and vaccine distribution challenges in many European countries. While a recovery is unfolding throughout these developed markets, analysts are lowering their expectations for corporate earnings. On the other hand, emerging market nations have seen a strong economic recovery, though the MSCI Emerging Markets Index returned only 2.24% for the quarter. China continued to be at the forefront of the emerging market space, with economic activity returning to pre-pandemic levels and economic forecasts coming in stronger than expected.
In the �xed-income market, the focus has shifted from the Federal Reserve’s ultra-accommodative policies to the sharp rise in long-term yields. The 10-year U.S. Treasury note ended the quarteryielding 1.74%, up from the 0.93% yield at theend of 2020, and exhibited the largest quarterlyrise in more than four years. This sizable movecame as investors began toprice in rising in�ationexpectations associatedwith the reopening of theU.S. economy and theimpact of �scal stimulus and demanded higheryields for holding Treasury bonds. Against thisbackdrop, �xed-income returns were mostly �ator negative during the quarter. Longer-durationbonds were among the worst-performing.Municipal bonds outperformed their corporatecounterparts for the most part, and
5
Value stocks outperformed growth stocks by a wide margin in the period - reversing the trend.
Year to date, shifting tides reward Schwab equity portfolios for value exposure
Municipal bonds propel Fidelity Go and F ifth �ird Bank to top fixed-income performance
Titan Invest and Morgan Stanley Robotics show 70%+ equity returns over the 1-y ear periodthanks to a boom in technology stocks
SigFig continues its reign as the top performer over the 5-year period
The 10-year U.S. Treasury note exhibited the largest quarterly rise in more than four years.

higher-yielding bonds generally led the pack inboth the corporate and municipal bond space.
Value Drives Robo Performance inQ1, Titan Retains One-Year Spot
In the last several Robo Reports, the performancedata has shown that robos with growth tilts intheir equity holdings have fared better. Thattrend reversed over the past six months. TheSchwab Domestic Focus portfolio placed �rst forboth performance relative to the NormalizedBenchmark and for equity performance in the�rst quarter. The standard Schwab portfolio,which has more international equities than theDomestic Focused portfolio, had the second-bestequity performance and the sixth-bestperformance compared to the NormalizedBenchmark in the �rst quarter. Schwab’s �rstquarter success was bolstered by the fact that ithas one of the most value-oriented portfolios.
The strong �rst and fourth quarter performancewas enough to push both Schwab portfolios intothe top 10 over the 1-year trailing period ending
March 31, 2021, when lookingat performance compared tothe Normalized Benchmark.While value stocks experienced
a strong six months, growth stocks stilloutperformed in periods longer than a year.
Titan Invest, on the other hand, has a heavygrowth tilt. In the �nal quarter of 2020, its twoportfolios had the highest equity performancecompared to their Normalized Benchmark, but inthe �rst quarter of 2021, they had the lowestequity performance compared to their
Normalized Benchmarks. Forthe 1-year period endingMarch 31st, 2021, however,
Titan retained its top spot for both equity-onlyperformance and performance versus theNormalized Benchmark. Over the past year,Titan’s equities returned 71.96%. These strongreturns led it to outperform its benchmark by12.43%. Titan di�erentiates itself from otherrobos by actively selecting individual stocks. Atthe end of the quarter, its three largest holdings
were Paypal, Twilio, and Apple. These holdings are representative of the larger portfolio, which is tilted towards large-cap growth stocks.
Municipal Bonds PropelFixed-Income Performance in Q1
In 2020, hesitant investors �ocked to U.S. Treasury bonds and other high-quality bond o�erings. In the �rst quarter of 2021, investorsbegan to move out of those categories and backinto high-yield �xed income as economicprospects improved. The tightening of creditspreads in the second half of 2020 and into 2021helped municipal and corporate bonds o�setrising interest rates. Municipal bonds also faredbetter than corporate bonds or Treasury bondsyear to date. Fidelity and Fifth Third Bank OptiFiwere the top two �xed-income performers overthe �rst quarter. Both oftheir �xed-incomeportfolios consist entirelyof municipal bonds. Whenlooking over the 1-yeartrailing period, InteractiveAdvisors Legg Mason,TIAA SRI, and M1 were the top �xed-incomeperformers. These portfolios hold higherallocations to corporate bonds. While municipaland corporate bonds both recovered in the secondhalf of 2020 and the �rst quarter of 2021,corporate bonds have generally fared better overthe past year.
Morgan Stanley Robotics and SRIShine
Just behind Titan for 1-year performance is theMorgan Stanley Robotics portfolio. Its equityholdings returned 71.90% over the 1-year trailingperiod. Unlike Titan, Morgan Stanley does notpick individual stocks but rather speci�c ETFs toachieve exposure to certain industries in itsdi�erent thematic portfolios. The four fundsspeci�c to the Robotics-themed portfolio allreturned over 65% over the one-year trailingperiod. The top fund, the ARK Innovation ETF,returned 177% over a period when the S&P 500returned 56%. The funds that Morgan Stanley
6
Both of Schwab’s portfolios showed stellar equity returns YTD.
Over the past year, Titan’s equities returned 71.96%.
Fidelity and Fifth Third were the top two fixed-income performers over the first quarter. Both bond portfolios consisted entirely of municipal funds.

has chosen for this particular theme aretechnology-heavy and give the portfolio a highergrowth tilt than most of the other robos. This hasboded well during a period when the COVIDeconomic environment has lent itself to remotework and an increased reliance on technology.
Morgan Stanley also claimed a top performancespot over the 3-year time period. Its SRI portfolio
was the top performer relativeto the Normalized Benchmarkover this time. It is one of thefew SRI portfolios whoseentire equity holdings are
invested in SRI-themed funds.
3-Year Equity Returns: Zacks andWells Fargo Rely on Domestics,Small-Caps
Over the 3-year period, Zacks Advantage andWells Fargo’s Intuitive Investor were the best
equity performers with annualreturns of 14.02% and 13.99%,respectively. During thisperiod, the Russell 3000 Indexreturned over 17% annualizedand the MSCI ForeignDeveloped and EmergingIndices both returned between
6 and 7% annualized. Zacks and Wells Fargooutperformed the other robos by holding a largerpercentage of their equities in domestic stocksthan international stocks. Zacks ended thequarter with 83% domestic exposure as apercentage of equities.
Another common factor was that both Zacks andWells Fargo have more mid- and small-capexposure than many other robos. Zacks achievesthis by speci�cally holding the S&P mid- andsmall-cap funds and Wells Fargo relies on theVanguard Extended Market ETF. While small-and mid-cap holdings generally underperformedlarge-cap stocks over the 3-year period, thefantastic run in small caps during the fourthquarter of last year and the �rst quarter of thisyear has boosted performance.
SigFig Remains Top 5-YearPerformer
SigFig maintained its top spot for 4-year and5-year performance forboth total portfolio andequity performance. Overthe 5-year period, SigFig’sportfolio returned 10.38% annually and itsequities returned 14.17% annually.
SigFig has bene�tted from a straightforwardapproach. The majority of its equities are held intotal U.S. stock market ETFs. These ETFs arecomposed mainly of large caps, which haveoutperformed mid and small caps, and entirely ofdomestic equities, which have widelyoutperformed foreign ones over the past �veyears. SigFig has also made good choices within itsinternational holdings, having more emergingmarkets than developed as a percentage of itsinternational exposure. Lastly, its �xed income isheavily investment-grade, with allocations toTIPS and high-quality domestic corporate bonds.These two areas of �xed income have performedwell, especially over the past year, and made SigFigthe second-best �xed-income performer over the5-year trailing period.
Filling out the 5-year total portfolio spots areAxos Invest and Vanguard P.A.S., which placedsecond and third, respectively. Vanguard, true toform, keeps its strategy simple and utilizes onlytwo equity funds—a total U.S. market fund andtotal international market fund—and threemunicipal �xed-income funds. This strategy,though simple, has returned 9.54% annually overthe past �ve years.
Schwab remains the top �xed-income performer.Unlike Vanguard, which holds only municipalbonds, Schwab holds a broad mix of �xed income,including mid-durationTIPS, emerging marketbonds, municipals, andhigh-yield corporates.Over the last �ve years,emerging market bondsand corporate bonds did better when markets
7
Morgan Stanley’s SRI portfolio was the top performer. Its entire equity holdings were ESG funds.
Over the 3-year period, Zacks Advantage and Wells Fargo’s Intuitive Investor were the best equity performers with annual returns of 14.02% and 13.99%, respectively.
Top robo SigFig earned 10.38% annually over the 5-year period.
Schwab holds a broad mix of fixed income - TIPS, emerging market bonds, municipals, and high-yield corporates.

were calmer and riskier debt was under less duress. Mid-duration TIPS, on the other hand, have done well in the second half of 2020 as investors shifted into in�ation-protecting assets.
SRI Performance
Socially Responsible Investing (SRI) remains a hot trend in the investment industry. At Backend Benchmarking, we compare the equity performance of the SRI options and the standard options at the same robo advisor to analyze their di�erences. The providers are Betterment, E*Trade, Ellevest, Merrill Edge, Morgan Stanley, M1 Finance, TD Ameritrade, and TIAA. Betterment recently introduced three new SRI portfolios: the Broad Impact portfolio, the Climate Impact Portfolio, and the Social Impact portfolio. This is the �rst Robo Report in which we can begin to report on them. Additionally, we cover a provider called Sustainfolio, which only o�ers SRI portfolios.
Over the 2-year trailing period, the equity-only performance of the SRI portfolios outperformed
the standard option at all providers except forE*Trade. The biggest performance gap was atMorgan Stanley, whose SRI equity portfoliooutperformed the standard option by 3.11%annually. As mentionedabove, the MorganStanley SRI portfolio wasthe top 3-year totalportfolio performer.
Over the last quarter,however, the results were mixed and there weremany instances in which the standard optionoutperformed the SRI option. One factor is thatSRI screens often exclude fossil fuels and manyenergy companies, which have lagged over thepast two years but had a very strong �rst quarteras the cyclical sectors have bounced back.
8
Over the 2-year period, the equity-only performance of the SRI portfolios outperformed the standard option in all but one provider.

Robo Advisor Average Returns
1Q 2021 1-Year 2-Year 3-Year 4-Year 5-Year
Equity 6.25% 59.06% 17.23% 12.15% 12.50% 12.99%
Fixed Income -2.29% 4.30% 4.21% 4.11% 3.59% 3.30%
Total Portfolio 3.10% 35.94% 12.66% 9.33% 9.31% 9.53%
Returns are net of fees and are as of 03/31/2021. All returns for periods longer than one year are annualized. Produced by Backend Benchmarking for BackendB.com
Index Returns
Index 3-Year Return
Domestic Russell 3000 18.02%
International Emerging Markets MSCI Emerging Markets 6.88%
International Developed Markets MSCI EAFE 6.62%
Value Russell 3000 Value 11.79%
Growth Russell 3000 Growth 23.38%
Large Cap Russell 1000 18.21%
Small Cap Russell 2000 15.68%
U.S. Aggregate Bond Barclays U.S. Aggregate 4.64%
Intermediate Corporate Bonds Barclays Intermediate Corp. 5.43%
Municipal Bonds Barclays Municipal 4.88%
Returns are as of 03/31/2021. All returns for periods longer than one year are annualized. Produced by Backend Benchmarking for BackendB.com
9

SRI Account Equity-Only Performance
10
0% 5% 10% 15% 20% 25% 30% 35% 40% 45% 50% 55% 60% 65%
Betterment
Betterment Broad Impact SRI
Betterment Climate Impact SRI
Betterment Social Impact SRI
Betterment SRI (legacy)
E*Trade Core
E*Trade Core SRI
Ellevest
Ellevest SRI
M1 Finance
M1 Finance SRI
Merrill Edge Guided Investing
Merrill Edge Guided Investing SRI
Morgan Stanley Market-Tracking
Morgan Stanley SRI
Sustainfolio
TD Ameritrade
TD Ameritrade SRI
TIAA Personal Portfolio
TIAA Personal Portfolio SRI
YTD 1-Year Trailing 2-Year Trailing (Annualized) 3-Year Trailing (Annualized)
11
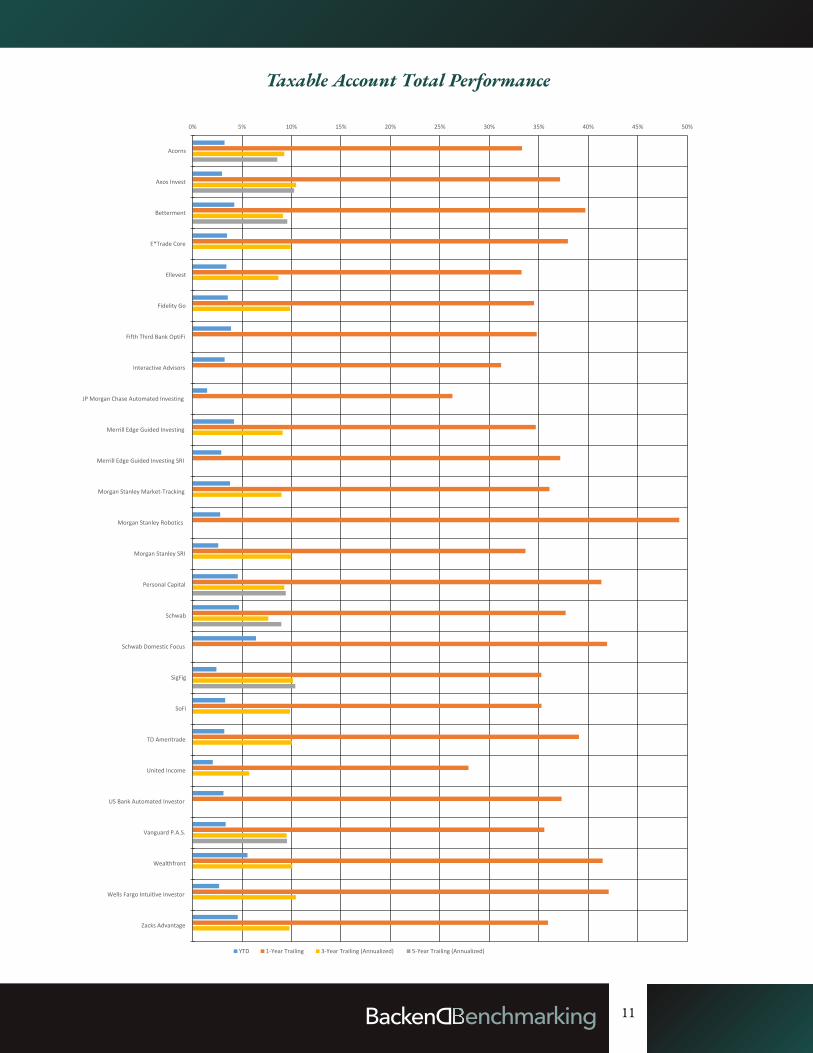
0% 5% 10% 15% 20% 25% 30% 35% 40% 45% 50%
Acorns
Axos Invest
Betterment
E*Trade Core
Ellevest
Fidelity Go
Fifth Third Bank OptiFi
Interactive Advisors
JP Morgan Chase Automated Investing
Merrill Edge Guided Investing
Merrill Edge Guided Investing SRI
Morgan Stanley Market-Tracking
Morgan Stanley Robotics
Morgan Stanley SRI
Personal Capital
Schwab
Schwab Domestic Focus
SigFig
SoFi
TD Ameritrade
United Income
US Bank Automated Investor
Vanguard P.A.S.
Wealthfront
Wells Fargo Intuitive Investor
Zacks Advantage
YTD 1-Year Trailing 3-Year Trailing (Annualized) 5-Year Trailing (Annualized)
Taxable Account Total Performance

Tax-Loss Harvesting Study
Essential Portfolios andSchwab Intelligent Portfoliosstand out for the highestpercentage of realized netlosses for the year. As of the
end of 2020, TD realized over 9.5% of its portfolio in net short-term losses, while Schwab realized over 8.3%. Meanwhile, our tax-loss harvesting study group of 11 robo advisors averaged 3.59% realized net losses as a percentage of year-end value.
TD and Schwab also demonstrated their aggressiveness of harvesting losses by heavy portfolio turnover. TD experienced a 120%portfolio turnover, while Schwab showed 116%. On the other hand, the average of the portfolios
analyzed in our tax-loss harvesting study groupexperienced turnover just under 50%. Thebene�ts of a more aggressive tax-loss harvestingstrategy accrue to theinvestor’s bottom line.Short-term losses not onlyo�set gains but can also beused to o�set someordinary income in manycases, both of whichbolster the after-tax performance of these leadingrobos.
Towards the middle of the pack, Wealthfrontrealized net losses of just under 5% of its totalportfolio, while Wells Fargo realized 3.75%. Bothof these portfolios were fairly active, withWealthfront standing out with a portfolioturnover rate of 87%. Morgan Stanley AccessInvesting showed some signs of tax-loss harvestingwith 2.14% of its portfolio in net realized losses.At the bottom of the pack were SigFig, CitizensBank SpeciFi, and UBS.SigFig did not realize anylosses, while SpeciFi, arobo advisor backed bySigFig’s technology, onlyrealized 0.05% net losses inthe year. This is in light ofestimated unrealized net losses above 9% of theaccount value for both accounts at the end of the�rst quarter of 2020. Similarly, UBS Advice
12
Not all robos implemented tax-loss harvesting to the same extent. While some realized netlosses of over 8% of the account value on the year, others did not realize any losses at all
TD Essential Portfolios and Schwab Intelligent Portfolios were top choices for tax-lossharvesting over the year
SigFig, UBS, and Citizens were at the bottom of the pack with virtually no net realized losseson the year
As of the end of 2020, the insight is clear: not all tax-loss harvesting services are made equally.
TD and Schwab were the most aggressive. TD experienced a 120% portfolio turnover, while Schwab showed 116%.
At the bottom of the pack were SigFig, Citizens Bank, and UBS. These three robos realized nearly zero net losses in the year of the pandemic.
Tax-Loss Harvesting Study—Whic hRobos Took Your Tax Bill Seriously?
The larg e at the be ginning o f the glob alpandemic has provide d the opportunity to assess the o f tax-l oss harv esting servic es at ma jorro bo ad visors. Back end Benc hmarking trac ks a seto f accoun ts that tax-l oss harv estingwhic h wer e all opene d and funde d at the same time and receiv e monthl y d eposits (no te that these accoun ts ar e fr om the mainaccoun ts that w e use to measur e performanc e in the Ro bo Report). As o f the end o f 2020, theinsigh t is cl ear: no t all tax-l oss harv esting servic es
ar e mad e equally . TD

Advantage, another SigFig-backed robo adviceproduct, reported only 0.13% net losses on theyear. Given that 2020 included a quarter whenstock indices were down over 30% from markethighs, investors would expect more opportunitiesto sell struggling asset classes to harvest losses forlater use. But this was not the case for these threeaccounts.
Ultimately, when selecting a robo advisor for itsability to execute tax-lossharvesting, it is important tobe aware thatimplementations vary widely.For some, it seems to be a
major feature, while others may be struggling to�nd the right algorithm to harvest losses. It is also
important for investors to keep in mind thatwhile tax-loss harvesting can improve after-taxreturns, the bene�ts can often appear greater thanthey are. When a tax loss is harvested, theresulting portfolio has alower cost basis, so realizedgains will be higher whenassets are sold in thefuture. Additionally, asmarkets rise, theopportunities to harvestlosses fall. Tax-loss harvesting opportunities occurmore frequently in newer accounts, since olderaccounts are more likely to hold assets which havealready signi�cantly appreciated above theiroriginal cost basis.
13
It is important to be aware that implementations vary widely.
When a tax loss is harvest-ed, the resulting portfolio has a lower cost basis, so realized gains will be higher when assets are sold in the future.

Industry Trends and Outlook
It is hard to believe that it has now been morethan a decade since the �rst robo advisors werelaunched in the wake of the �nancial crisis. Now,algorithmic, managed-account platforms havebecome ubiquitous. Juggernaut independent�rms like Betterment, Wealthfront, and PersonalCapital sit beside massive incumbents likeEdelman Financial Engines, Charles Schwab, andVanguard. With notable new entrants to themarketplace like Marcus Invest by GoldmanSachs, the once-novel industry is now mature andhighly competitive. Robo advisors are pushingthe boundaries between investment platforms anddigital banks, as traditional banking services havebecome key elements of their o�erings. However,not all success has been distributed evenly. Whilesome �rms are thriving and raising new rounds offunding, others are closing doors. Still, roboadvisors are at the epicenter of major trends.Socially responsible investing, direct indexing,and a digital-native way of life are all part of thisdeveloping story.
Robo Advisors Democratize InvestingAcross the Globe
Robo advisors continue to impress withsigni�cant growth infunding, assets undermanagement, and notablenew products. In 2020, thewealth-tech industry raisedover $3.7 billion in newfunding through November,according to reports from CB
Insights. This marked a 50% increase from 2019’s
14
Betterment grew its AUM from approximately $18 billion in 2020 to over $28 billion.
In 2020, the wealth-tech industry raised over $3.7 billion in new funding through November, according to reports from CB Insights. This marked a 50% increase from 2019.
Stash, the micro-investing online brokerage with over 5 million customers, launched Smart Portfolios.
New products from Walmart, Goldman Sachs, and Stash heat up the competitiv e U.S.marketplace
Vanguard-backed BangNiTou crosses 1 million users in China
Significant growth from Betterment, Schwab, Vanguard, and M1 F inance point to thepandemic rewarding digital platforms
Wealthfront’s Self-Driving Money - a glimpse at the future of automated cash management
year-end total. Investors shifting to managing more of their lives online in response to the pandemic has given the digital-advice industry a tailwind. For example, Betterment grew its AUM from approximately $18 billion in 2020 to over $28 billion, while Schwab experienced 51% growth indigitally advised assets, and Vanguard added $70 billion in robo-assets from the end of 2019 through the first quarter of 2021.Robo advisors still have ample room to grow. According to a Hearts and Wallets survey of 5,000 participants issued last September, only 8% of U.S. households reported having money invested with a robo advisor. There is a tremendous opportunity for this trend to spread.
Although firms like Wealthfront, Vanguard, and Schwab are dominant in this space, there have been notable new entrants. Goldman Sachs launched Marcus Invest in February of this year. This platform includes many of the features that we have come to appreciate in modern robos, including a socially responsible investing (SRI) option, a low advisory fee of 0.35%, and a low minimum of $1,000. Not long after, Merrill Lynch Guided Investing slashed its minimum from $5,000 to $1,000, making these services even more approachable for the average investor. Stash, the micro-investing online brokerage with over 5 million customers, launched a managed accounts product called Smart Portfolios. Vinod Raman, VP of Product at Stash, explained that, “from

day one, Stash was built for long-term, diversi�edinvesting, not day trading.” As the competition inthe automated investing space continues toaccelerate, one bene�ciary is clearly the long-terminvestor.
In what is potentially one of the biggestannouncements of 2020, Walmart is partneringwith Ribbit Capital, a large Robinhood backer, tolaunch a service called Hazel. According to
reports from RIABiz, there islanguage that includes “advisory services” and “�nancial counseling” in the �rm’s USPTO �ling. This has
the potential to be a ground-breaking o�ering, asWalmart has over 240 million weekly customersaround the world.
In global news, BangNiTou, a digital adviceprovider in the Chinese market, crossed its �rst 1
million users in March of2021. The name means “helpyou invest” and is a jointventure between Vanguardand Ant Group. The trend is
clear: automated, diversi�ed, low-cost portfoliosare here to stay, and they are becomingincreasingly accessible to investors of all assetlevels across the globe.
Robos Resilient to Pandemic Woes
The tumultuous period of COVID-19 sawvarious online services surge in popularity. Thework-from-home movement has beenaccompanied by the investment industry’s rise innew account openings across online brokers androbo advisors. According to reports fromBloomberg, brokers Schwab and TD Ameritrade
reported some of the bestmonths they have ever had interms of new accountopenings during the periods
of heightened volatility in the �rst half of 2020.When looking at the 1-year period ending March31, 2021, the story is the same. Schwab reports51% year-over-year growth in its digital advisorysolutions. Vanguard Personal Advisor Services,
the �rm’s hybrid robo advisor, grew from approximately $161 billion at the end of 2019 to$231 billion by March 31, 2021.
Although new openings are compelling, there is other good news for the digital advice industry. When robo advisors initially rolled out, many speculated that during a sharp sell-o� investors would make poor decisions due to the lack of communication with a human advisor. The investment research �rm Dalbar conducted a survey of investor sentiment in response to the COVID-19 sell-o�. According to its reports, 82%of investors were “satis�ed” with their robo advisor and 55% of investors reported a “signi�cant” increase in con�dence after the crisis. Reports of new account openings, account contributions during market sell-o�s, and overall satisfaction point to the possibility that the digital investor may hold up better than once anticipated.
Tides Shift in Robo Landscape
There have been multiple signi�cant changes in the robo advisor landscape as the market �nds its equilibrium. There have been new entrants and closures in the past year. Founded in 2010, Motif was one of the earliest platforms and had a unique approach emphasizing thematic investing. However, it closed doors in 2020 as intensity in the U.S. marketplace grew. Additionally, Wealthsimple, a large Canadian-based robo advisor, recently sold its U.S. advisory business to Betterment. Also in 2021, Prudential Link’s PMA platform, the �rm’s robo advisor, was discontinued.
While the highly competitive U.S. market drove closures, it also drove signi�cant acquisitions. The industry’s largest acquisition to date was announced in June of 2020. Empower Retirement, the second-largest retirement plan provider with over 12 million participants, purchased Personal Capital for$1 billion. This acquisition was notable for Personal Capital’s high valuation and the fact that it has been a pioneer in the space. The move provides Empower clients with a natural destination when exiting their employer-sponsored plans. In an even bigger transaction, Charles Schwab purchased TD
15
Walmart is partnering with Ribbit Capital, a large Robinhood backer, to launch a service called Hazel.
BangNiTou, a digital advice provider in the Chinese market, crossed its first 1 million users in March.
Schwab reports 51% year-over-year growth in its digital advisory solutions.

Ameritrade. Schwab Intelligent Portfolios and TDEssential Portfolios were two of the largestdigital-advice platforms before the acquisition, andnow they sit under the same roof. The landscapecontinues to consolidate as it matures.
While some �rms are closing doors or gettingacquired by larger institutions, others are raisinglarge sums of funding. M1 Finance, an onlinebrokerage platform that allows users to customizetheir holdings through a series of portfolio “pies,”just raised another monumental sum. In March, the�rm raised $75 million of Series D funding followinga $45 million Series C funding round last October.The most recent round followed rapid growth inassets from $1 billion in February 2020 to over $3billion in January 2021.
Titan Invest, the actively managed robo advisorbased in New York City, raised $12.5 million in
Series A funding as the �rmcrossed its �rst $500 million inassets. This is remarkable sincethe �rm was founded in 2018.Although many smaller roboadvisors have struggled todistinguish themselves amongthe juggernauts, some speci�c
�rms with unique value propositions haveexperienced signi�cant growth in assets and funding.
Robo Innovations
Robo advisors are now looking beyond investmentmanagement. The �rst major step towards o�eringmore personal �nance services was the introductionof cash spending and savings accounts. Now, it isstandard for independent robo advisors to o�er abank account alongside investment accounts.Ellevest, a robo advisor focused on serving the needsof women investors, launched its MoneyMembership program, which includes a debit cardand round-ups. Even beyond these banking features,some providers are looking to push the envelope.
Wealthfront’s Self-Driving Money feature set is aglimpse at the types of new capabilities being madeavailable to investors. Self-Driving Money allowsusers to automate savings on a day-to-day basis. Bycreating a series of savings goals and setting an
amount of “Everyday Cash” for day-to-day spending,investors enable Wealthfront to seamlessly split uppaychecks into di�erent “buckets” and monitor forexcess cash to be automatically transferred to aninvestment account. Self-Driving Money helps userslink monthly spending and savings to long-termgoals without having to decide how much money tomove each month. The automation increases thelikelihood of optimizing
with this feature. While still rudimentary, this typeof automated cash management is an area in whichwe expect to see continued innovation.
Is Direct Indexing the Next Big Wave?
Direct indexing is an investment strategy that seeksto replicate the underlying stocks of an index insteadof holding an index fund. Historically, this strategyhas been di�cult to implement for lower-dollaraccounts due to the capital requirements of buying awhole share, or more, of each security in an index.This is no longer the case as fractional-sharestechnology becomes mainstream. The reason fordirect indexing over an index ETF, is that it canincrease customization and opportunities for tax-lossharvesting. An investor can, for example, screen outindividual stocks that are not in line with ethicalconcerns. Concentrated stock positions can beaccounted for through speci�c stock screensimplemented on the strategy. From a tax-lossharvesting perspective, investors can harvest losses byselling individual securities instead of beingrestricted to selling an entire index fund or ETF.
This technology sits at the intersection of a fewmajor trends in the roboadvice industry: �ndingways to be conscientiousabout ESG concerns,automated tax-lossharvesting, and usingfractional-sharestechnology. In the last year,there were multiple acquisitions that point to these
16
Self-Driving Money helps users link monthly spending and savings to long-term goals without having to decide how much money to move each month.
Titan Invest, the actively managed robo advisor based in New York City, raised $12.5 million in Series A funding as the firm crossed its first $500 million in assets.
Schwab, BlackRock, Goldman Sachs, and Morgan Stanley have all engaged in transactions that could influence their ability to offer direct indexing at scale.
eac h do llar so it c an beappropriatel y investe d. The ol d adag e o f “it’ s no tabo ut timing the mark etb ut time in the mark et that
matters” is full y on display

technologies �nding their way into the hands of largeplayers in the space.
Schwab, BlackRock, Goldman Sachs, and MorganStanley have all engaged in transactions that couldin�uence their ability to o�er direct indexing at scale.Schwab purchased technology from Motif,bolstering its thematic and fractional sharecapabilities. Neesha Hathi, Schwab’s chief digitalo�cer, commented that this will “help our clientsnavigate their investment needs in a more personalway.” BlackRock purchased Aperio, a �rm knownfor its direct-indexing strategies, and Goldmanpurchased technology from Folio, improving itsfractional-shares technology. Lastly, Morgan Stanleyacquired Parametric, which for decades has beeno�ering a direct-indexing portfolio through its“Custom Core” SMA.
While there are only a few robo advice providersutilizing some type of direct indexing for clientstoday, we expect the recent surge of acquisitions inthis area will mature into products for the individualinvestor in coming years.
Final Thoughts
Looking back over the last year reveals a few majortrends in the industry. First, there continues to beconsolidation as the U.S. marketplace becomesincreasingly competitive. Still, for �rms like M1Finance and Titan whose growth prospects lookpromising, funding continues to pour in. Second,there is a great deal of value accruing to the averageinvestor, including free �nancial planning, access toSRI options at low minimums, digital bankingservices, and new innovative features likeSelf-Driving Money by Wealthfront. Finally, if thereis one thing that we have learned from the pandemic,it is that investing online continues to gainpopularity and trust. Firms such as Betterment,Acorns, and Schwab have grown tremendously in thelast year, and investors can rest assured that digitalinvesting is here to stay.
17

Robo Interview with Stash CEO Brandon Krieg
For this edition of the Robo Report, we spokewith Brandon Krieg, the CEO and Co-Founderof Stash. Stash has emerged as a leading consumer�ntech company. Counting its users at over 5million, the Stash platform is resonating withinvestors. Stash began as a self-directed investingplatform but has steadily expanded its o�erings.Since Stash just released a managed accountsplatform we thought it was a good time to discusshow they have succeeded in the crowded �ntechspace.
Can you share with us the current number ofusers and current assets on the platform?
Over 5 million customers and over $2.6 billion inAUM.
Stash has had impressive growth in terms ofthe number of users in a relatively short periodof time. Is there a particular aspect of your
brand or platform that hasled to this growth?
Stash’s mission to helpmillions of Americans investin themselves and build
long-term wealth is rooted in three key factors:accessibility, a�ordability, and simplicity. Thisfocus has guided every decision over the last 5+years—from our launch as a fractional investingapp to the holistic �nancial platform we are today.
Now, for a �at, monthly subscription—starting at$1/month—customers have access to investingand retirement accounts, a banking account withour Stock-Back Card, budgeting anddiversi�cation tools, round-the-clock educationalcontent, and more.
Regardless of yourbackground or �nancialexperience, anyone cancome to Stash and expectto be met with simple,easy-to-understandpersonalized guidance and tools—something that’s long been missing for the vast majority of Americans when it comes to managing their money and long-term goals.
Customer acquisition costs are a large hurdle for most consumer investing �ntech companies. How has Stash tackled customer acquisition? Are there any speci�c acquisition channels or methods Stash has found particularly successful?
The Stash platform helps to solve a very real problem for many Americans who have been on the sidelines or excluded from traditional �nancial services. Because of this market �t, we’ve been able to �nd success in most digital channels you would expect to �nd millennials, along with many traditional channels like TV and OOH.
18
Anyone can come to Stash and expect to be met with simple, easy-to-understand personalized guidance and tools.
Stash’s mission to help millions of Americans invest in themselves. Our three key factors: accessibility, affordability, and simplicity.
Stash Smart Portfolios, the company’s new managed accounts program, reports ov er 100,000users in its first month after launch
In just 5 years Stash went from a fractional-share investing app to a holistic platfor m withover 5 million users
A clear differentiating feature has been the Stock-Back Card - it aligns short-ter m spendingwith long-term investing

One of the interesting elements of Stash is howyou are working to help investors “browse”ETFs and stocks to �nd which investmentsthey are interested in. What have you learnedfrom o�ering a place for investors to “shop”for investments?
Making the stocks and funds o�ered by Stasheasier to browse has helped to provide an entrancepoint for many everyday Americans who areinterested in learning more about investing.Without the ability to discover and learn, many ofthese folks would have to rely on personalknowledge or historical experience—somethingthat’s, understandably, not a given for many�rst-time or beginner investors.
Of course, we’ve seen increased “browsing” whenspeci�c companies orindustries are in the newsduring a given moment intime—and breaking downkey information about given
investments can be helpful for people looking toknow more. But, since 2020, our �fth mostviewed investment on our website has been our“Match the Market” ETF, which we can creditback to our long-term investment philosophy.
Which dashboard features, or app featuresgenerally, stand out as particularly compellingfor users on the app? Are there any that standout as a “hit” with your user base?
Our Stock-Back Card is a key di�erentiator forus. Historically, many reward-driven cards havebeen designed to make customers spend more.Or, the rewards expire before being put to use.Stash’s Stock-Back Card helps customers invest inthemselves as they spend on life’s necessities or attheir favorite brands—plus, unlike points, thepieces of stock can grow with a customer overtime.
When a customer makes a qualifying purchasewith the Stock-Back Card, they earn stock thatmatches where they shopped. Swipe atMcDonald’s, earn $MCD,Spotify, earn $SPOT, Etsy,earn $ETSY. If you go toyour local bookstore orgrocery, customers alsoearn pieces of stock in their choice of more than adozen qualifying stocks and ETFs. We’ve also seenthat Stock-Back can be a great discovery tool forcustomers, helping them learn about newindustries and companies, and even promptingthem to make follow-up investments in the stocksand funds they receive Stock-Back in.
How does the Stash platform stand out fromother micro-investing apps like Acorns androbo-advice platforms?
It’s twofold. For one, Stash has never wavered inits mission to help make long-term, diversi�edinvesting as easy and a�ordable as possible. Thistried and true approach to investing is core to ourunique “Stash Way” philosophy, and continues toguide every decision we make.
What’s more, the Stash platform aims to supportpeople in all phases of their �nancial lives—fromfolks who are thinking about their �nancialfutures for the very �rst time, to moreexperienced savers or goal-setters. For example,those looking for a bit more help may choose tokick o� their investing journey with Stash’s SmartPortfolios—long-term, diversi�ed portfolios thatare fully managed by the Stash Investing Team.On the other hand, someone might choose to takea more “DIY” approach, investing in the speci�cstocks and funds they believe in, with the addedguidance of our Diversi�cation Analysis toolthrough their Personal Portfolio.
19
Swipe at McDonald’s, earn $MCD, Spotify, earn $SPOT, Etsy, earn $ETSY.
Of course, we’ve seen increased “browsing” when specific companies or industries are in the news.

Regardless, all customers have access to Stash’sStock-Back Card, a debit card that rewards themwith pieces of stock when they go about theirdaily spend. Plus, robust educational content andpersonalized advice. Again, it’s Stash’sunwavering dedication to accessibility,a�ordability, and simplicity that truly sets thebrand apart.
What type of clients have you had the mostsuccess in attracting onto the platform? Arethey new to investing? Previouslyself -directed? Previously in a traditionaladvice relationship?
A majority of Stash customers are around30-years-old and �rst-timeinvestors. This might meanthey’re coming to Stash tostart thinking about theirunique �nancial goals for the
�rst time, as well as how to build wealth for thelong term.
Because of this, education is embedded into everycorner of the Stash experience, helping to ensurethat customers feel supported and informed asthey navigate each part of their �nancial journey,from daily spend to goal-setting to retirement.
Has the launch and reception of the SmartPortfolios met expectations? Have you beensurprised by anything since launching SmartPortfolios?
It’s been exciting to see the response to SmartPortfolios. Roughly one month post-launch,
there are now more than100K Stash customers usingSmart Portfolios to invest intheir futures. The newo�ering helps solidify—anddeepen—Stash’s mission tomake long-term, diversi�ed
investing easier and more a�ordable for everyday Americans, particularly beginners who may not know where to start on their investment journeys. Unlike other institutions, Stash does not charge fees based on portfolio size—instead, Smart Portfolios are available to customers as part of Stash's Growth and Plus subscription plans, starting at $3/mo.
What have you learned about how individuals interact with their investments that you did not expect?
I think it’s clear that people are interested in ways to simplify their �nancial lives. Our popular tools like Auto-Stash and Smart Portfolios help to cement this—both of which o�er ways for customers to practice a more “set it and forget it” mentality by letting them automate their investment approach. It’s a simple way for people to live out our “Stash Way” investment philosophy—regular, diversi�ed, long-term investing.
What is the long-term e�ect investing �ntechs will have on the investment and advice industry?
Access is key. We’ve already seen how �ntechs can help to make it easier for more and more Americans to have a stake in the game, and to start building wealth for the long term. Fintechs also have a key role to playin helping to provide�nancial education and,ultimately, increasewidespread �nancialliteracy—something a vastmajority of Americansweren’t taught in school or even at home.
Taking a more macro lens, the hope is that�ntechs can help to make the �nancial services
20
A majority of Stash customers are around 30-years-old and first-time investors.
Roughly one month post-launch, there are now more than 100K Stash customers using Smart Portfolios to invest in their futures.
Fintechs also have a key role to play in helping to provide financial education and, ultimately, increase widespread financial literacy.

industry—and access to wealth-building tools—assimple, a�ordable, and equitable as possible.
Who is the typical Stash client? Can you shareany demographic information such as averageage or account size?
The average Stash customer is around30-years-old, with about $50K in householdincome. Many of them are �rst-time investors, ornew to their �nancial journey. In terms of gender,we were excited to see that nearly half of newcustomers coming to the platform in 2020 werewomen.
What other characteristics do you see in theStash clientele? Are there any otherdemographic, investor type, or other trendsyou see?
Amid the market volatility that came to de�ne thelast year or so, we saw roughly 50% in the numberof customers automating their investments tohelp them ride out the varying market highs andlows—a testament to the strength of Stash'slong-term investment philosophy.
What do Stash clients care about the most?
Perhaps not what customers care about “most,”but something we’ve certainly seen an increasedinterest in of late, are goal-setting tools. In 2020,for example, Stash launched Goals—a cashmanagement tool that allows customers to createunique categories within their Stash bankingaccount, helping them better prepare for expensesand more easily allocate money towards their
�nancial goals.
The genesis of Goals wasdirect customer feedback. A2019 Stash study found that,each week, at least 35% ofstudy participants faced an
unplanned expense, and 44% reported turning tocredit cards in those instances. Recognizingcustomers’ need for a better way to partition theirmoney—without the fear of taking ondebt—Goals was born.
Do you see Stash expanding past investmentsand banking? Are there any speci�c areas thatStash is considering like insurance orpayments?
While Stash does not sell insurance, we alreadypartner with several trusted platforms to o�er ourcustomers simple, a�ordable insurance options asa way to help complete their �nancialpicture—from life and auto to homeowners andrenters insurance.
What is out there that is on the cutting edgeof innovation? Are there any ideas or productsthat are new, coming to the market, or still inthe idea phase that you �nd interesting eitherwithin Stash or at other providers?
While we’re always talking to customers, ideating,and testing new features for the Stash platform,the year ahead will be rooted in focus. With over5M customers and a holistic �nancial o�ering,2021 will be about making the Stash experience assimple and delightful as possible.
What do you see as the largest challengepresented to Stash to continue its growth?
There are still hundredsof millions of Americanswho need better access toa�ordable �nancialproducts. This is thechallenge Stash has beenworking to solve since day one, and whatcontinues to drive the team day in and day out.
21
A 2019 Stash study found that, each week, at least 35% of study participants faced an unplanned expense, and 44% reported turning to credit cards in those instances.
There are still hundreds of millions of Americans who need better access to affordable financial products.

Charts and Tables
AUM Statistics
Robo AUM (in millions) Clients Source of AUM and Clients Figures
Acorns $3,378 5,443,371 Recent ADV
Ally Invest Advisors $710 57,006 Recent ADV
Axos Invest $205 19,649 Recent ADV
Beanstox $3 1,289 Recent ADV
Betterment $28,268 616,074 Recent ADV
blooom $4,883 24,144 Recent ADV
Edelman Financial Engines $260,100 1,293,365 Recent ADV
Ellevest $1,006 80,886 Recent ADV
FutureAdvisor $1,749 24,176 Recent ADV
M1 Finance $3,000* Unknown News Media
Personal Capital $17,800 27,000 Company Website
Qapital $23 56,755 Recent ADV
Schwab Digitally Advised Assets $63,600 Unknown Company Website
SigFig $1,422 26,791 Recent ADV
SoFi Invest $339 54,951 Recent ADV
Stash Invest $6 6,067,287 Recent ADV
Titan Invest $500 26,640 Recent ADV
United Income $889 1,142 Recent ADV
Vanguard Personal AdvisorServices $231,000 Unknown Company Representative
Wahed $147 15,161 Recent ADV
Wealthfront $15,847 278,740 Recent ADV
All clients, accounts, and AUM figures are estimates Produced by Backend Benchmarking for BackendB.comUnless otherwise noted, AUM figures include discretionarily managed assets only*AUM figure may include cash assets held in savings account products and assets on self-directed trading platform
22

Taxable Returns: Total Performance
Total Portfolio
1Q 2021
1Q 2021Return vs.
Benchmark 1-Year
1-YearReturn vs.
Benchmark 2-Year
2-YearReturn vs.
Benchmark 3-Year
3-YearReturn vs.
Benchmark 4-Year
4-YearReturn vs.
Benchmark 5-Year
5-YearReturn vs.
Benchmark
Acorns1 3.23% 0.88% 33.31% -1.35% 11.77% -1.46% 9.26% -0.63% 8.67% -1.27% 8.56% -1.43%
Ally Invest ManagedPortfolios9 3.37% 1.11% 33.39% -0.70% 11.94% -1.15% 9.03% -0.77% 8.95% -0.77% - -
Axos Invest8 2.97% 0.28% 37.15% 0.17% 13.65% -0.12% 10.46% 0.23% 10.15% -0.06% 10.27% -0.02%
BBVA SmartPath7 1.71% -0.55% 28.01% -5.99% 10.12% -3.04% - - - - - -
Beanstox42 1.71% -0.64% - - - - - - - - - -
Betterment27 4.21% 1.44% 39.71% 2.15% 12.88% -1.02% 9.13% -1.19% 9.27% -1.03% 9.57% -0.83%
Betterment BroadImpact SRI32 2.14% -0.21% - - - - - - - - - -
Betterment ClimateImpact SRI32 1.99% -0.36% - - - - - - - - - -
Betterment GoldmanSachs Smart Beta32 2.53% 0.18% 34.02% -0.64% - - - - - - - -
Betterment SocialImpact SRI32 2.12% -0.23% - - - - - - - - - -
Betterment SRI(legacy)27 3.58% 1.23% 35.78% 1.12% 12.45% -0.78% 9.01% -0.88% - - - -
Citi Wealth Builder40 4.05% 1.45% 37.36% 1.57% - - - - - - - -
Citizens Bank SpeciFi7 2.73% 0.04% 36.53% -0.45% 12.91% -0.86% - - - - - -
E*Trade Core21 3.48% 1.13% 37.94% 3.28% 13.38% 0.15% 9.93% 0.04% 9.60% -0.22% - -
E*Trade Core SmartBeta23 4.28% 1.93% 34.35% -0.78% 12.04% -1.28% - - - - - -
E*Trade Core SRI23 4.95% 2.60% 36.24% 1.11% 12.96% -0.36% - - - - - -
Edelman FinancialEngines (EMAP)4 3.98% 1.04% 37.58% -1.16% 12.54% -1.68% - - - - - -
Ellevest38 3.42% 1.41% 33.26% 0.88% 11.61% -1.07% 8.67% -0.87% 8.70% -0.87% - -
Ellevest SRI38 2.56% 1.40% 28.61% 0.80% 10.36% -0.89% - - - - - -
Fidelity Go33 3.56% 1.13% 34.53% -0.71% 12.53% -0.83% 9.86% -0.11% 9.83% -0.09% - -
Fifth Third Bank OptiFi7 3.88% 1.53% 34.79% 0.13% 12.64% -0.59% - - - - - -
FutureAdvisor3 2.56% 0.72% 30.52% -2.08% 11.98% -0.69% 8.35% -1.19% 8.46% -1.01% - -
Interactive Advisors24 3.24% 1.40% 31.20% -0.04% 10.74% -1.66% - - - - - -
Interactive AdvisorsLegg Mason GlobalGrowth and Income24 3.04% -0.07% 33.53% -6.39% - - - - - - - -
Interactive AdvisorsState Street Moderate24 2.86% 0.51% 35.47% 0.14% - - - - - - - -
Interactive AdvisorsWisdom Tree ModerateAggressive24 2.64% 0.55% 32.29% -0.65% - - - - - - - -
Returns are net of fees and are as of 03/31/2021. All returns for periods longer than one year are annualized. Produced by Backend Benchmarking for BackendB.com
23

Taxable Returns: Total Performance (continued from previous page)
Total Portfolio
1Q 2021
1Q 2021Return vs.
Benchmark 1-Year
1-YearReturn vs.
Benchmark 2-Year
2-YearReturn vs.
Benchmark 3-Year
3-YearReturn vs.
Benchmark 4-Year
4-YearReturn vs.
Benchmark 5-Year
5-YearReturn vs.
Benchmark
JP Morgan ChaseAutomated Investing7 1.46% -0.10% 26.27% -2.82% - - - - - - - -
Liftoff (Ritholtz WealthManagement)3 3.38% 1.03% 36.18% 1.52% - - - - - - - -
M1 Finance34 3.24% 0.38% 39.67% 1.52% - - - - - - - -
Merrill Edge GuidedInvesting31 4.18% 1.64% 34.70% -0.68% 11.98% -1.10% 9.10% -0.73% 8.89% -0.91% - -
Merrill Edge GuidedInvesting SRI31 2.90% 0.19% 37.17% 0.74% 14.42% 0.65% - - - - - -
Morgan Stanley Active3 2.76% 0.07% 37.55% 0.57% 13.90% 0.13% - - - - - -
Morgan Stanley Defenseand Cyber Security7 2.81% -0.39% 39.29% -1.01% - - - - - - - -
Morgan Stanley EmergingConsumer7 1.70% -1.41% 42.22% 2.30% - - - - - - - -
Morgan Stanley GenderDiversity7 2.61% 0.18% 34.05% -0.98% - - - - - - - -
Morgan Stanley Genomics7 1.07% -0.85% 32.05% 0.65% - - - - - - - -
Morgan Stanley GlobalFrontier7 2.15% -0.96% 37.95% -1.76% - - - - - - - -
Morgan Stanley InflationConscious7 4.05% 1.36% 38.23% 1.88% - - - - - - - -
Morgan StanleyMarket-Tracking12 3.78% 1.09% 36.08% -0.69% 12.68% -1.14% 8.99% -1.27% - - - -
Morgan Stanley Robotics7 2.79% -0.41% 49.21% 8.91% - - - - - - - -
Morgan Stanley SRI7 2.59% 0.50% 33.65% 0.71% 13.61% 0.73% 9.98% 0.33% - - - -
Personal Capital4 4.57% 1.11% 41.33% -0.98% 12.95% -2.01% 9.27% -1.71% 9.06% -2.00% 9.42% -1.84%
Qapital30 5.09% 2.15% 40.50% 1.76% 12.41% -1.76% - - - - - -
Schwab5 4.69% 2.60% 37.72% 3.66% 11.21% -1.52% 7.65% -1.92% 8.22% -1.53% 8.97% -0.99%
Schwab Domestic Focus5 6.41% 3.72% 41.91% 5.58% - - - - - - - -
SigFig6 2.40% -0.12% 35.26% -0.56% 13.87% 0.37% 10.16% 0.10% 10.12% 0.11% 10.38% 0.30%
SoFi17 3.29% 0.94% 35.27% 0.61% 13.62% 0.39% 9.85% -0.10% - - - -
Sustainfolio7 2.60% 0.42% - - - - - - - - - -
TD Ameritrade10 3.20% -0.08% 39.06% -1.04% 13.88% -0.74% 10.04% -0.73% 10.19% -0.53% - -
TD AmeritradeOpportunistic35 2.99% 1.07% 29.88% 0.52% - - - - - - - -
TD Ameritrade SRI45 3.42% 0.14% 39.82% -0.33% 14.76% 0.01% - - - - - -
Returns are net of fees and are as of 03/31/2021. All returns for periods longer than one year are annualized. Produced by Backend Benchmarking for BackendB.com
24

Taxable Returns: Total Performance (continued from previous page)
Total Portfolio
1Q 2021
1Q 2021Return vs.
Benchmark 1-Year
1-YearReturn vs.
Benchmark 2-Year
2-YearReturn vs.
Benchmark 3-Year
3-YearReturn vs.
Benchmark 4-Year
4-YearReturn vs.
Benchmark 5-Year
5-YearReturn vs.
Benchmark
TIAA PersonalPortfolio Active7 2.79% 0.36% 36.53% 1.29% 12.97% -0.62% - - - - - -
TIAA PersonalPortfolio7 2.19% -0.24% 33.28% -1.96% 12.86% -0.50% 9.46% -0.51% - - - -
TIAA PersonalPortfolio SRI7 2.77% 0.42% 35.92% 1.26% 13.47% 0.24% 10.06% 0.17% - - - -
Twine3 3.17% 0.06% 39.66% -0.26% 13.80% -0.63% - - - - - -
UBS AdviceAdvantage7 3.71% 0.51% 40.04% -0.47% 12.96% -1.83% - - - - - -
United Income16 2.04% -0.22% 27.89% -6.20% 8.12% -4.97% 5.73% -4.07% - - - -
US Bank AutomatedInvestor28 3.12% 1.03% 37.31% 4.37% 13.67% 0.83% - - - - - -
Vanguard DigitalAdvisor7 2.19% 0.01% 33.10% -0.42% - - - - - - - -
Vanguard P.A.S.43 3.34% 0.99% 35.56% 0.90% 12.65% -0.58% 9.50% -0.39% 9.54% -0.28% 9.54% -0.32%
Wahed Invest4 0.68% -1.67% - - - - - - - - - -
Wealthfront44 5.55% 2.78% 41.46% 3.90% 13.19% -0.71% 10.08% -0.24% 10.04% -0.26% - -
WealthfrontPassivePlus22 1.63% -0.38% 31.16% -1.22% - - - - - - - -
Wells Fargo IntuitiveInvestor14 2.68% 0.08% 42.07% 5.67% 14.02% 0.39% 10.45% 0.30% - - - -
Zacks Advantage29 4.56% 2.21% 35.94% 1.28% 12.97% -0.26% 9.79% -0.05% - - - -
Returns are net of fees and are as of 03/31/2021. All returns for periods longer than one year are annualized. Produced by Backend Benchmarking for BackendB.com
25

Non 60/40 Target Allocation Taxable Returns
Total Equity Fixed Income
% EquityAllocation 1Q 2021
1Q 2021 Returnvs. Benchmark 1-Year
1-Year Returnvs. Benchmark 1Q 2021 1-Year 1Q 2021 1-Year
Betterment Income27 0% -0.07% 2.67% 3.23% -0.26% - - -0.07% 3.23%
M1 Finance SRI34 98% 6.95% 1.19% - - 7.07% - - -
TD AmeritradeIncome35 23% -0.62% 0.34% 13.61% -0.05% *^ *^ *^ *^
TD AmeritradeManaged Risk35 9% 1.64% 3.11% 13.36% 2.69% *^ *^ *^ *^
Titan Invest3 100% 0.34% -5.42% 71.71% 12.43% 0.34% 71.96% - -
Produced by Backend Benchmarking for BackendB.comReturns are net of fees and are as of 03/31/2021. All returns for periods longer than one year are annualized.*^These portfolios hold balanced funds. The nature of these funds limits our ability to accurately breakdown equity and fixed income performance individually.
26

Taxable Returns: Equity and Fixed-Income Performance
Equity Fixed Income
1Q 2021 1-Year 2-Year 3-Year 4-Year 5-Year 1Q 2021 1-Year 2-Year 3-Year 4-Year 5-Year
Acorns1 6.70% 57.05% 16.64% 12.75% 12.24% 12.53% -2.66% 2.95% 4.09% 3.68% 2.86% 2.19%
Ally Invest Managed Portfolios9 7.60% 61.54% 17.34% 11.78% 12.40% - -3.36% 0.82% 4.15% 4.51% 3.61% -
Axos Invest8 5.90% 57.55% 18.08% 13.20% 13.37% 13.82% -2.14% 6.69% 5.47% 5.14% 4.11% 3.75%
BBVA SmartPath7 6.15% 52.00% 13.66% - - - -3.85% 0.79% 4.15% - - -
Beanstox42 3.44% - - - - - -2.19% - - - - -
Betterment27 7.56% 61.19% 16.78% 11.13% 11.70% 12.57% -2.11% 5.59% 4.18% 4.26% 3.79% 3.25%
Betterment Broad Impact SRI32 4.80% - - - - - -1.98% - - - - -
Betterment Climate Impact SRI32 4.76% - - - - - -2.30% - - - - -
Betterment Goldman Sachs SmartBeta32 6.23% 54.26% - - - - -3.00% 7.63% - - - -
Betterment Social Impact SRI32 4.88% - - - - - -2.17% - - - - -
Betterment SRI (legacy)27 7.15% 58.95% 17.17% 11.53% - - -2.01% 5.64% 4.20% 4.27% - -
Citi Wealth Builder40 *^ *^ - - - - *^ *^ - - - -
Citizens Bank SpeciFi7 5.37% 58.40% 17.25% - - - -2.92% 2.24% 4.18% - - -
E*Trade Core21 8.00% 64.67% 18.26% 12.71% 12.95% - -3.56% 4.68% 5.28% 5.20% 4.14% -
E*Trade Core Smart Beta23 7.16% 56.49% 15.61% - - - -0.68% 4.63% 4.30% - - -
E*Trade Core SRI23 8.28% 60.10% 17.16% - - - -0.68% 4.63% 4.30% - - -
Edelman Financial Engines(EMAP)4 7.81% 61.77% 16.64% - - - -4.37% -0.86% 2.69% - - -
Ellevest38 6.51% 58.82% 17.54% 12.32% 12.62% - -0.67% 5.24% 3.09% 3.18% 2.86% -
Ellevest SRI38 6.14% 59.52% 18.10% - - - -0.57% 4.67% 3.06% - - -
Fidelity Go33 5.90% 57.07% 17.46% 12.86% 13.28% - 0.02% 5.63% 3.81% 4.14% 3.79% -
Fifth Third Bank OptiFi7 6.56% 57.99% 17.99% - - - -0.02% 5.34% 4.01% - - -
FutureAdvisor3 7.67% 59.76% 17.69% 11.84% 12.20% - -3.63% 0.81% 4.39% 3.68% 3.39% -
Interactive Advisors24 8.45% 59.21% 14.74% - - - -3.11% 4.41% 4.92% - - -
Interactive Advisors Legg MasonGlobal Growth and Income24 6.38% 45.46% - - - - -4.44% 12.07% - - - -
Interactive Advisors State StreetModerate24 5.67% 55.85% - - - - -3.56% 5.09% - - - -
Interactive Advisors Wisdom TreeModerate Aggressive24 *^ *^ - - - - *^ *^ - - - -
Produced by Backend Benchmarking for BackendB.comReturns are net of fees and are as of 03/31/2021. All returns for periods longer than one year are annualized.*^These portfolios hold balanced funds. The nature of these funds limits our ability to accurately breakdown equity and fixed income performance individually.
27

Taxable Returns: Equity and Fixed Income Performance (continued from previous page)
Equity Fixed Income
1Q 2021 1-Year 2-Year 3-Year 4-Year 5-Year 1Q 2021 1-Year 2-Year 3-Year 4-Year 5-Year
JP Morgan Chase AutomatedInvesting7 5.48% 53.93% - - - - -3.17% 1.37% - - - -
Liftoff (Ritholtz WealthManagement)3 7.11% 59.72% - - - - -2.25% 5.41% - - - -
M1 Finance34 6.57% 60.58% - - - - -3.55% 8.30% - - - -
Merrill Edge Guided Investing31 6.85% 57.62% 17.57% 12.48% 12.65% - -0.43% 4.64% 3.35% 3.68% 3.13% -
Merrill Edge Guided Investing SRI31 5.64% 59.39% 19.15% - - - -2.49% 4.28% 3.88% - - -
Morgan Stanley Active3 5.36% 59.66% 18.11% - - - -3.05% 3.00% 4.46% - - -
Morgan Stanley Defense and CyberSecurity7 4.90% 58.11% - - - - -3.05% 3.02% - - - -
Morgan Stanley EmergingConsumer7 3.31% 61.91% - - - - -3.06% 3.02% - - - -
Morgan Stanley Gender Diversity7 5.06% 56.52% - - - - -2.12% 3.26% - - - -
Morgan Stanley Genomics7 3.77% 60.50% - - - - -2.98% 2.93% - - - -
Morgan Stanley Global Frontier7 4.07% 56.04% - - - - -3.06% 2.95% - - - -
Morgan Stanley InflationConscious7 7.81% 62.44% - - - - -2.57% 4.36% - - - -
Morgan Stanley Market-Tracking12 6.73% 58.54% 16.52% 10.97% - - -2.71% 1.17% 3.99% 4.18% - -
Morgan Stanley Robotics7 4.56% 71.90% - - - - -3.01% 3.06% - - - -
Morgan Stanley SRI7 5.24% 57.69% 19.63% 13.66% - - -2.14% 3.25% 3.90% 3.76% - -
Personal Capital4 7.25% 59.78% 16.20% 11.44% 11.33% 11.85% -2.36% 4.40% 3.79% 3.07% 2.65% 2.62%
Qapital30 8.99% 61.10% 15.63% - - - -3.22% 5.01% 4.98% - - -
Schwab5 9.24% 64.46% 15.67% 10.23% 11.01% 12.12% -1.51% 7.78% 5.34% 4.28% 4.37% 4.61%
Schwab Domestic Focus5 10.64% 68.31% - - - - -1.04% 6.08% - - - -
SigFig6 5.63% 59.21% 18.09% 12.71% 13.47% 14.17% -2.92% 3.69% 5.62% 5.05% 4.02% 3.84%
SoFi17 5.34% 59.12% 19.51% 13.09% - - -0.44% 4.79% 4.20% 4.23% - -
Sustainfolio7 5.58% - - - - - -1.68% - - - - -
TD Ameritrade10 5.57% 57.53% 17.12% 11.86% 12.64% - -3.19% 1.44% 4.01% 3.74% 3.21% -
TD Ameritrade Opportunistic35 8.14% 56.65% - - - - -3.30% 5.10% - - - -
TD Ameritrade SRI45 6.03% 58.72% 17.89% - - - -3.34% 1.20% 4.08% - - -
TIAA Personal Portfolio Active7 6.51% 59.31% 16.39% - - - -3.06% 6.13% 5.27% - - -
Returns are net of fees and are as of 03/31/2021. All returns for periods longer than one year are annualized. Produced by Backend Benchmarking for BackendB.com
*^These portfolios hold balanced funds. The nature of these funds limits our ability to accurately breakdown equity and fixed income performance individually.
28

Taxable Returns: Equity and Fixed Income Performance (continued from previous page)
Equity Fixed Income
1Q 2021 1-Year 2-Year 3-Year 4-Year 5-Year 1Q 2021 1-Year 2-Year 3-Year 4-Year 5-Year
TIAA Personal Portfolio7 5.55% 57.80% 17.57% 12.20% - - -3.03% 1.92% 4.38% 4.33% - -
TIAA Personal PortfolioSRI7 5.58% 57.07% 18.24% 12.90% - - -1.57% 8.33% 5.26% 4.86% - -
Twine3 5.65% 57.65% 17.73% - - - -2.68% 5.42% 4.15% - - -
UBS Advice Advantage7 5.79% 56.86% 15.63% - - - -1.29% 6.08% 4.04% - - -
United Income16 5.43% 48.04% 11.55% 7.26% - - -3.15% 1.42% 2.45% 2.63% - -
US Bank AutomatedInvestor28 5.61% 64.93% 19.97% - - - -0.59% 5.48% 4.45% - - -
Vanguard Digital Advisor7 5.95% 58.95% - - - - -3.26% 1.77% - - - -
Vanguard P.A.S.43 5.55% 58.72% 18.09% 12.78% 13.28% 13.84% -0.31% 4.96% 4.10% 4.22% 3.62% 2.87%
Wahed Invest4 4.39% - - - - - -0.80% - - - - -
Wealthfront44 8.80% 62.90% 16.48% 11.95% 12.41% - -1.16% 5.47% 4.75% 5.05% 4.25% -
Wealthfront PassivePlus22 5.39% 59.03% - - - - -1.24% 5.82% - - - -
Wells Fargo IntuitiveInvestor14 5.89% 66.70% 19.41% 13.99% - - -3.17% 6.78% 4.29% 4.10% - -
Zacks Advantage29 7.81% 61.41% 19.12% 14.02% - - -0.50% 3.28% 3.40% 3.39% - -
Returns are net of fees and are as of 03/31/2021. All returns for periods longer than one year are annualized. Produced by Backend Benchmarking for BackendB.com
*^These portfolios hold balanced funds. The nature of these funds limits our ability to accurately breakdown equity and fixed income performance individually.
29

Retirement Returns: Total Performance
Total Portfolio
1Q 2021
1Q 2021Return vs.
Benchmark 1-Year
1-YearReturn vs.
Benchmark 2-Year
2-YearReturn vs.
Benchmark 3-Year
3-YearReturn vs.
Benchmark 4-Year
4-YearReturn vs.
Benchmark 5-Year
5-YearReturn vs.
Benchmark
Ally InvestManagedPortfolios IRA9 7.44% 2.31% 57.74% 3.41% 16.90% -0.27% 11.64% -0.63% 12.04% -0.63% - -
Axos Invest IRA25 5.00% -0.05% 53.27% -0.40% 16.92% -0.12% 12.03% -0.16% 12.48% -0.09% 13.02% -0.05%
Betterment IRA27 6.09% 1.45% 52.58% 2.15% 15.54% -0.83% 10.71% -1.06% 11.13% -0.96% - -
4.26% -0.30% - - - - - - - - - -
E*Trade Core IRA21 7.95% 2.40% 63.78% 6.12% 17.99% 0.16% 12.49% -0.20% 12.72% -0.43% - -
Fidelity Go IRA33 4.61% 0.14% 47.53% -1.61% 15.97% -0.13% 11.94% 0.34% 11.99% 0.10% - -
Marcus Invest(Goldman Sachs)IRA3 7.00% 1.37% 56.31% -2.01% 16.87% -1.08% - - - - - -
Merrill EdgeGuided InvestingIRA31 6.35% 1.21% 52.52% -1.30% 16.09% -0.92% 11.32% -0.86% - - - -
Morgan StanleyIRA7 5.09% 1.19% 44.88% -0.35% 14.48% -0.75% 9.98% -1.06% - - - -
Personal CapitalIRA4 6.53% 1.16% 55.62% -0.65% 15.45% -2.10% 11.04% -1.47% 11.04% -1.91% - -
PrincipalSimpleInvest IRA7 5.96% 0.42% 55.69% -1.95% - - - - - - - -
Schwab IRA20 9.25% 4.04% 59.43% 4.44% 14.24% -3.06% 9.38% -2.98% 10.18% -2.58% 11.31% -1.97%
SigFig IRA6 4.67% -0.30% 50.24% -2.78% 14.41% -2.49% 10.03% -2.08% 11.05% -1.42% 11.78% -1.18%
SoFi IRA18 5.34% -0.36% 59.10% 0.12% 19.51% 1.43% 13.10% 0.26% - - - -
T Rowe PriceActivePlusPortfolios IRA13 6.84% 1.14% 63.98% 5.00% 19.28% 1.20% 13.58% 0.74% - - - -
TD AmeritradeIRA10 4.41% 0.02% 48.87% 0.37% 15.80% -0.16% 11.12% -0.39% 11.55% -0.23% - -
TIAA PersonalPortfolio IRA7 4.44% -0.28% 49.28% -1.79% 16.15% -0.35% 11.45% -0.40% - - - -
United IncomeIRA16 3.66% -1.96% 45.88% -12.43% 10.46% -7.49% 6.10% -6.66% - - - -
Wells FargoIntuitive InvestorIRA14 5.60% 0.63% 61.56% 8.54% 17.51% 0.61% 11.90% -0.21% - - - -
Zack's AdvantageIRA4 6.97% 1.59% 56.88% 0.57% 17.18% -0.21% 11.97% -0.45% - - - -
Returns are net of fees and are as of 03/31/2021. All returns for periods longer than one year are annualized. Produced by Backend Benchmarking for BackendB.com
30
blooom IRA41

Retirement Returns: Equity and Fixed Income Returns
Equity Fixed Income
1Q 2021 1-Year 2-Year 3-Year 4-Year 5-Year 1Q 2021 1-Year 2-Year 3-Year 4-Year 5-Year
Ally Invest ManagedPortfolios IRA9 7.94% 62.19% 17.52% 11.93% 12.50% - -3.05% 1.86% 4.09% 4.48% 3.67% -
Axos Invest IRA25 5.72% 58.41% 17.92% 12.61% 13.20% 13.83% -2.64% 6.56% 5.95% 5.30% 4.35% 4.09%
Betterment IRA27 7.32% 60.09% 16.48% 11.17% 11.86% - -3.01% 5.29% 4.44% 4.28% 3.85% -
5.59% - - - - - -3.54% - - - - -
E*Trade Core IRA21 8.03% 64.95% 18.27% 12.69% 12.96% - - - - - - -
Fidelity Go IRA33 5.99% 57.44% 17.78% 13.10% 13.39% - -3.57% 0.11% 4.37% 4.34% 3.42% -
Marcus Invest (GoldmanSachs) IRA3 7.10% 57.31% 17.08% - - - - - - - - -
Merrill Edge GuidedInvesting IRA31 6.97% 58.06% 17.55% 12.21% - - -2.61% 4.11% -1.11% 0.36% - -
Morgan Stanley IRA7 6.78% 58.48% 16.79% 11.20% - - -2.76% 1.12% 3.86% 4.08% - -
Personal Capital IRA4 7.10% 59.39% 16.11% 11.49% 11.46% - -3.11% 4.74% 3.90% 2.22% 2.32% -
Principal SimpleInvestIRA7 6.19% 57.30% - - - - - - - - - -
Schwab IRA20 9.90% 64.54% 15.20% 10.00% 10.86% 12.08% - - - - - -
SigFig IRA6 5.65% 55.09% 15.62% 10.70% 11.94% 12.69% -5.18% 11.41% 3.36% 3.65% 3.02% 3.68%
SoFi IRA18 5.34% 59.13% 19.54% 13.12% - - - - - - - -
T Rowe Price ActivePlusPortfolios IRA13 6.84% 63.98% 19.30% 13.59% - - - - - - - -
TD Ameritrade IRA10 5.62% 58.48% 17.86% 12.49% 13.12% - -3.70% 1.93% 3.67% 3.15% 2.88% -
TIAA Personal PortfolioIRA7 5.43% 57.58% 17.57% 12.21% - - -2.84% 2.53% 4.62% 4.46% - -
United Income IRA16 3.72% 46.55% 10.28% 6.01% - - - - - - - -
Wells Fargo IntuitiveInvestor IRA14 6.46% 67.33% 18.60% 12.52% - - -4.31% 5.65% 1.83% 2.72% - -
Zack's Advantage IRA4 7.56% 60.89% 18.34% 12.82% - - - - - - - -
Returns are net of fees and are as of 03/31/2021. All returns for periods longer than one year are annualized. Produced by Backend Benchmarking for BackendB.com*^These portfolios hold balanced funds. The nature of these funds limits our ability to accurately breakdown equity and fixed income performance individually.
31
blooom IRA41

Portfolio Account Minimum Advisory Fee
WeightedAverageExpense
Ratio
Initial Target AssetAllocation
(Equities/ FixedIncome/
Miscellaneous/Cash)
Current AssetAllocation
(Equities/ FixedIncome/
Miscellaneous/Cash)
InitialDomestic/
InternationalEquity Split
CurrentDomestic/
InternationalEquity Split
Tax E�ciencyRatio (% Muni
Bonds ofOverall Fixed
Income)
Acorns No minimum$1/month for Lite; $3/month forPersonal; $5/month for Family 0.05% 61%/39%/0%/0% 65%/35%/0%/0% 84%/16% 70%/30% 0%
Ally InvestManagedPortfolios $100
0.30% annually; Also offers'cash-enhanced' portfolio with 30%invested in cash and nomanagement fee 0.06% 59%/39%/0%/2% 59%/39%/0%/2% 59%/41% 60%/40% 0%
Axos Invest $500 0.24% annually 0.09% 64%/36%/0%/0% 64%/36%/0%/0% 62%/38% 63%/37% 0%
BBVA SmartPath $10,000 0.75% annually 0.12% 57%/39%/3%/1% 58%/37%/3%/1% 63%/37% 63%/37% 0%
Beanstox $100 $5/month 0.18% 60%/40%/0%/0% 59%/19%/0%/21% 84%/16% 82%/18% 100%
Betterment
Digital: Nominimum;Premium: $100,000 Digital: 0.25%; Premium: 0.40% 0.09% 65%/35%/0%/0% 65%/35%/0%/0% 49%/51% 58%/42% 37%
BettermentBroad ImpactSRI
Digital: Nominimum;Premium: $100,000 Digital: 0.25%; Premium: 0.40% 0.15% 60%/40%/0%/0% 62%/38%/0%/0% 50%/50% 51%/49% 60%
BettermentClimate ImpactSRI
Digital: Nominimum;Premium:$100,000 Digital: 0.25%; Premium: 0.40% 0.20% 60%/40%/0%/0% 62%/38%/0%/0% 78%/22% 58%/42% 37%
BettermentGoldman SachsSmart Beta
Digital: Nominimum;Premium: $100,000 Digital: 0.25%; Premium: 0.40% 0.11% 60%/40%/0%/0% 60%/40%/0%/0% 57%/43% 71%/29% 34%
BettermentIncome
Digital: Nominimum;Premium: $100,000 Digital: 0.25%; Premium: 0.40% 0.18% 0%/100%/0%/0% 0%/100%/0%/0% N/A N/A 0%
BettermentSocial ImpactSRI
Digital: Nominimum;Premium:$100,000 Digital: 0.25%; Premium: 0.40% 0.17% 60%/40%/0%/0% 62%/37%/0%/0% 57%/43% 57%/43% 37%
Betterment SRI(legacy)
Digital: Nominimum;Premium: $100,000 Digital: 0.25%; Premium: 0.40% 0.14% 60%/40%/0%/0% 60%/40%/0%/0% 50%/50% 50%/50% 59%
Citi WealthBuilder $1,500
0.55% annually; discountedrelationship pricing may beavailable 0.16% 61%/36%/0%/3% 66%/32%/0%/2% 72%/28% 83%/17% 1%
Citizens BankSpeciFi $2,000 0.50% annually 0.08% 64%/36%/0%/1% 64%/36%/0%/0% 54%/46% 55%/45% 0%
Current allocations as of 03/31/2021. Due to rounding, may not add to 100%. Produced by Backend Benchmarking for BackendB.comWeighted average expense ratio calculations exclude cash holdings from the portfolio.
32
Taxable Account Facts

Portfolio Account Minimum Advisory Fee
WeightedAverageExpense
Ratio
Initial Target AssetAllocation
(Equities/ FixedIncome/
Miscellaneous/Cash)
Current AssetAllocation
(Equities/ FixedIncome/
Miscellaneous/Cash)
InitialDomestic/
InternationalEquity Split
CurrentDomestic/
InternationalEquity Split
TaxE�ciencyRatio (%
Muni Bondsof Overall
FixedIncome)
E*Trade Core $500 0.30% annually 0.05% 60%/39%/0%/1% 60%/38%/0%/1% 75%/25% 66%/34% 0%
E*Trade CoreSmart Beta $500 0.30% annually 0.12% 61%/35%/0%/3% 60%/39%/0%/1% 65%/35% 66%/34% 100%
E*Trade Core SRI $500 0.30% annually 0.14% 61%/35%/0%/4% 60%/39%/0%/1% 65%/35% 66%/34% 100%
EdelmanFinancialEngines (EMAP) $5,000
1.75%; discounted tiered pricingat higher asset levels 0.12% 67%/30%/0%/3% 69%/28%/0%/4% 80%/20% 76%/24% 0%
Ellevest
No minimum;Private Client: $1million
$1/month for Essential; $5/monthfor Plus; $9/month for Executive 0.07% 62%/36%/0%/2% 57%/42%/0%/1% 71%/29% 62%/38% 96%
Ellevest SRI
No minimum;Private Client: $1million
$1/month for Essential; $5/monthfor Plus; $9/month for Executive 0.16% 56%/43%/0%/1% 46%/53%/0%/1% 63%/37% 63%/37% 84%
Fidelity Go
Digital Only: NoMinimum;PersonalizedPlanning & Advice:$25,000
Digital Only: for balances lessthan $10,000 there is no fee, forbalances between $10,000 -$49,999.99 it is $3/mo, forbalances $50,000 and above it is0.35% annually. PersonalizedPlanning & Advice: 0.50%annually 0.00% 61%/39%/0%/0% 60%/39%/0%/1% 71%/29% 71%/29% 100%
Fifth Third BankOptiFi $5,000 0.50% annually 0.19% 60%/40%/0%/1% 59%/40%/0%/1% 70%/30% 70%/30% 100%
FutureAdvisor $5,000 0.50% annually 0.06% 58%/41%/0%/1% 57%/42%/0%/1% 49%/51% 74%/26% 0%
InteractiveAdvisors
$100 minimum.Some portfolioselections requirea higher minimum
Fee between 0.08% - 1.5%annually depending on portfolioselection 0.13% 54%/46%/0%/0% 56%/43%/0%/1% 55%/45% 56%/44% 32%
InteractiveAdvisors LeggMason GlobalGrowth andIncome
$100 minimum.Some portfolioselections requirea higher minimum
Fee between 0.08% - 1.5%annually depending on portfolioselection 0.48% 69%/29%/0%/2% 71%/28%/0%/2% 79%/21% 70%/30% 0%
Current allocations as of 03/31/2021. Due to rounding, may not add to 100%. Produced by Backend Benchmarking for BackendB.comWeighted average expense ratio calculations exclude cash holdings from the portfolio.
33
Taxable Account F acts (continued from previous page)

Portfolio Account Minimum Advisory Fee
WeightedAverageExpense
Ratio
Initial Target AssetAllocation
(Equities/ FixedIncome/
Miscellaneous/Cash)
Current AssetAllocation
(Equities/ FixedIncome/
Miscellaneous/Cash)
InitialDomestic/
InternationalEquity Split
CurrentDomestic/
InternationalEquity Split
TaxE�ciency
Ratio (% MuniBonds of
Overall FixedIncome)
Interactive AdvisorsState Street Moderate
$100 minimum. Someportfolio selectionsrequire a higherminimum
Fee between 0.08% - 1.5%annually depending onportfolio selection 0.25% 64%/31%/2%/3% 67%/26%/5%/2% 66%/34% 64%/36% 0%
Interactive AdvisorsWisdom TreeModerate Aggressive
$100 minimum. Someportfolio selectionsrequire a higherminimum
Fee between 0.08% - 1.5%annually depending onportfolio selection 0.27% 54%/30%/14%/2% 55%/36%/7%/1% 62%/38% 64%/36% 1%
JP Morgan ChaseAutomated Investing $500
0.35% annually. JP MorganETF expenses will berebated or offset against themanagement fee 0.11% 50%/48%/0%/2% 54%/44%/0%/2% 55%/45% 58%/42% 0%
Liftoff (RitholtzWealth Management) No minimum 0.50% annually 0.08% 60%/40%/0%/0% 61%/39%/0%/0% 57%/43% 58%/42% 37%
M1 Finance
$100 minimum fortaxable accounts,$500 minimum forretirement accounts No management fee 0.05% 66%/34%/0%/0% 68%/31%/0%/0% 61%/39% 64%/36% 0%
M1 Finance SRI
$100 minimum fortaxable accounts,$500 minimum forretirement accounts No management fee 0.39% 100%/0%/0%/0% 98%/0%/0%/2% 69%/31% 71%/29% N/A
Merrill Edge GuidedInvesting
Guided Investing:$1,000;Guided Investing withan Advisor: $20,000
Guided Investing: 0.45%annually (digital only);Guided Investing with anAdvisor: 0.85% annually 0.07% 60%/39%/0%/1% 65%/32%/0%/3% 66%/34% 73%/27% 72%
Merrill Edge GuidedInvesting SRI
Guided Investing:$1,000;Guided Investing withan Advisor: $20,000
Guided Investing: 0.45%annually (digital only);Guided Investing with anAdvisor: 0.85% annually 0.17% 59%/37%/0%/4% 65%/30%/0%/4% 65%/35% 72%/28% 0%
Morgan Stanley Active $5,000 0.35% annually 0.40% 64%/35%/0%/1% 70%/29%/0%/1% 44%/56% 52%/48% 0%
Morgan StanleyDefense and CyberSecurity $5,000 0.35% annually 0.45% 64%/29%/0%/8% 75%/24%/0%/1% 58%/42% 60%/40% 0%
Morgan StanleyEmerging Consumer $5,000 0.35% annually 0.49% 64%/29%/0%/8% 75%/23%/0%/1% 57%/43% 39%/61% 0%
Morgan StanleyGender Diversity $5,000 0.35% annually 0.44% 60%/37%/0%/3% 67%/32%/0%/1% 68%/32% 69%/31% 9%
Current allocations as of 03/31/2021. Due to rounding, may not add to 100%. Produced by Backend Benchmarking for BackendB.comWeighted average expense ratio calculations exclude cash holdings from the portfolio.
34
Taxable Account F acts (continued from previous page)

Portfolio Account Minimum Advisory Fee
WeightedAverageExpense
Ratio
Initial TargetAsset Allocation(Equities/ Fixed
Income/Miscellaneous/
Cash)
Current AssetAllocation
(Equities/ FixedIncome/
Miscellaneous/Cash)
InitialDomestic/
CurrentDomestic/
TaxE�ciencyRatio (%
Muni Bondsof Overall
FixedIncome)
Morgan StanleyGenomics $5,000 0.35% annually 0.43% 49%/45%/0%/6% 61%/38%/0%/1% 56%/44% 60%/40% 0%
Morgan StanleyGlobal Frontier $5,000 0.35% annually 0.59% 66%/29%/0%/5% 74%/25%/0%/1% 40%/60% 43%/57% 0%
Morgan StanleyInflation Conscious $5,000 0.35% annually 0.46% 58%/30%/3%/9% 68%/29%/2%/1% 63%/37% 64%/36% 0%
Morgan StanleyMarket-Tracking $5,000 0.35% annually 0.07% 65%/30%/0%/5% 68%/31%/0%/1% 45%/55% 49%/51% 0%
Morgan StanleyRobotics $5,000 0.35% annually 0.47% 66%/28%/0%/5% 73%/27%/0%/1% 52%/48% 56%/44% 0%
Morgan Stanley SRI $5,000 0.35% annually 0.48% 64%/35%/0%/1% 65%/34%/0%/1% 56%/44% 64%/36% 9%
Personal Capital $100,000
0.89% annually; discountedtiered pricing at higher assetlevels 0.10% 69%/25%/5%/1% 73%/22%/4%/1% 70%/30% 71%/29% 0%
Qapital $10
Complete: $6 per month;Master: $12 per month foradditional non-investingfeatures 0.14% 67%/29%/0%/4% 70%/27%/0%/3% 70%/30% 72%/28% 0%
Schwab
IntelligentPortfolios: $5,000;Intelligent PortfoliosPremium: $25,000
Intelligent Portfolios: No fee(digital only); IntelligentPortfolios Premium: $300initial planning fee, $30/monthsubscription 0.18% 61%/23%/5%/10% 59%/30%/1%/10% 51%/49% 52%/48% 52%
Schwab DomesticFocus
IntelligentPortfolios: $5,000;Intelligent PortfoliosPremium: $25,000
Intelligent Portfolios: No fee(digital only); IntelligentPortfolios Premium: $300initial planning fee, $30/monthsubscription 0.12% 65%/25%/0%/11% 64%/26%/0%/10% 78%/22% 75%/25% 60%
SigFig $2,000No fee for the first $10k; 0.25%annually for balance over $10k 0.06% 62%/37%/0%/1% 64%/35%/0%/1% 58%/42% 60%/40% 0%
SoFi $1 No management fee 0.04% 52%/48%/0%/0% 66%/34%/0%/0% 67%/33% 70%/30% 65%
Sustainfolio $5,000 0.50% annually 0.23% 58%/40%/0%/2% 59%/36%/0%/5% 71%/29% 73%/27% 0%
Current allocations as of 03/31/2021. Due to rounding, may not add to 100%. Produced by Backend Benchmarking for BackendB.comWeighted average expense ratio calculations exclude cash holdings from the portfolio.
35
Taxable Account F acts (continued from previous page)
InternationalEquity Split
InternationalEquity Split

Taxable Account Facts (continued from previous page)
Portfolio Account Minimum Advisory Fee
WeightedAverageExpense
Ratio
Initial Target AssetAllocation
(Equities/ FixedIncome/
Miscellaneous/Cash)
Current AssetAllocation (Equities/
Fixed Income/Miscellaneous/ Cash)
InitialDomestic/
InternationalEquity Split
CurrentDomestic/
InternationalEquity Split
TaxE�ciency
Ratio (% MuniBonds of
Overall FixedIncome)
TD AmeritradeSelective Portfolios:$25,000
Selective Portfolios:0.75%-0.90% dependingon portfolio selection;discounted tiered pricingat higher asset levels 0.05% 65%/33%/0%/1% 73%/26%/0%/1% 65%/35% 58%/42% 0%
TD AmeritradeIncome
Selective Portfolios:$25,000
Selective Portfolios:0.75%-0.90% dependingon portfolio selection;discounted tiered pricingat higher asset levels 0.59% 21%/78%/0%/1% 23%/76%/0%/1% 72%/38% 53%/47% 0%
TD AmeritradeManaged Risk
Selective Portfolios:$25,000
Selective Portfolios:0.75%-0.90% dependingon portfolio selection;discounted tiered pricingat higher asset levels 1.30% 9%/49%/41%/1% 9%/49%/41%/1% N/A N/A 0%
TD AmeritradeOpportunistic
Selective Portfolios:$25,000
Selective Portfolios:0.75%-0.90% dependingon portfolio selection;discounted tiered pricingat higher asset levels 0.13% 43%/53%/0%/4% 55%/44%/0%/1% 53%/47% 64%/36% 0%
TD AmeritradeSRI
Selective Portfolios:$25,000
Selective Portfolios:0.75%-0.90% dependingon portfolio selection;discounted tiered pricingat higher asset levels 0.26% 67%/29%/0%/3% 73%/26%/0%/1% 59%/41% 59%/41% 0%
TIAA PersonalPortfolio Active $5,000 0.30% annually 0.64% 73%/26%/0%/1% 62%/36%/0%/2% 66%/34% 62%/38% 0%
TIAA PersonalPortfolio $5,000 0.30% annually 0.07% 61%/37%/0%/2% 60%/38%/0%/2% 71%/29% 63%/37% 0%
TIAA PersonalPortfolio SRI $5,000 0.30% annually 0.34% 60%/39%/0%/1% 61%/37%/0%/2% 71%/29% 63%/37% 3%
Titan Invest
$100 minimum forTitan Flagship;$10,000 relationshipminimum for TitanOpportunities
For deposits of $10,000 ormore, 1% annually. Fordeposits less than $10,000,$5 monthly instead 0.03% 100%/0%/0%/0% 99%/0%/0%/1% 100%/0% 96%/4% N/A
Current allocations as of 03/31/2021. Due to rounding, may not add to 100%. Produced by Backend Benchmarking for BackendB.comWeighted average expense ratio calculations exclude cash holdings from the portfolio.
36

PortfolioAccountMinimum Advisory Fee
WeightedAverageExpense
Ratio
Initial Target AssetAllocation (Equities/
Fixed Income/Miscellaneous/ Cash)
Current AssetAllocation (Equities/
Fixed Income/Miscellaneous/ Cash)
InitialDomestic/
InternationalEquity Split
CurrentDomestic/
InternationalEquity Split
Tax E�ciencyRatio (% Muni
Bonds ofOverall Fixed
Income)
Twine $5 0.60% annually 0.07% 69%/29%/0%/2% 70%/27%/0%/2% 64%/36% 65%/35% 0%
UBS AdviceAdvantage $5,000 0.75% annually 0.14% 68%/27%/0%/5% 72%/26%/0%/2% 59%/41% 59%/41% 80%
UnitedIncome No minimum
0.99% annually;discounted tiered pricingat higher asset levels 0.16% 59%/40%/0%/1% 62%/37%/0%/1% 51%/49% 59%/41% 0%
US BankAutomatedInvestor $5,000 0.24% annually 0.16% 60%/39%/0%/1% 58%/40%/0%/2% 59%/41% 68%/32% 89%
VanguardDigitalAdvisor
VanguardPersonal AdvisorServices:$50,000;Vanguard DigitalAdvisor: $3,000
Vanguard PersonalAdvisor Services 0.30%annually. Vanguard DigitalAdvisor combinedunderlying fund fees andmanagement fees cappedat 0.20% 58%/38%/0%/4% 61%/37%/0%/2% 59%/41% 69%/31% 1%
VanguardP.A.S.
VanguardPersonal AdvisorServices:$50,000;Vanguard DigitalAdvisor: $3,000
Vanguard PersonalAdvisor Services 0.30%annually. Vanguard DigitalAdvisor combinedunderlying fund fees andmanagement fees cappedat 0.20% 0.07% 60%/40%/0%/0% 64%/36%/0%/0% 60%/40% 69%/31% 100%
Wahed Invest $100
0.79% annually forbalances under $100,000;0.49% annually forbalances above $100,000 0.50% 52%/34%/13%/1% 53%/33%/12%/1% 100%/0% 100%/0% 0%
Wealthfront
$500, someadditionalportfolio featuresrequire a higherminimum 0.25% annually 0.10% 65%/35%/0%/0% 68%/32%/0%/0% 67%/33% 67%/33% 100%
Current allocations as of 03/31/2021. Due to rounding, may not add to 100%. Produced by Backend Benchmarking for BackendB.comWeighted average expense ratio calculations exclude cash holdings from the portfolio.
37
0.05%
Taxable Account F acts (continued from previous page)

PortfolioAccountMinimum Advisory Fee
WeightedAverageExpense
Ratio
Initial Target AssetAllocation
(Equities/ FixedIncome/
Miscellaneous/Cash)
Current AssetAllocation
(Equities/ FixedIncome/
Miscellaneous/Cash)
InitialDomestic/
InternationalEquity Split
CurrentDomestic/
InternationalEquity Split
Tax E�ciency Ratio(% Muni Bonds of
Overall FixedIncome)
WealthfrontPassivePlus
$500, someadditionalportfolio featuresrequire a higherminimum 0.25% annually 0.14% 45%/35%/19%/0% 51%/32%/17%/0% 60%/40% 61%/39% 100%
Wells FargoIntuitive Investor $5,000
0.35% annually;discountedrelationship pricingmay be available 0.13% 63%/34%/0%/3% 62%/35%/0%/3% 77%/23% 76%/24% 0%
Zacks Advantage $25,000
0.70% annually;discounted tieredpricing at higherasset levels 0.09% 57%/34%/0%/9% 61%/33%/0%/7% 72%/28% 83%/17% 94%
Current allocations as of 03/31/2021. Due to rounding, may not add to 100%. Produced by Backend Benchmarking for BackendB.comWeighted average expense ratio calculations exclude cash holdings from the portfolio.
38
Taxable Account F acts (continued from previous page)

Retirement Account Facts
Portfolio Account Minimum Advisory Fee
WeightedAverageExpense
Ratio
Initial Target AssetAllocation (Equities/
Fixed Income/Miscellaneous/
Cash)
Current AssetAllocation
(Equities/ FixedIncome/
Miscellaneous/Cash)
InitialDomestic/
InternationalEquity Split
CurrentDomestic/
InternationalEquity Split
Ally Invest ManagedPortfolios IRA $100
0.30% annually; Also offers'cash-enhanced' portfolio with 30%invested in cash and no management fee 0.05% 93%/5%/0%/2% 93%/5%/0%/2% 60%/40% 60%/40%
Axos Invest IRA $500 0.24% annually 0.05% 92%/8%/0%/0% 92%/8%/0%/0% 60%/40% 61%/39%
Betterment IRADigital: No minimum;Premium: $100,000 Digital: 0.25%; Premium: 0.40% 0.06% 87%/13%/0%/0% 87%/13%/0%/0% 47%/53% 58%/42%
No minimumEssentials: $45/year; Standard:$120/year; Unlimited: $250/year 0.07% 86%/14%/0%/0% 87%/13%/0%/0% 65%/35% 65%/35%
E*Trade Core IRA $500 0.30% annually 0.07% 98%/0%/0%/2% 99%/0%/0%/1% 75%/25% 66%/34%
Fidelity Go IRA
Digital Only: NoMinimum;Personalized Planning& Advice: $25,000
Digital Only: for balances less than$10,000 there is no fee, for balancesbetween $10,000 - $49,999.99 it is$3/mo, for balances $50,000 and above itis 0.35% annually. Personalized Planning& Advice: 0.50% annually 0.00% 85%/14%/0%/1% 85%/14%/0%/0% 71%/29% 71%/29%
Marcus Invest(Goldman Sachs)IRA $1,000 0.25% annually 0.05% 99%/0%/0%/1% 99%/0%/0%/1% 68%/32% 72%/28%
Merrill Edge GuidedInvesting IRA
Guided Investing:$1,000;Guided Investing withan Advisor: $20,000
Guided Investing: 0.45% annually (digitalonly); Guided Investing with an Advisor:0.85% annually 0.05% 89%/9%/0%/2% 93%/3%/0%/4% 64%/36% 71%/29%
Morgan Stanley IRA $5,000 0.35% annually 0.07% 79%/15%/0%/6% 83%/15%/0%/2% 47%/53% 50%/50%
Personal Capital IRA $100,0000.89% annually; discounted tieredpricing at higher asset levels 0.08% 91%/3%/2%/4% 94%/3%/2%/1% 69%/31% 71%/29%
PrincipalSimpleInvest IRA $1,000
0.40% annually. Combined fee betweenfund fees and management fee cappedat 0.85% 0.50% 98%/0%/0%/2% 98%/0%/0%/2% 64%/36% 66%/34%
Schwab IRA
Intelligent Portfolios:$5,000; IntelligentPortfolios Premium:$25,000
Intelligent Portfolios: No fee (digital only);Intelligent Portfolios Premium: $300initial planning fee, $30/monthsubscription 0.19% 94%/0%/0%/6% 94%/0%/0%/6% 54%/46% 53%/47%
SigFig IRA $2,000No fee for the first $10k; 0.25% annuallyfor balance over $10k 0.08% 91%/9%/0%/0% 91%/8%/0%/1% 45%/55% 47%/53%
SoFi IRA $1 No management fee 0.02% 100%/0%/0%/0% 100%/0%/0%/0% 66%/34% 70%/30%
Current allocations as of 03/31/2021. Due to rounding, may not add to 100%. Produced by Backend Benchmarking for BackendB.comWeighted average expense ratio calculations exclude cash holdings from the portfolio.
39
blooom IRA

Retirement Account Facts (continued from previous page)
Portfolio Account Minimum Advisory Fee
WeightedAverageExpense
Ratio
Initial TargetAsset Allocation(Equities/ Fixed
Income/Miscellaneous/
Cash)
Current AssetAllocation
(Equities/ FixedIncome/
Miscellaneous/Cash)
InitialDomestic/
InternationalEquity Split
CurrentDomestic/
InternationalEquity Split
T Rowe PriceActivePlusPortfolios IRA $50,000 No management fee 0.79% 100%/0%/0%/0% 100%/0%/0%/0% 63%/37% 64%/36%
TD Ameritrade IRASelective Portfolios:$25,000
Selective Portfolios: 0.75%-0.90%depending on portfolio selection;discounted tiered pricing at higherasset levels 0.05% 83%/15%/0%/1% 87%/11%/0%/2% 65%/35% 61%/39%
TIAA PersonalPortfolio IRA $5,000 0.30% annually 0.06% 88%/11%/0%/1% 88%/11%/0%/2% 72%/28% 61%/39%
United Income IRA No minimum0.99% annually; discounted tieredpricing at higher asset levels 0.21% 99%/0%/0%/1% 98%/0%/0%/2% 51%/49% 57%/43%
Wells FargoIntuitive InvestorIRA $5,000
0.35% annually; discountedrelationship pricing may be available 0.12% 91%/7%/0%/2% 91%/7%/0%/2% 67%/33% 67%/33%
Zack's AdvantageIRA $25,000
0.70% annually; discounted tieredpricing at higher asset levels 0.10% 93%/0%/0%/7% 94%/0%/1%/4% 62%/38% 84%/16%
Current allocations as of 03/31/2021. Due to rounding, may not add to 100%. Produced by Backend Benchmarking for BackendB.comWeighted average expense ratio calculations exclude cash holdings from the portfolio.
40

International Allocation of Total Equity for Taxable Robos
41
0%
10%
20%
30%
40%
50%
60%
70%
80%
90%
100%
International Equities Domestic Equities
0%
10%
20%
30%
40%
50%
60%
70%
80%
90%
100%
International Equities Domestic Equities

Taxable Risk/Return Charts and Tables
5-Year Risk/Return Statistics of Taxable Robos
Acorns Axos Invest BettermentPersonalCapital Schwab SigFig Vanguard P.A.S.
Standard Deviation 11.83% 12.17% 12.67% 12.92% 12.77% 11.59% 11.46%
Sharpe Ratio 0.66 0.77 0.69 0.67 0.65 0.81 0.75
This analysis was produced by Backend Analytics with the help of Markov Process International, Inc.
42
0%
2%
4%
6%
8%
10%
12%
14%
16%
18%
0
0.1
0.2
0.3
0.4
0.5
0.6
0.7
0.8
0.9
SigFig Axos Invest Vanguard P.A.S. Betterment Personal Capital Acorns Schwab
Sta
nd
ard
Dev
iati
on
Sha
rpe
Ra
tio
Sharpe Ratio Standard Deviation

3-Year Risk/Return Statistics of Taxable Robos
AcornsAlly Invest Managed
Portfolios Axos Invest BettermentBettermentSRI (legacy) E*Trade Core Ellevest Fidelity Go
Standard Deviation 14.05% 13.00% 14.53% 15.07% 14.12% 13.94% 13.50% 13.43%
Sharpe Ratio 0.60 0.62 0.66 0.56 0.58 0.64 0.58 0.66
FutureAdvisorMerrill Edge Guided
InvestingMorgan Stanley
Market-TrackingMorgan
Stanley SRIPersonalCapital Schwab SigFig SoFi
Standard Deviation 12.82% 13.85% 13.89% 11.96% 15.34% 15.23% 13.64% 13.12%
Sharpe Ratio 0.58 0.59 0.58 0.73 0.56 0.46 0.67 0.67
TD AmeritradeTIAA Personal
PortfolioTIAA PersonalPortfolio SRI United Income Vanguard P.A.S. Wealthfront
Wells FargoIntuitiveInvestor Zacks Advantage
Standard Deviation 15.17% 13.55% 13.58% 13.02% 13.79% 15.52% 15.45% 14.00%
Sharpe Ratio 0.61 0.63 0.67 0.38 0.62 0.60 0.63 0.63
This analysis was produced by Backend Analytics with the help of Markov Process International, Inc.
43
0%
2%
4%
6%
8%
10%
12%
14%
16%
0
0.1
0.2
0.3
0.4
0.5
0.6
0.7
0.8
Sta
nd
ard
Dev
iati
on
Sha
rpe
Ra
tio
Sharpe Ratio Standard Deviation

1-Year Risk/Return Statistics of Taxable Robos
44
0%
4%
8%
12%
16%
20%
24%
28%
32%
36%
0
0.5
1
1.5
2
2.5
3
3.5
4
4.5
Sta
nd
ard
Dev
iati
on
Sha
rpe
Ra
tio
Sharpe Ratio Standard Deviation
0%
4%
8%
12%
16%
20%
24%
28%
32%
36%
0
0.5
1
1.5
2
2.5
3
3.5
4
4.5
Sta
nd
ard
Dev
iati
on
Sha
rpe
Ra
tio
Sharpe Ratio Standard Deviation

1-Year Risk/Return Statistics of Taxable Robos
AcornsAlly Invest Managed
Portfolios Axos Invest BBVA SmartPath BettermentBetterment Goldman
Sachs Smart BetaBetterment
IncomeBettermentSRI (legacy)
Standard Deviation 13.44% 12.43% 13.74% 11.48% 14.53% 13.47% 1.48% 13.38%
Sharpe Ratio 2.21 2.38 2.37 2.21 2.38 2.24 2.07 2.35
Citi WealthBuilder
Citizens BankSpeciFi E*Trade Core
E*Trade CoreSmart Beta E*Trade Core SRI
Edelman FinancialEngines (EMAP) Ellevest Ellevest SRI
Standard Deviation 13.65% 13.56% 13.60% 13.17% 13.50% 14.16% 12.34% 10.80%
Sharpe Ratio 2.39 2.37 2.43 2.31 2.36 2.33 2.39 2.38
Fidelity GoFifth ThirdBank OptiFi FutureAdvisor
InteractiveAdvisors
Interactive Advisors LeggMason Global Growth and
Income
InteractiveAdvisors State
Street Moderate
Interactive AdvisorsWisdom Tree
Moderate Aggressive
JP Morgan ChaseAutomatedInvesting
Standard Deviation 12.53% 12.53% 12.25% 11.69% 12.61% 13.64% 12.13% 10.28%
Sharpe Ratio 2.43 2.45 2.23 2.38 2.36 2.29 2.37 2.32
Liftoff (RitholtzWealth Management)
M1Finance
Merrill EdgeGuided
Investing
Merrill EdgeGuided
Investing SRIMorgan Stanley
Active
Morgan StanleyDefense and Cyber
Security
Morgan StanleyEmergingConsumer
Morgan StanleyGender
Diversity
Standard Deviation 13.38% 14.07% 13.19% 13.21% 13.28% 14.91% 14.71% 12.14%
Sharpe Ratio 2.38 2.45 2.32 2.46 2.47 2.30 2.47 2.47
Morgan StanleyGenomics
Morgan StanleyGlobal Frontier
Morgan StanleyInflation Conscious
Morgan StanleyMarket-Tracking
Morgan StanleyRobotics
MorganStanley SRI
PersonalCapital Qapital
Standard Deviation 11.93% 12.91% 19.88% 13.41% 15.64% 11.82% 15.25% 15.88%
Sharpe Ratio 2.39 2.56 1.73 2.37 2.64 2.51 2.35 2.22
SchwabSchwab Domestic
Focus SigFig SoFi TD AmeritradeTD Ameritrade
IncomeTD AmeritradeManaged Risk
TD AmeritradeOpportunistic
Standard Deviation 13.90% 15.44% 13.13% 12.37% 14.76% 4.60% 2.99% 11.97%
Sharpe Ratio 2.37 2.35 2.37 2.51 2.31 2.78 4.19 2.24
TD AmeritradeSRI
TIAA PersonalPortfolio Active
TIAA PersonalPortfolio
TIAA PersonalPortfolio SRI Titan Invest Twine
UBS AdviceAdvantage United Income
Standard Deviation 14.67% 12.69% 12.78% 12.52% 25.47% 14.96% 15.27% 11.98%
Sharpe Ratio 2.36 2.52 2.31 2.51 2.25 2.31 2.28 2.11
US BankAutomated
Investor
VanguardDigital
AdvisorVanguard
P.A.S. WealthfrontWealthfrontPassivePlus
Wells FargoIntuitiveInvestor
ZacksAdvantage
Standard Deviation 13.53% 12.28% 13.43% 15.04% 12.21% 15.26% 13.55%
Sharpe Ratio 2.41 2.39 2.33 2.38 2.28 2.38 2.33
This analysis was produced by Backend Analytics with the help of Markov Process International, Inc.
45

Retirement Risk/Return
5-Year Risk/Return Statistics of Retirement Robos
Axos Invest IRA Schwab IRA SigFig IRA
Standard Deviation 16.95% 17.02% 16.95%
Sharpe Ratio 0.74 0.63 0.67
This analysis was produced by Backend Analytics with the help of Markov Process International, Inc.
3-Year Risk/Return Statistics of Retirement Robos
Ally Invest ManagedPortfolios IRA
Axos Invest IRA BettermentIRA
E*Trade CoreIRA
Fidelity Go IRA Merrill Edge GuidedInvesting IRA
MorganStanley IRA
Personal CapitalIRA
Standard Deviation 21.03% 20.13% 19.35% 22.20% 18.35% 20.01% 17.04% 20.57%
Sharpe Ratio 0.56 0.59 0.55 0.58 0.63 0.56 0.56 0.54
SchwabIRA
SigFig IRA SoFi IRA T Rowe Price ActivePlusPortfolios IRA
TD AmeritradeIRA
TIAA PersonalPortfolio IRA
United IncomeIRA
Wells Fargo IntuitiveInvestor IRA
Zack'sAdvantage IRA
Standard Deviation 21.07% 20.03% 20.59% 22.74% 18.81% 19.10% 21.40% 21.03% 21.18%
Sharpe Ratio 0.46 0.51 0.63 0.61 0.58 0.59 0.32 0.57 0.57
This analysis was produced by Backend Analytics with the help of Markov Process International, Inc..
1-Year Risk/Return Statistics of Retirement Robos
Ally Invest ManagedPortfolios IRA
Axos InvestIRA
BettermentIRA
E*Trade CoreIRA
Fidelity GoIRA
Marcus Invest(Goldman Sachs) IRA
Merrill Edge GuidedInvesting IRA
Morgan StanleyIRA
Standard Deviation 20.24% 18.83% 18.61% 21.41% 17.37% 20.64% 19.15% 16.39%
Sharpe Ratio 2.36 2.37 2.37 2.42 2.33 2.27 2.30 2.35
Personal CapitalIRA
PrincipalSimpleInvest IRA
Schwab IRA SigFig IRA SoFi IRA T Rowe Price ActivePlusPortfolios IRA
TD AmeritradeIRA
TIAA PersonalPortfolio IRA
Standard Deviation 20.03% 19.91% 21.04% 18.62% 19.66% 21.50% 17.65% 17.96%
Sharpe Ratio 2.31 2.33 2.33 2.28 2.47 2.41 2.35 2.32
United IncomeIRA
Wells Fargo IntuitiveInvestor IRA
Zack's AdvantageIRA
Standard Deviation 20.12% 20.56% 20.56%
Sharpe Ratio 1.98 2.44 2.30
This analysis was produced by Backend Analytics with the help of Markov Process International, Inc.
46

Normalized Benchmark
Equity Portfolio
Category Asset Type Ticker NameCurrent Taxable
Benchmark WeightCurrent Retirement Benchmark
Weight
Equity Domestic VTI Vanguard Total Stock Market ETF 65% 62%
Equity International VXUS Vanguard Total International Stock ETF 35% 38%
Produced by Backend Benchmarking for BackendB.comBenchmark weights updated at the end of each calendar year. Benchmark updates do not affect performance prior to update.
Bond Portfolio
Category Asset Type Ticker NameCurrent Taxable
Benchmark WeightCurrent Retirement Benchmark
Weight
Fixed Income Multi-Sector US AGG iShares Core US Aggregate Bond ETF 29% 24%
Fixed Income Investment-Grade Corporates LQDiShares iBoxx $ Investment GradeCorporate Bond ETF 10% 3%
Fixed Income High-Yield Corporates JNKSPDR Bloomberg Barclays High YieldBond ETF 2% 5%
Fixed Income International Developed IGOViShares International Treasury BondETF 6% 4%
Fixed Income International Emerging Markets EMBiShares J.P. Morgan USD EmergingMarkets Bond ETF 4% 7%
Fixed Income Municipals MUB iShares National Muni Bond ETF 26% 0%
Fixed Income TIPS TIP iShares TIPS Bond ETF 5% 6%
Fixed Income Short-Term Treasuries (0-3 Year Maturity) VGSH Vanguard Short-Term Treasury ETF 4% 0%
Fixed IncomeIntermediate-Term Treasuries (3-10 YearMaturity) VGIT
Vanguard Intermediate-Term TreasuryETF 4% 4%
Fixed Income Long-Term Treasuries (10+ Year Maturity) VGLT Vanguard Long-Term Treasury ETF 1% 4%
Fixed Income Securitized VMBSVanguard Mortgage-Backed SecuritiesETF 1% 1%
Fixed Income Cash FDRXX Fidelity® Government Cash Reserves 8% 42%
Produced by Backend Benchmarking for BackendB.com
Benchmark weights updated at the end of each calendar year. Benchmark updates do not affect performance prior to update.
47

Taxable Normalized Benchmark Returns
1Q 2021 1-Year 2-Year 3-Year 4-Year 5-Year
Acorns Normalized Benchmark 2.35% 34.66% 13.23% 9.89% 9.94% 9.99%
Ally Invest Managed Portfolios Normalized Benchmark 2.26% 34.09% 13.09% 9.80% 9.72% -
Axos Invest Normalized Benchmark 2.69% 36.98% 13.77% 10.23% 10.21% 10.29%
BBVA SmartPath Normalized Benchmark 2.26% 34.00% 13.16% - - -
Beanstox Normalized Benchmark 2.35% - - - - -
Betterment Normalized Benchmark 2.77% 37.56% 13.90% 10.32% 10.30% 10.40%
Betterment Broad Impact SRI Normalized Benchmark 2.35% - - - - -
Betterment Climate Impact SRI Normalized Benchmark 2.35% - - - - -
Betterment Goldman Sachs Smart Beta Normalized Benchmark 2.35% 34.66% - - - -
Betterment Income Normalized Benchmark -2.74% 3.49% - - - -
Betterment Social Impact SRI Normalized Benchmark 2.35% - - - - -
Betterment SRI (legacy) Normalized Benchmark 2.35% 34.66% 13.23% 9.89% - -
Citi Wealth Builder Normalized Benchmark 2.60% 35.79% - - - -
Citizens Bank SpeciFi Normalized Benchmark 2.69% 36.98% 13.77% - - -
E*Trade Core Normalized Benchmark 2.35% 34.66% 13.23% 9.89% 9.82% -
E*Trade Core Smart Beta Normalized Benchmark 2.35% 35.13% 13.32% - - -
E*Trade Core SRI Normalized Benchmark 2.35% 35.13% 13.32% - - -
Edelman Financial Engines (EMAP) Normalized Benchmark 2.94% 38.74% 14.22% - - -
Ellevest Normalized Benchmark 2.01% 32.38% 12.68% 9.54% 9.57% -
Ellevest SRI Normalized Benchmark 1.16% 27.81% 11.25% - - -
Fidelity Go Normalized Benchmark 2.43% 35.24% 13.36% 9.97% 9.92% -
Fifth Third Bank OptiFi Normalized Benchmark 2.35% 34.66% 13.23% - - -
FutureAdvisor Normalized Benchmark 1.84% 32.60% 12.67% 9.54% 9.47% -
Interactive Advisors Normalized Benchmark 1.84% 31.24% 12.40% - - -
Interactive Advisors Legg Mason Global Growth and Income Normalized Benchmark 3.11% 39.92% - - - -
Interactive Advisors State Street Moderate Normalized Benchmark 2.35% 35.33% - - - -
Interactive Advisors Wisdom Tree Moderate Aggressive Normalized Benchmark 2.09% 32.94% - - - -
JP Morgan Chase Automated Investing Normalized Benchmark 1.56% 29.09% - - - -
Liftoff (Ritholtz Wealth Management) Normalized Benchmark 2.35% 34.66% - - - -
M1 Finance Normalized Benchmark 2.86% 38.15% - - - -
M1 Finance SRI Normalized Benchmark 5.76% - - - - -
Merrill Edge Guided Investing Normalized Benchmark 2.54% 35.38% 13.08% 9.83% 9.80% -
Merrill Edge Guided Investing SRI Normalized Benchmark 2.71% 36.43% 13.77% - - -
Morgan Stanley Active Normalized Benchmark 2.69% 36.98% 13.77% - - -
Morgan Stanley Defense and Cyber Security Normalized Benchmark 3.20% 40.30% - - - -
Morgan Stanley Emerging Consumer Normalized Benchmark 3.11% 39.92% - - - -
Morgan Stanley Gender Diversity Normalized Benchmark 2.43% 35.03% - - - -
Morgan Stanley Genomics Normalized Benchmark 1.92% 31.40% - - - -
Returns are net of fees and are as of 03/31/2021. All returns for periods longer than one year are annualized. Produced by Backend Benchmarking for BackendB.com
48

Taxable Normalized Benchmark Returns (continued from previous page)
1Q 2021 1-Year 2-Year 3-Year 4-Year 5-Year
Morgan Stanley Global Frontier Normalized Benchmark 3.11% 39.71% - - - -
Morgan Stanley Inflation Conscious Normalized Benchmark 2.69% 36.35% - - - -
Morgan Stanley Market-Tracking Normalized Benchmark 2.69% 36.77% 13.82% 10.26% - -
Morgan Stanley Robotics Normalized Benchmark 3.20% 40.30% - - - -
Morgan Stanley SRI Normalized Benchmark 2.09% 32.94% 12.88% 9.65% - -
Personal Capital Normalized Benchmark 3.46% 42.31% 14.96% 10.98% 11.06% 11.26%
Qapital Normalized Benchmark 2.94% 38.74% 14.17% - - -
Schwab Normalized Benchmark 2.09% 34.06% 12.73% 9.57% 9.75% 9.96%
Schwab Domestic Focus Normalized Benchmark 2.69% 36.33% - - - -
SigFig Normalized Benchmark 2.52% 35.82% 13.50% 10.06% 10.01% 10.08%
SoFi Normalized Benchmark 2.35% 34.66% 13.23% 9.95% - -
Sustainfolio Normalized Benchmark 2.18% - - - - -
TD Ameritrade Normalized Benchmark 3.28% 40.10% 14.62% 10.77% 10.72% -
TD Ameritrade Income Normalized Benchmark -0.96% 13.66% - - - -
TD Ameritrade Managed Risk Normalized Benchmark -1.47% 10.67% - - - -
TD Ameritrade Opportunistic Normalized Benchmark 1.92% 29.36% - - - -
TD Ameritrade SRI Normalized Benchmark 3.28% 40.15% 14.75% - - -
TIAA Personal Portfolio Active Normalized Benchmark 2.43% 35.24% 13.59% - - -
TIAA Personal Portfolio Normalized Benchmark 2.43% 35.24% 13.36% 9.97% - -
TIAA Personal Portfolio SRI Normalized Benchmark 2.35% 34.66% 13.23% 9.89% - -
Titan Invest Normalized Benchmark 5.76% 59.28% - - - -
Twine Normalized Benchmark 3.11% 39.92% 14.43% - - -
UBS Advice Advantage Normalized Benchmark 3.20% 40.51% 14.79% - - -
United Income Normalized Benchmark 2.26% 34.09% 13.09% 9.80% - -
US Bank Automated Investor Normalized Benchmark 2.09% 32.94% 12.84% - - -
Vanguard Digital Advisor Normalized Benchmark 2.18% 33.52% - - - -
Vanguard P.A.S. Normalized Benchmark 2.35% 34.66% 13.23% 9.89% 9.82% 9.86%
Wahed Invest Normalized Benchmark 2.35% - - - - -
Wealthfront Normalized Benchmark 2.77% 37.56% 13.90% 10.32% 10.30% -
Wealthfront PassivePlus Normalized Benchmark 2.01% 32.38% - - - -
Wells Fargo Intuitive Investor Normalized Benchmark 2.60% 36.40% 13.63% 10.15% - -
Zacks Advantage Normalized Benchmark 2.35% 34.66% 13.23% 9.84% - -
Returns are net of fees and are as of 03/31/2021. All returns for periods longer than one year are annualized. Produced by Backend Benchmarking for BackendB.com
49

Retirement Normalized Benchmark Returns
1Q 2021 1-Year 2-Year 3-Year 4-Year 5-Year
Ally Invest Managed Portfolios IRA Normalized Benchmark 5.13% 54.33% 17.17% 12.27% 12.67% -
Axos Invest IRA Normalized Benchmark 5.05% 53.67% 17.04% 12.19% 12.57% 13.07%
Betterment IRA Normalized Benchmark 4.64% 50.43% 16.37% 11.77% 12.09% -
4.56% - - - - -
E*Trade Core IRA Normalized Benchmark 5.55% 57.66% 17.83% 12.69% 13.15% -
Fidelity Go IRA Normalized Benchmark 4.47% 49.14% 16.10% 11.60% 11.89% -
Marcus Invest (Goldman Sachs) IRA Normalized Benchmark 5.63% 58.32% 17.95% - - -
Merrill Edge Guided Investing IRA Normalized Benchmark 5.14% 53.82% 17.01% 12.18% - -
Morgan Stanley IRA Normalized Benchmark 3.90% 45.23% 15.23% 11.04% - -
Personal Capital IRA Normalized Benchmark 5.37% 56.27% 17.55% 12.51% 12.95% -
Principal SimpleInvest IRA Normalized Benchmark 5.54% 57.64% - - - -
Schwab IRA Normalized Benchmark 5.21% 54.99% 17.30% 12.36% 12.76% 13.28%
SigFig IRA Normalized Benchmark 4.97% 53.02% 16.90% 12.11% 12.47% 12.96%
SoFi IRA Normalized Benchmark 5.70% 58.98% 18.08% 12.84% - -
T Rowe Price ActivePlus Portfolios IRA Normalized Benchmark 5.70% 58.98% 18.08% 12.84% - -
TD Ameritrade IRA Normalized Benchmark 4.39% 48.50% 15.96% 11.51% 11.78% -
TIAA Personal Portfolio IRA Normalized Benchmark 4.72% 51.07% 16.50% 11.85% - -
United Income IRA Normalized Benchmark 5.62% 58.31% 17.95% 12.76% - -
Wells Fargo Intuitive Investor IRA Normalized Benchmark 4.97% 53.02% 16.90% 12.11% - -
Zack's Advantage IRA Normalized Benchmark 5.38% 56.31% 17.39% 12.42% - -
Returns are net of fees and are as of 03/31/2021. All returns for periods longer than one year are annualized. Produced by Backend Benchmarking for BackendB.com
50
blooom IRA Normalized Benchmark

Terms of Use (“Terms”)
Last updated: 7/1/2020
Please read these Terms of Use (“Terms”, “Terms of Use”) caref ully before subscribing to the Robo Report™ and the RoboRanking™ (“Our Research”, “Research”) distributed by BackEndB.com, LLC (“The Company”) through the websiteshttps://theroboreport.com/ and https://backendbenchmarking.com/ (“Websites”, “Website”).
Your access to and use of Our Research is conditioned on your acceptance of and compliance with the Terms. These Termsapply to all subscribers and others who access or use Our Research.
The Company reserves the right to change these terms at any time without notice. By continuing to subscribe to OurResearch, you agree to abide by them.
Our Research focuses on digital services providing automated investment advice (“Robo”, “Robos”). A “Covered Robo” isany Robo for which the Company publishes historical return data in Our Research.
Our Research is copyrighted and owned by the Company. Use of Our Research for commercial purposes is strictlyprohibited without written consent or a license, except for Covered Robos who wish to use Our Research for marketingpurposes, subject to the following requirements:
1. If materials, insights, facts, data or other information from Our Research is used, Our Research must becited as the source and it must be stated Our Researchis produced by Backend Benchmarking.
2. To avoid misrepresentation, the name or time period of Our Research cited must be stated. For example,if the information used is performance from the First Quarter 2018 the Robo Report, it must be clearlystated that the performance is from the first quarter report, or performance numbers are from the timeperiod ending 03/31/2018.
3. The Company does not permit the redistribution of Our Research. We welcome and encourage includinga link to our Website in any articles or other materials. We provide the report for free to anyone whowants to subscribe. Attaching, hosting for download, or including a link that allows a user to directlyaccess Our Research is prohibited. The appropriate link for our Website to use is:https://www.backendbenchmarking.com/the-robo-report/
4. One must use the most recent version of Our Research at the time of publishing. The most recent versionof Our Research and the date it was published are onhttps://www.backendbenchmarking.com/the-robo-report/. The newest version can be obtained by fillingout the subscription form on the Website or by contacting the Company directly.
Failure to comply with the aforementioned guidelines may result in a takedown notice, revocation of your subscription toOur Research, and/or legal action.
To request written consent or a license, contact The Company at [email protected] or call 732-893-8290 and ask forDavid Goldstone.
Disclaimer of Warranties:Our Research is provided “as is”; with all faults. The Company disclaims all warranties of any kind regarding the Research,either express or implied, including but not limited to, any implied warranty of merchantability, fitness for a particularpurpose, ownership, noninfringement, accuracy of informational content, and absence of viruses and damaging or disablingcode.
The Company does not warrant the accuracy, completeness, or timeliness of the Research. The Company shall not beresponsible for investment decisions, damages, or other losses resulting from use of Our Research.
Past performance does not guarantee f uture performance. The Company shall not be considered an “expert” under theSecurities Act of 1933. The Company does not warrant that this service complies with the requirements of the FINRA orany similar organization or with the securities laws of any jurisdiction.”
Some jurisdictions do not allow the exclusion or limitation of implied warranties, so the above exclusions or limitations maynot apply.
51

Disclosures1 These accounts were funded with more than the minimum amount required to establish an account. Had the accounts been funded with more assets,they would be charged a �at dollar fee up to $1,000,000. Because the fee is a �at dollar amount, a higher account balance would have the result of increasingre�ected performance, while a lower account balance would have the result of decreasing re�ected performance. In December of 2018 a $1 fee was notrecorded. Performance has been updated to include this fee as of Q1 2019.
2 This account has no minimum required to establish an account, but had the account been funded with more assets, it would, at certain asset levels, beeligible for a lower advisory fee. The lower advisory fee would have the result of increasing re�ected performance.
3 These accounts were funded with more than the minimum amount required to establish an account. There is no fee schedule; all accounts are chargedthe same asset-based fee. Therefore, performance is not a�ected by the account’s asset level.
4 This account was funded with the minimum or more than the minimum amount required to establish an account at the time of opening. Had theaccount been funded with more assets it would, at certain asset levels, be eligible for a lower advisory fee. The lower advisory fee would have the result ofincreasing re�ected performance.
5 This account was funded with more than the minimum in order to take advantage of tax-loss harvesting. Tax-loss harvesting may result in better or worseperformance compared to similarly positioned accounts that are not enrolled in tax-loss harvesting. This account is enrolled in their digital only“Intelligent Portfolios”, thus it is not charged an advisory fee. If one were to upgrade to “Intelligent Advisory” which introduces access to live advisors, asubscription fee would be levied, which would decrease re�ected performance.
6 These accounts were funded with the minimum amount required to establish an account. At balances less than $10,000, there is no advisory fee. Had theaccount been funded with $10,000 or more, an asset-based advisory fee would be levied, which would decrease re�ected performance.
7 These accounts were funded with the minimum amount required to establish an account at the time of opening. There is no fee schedule; all accountsare charged the same asset-based fee. Therefore, performance is not a�ected by the account’s asset level.
8 These accounts have no minimum required to establish an account. There is no advisory fee on these accounts. Had additional service packages, such astax-loss harvesting, been added, the lesser of an asset-based fee or �at dollar fee would have been assessed. These fees would decrease the re�ectedperformance.
9 This account was funded with the minimum investment amount at the time. At the time of opening, the account had a 0.25% management fee. Due tochanges in the service at the end of the 1st quarter 2017, new accounts are charged a 0.30% management fee. The fee on our account was grandfathered inand remains at 0.25%. The higher advisory fee would have the result of decreasing re�ected performance.
10 These accounts were funded with the minimum amount required to establish an account. This account is enrolled in their digital only “EssentialPortfolios” and is charged an asset-based advisory fee. If one were to upgrade to “Selective Portfolios” which introduces access to live advisors, a higherasset-based advisory fee schedule would apply, which would decrease re�ected performance.
11 This account has no minimum required to establish an account, but had the account been funded with more assets, it would, at certain asset levels, beeligible for a lower advisory fee. The lower advisory fee would have the result of increasing re�ected performance. A special request was made for anallocation of 60% equities and 40% �xed income or close to it, but this allocation was not one of the standard models at the time of account opening. Atthe time of account opening the closest standard models o�ered were in the range of 50/50 or 75/25 equity to �xed income split.
12 These accounts were funded with more than the minimum amount required to establish an account. Due to the asset based advisory fee, performance isnot a�ected by the accounts’ asset levels. In previous reports we reported the performance of two accounts that were combined to achieve a 60/40allocation. Due to our introduction of Normalized Benchmarking we are no longer reporting the combined account, but just the account with the closestto a 60/40 allocation as we could achieve at this provider.
13 These accounts were funded with less than the minimum investment through an agreement between BackEnd Benchmarking and the provider. Thereis no advisory fee levied regardless of the amount of assets invested.
14 This account was funded with the minimum amount required to establish an account. A �at, asset-based advisory fee is levied on the account. Had wesubscribed to additional, speci�c, provider products the account would be eligible for a lower asset-based advisory fee. A lower advisory fee would have theresult of increasing re�ected performance.
15 This account has no minimum required to establish an account and is enrolled in the Digital Only plan. If the account was enrolled in the premiumservice with access to live advisors, there would be a higher asset-based advisory fee. The higher advisory fee would have the result of decreasing re�ectedperformance.
16 This account is enrolled in the Self Service plan. If the account was enrolled in the Full Service Plan, the fee would be higher or lower depending on thelevel of assets in the account. The higher/lower advisory fee would have the result of decreasing/increasing re�ected performance. Recently, this providerchanged its fee schedule, but our account was grandfathered in at the previous, lower fee for the size of the account. New accounts would be subject to thenew fee schedule, which would decrease re�ected performance at most account size levels.
17 This account was funded with more than the minimum amount required to establish an account. This account will not be charged an advisory fee
52

through 2019. In previous reports we reported the performance of two accounts that were combined to achieve a 60/40 allocation. Due to ourintroduction of Normalized Benchmarking we are no longer reporting the combined account, but only the account with the closest to a 60/40 allocationas we could achieve at this provider.
18 This account was funded with more than the minimum amount required to establish an account. This account will not be charged an advisory feethrough 2019.
20 This account was funded with the minimum required to establish an account. This account is enrolled in their digital only “Intelligent Portfolios”, thusit is not charged an advisory fee. If one were to upgrade to “Intelligent Advisory” which introduces access to live advisors, a subscription fee would belevied, which would decrease re�ected performance.
21 These accounts were funded with more than the minimum amount required to establish an account. There is no fee schedule; all accounts are chargedthe same asset-based fee. Therefore, performance is not a�ected by the account’s asset level. Fee was waived for the �rst year. Had a fee been levied, re�ectedperformance would have been lower.
22 These accounts were funded with more than the minimum amount required to establish an account. There is currently no fee schedule; all accounts arecharged the same asset-based fee. Therefore, performance is not a�ected by the account’s asset level. Previously, the fee was only assessed on balances inexcess of $10,000.
23 These accounts were funded with the minimum amount required to establish an account. There is no fee schedule; all accounts are charged the sameasset-based fee. Therefore, performance is not a�ected by the account’s asset level. Fee was waived for an initial promotional period. Had a fee been levied,re�ected performance would have been lower.
24 Interactive Advisors is registered as an advisor under the name of Covestor Ltd. and is part of the Interactive Brokers Group. This account was fundedwith the minimum required to open an account and is invested in their Asset Allocation portfolio. It is charged an asset-based fee. There is no fee scheduleon this account; therefore performance is not a�ected by the account’s asset levels. Previously, the account was charged a lower asset-based fee; the increasetook e�ect starting March 2019. Interactive Advisors o�ers multiple strategies with di�erent sets of fees, including Smart Beta, index-tracking and modelETF portfolios, in addition to the Asset Allocation portfolios. Interactive Advisors also o�ers a marketplace for actively managed portfolios for which itcharges higher fees (0.5-1.5%), part of which it remits to the portfolio managers supplying the data underlying those strategies.
25 Originally, there was no advisory fee on these accounts. Had additional service packages, such as tax-loss harvesting, been added, the lesser of anasset-based fee or �at dollar fee would have been assessed. In June 2018, one package was activated, resulting in a fee on these accounts. This fee decreasesthe re�ected performance.
26 This account was enrolled in Prudential’s Strategic Portfolios. It was funded with the minimum required to open an account. Had the account beenfunded with more assets it would, at certain asset levels, be eligible for a lower advisory fee. The lower advisory fee would have the result of increasingre�ected performance. Prudential also o�ers Reserve Portfolios for short-term investing, which have a lower account minimum and fee. However, theReserve Portfolios do not allow asset-allocation customization based on individual demographic and risk tolerance.
27 This account has no minimum required to establish an account and is enrolled in the Digital Only plan. If more was invested, the account would beassessed a lower asset-based fee, which would increase re�ected performance. If the account was enrolled in the premium service with access to live advisors,there would be a higher asset-based advisory fee. The higher advisory fee would have the result of decreasing re�ected performance. All balances above $2million are charged a lower asset-based advisory fee. A lower advisory fee would have the result of increasing re�ected performance. The 2018 end-of-yearstatement for Betterment did not include dividends received near the end of 2018, these dividends �rst appeared on the March 31st, 2019 statement.These dividends are re�ected as of the Q1 2019 Robo Report™ but were not re�ected in performance reported in the Q4 2018 Robo Report™. In Q22020 a dividend was misattributed to the cash asset class instead of income causing the equity performance of the main Betterment account to be slightlyunderrepresented.
28 These accounts were funded with the minimum amount required to establish an account. There is no fee schedule; all accounts are charged the sameasset-based fee. Therefore, performance is not a�ected by the account’s asset level. Fee was waived for an initial promotional period. Had a fee been levied,re�ected performance would have been lower. As of March 27, 2019, the management fee has been lowered. The lower advisory fee will increase re�ectedperformance.
29 This account was funded with the minimum or more than the minimum amount required to establish an account at the time of opening. Had theaccount been funded with more assets it would, at certain asset levels, be eligible for a lower advisory fee. The lower advisory fee would have the result ofincreasing re�ected performance. After opening, this provider changed its fee schedule, raising the fee for the asset level of the account, but our accountwas grandfathered in at the previous, lower fee. New accounts would be subject to the new fee schedule, which may change re�ected performance.
30 These accounts were funded with more than the minimum amount required to establish an account. The account is charged a �at dollar feesubscription at its service level. Had the accounts been enrolled in di�erent service packages, they could be assessed a higher subscription fee. Because thefee is a �at dollar amount, a higher account balance would have the result of increasing re�ected performance, while a lower account balance would havethe result of decreasing re�ected performance.
31 These accounts were funded with the minimum amount required to establish an account at the time of opening.This account is enrolled in their digitalonly “Guided Investing” and is charged an asset-based advisory fee. If one were to upgrade to “Guided Investing with an Advisor” which introduces accessto live advisors, a higher asset-based advisory fee schedule would apply, which would decrease re�ected performance.
32 This account has no minimum required to establish an account and is enrolled in the Digital Only plan. If the account was enrolled in the premium
53

service with access to live advisors, there would be a higher asset-based advisory fee. The higher advisory fee would have the result of decreasing re�ectedperformance. All balances above $2 million are charged a lower asset-based advisory fee. A lower advisory fee would have the result of increasing re�ectedperformance.
33 This account has no minimum required to establish an account and is enrolled in the Digital Only plan. If the account was enrolled in the premiumservice with access to live advisors, there would be a higher asset-based advisory fee. The higher advisory fee would have the result of decreasing reflectedperformance. Prior to August 2020, this account was assessed a 0.35% annual management fee As of August 2020, the provider changed the fee structuresuch that accounts under $10,000 are not charged a management fee. Our account is under this threshold and will therefore not be charged a managementfee starting in August of 2020. This will have the result of increasing re�ected performance.
34 This account was funded with more than the minimum required to establish an account, There is no management fee levied. Therefore, performance isnot affected by the account’s asset level. This platform has numerous different portfolio strategies. We chose the “moderately aggressive” strategy. Differentportfolio strategies have different allocations which could increase or decrease reflected performance.
35 These accounts were funded with the minimum amount required to establish an account. This account is enrolled in their “Selective Portfolios” and ischarged an asset-based advisory fee. These specific portfolios are only offered at the “Selective Portfolios” level, which charges a higher asset-based advisoryfee due to access to live advisors than the “Essential Portfolios.” Additionally, these portfolios hold balanced funds. Due to the nature of these funds andlimits in our portfolio management system, we cannot accurately track equity and fixed income performance individually at the portfolio level. Totalportfolio performance is unaffected by holding balanced funds.
36 These accounts were funded with more than the minimum amount required to establish an account. There is no fee schedule; all accounts are chargedthe same asset-based fee. Therefore, performance is not affected by the account’s asset level. This platform has numerous different portfolio strategies. Wechose the “60/40 classic” option. Different portfolio strategies have different allocations which could increase or decrease reflected performance.
37 These accounts were funded with the minimum amount required to establish an account. This account is enrolled in their “Selective Portfolios” and ischarged an asset-based advisory fee. These specific portfolios are only offered at the “Selective Portfolios” level, which charges a higher asset-based advisoryfee due to access to live advisors than the “Essential Portfolios.”
38 These accounts were opened when the provider charged 0.25% annual management fee. Recently, the fee structure changed to be a �at monthly fee.However, our account was grandfathered into the old fee structure. This change may have the result of increasing/decreasing re�ected performance basedon account size.
39 This account charges a 0.15% annual management fee and caps the underlying fund fees at 0.05% so that the all-in fee never exceeds 0.20% annually.The same fee is charged at all asset levels.
40 This account charges 0.55% annually. However, those with a Citi Gold or Priority account (required balances of $50,000 and $200,000 respectively)will not be charged a management fee, which would increase re�ected performance.
41 This account is enrolled in the “Standard” pricing plan for $120 a year which is paid by an outside bank account. This account was opened with a$5,000 initial deposit. We assess the fee on the account as though it was opened with a $50,000 initial deposit. We assess a $1 monthly, $12 a year,management fee on this account. A �at dollar fee pricing structure means the level of assets in the account will a�ect net-of-fee performance.
42 These accounts were funded with more than the minimum amount required to establish an account. The account is charged a �at dollar feesubscription. Because the fee is a �at dollar amount, a higher account balance would have the result of increasing re�ected performance, while a loweraccount balance would have the result of decreasing re�ected performance.
A On June 19th, 2017, Vanguard removed Backend Benchmarking’s primary Vanguard account from the Vanguard Personal Advisor Services program.As of June 20th, 2017, the primary account was replaced by a secondary account with the same risk pro�le as the primary account. The returns for thesecondary account have been linked to the original primary account. Asset type and allocation between the two accounts at the time of the switch werevery close but not identical.
B In the 1st Quarter of 2018 Wealthfront liquidated the positions in the account used for the 4th Quarter 2017 and previous editions of this report. Adi�erent account was used for this report and is labeled “Wealthfront (Risk 4.0)”. The performance numbers from the previous account are available in theaddendum labeled as “Wealthfront (Risk 3.0)”. The risk scores and thus allocations of the two accounts are di�erent and labeled as such. Asset type andallocation between the two accounts at the time of the switch were close but not identical. The di�erence of equity allocation between the accounts on12/31/2017 was approximately 5.4%.
C Due to the down market in December 2018, this account engaged in repeated tax loss harvesting on one of its asset types. All alternative securities wereexhausted for this asset type, so to prevent a wash sale, the entire position, representing approximately 31% of the portfolio, was liquidated and held as cashfor a 1 month period, during which time the market experienced a large upswing. Because this portfolio missed the market upswing, its performance versusthe normalized benchmark is lower.
In previous reports the initial target asset allocation was calculated as the asset allocation at the end of the �rst month after the account was opened. In theQ3 2018 report we adjusted our method to calculate the initial target asset allocation as of the end of the trading day after all initial trades were placed inthe accounts. This adjustment has caused some portfolio's initial target allocation to be updated from previous reports. These updates did not change anyinitial target allocations of equity, �xed income, cash, or other by more than 1%.
Prior to Q3 2018, due to technological limitations of our portfolio management system, some accounts which contained fractional shares had misstated
54

the quantity of shares when transactions quantities were smaller than 1/1000th of a share in a position as a result of purchases, sales, or dividendreinvestments. This had a marginal e�ect on historical performance of the accounts. The rounding of position quantities caused by this limitation has beenresolved, and quantities have been adjusted to re�ect the full position to the 1/1,000,000th of a share as of the end of Q3 2018. Therefore, this rounding offractional shares will not be necessary in the future.
At certain custodians a combination of the custodian providing us a limited number of digits on fractional share and fractional cent transactions roundingerrors are introduced into our tracking. At quarter end starting 3/31/2020 we implemented a process to enter small transactions to eliminate anyrounding errors that have built up to more than a full cent. These transactions are small and do not have an appreciable e�ect on performance
This report represents Backend Benchmarking’s research, analysis and opinion only; the period tested was short in duration and may not provide ameaningful analysis; and, there can be no assurance that the performance trend demonstrated by Robos vs indices during the short period will continue.Backend Benchmarking is under common ownership and control with Condor Capital Management, an SEC registered investment adviser. A copy ofCondor’s disclosure Brochure is available at www.condorcapital.com. Condor Capital holds a position in Schwab, JP Morgan Chase and Goldman Sachsin one of the strategies used in many of their discretionary accounts. As of 03/31/2021 the total size of the position was 36,120 shares of Schwab commonstock, 18,255 shares of JP Morgan Chase common stock, and 5,669 shares of Goldman Sachs common stock. As of 03/31/2021 accounts discretionarilymanaged by Condor Capital Management held bonds issued by the following companies: Morgan Stanley, Bank of America, Goldman Sachs, Wells Fargo,E*Trade, Citi Group, JP Morgan Chase, Citizens Financial Group, US Bancorp, Ally Financial, Charles Schwab, and Capital One.
For more information, please contact BackendBenchmarking at [email protected]
Connect with us at: www.facebook.com/TheRoboReportwww.linkedin.com/company/TheRoboReportwww.twitter.com/TheRoboReport
55