editorial note - halal muihalalmui.org/images/stories/pdf/journal-of-halal-research-vol.1-no... ·...
TRANSCRIPT


Editorial Note
Raafqi Ranasasmita
Journal of Halal Research editorial office, LPPOM MUI, Global Halal Centre building, Pemuda 5 street, Bogor, Indonesia 16161 ([email protected])
It is such a priveledge to launch the Journal of Halal Research first edition, also to be appointed from LPPOM MUI as the editor-in-chief. Not only it is the premier journal of its kind, but it also opens a whole new horizon of science. It is also the first scientific journal worldwide which is owned by a halal certification body. Lukmanul Hakim, LPPOM MUI Director, has given an explanation on why this journal is developed by the LPPOM MUI and the future direction of the publication. He has also encouraged all stakeholders to support the publication which would be benificial to the global application of halal principle. The director’s message—Globalizing Halal Science—was also chosen to be the cover of this first issue. Reki Wicaksono Ashadi from Faculty of Halal Food Science, Djuanda University, added the explanation by providing introduction to halal science. Ashadi has shown that halal has not only be a propietary for moslem, but it has become an integral aspect of quality that is recognized internationally. Journal of Halal Research will harness this expanding discipline by encouraging and publishing original research articles that report significant findings in the multidisciplinary fields of Halal Science. The Journal also offers a dynamic forum by also including poignant and up-to-date reviews, short communication, and book reviews. A special column for commemorating deceased researcher is also provided to appreciate the contribution of past researcher that gave path and foundation to halal science as we see today. This journal seeks to promote diverse areas of halal science, spanning from social to life science. Topics of particular interest within this journal scope are:
- Food science and technology, including the innovative material development and novel
manufacturing
- Pharmaceutical Science and Medicine, from the development of halal-comply pharmaceutics
to development of hospital setting that applies sharia’ principle
- Cosmeceutical science, from raw material to final product
- System development to assure the integrity of halal, from farm-to-fork
- Pyschology and marketing science
- Natural science This inaugural issue of halal journal shows how much does research in this field evolved; from how to cater halal meals in in-flight catering services to integrated halal supply chain. The contributor background is interestingly diverse, from a postgraduate student in Industrial Agriculture Technology to lecturer in Management. The paper for this first issue came from The First Symposium on Global Halal Research, a premier event in Indonesia for halal symposium, organized by LPPOM MUI. The journal thanks the impressive support of LPPOM MUI as Indonesian halal certification body for founding the Journal and guarantee adequate support, both in terms of facility, funding and human resources. By such encouragement, the Journal of Halal Research aspire to be a top publication agency with a vast array of reader and highly citated reference. Furthermore, the ultimate goal is have an wide impact in the application of the science aspect in halal, especially in industrial setting. In the end, it will facilitate every moslem to practise their religious belief easier in today’s world, which has far changed from when the time the last messenger prophecy came. In short, it will globalize halal science. We look forward for the submission of your precious article here, in Journal of Halal Research.
Journal of Halal Research | page 1

Globalizing Halal Science
Lukmanul Hakim
Director, The Assessment Institute for Foods, Drugs, and Cosmetics, Indonesian Council of Ulama LPPOM MUI, Global Halal Centre Building, Pemuda 5 street, Bogor, Indonesia 16161 ([email protected])
Halal certification, by simple definition, is an investigation to prove that the status of a certain product is halal, from its raw material, processing until packaging and distribution, including how the company internal system can ensure the consistency of the product halalness status. The guidance is purely sharia, from the direction of the Qur’an and reference from Prophet Mohammed PBUH hadith. It is then compiled by the ‘ulama (Islamic scholar) in form of fatwa. Such holy guidelines can not directly be applied into industrial setting which halal product certification take place. It will take a careful and methodological observation, understanding of the business process involved, and adequate investigator (auditor) expertise to apply the religious requirement into the certification process. Moslem scientist has became a mediator to bridge the gap these two different spectrum. They became the mediator which examine the business process and report the audit result to the ulama in understandable term(s). By their aid, the ulama could take the fatwa decision accurately, based on the scientific input of the scientist (auditor) and reference from the religious text. The scientist-‘ulama interaction resulted in Halal Science that shape our world today. In LPPOM MUI, the Halal Assurance System 23000 standard and its derivatives, is the product of the Halal Science, where fatwa is translated to industrial requirement. The 11 criteria of requirement of our standard has not only limited itself on the raw material, product and production process. The standard has also added a total quality management aspect that is applicable in business setting and could withstand changes, such as halal policy, appointment of a halal management team and internal audit appraisal to name a few. No wonder that many halal certification organization has adopted this standard for their halal certification process. Meanwhile, the industry admire the standard to be modern, applicable, and adaptive to various business area and size. It may also be the reason of the increasing certification request accross the globe. The journal itself is a media for scientist to disseminate their study, both by literature analysis and research, to answer the problem and challenges in this field. It is also a room for the ‘ulama to provide translation of the religious text to today’s industrial context. Other parties should also join this effort, from government (as the regulator), halal certifier and industrial player, by contributing their own perspective on Halal Science. The ultimate endeavor is to have a better implementation of the halal principle in today’s industrial setting; a condition that has far changed than the time when the Prophecy came. By such collaboration, we can expect the globalization of halal. I am grateful to Allah azza wa jalla for the fulfillment of our institution’s dream to have our own scientific publication. My greatest appreciation also to the editorial team for their meticulous work, the hard work of the paper contributors, and contribution of LPPOM MUI staffs, who have endlessly support this publication. Last but not least, I thank all of you, our journal reader, who have shared the excitement of this publication and willing to spread the journal message’s accross. It is my greatest wishes that this journal would have a great positive impact to the halal world.
Journal of Halal Research | page 2

Halal Science: An Introduction
Reki Wicaksono Ashadi
Dept. Halal Food Science, Faculty of Halal Food Science, Djuanda University, Bogor, Indonesia ([email protected])
I. Introduction
Halal is world-widely recognized as a crucial issue of safety focusing on spirituality for Muslims as well as a sign of food quality for non-Muslims. Halal (حالل , halāl, halaal) is an Islamic Arabic term meaning "permissible". It has both a general and specific meaning. When people use the word in Islamic countries, they usually mean to say what is allowed by Islamic Law. In non-Islamic countries, the word usually means fit to be eaten by a Muslim. Halal simply means permitted or lawful.
Muslim population around the globe can be numbered up to 1.8 billion about 1/4 of the world population. As a consequence, the enormous world Halal market has interestingly attracted many countries, developed or developing alike, to focus on their new challenge, whether they are agricultural or industrial countries, exporters or non – exporters. For South Eastern Asian Nations alone, four countries namely Malaysia, Singapore, Indonesia and Thailand have shown their interest in this Halal market and their determination to become the center of Halal foods.
Rapid technological advancement has altered our life styles so that we are more dependent on eating processed foods and dietary supplements, and using branded cosmetics. As a result, it is becoming more challenging to be aware of the ingredients of the foods we eat and of the products we use in our everyday lives - for example, the presence of animal proteins/peptides in processed food, dietary supplements, and cosmetic products. II. Halal is A Branch of Science
The Halal and the Haram are part of the total legal system of Islam, Its Shari’ah, a system whose primary objective is the good of human kind. Most of the time, when it is come to Halal, it always positioned in mind as something that related to food. Nevertheless, Halal actually cover a wide area of consideration such as purchase intention, source of income [1]; attitude toward advertisement, attitude toward product and purchase intention [2]; word of mouth [3]; and religiousity [4]. This means, halal is applicable to a wide application.
Halal means permissible and lawful while Haram means prohibited. It is exactly opposite of Halal. Mashbooh is something questionable or doubtful, either due to the differences in scholars’ opinions or the presence of undetermined ingredients in a food product. Najis is something not clean, (Halal thing may become Najis when contaminated) and Makrooh is a term generally
associated with someone’s dislike for a food product or, while not clearly haram, is considered dislikeable by some Muslims.
Al-Qaradawi said the lawful (halal) and the prohibited (haram) in Islamic Shari’ah is not simple matter. It is not for any human to decide what is lawful and what is prohibited, not even the Prophet, the only criterion for defining the halal or the haram is Quran injunction revealed from Allah SWT. Imam Malik said “The word of any person other than the Prophet (PBUH) is sometimes acceptable and sometimes objection” and Imam Shafi’I commented “My opinion is correct wth the possibility of its being errorneous. An opinion different from mine could be errornous and could be correct.
Because of those terms which have written above Halal Science is part of knowledge about or study about the dietary law to let Muslims enjoin healthy provision as they perform their greater duty as khalifah Allah on earth. Food is definitely necessary for all living beings to survive. What is not edible for humans may be nutrias for other species. Rizq and haqq as key Quranic terms that operate at a higher level under which halal and haram are subsumed and appropriated. While it is possible to reduce halal and haram to al-haqq in the sense that what is made halal is truly beneficial and what is made haram is truly harmfull, if it will be preposterouse to reverse the order by confining al Haqq to halal and haram parameter [5]. III. Halal Law
Muslims prioritize on the importance of the permissibility of sources of food to be consumed. This is because food intake will affect the development of human wellness and behaviour. Haram food is explicitly prohibited in the Qur'an, Sunnah and the consensus of the Muslim jurist (Ijma’). Muslim were prohibited from eating the flesh of pork and its derivatives as it is a sin and impiety to do so. These rulings have been stated from Islamic law as guidelines to all of mankind. Besides, eating of haram materials and using it as an adulterant or additives in food products are also forbidden. This is clearly demonstrated in many verses of the Quran. In Surah al-Maidah, for example Allah says: “Forbidden unto you (for good) are carrion and blood and flesh of the swine, and that over which is invoked the name of other than Allah, and the strangled, and the dead through beating, and the dead through falling from a height, and that which has been killed by (the goring of) horns, and the devoured of wild beasts, unless you
Journal of Halal Research | page 3

have cleansed (by slaughtering) it in the proper, lawful way, while yet there is life in it, and that which has been immolated unto idols. And (forbidden is it) that ye swear by the divine arrows. This is an abomination.” (Al-Ma’idah, 3)
There are also doubtful things and questionable in Islamic law. This mashbooh sources is doubtful and questionable in Islamic law. For instance, food that has been added by animal enzyme or substance from doubtful based ingredients into halal food products. This is mentioned in the sunnah of the Prophet Muhammad (s.a.w.) where it is stated that: “Both doubtful things are evident but in between there are doubtful (mashbooh) things and most of the people having no knowledge about them. So whoever saves himself from these doubtful things, he saves his religion and his honor, but he who falls into doubtful matters fall into that which is unlawful, like the shepherd who pastures around a sanctuary, all but grazing therein. Truly every kind has a sanctuary, and truly Allah (s.w.t.) sanctuary is His prohibitions.” [6]
Pigs are animals that are prohibited in Islam. This is clearly mentioned in the Quran, Sunnah and the consensus of the Muslim jurist (Ijma’). The prohibition of this animal is based on several aspects of harm from either chemical, microbial or psychology [7]. Among the verses in the Quran that emphasizes prohibition of pigs can be found in surah al-Baqarah where Allah said: “He hath only forbidden you dead meat and blood, and the flesh of swine, and that on which any other name hath been invoked besides that of Allah (s.w.t.) but if one is forced by necessity, without willful disobedience, nor transgressing due limits,-then is He guiltless. For Allah is Oft-forgiving Most Merciful.” (Al-Baqarah, 173)
IV. Istihalah Generally, Muslim jurist agreed that gelatin
derived from slaughtered and permitted animals is halal. However, there is argument on gelatin that is derived from pig and carrion. The halal and haram sources of this matter have been debated among Muslim jurists. Some of them agreed that gelatin extracted from the prohibited sources is haram. Whereas the other opinion supported the idea that gelatin from haram sources is halal because it does already undergo Transformation (Istihalah) process [8].
Istihalah, from the Fiqh point of view, is defined as “changing the nature of the defiled or forbidden substance to produce a different substance in name, properties and characteristics. Istihalah also can be defined as a complete transformation occurred physically and chemically [9].
The scholar (Inb Abdeen) said that: “transformation is changing and conversion of the
material nature”. Then he gives examples about transformation, and then he said:” in all of those examples there is change of the material nature to new nature, and it is not only conversion of characteristics.
Dr. Hamed jami mentioned in the 9th Medical Fiqh Symposium about the criteria of transformation, and he said, “ The transformation criteria from Islam point of view mean the complete conversion of the material nature, and so all its nature, characteristics and properties must convert, and so the transformed material must be not similar to the original material, and it must has new independent nature, another characteristics, and new name.
If we take the most famous example about transformation, which is transformation of wine (ethanol) to vinegar (acetic acid), that the original material (ethanol) belongs to alcohols group, but the transformed material (acetic acid) belongs to acids group. This mean there is complete conversion in physical and chemical properties, and there is change of the material nature to new nature, and it is not only conversion of characteristics. V. Halal Food Science
Halal applies to every single ingredient, utensil, activity and procedure. It is everything from fork to farm. Thus, supply chains play a critical role. Halalan toyyiban should cover all chains of production; from raw materials and ingredients, to planning, manufacturing, packaging, logistics and delivery, warehouse, marketing and consumption. Halal is defined as anything that is considered permissible and lawful. Traditionally applied to food, halal in linguistics is known as “halla”, which is to be or become lawful, legal, licit, legitimate, permissible, permitted, allowable, allowed, admissible, un-prohibited, unforbidden. The concept is lately expanded to all goods and services: cosmetics, clothing, pharmaceutical, financial and tour packages. On the other hand, toyyiban that is rooted from ‘toyyib’, provides meaning to wholesomeness, which signifies quality, cleanliness, safety and nutritionals. Islam restricts al-khabith, the products that is bad, imperfect, decayed and harmful because it provides injurious to one’s physical health, affect the character and spiritual minds, which lead a man to a corrupt deeds. VI. Ta`wil
In commenting on the verse of the word ‘flesh of swine’or pork meat al-Zamakhshari states in interpretation that, it also includes lard [10]. Although the Quran mentions only the flesh but the pig derivatives and by-products are also prohibited as well. This view is supported by al-Qurtubi in al-Jami’ li Ahkam al-Qur’an which includes lard as a part of the meat [11]. In addition, Ibn Hazm al-Zahiri that furs and bones which are derived from pig are also haram to be consumed. However, the
Journal of Halal Research | page 4
skins derived from pigs are permitted when they are tanned. Ibn Hayyan and Dawood however suggest that the prohibition was only meant for meat not the lard and derivatives [12]. There are many reasons for the prohibition of pigs and one of the reasons is to protect Muslims from harm. It is submitted; however that only Allah (s.w.t.) knows the exact reason and the real wisdom as to why pork is prohibited. From that perspective, Muslim scholars have a consensus opinion (Ijma’) on prohibition for all part of pig.
VII. CONCLUSION
Halal principle addresses a range of cultural, economic and political concerns especially in relation to contemporary food, banking, and lifestyle. For Muslim, halal is embedded in daily life. Halal is also widely recognized as a crucial issue of safety, focusing on spirituality for Muslims.
To ensure the halalness to the consumers, halal standard introduces to the halal industry as well as halal certification from trusted Islamic organization (in Indonesia has been done by LPPOM-MUI). From the Islamic point of view, this prohibition includes all part of pig such as flesh, skin, and also its derivatives (lard, enzyme and others). Hence, products that contained lard have to be clearly stated in food labeling. Several techniques have been developed to assist consumers in choosing food products. In Islam a strong emphasis is placed on cleanliness both spiritually and especially on dietary laws. For a food or drink to be approved for consumption as Halal it must be confirmed by Islamic law (Shari’ah) revealed in Quran and in tradition of last Prophet.
VIII. References [1] Regenstein, J. M. et al. The kosher and halal
food laws. Compr Rev Food Sci Food Saf. 2(3), 111-127 (2003).
[2] Maheswaran, D et al. The effects of knowledge, motivation, and type of message on ad processing and product judgments." J Cons Res. 66-73 (1990)
[3] Söderlund, M. Measuring customer loyalty with multi-item scales: A case for caution", Int. J. Serv. Ind. Manag. 17 (1), 76 – 98 (2006)
[4] Worthington, E.L et al. The Religious commitment inventory—10: Development,
refinement, and validation of a brief scale for research and counseling. J. Counsel. Psyc. 50(1): 84 –96.
[5] Solihu, A. K. H. in Proceeding of the international conference on science, Technology and Social Science – ICSTSS 2012 (eds Kasim, A. et al.) 105-114 (Springer Singapore, 2012).
[6] Al-Bukhari. Sahih Al-Bukhari. (1979) [7] Hawwa, S. Al-Islam. (1994) [8] Hammad, N. Al-mawad al-muharramah wa al-
najisah fi al-ghiza’ wa al-dawa’ bayna al-nazariyyah wa al-tatbiq. (Dar Ihya 2004)
[9] Aizat, M. J. Radzi, C.W. J. W. M.. Theory of istihalah in islamic and science perspective: Application for several food processing products. J. Syar. 17 (1), 169-193. (2009)
[10] A. H. Sakr. Pork: Possible Reasons for its Prohibition. (Foundation for Islamic Knowledge: 1991)
[11] Qurtubi. al-Jami‘ li Ahkam al-Quran. 13 vols. Lebanon. Mu’assasah al-Risalah. 2006.4
[12] Zamakhsyari. al-Kasysyaf. 1 vol. Misr. (Maktabah al-‘Abikan 1998)
Journal of Halal Research | page 5

A Value Stream Mapping for Supporting Set Aside Halal Food on International In-Flight Meal Services
Hety Handayani Hidayat1, Taufik Djatna2
1Graduate Program of Agro-Industrial Technology, School of Post Graduate Studies, Bogor Agricultural
University, Indonesia 16680 ([email protected]) 2Department of Agro-Industrial Technology, Bogor Agricultural University, Indonesia 16680
Abstract
In this last decade, airplane passenger awareness on served halal food are growing significantly. Halal is not only about free from any componenst that is prohibited to consume. It is also about the whole concept of good and cleans principle which is called Thayyib in Arabic term. Such concern on good and clean principle is shared throughout the production flow. Thus, catering should adequately measured their production flow items and controlled their specific critical process in order to ensure the integrity of the food they served as Halal. This paper will identify critical processes on the improvement called as value stream mapping (VSM) on an international in-flight meal services. VSM initially evaluated existing processes and result as a Current State. Optimal and planned improvements were then constructed as a Future State. Gaps existed between both states are potential point in improving the efficiency of system and increasing Muslims satisfaction for passenger of their preferences. For initial mapping, stakeholders in each sphere supply chain were investigated by using Supplier Input Process Output Costumers diagram. VSM arrangement will show all activities involved in the industry, from receipt of materials, transformation flow of raw materials until the product are being served. Moreover, relief method were used to identified significant factors that influence halal food production flow. As a result, VSM model catering can easily comprehend their production flow and control it. However, this system has not been able to trace the origin and halal materials or their ingredients are used. Eventually the finding will encourage a better efficiency and maintain passenger Muslim satisfaction for their in-flight meal services. Whole system should also be approach by embedding this method in/to current planning, procurements material and quality control systems.
Keywords: Value Stream Mapping, halal, international in-flight meal services
I. Introduction
Islam is the fastest growing religion in the world with the increasing number of Muslim population by over 235 percent in the last fifty years [1]. Islam is not only a religion of rituals but also a way of life. One of the things that consider in Islam is eating because food is a basic part of existence of mankind. Food consumed by Muslims that meets the Islamic dietary code is called halal food. Halal is not only about free from any components that prohibited for Muslims consumption (in Arabic called Halal Syar’i) but also about the whole concept of good and cleans principle (in Arabic called Thayyib) [2].
Therefore, the provision of halal food has become an obligation that must be fully applicable in any condition and situation. The increasing awareness of Muslims all over the world on their obligation to consume food creates greater demand for halal foods. Realizing this, the airline has completed their services by serving in-flight meal services [3]. In their own in-flight meal services, airlines have variant menu Muslim that just consist of halal food [4].
For providing halal food to passengers, in addition to using halal ingredients, catering and
airline should be done special treatment. This is to avoid a halal food became unlawful (called Haram) when it is contaminated by forbidden thing [5]. These forbidden things include substances is prohibited for Muslims consumption , dirt or other physical contaminants, water treated with forbidden substances, and cross contaminants due to the use of the sharing tools with haram food processing.
According to a case report [6] in 2012, PT Aerofood ACS, as Garuda Indonesia Airline in-flight catering, has implemented halal assurance system [6] which is a pre-requisite for halal certification from Indonesian Halal Certification Body LPPOM MUI. Its production cycle time is 40 hours, which is longer than the average 24-hours-cycle time in international flight catering. Some airline catering even has reduce it up to 8 hours. The reduction can be done by reducing the wastage of time [7]. This is in line with some work [8] suggesting that lead time is a major problem for in-flight catering.
According to the treatment complexities of halal food and timing problem, airline and catering should adequately manage the production flow to support set aside a halal food. To make it easier, we
Journal of Halal Research | page 6

proposed those catering to re-arrange their value stream mapping ensuring halal-comply production with a more efficient execution. This work aims to arrange and to identify critical processes on the improvement called as value stream mapping (VSM) on an international in-flight meal services.
II. Problem Statement
Provision of halal food on the flight was handled by special caterers, distincly different to regular ones. The fundamental differences of inflight catering are its operating system are the involvement of multiple stakeholders, from airline crew to airport personnel. It also has a long and specific supply chain [7].
Serving halal products should be preserved in all aspect of food processings (Figure 1) from receipt of incoming raw materials or processed foods, preparation, processing, until presentation [9]. Considering the variability of in-flight catering operating systems, this study only focused on process ordering and delivery materials until halal food are served for the passengger. In this paper, our case study is the premium menu on international airline flight.
Fig. 1. Production flow in general food services
III. Methodology
In this case, the most important information are production flow and halal concepts. The overall methodology are presented on Fig 2.
Fig.2. Research Framework
A. Value Stream Mapping
Value Stream Mapping is a map of flow chart that contains information of the flow of material and information throughout the manufacturing process [10]. This powerful tool is based on lean principles and are used to identify opportunities for process improvement and performance pathways. By describing the relationship between the value added time, it resulted as the sum total process cycle time in the value stream. Process waste are presented as the total number of inventory on stream [11].
One of the key indicator of performance in Value stream mapping is Process Cycle Efficiency (PCE). PCE measure the efficiency of processing time to the overall process cycle time. The eqution is explanined as [12]:
(1) B. Relief Algorithm
In order to simplify the process of dynamic attribute selection in a database operation, Relief method [13] was used in this paper. The success of the algorithm is due to the fact that it's fast, easy to understand and implement and accurate even with dependent features and noisy data. The algorithm is based on a simple principle. Objects with similar properties were put in a class. The properties (or features) is then distinguish based on their importance, from very to less important. In this case, we selected significant factors and critical processes that can be influence halal of food. The algorithm basically consists of three important parts [13]:
1. Calculate the nearest miss and nearest hit; 2. Calculate the weight of a feature with the
following equation:
(2)
(3)
3. Return a ranked list of features or the top k features according to a given threshold.
C. Halal Concept Halal concept are related to good and cleaness
and it includes the various aspects of personal body care, clothing, equipment and the working premises for processing or manufacture of foods, drinks and products. “Good” refer to food that is not hazardous to human health and suffice in terms of nutrients. In the context of halal, hygienic food, drinks and products can be defined as free from najis or contamination and harmful germs [2,5]. In order to assure the safety aspect, the producers should also comply with Good Manufacturing Practice-GMP and Good Hygiene Practice-GHP [16].
2
2 2
'
1
x Xx
c C c E
Gini p x
Reliefp c p c
nearest m iss
nearest hit
i ij
ij
W F P different value of F
P different value of F
Journal of Halal Research | page 7

IV. Result and Discussion
A. The Analysis of In-flight Meal Services As a system, flight meal services in general
consists of five components which are input, process, output, stakeholders, and key performance indicator. All components work in its design environment as a boundary system [14], as describe in Fig. 3. The role of stakeholders involved in the system in-flight meal services can be described in the SIPOC diagram. SIPOC is a diagram that can illustrate the processes occurring in the industry and associations with suppliers and customers [12].
Fig. 3. Boundary System of In-flight Meal Services
The complexity of in-flight meal service operating system span from the involve of many stakeholders diverse raw material, variety of equipment, and complicated handling processes. Current value stream mapping system is describe in Figure 4. The map were chosen because it is an effective and proven tool to assess existing business processes and to re-design them based on Halal pre-requisite [10]. The flow production start from passengers reqquesting halal menu when purchasing the ticket. The demand will be then recapitulated by the marketing department of Garuda Airline and reported to PT. Aerofood ACS. The catering company plans and made reservations to the
supplier. Fruit and vegetable suppliers are delivered daily, while other products (such as meat and fishs) are received once weekly. These materials will be furthermore processed through a sequence (receiving, material preparation, cooking, packaging, uplift, MTSU, and serving), including the primary storage (as main store, airline store, and mini store), and then a distribution by using a particular mode. Each process has a cycle time that is symbolized by C/T (cycle time). Also, in this CVSM (Current Value Stream Mapping) also contains information inspections conducted in each process, storing, and distribution to ensure the halal products.
Using hypothetical data refers to [6], NVAT (Non-Value Added Time) in current system is 3,379.35 minutes, so it is much longer than average VAT (Value Added Time) which is only 325.35 minutes. In other words, it has low productivity that indicated by their 8.78% process cycle efficiency (PCE). C. Future Value Stream Mapping: Improvement Based on Halal Requirements It is necessary to improve efficiency and implement the halal concept, especially most common waste and their effect on quality of halal food. Table 1 (in supplementary attachment) display the hypothetical data which rate the chances of waste. The data were furthermore analyzed using the relief method to select which waste is the most significant. The assessment resulted in a 2.75 threshold value, which estimate overproduction and the delivery of defect or forbidden product as the most significant component.Afterwards, value stream mapping tools VALSAT is used to classify the type of significant waste. There are 7 VALSAT which depends on the waste that occurs predominantly in the industry [16]. These linkages can be seen in Table 2 (supplementary attachment). VALSAT is a valuable tools for mapping the
Fig. 4. Current value stream mapping showing the complexity of flow production process and the time required for each step to complete
Journal of Halal Research | page 8

filter quality. The quality filter mapping approach is a tool designed to identify where quality problems exist in the supply chain. The resulting map itself showed three different types of quality defect occur in the supply chain [16]. In this case the quality will refer to halal and thayyib (good and cleanness).
In quality filter mapping, there are 3 type of effect: internal scrap, service defect and product defect. Internal scrap refers to defects produced in a company that have been caught by inspection. Meanwhile, service defects are defects are any problems that customers experience which are not related to production failure. Product defects refers to imperfection caused by other reason. By performing quality filter mapping, the most halal critical processes we found to consisted of main store, cooking, MTSU and serving (Fig 5). All four were critical since it causes most types of larger defects. An airline catering is recomended to provide more attention to assure halal status and product.
Fig. 5. Quality Filter Mapping V. Conclusion
Value stream mapping will facilitate in-flight catering and airline to improve production flow of halal food and identify halal critical processes involved. This system is recommended to be integrated of the existing including improving Muslim passenger’s satisfaction and the whole process cycle efficiency.
VI. References
[1] Abdul RA, Ahmad NB. People awareness on halal foods and products: Potential issue for policy maker. Proc. Soc. Behav. Sci. 121 (25), 3. (2014)
[2] Mian, N.R. Muhammad, M. C. Halal food production. (2004)
[3] Archa, R, Subha, M. V. A study on service quality and passenger satisfaction on indian airlines. Int. J Multidisc. Res. 2(2), 5780. (2012)
[4] DJatna, T, Hety H.H. in Real time key element extraction for design in-flight meal services based on passengger’s personality traits. 120-125 (Proceeding the 6th ICITEE, 2014).
[5] Abdul, H.N. et al. Adoption of halal supply chain among Malaysian’s halal manufacturers: a exploratory study. Proc. Soc. Behav. Sci. 129, 388 – 395. (2014)
[6] Fida E. Gambaran penerapan food safety pada pengolahan makanan untuk kru pesawat di Aerofood ACS tahun 2012. (Universitas Indonesia, 2012)
[7] Jones P. Flight catering. (Elsevier, 2004) [8] WIPRO Technologies. Inflight catering
management solution. (Wipro Ltd, 2013) [9] McSwane, D. et al. Essential of food safety and
sanitation. (Prentice Hall, 2003) [10] Boror, C. The certified quality engineer
handbook third edition. (American Society for Quality Press 2009)
[11] Nielsen, A. Getting started with value stream mapping. (Gaardiener Neilsen Associates Inc 2008)
[12] Gaspersz, V. Fontana. A. Learn six sigma for manufacturing and service industries, waste elimination and continous cost reduction. (Penerbit Gramedia Pustaka Utama, 2011)
[13] Kira, K. Rendell, L. A. The feature selection problem: Traditional methods and a new algorithm. 129-134 (AAAI Press, 1992).
[14] Wasson, C. System analysis, design, and development: concepts, principles and practices. (John Wiley & S, 2006)
[15] Abdul, R.W. Guidelines for the preparation of halal food and goods for the muslim consumers. Amalmerge Halal and Food Safety Institute, 2004).
[16] Hines, P. Nick, R. The seven VSM tools. Int J. Op. Prod. Manag. 17 (1), 46-64 (1997)
Journal of Halal Research | page 9

Supplementary Attachment Table 1. Hypothetical data simulating the chances/ opportunitunities that a component will become a waste. The linkert scale is used, where 1 indicate are rarest and the most frequent one is 5.
Table 2. The Seven Stream Mapping Tools displaying relationship between activity and its correlation
Waste/Experts
Overproduction
Delay Transportation
Inapproriate processing
Unnecessary inventory
Unnecessary motion
Defect Quality standard
1 5 5 5 1 2 3 5 no 2 2 2 5 2 3 5 1 no 3 2 1 2 5 3 5 1 no 4 1 4 3 2 4 3 5 no 5 4 2 4 5 2 4 1 yes 6 1 2 1 2 4 5 2 yes 7 5 2 3 5 3 5 3 yes 8 3 2 1 5 1 1 1 yes 9 5 3 5 1 4 4 3 yes 10 4 4 4 1 4 3 4 yes
Waste/ Structure Mapping Tools Process activity mapping
Supply chain response matrix
Production variety funnel
Quality filter mapping
Demand amplification mapping
Decision point analysis
Physical structure mapping
Overproduction (O) L M L M M Delay (D) H H L M M Transportation (T) H L Inappropiate processing (IP)
H M L L
Unnecessary inventory (UI)
M H M H M L
Unnecessary motion (UM)
H L
Defect/forbidden (Df) L H Notes: H: high correlation and usefulness M: medium correlation and usefulness L: low correlation and usefulness
Journal of Halal Research | page 10
Application of Association Rule Model in Biosensor
for Identifying Dairy Products Quality
Elfa Susanti Thamrin1, Taufik Djatna 2
1) Post Graduate Program of Agro-Industrial Technology, School of Post Graduate Studies, Bogor Agricultural University, Darmaga, Bogor,West Java, Indonesia ([email protected])
2) Department of Agro-Industrial Technology, Bogor Agricultural University, Darmaga, Bogor,West Java, Indonesia ([email protected])
Abstract
The safety of packed product, such as the dairy, need to fulfill halal aspects, as well as the Thayyib (good and cleanliness) principles. To support Thayyib conditions, the food must be kept fresh by proper packaging. Smart packaging label indicator is a packaging innovations that will indicate product quality by the changing color. Such biosensor will allow customers to identify inproper storage. A sensitive quantifier that relate the biosensor color changes and the actual quality is currently non-existent. Association Rules Mining (ARM) is used to produce association rule model which would create a better model for dairy products biosensors performance. Formulation of relevant interesting measures is used as the approach to construct ARM, which is then constructed by priori approach. The threshold on ARM measured support, bond, lift and confidence will give information on °Hue, ΔE value, hedonic value, total of colony, time and temperature of storage products. One of the top 10 association rules showed that then the label changes color to red yellowish when the value of °Hue is yellow red, ΔE is medium and the product safe from the colony. Such rules will enable to predict product shelf-life, which would further enable Moslem consumer to monitor the good and cleanliness aspect of a dairy product.
Keywords: Association Rules Mining, Color Change, Quality Change, Halal Aspects
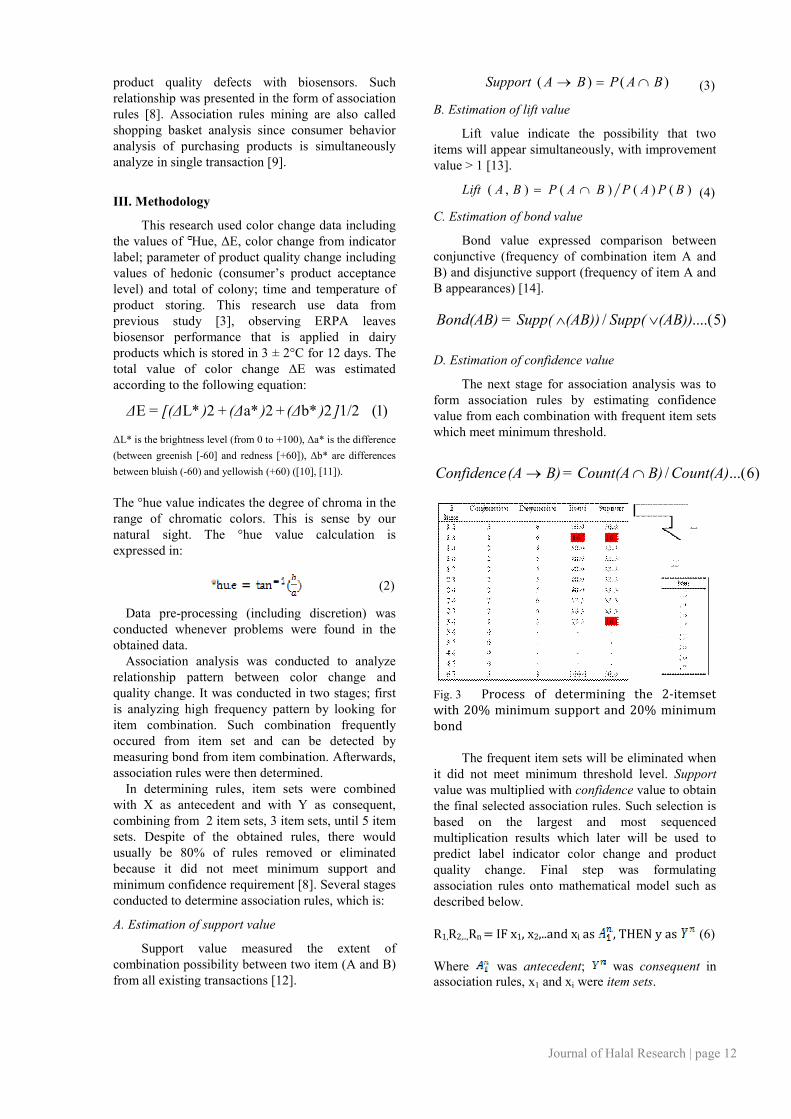
I. Introduction Allah God Almighty commands us to eat halal and good food (halalan thoyyiban) to do no harm to our body, as written in The Holy Qur'an (2:168). Thayyib (good) meal is highly nutritious food that is absent of harmful substances. Proper packaging will maintain the Thayyib and halal aspect of food from production to the consumer’s shelf. Time Temperature Indicator (Fig. 1) is a smart packaging indicator, displaying product temperature real-time. A new model that is more accurate yet cost efficient should be construct as alternatives to existing model [1], [2], [3].
Fig. 1 Example of a color indicator label showing gradual color changes indicating product quality
Color is an important perimeter related to product quality [4]. Color is classified as °hue value calculation (h) and the total of color difference (ΔE) [5], an approach which is develop by Commission
Internationale d'Eclairage Lab (Figure 2). The damage will occurs when product contact the environment directly through air, oxygen, light, water vapor or temperature changes [6].
Fig. 2 CIE 1976 L*a*b* colorimetric system which easily classify color
There are two types of indicator, external and
internal indicator. Time and temperature indicators is the examples of external indicators. Meanwhile, indicator for oxygen, carbon dioxide, pathogen, and microbial growth is clasified as internal indicators [7]. Smart packaging with color indicator is widely applied to products susceptible to heat damage.
The apriori algorithm is a data mining that use Association Rules Minning. The mechanism of the association rules are calculated based on the support, confidence, lift and bond of relationship items. This research aim to develop a model association discoloration and quality changes in indicators of
Journal of Halal Research | page 11
product quality defects with biosensors. Such relationship was presented in the form of association rules [8]. Association rules mining are also called shopping basket analysis since consumer behavior analysis of purchasing products is simultaneously analyze in single transaction [9].
III. Methodology
This research used color change data including the values of Hue, ΔE, color change from indicator label; parameter of product quality change including values of hedonic (consumer’s product acceptance level) and total of colony; time and temperature of product storing. This research use data from previous study [3], observing ERPA leaves biosensor performance that is applied in dairy products which is stored in 3 ± 2°C for 12 days. The total value of color change ΔE was estimated according to the following equation:
)1( 1/22b*+2a* + 2L* = E ])(Δ)(Δ)[(ΔΔ
ΔL* is the brightness level (from 0 to +100), Δa* is the difference
(between greenish [-60] and redness [+60]), Δb* are differences
between bluish (-60) and yellowish (+60) ([10], [11]).
The °hue value indicates the degree of chroma in the range of chromatic colors. This is sense by our natural sight. The °hue value calculation is expressed in:
(2)
Data pre-processing (including discretion) was conducted whenever problems were found in the obtained data.
Association analysis was conducted to analyze relationship pattern between color change and quality change. It was conducted in two stages; first is analyzing high frequency pattern by looking for item combination. Such combination frequently occured from item set and can be detected by measuring bond from item combination. Afterwards, association rules were then determined.
In determining rules, item sets were combined with X as antecedent and with Y as consequent, combining from 2 item sets, 3 item sets, until 5 item sets. Despite of the obtained rules, there would usually be 80% of rules removed or eliminated because it did not meet minimum support and minimum confidence requirement [8]. Several stages conducted to determine association rules, which is:
A. Estimation of support value
Support value measured the extent of combination possibility between two item (A and B) from all existing transactions [12].
)()( BAPBASupport (3)
B. Estimation of lift value
Lift value indicate the possibility that two items will appear simultaneously, with improvement value > 1 [13].
)()()(),( BPAPBAPBALift (4)
C. Estimation of bond value
Bond value expressed comparison between conjunctive (frequency of combination item A and B) and disjunctive support (frequency of item A and B appearances) [14].
)5....(/ (AB))Supp((AB))Supp(=Bond(AB)
D. Estimation of confidence value
The next stage for association analysis was to form association rules by estimating confidence value from each combination with frequent item sets which meet minimum threshold.
)6...(/ Count(A)B)Count(A=B)(AConfidence
Fig. 3 Process of determining the 2-itemset with 20% minimum support and 20% minimum bond
The frequent item sets will be eliminated when it did not meet minimum threshold level. Support value was multiplied with confidence value to obtain the final selected association rules. Such selection is based on the largest and most sequenced multiplication results which later will be used to predict label indicator color change and product quality change. Final step was formulating association rules onto mathematical model such as described below.
R1,R2,..,Rn = IF x1, x2,..and xi as , THEN y as (6)
Where was antecedent; was consequent in association rules, x1 and xi were item sets.
Journal of Halal Research | page 12

The value of L*a*b* were calculated by equation (1) to obtain the value of ΔE. These data used as secondary data in this paper to develop models of the relationship between biosensors color changes with the dairy products quality changes used ARM.
The data was pre-processed with discretization method to classify the data (ºHue, ΔE, consumer preferences and the number of colonies) to a nominal value. This was to facilitate research to associate each sets of item. Afterwards, the discretization data is entered into the tabular table and used binary number "1" if there was data on the item sets and "0" if there was no data, and calculated the value of the support (equation 3) of each item sets
IV. Result and Discussion
Support value (equation 3) from each item set was chosen when it met 20% minimum support. Afterwards, each item sets was combined. In the beginning, two item sets were combined, resulting in 67 rules from 13 item sets in the tabular table. This will also resulted in conjunctive and disjunctive values for each combination. The conjunctive and disjunctive estimations were to estimate bond value (equation 4).
The combination would further be eliminated if bond value and support value were ≤ 20% to eliminate excessive value. This would result in 29 combinations and 30 rules, which is further combined into 39 combinations of 3-item sets. One rule was eliminated since it did not meet the min bond ≥ 20%
Rules were then combined into 4-item sets, resulting 15 rules. Afterwards, 3 rules were generated from 5-item (Table 1), with ≥ 1% lift and ≥ 80% confidence. For example, one of the rules (Table 1) is, “IF ºHue is red, ΔE is low, hedonic is like, colony is safe THEN color indicator is red”. It has 30.7% support, meaning that they were 30.7% occurrence frequency of relationship between both statement. The 40% bond value imply 40%
simultaneously frequency of occurrence of the relationship. In termes of confidence, a 100% value means there is absolute chance of color indicator turns red when ºHue is red, ΔE is low, hedonic is like and colony is safe. Meanwhile, a > 1% lift indicate positive correlation between color change and quality .
Association rules were formed by estimating lift value in combination 4-item sets, and then support value and confidence were multiplied to sequence association rules of formed association rules (Figure 5). There were 10 highest association rules in this research.
Fig. 5 Result of association rules within threshold
VII. Conclusion
Muslim consumers can easily maintain Thayyib aspect by identifying biosensor discoloration. The top 10 rules calculated in this research will facilitate better predictive value of how long a product can be stored in a more efficient fashion than existing method. Further validation and verification were
Journal of Halal Research | page 13
required to measured the accuracy of the model when applied in actual condition.
References
[1] Hasnedi, Y. et al. Smart packaging as tilapia fillets rottenness detection. PHPI. 8(2), 129–142 (2010)
[2] Warsiki, E. Putri, C. D. W. Making of labels/films color indicator with natural and synthetic dyes. E. J. Agroin. Indones. 1(2), 82-87 (2012)
[3] Nofrida, R. Color indicator film from ERPA leaf (Aerva sanguinolenta) as smart packaging for susceptible temperature and light product. (IPB, 2013)
[4] Warsiki, Setiautami. Color stability of beat dyes label during heating. 213-219 (Prosiding International Conference on Adaptive and Intelligent Agroindustry; 2013 )
[5] MacDougall. Colour in food: Improving quality. (Woodhead Publishing Ltd, 2002)
[6] Savitri, I. Determination of wafer expired by using Arrhenius models and Labuza models. (IPB, 2000)
[7] Ahvenainen, R. Active and intelligent packaging in novel food packaging techniques. (Woodhead Publishing Limited 2003)
[8] Prasetyo. Data mining: concepts and applications using MATLAB. (Andi Yogyakarta, 2012)
[9] Gunadi. G, Sensuse. D. Application of data mining market basket analysis method book sales data using apriori algorithm and frequent pattern growth (FP-GROWTH): case study in PT. Gramedia. JTMKOM. 4(1), 118-132 (2012)
[10] Vaikousi, H. et al. Applicability of a microbial time temperature indicator (TTI) for a monitoring spoilage of modified atmosphere packed minced meat. Int. J. Food. Microb. 133, 272-278. (2009)
[11] Kim, M. et al. Selection of an optimum pH indicator for developing lactic acid bacteria based time temperature integrators (TTI). J Food Eng. 113, 471-478 (2012)
[12] Yin. Y, et al. Data mining: concepts, methods and application in management and engineering design. (Springer: 2011)
[13] Geng. L, Hamilton, H. J. Interesting measure for data mining: a survey. ACM Comp Surv. 38 (3), 1-32. (2006)
[14] Younes. N.B, et al. Bridging conjunctive and disjunctive search spaces for mining a new concise and exact representation of correlated patterns. (eds Pfahringer B, Holmes G, Hoffmann A). 189-204. (Springer, 2010)
Journal of Halal Research | page 14

A Supply Chain Approach Towards Halal
Marco Tieman1, Mohd Ridzuan Darun2 1Graduate School of Business, Universiti Tun Abdul Razak, Kuala Lumpur, Malaysia ([email protected])
2 Faculty of Industry Management, Universiti Malaysia Pahang, Kuantan, Malaysia ([email protected])
Abstract
A neglect of halal requirements throughout the entire food supply chain is gradually weakening consumer confidence in halal brands. This paper sets out to argue that halal certification should include next to sourcing and production requirements also guidelines for the distribution of halal products towards the point of consumer purchase. The authors propose a Halal Supply Chain Integration Model to better organise halal food supply chain networks. The conductor plays a key role in assembling and conducting the halal supply chain network, which role can be performed by the brand owner or 4th party logistics service provider. These halal food supply chains should be well aligned with the product characteristics (ambient vs. cool chain; bulk vs. unitised) and market requirements (Muslim vs. non-Muslim country). The inclusion of distribution requirements for halal product certification need an active participation of logistics asset management providers, logistics service providers and halal certification bodies. Governments are recommended to stimulate a supply chain approach towards halal in order to better protect the halal integrity for the Muslim consumer and minimize exposure of halal brands. Industry surveys and case study research are needed to discover the issues in bringing halal compliance downstream the supply chain for both Muslim and non-Muslim countries.
Keywords: halal supply chain, halal value chain, halal supply chain management, halal supply chain integration model
I. Introduction
Halal is going through an evolution [1], from a Muslim company (based on trust), a halal product (based on product certification), halal supply chain (based on supply chain certification & compliance) to a halal value chain (based on Islamic values in the entire value chain). Today, most halal food systems have embraced a supply chain approach towards food safety (through hazard analysis and critical control points), but only a product approach towards halal. As the brand owners promise both food safety and halal at the point of consumer purchase both need to be protected equally. This equal importance is also written in the holy Quran (2:168: “Eat of what is on earth, lawful and good…”). The body of knowledge on halal supply chain management is a new field of study and there are many research opportunities yet to be explored. This is different from for example the banking sector, where Islamic banking products are well developed and also accepted by non-Muslim consumers simply because of fair trade values and cumulative returns are greater compared to traditional banking products, as well as government support to spearhead and conduct research in this sector [2].
With the globalization of supply chains, halal food supply chains become more complex and therefore more vulnerable to contamination [3, 4]. Halal scandals over the past years have proven the vulnerability of halal food supply chains and the possibility of a halal issue to escalate into a major
crisis for brand owners. A neglect of halal requirements through the entire supply chain is gradually weakening consumer confidence in halal brands [5]. This requires a paradigm shift of halal assurance, to move from a halal product towards a halal supply chain approach. Thus far, there has been relatively little guidance from academia on halal assurance, which in general has been following, rather than leading business practices. Hence, there is a need for theory building by scholars to develop practical tools and methods for successful implementation of halal supply chain management.
This paper discusses first of all common issues in the distribution channel. This is followed by the introduction of the Halal Supply Chain Integration Model to better organise halal food supply chain networks. Brand owners can use the model to better organise supply chain networks that provide a higher level of halal assurance (for the Muslim consumer).
II. Issues in the Distribution Channel
Physical distribution is the part of logistics management that directly connects to the market: the point of consumer purchase. Physical distribution consists of the subsystems inventory management, warehousing and transportation [6]. Inventory management is concerned with the optimal size of stock in each link in the chain. Warehouse management is concerned with the location and management of activities in the
Journal of Halal Research | page 15

warehouse. The transportation system is concerned with the choice of modality and planning of the type of mode of transport. With regards to protecting halal integrity in the supply chain, warehouse management and transportation is of particular interest.
There are many different roles for a warehouse in the supply chain, namely [7]: storage, consolidation (receiving product from different sources), cross-docking (consolidation without storage), sorting (letters, parcels), fulfillment (internet retailers), reverse logistics (returns), and pubic sector (army, natural disaster). A warehouse has important processes to recognize for an effective halal assurance, namely [8]: (i) receive, (ii) putaway, (iii) replenish, (iv) value added logistics, (v) cross-dock, (vi) pick and (vii) ship. Some warehouses are dedicated halal warehouses (only carrying halal products, not allowing non-halal products to enter the warehouse) and some warehouses carry both halal and non-halal items. In the last group, segregation is critical throughout the warehouse processes. Warehouses can be operated by manufacturers, logistics service providers, wholesalers, distributors and retailers.
Transportation can be divided in three (3) sections: (i) loading, (ii) transit, and (iii) receiving. At loading and receiving it is important that halal and non-halal products are properly segregated according to market requirements and their halal status is recognized from their label, freight documents and digital freight information. During transportation there could be border inspections of the cargo by customs and/or health authorities. These border inspection authorities open the container, take one or multiple boxes out for further inspection, check the contents, and return the boxes back into the container. Also for these authorities the halal status of the cargo (or part of the shipment) should be recognized to avoid possible contamination by cross border inspection at their inspection facilities.
Various issues can be recognized in the distribution channel of food products towards retail. First, the halal status of cargo is not recognized as a consolidation criterion and therefore not identified in logistics handling instructions. Therefore halal and non-halal cargo is often mixed on the same pallet (load carrier), container, and in the transport vehicle. In warehouses halal and non-halal cargo is often mixed on one pallet, stored vertically above each other in pallet racking, in the same storage zones, and in value added logistics. The result is that halal and non-halal flows are often consolidated in transportation and warehousing. The International Halal Integrity Alliance (IHI Alliance) international halal standard for logistics [9] propose to use of the code “halal supply chain” to be marked on labels, freight documents and in IT
systems to identify halal cargo. However, not many local halal standards and halal certification bodies have adopted this code.
Second, food manufacturers are not required to address the physical distribution under their current product certification. Therefore, halal assurance is not being addressed in physical distribution up to the point of the consumer purchase. The result is that halal requirements are often not part of commercial contract with logistics service providers, distributors and retailers. As a consequence, halal and non-halal is being mixed downstream towards the point of consumer purchase.
Third, there is a lack of halal certified logistics service providers. This is a result of a lack of halal certification bodies that certify logistics service providers, lack of local halal logistics standards, and lack of demand for halal logistics (as halal logistics is not required for product certification). The multinational third party logistics service providers have not been leading halal logistics and supply chain services, but more the local players. However, these multinational third party logistics service providers will be critical for cross border supply chains as they have logistics infrastructure and assets all over the world and are able to provide true end-to-end halal logistics and supply chain services.
Fourth, downstream the supply chain, traders (wholesalers and distributors) often have poor halal practices, where dogs are used for the protection of premises (that are often able to enter storage areas). Due to space limitations, halal and non-halal products are not systematically segregated. Most of the transportation is outsourced, where segregation/designated halal transportation is not a requirement in the commercial contract.
Fifth, retailers in Muslim and non-Muslim countries are often carrying both halal and non-halal products. In Muslim countries some retailers have created non-halal zones, clearly marked as such, to shelf their alcoholic beverages and pork based products. These non-halal zones could even have their own casher and trolleys, to address risk of contamination and perception of the Muslim consumer. On the other hand, in non-Muslim countries some retailers have created halal zones, clearly marked as such, to shelf all their halal (certified) products. Although the retailer could have segregated at shelf, its supply and storage behind its outlet could still be mixed due to space constraints and economies of scale in transport. Furthermore, in modern trade large supermarket chains are integrating backwards in the supply chain by setting up distribution centres to consolidate supply from the fast moving consumer goods producers for delivery to their retail outlets (hereby reducing the number of truck deliveries to
Journal of Halal Research | page 16
their outlets). In those DCs often both halal and non-halal are handled and consolidated in shipments to retail.
Sixth, there is a lack of consumer awareness on current logistics practices where halal and non-halal are mixed. However, consumer surveys [5] show that the Muslim consumer in both Muslim and non-Muslim countries find the segregation in logistics important and there is a willingness to pay a premium for products that have extended halal assurance towards logistics.
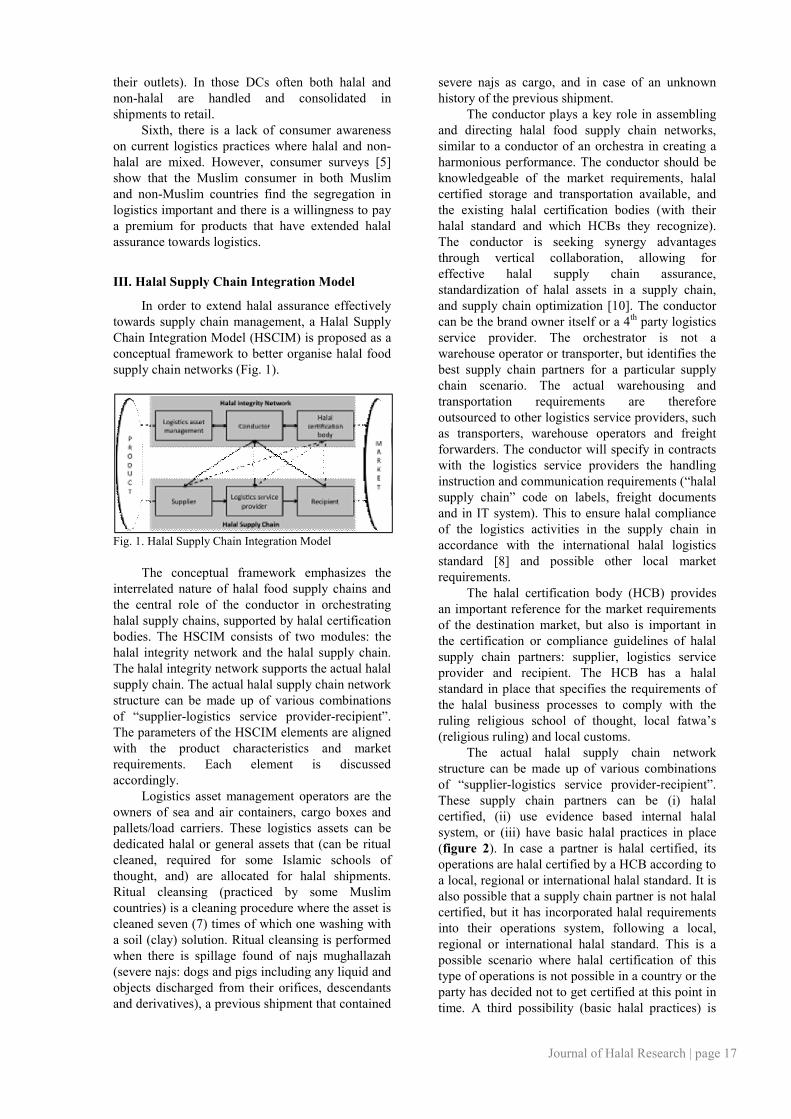
III. Halal Supply Chain Integration Model
In order to extend halal assurance effectively towards supply chain management, a Halal Supply Chain Integration Model (HSCIM) is proposed as a conceptual framework to better organise halal food supply chain networks (Fig. 1).
Fig. 1. Halal Supply Chain Integration Model
The conceptual framework emphasizes the interrelated nature of halal food supply chains and the central role of the conductor in orchestrating halal supply chains, supported by halal certification bodies. The HSCIM consists of two modules: the halal integrity network and the halal supply chain. The halal integrity network supports the actual halal supply chain. The actual halal supply chain network structure can be made up of various combinations of “supplier-logistics service provider-recipient”. The parameters of the HSCIM elements are aligned with the product characteristics and market requirements. Each element is discussed accordingly.
Logistics asset management operators are the owners of sea and air containers, cargo boxes and pallets/load carriers. These logistics assets can be dedicated halal or general assets that (can be ritual cleaned, required for some Islamic schools of thought, and) are allocated for halal shipments. Ritual cleansing (practiced by some Muslim countries) is a cleaning procedure where the asset is cleaned seven (7) times of which one washing with a soil (clay) solution. Ritual cleansing is performed when there is spillage found of najs mughallazah (severe najs: dogs and pigs including any liquid and objects discharged from their orifices, descendants and derivatives), a previous shipment that contained
severe najs as cargo, and in case of an unknown history of the previous shipment.
The conductor plays a key role in assembling and directing halal food supply chain networks, similar to a conductor of an orchestra in creating a harmonious performance. The conductor should be knowledgeable of the market requirements, halal certified storage and transportation available, and the existing halal certification bodies (with their halal standard and which HCBs they recognize). The conductor is seeking synergy advantages through vertical collaboration, allowing for effective halal supply chain assurance, standardization of halal assets in a supply chain, and supply chain optimization [10]. The conductor can be the brand owner itself or a 4th party logistics service provider. The orchestrator is not a warehouse operator or transporter, but identifies the best supply chain partners for a particular supply chain scenario. The actual warehousing and transportation requirements are therefore outsourced to other logistics service providers, such as transporters, warehouse operators and freight forwarders. The conductor will specify in contracts with the logistics service providers the handling instruction and communication requirements (“halal supply chain” code on labels, freight documents and in IT system). This to ensure halal compliance of the logistics activities in the supply chain in accordance with the international halal logistics standard [8] and possible other local market requirements.
The halal certification body (HCB) provides an important reference for the market requirements of the destination market, but also is important in the certification or compliance guidelines of halal supply chain partners: supplier, logistics service provider and recipient. The HCB has a halal standard in place that specifies the requirements of the halal business processes to comply with the ruling religious school of thought, local fatwa’s (religious ruling) and local customs.
The actual halal supply chain network structure can be made up of various combinations of “supplier-logistics service provider-recipient”. These supply chain partners can be (i) halal certified, (ii) use evidence based internal halal system, or (iii) have basic halal practices in place (figure 2). In case a partner is halal certified, its operations are halal certified by a HCB according to a local, regional or international halal standard. It is also possible that a supply chain partner is not halal certified, but it has incorporated halal requirements into their operations system, following a local, regional or international halal standard. This is a possible scenario where halal certification of this type of operations is not possible in a country or the party has decided not to get certified at this point in time. A third possibility (basic halal practices) is
Journal of Halal Research | page 17
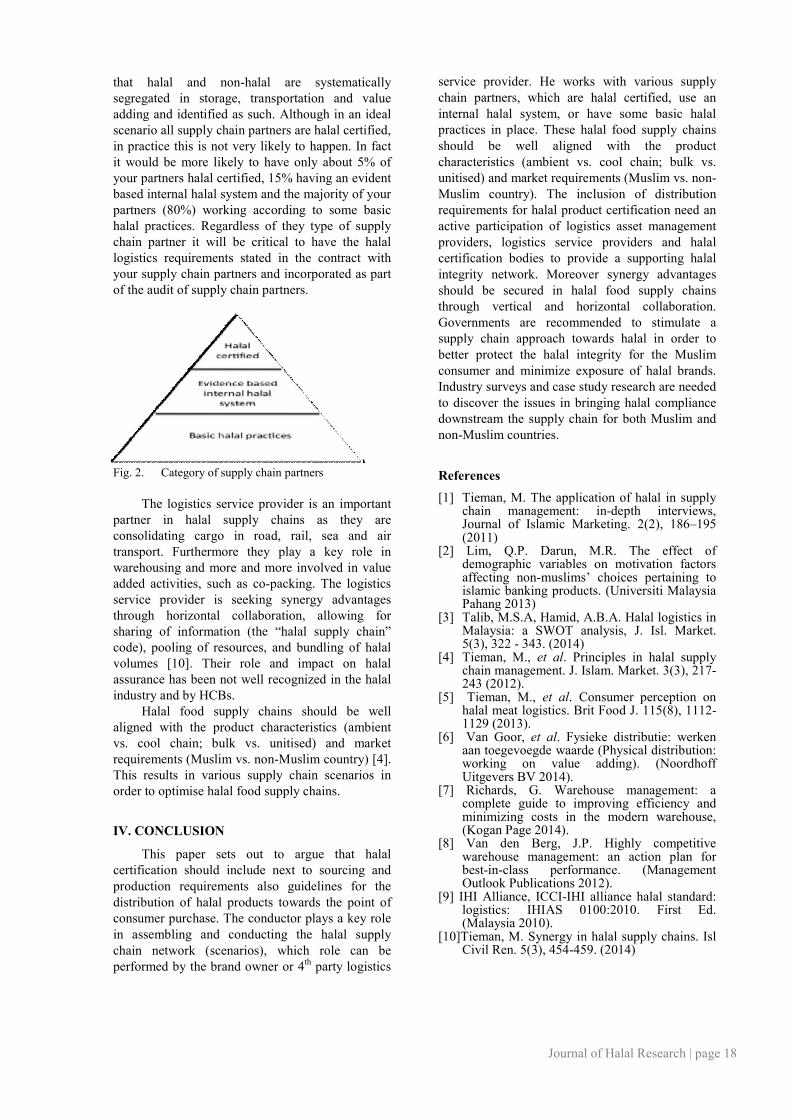
that halal and non-halal are systematically segregated in storage, transportation and value adding and identified as such. Although in an ideal scenario all supply chain partners are halal certified, in practice this is not very likely to happen. In fact it would be more likely to have only about 5% of your partners halal certified, 15% having an evident based internal halal system and the majority of your partners (80%) working according to some basic halal practices. Regardless of they type of supply chain partner it will be critical to have the halal logistics requirements stated in the contract with your supply chain partners and incorporated as part of the audit of supply chain partners.
Fig. 2. Category of supply chain partners The logistics service provider is an important
partner in halal supply chains as they are consolidating cargo in road, rail, sea and air transport. Furthermore they play a key role in warehousing and more and more involved in value added activities, such as co-packing. The logistics service provider is seeking synergy advantages through horizontal collaboration, allowing for sharing of information (the “halal supply chain” code), pooling of resources, and bundling of halal volumes [10]. Their role and impact on halal assurance has been not well recognized in the halal industry and by HCBs.
Halal food supply chains should be well aligned with the product characteristics (ambient vs. cool chain; bulk vs. unitised) and market requirements (Muslim vs. non-Muslim country) [4]. This results in various supply chain scenarios in order to optimise halal food supply chains.
IV. CONCLUSION
This paper sets out to argue that halal certification should include next to sourcing and production requirements also guidelines for the distribution of halal products towards the point of consumer purchase. The conductor plays a key role in assembling and conducting the halal supply chain network (scenarios), which role can be performed by the brand owner or 4th party logistics
service provider. He works with various supply chain partners, which are halal certified, use an internal halal system, or have some basic halal practices in place. These halal food supply chains should be well aligned with the product characteristics (ambient vs. cool chain; bulk vs. unitised) and market requirements (Muslim vs. non-Muslim country). The inclusion of distribution requirements for halal product certification need an active participation of logistics asset management providers, logistics service providers and halal certification bodies to provide a supporting halal integrity network. Moreover synergy advantages should be secured in halal food supply chains through vertical and horizontal collaboration. Governments are recommended to stimulate a supply chain approach towards halal in order to better protect the halal integrity for the Muslim consumer and minimize exposure of halal brands. Industry surveys and case study research are needed to discover the issues in bringing halal compliance downstream the supply chain for both Muslim and non-Muslim countries.
References
[1] Tieman, M. The application of halal in supply chain management: in-depth interviews, Journal of Islamic Marketing. 2(2), 186–195 (2011)
[2] Lim, Q.P. Darun, M.R. The effect of demographic variables on motivation factors affecting non-muslims’ choices pertaining to islamic banking products. (Universiti Malaysia Pahang 2013)
[3] Talib, M.S.A, Hamid, A.B.A. Halal logistics in Malaysia: a SWOT analysis, J. Isl. Market. 5(3), 322 - 343. (2014)
[4] Tieman, M., et al. Principles in halal supply chain management. J. Islam. Market. 3(3), 217-243 (2012).
[5] Tieman, M., et al. Consumer perception on halal meat logistics. Brit Food J. 115(8), 1112-1129 (2013).
[6] Van Goor, et al. Fysieke distributie: werken aan toegevoegde waarde (Physical distribution: working on value adding). (Noordhoff Uitgevers BV 2014).
[7] Richards, G. Warehouse management: a complete guide to improving efficiency and minimizing costs in the modern warehouse, (Kogan Page 2014).
[8] Van den Berg, J.P. Highly competitive warehouse management: an action plan for best-in-class performance. (Management Outlook Publications 2012).
[9] IHI Alliance, ICCI-IHI alliance halal standard: logistics: IHIAS 0100:2010. First Ed. (Malaysia 2010).
[10]Tieman, M. Synergy in halal supply chains. Isl Civil Ren. 5(3), 454-459. (2014)
Journal of Halal Research | page 18

Information System Development on Halal Supply Chain Traceability (Case Study: Supply Chain of Beef Meat Balls)
Dwi Purnomo1, Totok Pujianto2, Rizal Maulana3
1 Dept. of Agro-Industrial Technology, Faculty of Agroindustrial Technology, Universitas Padjadjaran ([email protected])
2 Dept. of Agro-Industrial Technology, Faculty of Agroindustrial Technology, Universitas Padjadjaran ([email protected])
3 Dept. of Agro-Industrial Technology, Faculty of Agro industrial Technology, Universitas Padjadjaran ([email protected])
Abstract
Processed beef products were prone to negative manipulation, which is done by several actor. It will cause uneasiness and discomfort for the consumers. Consumers need information access to ensure that the products that were consumed fulfill the general quality standard and Halal requirements. This research aimed to design a system of information that could support halal status traceability of beef processed products to facilitate consumer access to more product information . Waterfall model was chosen to develop the information system. The information, which is provided in the information system, includes general information such as identity of the actor, existence of documents, which related with quality and Halal assurance. In addition it also provided information about the condition of 5M resources (material, machine, method, man, and money) were represented by a radar chart compared with ideal condition. The condition of resources was presented in the form of a star rating which symbolize the resources condition. Additional functioninclude tracking for beef supply origin, supported by google maps. Such tools will make it easier for consumers to get more information about the actor. Keywords Information system, traceability, halal, processed beef products
I. Introduction Processed beef products are popular
livestock products. This could be seen by the high number of cattle slaughtering in West Java Province in 2011 which had reached 687,457 cattle. This number was greater compared to the population of beef cattle, which only reached 422,989 cattle [1]. The high demand and scarce supply, result in high price. These conditions and also low awareness of the actors (person or entities involved) along the supply chain had triggered a variety of frauds, especially for hampering quality. Such fraud caused consumers discomfort, demanding more access to information that will assure good quality products [2].
Aside from quality, most Indonesian consumers have a high preference on halal products. Halal Assurance System (HAS) 23000 standards required meticulous quality assurance throughout the process, from farm to fork [3], ensuring traceability. Applying halal in comprehensive system will assured other legal aspects, enable food production with the highest quality [2]. However, the extensive and complex business process made the halal supply chain distribution network, especially in processed beef products, became a major obstacle in documenting halal and quality assurance. Many data were not properly recorded and were also not pass on from one actor to another [3]. Government has stipulate traceability record through Agriculture Regulation No. 20/Permentan/ OT.140 / 2/2010 about Food
Quality Assurance System of Agricultural Products in Article 19, Paragraph 1. The rapid developments of technology can be utilize to overcome the inability to traces processed beef products status. For example, Thailand had focused on developing ICT-based information systems (Information Communication Technology) in their effort to guarantee halal products [5]. This paper will identifying the halal supply chain model of processed beef products and construct an information systems which will support traceability. However, meatball will be the focus considering it is the most popular commodity and the frequent negative it sufferred related to quality and halal issue. II. Methodology Waterfall model will be used to develop the proposed halal information systems. Survey by interviews and direct observation was conducted between August 2013 to July 2014 in the city of Tasikmalaya, Bandung and Bogor (West Java province, Indonesia) to map halal meatballs supply chain. Two meatballs producers in Bandung were use as the primary meatball actors. Data was then processed with a descriptive approach that describes the results of a survey into an easily understood narrative. Data processing and information system design is performed in the Laboratory Information System and Management, Department of Agricultural Engineering and Industrial Management, Faculty of Agro industrial Technology Universitas Padjadjaran.
Journal of Halal Research | page 19

Fig 1. Waterfall Model IV. System Analysis
Concepts of design were the first stage of system analysis development. It is constructed by a thorough literature study related to halal traceability system. The aime was to define the main function of the system, which the process is depicted in Fig. 2.
Fig 2. Traceability System Standard
The information systems itself were built on websites based with easy accessed. The tracing process use upstream traceability concept which focus on processing actor. Fig. 3 illustrate the tracing procedure, which was conducted between relevant actors from the processor, continued to beef supplier, then to slaughterhouses (which is Tempat Pemotongan Hewan-TPH for small scale butcher and Rumah Pemotongan hewan-RPH for large scale). The appraisal of halal status application in each actor refers to LPPOM-MUI HAS23000 standards. The survey have identified that cattle supplies is dominated by Central Java and East Java province. However, this cross provincial distribution makes it difficult to trace to the cattle origins. Thus, traceability system does not apply to cattle origin while this may effect meatballs quality in the end.. .
Fig 3. Tracing path between actors
Each resources were identified as variables. The important variables from this research are Machine, Material Method, Man and Money (5M), attributed to each actor. Tracing procedure (Fig. 4) was conducted to obtain information related to the resources of actors. The initial phase was to trace each actors (industrial processing, suppliers and slaughterhouse / RPH). Then, assessment were made on each resource conditions among each actor. Assessment was conducted by discussions with experts.
Start
Tracing
Meatballs Industries
Meat Suppliers
Slaughterhouses
ActorsResources
Valuing
Data from Producers
Data from Meat Supliers
Data from Slaughter-
houses
Experts
Actor's Resources & Capabiltiy Mapping
Fig 4. Tracing mechanism to identify resources of each actors
The results of the tracing mechanism would be
informed in the halal information systems in form of the data actors. Activities were continued in designing the development of the basic concept. The system was designed in Data Context Diagram (DCD) which would resulted a Data Flow Diagrams (DFD) which describes general information. There are three external actors related to information systems (Fig. 5), each have different access rights. DCD also showed two types of direction arrows. The first was the direction of the arrow pointing to the information system, meaning that the flow of data had been inputted for the system. The second is the opposite.
The first actor was the visitor. Visitor’s role was receivers of the information that had been processed by the system with the help of an administrator / super administrator. Information received by visitors was halal traceability information ranging from the product processing and origin of the meat supply sources used in the manufacture of processed products. Administrators system makes sure that the information in the system work well. Management system consists of inputting data, data changing if there were errors occurred or improvements needed to be made and deletion of data. The super administrator managed data administrators. In other words, only the super administrator had the access all level or added new administrators.
Journal of Halal Research | page 20

Halal Products Traceabilty Information
System
Super Administrator
Administrator
VisitorsHalal
Products Traceabilty Information
Managerial
Data Input Administrator
Question / Comment
Question / Comment
Managerial
Question / Comment
Figure 5. Data Context Diagram (DCD) DCD model continued by Data Flow Diagrams (DFD). DFD prepared to further elaboration on the functional information system developed (Saladin and Rosa, 2013). The administrator had six activities include the management of the information systems. The first activity is the activity log, the second is to manage the article, the third is to manage the data actor, the fourth is managing actor’s resources data factors and criteria, fifth and sixth article management is the management of data admin. The DFD level 1 of the system is presented in Figure 6
Fig 6. DBD level 1 Database System Design
Database design was developed to set the data to be stored and available when needed.
Inftomstion SystemData Entity
Articles
Admin
Criteria & Resources
Data
Producers Data
Suppliers Data
Slaughter-houses Data
Comments
Figure 7. DFD Level 1 Data entity is a core data that would be stored in the database. On Fig. 7 showed that, there are four data entities that must exist and stored in the system information. The data entities consist of: 4. Entities articles containing data, which
contained halal aspects of the products, supply chain.
5. Entities that contain data processing Data processing, ranging from general data and associated data variable tehadap assessment 5M (Machine, Material, Method, Man, Money) and other factors.
6. Entity Data contained merchant’s data, ranging from general data and associated data variable with assessment on 5M (Machine, Material, Method, Man, Money) and factors.
7. An entity of data that contains the slaughterhouse data, ranging from general data and associated data variable assessment 5M (Machine, Material, Method, Man, Money) and factors.
8. Admin Data Entity that contains data about the admin or administrator of the system
9. Entity Data Factors and Criteria 5M containing 5M resource factors and criteria used in the assessment process. Lastly is the comment that stores data visitor comments.
V. Results and Discussion
Web page is divided into two main parts. The first part is the admin page, which provide information systems management. The second section dedicated for visitors to trace the halal products traceability. To access the admin page, administrator must log in first. Admin area is divided into four sections. The first part dedicated to maintaining actors data, the second part to manage the data, the third part is provided to manage the data message / comment and the fourth part is the logout link. The management data page provided to manage all data input from processing level up to the slaughterhouses. The page navigated administrator in data management. Data management consists of data auditioning, viewing
Journal of Halal Research | page 21
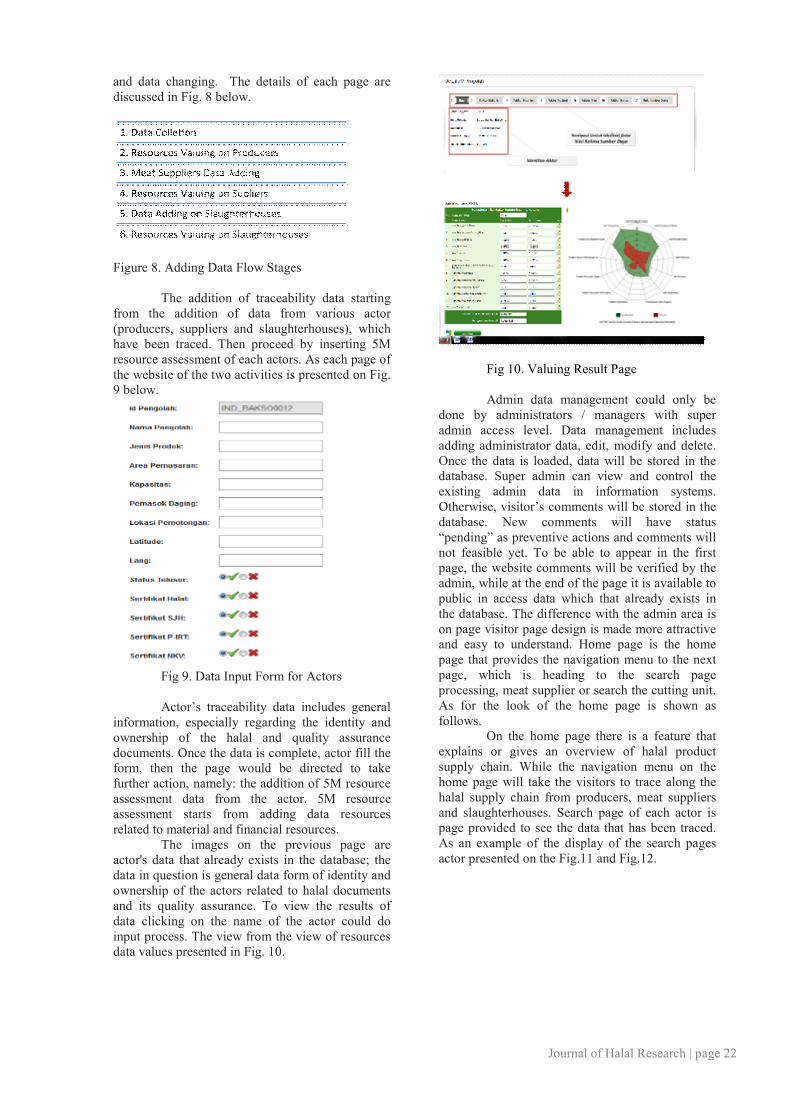
and data changing. The details of each page are discussed in Fig. 8 below.
Figure 8. Adding Data Flow Stages
The addition of traceability data starting from the addition of data from various actor (producers, suppliers and slaughterhouses), which have been traced. Then proceed by inserting 5M resource assessment of each actors. As each page of the website of the two activities is presented on Fig. 9 below.
Fig 9. Data Input Form for Actors Actor’s traceability data includes general
information, especially regarding the identity and ownership of the halal and quality assurance documents. Once the data is complete, actor fill the form, then the page would be directed to take further action, namely: the addition of 5M resource assessment data from the actor. 5M resource assessment starts from adding data resources related to material and financial resources.
The images on the previous page are actor's data that already exists in the database; the data in question is general data form of identity and ownership of the actors related to halal documents and its quality assurance. To view the results of data clicking on the name of the actor could do input process. The view from the view of resources data values presented in Fig. 10.
Fig 10. Valuing Result Page Admin data management could only be
done by administrators / managers with super admin access level. Data management includes adding administrator data, edit, modify and delete. Once the data is loaded, data will be stored in the database. Super admin can view and control the existing admin data in information systems. Otherwise, visitor’s comments will be stored in the database. New comments will have status “pending” as preventive actions and comments will not feasible yet. To be able to appear in the first page, the website comments will be verified by the admin, while at the end of the page it is available to public in access data which that already exists in the database. The difference with the admin area is on page visitor page design is made more attractive and easy to understand. Home page is the home page that provides the navigation menu to the next page, which is heading to the search page processing, meat supplier or search the cutting unit. As for the look of the home page is shown as follows.
On the home page there is a feature that explains or gives an overview of halal product supply chain. While the navigation menu on the home page will take the visitors to trace along the halal supply chain from producers, meat suppliers and slaughterhouses. Search page of each actor is page provided to see the data that has been traced. As an example of the display of the search pages actor presented on the Fig.11 and Fig.12.
Journal of Halal Research | page 22
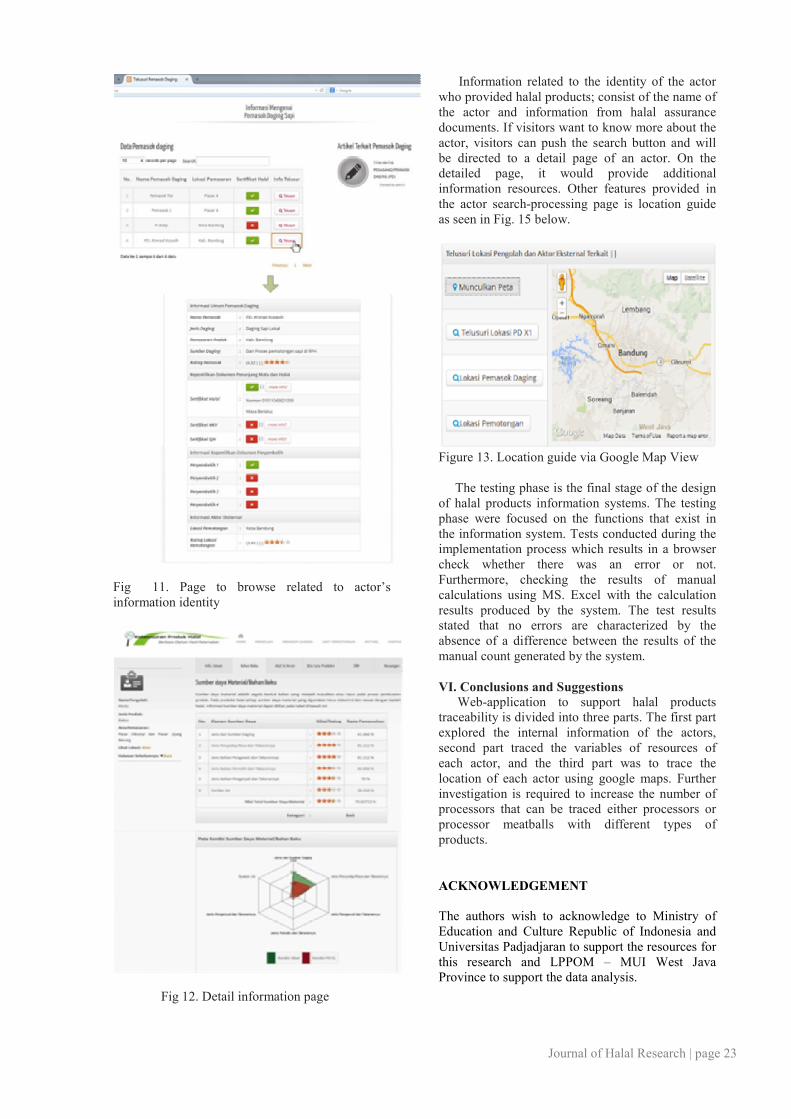
Fig 11. Page to browse related to actor’s information identity
Fig 12. Detail information page
Information related to the identity of the actor who provided halal products; consist of the name of the actor and information from halal assurance documents. If visitors want to know more about the actor, visitors can push the search button and will be directed to a detail page of an actor. On the detailed page, it would provide additional information resources. Other features provided in the actor search-processing page is location guide as seen in Fig. 15 below.
Figure 13. Location guide via Google Map View The testing phase is the final stage of the design of halal products information systems. The testing phase were focused on the functions that exist in the information system. Tests conducted during the implementation process which results in a browser check whether there was an error or not. Furthermore, checking the results of manual calculations using MS. Excel with the calculation results produced by the system. The test results stated that no errors are characterized by the absence of a difference between the results of the manual count generated by the system. VI. Conclusions and Suggestions Web-application to support halal products traceability is divided into three parts. The first part explored the internal information of the actors, second part traced the variables of resources of each actor, and the third part was to trace the location of each actor using google maps. Further investigation is required to increase the number of processors that can be traced either processors or processor meatballs with different types of products. ACKNOWLEDGEMENT The authors wish to acknowledge to Ministry of Education and Culture Republic of Indonesia and Universitas Padjadjaran to support the resources for this research and LPPOM – MUI West Java Province to support the data analysis.
Journal of Halal Research | page 23
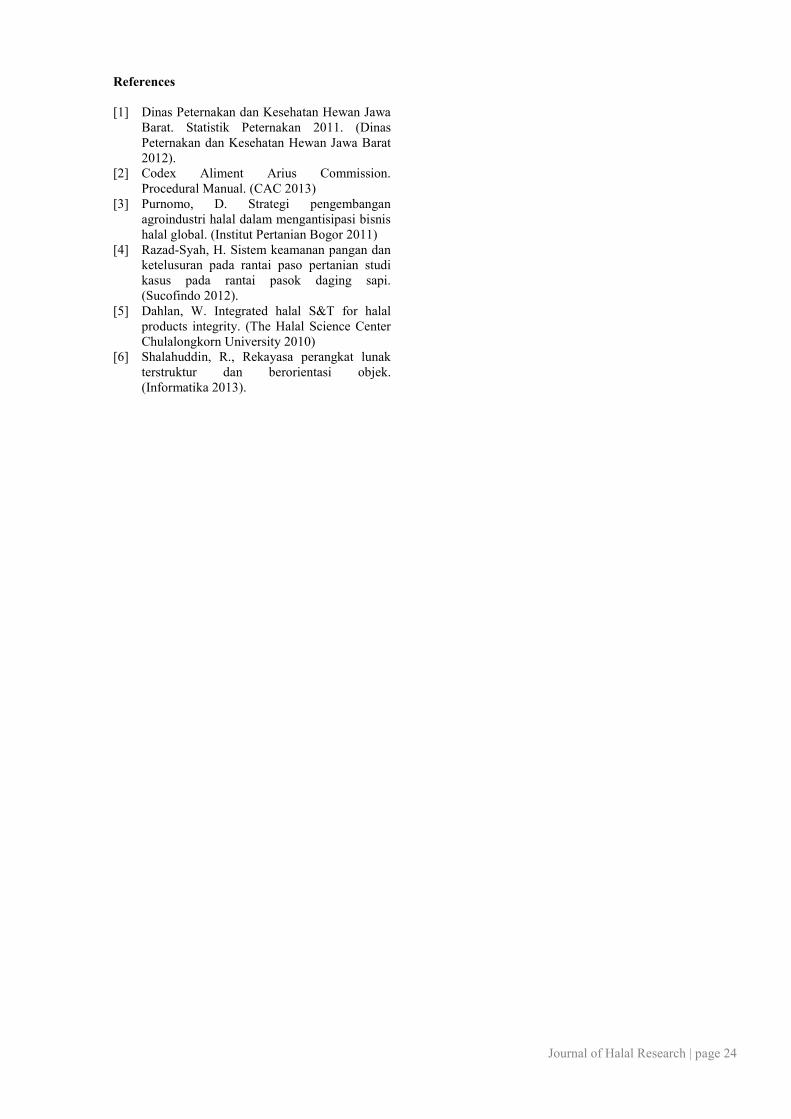
References [1] Dinas Peternakan dan Kesehatan Hewan Jawa
Barat. Statistik Peternakan 2011. (Dinas Peternakan dan Kesehatan Hewan Jawa Barat 2012).
[2] Codex Aliment Arius Commission. Procedural Manual. (CAC 2013)
[3] Purnomo, D. Strategi pengembangan agroindustri halal dalam mengantisipasi bisnis halal global. (Institut Pertanian Bogor 2011)
[4] Razad-Syah, H. Sistem keamanan pangan dan ketelusuran pada rantai paso pertanian studi kasus pada rantai pasok daging sapi. (Sucofindo 2012).
[5] Dahlan, W. Integrated halal S&T for halal products integrity. (The Halal Science Center Chulalongkorn University 2010)
[6] Shalahuddin, R., Rekayasa perangkat lunak terstruktur dan berorientasi objek. (Informatika 2013).
Journal of Halal Research | page 24

Fermentation Profiles of Nabidh (Fruit Juice)
Rahajeng Aditya1, Dahrul Syah1, Muti Arintawati2
1Department of Food Science and Technology, Fac. Agricultural Technology, Bogor Agricultural University-
IPB PO BOX 220, Bogor, Indonesia 16680 ([email protected])
2The Assessment Institute for Foods, Drugs, and Cosmetics Indonesian Council of Ulama (LPPOM MUI), LPPOM MUI, Global Halal Centre building, Pemuda street 5, Bogor, Indonesia 16161 ([email protected])
Abstract Prophet Mohammed did not consume the nabidh (fermented fruit juice) after three days. However, it is not clear the reasoning for such act, which sparkle a dispute on the requirement of fermented beverage, especially on its ethanol content. This study will analyze nabidh fermentation profile to build a mathematical model than enables us to predict the nature of such fermentation. Nabidhs from grape, apple, and dates were fermentated for five days consecutively. Daily HPLC analysis were performed to measure sugar (glucose, fructose, and sucrose), alcohol (methanol, ethanol, propanol, butanol), and acid (tartaric acid, citric acid, malic acid, acetic acid). After measuring the statistically most signifant compound, a mathematical model and ratio fraction were constructed. Ethanol was shown to have the strongest correlation to fermentation period until the fifth day with concentration under 1%. The patterns of ethanol content between each nabidhs is similar. The ratio of sugar, ethanol, and acid in all nabidhs also undergoes a similar patterns. Keywords: nabidh, fermentation, fermentation model, ratio fraction
I. Introduction
The study about alcohol is one of the strategic issue, especially in halal science [1]. The fruit juice beverages called Nabidh in Arabic is interesting to be studied from halal prespective. In a hadith from Ibnu Abbas, nabidz (nabidh) is said to be prepared in the night. Afterwards, Prophet Mohammed PBUH still drank it for 3 consecutive day until evening. If there was remaining nabidh, Rasulullah gave it to his assistant or asked the remaining to be thrown away (HR Muslim 4971-4974). In another hadith, Prophet Mohammed PBUH stated, “Drink the nabidh before it become hard.” His friends then ask, “How long it can be hard?” The Prophet replied, “In three days”, (HR Imam Ahmad). This research will study fermentation condition to measure significant compound and its fraction, which would enables us to build a mathematical model, and ratio fraction. This study is expected to be a valuable referral for ethanol content requirement in halal certification.
II. Materials and Method
Preparation of Nabidh and Fermentation
Vitis vinifera grape nabidh and Malang apple nabidh was made by removing seeds, weighting and crushing with juicer. It is then filtered by muslin cloth. Deglet nour (Tunisian) date juice was made mixing boiled water and date’s pulp with 1:3 ratio, and stirred slowly for 5 minutes. After being submerged for 9 hours in RT, dates water juice is filtered with Muslin cloth [2].
Each nabidhs is then fermented for five consecutived incubation day in 5 separate closed bottle, containing 20 mL nabidh, in microaerophilic condition at 29ºC. Sample were taken for each day and analyzed with HPLC analysis with RID detector to measured sugar, alcohol and acid level.
Sugar (glucose, fructose, and sucrose) measurement were performed using RH column, and 75% acetonitrile as the mobile phase. Alcohol (methanol, ethanol, propanol, butanol) were measured using amino column, and 0.01 N sulfuric acid as mobile phase. Meanwhile, acid (tartaric acid, citric acid, malic acid, acetic acid) were analyzed using UV detector, C18 column, and buffer phosphate as mobile phase. All chemicals use HPLC grade chemicals from Merck (USA).
Correlation Analysis and The Influence of
Fermentation Period (day)
Pearson correlation analysis (Minitab 15) was performed to measured relation between these perimeter (for each nabidh) and incubation time. ANOVA (SAS 9.1.3) were used to measured the influence of those perimeter that give the most significant correlation. Tukey method (SAS 9.1.3) were also used to determine the incubation time that influence the compound output. This is to know what day has the most influence to the most significant compound. Pattern similarity between each nabidh fermentation were measured using Cluster Analysis (Minitab 15).
Modeling Fermentation Mathematically
Mathematical model is applied for all fermentation perimeter (sugar, ethanol, acid) in each
Journal of Halal Research | page 25

nabidhs to describe its dynamic. It is done by assuming dynamics of sugar, ethanol, and acid in the fermentation process. Based on research data, differential functions were then constructed from each compounds by entering it into Mathematica 7.0 for Students program as describe below:
dX/dt = change rate of “X” at certain “t” X = compound/function of compound r = growth ratio of compound K = capacity of the amount of compound t = time
By using Least Square method, value of gauge
perimeter were produced to describe such dynamics. Least Square Method is a classic method that is used in fathoming the dynamic system perimeter [9] The result from the calculation will be gauge perimeter , MRE (Mean Relative Error) value, function/exact solution, plot of gauge solution curve with the spreading of research data, and plot of combination curve of gauge solution with the spreading of the eprimeter. The perimeter of sugar, ethanol, and acid will be used by Mathematica 7.0 for Students in differential function. This function is a dynamic system solution, as a substitution from the value of α (sugar), β (ethanol), dan γ (acid). The mathematical model will then be confirm by comparing between gauge solution curve versus curve plot of data. It would also be calculated by the value of MRE (Mean Relative Error) in every compound. When the value of MRE is closer to 0, the incorrectness become smaller, therefore the model become better. In fermentation, sugar is known to be utilize, forming ethanol and acid. This will result in an equation as below:
dS/dt = change rate of sugar at certain time dE/dt = change rate of ethanol at certain time dA/dt = change rate of acid at certain time S = concentration of sugar E = concentration of ethanol A = concentration of acid S[t] = function of sugar E[t] = function of ethanol A[t] = function of acid α = perimeter of sugar’s differential function β = perimeter of ethanol’s differential function γ = perimeter of acid’s differential function K = maximum amount of sugar/ethanol/acid in
nabidhs t = time
Then amount of sugar, ethanol, and acid at day 3 were calculated using Mathematica 7.0 for Student
according to the above formula for each nabidhs. It is then compare with the actual data for the same day.
The fraction of sugar, ethanol, and acid were calculated with the following formula :
F=X
Y
F = fraction of sugar/ethanol/acid X = the amount of compound at day 3 based on calculation with mathematics model Y = the maximum amount of compound
III. Results and Discussion
Fermentation Profiles
A.1 The dynamics of sugar concentration
During fermentation, yeast invertase will hydrolize starch in the nabidh to become monosacharride reducing sugars (such as fructose and glucose), and disaccharide (such as sucrose) [3]. The amount of fructose and glucose increase in the beginning of the second and third day of fermentation, respectively. Its is then reduced until the fifth day. Sucrose (disaccaride) decrease to an undetectable level from day two untill the end. The hydrolising process cause the amount of sucrose decrease everyday until day-5. Table 1 The effect of fermentation time toward glucose concentration
A.2 The amount of ethanol
Simple sugar that is produced by fermentation, and further converted into alcohol. The conversion of monosaccharide (glucose and fructose) to alcoholic in fermentation is caused by zymase, a yeast enzyme [3]. This microorganism metabolized glucose and fructose to form piruvic acid though Embden-Meyerhof-Parnas (EMP) pathway. Piruvic acid will then decarboxylated to form asetaldehid, which would be further dehydrogenated to become ethanol [1].
(3)
Journal of Halal Research | page 25

Table 1. The escalating amount of alcohol (ethanol) following increasing fermentation period.
Within the first day of fermentation process, the amount of ethanol still low. At day-0, alcohol (ethanol) do not produced yet in apple nabidh and date nabidh. This occur possibility because onky yeast that took significant role to produce ethanol, meanwhile mold only hydrolyze starch.
After the second day, ethanol begin to increase significantly within each day until day-5. This is because microorganism is in logaritmic phase. In addition to, at that period, yeast and mold form alcohol equally, therefore alcohol forming rate will go faster. In alcohol productivity, mold probably also have a role to influence the forming of alcohol. Mold, beside hydrolize starch, also use starch and sugar to form ethanol. Saono and Basuki [8] reported that mold can use starch and glucose to form ethanol and biomass cell. Alcohol fermentation itself need 30-72 hours time to occur [7]. When mold hydrolyze starch, the resulting sugar will be rapidly use by yeast as a carbon source, to form alcohol. This is because yeast use sugar better than starch for carbon source [8]. At day-5, the increasing rate of alcohol production starts to enter a plateu growth phase due to the limited nutrient in the media.
Grape nabidh showed the highes amount of ethanol (between 0.01% and 0.95%) due to the high reducing sugar content. Meanwhile, the lowest amount of ethanol is produced by apple nabidh (between 0% to 0.45%). Ethanol content in date nabidh comes in between other nabidh.
Grape nabidh has the highest reducing sugar quantity yet show lower ethanol; possibly due to sugar saturation. Tollerated sugar concentration for mold is between 14-18% [7]. If the concentration of sugar is too high, the activity of mold could be inhibited, which expands fermentation period and making only a fraction of sugar can be utilize. In high concentration (more than 150 g/L), sugar will inhibit the activity of enzyme by suppressing oxidation chain [4].
A.3 The amount of acid
Acid that produced from the fermentation is organic acids. The whole acids that produced consist of tartaric acid, malic acid, citric acid, and acetic acid. Generally, amount of acid increase significantly at the end of fermentation (day-4 and day-5). This is caused by the resulting anaerobic
condition. This condition cause decreasing number of yeast and increasing bacteria production, resulted in increasing of acid. Table 2 The increasing concentration of all acid along the fermentation time
A.4 Overall Profiles of Fermentation
Each of nabidh have different fermentation profiles except for sugar which is all the same. In grape nabidh, fermentation profiles consist of alcohol (ethanol), and organic acid (tartaric, citric, and malic acid). In apple nabidh, consist of, alcohol (ethanol), and organic acid (citric and malic acid). In date nabidh, consist of, alcohol (ethanol), and organic acid (tartaric, malic, and acetic acid). Table 3 The dynamic interplay between the concentration of sugar, ethanol and acid
Analysis of Significance
The correlation analysis (Minitab 15) for the nabidh showing significant value (Pvalue < 0.05) for only ethanol in all nabidh. The value of correlation coefficient between fermentation time and ethanol content shows more than 0.9 value for all nabidh. This shows a strong correlation (Sarwono 2006). Table 3 The perimeter which has significant value
Variables
The Significance Value
Grape Nabidh
Apple Nabidh
Date Nabidh
Fructose 0.020 0.014
Glucose 0.011
Sucrose 0.032 0.001
Ethanol 0.001 0.001 0.004
Tartaric acid 0.029 0.003
Citric acid 0.002
Malic acid 0.030 0.003
Acetic acid 0.047
Journal of Halal Research | page 26
Analysis of The Influence of Fermentation Period Analysis of whether fermentation time (day)
influence ethanol amount is performed using ANOVA (=0.05) by S.A.S 9.1.3 program. All nabidh shows that a minimum one day fermentation time will influence the ethanol content. The application of Tukey method analysis showed different result in terms of each nabidhs influence. Grape, apple and date nabidh displayed significant influence in day-2, day-1 and day-3 respectively. The result for grape nabidh and date nabidh is similar with previous research [6].
Analysis of The Similarities of Fermentation Pattern
Cluster analysis were applied on ethanol amount to understand the grouping based on the similarities of the attribute between groups. The attribute is fermentation pattern of ethanol in every nabidhs for each day. Analysis showed that there are two groups of cluster. The first cluster is ethanol from grape and apple nabidh with 99.7976 level of similarity. The second cluster is ethanol from date and grape and apple nabidh with 95.7563 level of similarity. Regardless of the resulting two cluster, the close value between both cluster showed similarity between the attribute for all nabidhs fermentation pattern of ethanol.
Fig. 4. Dendogram of cluster analysis between nabidh
displaying two cluster which is grape-apple nabidhs and
apple-date nabidhs
Mathematical Model
The value of gauge perimeter in grape nabidh is 0.0429026 for sugar (α), 0.160232 for ethanol (β), and 0.0721248 for acid (γ). “K” value for sugar, ethanol and acid 4, 1 and 10 consecutively. Based on this value, the mathematics model for grape nabidh is:
dS
dt= 0.0429026 S [t ](4− S [t ]
4 )
dE
dt= 0.160232 E [t ](1− E [t ]
1 )S [ t ]
dAdt
= 0.0721248 A [t ](10− A [t ]10 )S [t ]
In apple nabidh, the value of gauge perimeter fo sugar (α), ethanol (β) and acid (γ) is 0.148887, 0.176262, and 0.125164, respectively. Meanwhile, “K” value is 4, 0.5 and 13 for sugar, ethanol and acid. The mathematics model for apple nabidh will then be constructed as follows:
dS
dt= 0.148887 S [t ](4− S [t ]
4 )
dEdt
= 0.176262 E [t ](0.5− E [t ]0.5 )S [t ]
/
In date nabidh, sugar (α), ethanol (β) and acid (γ) showed gauge perimeter value of 0.0928585, 0.0736481, and 0.0706107. Meanwhile, its “K” value is 8.0, 0.6, and 9.0 for sugar, ethanol and acid respectively. The mathematics model will then follow the below equation:
dSdt
= 0.0928585 S [t](8− S [ t ]
8 )
dEdt
= 0.0736481 E [t ](0.6− E [t ]0.6 )S [t ]
dA
dt= 0.0706107 A [t ](9− A [t ]
9 )S [ t ]
Related to MRE value, ethanol for all nabidhs showed an MRE absolute value less than 2% (data not shown) meaning that incorrectness is small and the model will be better in simulating real coldition. The absolute value of sugar MRE in all nabidhs is also less than 5%. Meanwhile, MRE value acid is low for apple nabidh (-1.73%) and relatively high for grape (-24.60%) and date (-15.54%.). The negative mark mean that the gauge solution curve is disposed under the spreading data. The unconformity for sugar and acid between each nabidh varies, meanwhile for ethanol all showed an absolute value under 4% (data not shown).
The mathematics model showed a simpler method to interpret a problem and make a better prediction. The gap between mathematical model and future research data can be influenced by the data progression and the type of model that is being used.
Ratio Fraction
The calculation of the amount of sugar, ethanol, and acid at day-3 (t=3) Mathematica 7.0 for Students is showed in table 4.
Journal of Halal Research | page 27
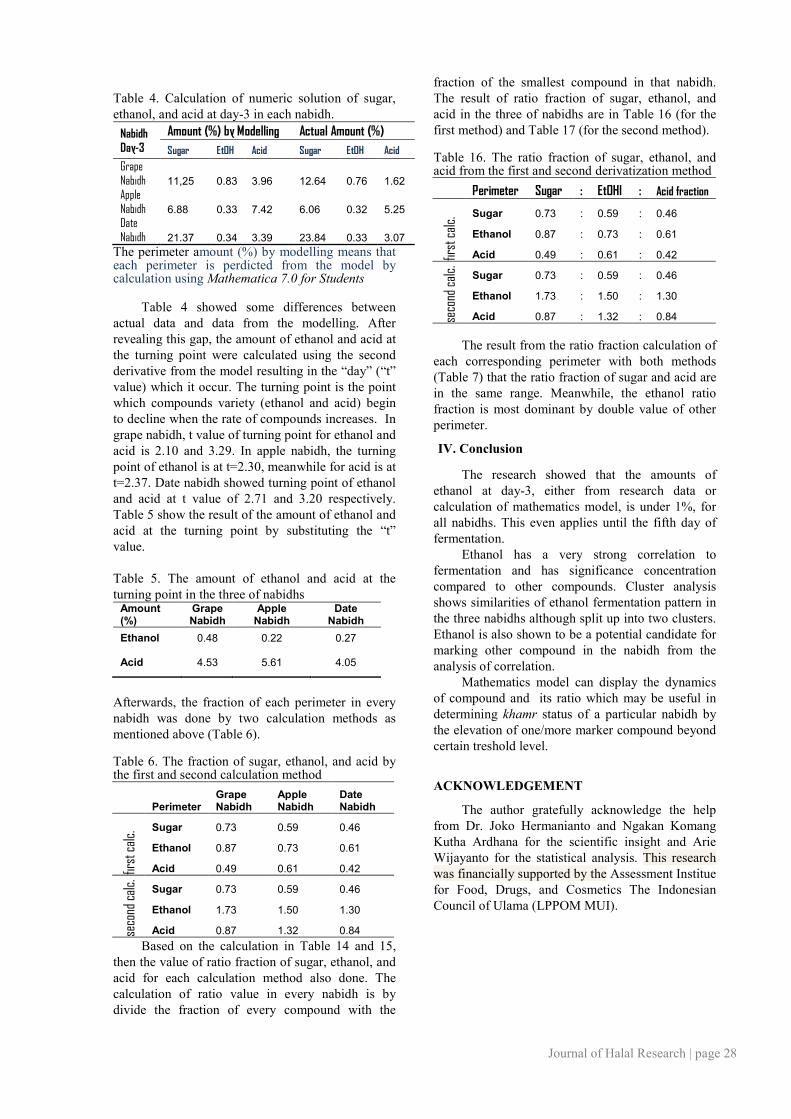
Table 4. Calculation of numeric solution of sugar, ethanol, and acid at day-3 in each nabidh.
Nabidh Day-3
Amount (%) by Modelling Actual Amount (%)
Sugar EtOH Acid Sugar EtOH Acid
Grape Nabidh 11,25 0.83 3.96 12.64 0.76 1.62 Apple Nabidh 6.88 0.33 7.42 6.06 0.32 5.25 Date Nabidh 21.37 0.34 3.39 23.84 0.33 3.07
The perimeter amount (%) by modelling means that each perimeter is perdicted from the model by calculation using Mathematica 7.0 for Students
Table 4 showed some differences between actual data and data from the modelling. After revealing this gap, the amount of ethanol and acid at the turning point were calculated using the second derivative from the model resulting in the “day” (“t” value) which it occur. The turning point is the point which compounds variety (ethanol and acid) begin to decline when the rate of compounds increases. In grape nabidh, t value of turning point for ethanol and acid is 2.10 and 3.29. In apple nabidh, the turning point of ethanol is at t=2.30, meanwhile for acid is at t=2.37. Date nabidh showed turning point of ethanol and acid at t value of 2.71 and 3.20 respectively. Table 5 show the result of the amount of ethanol and acid at the turning point by substituting the “t” value.
Table 5. The amount of ethanol and acid at the turning point in the three of nabidhs
Amount (%)
Grape Nabidh
Apple Nabidh
Date Nabidh
Ethanol 0.48 0.22 0.27
Acid 4.53 5.61 4.05
Afterwards, the fraction of each perimeter in every nabidh was done by two calculation methods as mentioned above (Table 6). Table 6. The fraction of sugar, ethanol, and acid by the first and second calculation method
Perimeter Grape Nabidh
Apple Nabidh
Date Nabidh
first
cal
c. Sugar 0.73 0.59 0.46
Ethanol 0.87 0.73 0.61
Acid 0.49 0.61 0.42
seco
nd c
alc.
Sugar 0.73 0.59 0.46
Ethanol 1.73 1.50 1.30
Acid 0.87 1.32 0.84
Based on the calculation in Table 14 and 15, then the value of ratio fraction of sugar, ethanol, and acid for each calculation method also done. The calculation of ratio value in every nabidh is by divide the fraction of every compound with the
fraction of the smallest compound in that nabidh. The result of ratio fraction of sugar, ethanol, and acid in the three of nabidhs are in Table 16 (for the first method) and Table 17 (for the second method). Table 16. The ratio fraction of sugar, ethanol, and acid from the first and second derivatization method
Perimeter Sugar : EtOHl : Acid fraction
first
cal
c. Sugar 0.73 : 0.59 : 0.46
Ethanol 0.87 : 0.73 : 0.61
Acid 0.49 : 0.61 : 0.42
seco
nd c
alc.
Sugar 0.73 : 0.59 : 0.46
Ethanol 1.73 : 1.50 : 1.30
Acid 0.87 : 1.32 : 0.84
The result from the ratio fraction calculation of each corresponding perimeter with both methods (Table 7) that the ratio fraction of sugar and acid are in the same range. Meanwhile, the ethanol ratio fraction is most dominant by double value of other perimeter.
IV. Conclusion
The research showed that the amounts of ethanol at day-3, either from research data or calculation of mathematics model, is under 1%, for all nabidhs. This even applies until the fifth day of fermentation.
Ethanol has a very strong correlation to fermentation and has significance concentration compared to other compounds. Cluster analysis shows similarities of ethanol fermentation pattern in the three nabidhs although split up into two clusters. Ethanol is also shown to be a potential candidate for marking other compound in the nabidh from the analysis of correlation.
Mathematics model can display the dynamics of compound and its ratio which may be useful in determining khamr status of a particular nabidh by the elevation of one/more marker compound beyond certain treshold level.
ACKNOWLEDGEMENT
The author gratefully acknowledge the help from Dr. Joko Hermanianto and Ngakan Komang Kutha Ardhana for the scientific insight and Arie Wijayanto for the statistical analysis. This research was financially supported by the Assessment Institue for Food, Drugs, and Cosmetics The Indonesian Council of Ulama (LPPOM MUI).
Journal of Halal Research | page 28

References
[1] Amerine, et al. Technology of wine making. (The AVI Publishing Co. Inc. 1987).
[2] Dirar, H. A. The indigenous fermented foods of the sudan: a study in african food and nutrition. (CAB International Wallingford, 1993).
[3] Frazier, W. C. Food microbiology. (Tata Mc Graw-Hill Publishing Co. Ltd, 1977).
[4] Fiechter, A. Advances in Biochemical Engineering. Springer-Verlag, 1982).
[5] Hedwig, R. Teori sistem. (Universitas Bina Nusantara, 2010).
[6] Najiha, Anis. et. al. A preliminary study on halal limits for ethanol content in food products. Mid. East. J. Sci. Res. 6 (1), 45-50. (2010)
[7] Paturau, J. M. By product of the cane sugar industry. (Elsevier Scientific Publishing Co, 1982).
[8] Saono, S., Basuki, T. The amylolytic, lypolytic and proteolytic activities of yeast and mycelial molds from ragi and some indonesian traditional fermented food. Ann. Bogoriensis. 6, 207-219. (1979)
[9] Wijayanto, A. Pendugaan perimeter model dinamik dengan menggunakan metode robust dan implementasinya dengan gui mathematica [minithesis]. (IPB 2007).
Journal of Halal Research | page 29