editors: giorgio secreto, barnett zumoff 6. endocrine ... giorgia.pdfcirculating testosterone levels...
TRANSCRIPT

Research Signpost
37/661 (2), Fort P.O.
Trivandrum-695 023
Kerala, India
The Androgen-Excess Theory of Breast Cancer, 2012: 79-109 ISBN: 978-81-308-0507-8 Editors: Giorgio Secreto, Barnett Zumoff
6. Endocrine Classification of
Postmenopausal Breast Cancers
Giorgio Secreto
Hormone Research Laboratory, Department of Preventive and Predictive Medicine
Fondazione IRCCS Istituto Nazionale dei Tumori, Via Venezian 1
20133 Milan, Italy
Abstract. To further investigate the role of androgens in breast
cancer, we examined the relationship of serum levels of
testosterone to patient and tumor characteristics in a cohort of
about 600 postmenopausal patients. We found a significant
association of elevated testosterone levels with estrogen-receptor
(ER)-positive status and with high androgen-receptor (AR)-
positivity of tumors. These findings provide further evidence that
testosterone levels are a marker for hormone-dependent breast
cancer, as suggested in our previous studies (Chapter 4, section 2).
Evaluating both the serum testosterone levels (high/low) of the
patient and the ER status (positive/negative) of the tumor, we
identified four different groups of postmenopausal breast cancer
patients, who could be further divided in two subgroups by AR
status (positive/negative). This endocrine classification (based on
testosterone levels, ER status, and AR status), identifies different
subsets of ER-positive and ER-negative breast cancers, possibly
with different prognoses and requiring different treatments.
Preliminary data on the outcomes in the patients of our cohort
validate the clinical implications of our classification. We also discuss the possible mechanisms by which androgens stimulate cancer
growth in the different subsets of patients. Correspondence/Reprint request: Prof. Giorgio Secreto, Hormone Research Laboratory, Department of
Preventive and Predictive Medicine, Fondazione IRCCS Istituto Nazionale dei Tumori, Via Venezian 1, 20133
Milan, Italy. E-mail: [email protected]

Giorgio Secreto 80
Breast cancer originates in the epithelial cells of the mammary gland. In
the past decades, basic research has focused on the study of the cancerous
cell, and has obtained important knowledge of molecular mechanisms leading
to cancer growth, invasiveness, and metastasis [1]. Concurrently with studies
on the cell, it has become evident that malignant transformation of the
epithelium does not result only from a sequel of genetic abnormalities of the
epithelial cells but also from a profound disruption of the epithelial-
mesenchymal interaction. The role of the tumor microenvironment is now
well documented, although the complex interrelationship among the different
types of stromal cells (fibroblasts, myo-epithelial cells, macrophages,
endothelial cells, adipocytes etc), the extra-cellular matrix, and the epithelial
cells has not been fully clarified [2-10]. The reciprocal communication
between epithelium and stroma in the control of mammary epithelial growth
is regulated by sex steroids, whose action on the epithelium is mediated by
stromal growth factors and components of the extra-cellular matrix [3,4]. In
turn, the cancerous cell stimulates the production of large amount of
estrogens by stromal fibroblasts and macrocrophages via paracrine
mechanisms [2,4,11,12]. Sex steroids also directly support cancer growth
through binding to intracellular receptors.
Therefore, breast cancer growth largely depends on the endocrine
environment in which the tumor develops, and the anomaly of the
microenvironment that favors cancer growth reflects a more general
endocrine abnormality of the woman with cancer, which we have identified
as androgen excess (Table 1).
Table 1. Abnormal endocrine status of women that favors cancer growth both directly
and indirectly through a disruption of the normal mesenchymal-epithelial
communication.
Comprehensive patient-and-tumor characterization
Generalized Endocrine Abnormality of the Woman
Abnormal Endocrine Milieu of the Breast
Breast Cancer

Endocrine classification of breast cancer 81
Studies of the cancerous cell and its microenvironment are useful for
improving our knowledge of the development and behavior of breast cancer;
however, application of the important findings of basic research to clinical
practice has been fairly limited so far.
What we need now is to evaluate the hormonal status of the patient
together with the characteristics of the tumor. At present, measurement of
circulating testosterone levels is the best way to identify women with
hormone-dependent breast cancer. We believe that a comprehensive
characterization of the patient and her tumor might be helpful in selecting
different subsets of breast cancers to submit to different treatments. Better
categorization of the patient/tumor disorder would be a further step toward
personalized therapy, which is the objective of modern oncology.
1. The TPM study (testosterone, prognosis, mammary cancer)
To further investigate the role of androgens in breast cancer, we initiated a
prospective study in women with operable breast cancer specifically designed
with statistical power sufficient for conclusively assessing the role of
endogenous testosterone as a predictor of breast cancer progression (TPM
study). A secondary aim of the study was to examine the relationship of serum
levels of testosterone and other sex steroids to patient and tumor characteristics.
The study design is shown in figure 1. All patients admitted to the Breast
Surgery Unit of the National Cancer Institute (INT) of Milan, Italy, were
evaluated for eligibility for the study. From January 2004 to the end of March
2011, we recruited 3599 patients, of whom 2475 satisfied the criteria of
eligibility for the study: the inclusion criterion was histologically confirmed
non-metastatic breast carcinoma (any T, any N, M0); the exclusion criteria
were non-epithelial cancer, previous cancer diagnosis (except in situ cervical
cancer or non-melanoma skin cancer), and history of neo-adjuvant
chemotherapy or hormone therapy. Written informed consent was obtained
from all included patients. The study was approved by the Scientific and
Ethical Committee of the INT.
Each patient provided a sample of blood to constitute a biological bank
for hormonal and genetic analyses. Results of the analyses were added into
the data bank already containing the relevant data of patients extracted from
the clinical records: personal data (age and BMI), menopausal status,
pharmacological treatment affecting circulating hormone levels (hormone
therapy, cortisone, etc), date and type of surgery, histology, pathological
TNM stage, tumor grade, hormone receptor status (estrogen receptor
(ER), progesterone receptor (PR), epidermal-growth-factor-receptor-type2
(HER2) overexpression), adjuvant therapy (chemotherapy, hormone therapy),

Giorgio Secreto 82
Figure 1
radiotherapy, date of latest check-up, date of recurrence, site of recurrence,
contralateral breast cancer, primary non-breast cancer and date and cause of
death. A follow-up of 5 years has been programmed.
Among the 2475 eligible patients, 782 were premenopausal, 186 peri-
menopausal and 1057 postmenopausal. Surgery and adjuvant therapies were
done according to the standard protocols used in INT.
2. The postmenopausal TPM cohort
The cohort of 592 postmenopausal patients enrolled in the first 3 years of
recruitment (January 2004-December 2006) has been extensively studied, and
the findings of these studies are the basis for the discussion in this chapter.
Postmenopausal status was defined as: last menstruation ≥12 months before
enrollment, bilateral oophorectomy, hysterectomy without oophorectomy, or
unilateral oophorectomy in women 50 or more years old.

Endocrine classification of breast cancer 83
2.1. Relationships of both serum estradiol and testosterone levels
to patient and tumor characteristics
In a previous report [13], we examined the relationship of circulating
testosterone levels to age, BMI, and selected tumor characteristics. An
interesting result of the study was that testosterone levels did not decline with
age in postmenopausal women, in contrast with the constant decline of
adrenal androgens with increasing age reported in the literature [14-16]. This
finding confirms that the postmenopausal ovary is an important source of
androgens in postmenopausal breast cancer patients, consistent with previous
reports in healthy women [14-18], and explains the efficacy of ovariectomy
in patients with elevated androgen levels, as shown in our previous studies
(Chapter 4, sections 1 and 2).
As regards BMI, we found a positive significant relationship between
circulating testosterone levels and BMI. Obesity is a known risk factor for
postmenopausal breast cancer [19,20] and the association of high BMI with
high testosterone levels in women may provide an explanation for that risk
relationship. Testosterone levels by category of age and BMI are reported in
Table 2.
Other interesting observations were obtained by comparing the tumor
characteristics with circulating testosterone levels. We found that elevated
testosterone levels were associated with larger tumor size, but the association
was limited to older women (65 years), a result suggesting that testosterone
may favor tumor growth in late postmenopausal patients.
Table 2. Testosterone levels (mean±SD) by age and BMI categories in the TPM
postmenopausal cohort (592 patients) (modified from Secreto et al. CEBP 2009: 18,
2942).
Patients Testosterone
(ng/mL)
Patients Testosterone
(ng/mL)
N* % Mean±SD P† N* % Mean±SD P
†
Age, y BMI
40-49 14 2.4 0.401 ± 0.202 0.288 <25 250 47.0 0.383 ± 0.164 0.001
50-59 163 27.5 0.396 ± 0.167 25-30 182 34.2 0.402 ± 0.201
60-69 223 37.7 0.403 ± 0.192 >30 100 18.8 0.469 ± 0.219
≥ 70 192 32.4 0.428 ± 0.214
*=Number of patients, †=Nonparametric Cuzick test for trend.

Giorgio Secreto 84
We also found significantly higher testosterone levels in ER-positive
than in ER-negative patients. This finding suggests that testosterone levels
are a marker for hormone-dependent disease in general, and provides further
evidence for the androgen excess theory (Chapter 4 section 2). No significant
relationship was found between testosterone levels and tumor grade, axillary
nodal involvement, or HER2 status. Relationships of testosterone levels to
tumor characteristics in the whole cohort and in the cohort divided by age
categories (<65 and 65 y) are reported in Tables 3 and 4.
In a subsequent publication [21], we focus our attention on the relationship
of serum estradiol and serum testosterone levels to tumor size and ER status in
492 patients of the same cohort in whom we had already measured testosterone
Table 3. Testosterone levels (mean±SD) by categories of tumor characteristics in the
TPM postmenopausal cohort (592 patients) (modified from Secreto et al. CEBP 2009:
18, 2942).
Patients Testosterone (ng/mL)
N* (%) Mean±SD P
Tumor size, cm
<2 385 (66.2) 0.393 ± 0.327 0.001†
>2 196 (33.7) 0.445 ± 0.191
Grade
1 39 (6.7) 0.443 ± 0.282 0.672§
2 325 (55.6) 0.404 ± 0.181
>2 220 (37.7) 0.417 ± 0.194
Nodal status
negative 358 (62.2) 0.410 ± 0.200 0.696†
positive 218 (37.8) 0.412 ± 0.184
ER/PR status ≠
positive 508 (86.0) 0.420± 0.197 0.001†
negative 83 (14.0) 0.346± 0.158
HER2 status
positive 206 (48.0) 0.399± 0.174 0.423†
negative 223 (52.0) 0.418± 0.188
*=Number of patients, †=Fisher's test, §=Nonparametric Cuzick test for trend, ≠ Negative=ER-negative and
PR-negative; positive=ER-positive and PR-positive or ER-negative and PR-positive or ER-positive and
PR-negative.

Endocrine classification of breast cancer 85
Table 4. Testosterone levels (mean±SD) by categories of tumor characteristics in the
TPM postmenopausal patients according to age (<65 and ≥65 y) (modified from
Secreto et al. CEBP 2009: 18, 2942).
Age <65 Age ≥65
Patients Testosterone
(ng/mL)
Patients Testosterone
(ng/mL)
N* (%) Mean±SD P N* (%) Mean±SD P
Tumor size, cm
<2 200 (71.9) 0.398 ± 0.166 0.768† 185 (61.1) 0.389 ± 0.221 0.001
§
>2 78 (28.1) 0.407 ± 0.172 118 (38.9) 0.470 ± 0.199
Grade
1 20 (7.1) 0.413 ± 0.211 0.925§ 19 (6.2) 0.474 ± 0.346 0.706
§
2 146 (52.1) 0.400 ± 0.170 179 (58.9) 0.407 ± 0.190
>2 114 (40.8) 0.397 ± 0.158 106 (34.9) 0.438 ± 0.226
Nodal status
negative 171 (60.8) 0.403 ± 0.173 0.467† 187 (63.4) 0.415 ± 0.233 0.306
§
positive 110 (39.2) 0.389 ± 0.160 108 (36.6) 0.436 ± 0.203
ER/PR status ≠
positive 236 (83.4) 0.409 ± 0.166 0.014† 272 (88.3) 0.430 ± 0.220 0.024
§
negative 47 (16.6) 0.348± 0.163 36 (11.7) 0.343± 0.153
HER2 status
positive 142 (51.1) 0.402 ± 0.169 0.725† 64 (42.4) 0.392 ± 0.187 0.134
†
negative 136 (48.9) 0.397 ± 0.167 87 (57.6) 0.451 ± 0.213
*=Number of patients, †=Fisher's test, §=Nonparametric Kruskal-Wallis test, ≠ Negative=ER-negative and
PR-negative; positive=ER-positive and PR-positive or ER-negative and PR-positive or ER-positive and
PR-negative.
[13], and who had sufficient serum remaining for estrogen assay. We found a
significant relationship of estradiol levels to BMI, but not to age, grade, axillary
nodal involvement, PR status or HER2 status (Table 5).
We found that the relationship to ER status was highly significant for
testosterone levels, as expected [13], but it was surprisingly weak for estradiol
levels. High levels of both testosterone and estradiol were significantly
related to larger tumor size (≥ 2 cm), with a somewhat stronger relationship
for estradiol (Table 6).

Giorgio Secreto 86
Multivariate analysis, adjusting for age and BMI, supported the
relationships of circulating sex steroid levels to ER status and tumor size.
However the relationship of testosterone levels to tumor size weakened and
lost statistical significance after adjustment for estradiol levels (Tables 7, 8).
Dividing patients by age categories (<65 and 65 y), the tumor size was
significantly related to estradiol levels in both age groups (p=0.044 in the
<65 y and p=0.001 in the 65 y groups), while the relationship of tumor size
to testosterone levels was limited to the older patients (p=0.098 in the <65 y
and p=<0.001 in the 65 y groups) and weakened substantially after
adjustment for estradiol levels (p=0.059). ER status was significantly related
to testosterone levels only in the oldest patients (p=0.077 in the <65 y and
p=0.030 in the 65 y); the significance persisted after adjustment for estradiol
levels (p=0.048). No significant relationship was found between ER status
and estradiol levels in either age group (p=0.057 in the <65 y and p=0.343 in
the 65 y groups).
The relationship of estradiol and testosterone levels to tumor size
suggests that both hormones are involved in promoting tumor growth, but our
findings suggest that testosterone exerts its action mainly through conversion
into estradiol. The finding of a relationship of testosterone levels to tumor
Table 5. Estradiol levels (pg/mL) by categories of age, BMI, grade, axillary nodes
and HER2 status in the TPM postmenopausal cohort (492 patients) (modified from
Secreto et al. IJBM 2011: 26, 241).
Patients Estradiol
(pg/mL)
Patients Estradiol
(pg/mL)
N* (%) Mean ± SD P N* (%) Mean ± SD P
Age, y Grade
50-59 133 27.0 8.07 ± 4.29 0.202† 1 33 (6.8) 8.52 ± 4.30 0.883
†
60-69 188 38.2 7.78 ± 4.31 2 269 (55.1) 8.15 ± 4.49
≥70 171 34.8 8.58 ± 4.14 ≥2 186 (38.1) 8.41 ± 4.39
BMI, kg/m2 Nodes
<25 212 47.5 6.92 ± 3.57 <0.001† Negative 301 (62.2) 8.00 ± 4.32 0.113
§
25-30 160 35.9 8.05 ± 4.06 Positive 183 (37.8) 8.67 ± 4.62
≥30 74 16.6 11.52±4.37
PR HER2
Positive 331 67.6 8.43±4.22 0.768 Positive 172 (47.9) 7.61 ± 3.83 0.337§
Negative 159 32.4 7.54±4.29 Negative 187 (52.1) 8.15 ± 4.62
*=Number of patients, †=Nonparametric Cuzick test for trend, §Nonparametric Kruskal-Wallis test.

Endocrine classification of breast cancer 87
Table 6. Estradiol and testosterone levels (mean±SD) by categories of tumor size and
ER status in the TPM postmenopausal cohort (492 patients) (modified from Secreto
et al. IJBM 2011: 26, 241).
*=Number of patients, †=Nonparametric Cuzick test for trend, §= Fisher’s test.
Table 7. Odds ratios of tumor size (2/<2 cm) by estradiol and testosterone quartiles
in the TPM postmenopausal cohort (492 patients) (modified from Secreto et al. IJBM
2011: 26, 241).
Estradiol quartiles (pg/mL)
≤5.07 5.08-7.73 7.74-10.40 >10.40 P trend
Tumor size ≥2/<2 cm 18/86 36/75 39/76 49/58
Age and BMI-adjusted
OR (95% CI)
1 2.36
(1.23-4.56)
2.30
(1.20-4.42)
3.84
(1.99-7.40)
<0.001
Testosterone quartiles (ng/mL)
<0.270 0.270-0.390 0.390-0.527 >0.527 P trend
Tumor size ≥2/<2 cm 22/89 35/73 42/69 43/64
Age and BMI-adjusted
OR (95% CI)
1 2.01
(1.07-3.78)
2.53
(1.36-4.69)
2.45
(1.32-4.56)
0.005
Age, BMI and estradiol-
adjusted OR (95% CI)
1 1.66
(0.87-3.18)
2.05
(1.08-3.88)
1.68
(0.87-3.28)
0.151

Giorgio Secreto 88
Table 8. Odds ratios of ER status (positive/negative) by estradiol and testosterone
quartiles in the TPM postmenopausal cohort (492 patients) (modified from Secreto
et al. IJBM 2011: 26, 241).
Estradiol quartiles (pg/mL)
≤5.07 5.07-7.73 7.74-10.40 >10.40 P trend
ER status positive/negative 96/27 105/17 104/19 108/15
Age-adjusted OR (95% CI) 1 1.80
(0.92-3.53)
1.50
(0.78-2.89)
2.02
(1.01-4.04)
0.070
Testosterone quartiles (ng/mL)
<0.270 0.270-0.390 0.390-0.527 >0.527 P trend
ER status positive/negative 95/29 98/23 109/14 111/12
Age-adjusted OR (95% CI) 1 1.29
(0.69-2.39)
2.42
(1.20-4.87)
2.69
(1.30-5.59)
0.002
Age and estradiol-adjusted
OR (95% CI)
1 1.23
(0.66-2.32)
2.28
(1.11-4.67)
2.42
(1.10-5.34)
0.008
size only in the old postmenopausal group supports the view that the
biological characteristics of breast cancer may differ in the elderly compared
with the early postmenopausal patients [22]. It is well known that the risk of
developing breast cancer increases markedly with advancing age [23,24], and
signs of virilization – markers of enhanced androgenic activity – are often
present in older women [25], suggesting a possible link between androgens
and increased risk of breast cancer in old age.
The most relevant finding of the study was the strong relationship of
circulating testosterone levels to the ER content of the tumor, in contrast to
the weak relationship of circulating estradiol levels to ER content, suggesting
that testosterone level, but not estradiol level, is a marker for hormone-
dependent breast cancer.
Two observations can explain the weak relationship between estradiol
levels and ER content. First, circulating estradiol levels do not reflect the
intratumoral levels of the hormone; higher levels of estradiol in tumor tissue
than in blood have been repeatedly reported in the literature, with a
tissue/plasma ratio for estradiol of about 10 [26-33]. Secondly, it is largely

Endocrine classification of breast cancer 89
accepted that hormones stimulate the synthesis of their own receptors
[34-36]. Assuming that intratumoral estradiol up-regulates the synthesis of its
receptor, the ER content of the tumor has to be only weakly related to the
estradiol level in the blood.
In an attempt to explain the significant relationship between circulating
testosterone and ER, let us consider the biosynthetic pathway of sex steroids
(Tables 9 and 10).
Testosterone can be synthesized through different pathways (the 5
pathway, the 4 pathway, and all the intermediate steps of conversion from
5 to 4 steroids), while estradiol can only be formed either by direct
aromatization of testosterone or by conversion from estrone. Estrone, in turn,
can derive only from androstenedione, by the action of the enzyme
aromatase. Estrone can be converted to estrone sulfate by the enzyme
sulfotransferase in peripheral tissues. Estrone sulfate is the most abundant
estrogen circulating in the blood of pre- and postmenopausal women [37]; it
is biologically inactive and can be converted to the active estrone by the
enzyme sulfatase, either in peripheral organs or in breast cancer tissue [38].
Androstenedione is a steroid with weak androgenic activity; it is, however,
easily converted into the stronger androgen testosterone by the enzyme 17-
Table 9. Biosynthetic pathway of sex steroids.
*=dihydrotestosterone

Giorgio Secreto 90
Table 10. Enzymes involved in sex steroid production in breast-cancer tissue.
*=17-hydroxysteroid dehydrogenase; †a comprehensive review of 17 -HSD family
is reported by Nagasaki et al [40].
HSD5 [39], a reaction that is reversible. In contrast, the reaction catalyzed by
aromatase is irreversible -- estrogens cannot be reverted to androgens once
they are formed. Estrogens can derive only from androgen precursors, and the
immediate precursors of estrone and estradiol are androstenedione and
testosterone, respectively. Estradiol is the most important stimulator of breast
epithelial growth, and its concentrations are 10 or more times as high in
breast cancer tissue as in plasma. A small proportion of intratumoral estradiol
comes directly from the blood stream, while a larger proportion derives from
local (autocrine) production via three possible pathways [40]:
androstenedione estrone estradiol; androstenedione testosterone
estradiol; estrone sulfate estrone estradiol. There is clear evidence that
aromatase as well as the other estrogen-producing enzymes (17β-HSD1,
sulfatase) are abundantly expressed in breast tumors [39,41,42 ].
In conclusion, we suggest that the circulating testosterone level is a good
indicator of the level of androgen precursors available for the intratumoral

Endocrine classification of breast cancer 91
synthesis of estradiol. Estradiol in the cancerous tissue up-regulates the
synthesis of ER, which are, therefore, related to circulating testosterone
levels.
2.2. Androgen receptors (AR) in the TPM cohort: Relationship to
tumor characteristics and circulating sex steroid levels
We examined the intratumoral AR content in 534 patients of our cohort
and divided the tumors into four groups according to the level of AR
expression: absent (0% of stained cells), negative (1-10%), moderately
positive (from >10% to 60%) and highly positive (>60%). More than 70% of
our patients were AR-positive, a finding in agreement with the data from the
literature [43-49]. AR were highly expressed (>60%) in about half of AR-
positive tumors and the half of non-AR-positive tumors was AR absent
(Table 11).
The relationship of AR expression to the clinical-pathological parameters
of our patients is reported in Table 12. AR-absent and AR-negative tumors
were considered as a single group.
No significant relationship was found between AR expression and age,
BMI, tumor size, or axillary nodal involvement; the relationship was of
borderline statistical significance with HER-negative status, and was highly
statistically significant with low histological grade, ER-positivity, and PR-
positivity. All these findings are in substantial agreement with reports in the
literature [45-47,49,50].
The relationship between AR and ER expression is made still more
evident by dividing both receptors into three categories: negative, moderately
positive, and highly positive. The frequency of ER-negative tumors decreases
with increasing AR categories, while the frequency of ER-positive tumors
increases with increasing AR categories (Table 13).
Table 11. Androgen receptor (AR) expression in the TPM postmenopausal cohort
(534 patients).
N* (%) AR expression Group
74 (13.9) 0% Absent
73 (13.9) 1% - 10% Negative
197 (36.9) > 10% - ≤60% Moderately positive
190 (35.4) > 60% Highly positive
*=Number of patients

Giorgio Secreto 92
Table 12. Androgen receptor (AR) categories in relation to patient and tumor
characteristics in the TPM postmenopausal patients.
AR expression
≤ 10%
Positive
> 10% - ≤ 60% > 60%
N* % N* % N* % P†
Age, years
< 70 96 27.2 140 39.7 116 32.9 0.114
≥ 70 51 28.0 57 31.3 74 40.7
BMI, kg/m2
< 25 64 28.6 85 37.9 75 33.5 0.584
≥ 25 66 25.8 93 36.3 97 37.9
Tumor size
cm
< 2 91 26.3 123 35.6 132 38.1 0.179
≥ 2 55 30.1 73 39.8 55 30.1
Grade
≤ 2 73 22.2 120 36.5 136 41.3 <0.001
> 2 73 36.5 74 37.0 53 26.5
Axillary
nodal status
Negative 85 26.5 121 37.7 115 35.8 0.827
Positive 58 28.9 72 35.8 71 35.3
HER2 status
Negative 58 29.7 62 31.8 75 38.5 0.050
Positive 60 32.4 75 40.6 50 27.0
ER status
Positive 93 21.0 171 38.6 179 40.2 <0.001
Negative 54 59.3 26 28.6 11 12.1
PR status
Positive 72 20.3 137 38.6 146 41.1
<0.001 Negative 75 41.9 60 33.5 44 24.6
*=Number of patients, †Pearson’s chi-square test.

Endocrine classification of breast cancer 93
Table 13. Relation of Estrogen receptors (ER) and Androgen receptors (AR) by
categories: negative, moderately positive and highly positive.
AR expression
Negative
≤ 10%
Moderately positive
> 10% - ≤ 60%
Highly positive
> 60%
N* % N* % N* % P†
ER expression
Negative
≤ 10%
51 58.0 25 28.4 12 13.6
<0.001
Moderately positive
> 10% - ≤ 66%
14 29.2 21 43.7 13 27.1
Highly positive
> 66%
74 19.8 143 38.3 156 41.8
*=Number of patients, †Pearson’s chi-square test.
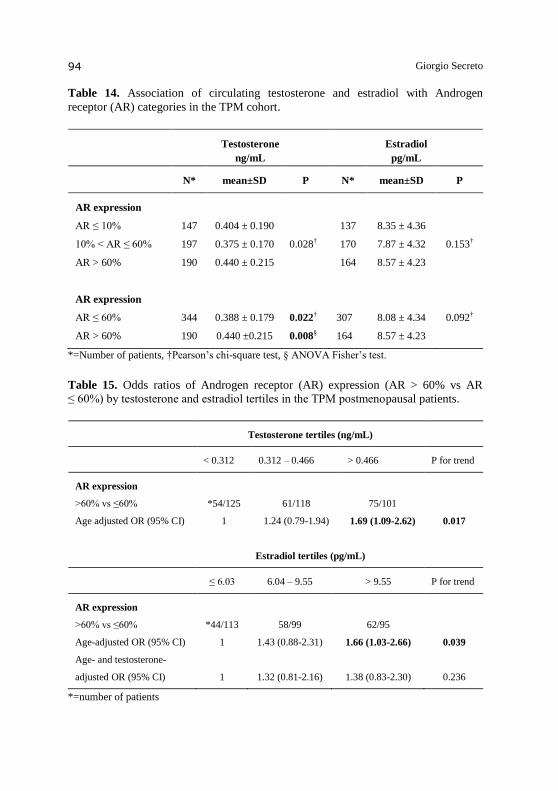
We evaluated the relationship of circulating testosterone and estradiol levels to AR categories. Mean testosterone levels were significantly higher in patients with high AR expression (>60%) than in the other 2 groups (<60%). No significant differences among the 3 AR categories was found for estradiol mean concentrations (Table 14). We further evaluated the odds ratio of AR expression (AR >60% vs AR
60%) by testosterone and estradiol tertiles. AR expression >60% was
significantly associated with high levels of both sex steroids, but the association
with estradiol lost statistical significance after adjustment for testosterone
(Table 15). This finding confirms that circulating testosterone levels, but not
estradiol levels, are a marker of hormone-dependent breast cancer.
2.3. Key role of androgen excess in the growth of ER-positive and
ER-negative breast cancers
In this book, it has been repeatedly stated that the role of androgens in
breast cancer, either inhibiting or stimulating tumor growth, is still debated
and largely unknown. In light of the evidence, it seems reasonable to think
that both actions can be carried out by androgens, with the predominance of
inhibitory or stimulatory effect depending on the microenvironment in which
a tumor develops and on the hormonal status of the patient.
Giorgio Secreto 94
Table 14. Association of circulating testosterone and estradiol with Androgen
receptor (AR) categories in the TPM cohort.
Testosterone
ng/mL
Estradiol
pg/mL
N* mean±SD P N* mean±SD P
AR expression
AR ≤ 10%
10% < AR ≤ 60%
AR > 60%
147
197
190
0.404 ± 0.190
0.375 ± 0.170
0.440 ± 0.215
0.028†
137
170
164
8.35 ± 4.36
7.87 ± 4.32
8.57 ± 4.23
0.153†
AR expression
AR ≤ 60%
AR > 60%
344
190
0.388 ± 0.179
0.440 ±0.215
0.022†
0.008§
307
164
8.08 ± 4.34
8.57 ± 4.23
0.092†
*=Number of patients, †Pearson’s chi-square test, § ANOVA Fisher’s test.
Table 15. Odds ratios of Androgen receptor (AR) expression (AR > 60% vs AR
≤ 60%) by testosterone and estradiol tertiles in the TPM postmenopausal patients.
Testosterone tertiles (ng/mL)
< 0.312 0.312 – 0.466 > 0.466 P for trend
AR expression
>60% vs ≤60% *54/125 61/118 75/101
Age adjusted OR (95% CI) 1 1.24 (0.79-1.94) 1.69 (1.09-2.62) 0.017
Estradiol tertiles (pg/mL)
≤ 6.03 6.04 – 9.55 > 9.55 P for trend
AR expression
>60% vs ≤60% *44/113 58/99 62/95
Age-adjusted OR (95% CI) 1 1.43 (0.88-2.31) 1.66 (1.03-2.66) 0.039
Age- and testosterone-
adjusted OR (95% CI)
1
1.32 (0.81-2.16)
1.38 (0.83-2.30)
0.236
*=number of patients

Endocrine classification of breast cancer 95
Studies from our laboratory suggest that androgen excess is the endocrine
abnormality that characterizes women with breast cancer. The mechanisms
by which androgen excess stimulates cancer growth are those reported in
Chapter 3, namely: 1. Conversion to estrogens. 2. Direct stimulation through
binding to AR. 3. Stimulation of the epidermal-growth-factor-receptor (EGR-
R) signaling pathway. A fourth possible mechanism that emerged in the last
years is the stimulation of the HER2 pathway. In the present section we
suggest how these mechanisms might be implicated in the growth of ER-
positive and ER-negative cancers, commonly called hormone-dependent and
non-hormone-dependent tumors, respectively.
The process suggested for the ER-positive tumors is based on the well
documented evidence that: 1) large amounts of inactive androgen precursors
are present in breast-cancer tissue [26,29,51,52], 2) sex steroid-producing
enzymes are abundantly expressed in breast cancer tissue: aromatase
(androstenedione estrone) [12,39,42,53,54]; 5-reductase (testosterone
DHT) [39,53]; steroid sulfatase (estrone-sulfate estrone and DHEA-S
DHEA) [38,41]; 17βHSD-type 1 (estrone estradiol) [40] and 17βHSD-
type 5 (androstenedione testosterone) [39], 3) intratumoral estradiol
concentrations are higher than those of plasma [26, 27, 29-33, 54], 4)
intratumoral DHT concentrations are higher than those of plasma [30,31], 5)
ER are expressed in higher amount in breast-cancer tissue than in normal
breast tissue [55,56], 6) AR are expressed in the large majority of ER-
positive tumors [43, 45-47,49], 7) hormones up-regulate the synthesis of their
own receptors [34-36].
The role of androgen excess in the development of ER-positive breast
cancer is summarized in Figure 2: within the cancer cell, high androgen
levels in the presence of high aromatase activity induce increased estrogen
synthesis; estrogen binds to ER and stimulates cell proliferation, on the one
hand, and up-regulates ER synthesis on the other hand, thus creating an auto-
regulatory loop that operates at a level higher than in normal cells; the
presence of androgen excess plus increased aromatase activity allows
continuous estrogen formation; the auto-regulatory loop permits continuous
binding of estrogen to its receptor, thus stimulating continuous cell
proliferation, still under hormonal control (hormone-dependent tumors)
(Figure 2A); at the same time, the high androgen levels favor increased
conversion of testosterone into the stronger (and non-aromatizable) DHT,
thus explaining reports from the literature of DHT concentrations three times
as high in tumor tissue as in blood [30,31]; testosterone and DHT probably
up-regulate intratumoral AR synthesis, and this would account for the
frequent presence of ER and AR in the same tumor (Figure 2B).

Giorgio Secreto 96
Figure 2. A. Simplified scheme to summarize the possible role of androgen excess in
breast cancer development. The up-regulation of estrogen receptors is shown in bold.
“Testosterone” (also in bold) represents androgen excess and its transformation to
estradiol; the other precursors of estradiol [androstenedione (4), estrone (E1), and
estrone sulfate (E1-S)] are shown in non-bold letters. B. Simplified scheme to
summarize the possible role of androgen excess in breast cancer development. The
up-regulation of androgen receptors is in bold.
The mechanism described applies to most ER-positive tumors that are
also AR-positive. It suggests that androgen excess operates through increased
formation of estrogens, which are the final stimulators of cancer growth.
Under these conditions, high levels of AR and increased synthesis of DHT

Endocrine classification of breast cancer 97
might be interpreted as an attempt to counter the stimulatory effect of
excessive estrogen production, consistent with the apparently paradoxical
effect of androgen excess, both stimulating and inhibiting cancer growth, that
we have discussed in Chapter 4, section 2. Suzuki et al. [42,53] reported a
negative correlation between aromatase expression and DHT concentration in
breast-cancer tissue, and suggested that aromatase acts as a down-regulator of
DHT synthesis by reducing the availability of the DHT precursors
testosterone and androstenedione. Peters et al. [57] showed that AR can
inhibit ER expression and thereby inhibit estrogen-stimulated cell
proliferation. Studies by Suzuki [42,53] and Peters [57] support a possible
role for androgens in countering estrogenic stimulatory effects. Conversely,
however, a synergistic action of androgens and estrogens in stimulating
breast-cancer growth has been observed in animal studies, as summarized in
the review of Liao and Dickson [58].
ER-negative tumors are a very heterogeneous class of tumors. AR are
expressed in about half of ER-negative tumors [43,45,48,50,59], and
emerging evidence suggests a critical role for androgens in breast
carcinogenesis, independent of ER. Several possible mechanisms can be
inferred from data in the literature: 1) Direct stimulation of cell proliferation
by binding to AR is suggested by the findings of Farmer et al. [59], who
identified a subset of AR-positive tumors with increased androgen signaling,
the “molecular apocrine” class, and by the findings of Doane et al. [60], who
identified a subset of ER-negative/AR-positive tumors whose growth was
directly stimulated by androgens in an AR-dependent way. Such direct
stimulation is represented in bold characters in Figure 2B. 2) A significant
association of AR-positive status with HER2 overexpression has been
repeatedly reported in ER-negative cancers, and cross-talk between AR and
HER2 signaling pathways favoring synergistic stimulation of cell
proliferation in these tumors has been suggested [43,47,50,59-62]. 3) HER2
is one of the four known members of the EGF-R family [63], and synthesis of
EGF is stimulated by androgens, as reported in Chapter 3. HER1, commonly
referred to as EGF-R, is the prototype of the EGF-R family. It has been
reported to be expressed in about 30% of breast cancers in several previous
studies (Bolla and Toi, as quoted by Biscardi et al. [63], and Harris et al, as
quoted by Bhargava et al. [64]), and in 6% of cases in a more recent study by
Bhargava et al. [64], who used more stringent criteria in defining EGF-R
overexpression. All these studies reported no correlation between HER1 and
ER, but in none of them was the correlation with AR examined. We
hypothesize that in a least a subset of HER1-positive and ER-negative
tumors, for example in the 6% identified by Bhargava et al, cell proliferation

Giorgio Secreto 98
may be stimulated by the HER1 pathway, independent of the expression of
ER, PR, or AR.
Summing up the reported mechanisms, androgen excess may favor
breast-cancer-cell proliferation in the majority of ER-positive tumors and in a
substantial subset of ER-negative tumors, both groups that are characterized
by overexpression of AR. AR-positivity is associated with a more favorable
prognosis than AR-negativity, and can be regarded as a marker of hormone
(androgen)-dependent disease. We also suggest that androgens might be
involved in the growth of a subset of ER-negative/AR-negative cancers by
stimulating the EGF/HER1 signaling pathway.
2.4. Endocrine classification of postmenopausal breast cancers
We propose an endocrine classification of breast cancer that takes into
account the characteristics of the patient and of her tumor. Our classification
is based on the evidence that testosterone is a suitable marker of hormone-
dependent disease (Chapter 4, section 2 and Chapter 6, section 2.1) and that
the assessment of ER status is the most widely used approach to select
patients for endocrine therapy. Evaluating both the serum testosterone levels
of the patient and the ER status of the tumor, we have identified four different
groups of postmenopausal breast-cancer patients. The cut-off value used to
select high versus low testosterone values was 0.39 ng/ml, the median value
for patients in our cohort (Table 16).
Table 16. Distribution of 534 patients of the postmenopausal TPM cohort in the 4
groups obtained by combining circulating testosterone levels (high/low) and ER status
(positive/negative).
Group Testosterone* and ER status 534 patients
N† %
Group 1. High testosterone and ER-positive 229 42.9
Group 2. High testosterone and ER-negative 30 5.6
Group 3. Low testosterone and ER-positive 214 40.1
Group 4. Low testosterone and ER-negative 61 11.4
*=Cut-off value between high and low testosterone levels: 0.39 ng/mL (median of all values). †=Number of patients.

Endocrine classification of breast cancer 99
Most of the ER-positive patients were PR-positive (77.0%) and most of
the ER-negative patients were PR-negative (84.6%). In the two ER-positive
groups, PR-positivity was observed in 75.6% and in 78.5% of tumors of
groups 1 and 3, respectively. In the 2 ER-negative groups, a PR-negative
status was found in 86.7% and in 83.6% of tumors of groups 2 and 4,
respectively. Within these four large groups, other subgroups can be further
selected according to other tumor characteristics. We examined AR
expression, which became the third parameter of our classification (Table 17).
We consider group 1 as the “complete” hormone-dependent group (high
testosterone, ER-positive, and 77% AR-positive). In this group, cell
proliferation depends on androgen excess and the intratumoral sequence
shown in Figure 2A (androgen excess estrogen excess). Our previous
studies (Chapter 4, sections 1 and 2) have shown that the ovary is the main
source of the elevated testosterone levels, with a minor contribution of
adrenal androgen precursors. Oophorectomy might be considered as a
possible additional therapeutic option in these patients.
In group 3 too, cell proliferation is stimulated by androgen excess through
increased conversion to estrogens (Figure 2A), but the low levels of circulating
Table 17. Androgen receptor (AR) status (positive >10% of stained cells; negative
≤ 10%) in the four groups of our classification.
Groups Testosterone and
ER status
(%) AR-positive AR-negative
N* % N* %
Group 1. High T and
ER-positive
(42.9) 177 77.3 52 22.7
Group 2. High T and
ER-negative
(5.6) 9 30.0 21 70.0
Group 3. Low T and
ER-positive
(40.1) 173 80.8 41 19.2
Group 4. Low T and
ER-negative
(11.4) 28 45.9 33 54.1
*=Number of patients

Giorgio Secreto 100
testosterone suggest a major role of adrenal androgen precursors in favoring
increased autocrine production of estrogens in the cancer tissue. In this group,
the high intratumoral concentration of estradiol derives in part from increased
sulfatase activity (estrone sulfate estrone) and in part from increased
aromatase activity (androstenedione estrone); the conversion estrone
estradiol is catalyzed by the enzyme 17β-HSD1. Suzuki et al. found higher
concentrations of the enzyme sulfatase than of the enzymes aromatase [41] and
sulfotransferase (estrone estrone sulfate) [38] in breast-cancer tissues,
suggesting that the sulfatase pathway might be more important than the
aromatase pathway. Inhibitors of steroid sulfatase inhibit the conversion of
estrone sulfate to estrone and of DHEAS to DHEA, and since DHEA is the
precursor of androstenedione, which is the main substrate of aromatase [65],
steroid sulfatase inhibitors might be effective in the treatment of patients of
Group 3.
Group 2 is the smallest group in our classification, and is further divided
in two subsets by AR status: 1/3 of these tumors are AR-positive and 2/3 are
AR-negative. All of the 9 AR-positive and 81% of the AR-negative tumors
were PR-negative. The AR-positive subset probably corresponds with the
pure apocrine carcinomas, which represent 0.3-4% of all infiltrating breast
cancers [66] and are generally ER-negative, PR-negative, and AR-positive.
We suggest that androgens stimulate the growth of these tumors by binding
to AR, an effect that may be counteracted by antiandrogens. The 21 tumors in
the AR-negative subset show the highest levels of testosterone (mean 0.577±
0.097 ng/ml: median 0.560 ng/ml). These findings prompt us to suggest that
elevated androgen levels induce increased EGF production and that tumor
growth may be stimulated by the EGF-R (HER1) pathway. EGF-R inhibitors
might therefore be useful in the treatment of these tumors.
In Group 4, about half the tumors are AR-positive. We suggest that in
the AR-positive subset increased intratumoral androgen production occurs
from adrenal androgen precursors, which stimulate tumor growth by binding
to AR. This subset too might benefit from anti-androgen therapy. We regard
the AR-negative tumors in Group 4 as the non-hormone-dependent group (low
testosterone levels, ER-negative, AR-negative, and 78.8% PR-negative).
Summing up our reasoning, we suggest that all ER-positive and/or AR-
positive tumors depend on androgens for their growth. Androgen excess is
obvious when the circulating testosterone levels are elevated, but even when
testosterone levels are normal, increased intratumoral androgen production
from adrenal precursors is likely in AR-positive tumors. Lastly, we propose
that cancer growth can be stimulated through the EGF-R pathway when serum
testosterone levels are elevated but tumors are ER-negative and AR-negative.

Endocrine classification of breast cancer 101
This proposed endocrine classification identifies different subsets of
ER-positive and ER-negative breast cancers, possibly with different
prognoses and requiring different treatments. The outcomes in the patients of
our cohort, reported in the next section, validate the clinical implications
from our classification.
2.5. Outcomes of patients according to our endocrine classification:
Preliminary data
All the evaluable patients in our cohort had three or more years of
follow-up. Follow-up information was extracted from the clinical records or
was obtained by telephone. The follow-up is still ongoing, and statistical
analysis of overall survival and disease-free survival will be done when we
have information for all 534 patients in the cohort. Here we report only
preliminary data on the rate of recurrence in the different groups we have
described above.
We have information on 471 (88.2%) of the 534 patients of our cohort
recruited in the first 3 years of the study (January 2004- December 2006),
with a median follow-up of 67.7 months (interquartile range 59.7 to 77.3).
Thirty-seven of the 471 patients were excluded from the evaluation of the
recurrence rate: 13 had died from unrelated disease, without breast-cancer
progression, and 24 had developed second primary tumors at other sites. Of
the remaining 434 evaluable patients, 67 (15.4%) had progression of breast
cancer (Table 18).
The distribution of the 434 evaluable patients into the 4 groups was
similar to the distribution of patients in the whole cohort (Table 19).
Table 18. Follow-up information in the 534 patients of our cohort.

Giorgio Secreto 102
Table 19. Distribution of the 434 patients evaluable for disease progression in the 4
groups of our endocrine classification.
Group Testosterone and ER status 434 pts
with follow-up
534 pts
(whole cohort)
N* % %
Group 1. High testosterone and ER-positive 184 (42.4) (42.9)
Group 2. High testosterone and ER-negative 25 (5.8) ( 5.6)
Group 3. Low testosterone and ER-positive 177 (40.8) (40.1)
Group 4. Low testosterone and ER-negative 48 (11.1) (11.4)
*=Number of patients
In the two ER-positive groups reported in Table 20, the rate of recurrence
was almost twice as high in the high-testosterone group 1 (14.7%) as in the
low-testosterone group 3 (7.9%) (p=0.037). We also evaluated the prognostic
value of AR status in both ER-positive groups (Table 21). Disease
progression was slightly, but not significantly, more frequent in AR-positive
than in AR-negative patients, both in Group 1 and in Group 3. Whether AR-
positivity is indeed a factor for increased risk of breast-cancer relapse needs
to be examined in a larger number of cases.
The standard therapy of ER-positive tumors with antiestrogens and
antiaromatase drugs is effective only in countering increased estrogen
production and activity, which are consequences of androgen excess, but
these drugs are powerless against the androgen excess itself, which originates
from the ovarian interstitial-cell hyperplasia that such patients frequently
manifest (Chapter 4). We suggest that oophorectomy should be done in
ER-positive patients with high levels of testosterone, in addition to standard
therapy. We would expect that this intervention might reduce the recurrence
rate from the 15% level seen in our group 1 patients to the 8% level seen in
our group 3 patients.
The outcomes of patients in the ER-negative groups are reported in Table 22.
Disease progression was as frequent in the high-testosterone group 2 (36%)
as in the low-testosterone group 4 (35.4%), suggesting that circulating
testosterone levels are not prognostic in ER-negative patients.
However, interesting data concerning the importance of serum
testosterone levels emerged when we examined the prognostic value of AR
status in the two ER-negative groups (Table 23).

Endocrine classification of breast cancer 103
Table 20. Outcomes in the two ER-positive groups of our classification.
Group testosterone and ER status (N*) Disease Progression
NO
N*
YES
N* (%)
P†
Group 1. High testosterone and ER positive (184) 157 27 (14.7)
0.037
Group 3. Low testosterone and ER positive (177) 163 14 ( 7.9)
*=Number of patients, †=Pearson’s chi-square test.
*=Number of patients, †=Pearson’s chi-square test.
Table 21. Disease progression in the two ER-positive groups of our classification
according to AR status.
Progression
Groups
N* (%)
NO
N* (%)
YES
N* (%)
P†
Group 1
T high ER+
AR+ 141/184 (76.6%) 118/141 (83.7 ) 23/141 (16.3)
0.284 AR- 43/184 (23.4%) 39/43 (90.7) 4/43 (9.3)
Group 3
T low ER+
AR+ 139/177 (78.4%) 127/139 (91.4) 12/139 (8.6)
n.e.§ AR- 38/177 (21.6%) 36/38 (94.7) 2/38 (5.3)
*=Number of patients, †= Pearson’s chi-square test, §=not evaluable because of the small number of cases.
Table 22. Outcomes in the two ER-negative groups of our classification.
Group testosterone and ER status (N*) Disease Progression
NO
N*
YES
N* (%)
P†
Group 2 High testosterone and
ER-negative (25)
16 9 (36.0)
0.945
Group 4 Low testosterone and
ER-negative (48)
31 17 (35.4)
*=Number of patients, †=Pearson’s chi-square test.

Giorgio Secreto 104
Table 23. Disease progression in the two ER-negative groups of our classification
according to the AR status.
Progression
Groups N* (%) NO
N* (%)
YES
N* (%)
P†
Group 2
T high ER-
AR+ 7/25 (28.0%) 6/7 (85.7) 1/7 (14.3)
n.e.§ AR- 18/25 (72.0%) 10/18 (55.6) 8/18 (44.4)
Group 4
T low ER-
A+ 22/48 (45.8%) 13/22 (59.1) 9/22 (40.9) 0.464
A- 26/48 (54.2%) 18/26 (69.2) 8/26 (30.8)
*=Number of patients, †=Pearson’s chi-square test, §=not evaluable because of the small
number of cases.
In the high-testosterone group 2, only 1 of the 7 AR-positive patients
(14.3%) relapsed, whereas disease progression occurred in 8 of the 18 AR-
negative patients (44.4%). AR-positive status seems, therefore, to be a factor
for better outcome in ER-negative patients with high testosterone levels. Such
patients can still be regarded as hormone-dependent, and therefore have
intrinsically less aggressive tumors.
In contrast, in the low-testosterone group 4, disease progression occurred
in 40.9% of AR-positive and 30.8% of AR-negative patients, suggesting that
AR-positivity is not significantly related to risk of relapse in ER-negative
patients with low testosterone levels. Taken together, these findings suggest
that two different groups of ER-negative patients can be identified by their
circulating levels of testosterone (high vs low) and their AR status: in patients
with high testosterone levels, AR-positive status is protective, while in low-
testosterone patients, it is not. This tentative conclusion needs to be tested in
a larger number of cases.
In conclusion, the endocrine classification obtained by the simultaneous
evaluation of testosterone level, ER status, and AR status, identifies 2
different groups of ER-positive and 2 different groups of ER-negative tumors
and implies that improved selection of patients can enhance the efficacy of
therapy and the quality of life (Table 24). We suggest that serum testosterone
levels should be routinely determined in postmenopausal breast cancer
patients, in order to program therapies with the dual objective of treating the
cancer and correcting the basic hormonal abnormality, thus reducing the
probability of recurrences.

Endocrine classification of breast cancer 105
As a final consideration, we believe that the findings from basic
research could be better understood if interpreted in the light of the
hormonal status of the patient and not only in that of the characteristics of
the tumor. We think that the molecular mechanisms leading to cancer
growth may be different in the four groups of our classification, and we
think it may be necessary to take that into account in order to achieve
targeted therapy (Table 25). A network of biological banks of serum,
plasma, buffy coat, and tissue, joined with data banks containing all the
relevant information on patients and on their tumors, would be highly
desirable for evaluating this conclusion in a short time.
Table 24. Clinical implications of our Endocrine Classification obtained by the
simultaneous evaluation of circulating testosterone levels, ER status, and AR status.
Table 25. Successive steps towards optimization of basic research for arriving at
targeted therapy.

Giorgio Secreto 106
References
1. Widschwendter, M., and Jones, P. A. DNA methylation and breast
carcinogenesis. 2002, Oncogene, 21, 5462.
2. Mor, G. et al. Macrophages, Estrogen and the Microenvironment of Breast
Cancer. 1998, J. Steroid Biochem. Molec. Biol., 67, 403.
3. Woodward, T. L., Xie, J.W., and Haslam, S.Z. The Role of Mammary Stroma in
Modulating the Proliferative Response to Ovarian Hormones in the Normal
Mammary Gland .1998, J. Mammary Gland Biol. Neoplasia, 3, 117.
4. Imagawa, W. et al. Hormone/growth factor interactions mediating epithelial/
stromal communication in mammary gland development and carcinogenesis.
2002, J. Steroid Biochem. Mol. Biol., 80, 213.
5. Shekhar, M.P.V., Pauley, R., and Heppner, G. Host microenvironment in breast
cancer development. Extracellular matrix–stromal cell contribution to neoplastic
phenotype of epithelial cells in the breast. 2003, Breast Cancer Res., 5, 130.
6. Ben-Baruch, A. Host microenvironment in breast cancer development.
Inflammatory cells, cytokines and chemokines in breast cancer progression:
reciprocal tumor–microenvironment interactions. 2003, Breast Cancer Res., 5, 31.
7. Allinen M. et al. Molecular characterization of the tumor microenvironment in
breast cancer. 2004, Cancer Cell, 6, 17.
8. Pollard, J.F. Macrophages define the invasive microenvironment in breast cancer.
2008, J. Leukoc. Biol., 84, 623.
9. Ma, X.J. et al. Gene expression profiling of the tumor microenvironment during
breast cancer progression. 2009, Breast Cancer Res., 11, R7.
10. Fleming, J.M. et al. The normal breast microenvironment of premenopausal
women differentially influences the behavior of breast cancer cells in vitro and in
vivo. 2010, BMC Med., 8, 27.
11. Pauley, R.J. et al. Regulated CYP19 Aromatase Transcription in Breast Stromal
Fibroblasts. 2000, J. Clin. Endocrinol. Metab., 85, 837.
12. Bulun, S.E. et al. Regulation of aromatase expression in estrogen-responsive
breast and uterine disease: From bench to treatment. 2005, Pharmacol. Rev.,
57, 359.
13. Secreto, G. et al. Testosterone and biological characteristics of breast cancers in
postmenopausal women. 2009, Cancer Epidemiol. Biomarkers Prev., 18, 2942.
14. Burger, H.G. et al. A prospective longitudinal study of serum testosterone,
dehydroepiandrosterone sulfate, and sex hormone-binding globulin levels
through the menopause transition. 2000, J. Clin. Endocrinol. Metab., 85, 2832.
15. Lamar, C.A. et al. Serum sex hormones and breast cancer risk factors in
postmenopausal women. 2003, Cancer Epidemiol. Biomarkers Prev., 12, 380.
16. Davison, S.L. et al. Androgen levels in adult females: Changes with age,
menopause, and oophorectomy. 2005, J. Clin. Endocrinol. Metab., 90, 3847.
17. Laughlin, G.A. et al. Hysterectomy, oophorectomy, and endogenous sex hormone
levels in older women: the Rancho Bernardo Study. 2000, J. Clin. Endocrinol.
Metab. 85, 645.

Endocrine classification of breast cancer 107
18. Fogle, R.H. et al. Ovarian androgen production in postmenopausal women. 2007,
J. Clin. Endocrinol. Metab., 92, 3040.
19. van den Brandt, P.A. et al. Pooled analysis of prospective cohort studies on
height, weight, and breast cancer risk. 2000, Am. J. Epidemiol., 152, 514.
20. Lahmann P.H. et al. Body size and breast cancer risk: findings from the European
Prospective Investigation into Cancer And Nutrition (EPIC). 2004, Int. J. Cancer,
111, 762.
21. Secreto, G. et al. Circulating sex hormones and tumor characteristics in
postmenopausal breast cancer patients. A cross-sectional study. 2011, Int. J. Biol.
Markers, 26, 241.
22. Diab, S.G., Elledge, R.M., and Clark, G.M. Tumor characteristics and clinical
outcome of elderly women with breast cancer. 2000, J. Natl. Cancer Inst., 92,
550.
23. Edwards, B.K. et al. Annual report to the nation on the status of cancer, 1973-
1999, featuring implications of age and aging on U.S. cancer burden. 2002,
Cancer, 94, 2766.
24. Denduluri, N., and Ershler, W.B. Aging biology and cancer. 2004, Semin.
Oncol., 31, 137.
25. Kirschner, M.A. Hirsutism and virilism in women. 1984, Spec. Top. Endocrinol.
Metab., 6, 55.
26. Van Landeghem, A.A. et al. Endogenous concentration and subcellular
distribution of estrogens in normal and malignant human breast tissue. 1985,
Cancer Res., 45, 2900.
27. Vermeulen, A. et al. Aromatase, 17β-hydroxysteroid dehydrogenase and
intratissular sex hormone concentrations in cancerous and normal glandular
breast tissue in postmenopausal women. 1986, Eur. J. Cancer Clin. Oncol., 22, 515.
28. Santen, R.J. Determination of tissue oestradiol in human breast cancer. 1986,
Cancer Surv., 5, 597.
29. Thijssen, J.H.H., and Blankenstein, M.A. Endogenous oestrogens and androgens
in normal and malignant endometrial and mammary tissues. 1989, Eur. J. Cancer
Clin. Oncol., 25, 1953.
30. Mistry, P., Griffiths, K., and Maynard, P.V. Endogenous C19-steroids and
oestradiol levels in human primary breast tumour tissues and their correlation
with androgen and oestrogen receptors. 1986, J. Steroid Biochem., 24, 1117.
31. Recchione, C. et al. Testosterone, dihydrotestosterone and oestradiol levels in
postmenopausal breast cancer tissues. 1995, J. Steroid Biochem. Molec. Biol.,
52, 541.
32. Shibuya, R. et al. Intratumoral concentration of sex steroids and expression of sex
steroid-producing enzymes in ductal carcinoma in situ of human breast. 2008,
Endocr. Relat. Cancer, 15, 113.
33. Sasano, H. et al. In situ estrogen production and its regulation in human breast
carcinoma: from endocrinology to intracrinology. 2009, Pathol. Int., 59, 777.
34. Bergman, M.D. et al. Up-regulation of the uterine estrogen receptor and its
messenger ribonucleic acid during the mouse estrous cycle: the role of estradiol.
1992, Endocrinology, 130, 1923.

Giorgio Secreto 108
35. Pink, J.J., and Jordan, V.C. Models of estrogen receptor regulation by estrogens and
antiestrogens in breast cancer cell lines. 1996, Cancer Res., 56, 2321.
36. Stanisić, V., Lonard, D.M., and O'Malley, B.W. Modulation of steroid hormone
receptor activity. 2010, Prog. Brain Res., 181, 153.
37. Stanway, S.J., Purohit, A., and Reed, M.J. Measurement of estrone Sulfate in
Postmenopausal Women: Comparison of Direct RIA and GC-MS/MS. Methods
for Monitoring Response to Endocrine Therapy in Women with Breast Cancer.
2007, Anticancer Res., 27, 2765.
38. Suzuki, T. et al. Steroid sulfatase and estrogen sulfotransferase in normal human
tissue and breast carcinoma. 2003, J. Steroid Biochem. Molec. Biol., 86, 449.
39. Suzuki, T. et al. Androgens in human breast carcinoma. 2010, Med. Mol.
Morphol., 43, 75.
40. Nagasaki, S. et al. 17β-Hydroxysteroid dehydrogenases in human breast cancer.
2009, Ann. N.Y. Acad. Sci., 1155, 25.
41. Suzuki, T. et al. Estrogen sulfotransferase and steroid sulfatase in human breast
carcinoma. 2003, Cancer Res., 63, 2762.
42. Suzuki, T. et al. Aromatase in human breast carcinomas as a key regulator of
intratumur sex steroid concentrations. 2008, Endocr. J., 55, 455.
43. Agoff, S.N. et al. Androgen receptor expression in estrogen receptor-negative
breast cancer. Immunohistochemical, clinical, and prognostic associations. 2003,
Am. J. Clin. Pathol., 120,725.
44. Nicolás Díaz-Chico, B. et al. Androgens and androgen receptors in breast cancer.
2007, J. Steroid Biochem. Mol. Biol., 105, 1.
45. Ogawa, Y. et al. Androgen receptor expression in breast cancer: relationship with
clinicopathological factors and biomarkers. 2008, Int. J. Clin. Oncol., 13, 431.
46. Park, S. et al. Expression of androgen receptors in primary breast cancer. 2010,
Ann. Oncol. 21, 488.
47. Niemeier, L.A. et al. Androgen receptor in breast cancer: expression in estrogen
receptor-positive tumors and in estrogen receptor-negative tumors with apocrine
differentiation. 2010, Mod. Pathol., 23, 205.
48. Micello, D. et al. Androgen receptor is frequently expressed in HER2-positive,
ER/PR-negative breast cancers. 2010, Virchows Arch., 457, 467.
49. Yu, Q. et al. Expression of androgen receptor in breast cancer and its significance
as a prognostic factor. 2011, Ann. Oncol., 22, 1288.
50. Moinfar, F. et al. Androgen receptors frequently are expressed in breast
carcinomas: potential relevance to new therapeutic strategies. 2003, Cancer,
98, 703.
51. Blankestein, M.A. et al. Tissue androgen and the endocrine autonomy of breast
cancer. 1992, J. Steroid Biochem. Mol. Biol., 43, 167.
52. Pasqualini, J.R. Role of androgens in breast cancer. 1993, J. Steroid Biochem.
Molec. Biol., 45, 167.
53. Suzuki, T. et al. 5a-Reductase type 1 and aromatase in breast carcinoma as
regulators of in situ androgen production. 2007, Int. J. Cancer, 120, 285.
54. Santen, R.J. et al. History of Aromatase: Saga of an Important Biological
Mediator and Therapeutic Target. 2009, Endocr. Rev., 30, 343.

Endocrine classification of breast cancer 109
55. Ricketts, D. et al. Estrogen and progesterone receptors in the normal female
breast. 1991, Cancer Res., 51, 1817.
56. Khan, S.A. et al. The normal breast epithelium of women with breast cancer
displays an aberrant response to estradiol. 1999, Cancer Epidemiol. Biomarkers
Prev., 8, 867.
57. Peters, A.A. et al. Androgen receptor inhibits estrogen receptor-a activity and is
prognostic in breast cancer. 2009, Cancer Res., 69, 6131.
58. Liao, D.J. and Dickson, R.B. Role of androgens in the development, growth, and
carcinogenesis of the mammary gland. 2002, J. Steroid Biochem. Mol. Biol.,
80, 175.
59. Farmer, P. et al. Identification of molecular apocrine breast tumours by
microarray analysis 2005, Oncogene, 24, 4660.
60. Doane, A.S. et al. An estrogen receptor-negative breast cancer subset
characterized by a hormonally regulated transcriptional program and response to
androgen. 2006, Oncogene, 25, 3994.
61. Naderi, A., and Hughes-Davies, L. A functionally significant cross-talk between
androgen receptor and ErbB2 pathways in estrogen receptor negative breast
cancer. 2008, Neoplasia, 10, 542.
62. Vranic, S. et al. EGFR and HER-2/neu expression in invasive apocrine carcinoma
of the breast. 2010, Mod. Pathol., 23, 644.
63. Biscardi, J.S. et al. Tyrosine kinase signalling in breast cancer Epidermal growth
factor receptor and c-Src interactions in breast cancer. 2000, Breast Cancer Res.,
2, 203.
64. Bhargava, R. et al. EGFR gene amplification in breast cancer: correlation with
epidermal growth factor receptor mRNA and protein expression and HER-2
status and absence of EGFR-activating mutations. 2005 Mod. Pathol., 18, 1027.
65. Stanway, S.J. et al. Steroid sulfatase: a new target for the endocrine therapy of
breast cancer. 2007, The Oncologist, 12, 370.
66. Wells, C.A., and El-Ayat, G.A. Non-operative breast pathology: apocrine lesions.
2007, J. Clin. Pathol., 60, 1313.