editors: irka hajdas, christoph kull and ... - rero doc · expertise around quantitative...
TRANSCRIPT
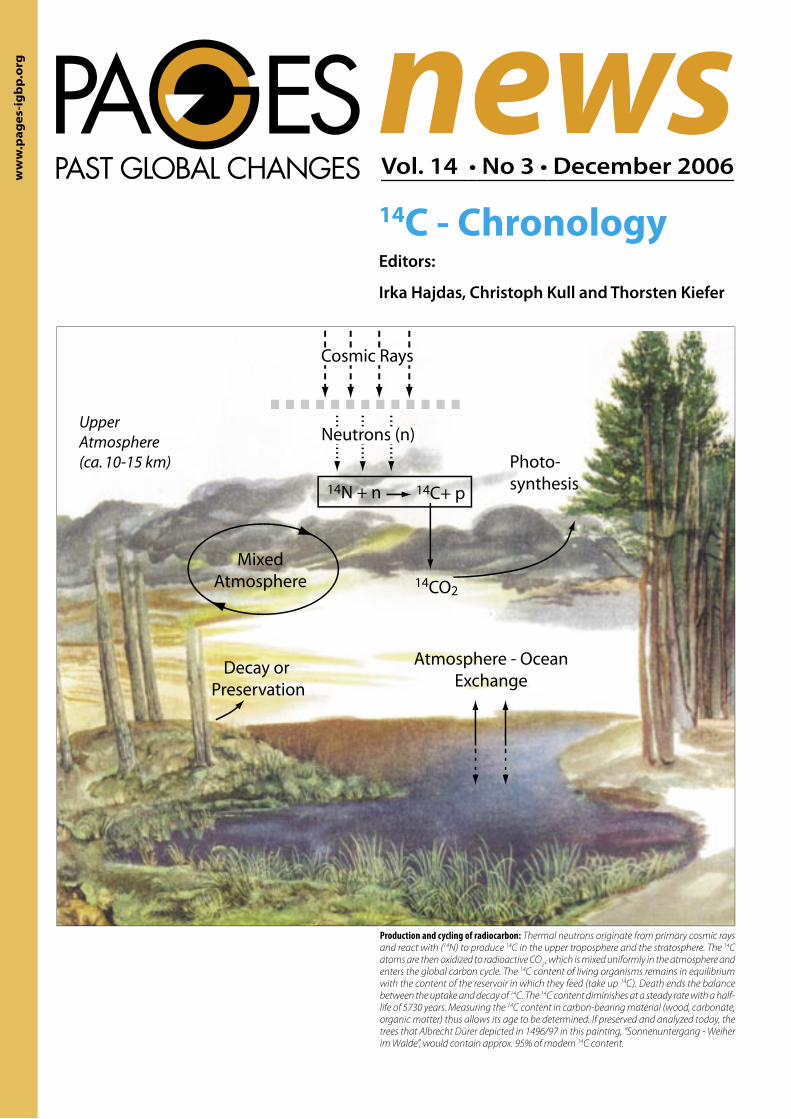
Production and cycling of radiocarbon: Thermal neutrons originate from primary cosmic rays and react with (14N) to produce 14C in the upper troposphere and the stratosphere. The 14C atoms are then oxidized to radioactive CO
2 , which is mixed uniformly in the atmosphere and
enters the global carbon cycle. The 14C content of living organisms remains in equilibrium with the content of the reservoir in which they feed (take up 14C). Death ends the balance between the uptake and decay of 14C. The 14C content diminishes at a steady rate with a half-life of 5730 years. Measuring the 14C content in carbon-bearing material (wood, carbonate, organic matter) thus allows its age to be determined. If preserved and analyzed today, the trees that Albrecht Dürer depicted in 1496/97 in this painting, “Sonnenuntergang - Weiher im Walde”, would contain approx. 95% of modern 14C content.
ww
w.p
ag
es-
igb
p.o
rg
14C - ChronologyEditors:
Irka Hajdas, Christoph Kull and Thorsten Kiefer
����Vol. 14 • No 3 • December 2006
�������������������������������
���������������
���������������
��������������������������
������� ������
�����
���������������������
�����������
������������
2
PAGES News, Vol.14 • No 3 • December 2006
14C-ChronologyIRKA HAJDAS PSI/ETH Laboratory for Ion Beam Physics, Zurich, Switzerland; [email protected]
The radiocarbon dating method is commonly used to estimate the age of carbon-bearing material deposited in nature during the last 50 kyr. During nearly six decades of its application, the method has become a research discipline in itself. An ever-growing de-mand for reliable chronologies drives developments in preparative and measurement techniques. The need for calibration of the 14C timescale, which has been the main challenge posed by the 14C dating method almost from the beginning, has resulted in extended studies of suitable archives (trees, lake sediments, corals, stalagmites), as well as the development of calibration programs. All these developments were possible because of interdisciplinary collaborations. The exciting questions emerging as the work continues call for closer collaboration to keep the communities informed and interacting. For example, recent discussions on the timing of the Neanderthal extinction, the dispersion of modern Homo sapiens across Europe, and the possible connections to the climate changes that took place around that time of meltwater event Heinrich 4, rely heavily on the radiocarbon timescale and calibration. Our knowledge of paleo-reservoir ages, which is critical for marine records, is still very limited and a combined eff ort of the paleo and 14C communities is needed. Furthermore, new calibration tools are now available and the benefi ts of using them should be pre-sented to the paleocommunity.
In this issue of PAGES news, nine contributions present overview and progress reports on new developments in 14C dating meth-od and applications: The complex global cycle of the cosmogenic isotope 14C is addressed by Konrad Hughen. He presents an over-view of the recent reconstructions of Δ14C (the measure of variability in the atmospheric 14C content), which also contribute to the eff ort to extend the radiocarbon calibration curve back to the limit of the method (ca. 50-60 kyr BP). The progress and future pros-pects of the extension of the calibration curve is the focus of the IntCal group, presented in this issue by Paula Reimer. Promising new results from dating ancient Kauri wood from New Zealand (OIS3) were obtained by Alan Hogg and co-workers. Work towards more precise chronologies depends on the quality of radiocarbon ages. Results of two recent inter-comparison exercises (FIRI and VIRI) are reported by Marian Scott. In the contribution from Ron and Paula Reimer, spatial variability of marine reservoir ages is addressed; an important correction included in the calibration program and needed for marine records. Reconstruction of paleoreservoir ages is addressed by Pieter Grootes and Michael Sarnthein. Christopher Bronk Ramsey describes the Bayesian approach to calibrating sequences of 14C ages using OxCal. A similar approach using the Bpeat code based on the MexCal program is presented by Maarten Blaauw. The higher precision of chronologies based on such approaches is illustrated by examples discussed in the contribution by David Lowe, Rewi Newnham and myself.
These are only a few examples of 14C research activities that aim to improve the radiocarbon timescale and our understanding of complex processes that complicate this otherwise very straightforward method. We are all looking forward to the new, exciting data and even closer collaboration between the paleo and 14C communities.
Edit
oria
l
April 11 - 14, 2007, Nanjing, China2nd LIMPACS Salinity, Climate Change and Salinisation Workshop
Further Information:www.geog.ucl.ac.uk/ecrc/limpacs/events.htm
May 19 - 24, 2007, Obergurgel, AustriaOcean Controls in Abrupt Climate Change ESF-FWF Conference in Partnership with LFUI
Further Information:www.pages.unibe.ch/calendar/2007/ESF_Conference_announcement.pdf
July 11 - 14, 2007, Barcelona, Spain4th International Limnogeology Congress
Further Information:www.ilic2007.com/
July 28 - August 3, Cairns, AustraliaXVII INQUA Congress 2007
Further Information:www.inqua2007.net.au
August 27 - 31, 2007, Beijing, ChinaThird Alexander von Humboldt International Conference: East Asian Summer Monsoon, past, present and future
Further Information:www.pages.unibe.ch/calendar/2007/monsoon_simp.pdf
August 27 - 31, 2007, Hamburg, GermanySecond International Conference on Earth System Modeling
Further Information:
www.mpimet.mpg.de/icesm
PAGES calendar 2007
3
PAGES News, Vol.14 • No 3 • December 2006
An
nou
nce
men
tsInside PagesThere will be some new faces at the PAGES IPO and on the PAGES SSC at the start of 2007.
Leaving Science OfficerAfter 6 years at the IPO, Christoph Kull is moving on to work for the Swiss “Advisory Body on Climate Change” (OcCC), whose role is to formulate rec-ommendations on questions regarding climate and global change for politicians and the federal administration. While he will certainly be missed, his presence will still be felt for a long time, given his work on many ongoing activities, as well as 15 co-edited PAGES newsletters, countless PPT teaching slides and photographs, and other products that you will still be able to download from our online Product Da-tabase. We thank him for his services to the paleoscience community, wish him the best of luck and success in his new post, and hope to meet him frequently in the future as an active member of the PAGES community. His successor will be presented in the next PAGES News.
Outgoing PAGES SSC membersAt the end of 2006, PAGES Scientific Steering Committee (SSC) says fare-well to Carol Crumley (USA), José
Ignacio Martínez (Colombia), and Ryuji Tada (Japan). We thank them for their contributions to PAGES, and their help and dedication during their time on the Committee. We are sure that they will continue to remain engaged in PAGES activities.
Incoming PAGES SSC membersPAGES welcomes three new members to its SSC in 2007. Takeshi Nakatsuka (Ja-pan) is Assistant Professor in Geochem-istry at Hokkaido University. He has a scientific background in both modern ocean biogeochemistry as well as paleo applications in marine biogeochemis-try, and is now extending towards pa-leoenvironmental studies on land. José D. Carriquiry (Mexico) is a professor at the Oceanographic Research Institute (Marine Geochemistry Group) of the Uni-versidad Autónoma de Baja California at Ensenada. His scientific expertise in coral paleoclimatology led him to active in-volvement in the PAGES/CLIVAR initiative on Annual Records of Tropical Systems (ARTS). This expertise will be an excellent complement to the existing fields on the SSC. Pierre Francus (Canada), originally from Belgium, is a professor at the Uni-versité du Québec. His broad scientific
expertise around quantitative sedimen-tology, paleoenvironmental reconstruc-tion and quaternary paleoclimatology, fits within the PAGES/CLIVAR, IMAGES, and Polar focus groups.
PAGES science planBeyond changes in personnel, 2007 will also see the publication of a new Science and Implementation Plan, which will flesh out PAGES revised scientific structure, the general form of which can be found at www.pages-igbp.org/science/research/newstructure.html. This new plan will provide a framework for activities on and around paleoscience that we hope you will bring to life by getting involved in, as a member or even as a leader.
Next issue of PAGES NewsThe next deadline for manuscript submis-sions to the PAGES newsletter is 28 Febru-ary 2007. This issue will contain an open section for your contributions as usual as well as a special section on past human - climate - ecosystem interactions guest edited by John Dearing (UK). Guidelines for submitting articles can be found at www.pages-igbp.org/products/newslet-ters/instructions.html.
���������
����������������������������������������������������������������������� ���� �������� �������� ���� ������������� ��������������� ����� ������� �������� ������� ��������� ������������������������������������������������������������������������� ���� ���� ������������� �� ������������� ����� ��������������� ��������� ���� ������������ ������ ��������� ����������������������������������������������������������������������������������������������������
��������������������������������������������������������������������������������������
�������������������������������������������������������������������������������
������������������������������������������
��������������������������������������������������������������������������������������
�����������������������������������������������������������
New on the PAGES bookshelf
4
PAGES News, Vol.14 • No 3 • December 2006
The Millennium project: European climate of the last millenniumM. GAGEN1, D. MCCARROLL1 AND S. HICKS2
1Department of Geography, University of Wales Swansea, UK; [email protected] of Geosciences, University of Oulu, Finland
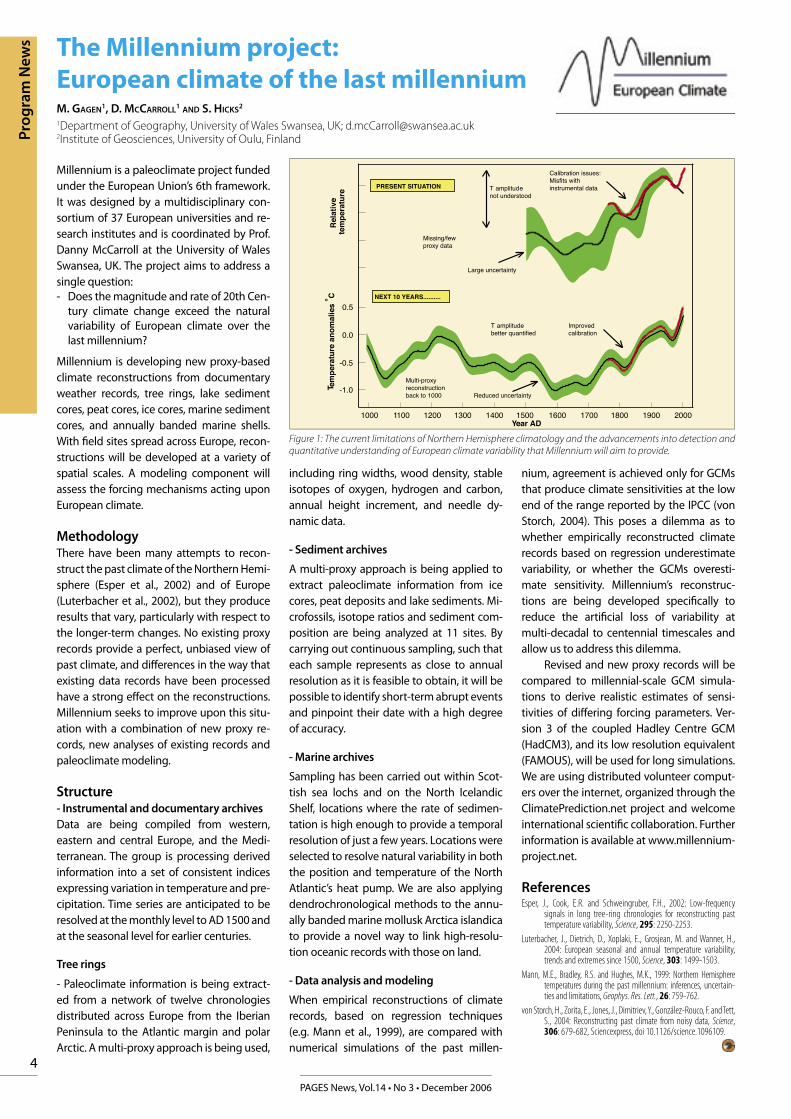
Millennium is a paleoclimate project funded under the European Union’s 6th framework. It was designed by a multidisciplinary con-sortium of 37 European universities and re-search institutes and is coordinated by Prof. Danny McCarroll at the University of Wales Swansea, UK. The project aims to address a single question:- Does the magnitude and rate of 20th Cen-
tury climate change exceed the natural variability of European climate over the last millennium?
Millennium is developing new proxy-based climate reconstructions from documentary weather records, tree rings, lake sediment cores, peat cores, ice cores, marine sediment cores, and annually banded marine shells. With fi eld sites spread across Europe, recon-structions will be developed at a variety of spatial scales. A modeling component will assess the forcing mechanisms acting upon European climate.
MethodologyThere have been many attempts to recon-struct the past climate of the Northern Hemi-sphere (Esper et al., 2002) and of Europe (Luterbacher et al., 2002), but they produce results that vary, particularly with respect to the longer-term changes. No existing proxy records provide a perfect, unbiased view of past climate, and diff erences in the way that existing data records have been processed have a strong eff ect on the reconstructions. Millennium seeks to improve upon this situ-ation with a combination of new proxy re-cords, new analyses of existing records and paleoclimate modeling.
Structure- Instrumental and documentary archivesData are being compiled from western, eastern and central Europe, and the Medi-terranean. The group is processing derived information into a set of consistent indices expressing variation in temperature and pre-cipitation. Time series are anticipated to be resolved at the monthly level to AD 1500 and at the seasonal level for earlier centuries.
Tree rings
- Paleoclimate information is being extract-ed from a network of twelve chronologies distributed across Europe from the Iberian Peninsula to the Atlantic margin and polar Arctic. A multi-proxy approach is being used,
including ring widths, wood density, stable isotopes of oxygen, hydrogen and carbon, annual height increment, and needle dy-namic data.
- Sediment archives
A multi-proxy approach is being applied to extract paleoclimate information from ice cores, peat deposits and lake sediments. Mi-crofossils, isotope ratios and sediment com-position are being analyzed at 11 sites. By carrying out continuous sampling, such that each sample represents as close to annual resolution as it is feasible to obtain, it will be possible to identify short-term abrupt events and pinpoint their date with a high degree of accuracy.
- Marine archives
Sampling has been carried out within Scot-tish sea lochs and on the North Icelandic Shelf, locations where the rate of sedimen-tation is high enough to provide a temporal resolution of just a few years. Locations were selected to resolve natural variability in both the position and temperature of the North Atlantic’s heat pump. We are also applying dendrochronological methods to the annu-ally banded marine mollusk Arctica islandica to provide a novel way to link high-resolu-tion oceanic records with those on land.
- Data analysis and modeling
When empirical reconstructions of climate records, based on regression techniques (e.g. Mann et al., 1999), are compared with numerical simulations of the past millen-
nium, agreement is achieved only for GCMs that produce climate sensitivities at the low end of the range reported by the IPCC (von Storch, 2004). This poses a dilemma as to whether empirically reconstructed climate records based on regression underestimate variability, or whether the GCMs overesti-mate sensitivity. Millennium’s reconstruc-tions are being developed specifi cally to reduce the artifi cial loss of variability at multi-decadal to centennial timescales and allow us to address this dilemma.
Revised and new proxy records will be compared to millennial-scale GCM simula-tions to derive realistic estimates of sensi-tivities of diff ering forcing parameters. Ver-sion 3 of the coupled Hadley Centre GCM (HadCM3), and its low resolution equivalent (FAMOUS), will be used for long simulations. We are using distributed volunteer comput-ers over the internet, organized through the ClimatePrediction.net project and welcome international scientifi c collaboration. Further information is available at www.millennium-project.net.
ReferencesEsper, J., Cook, E.R. and Schweingruber, F.H., 2002: Low-frequency
signals in long tree-ring chronologies for reconstructing past temperature variability, Science, 295: 2250-2253.
Luterbacher, J., Dietrich, D., Xoplaki, E., Grosjean, M. and Wanner, H., 2004: European seasonal and annual temperature variability, trends and extremes since 1500, Science, 303: 1499-1503.
Mann, M.E., Bradley, R.S. and Hughes, M.K., 1999: Northern Hemisphere temperatures during the past millennium: inferences, uncertain-ties and limitations, Geophys. Res. Lett., 26: 759-762.
von Storch, H., Zorita, E., Jones, J., Dimitriev, Y., González-Rouco, F. and Tett, S., 2004: Reconstructing past climate from noisy data, Science, 306: 679-682, Sciencexpress, doi 10.1126/science.1096109.
Year AD
Missing/few proxy data
Multi-proxyreconstructionback to 1000
T amplitudenot understood
T amplitude better quantified
Calibration issues:Misfits with instrumental data
Improved calibration
PRESENT SITUATION
Reduced uncertainty
Large uncertainty
1000 1100 1200 1300 1400 1500 1600 1700 1800 1900 2000
0.0
0.5
-0.5
-1.0T em
pera
ture
ano
mal
ies
° C
Rel
ativ
e te
mpe
ratu
re
NEXT 10 YEARS..........
Figure 1: The current limitations of Northern Hemisphere climatology and the advancements into detection and quantitative understanding of European climate variability that Millennium will aim to provide.
Prog
ram
New
s
5
PAGES News, Vol.14 • No 3 • December 2006
Prog
ram
New
sPaleoenvironments in south India: Monsoon records from rainfed reservoirsK. ANUPAMA
French Institute of Pondicherry, India; [email protected]
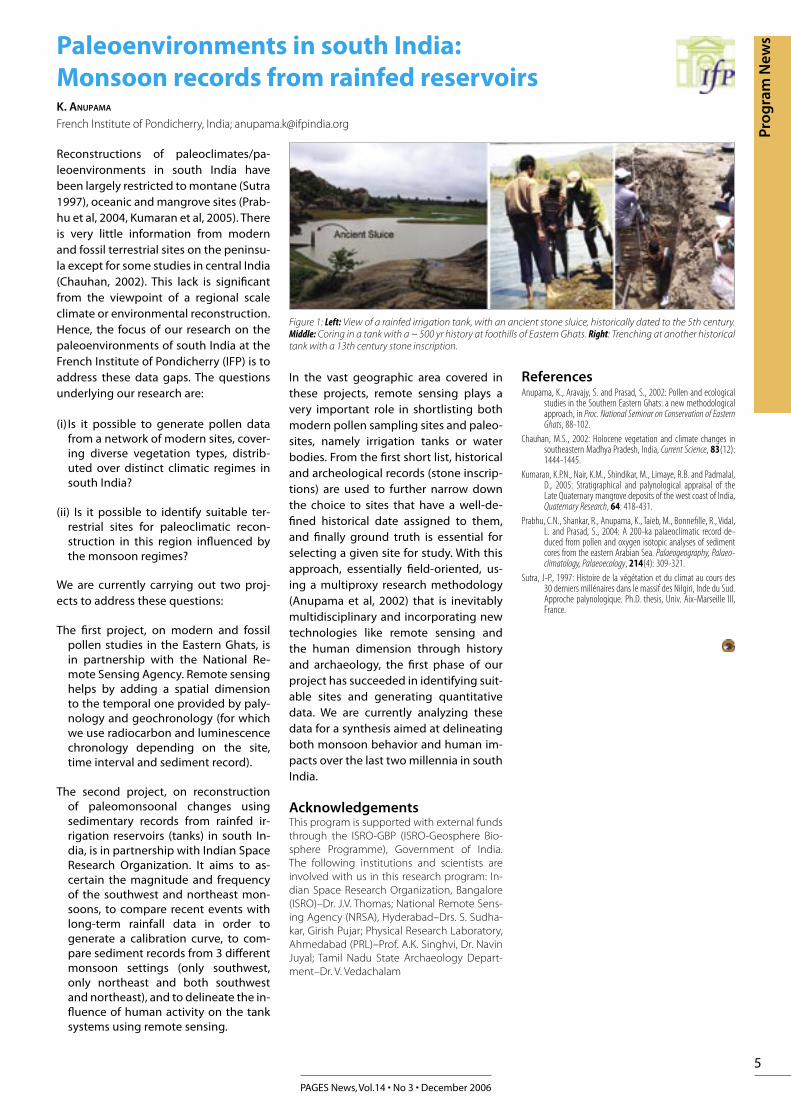
Reconstructions of paleoclimates/pa-leoenvironments in south India have been largely restricted to montane (Sutra 1997), oceanic and mangrove sites (Prab-hu et al, 2004, Kumaran et al, 2005). There is very little information from modern and fossil terrestrial sites on the peninsu-la except for some studies in central India (Chauhan, 2002). This lack is significant from the viewpoint of a regional scale climate or environmental reconstruction. Hence, the focus of our research on the paleoenvironments of south India at the French Institute of Pondicherry (IFP) is to address these data gaps. The questions underlying our research are:
(i) Is it possible to generate pollen data from a network of modern sites, cover-ing diverse vegetation types, distrib-uted over distinct climatic regimes in south India?
(ii) Is it possible to identify suitable ter-restrial sites for paleoclimatic recon-struction in this region influenced by the monsoon regimes?
We are currently carrying out two proj-ects to address these questions:
The first project, on modern and fossil pollen studies in the Eastern Ghats, is in partnership with the National Re-mote Sensing Agency. Remote sensing helps by adding a spatial dimension to the temporal one provided by paly-nology and geochronology (for which we use radiocarbon and luminescence chronology depending on the site, time interval and sediment record).
The second project, on reconstruction of paleomonsoonal changes using sedimentary records from rainfed ir-rigation reservoirs (tanks) in south In-dia, is in partnership with Indian Space Research Organization. It aims to as-certain the magnitude and frequency of the southwest and northeast mon-soons, to compare recent events with long-term rainfall data in order to generate a calibration curve, to com-pare sediment records from 3 different monsoon settings (only southwest, only northeast and both southwest and northeast), and to delineate the in-fluence of human activity on the tank systems using remote sensing.
In the vast geographic area covered in these projects, remote sensing plays a very important role in shortlisting both modern pollen sampling sites and paleo-sites, namely irrigation tanks or water bodies. From the first short list, historical and archeological records (stone inscrip-tions) are used to further narrow down the choice to sites that have a well-de-fined historical date assigned to them, and finally ground truth is essential for selecting a given site for study. With this approach, essentially field-oriented, us-ing a multiproxy research methodology (Anupama et al, 2002) that is inevitably multidisciplinary and incorporating new technologies like remote sensing and the human dimension through history and archaeology, the first phase of our project has succeeded in identifying suit-able sites and generating quantitative data. We are currently analyzing these data for a synthesis aimed at delineating both monsoon behavior and human im-pacts over the last two millennia in south India.
AcknowledgementsThis program is supported with external funds through the ISRO-GBP (ISRO-Geosphere Bio-sphere Programme), Government of India. The following institutions and scientists are involved with us in this research program: In-dian Space Research Organization, Bangalore (ISRO)–Dr. J.V. Thomas; National Remote Sens-ing Agency (NRSA), Hyderabad–Drs. S. Sudha-kar, Girish Pujar; Physical Research Laboratory, Ahmedabad (PRL)–Prof. A.K. Singhvi, Dr. Navin Juyal; Tamil Nadu State Archaeology Depart-ment–Dr. V. Vedachalam
ReferencesAnupama, K., Aravajy, S. and Prasad, S., 2002: Pollen and ecological
studies in the Southern Eastern Ghats: a new methodological approach, in Proc. National Seminar on Conservation of Eastern Ghats, 88-102.
Chauhan, M.S., 2002: Holocene vegetation and climate changes in southeastern Madhya Pradesh, India, Current Science, 83(12): 1444-1445.
Kumaran, K.P.N., Nair, K.M., Shindikar, M., Limaye, R.B. and Padmalal, D., 2005: Stratigraphical and palynological appraisal of the Late Quaternary mangrove deposits of the west coast of India, Quaternary Research, 64: 418-431.
Prabhu, C.N., Shankar, R., Anupama, K., Taieb, M., Bonnefille, R., Vidal, L. and Prasad, S., 2004: A 200-ka palaeoclimatic record de-duced from pollen and oxygen isotopic analyses of sediment cores from the eastern Arabian Sea. Palaeogeography, Palaeo-climatology, Palaeoecology, 214(4): 309-321.
Sutra, J-P., 1997: Histoire de la végétation et du climat au cours des 30 derniers millénaires dans le massif des Nilgiri, Inde du Sud. Approche palynologique. Ph.D. thesis, Univ. Aix-Marseille III, France.
Figure 1: Left: View of a rainfed irrigation tank, with an ancient stone sluice, historically dated to the 5th century. Middle: Coring in a tank with a ~ 500 yr history at foothills of Eastern Ghats. Right: Trenching at another historical tank with a 13th century stone inscription.
6
PAGES News, Vol.14 • No 3 • December 2006
Cosmogenic isotope 14C: Production and carbon cycleK. HUGHEN Department of Marine Chemistry and Geochemistry, Woods Hole Oceanographic Institution, USA; [email protected]
Global Δ14C cycleRadiocarbon is produced by galactic cosmic radiation interacting with atmospheric ni-trogen, and enters the global carbon cycle as 14CO
2, which is well mixed within the at-
mosphere. Photosynthesis fixes CO2, and
hence 14CO2, into plant organic matter and
the global food chain. In addition, CO2 dis-
solves in water (primarily seawater) to form dissolved inorganic carbon (DIC) that can then be incorporated into marine carbon-ates. Conventional 14C dating assumes that initial 14C concentration has remained con-stant. However, atmospheric and surface ocean 14C concentrations have changed no-tably through time. This is due to changes in either the rate of 14C production in the at-mosphere (a function of geomagnetic field intensity and solar variability), or the distri-bution of 14C between different reservoirs in the global carbon cycle (primarily deep ocean ventilation).
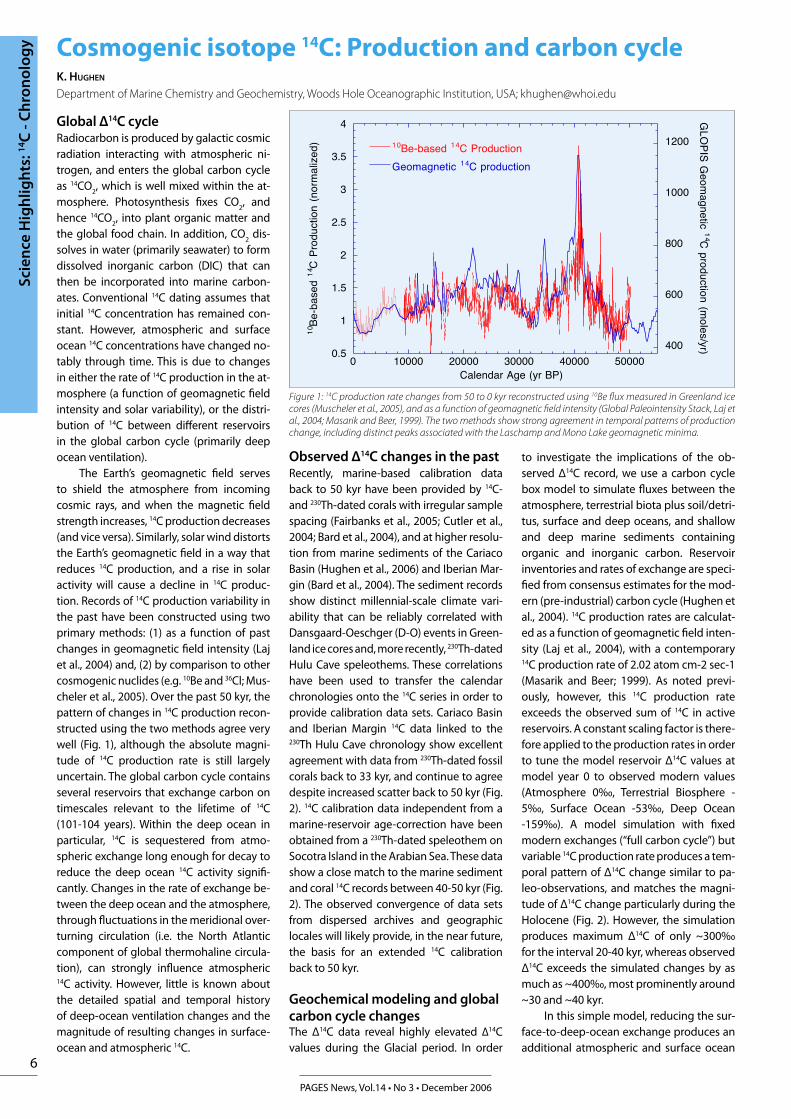
The Earth’s geomagnetic field serves to shield the atmosphere from incoming cosmic rays, and when the magnetic field strength increases, 14C production decreases (and vice versa). Similarly, solar wind distorts the Earth’s geomagnetic field in a way that reduces 14C production, and a rise in solar activity will cause a decline in 14C produc-tion. Records of 14C production variability in the past have been constructed using two primary methods: (1) as a function of past changes in geomagnetic field intensity (Laj et al., 2004) and, (2) by comparison to other cosmogenic nuclides (e.g. 10Be and 36Cl; Mus-cheler et al., 2005). Over the past 50 kyr, the pattern of changes in 14C production recon-structed using the two methods agree very well (Fig. 1), although the absolute magni-tude of 14C production rate is still largely uncertain. The global carbon cycle contains several reservoirs that exchange carbon on timescales relevant to the lifetime of 14C (101-104 years). Within the deep ocean in particular, 14C is sequestered from atmo-spheric exchange long enough for decay to reduce the deep ocean 14C activity signifi-cantly. Changes in the rate of exchange be-tween the deep ocean and the atmosphere, through fluctuations in the meridional over-turning circulation (i.e. the North Atlantic component of global thermohaline circula-tion), can strongly influence atmospheric 14C activity. However, little is known about the detailed spatial and temporal history of deep-ocean ventilation changes and the magnitude of resulting changes in surface-ocean and atmospheric 14C.
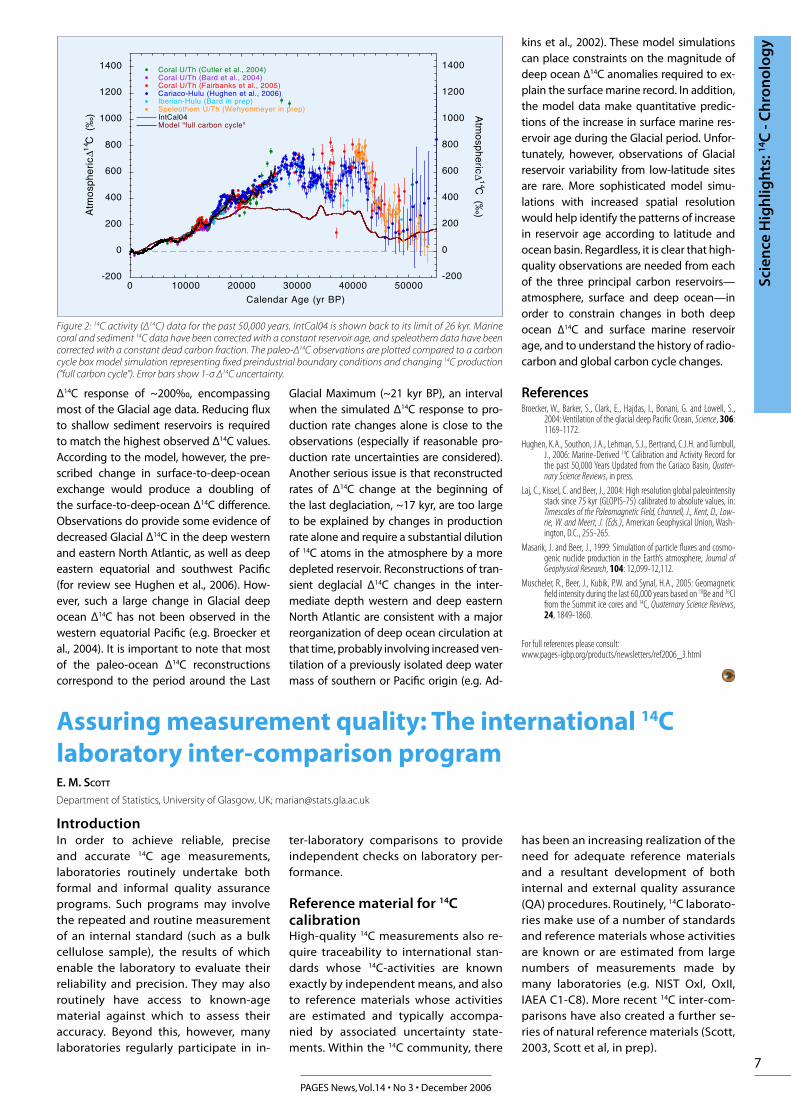
Observed Δ14C changes in the pastRecently, marine-based calibration data back to 50 kyr have been provided by 14C- and 230Th-dated corals with irregular sample spacing (Fairbanks et al., 2005; Cutler et al., 2004; Bard et al., 2004), and at higher resolu-tion from marine sediments of the Cariaco Basin (Hughen et al., 2006) and Iberian Mar-gin (Bard et al., 2004). The sediment records show distinct millennial-scale climate vari-ability that can be reliably correlated with Dansgaard-Oeschger (D-O) events in Green-land ice cores and, more recently, 230Th-dated Hulu Cave speleothems. These correlations have been used to transfer the calendar chronologies onto the 14C series in order to provide calibration data sets. Cariaco Basin and Iberian Margin 14C data linked to the 230Th Hulu Cave chronology show excellent agreement with data from 230Th-dated fossil corals back to 33 kyr, and continue to agree despite increased scatter back to 50 kyr (Fig. 2). 14C calibration data independent from a marine-reservoir age-correction have been obtained from a 230Th-dated speleothem on Socotra Island in the Arabian Sea. These data show a close match to the marine sediment and coral 14C records between 40-50 kyr (Fig. 2). The observed convergence of data sets from dispersed archives and geographic locales will likely provide, in the near future, the basis for an extended 14C calibration back to 50 kyr.
Geochemical modeling and global carbon cycle changesThe Δ14C data reveal highly elevated ∆14C values during the Glacial period. In order
to investigate the implications of the ob-served Δ14C record, we use a carbon cycle box model to simulate fluxes between the atmosphere, terrestrial biota plus soil/detri-tus, surface and deep oceans, and shallow and deep marine sediments containing organic and inorganic carbon. Reservoir inventories and rates of exchange are speci-fied from consensus estimates for the mod-ern (pre-industrial) carbon cycle (Hughen et al., 2004). 14C production rates are calculat-ed as a function of geomagnetic field inten-sity (Laj et al., 2004), with a contemporary 14C production rate of 2.02 atom cm-2 sec-1 (Masarik and Beer; 1999). As noted previ-ously, however, this 14C production rate exceeds the observed sum of 14C in active reservoirs. A constant scaling factor is there-fore applied to the production rates in order to tune the model reservoir Δ14C values at model year 0 to observed modern values (Atmosphere 0‰, Terrestrial Biosphere -5‰, Surface Ocean -53‰, Deep Ocean -159‰). A model simulation with fixed modern exchanges (“full carbon cycle”) but variable 14C production rate produces a tem-poral pattern of Δ14C change similar to pa-leo-observations, and matches the magni-tude of Δ14C change particularly during the Holocene (Fig. 2). However, the simulation produces maximum Δ14C of only ~300‰ for the interval 20-40 kyr, whereas observed Δ14C exceeds the simulated changes by as much as ~400‰, most prominently around ~30 and ~40 kyr.
In this simple model, reducing the sur-face-to-deep-ocean exchange produces an additional atmospheric and surface ocean
5.0
1
5.1
2
5.2
3
5.3
4
004
006
008
0001
0021
00005000040000300002000010
01 desab-eB 41 noitcudorP CcitengamoeG 41 noitcudorp C
GLO
PIS Geom
agnetic 14C production (m
oles/yr)
10Be
-bas
ed14
C P
rodu
ctio
n (n
orm
aliz
ed)
)PB ry( egA radnelaC
Figure 1: 14C production rate changes from 50 to 0 kyr reconstructed using 10Be flux measured in Greenland ice cores (Muscheler et al., 2005), and as a function of geomagnetic field intensity (Global Paleointensity Stack, Laj et al., 2004; Masarik and Beer, 1999). The two methods show strong agreement in temporal patterns of production change, including distinct peaks associated with the Laschamp and Mono Lake geomagnetic minima.
Scie
nce
Hig
hlig
hts:
14C
- C
hro
nol
ogy
7
PAGES News, Vol.14 • No 3 • December 2006
Sci
ence
Hig
hlig
hts:
14C
- C
hro
nol
ogy
Δ14C response of ~200‰, encompassing most of the Glacial age data. Reducing flux to shallow sediment reservoirs is required to match the highest observed Δ14C values. According to the model, however, the pre-scribed change in surface-to-deep-ocean exchange would produce a doubling of the surface-to-deep-ocean Δ14C difference. Observations do provide some evidence of decreased Glacial Δ14C in the deep western and eastern North Atlantic, as well as deep eastern equatorial and southwest Pacific (for review see Hughen et al., 2006). How-ever, such a large change in Glacial deep ocean Δ14C has not been observed in the western equatorial Pacific (e.g. Broecker et al., 2004). It is important to note that most of the paleo-ocean Δ14C reconstructions correspond to the period around the Last
Glacial Maximum (~21 kyr BP), an interval when the simulated Δ14C response to pro-duction rate changes alone is close to the observations (especially if reasonable pro-duction rate uncertainties are considered). Another serious issue is that reconstructed rates of Δ14C change at the beginning of the last deglaciation, ~17 kyr, are too large to be explained by changes in production rate alone and require a substantial dilution of 14C atoms in the atmosphere by a more depleted reservoir. Reconstructions of tran-sient deglacial Δ14C changes in the inter-mediate depth western and deep eastern North Atlantic are consistent with a major reorganization of deep ocean circulation at that time, probably involving increased ven-tilation of a previously isolated deep water mass of southern or Pacific origin (e.g. Ad-
002-
0
002
004
006
008
0001
0021
0041
00005000040000300002000010
)4002 ,.la te reltuC( hT/U laroC)4002 ,.la te draB( hT/U laroC
)5002 ,.la te sknabriaF( hT/U laroC)6002 ,.la te nehguH( uluH-ocairaC
)perp ni reyemneyheW( hT/U mehtoelepS)perp ni draB( uluH-nairebI
40laCtnI"elcyc nobrac lluf" ledoM
002-
0
002
004
006
008
0001
0021
0041
Atm
osph
eric
�14C
(‰
)
)PB ry( egA radnelaCAtm
ospheric�14C
(‰)
Figure 2: 14C activity (Δ14C) data for the past 50,000 years. IntCal04 is shown back to its limit of 26 kyr. Marine coral and sediment 14C data have been corrected with a constant reservoir age, and speleothem data have been corrected with a constant dead carbon fraction. The paleo-Δ14C observations are plotted compared to a carbon cycle box model simulation representing fixed preindustrial boundary conditions and changing 14C production (“full carbon cycle”). Error bars show 1-σ Δ14C uncertainty.
kins et al., 2002). These model simulations can place constraints on the magnitude of deep ocean ∆14C anomalies required to ex-plain the surface marine record. In addition, the model data make quantitative predic-tions of the increase in surface marine res-ervoir age during the Glacial period. Unfor-tunately, however, observations of Glacial reservoir variability from low-latitude sites are rare. More sophisticated model simu-lations with increased spatial resolution would help identify the patterns of increase in reservoir age according to latitude and ocean basin. Regardless, it is clear that high-quality observations are needed from each of the three principal carbon reservoirs—atmosphere, surface and deep ocean—in order to constrain changes in both deep ocean ∆14C and surface marine reservoir age, and to understand the history of radio-carbon and global carbon cycle changes.
ReferencesBroecker, W., Barker, S., Clark, E., Hajdas, I., Bonani, G. and Lowell, S.,
2004: Ventilation of the glacial deep Pacific Ocean, Science, 306: 1169-1172.
Hughen, K.A., Southon, J.A., Lehman, S.J., Bertrand, C.J.H. and Turnbull, J., 2006: Marine-Derived 14C Calibration and Activity Record for the past 50,000 Years Updated from the Cariaco Basin, Quater-nary Science Reviews, in press.
Laj, C., Kissel, C. and Beer, J., 2004: High resolution global paleointensity stack since 75 kyr (GLOPIS-75) calibrated to absolute values, in: Timescales of the Paleomagnetic Field, Channell, J., Kent, D., Low-rie, W. and Meert, J. (Eds.), American Geophysical Union, Wash-ington, D.C., 255-265.
Masarik, J. and Beer, J., 1999: Simulation of particle fluxes and cosmo-genic nuclide production in the Earth’s atmosphere, Journal of Geophysical Research, 104: 12,099-12,112.
Muscheler, R., Beer, J., Kubik, P.W. and Synal, H.A., 2005: Geomagnetic field intensity during the last 60,000 years based on 10Be and 36Cl from the Summit ice cores and 14C, Quaternary Science Reviews, 24, 1849-1860.
For full references please consult: www.pages-igbp.org/products/newsletters/ref2006_3.html
Assuring measurement quality: The international 14C laboratory inter-comparison programE. M. SCOTT
Department of Statistics, University of Glasgow, UK; [email protected]
IntroductionIn order to achieve reliable, precise and accurate 14C age measurements, laboratories routinely undertake both formal and informal quality assurance programs. Such programs may involve the repeated and routine measurement of an internal standard (such as a bulk cellulose sample), the results of which enable the laboratory to evaluate their reliability and precision. They may also routinely have access to known-age material against which to assess their accuracy. Beyond this, however, many laboratories regularly participate in in-
ter-laboratory comparisons to provide independent checks on laboratory per-formance.
Reference material for 14C calibrationHigh-quality 14C measurements also re-quire traceability to international stan-dards whose 14C-activities are known exactly by independent means, and also to reference materials whose activities are estimated and typically accompa-nied by associated uncertainty state-ments. Within the 14C community, there
has been an increasing realization of the need for adequate reference materials and a resultant development of both internal and external quality assurance (QA) procedures. Routinely, 14C laborato-ries make use of a number of standards and reference materials whose activities are known or are estimated from large numbers of measurements made by many laboratories (e.g. NIST OxI, OxII, IAEA C1-C8). More recent 14C inter-com-parisons have also created a further se-ries of natural reference materials (Scott, 2003, Scott et al, in prep).
8
PAGES News, Vol.14 • No 3 • December 2006
History of inter-comparisonsSince the early days of applied 14C mea-surement, it has been common practice for laboratories to exchange samples in attempts to improve and sustain analyti-cal confi dence. With time, this practice has given way to a succession of more formal inter-comparison exercises. Within the 14C community in the past 20 years, there have been a number of very exten-sive inter-laboratory trials. These com-parisons have varied widely in terms of sample type and preparation, with their primary goal the investigation of the comparability of results produced under possibly quite diff erent laboratory proto-cols. Regular comparisons have reassured users that the laboratories are striving to ensure highest quality results, while at the same time allowing the laboratories to identify any systematic off sets and ad-ditional sources of variation. Thus, partici-pation in a laboratory inter-comparison has become an important part of a formal QA program.
Here we summarize some of the fi nd-ings from the two most recent 14C inter-comparison exercises (FIRI (Fourth) and VIRI (Fifth), Scott 2003 and Scott et al, in prep.). VIRI is ongoing at this time but continues the tradition of TIRI (Third) and FIRI, operating as an independent check on laboratory procedures. It is a 4-year project, with the fi rst phase already com-pleted. Phase 2, using bone samples, is due to be reported by the end of 2006. Further stages will include samples of peat, wood and shell with a range of ages. VIRI, like the TIRI and FIRI inter-com-parisons, is a 14C community project, with samples provided by participants and a substantial laboratory participation rate of over 75%.
What questions have been asked and answered by these inter-comparisons?- Comparability of measurements from diff erent laboratories
One of the main questions that such inter-comparisons are used to answer concerns how comparable the results are among laboratories, especially where some use diff erent procedures and techniques. For the 14C dating community, this historically concerned the comparability of results from the accelerator mass spectrometric (AMS) and radiometric (liquid scintillation (LSC) or gas proportional counting (GPC)) laboratories.
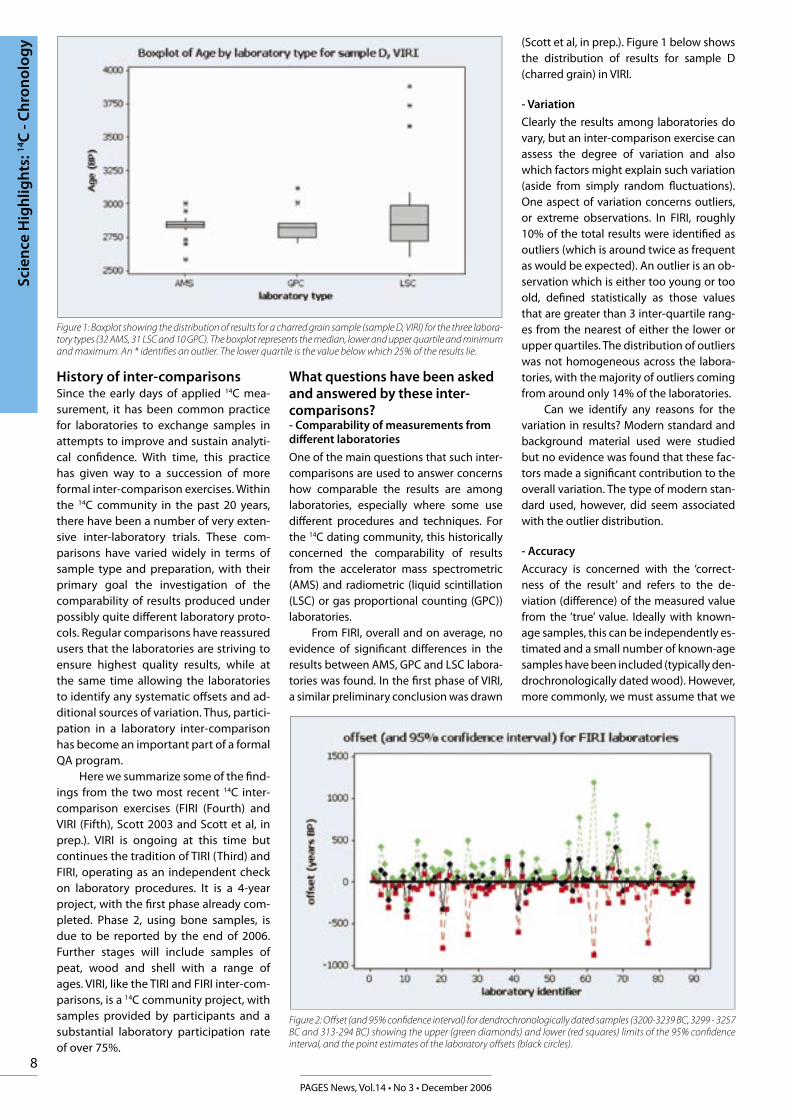
From FIRI, overall and on average, no evidence of signifi cant diff erences in the results between AMS, GPC and LSC labora-tories was found. In the fi rst phase of VIRI, a similar preliminary conclusion was drawn
(Scott et al, in prep.). Figure 1 below shows the distribution of results for sample D (charred grain) in VIRI.
- Variation
Clearly the results among laboratories do vary, but an inter-comparison exercise can assess the degree of variation and also which factors might explain such variation (aside from simply random fl uctuations). One aspect of variation concerns outliers, or extreme observations. In FIRI, roughly 10% of the total results were identifi ed as outliers (which is around twice as frequent as would be expected). An outlier is an ob-servation which is either too young or too old, defi ned statistically as those values that are greater than 3 inter-quartile rang-es from the nearest of either the lower or upper quartiles. The distribution of outliers was not homogeneous across the labora-tories, with the majority of outliers coming from around only 14% of the laboratories.
Can we identify any reasons for the variation in results? Modern standard and background material used were studied but no evidence was found that these fac-tors made a signifi cant contribution to the overall variation. The type of modern stan-dard used, however, did seem associated with the outlier distribution.
- Accuracy
Accuracy is concerned with the ‘correct-ness of the result’ and refers to the de-viation (diff erence) of the measured value from the ‘true’ value. Ideally with known-age samples, this can be independently es-timated and a small number of known-age samples have been included (typically den-drochronologically dated wood). However, more commonly, we must assume that we
Figure 1: Boxplot showing the distribution of results for a charred grain sample (sample D, VIRI) for the three labora-tory types (32 AMS, 31 LSC and 10 GPC). The boxplot represents the median, lower and upper quartile and minimum and maximum. An * identifi es an outlier. The lower quartile is the value below which 25% of the results lie.
Figure 2: Off set (and 95% confi dence interval) for dendrochronologically dated samples (3200-3239 BC, 3299 - 3257 BC and 313-294 BC) showing the upper (green diamonds) and lower (red squares) limits of the 95% confi dence interval, and the point estimates of the laboratory off sets (black circles).
Scie
nce
Hig
hlig
hts:
14C
- C
hro
nol
ogy
9
PAGES News, Vol.14 • No 3 • December 2006
Sci
ence
Hig
hlig
hts:
14C
- C
hro
nol
ogycan define (through calculation) what the
‘true’ 14C age will be (the consensus value) and then we can estimate for each labora-tory, whether there is a constant offset (or a bias) from this consensus. The current program of inter-laboratory comparisons has afforded an opportunity for laborato-ries to assess their accuracy. In each inter-comparison, the consensus values for the unknown age samples was calculated and reported. Figure 2, , shows the offset (and 95% confidence interval) for individual laboratories based on the dendrochrono-logically dated samples included in FIRI. The sample dendro-ages were 3200-3239 BC, 3299 - 3257 BC and 313-294 BC.
ConclusionsAnalyses of results from FIRI and phase 1 of VIRI support the fact that radiocarbon laboratories are generally accurate and precise. The results from FIRI are signifi-cant in that they show broad agreement between measurements made in different laboratories on a wide range of materials, and they also demonstrate no statistically significant difference between measure-ments made by radiometric or AMS tech-niques. As a result of the inter-comparison program, an extensive suite of natural ref-erence materials (such as wood, carbonate, etc) spanning the applied 14C timescale has been created by the 14C dating community.
These can now be used by 14C labs to im-prove their dating accuracy and are thus of great benefit to the users of 14C dates.
AcknowledgementsFIRI and VIRI are supported by EC FPIV pro-gramme and English Heritage. The assistance of sample providers is gratefully acknowledged, in addition to the support of all participating labs.
ReferencesScott, E.M., 2003: The Third International Radiocarbon Intercomparison
(TIRI) and The Fourth International Radiocarbon Intercomparison (FIRI), Radiocarbon, 45(2):135-328.
Scott, E.M., Cook, G.T., Naysmith, P., Bryant, C. and O’Donnell, D., A report on phase 1 of the 5th International Radiocarbon inter-compari-son (VIRI), Radiocarbon, in prep.
IntCal and the future of radiocarbon calibrationP. J. REIMER1, E. BARD2, C. BUCK3, T. P. GUILDERSON4,5, A. HOGG6, K. HUGHEN7, B. KROMER8, R. REIMER1, J. SOUTHON9, C. S. M. TURNEY10, J. VAN DER PLICHT11,12, C. E. WEYHENMEYER13 AND C. B. RAMSEY14
1CHRONO Centre for Climate, the Environment, and Chronology, Queen’s University Belfast, UK; [email protected], UMR-6635, Aix-en-Provence, France; 3Department of Probability and Statistics, University of Sheffield, UK; 4Center for Accelerator Mass Spectrometry L-397, Lawrence Livermore National Laboratory, USA; 5Ocean Sciences Department, University of California, Santa Cruz, USA; 6Radiocarbon Dating Laboratory, University of Waikato, Hamilton, New Zealand; 7Department of Marine Chemistry & Geochemistry, Woods Hole Oceanographic Institution, USA; 8Heidelberger Akademie der Wissenschaften, Heidelberg, Germany; 9Department of Earth System Science, University of California, Irvine, USA; 10GeoQuEST Research Centre, School of Earth and Environmental Sciences, University of Wollongong, Australia; 11Centrum voor Isotopen Onderzoek, Rijksuniversiteit Groningen, Groningen, Netherlands; 12Faculty of Archaeology, Leiden University, Netherlands; 13Department of Earth Sciences, Syracuse University, USA; 14Oxford Radiocarbon Accelera-tor Unit, UK
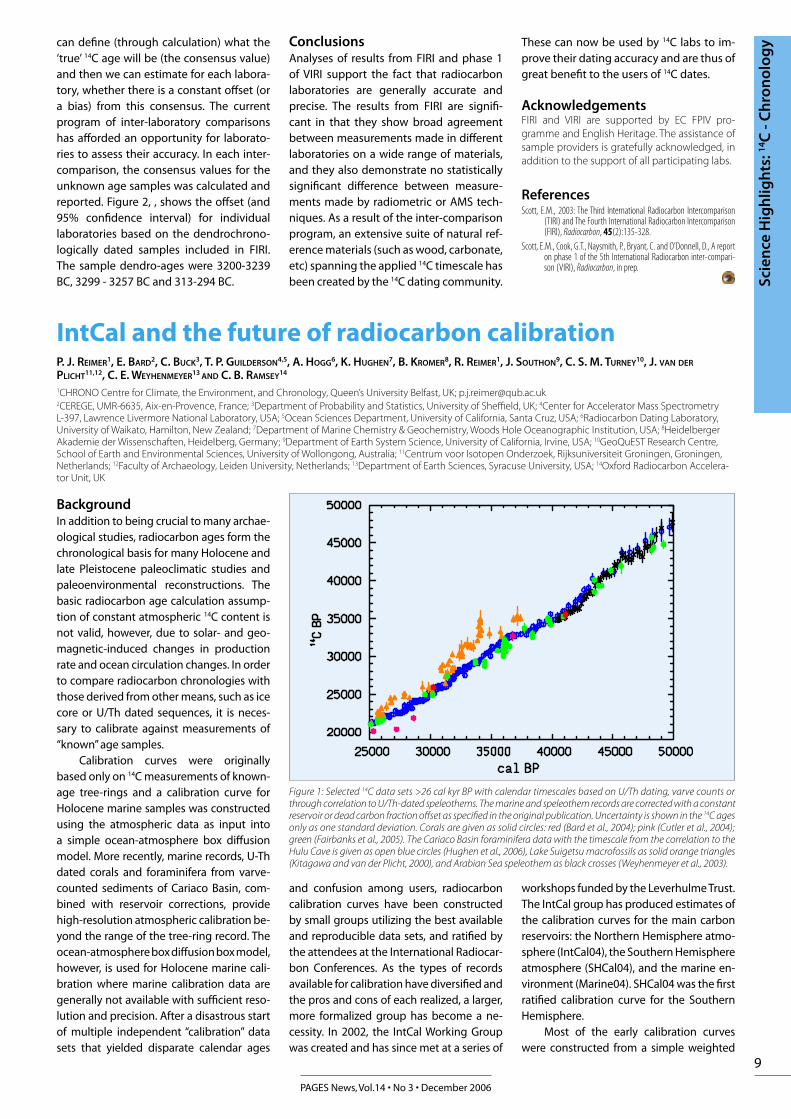
BackgroundIn addition to being crucial to many archae-ological studies, radiocarbon ages form the chronological basis for many Holocene and late Pleistocene paleoclimatic studies and paleoenvironmental reconstructions. The basic radiocarbon age calculation assump-tion of constant atmospheric 14C content is not valid, however, due to solar- and geo-magnetic-induced changes in production rate and ocean circulation changes. In order to compare radiocarbon chronologies with those derived from other means, such as ice core or U/Th dated sequences, it is neces-sary to calibrate against measurements of “known” age samples.
Calibration curves were originally based only on 14C measurements of known-age tree-rings and a calibration curve for Holocene marine samples was constructed using the atmospheric data as input into a simple ocean-atmosphere box diffusion model. More recently, marine records, U-Th dated corals and foraminifera from varve-counted sediments of Cariaco Basin, com-bined with reservoir corrections, provide high-resolution atmospheric calibration be-yond the range of the tree-ring record. The ocean-atmosphere box diffusion box model, however, is used for Holocene marine cali-bration where marine calibration data are generally not available with sufficient reso-lution and precision. After a disastrous start of multiple independent “calibration” data sets that yielded disparate calendar ages
and confusion among users, radiocarbon calibration curves have been constructed by small groups utilizing the best available and reproducible data sets, and ratified by the attendees at the International Radiocar-bon Conferences. As the types of records available for calibration have diversified and the pros and cons of each realized, a larger, more formalized group has become a ne-cessity. In 2002, the IntCal Working Group was created and has since met at a series of
workshops funded by the Leverhulme Trust. The IntCal group has produced estimates of the calibration curves for the main carbon reservoirs: the Northern Hemisphere atmo-sphere (IntCal04), the Southern Hemisphere atmosphere (SHCal04), and the marine en-vironment (Marine04). SHCal04 was the first ratified calibration curve for the Southern Hemisphere.
Most of the early calibration curves were constructed from a simple weighted
Figure 1: Selected 14C data sets >26 cal kyr BP with calendar timescales based on U/Th dating, varve counts or through correlation to U/Th-dated speleothems. The marine and speleothem records are corrected with a constant reservoir or dead carbon fraction offset as specified in the original publication. Uncertainty is shown in the 14C ages only as one standard deviation. Corals are given as solid circles: red (Bard et al., 2004); pink (Cutler et al., 2004); green (Fairbanks et al., 2005). The Cariaco Basin foraminifera data with the timescale from the correlation to the Hulu Cave is given as open blue circles (Hughen et al., 2006), Lake Suigetsu macrofossils as solid orange triangles (Kitagawa and van der Plicht, 2000), and Arabian Sea speleothem as black crosses (Weyhenmeyer et al., 2003).
10
PAGES News, Vol.14 • No 3 • December 2006
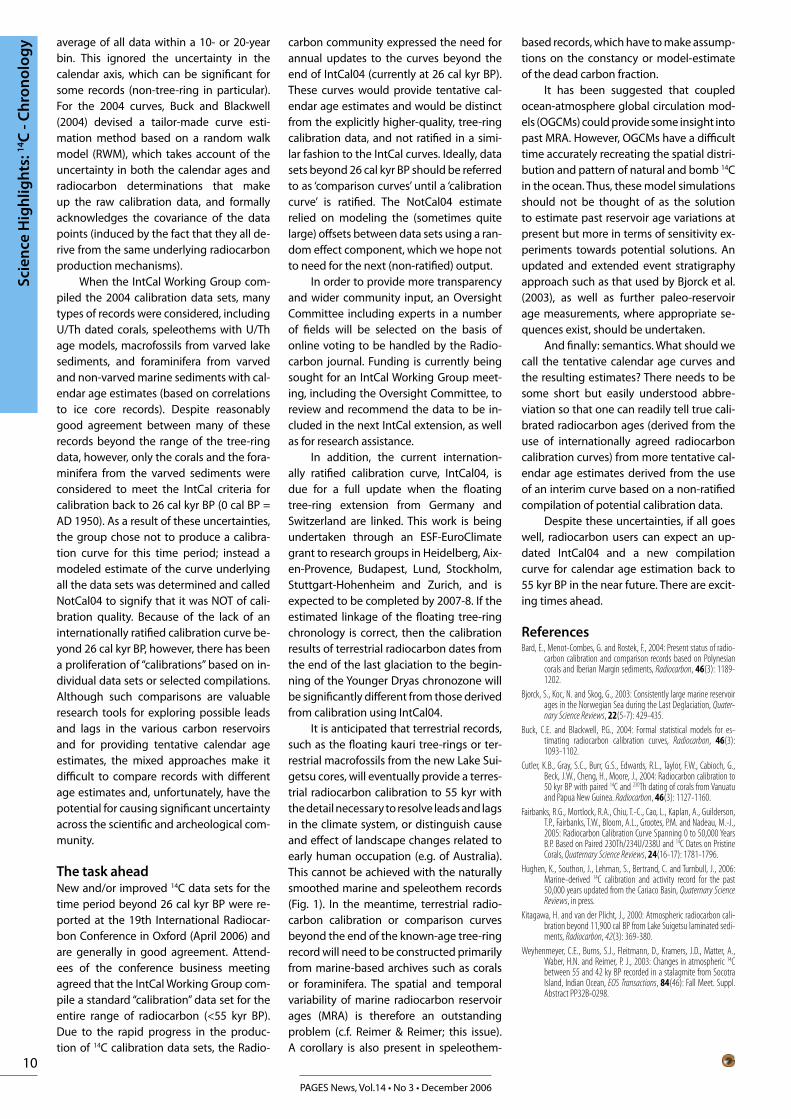
average of all data within a 10- or 20-year bin. This ignored the uncertainty in the calendar axis, which can be significant for some records (non-tree-ring in particular). For the 2004 curves, Buck and Blackwell (2004) devised a tailor-made curve esti-mation method based on a random walk model (RWM), which takes account of the uncertainty in both the calendar ages and radiocarbon determinations that make up the raw calibration data, and formally acknowledges the covariance of the data points (induced by the fact that they all de-rive from the same underlying radiocarbon production mechanisms).
When the IntCal Working Group com-piled the 2004 calibration data sets, many types of records were considered, including U/Th dated corals, speleothems with U/Th age models, macrofossils from varved lake sediments, and foraminifera from varved and non-varved marine sediments with cal-endar age estimates (based on correlations to ice core records). Despite reasonably good agreement between many of these records beyond the range of the tree-ring data, however, only the corals and the fora-minifera from the varved sediments were considered to meet the IntCal criteria for calibration back to 26 cal kyr BP (0 cal BP = AD 1950). As a result of these uncertainties, the group chose not to produce a calibra-tion curve for this time period; instead a modeled estimate of the curve underlying all the data sets was determined and called NotCal04 to signify that it was NOT of cali-bration quality. Because of the lack of an internationally ratified calibration curve be-yond 26 cal kyr BP, however, there has been a proliferation of “calibrations” based on in-dividual data sets or selected compilations. Although such comparisons are valuable research tools for exploring possible leads and lags in the various carbon reservoirs and for providing tentative calendar age estimates, the mixed approaches make it difficult to compare records with different age estimates and, unfortunately, have the potential for causing significant uncertainty across the scientific and archeological com-munity.
The task aheadNew and/or improved 14C data sets for the time period beyond 26 cal kyr BP were re-ported at the 19th International Radiocar-bon Conference in Oxford (April 2006) and are generally in good agreement. Attend-ees of the conference business meeting agreed that the IntCal Working Group com-pile a standard “calibration” data set for the entire range of radiocarbon (<55 kyr BP). Due to the rapid progress in the produc-tion of 14C calibration data sets, the Radio-
carbon community expressed the need for annual updates to the curves beyond the end of IntCal04 (currently at 26 cal kyr BP). These curves would provide tentative cal-endar age estimates and would be distinct from the explicitly higher-quality, tree-ring calibration data, and not ratified in a simi-lar fashion to the IntCal curves. Ideally, data sets beyond 26 cal kyr BP should be referred to as ‘comparison curves’ until a ‘calibration curve’ is ratified. The NotCal04 estimate relied on modeling the (sometimes quite large) offsets between data sets using a ran-dom effect component, which we hope not to need for the next (non-ratified) output.
In order to provide more transparency and wider community input, an Oversight Committee including experts in a number of fields will be selected on the basis of online voting to be handled by the Radio-carbon journal. Funding is currently being sought for an IntCal Working Group meet-ing, including the Oversight Committee, to review and recommend the data to be in-cluded in the next IntCal extension, as well as for research assistance.
In addition, the current internation-ally ratified calibration curve, IntCal04, is due for a full update when the floating tree-ring extension from Germany and Switzerland are linked. This work is being undertaken through an ESF-EuroClimate grant to research groups in Heidelberg, Aix-en-Provence, Budapest, Lund, Stockholm, Stuttgart-Hohenheim and Zurich, and is expected to be completed by 2007-8. If the estimated linkage of the floating tree-ring chronology is correct, then the calibration results of terrestrial radiocarbon dates from the end of the last glaciation to the begin-ning of the Younger Dryas chronozone will be significantly different from those derived from calibration using IntCal04.
It is anticipated that terrestrial records, such as the floating kauri tree-rings or ter-restrial macrofossils from the new Lake Sui-getsu cores, will eventually provide a terres-trial radiocarbon calibration to 55 kyr with the detail necessary to resolve leads and lags in the climate system, or distinguish cause and effect of landscape changes related to early human occupation (e.g. of Australia). This cannot be achieved with the naturally smoothed marine and speleothem records (Fig. 1). In the meantime, terrestrial radio-carbon calibration or comparison curves beyond the end of the known-age tree-ring record will need to be constructed primarily from marine-based archives such as corals or foraminifera. The spatial and temporal variability of marine radiocarbon reservoir ages (MRA) is therefore an outstanding problem (c.f. Reimer & Reimer; this issue). A corollary is also present in speleothem-
based records, which have to make assump-tions on the constancy or model-estimate of the dead carbon fraction.
It has been suggested that coupled ocean-atmosphere global circulation mod-els (OGCMs) could provide some insight into past MRA. However, OGCMs have a difficult time accurately recreating the spatial distri-bution and pattern of natural and bomb 14C in the ocean. Thus, these model simulations should not be thought of as the solution to estimate past reservoir age variations at present but more in terms of sensitivity ex-periments towards potential solutions. An updated and extended event stratigraphy approach such as that used by Bjorck et al. (2003), as well as further paleo-reservoir age measurements, where appropriate se-quences exist, should be undertaken.
And finally: semantics. What should we call the tentative calendar age curves and the resulting estimates? There needs to be some short but easily understood abbre-viation so that one can readily tell true cali-brated radiocarbon ages (derived from the use of internationally agreed radiocarbon calibration curves) from more tentative cal-endar age estimates derived from the use of an interim curve based on a non-ratified compilation of potential calibration data.
Despite these uncertainties, if all goes well, radiocarbon users can expect an up-dated IntCal04 and a new compilation curve for calendar age estimation back to 55 kyr BP in the near future. There are excit-ing times ahead.
ReferencesBard, E., Menot-Combes, G. and Rostek, F., 2004: Present status of radio-
carbon calibration and comparison records based on Polynesian corals and Iberian Margin sediments, Radiocarbon, 46(3): 1189-1202.
Bjorck, S., Koc, N. and Skog, G., 2003: Consistently large marine reservoir ages in the Norwegian Sea during the Last Deglaciation, Quater-nary Science Reviews, 22(5-7): 429-435.
Buck, C.E. and Blackwell, P.G., 2004: Formal statistical models for es-timating radiocarbon calibration curves, Radiocarbon, 46(3): 1093-1102.
Cutler, K.B., Gray, S.C., Burr, G.S., Edwards, R.L., Taylor, F.W., Cabioch, G., Beck, J.W., Cheng, H., Moore, J., 2004: Radiocarbon calibration to 50 kyr BP with paired 14C and 230Th dating of corals from Vanuatu and Papua New Guinea. Radiocarbon, 46(3): 1127-1160.
Fairbanks, R.G., Mortlock, R.A., Chiu, T.-C., Cao, L., Kaplan, A., Guilderson, T.P., Fairbanks, T.W., Bloom, A.L., Grootes, P.M. and Nadeau, M.-J., 2005: Radiocarbon Calibration Curve Spanning 0 to 50,000 Years B.P. Based on Paired 230Th/234U/238U and 14C Dates on Pristine Corals, Quaternary Science Reviews, 24(16-17): 1781-1796.
Hughen, K., Southon, J., Lehman, S., Bertrand, C. and Turnbull, J., 2006: Marine-derived 14C calibration and activity record for the past 50,000 years updated from the Cariaco Basin, Quaternary Science Reviews, in press.
Kitagawa, H. and van der Plicht, J., 2000: Atmospheric radiocarbon cali-bration beyond 11,900 cal BP from Lake Suigetsu laminated sedi-ments, Radiocarbon, 42(3): 369-380.
Weyhenmeyer, C.E., Burns, S.J., Fleitmann, D., Kramers, J.D., Matter, A., Waber, H.N. and Reimer, P. J., 2003: Changes in atmospheric 14C between 55 and 42 ky BP recorded in a stalagmite from Socotra Island, Indian Ocean, EOS Transactions, 84(46): Fall Meet. Suppl. Abstract PP32B-0298.
Scie
nce
Hig
hlig
hts:
14C
- C
hro
nol
ogy
11
PAGES News, Vol.14 • No 3 • December 2006
Scie
nce
Hig
hlig
hts:
14C
- C
hro
nol
ogyThe potential for extending Intcal04 using OIS-3
New Zealand sub-fossil KauriA. G. HOGG1, C. S.M. TURNEY2, J. G. PALMER3, L. L. K. FIFIELD4 AND M. G. L. BAILLIE5
1Radiocarbon Dating Laboratory, University of Waikato, Hamilton, New Zealand; [email protected] Research Centre, School of Earth and Environmental Sciences, University of Wollongong, Australia3Gondwana Tree-Ring Laboratory, Canterbury, New Zealand4Department of Nuclear Physics, Research School of Physical Sciences and Engineering, Australian National University, Canberra, Australia5Department of Archaeology and Palaeoecology, School of Geography, Archaeology and Palaeoecology, Queen’s University, Belfast, UK
IntroductionRecent articles by Turney et al. (2006) and Balter (2006) publicized the current state of radiocarbon calibration beyond 20 kyr BP. They stress the need for new calibration studies, which are critical for developing late Pleistocene chronologies for paleo-climate and archeological research. Peat bogs in Northland, New Zealand contain large numbers of sub-fossil kauri (Agathis australis) logs in discontinuous sequences ranging in age from a few hundred years to more than 60 kyr BP. The buried trees are well preserved, often with their bark still at-tached and one has been found to contain more than 2000 rings. This article summa-rizes some current research being under-taken on the Northland sub-fossil Oxygen Isotope Stage (OIS)-3 (25 – 60 kyr BP) kauri resource by a team from New Zealand, Aus-tralia and the UK.
SamplingOIS-3 “ancient kauri” logs are found in bogs scattered over a 300 km stretch of northern New Zealand, from about 34°50’ to 36°20’S (Palmer et al., 2006). Kauri is a highly valued timber species but past over-exploitation of living stands now means supplies are limited. The remarkable preservation state of the buried kauri and its inherent value has meant the wood is being harvested for commercial purposes. Our practice has been to take advantage of this and work alongside milling companies who use large earth moving machinery to mine the buried logs.
As the logs are extracted, we cut cross-sections from the base of the bole but above the root plate to avoid tree-ring distortion because of buttressing and fl ar-ing. Tree-ring samples are prepared and analyzed following well-documented den-drochronological techniques for ring-width measurement and cross-dating.
Dendrochronological analysisThus far, we have collected 167 cross-sec-tions from 16 diff erent pre-Holocene bog sites and 145 have been measured (Palmer et al., 2006). Several discontinuous fl oating chronologies have now been developed which in total span more than 10,000 years. The preliminary cross-dating has shown
that it is possible to cross-match between diff erent trees from diff erent locations (i.e. inter-site cross-matching). Furthermore, the spread in the radiocarbon ages obtained from within and between sites indicates that preservation did not take place during only one specifi c period of time. A possibil-ity therefore exists for the development of long continuous sections of chronology within OIS–3.
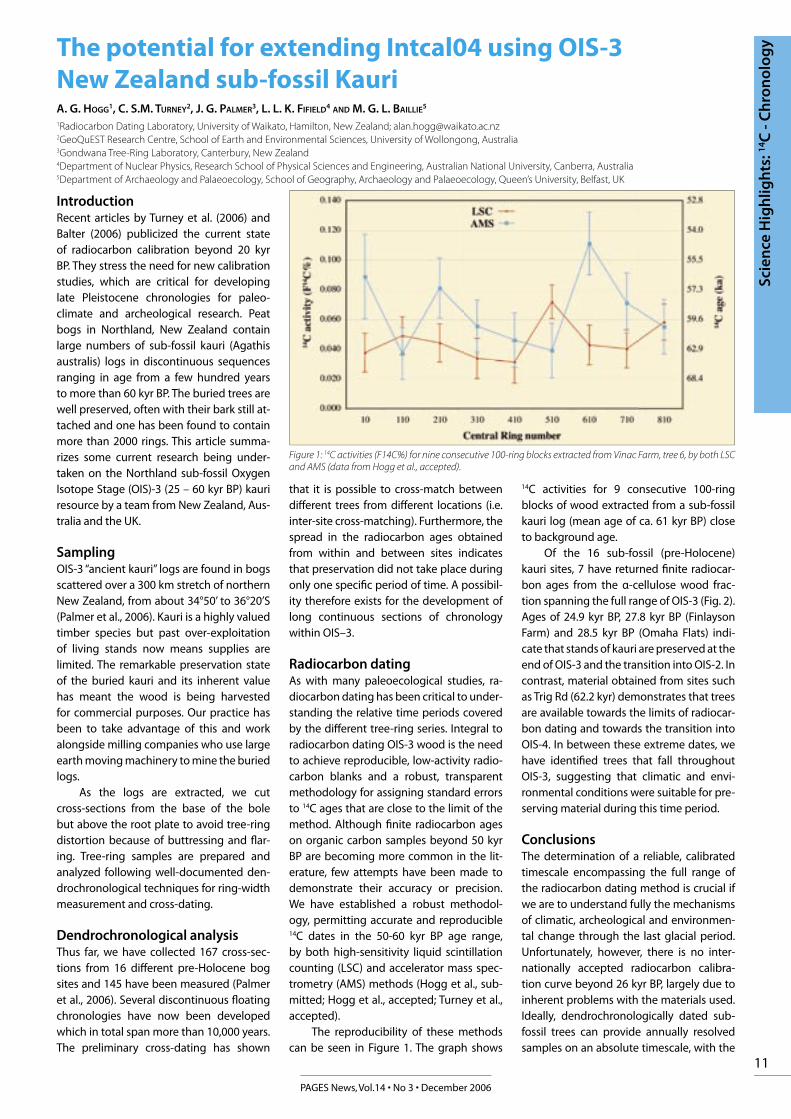
Radiocarbon datingAs with many paleoecological studies, ra-diocarbon dating has been critical to under-standing the relative time periods covered by the diff erent tree-ring series. Integral to radiocarbon dating OIS-3 wood is the need to achieve reproducible, low-activity radio-carbon blanks and a robust, transparent methodology for assigning standard errors to 14C ages that are close to the limit of the method. Although fi nite radiocarbon ages on organic carbon samples beyond 50 kyr BP are becoming more common in the lit-erature, few attempts have been made to demonstrate their accuracy or precision. We have established a robust methodol-ogy, permitting accurate and reproducible 14C dates in the 50-60 kyr BP age range, by both high-sensitivity liquid scintillation counting (LSC) and accelerator mass spec-trometry (AMS) methods (Hogg et al., sub-mitted; Hogg et al., accepted; Turney et al., accepted).
The reproducibility of these methods can be seen in Figure 1. The graph shows
14C activities for 9 consecutive 100-ring blocks of wood extracted from a sub-fossil kauri log (mean age of ca. 61 kyr BP) close to background age.
Of the 16 sub-fossil (pre-Holocene) kauri sites, 7 have returned fi nite radiocar-bon ages from the α-cellulose wood frac-tion spanning the full range of OIS-3 (Fig. 2). Ages of 24.9 kyr BP, 27.8 kyr BP (Finlayson Farm) and 28.5 kyr BP (Omaha Flats) indi-cate that stands of kauri are preserved at the end of OIS-3 and the transition into OIS-2. In contrast, material obtained from sites such as Trig Rd (62.2 kyr) demonstrates that trees are available towards the limits of radiocar-bon dating and towards the transition into OIS-4. In between these extreme dates, we have identifi ed trees that fall throughout OIS-3, suggesting that climatic and envi-ronmental conditions were suitable for pre-serving material during this time period.
ConclusionsThe determination of a reliable, calibrated timescale encompassing the full range of the radiocarbon dating method is crucial if we are to understand fully the mechanisms of climatic, archeological and environmen-tal change through the last glacial period. Unfortunately, however, there is no inter-nationally accepted radiocarbon calibra-tion curve beyond 26 kyr BP, largely due to inherent problems with the materials used. Ideally, dendrochronologically dated sub-fossil trees can provide annually resolved samples on an absolute timescale, with the
Figure 1: 14C activities (F14C%) for nine consecutive 100-ring blocks extracted from Vinac Farm, tree 6, by both LSC and AMS (data from Hogg et al., accepted).
12
PAGES News, Vol.14 • No 3 • December 2006
additional assurance that their carbon con-tent is truly representative of atmospheric CO
2 at the time of growth. The principal
sources of uncertainty that have plagued other attempts at calibration in this time range are thereby avoided. We have shown the considerable potential of New Zealand kauri (Agathis australis) for developing long fl oating sections of calibration curve in the time period 26-60 kyr BP and the LSC and AMS techniques that are required to ob-tain precise and reproducible ages at these older time periods. It must be remembered
Figure 2: Chronologies and distribution of fi nite α-cellulose 14C ages obtained on sub-fossil Agathis australis (Northland, New Zealand) – modifi ed from Turney et al., accepted).
that IntCal04 teams took approx. 30 years to build 26,000 years of chronology. Although signifi cant progress has been made with the kauri, a considerable investment in both time and resources will be necessary if this enormous task is to be completed.
ReferencesBalter, M., 2006: Radiocarbon dating’s fi nal frontier, Science, 313: 1560-
1563.Hogg, A.G., Fifi eld, L.K., Palmer, J.G., Turney, C.S.M., Galbraith, R. and
Robertson, S.A., Robust radiocarbon dating of wood samples by high sensitivity liquid scintillation spectroscopy in the 50 – 70 ka age range. Radiocarbon, submitted.
Hogg, A.G., Fifi eld, L.K., Palmer, J.G., Turney, C.S.M., Galbraith, R. and Robertson, S.B., Dating ancient wood by high sensitivity liq-uid scintillation counting and accelerator mass spectrometry – pushing the boundaries. Quaternary Geochronology, accepted.
Palmer, J., Lorrey, A., Turney, C.S.M., Hogg, A.G., Fifi eld, L.K., Baillie, M.G.L. and Ogden, J., 2006: Extension of New Zealand kauri (Ag-athis australis) tree-ring chronologies into Oxygen Isotope Stage (OIS)-3, Journal of Quaternary Science, 21(7): 779-788.
Turney, C.S.M., Fifi eld, L.K., Palmer, J.G., Hogg, A.G., Baillie, M.G.L., Gal-braith, R., Ogden, J., Lorrey, A. and Tims, S.G., Towards a radio-carbon calibration for oxygen isotope stage 3 using New Zealand kauri (Agathis australis). Radiocarbon, accepted.
Turney, C.S.M., Roberts, R.G. and Jacobs, Z., 2006: Progress and pitfalls in radiocarbon dating, Nature, 443: doi: 10.1038/nature05214.
Marine reservoir corrections and the calibration curveR. W. REIMER AND P. J. REIMER
14CHRONO Centre for Climate, the Environment, and Chronology, Queen’s University Belfast, UK; [email protected]
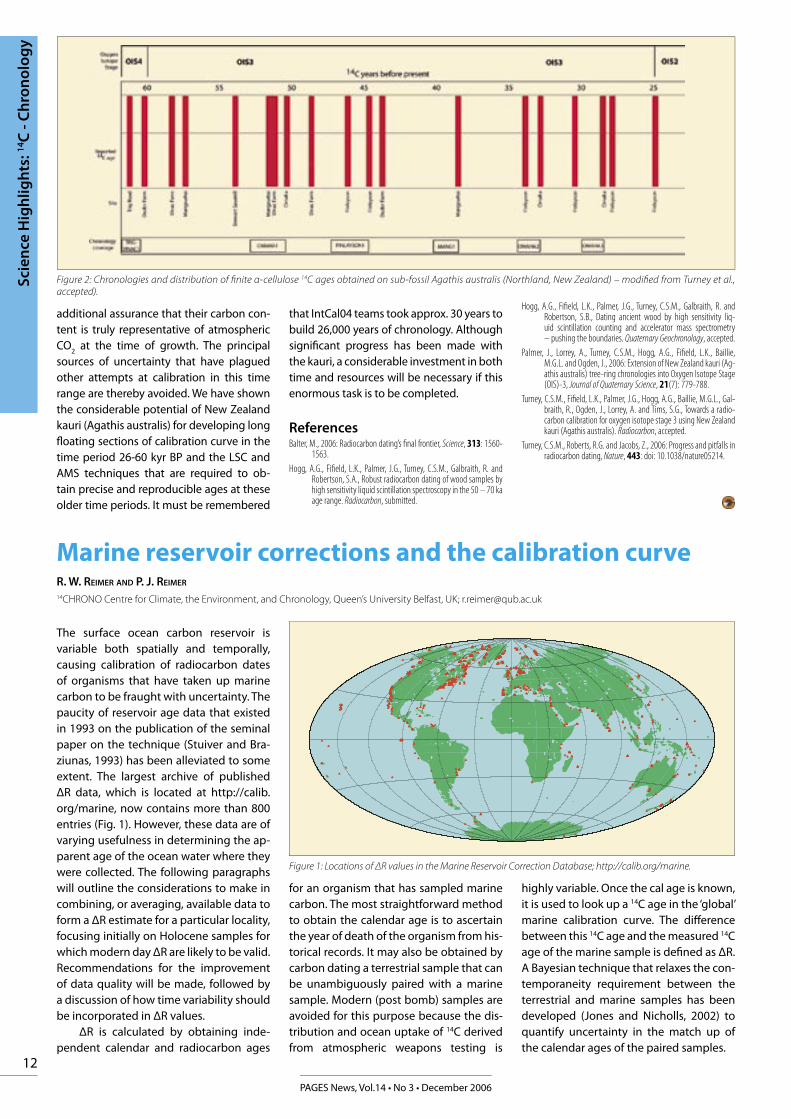
The surface ocean carbon reservoir is variable both spatially and temporally, causing calibration of radiocarbon dates of organisms that have taken up marine carbon to be fraught with uncertainty. The paucity of reservoir age data that existed in 1993 on the publication of the seminal paper on the technique (Stuiver and Bra-ziunas, 1993) has been alleviated to some extent. The largest archive of published ΔR data, which is located at http://calib.org/marine, now contains more than 800 entries (Fig. 1). However, these data are of varying usefulness in determining the ap-parent age of the ocean water where they were collected. The following paragraphs will outline the considerations to make in combining, or averaging, available data to form a ΔR estimate for a particular locality, focusing initially on Holocene samples for which modern day ΔR are likely to be valid. Recommendations for the improvement of data quality will be made, followed by a discussion of how time variability should be incorporated in ΔR values.
ΔR is calculated by obtaining inde-pendent calendar and radiocarbon ages
for an organism that has sampled marine carbon. The most straightforward method to obtain the calendar age is to ascertain the year of death of the organism from his-torical records. It may also be obtained by carbon dating a terrestrial sample that can be unambiguously paired with a marine sample. Modern (post bomb) samples are avoided for this purpose because the dis-tribution and ocean uptake of 14C derived from atmospheric weapons testing is
highly variable. Once the cal age is known, it is used to look up a 14C age in the ‘global’ marine calibration curve. The diff erence between this 14C age and the measured 14C age of the marine sample is defi ned as ΔR. A Bayesian technique that relaxes the con-temporaneity requirement between the terrestrial and marine samples has been developed (Jones and Nicholls, 2002) to quantify uncertainty in the match up of the calendar ages of the paired samples.
Figure 1: Locations of ΔR values in the Marine Reservoir Correction Database; http://calib.org/marine.
Scie
nce
Hig
hlig
hts:
14C
- C
hro
nol
ogy
13
PAGES News, Vol.14 • No 3 • December 2006
Scie
nce
Hig
hlig
hts:
14C
- C
hro
nol
ogy
Before published ΔR data is accepted for consideration, an assessment must be made of whether the organism that was used to determine ΔR took up dead car-bon in its lifetime, as for example, gastro-pods may do. A known value of ΔR may be unusable for general marine calibration purposes if the dated material was infl u-enced by carbonates or other sources of old carbon taken up during the organism’s feeding process. Diffi culty may also arise if the ΔR is derived from a scavenger that has made a diet of animals that take up old carbon. In this case, a determination must be made of whether the old carbon is taken into its soft body tissue or only into the shell. The ΔR database at the calib.org website was recently expanded to contain dietary preferences of the dated mate-rial but much work remains to be done in populating these fi elds with data. The par-ticipation of a biologist would greatly help in identifying database records that are suspect due to old carbon infl uence. The problem acquires an additional dimen-sion when realizing that bottom-scrap-ing feeders may be suitable indicators of ocean age if there are no carbonates in their habitat, or if the sample needing cali-bration is of the same species in the same environment.
Generally, ΔR is not available at the precise location of the sample in question, so an estimate must be made of which nearby ΔR values are most likely suitable for inclusion. This requires knowledge of local ocean currents. Ideally, only ΔR val-ues that are from the precise location or ‘upstream’ of the site in question should be used. Recently, a compilation of known regional ocean-current information was begun at http://calib.org/marine. Presum-
ably, far more information is available and it is only a question of transfer of knowl-edge from the oceanography to the radio-carbon community.When all these considerations have been made, the selected ΔR values need to be combined into a weighted average. This produces an estimate of the uncertainty of ΔR, which must seem amazingly low to anyone who has undertaken an assess-ment of all the contributing uncertain-ties! The problem is that there is no way to quantify uncertainties in diet, habitat, and ocean currents, particularly using pre-bomb samples collected for entirely diff erent purposes. However, by selecting the appropriate species, where possible, and using the standard deviation rather than the uncertainty on the mean, at least some of the variability is accounted for.
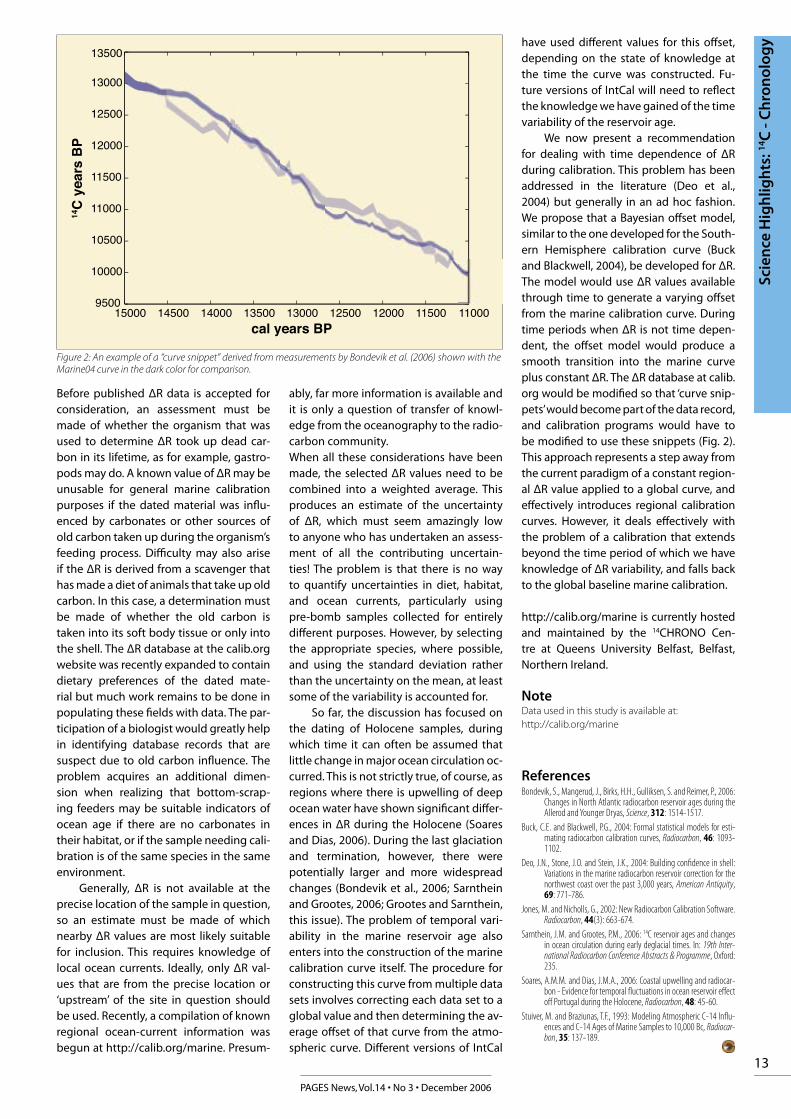
So far, the discussion has focused on the dating of Holocene samples, during which time it can often be assumed that little change in major ocean circulation oc-curred. This is not strictly true, of course, as regions where there is upwelling of deep ocean water have shown signifi cant diff er-ences in ΔR during the Holocene (Soares and Dias, 2006). During the last glaciation and termination, however, there were potentially larger and more widespread changes (Bondevik et al., 2006; Sarnthein and Grootes, 2006; Grootes and Sarnthein, this issue). The problem of temporal vari-ability in the marine reservoir age also enters into the construction of the marine calibration curve itself. The procedure for constructing this curve from multiple data sets involves correcting each data set to a global value and then determining the av-erage off set of that curve from the atmo-spheric curve. Diff erent versions of IntCal
have used diff erent values for this off set, depending on the state of knowledge at the time the curve was constructed. Fu-ture versions of IntCal will need to refl ect the knowledge we have gained of the time variability of the reservoir age.
We now present a recommendation for dealing with time dependence of ΔR during calibration. This problem has been addressed in the literature (Deo et al., 2004) but generally in an ad hoc fashion. We propose that a Bayesian off set model, similar to the one developed for the South-ern Hemisphere calibration curve (Buck and Blackwell, 2004), be developed for ΔR. The model would use ΔR values available through time to generate a varying off set from the marine calibration curve. During time periods when ΔR is not time depen-dent, the off set model would produce a smooth transition into the marine curve plus constant ΔR. The ΔR database at calib.org would be modifi ed so that ‘curve snip-pets’ would become part of the data record, and calibration programs would have to be modifi ed to use these snippets (Fig. 2). This approach represents a step away from the current paradigm of a constant region-al ΔR value applied to a global curve, and eff ectively introduces regional calibration curves. However, it deals eff ectively with the problem of a calibration that extends beyond the time period of which we have knowledge of ΔR variability, and falls back to the global baseline marine calibration.
http://calib.org/marine is currently hosted and maintained by the 14CHRONO Cen-tre at Queens University Belfast, Belfast, Northern Ireland.
NoteData used in this study is available at:http://calib.org/marine
ReferencesBondevik, S., Mangerud, J., Birks, H.H., Gulliksen, S. and Reimer, P., 2006:
Changes in North Atlantic radiocarbon reservoir ages during the Allerod and Younger Dryas, Science, 312: 1514-1517.
Buck, C.E. and Blackwell, P.G., 2004: Formal statistical models for esti-mating radiocarbon calibration curves, Radiocarbon, 46: 1093-1102.
Deo, J.N., Stone, J.O. and Stein, J.K., 2004: Building confi dence in shell: Variations in the marine radiocarbon reservoir correction for the northwest coast over the past 3,000 years, American Antiquity, 69: 771-786.
Jones, M. and Nicholls, G., 2002: New Radiocarbon Calibration Software. Radiocarbon, 44(3): 663-674.
Sarnthein, J.M. and Grootes, P.M., 2006: 14C reservoir ages and changes in ocean circulation during early deglacial times. In: 19th Inter-national Radiocarbon Conference Abstracts & Programme, Oxford: 235.
Soares, A.M.M. and Dias, J.M.A., 2006: Coastal upwelling and radiocar-bon - Evidence for temporal fl uctuations in ocean reservoir eff ect off Portugal during the Holocene, Radiocarbon, 48: 45-60.
Stuiver, M. and Braziunas, T.F., 1993: Modeling Atmospheric C-14 Infl u-ences and C-14 Ages of Marine Samples to 10,000 Bc, Radiocar-bon, 35: 137-189.
9500
10000
10500
11000
11500
12000
12500
13000
13500
11000 11500 12000 12500 13000 13500 14000 14500 15000
14C
yea
rs B
P
cal years BP
Figure 2: An example of a “curve snippet” derived from measurements by Bondevik et al. (2006) shown with the Marine04 curve in the dark color for comparison.
14
PAGES News, Vol.14 • No 3 • December 2006
New approaches to constructing age models: OxCal4C. BRONK RAMSEY
Oxford Radiocarbon Accelerator Unit, UK; [email protected]
IntroductionWhen looking at past changes in the cli-mate and their impact on the environment, timing is all-important. This is not so much because we want to know exactly when something happened but because we want to know how fast and in what order the changes occurred. For this reason, very well dated records, such as ice-cores, play a major role in our understanding of past climate. For most environmental records we need to make use of less precise dating methods, such as radiocarbon or Uranium series, sometimes in conjunction with rela-tive dating information from varves or de-position-rate models. In order to improve overall dating precision, assumptions are also sometimes made about the synchro-nous nature of climate change—assump-tions that can result in circular reasoning when we come to interpret the results.
Age models with uncertaintiesIt is an unfortunate fact that once we put together a lot of information from diff erent sources, we introduce considerable uncer-tainties in our age estimates. This is particu-larly true in the case of radiocarbon dating, where the calibration process results in complex probability distributions that are frequently multimodal. In order to get back to something that is easier to deal with, simple best-fi t age models are often ap-plied. However, while this approach may be useful for putting a record roughly onto an absolute timescale, it is not good enough if we wish to compare the timing of events between records with good accuracy and precision. To do so, we need ways of esti-mating our uncertainties in age at all points in the records and to recover as much rela-tive date information as possible.
For these reasons there has been in-creasing interest in methods for combining information from diff erent sources. For over a decade now, such approaches have been used in archeological studies where we frequently have relative date information and increasingly these methods are being used in other disciplines (Buck and Millard, 2004). This is in part due to the widespread availability of software such as OxCal (Bronk Ramsey, 1995), BCal (Buck et al., 1999) and DateLab (Jones and Nicholls, 2002) for per-forming such analyses. In recent years, such methods have also been applied to depo-sition models, particularly for peat (see for example Blaauw and Christen, 2005). At the 19th international radiocarbon conference
held in Oxford in April 2006 (http://c14.arch.ox.ac.uk/conference.html) there were several papers presented on developments in age-depth modeling, including the new age-depth models included in the OxCal program.
Deposition models in OxCal version 4OxCal is a computer program for analysis of chronological information. It is freely avail-able for online use or for download to PC or Mac from http://c14.arch.ox.ac.uk/oxcal.html. Although it is most often used for the straightforward calibration of radio-carbon dates, it can also be used to build chronological models of various kinds, us-ing a range of diff erent dating techniques. Previous versions of the program enabled the stratigraphic order of samples to be constrained within a sequence, and also catered for the special case of known age gaps when ‘wiggle-matching’ radiocarbon-dated tree-ring sequences to the calibra-tion curve.
The new version of the program ca-ters for a much wider range of deposition
models. These models were fi rst discussed at the INTIMATE workshop in Iceland in Sep-tember 2005 (Bronk Ramsey, in press). They range from the loose constraint that dates must be in a particular order (called the Sequence model) to the rigid assumption that the deposition is assumed to be uni-form in nature with a constant rate (called the U_Sequence model). Both of these models have been implemented before in several software packages. However, the true situation usually lies between these ex-tremes and a model that allows for random fl uctuations in deposition (called the P_Se-quence model) is also included and should be appropriate in a much wider range of situations. In many cases, where there are large-scale exposures or multiple cores, the degree of fl uctuation in deposition rate can be independently assessed, in other cases this needs to be assessed from the nature of the sediments, or from the dating informa-tion itself.
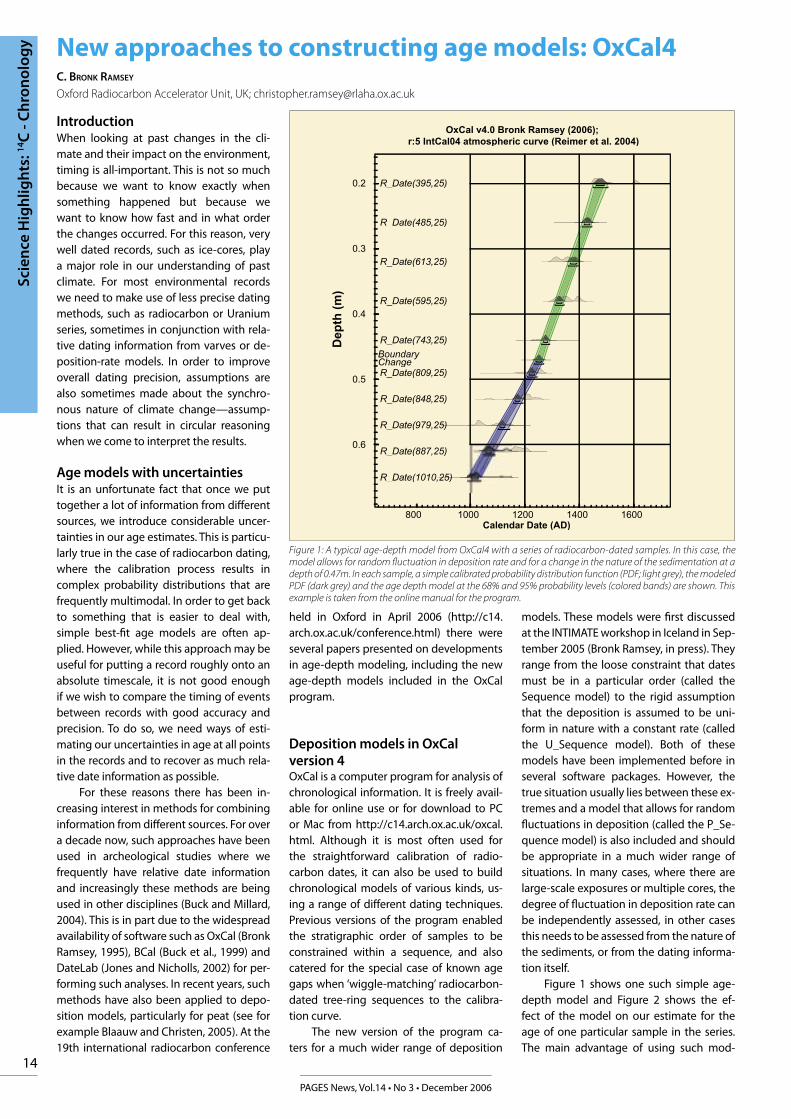
Figure 1 shows one such simple age-depth model and Figure 2 shows the ef-fect of the model on our estimate for the age of one particular sample in the series. The main advantage of using such mod-
R_Date(1010,25)
R_Date(887,25)
R_Date(979,25)
R_Date(848,25)
R_Date(809,25)
Boundary Change
R_Date(743,25)
R_Date(595,25)
R_Date(613,25)
R_Date(485,25)
R_Date(395,25)
800 1000 1200 1400 1600Calendar Date (AD)
0.2
0.3
0.4
0.5
0.6
Dep
th (
m)
OxCal v4.0 Bronk Ramsey (2006); r:5 IntCal04 atmospheric curve (Reimer et al. 2004)
Figure 1: A typical age-depth model from OxCal4 with a series of radiocarbon-dated samples. In this case, the model allows for random fl uctuation in deposition rate and for a change in the nature of the sedimentation at a depth of 0.47m. In each sample, a simple calibrated probability distribution function (PDF; light grey), the modeled PDF (dark grey) and the age depth model at the 68% and 95% probability levels (colored bands) are shown. This example is taken from the online manual for the program.
Scie
nce
Hig
hlig
hts:
14C
- C
hro
nol
ogy
15
PAGES News, Vol.14 • No 3 • December 2006
Scie
nce
Hig
hlig
hts:
14C
- C
hro
nol
ogy
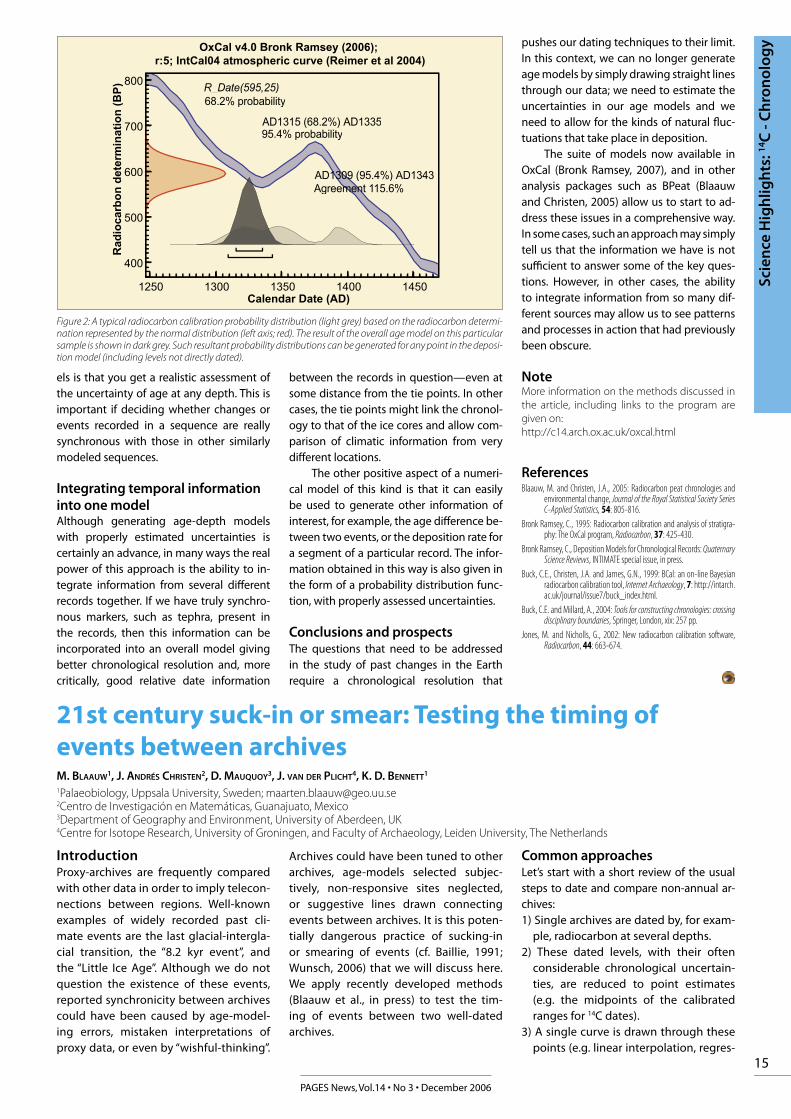
els is that you get a realistic assessment of the uncertainty of age at any depth. This is important if deciding whether changes or events recorded in a sequence are really synchronous with those in other similarly modeled sequences.
Integrating temporal information into one modelAlthough generating age-depth models with properly estimated uncertainties is certainly an advance, in many ways the real power of this approach is the ability to in-tegrate information from several diff erent records together. If we have truly synchro-nous markers, such as tephra, present in the records, then this information can be incorporated into an overall model giving better chronological resolution and, more critically, good relative date information
between the records in question—even at some distance from the tie points. In other cases, the tie points might link the chronol-ogy to that of the ice cores and allow com-parison of climatic information from very diff erent locations.
The other positive aspect of a numeri-cal model of this kind is that it can easily be used to generate other information of interest, for example, the age diff erence be-tween two events, or the deposition rate for a segment of a particular record. The infor-mation obtained in this way is also given in the form of a probability distribution func-tion, with properly assessed uncertainties.
Conclusions and prospectsThe questions that need to be addressed in the study of past changes in the Earth require a chronological resolution that
R_Date(595,25)68.2% probability
AD1315 (68.2%) AD133595.4% probability
AD1309 (95.4%) AD1343Agreement 115.6%
1250 1300 1350 1400 1450Calendar Date (AD)
400
500
600
700
800
Rad
ioca
rbo
n d
eter
min
atio
n (
BP
)
OxCal v4.0 Bronk Ramsey (2006); r:5; IntCal04 atmospheric curve (Reimer et al 2004)
Figure 2: A typical radiocarbon calibration probability distribution (light grey) based on the radiocarbon determi-nation represented by the normal distribution (left axis; red). The result of the overall age model on this particular sample is shown in dark grey. Such resultant probability distributions can be generated for any point in the deposi-tion model (including levels not directly dated).
pushes our dating techniques to their limit. In this context, we can no longer generate age models by simply drawing straight lines through our data; we need to estimate the uncertainties in our age models and we need to allow for the kinds of natural fl uc-tuations that take place in deposition.
The suite of models now available in OxCal (Bronk Ramsey, 2007), and in other analysis packages such as BPeat (Blaauw and Christen, 2005) allow us to start to ad-dress these issues in a comprehensive way. In some cases, such an approach may simply tell us that the information we have is not suffi cient to answer some of the key ques-tions. However, in other cases, the ability to integrate information from so many dif-ferent sources may allow us to see patterns and processes in action that had previously been obscure.
NoteMore information on the methods discussed in the article, including links to the program are given on:http://c14.arch.ox.ac.uk/oxcal.html
ReferencesBlaauw, M. and Christen, J.A., 2005: Radiocarbon peat chronologies and
environmental change, Journal of the Royal Statistical Society Series C-Applied Statistics, 54: 805-816.
Bronk Ramsey, C., 1995: Radiocarbon calibration and analysis of stratigra-phy: The OxCal program, Radiocarbon, 37: 425-430.
Bronk Ramsey, C., Deposition Models for Chronological Records: Quaternary Science Reviews, INTIMATE special issue, in press.
Buck, C.E., Christen, J.A. and James, G.N., 1999: BCal: an on-line Bayesian radiocarbon calibration tool, Internet Archaeology, 7: http://intarch.ac.uk/journal/issue7/buck_index.html.
Buck, C.E. and Millard, A., 2004: Tools for constructing chronologies: crossing disciplinary boundaries, Springer, London, xix: 257 pp.
Jones, M. and Nicholls, G., 2002: New radiocarbon calibration software, Radiocarbon, 44: 663-674.
21st century suck-in or smear: Testing the timing of events between archivesM. BLAAUW1, J. ANDRÉS CHRISTEN2, D. MAUQUOY3, J. VAN DER PLICHT4, K. D. BENNETT1
1Palaeobiology, Uppsala University, Sweden; [email protected] de Investigación en Matemáticas, Guanajuato, Mexico3Department of Geography and Environment, University of Aberdeen, UK4Centre for Isotope Research, University of Groningen, and Faculty of Archaeology, Leiden University, The Netherlands
IntroductionProxy-archives are frequently compared with other data in order to imply telecon-nections between regions. Well-known examples of widely recorded past cli-mate events are the last glacial-intergla-cial transition, the “8.2 kyr event”, and the “Little Ice Age”. Although we do not question the existence of these events, reported synchronicity between archives could have been caused by age-model-ing errors, mistaken interpretations of proxy data, or even by “wishful-thinking”.
Archives could have been tuned to other archives, age-models selected subjec-tively, non-responsive sites neglected, or suggestive lines drawn connecting events between archives. It is this poten-tially dangerous practice of sucking-in or smearing of events (cf. Baillie, 1991; Wunsch, 2006) that we will discuss here. We apply recently developed methods (Blaauw et al., in press) to test the tim-ing of events between two well-dated archives.
Common approachesLet’s start with a short review of the usual steps to date and compare non-annual ar-chives: 1) Single archives are dated by, for exam-
ple, radiocarbon at several depths. 2) These dated levels, with their often
considerable chronological uncertain-ties, are reduced to point estimates (e.g. the midpoints of the calibrated ranges for 14C dates).
3) A single curve is drawn through these points (e.g. linear interpolation, regres-
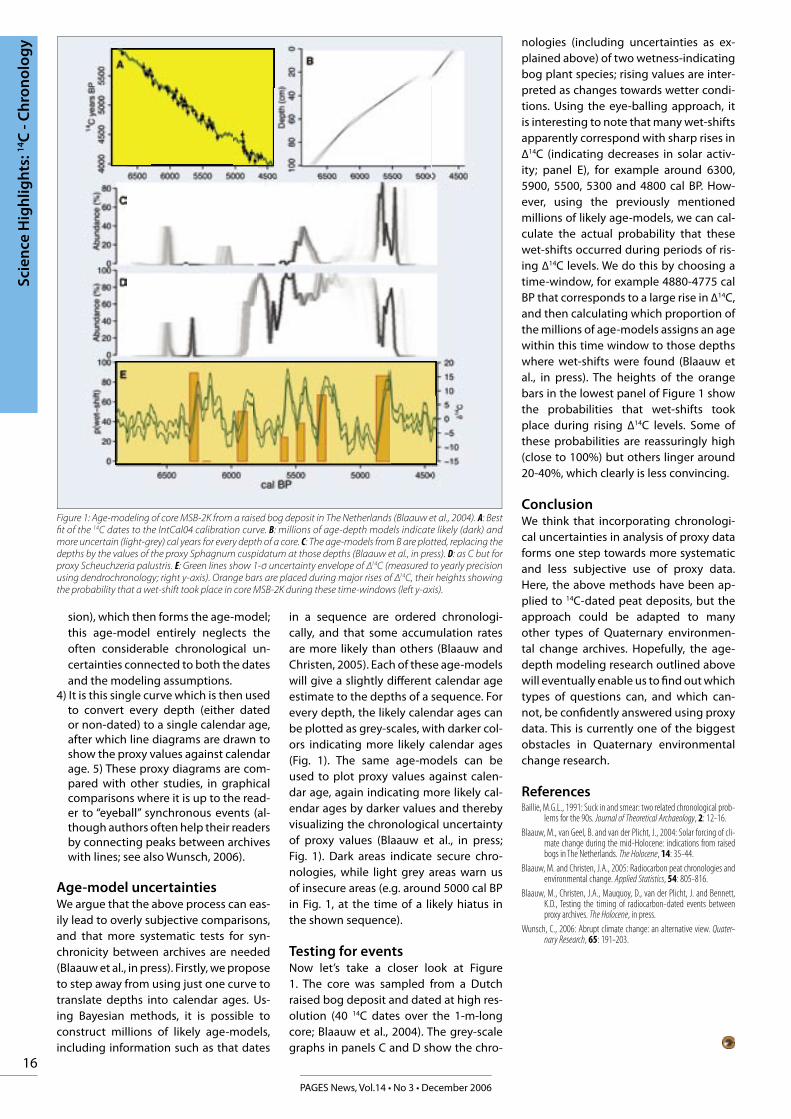
16
PAGES News, Vol.14 • No 3 • December 2006
sion), which then forms the age-model; this age-model entirely neglects the often considerable chronological un-certainties connected to both the dates and the modeling assumptions.
4) It is this single curve which is then used to convert every depth (either dated or non-dated) to a single calendar age, after which line diagrams are drawn to show the proxy values against calendar age. 5) These proxy diagrams are com-pared with other studies, in graphical comparisons where it is up to the read-er to “eyeball” synchronous events (al-though authors often help their readers by connecting peaks between archives with lines; see also Wunsch, 2006).
Age-model uncertaintiesWe argue that the above process can eas-ily lead to overly subjective comparisons, and that more systematic tests for syn-chronicity between archives are needed (Blaauw et al., in press). Firstly, we propose to step away from using just one curve to translate depths into calendar ages. Us-ing Bayesian methods, it is possible to construct millions of likely age-models, including information such as that dates
in a sequence are ordered chronologi-cally, and that some accumulation rates are more likely than others (Blaauw and Christen, 2005). Each of these age-models will give a slightly diff erent calendar age estimate to the depths of a sequence. For every depth, the likely calendar ages can be plotted as grey-scales, with darker col-ors indicating more likely calendar ages (Fig. 1). The same age-models can be used to plot proxy values against calen-dar age, again indicating more likely cal-endar ages by darker values and thereby visualizing the chronological uncertainty of proxy values (Blaauw et al., in press; Fig. 1). Dark areas indicate secure chro-nologies, while light grey areas warn us of insecure areas (e.g. around 5000 cal BP in Fig. 1, at the time of a likely hiatus in the shown sequence).
Testing for eventsNow let’s take a closer look at Figure 1. The core was sampled from a Dutch raised bog deposit and dated at high res-olution (40 14C dates over the 1-m-long core; Blaauw et al., 2004). The grey-scale graphs in panels C and D show the chro-
nologies (including uncertainties as ex-plained above) of two wetness-indicating bog plant species; rising values are inter-preted as changes towards wetter condi-tions. Using the eye-balling approach, it is interesting to note that many wet-shifts apparently correspond with sharp rises in ∆14C (indicating decreases in solar activ-ity; panel E), for example around 6300, 5900, 5500, 5300 and 4800 cal BP. How-ever, using the previously mentioned millions of likely age-models, we can cal-culate the actual probability that these wet-shifts occurred during periods of ris-ing ∆14C levels. We do this by choosing a time-window, for example 4880-4775 cal BP that corresponds to a large rise in ∆14C, and then calculating which proportion of the millions of age-models assigns an age within this time window to those depths where wet-shifts were found (Blaauw et al., in press). The heights of the orange bars in the lowest panel of Figure 1 show the probabilities that wet-shifts took place during rising ∆14C levels. Some of these probabilities are reassuringly high (close to 100%) but others linger around 20-40%, which clearly is less convincing.
ConclusionWe think that incorporating chronologi-cal uncertainties in analysis of proxy data forms one step towards more systematic and less subjective use of proxy data. Here, the above methods have been ap-plied to 14C-dated peat deposits, but the approach could be adapted to many other types of Quaternary environmen-tal change archives. Hopefully, the age-depth modeling research outlined above will eventually enable us to fi nd out which types of questions can, and which can-not, be confi dently answered using proxy data. This is currently one of the biggest obstacles in Quaternary environmental change research.
ReferencesBaillie, M.G.L., 1991: Suck in and smear: two related chronological prob-
lems for the 90s. Journal of Theoretical Archaeology, 2: 12-16.Blaauw, M., van Geel, B. and van der Plicht, J., 2004: Solar forcing of cli-
mate change during the mid-Holocene: indications from raised bogs in The Netherlands. The Holocene, 14: 35-44.
Blaauw, M. and Christen, J.A., 2005: Radiocarbon peat chronologies and environmental change. Applied Statistics, 54: 805-816.
Blaauw, M., Christen, J.A., Mauquoy, D., van der Plicht, J. and Bennett, K.D., Testing the timing of radiocarbon-dated events between proxy archives. The Holocene, in press.
Wunsch, C., 2006: Abrupt climate change: an alternative view. Quater-nary Research, 65: 191-203.
Figure 1: Age-modeling of core MSB-2K from a raised bog deposit in The Netherlands (Blaauw et al., 2004). A: Best fi t of the 14C dates to the IntCal04 calibration curve. B: millions of age-depth models indicate likely (dark) and more uncertain (light-grey) cal years for every depth of a core. C: The age-models from B are plotted, replacing the depths by the values of the proxy Sphagnum cuspidatum at those depths (Blaauw et al., in press). D: as C but for proxy Scheuchzeria palustris. E: Green lines show 1-σ uncertainty envelope of ∆14C (measured to yearly precision using dendrochronology; right y-axis). Orange bars are placed during major rises of ∆14C, their heights showing the probability that a wet-shift took place in core MSB-2K during these time-windows (left y-axis).
Scie
nce
Hig
hlig
hts:
14C
- C
hro
nol
ogy
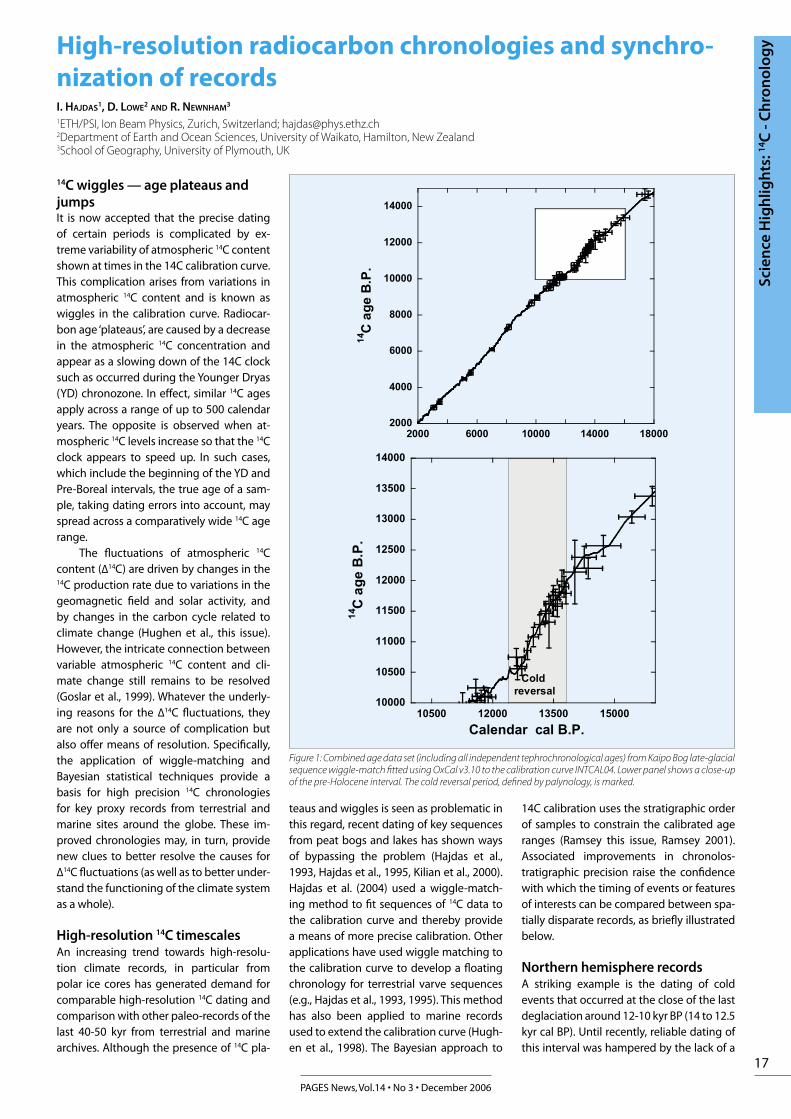
17
PAGES News, Vol.14 • No 3 • December 2006
Scie
nce
Hig
hlig
hts:
14C
- C
hro
nol
ogyHigh-resolution radiocarbon chronologies and synchro-
nization of recordsI. HAJDAS1, D. LOWE2 AND R. NEWNHAM3
1ETH/PSI, Ion Beam Physics, Zurich, Switzerland; [email protected] of Earth and Ocean Sciences, University of Waikato, Hamilton, New Zealand3School of Geography, University of Plymouth, UK
14C wiggles — age plateaus and jumpsIt is now accepted that the precise dating of certain periods is complicated by ex-treme variability of atmospheric 14C content shown at times in the 14C calibration curve. This complication arises from variations in atmospheric 14C content and is known as wiggles in the calibration curve. Radiocar-bon age ‘plateaus’, are caused by a decrease in the atmospheric 14C concentration and appear as a slowing down of the 14C clock such as occurred during the Younger Dryas (YD) chronozone. In effect, similar 14C ages apply across a range of up to 500 calendar years. The opposite is observed when at-mospheric 14C levels increase so that the 14C clock appears to speed up. In such cases, which include the beginning of the YD and Pre-Boreal intervals, the true age of a sam-ple, taking dating errors into account, may spread across a comparatively wide 14C age range.
The fluctuations of atmospheric 14C content (∆14C) are driven by changes in the 14C production rate due to variations in the geomagnetic field and solar activity, and by changes in the carbon cycle related to climate change (Hughen et al., this issue). However, the intricate connection between variable atmospheric 14C content and cli-mate change still remains to be resolved (Goslar et al., 1999). Whatever the underly-ing reasons for the ∆14C fluctuations, they are not only a source of complication but also offer means of resolution. Specifically, the application of wiggle-matching and Bayesian statistical techniques provide a basis for high precision 14C chronologies for key proxy records from terrestrial and marine sites around the globe. These im-proved chronologies may, in turn, provide new clues to better resolve the causes for ∆14C fluctuations (as well as to better under-stand the functioning of the climate system as a whole).
High-resolution 14C timescalesAn increasing trend towards high-resolu-tion climate records, in particular from polar ice cores has generated demand for comparable high-resolution 14C dating and comparison with other paleo-records of the last 40-50 kyr from terrestrial and marine archives. Although the presence of 14C pla-
teaus and wiggles is seen as problematic in this regard, recent dating of key sequences from peat bogs and lakes has shown ways of bypassing the problem (Hajdas et al., 1993, Hajdas et al., 1995, Kilian et al., 2000). Hajdas et al. (2004) used a wiggle-match-ing method to fit sequences of 14C data to the calibration curve and thereby provide a means of more precise calibration. Other applications have used wiggle matching to the calibration curve to develop a floating chronology for terrestrial varve sequences (e.g., Hajdas et al., 1993, 1995). This method has also been applied to marine records used to extend the calibration curve (Hugh-en et al., 1998). The Bayesian approach to
14C calibration uses the stratigraphic order of samples to constrain the calibrated age ranges (Ramsey this issue, Ramsey 2001). Associated improvements in chronolos-tratigraphic precision raise the confidence with which the timing of events or features of interests can be compared between spa-tially disparate records, as briefly illustrated below.
Northern hemisphere recordsA striking example is the dating of cold events that occurred at the close of the last deglaciation around 12-10 kyr BP (14 to 12.5 kyr cal BP). Until recently, reliable dating of this interval was hampered by the lack of a
10000
10500
11000
11500
12000
12500
13000
13500
14000
10500 12000 13500 15000
14 C
ageB.P.
Calendar cal B.P.
Coldreversal
2000
4000
6000
8000
10000
12000
14000
2000 6000 10000 14000 18000
14 C
ageB.P.
Figure 1: Combined age data set (including all independent tephrochronological ages) from Kaipo Bog late-glacial sequence wiggle-match fitted using OxCal v3.10 to the calibration curve INTCAL04. Lower panel shows a close-up of the pre-Holocene interval. The cold reversal period, defined by palynology, is marked.
18
PAGES News, Vol.14 • No 3 • December 2006
dendrochronological calibration curve, and by the age plateau and rapid jumps that characterize the YD (see above). Extension of the calibration curve and the new data sets of INTCAL98 and INTCAL04 (Stuiver and Reimer 1998, Reimer et al., 2004) have en-abled reconstruction of the fluctuations in atmospheric 14C content during the YD, and provided the basis for wiggle-matching 14C chronologies. The characteristic 14C changes have themselves become time markers. For example, the chronology established for the Kråkenes Lake sequence (Norway) was the first to show the coincidence between a dramatic change in 14C ages (11-10.6 kyr BP) and the onset of cooling at the beginning of the YD (Gulliksen et al., 1998). This coinci-dence has subsequently been observed in other records from European lakes, such as: Soppensee (Switzerland), Holzmaar (Ger-many), (Hajdas et al., 1993, 1995), Madtjärn (Sweden) and Gościąż (Poland) (Goslar et al., 1999). High-resolution 14C dating of a degla-cial cold event found on Kodiak Island also showed that Alaska experienced cooling which was synchronous with the YD in the North Atlantic region (Hajdas et. al. 1998).
Southern Hemisphere RecordsThe radiocarbon dating of the New Zealand Franz-Joseph Glacier re-advance at ca. 11
kyr BP (Denton and Hendy 1994) sparked debate on the global extent of YD cooling and drew attention to records from the Southern Hemisphere. A high-resolution 14C chronology for the Kaipo Bog sequence from New Zealand provides further insight into a cold reversal that preceded early Ho-locene warming (Hajdas et al., 2006). In to-tal,, 51 age points for Kaipo Bog were fitted to the INTCAL04 calibration curve (Reimer et al., 2004) via the OxCal (version 3.10) se-quence calibration (Ramsey, 2001) (Fig. 1), which uses a Bayesian approach that incor-porates known parameters into the fitting procedure. In this case, the known stratig-raphy—age superposition with depth—de-fined the fitting procedure. This procedure resulted in reduced errors for calibrated ages and gave a continuous sequence of calendar ages independent of 14C age pla-teaus or wiggles. Based on this chronol-ogy, cooling at Kaipo commenced between 13,820 and 13,590 cal yr BP (12,030 ± 90 14C yr BP) and ended ~1000 years later be-tween 12,800 and 12,390 cal yr BP (10,790 ± 70 and 10,600 ± 90 14C yr BP). This improved chronology reveals that the cold event was not synchronous with the YD, an alternative scenario possible with the original chronol-ogy (Newnham & Lowe, 2000). High-reso-lution radiocarbon chronologies from two
Patagonian sites, Huelmo (Chile) and Mas-cardi (Argentina) (Hajdas et. al. 2003) have also shown that the cold events observed in those two records preceded the YD chro-nozone by some 500 years but terminated close to the end of the YD.
In summary, these examples illustrate the potential of high-resolution radiocar-bon dating for development of reliable tim-escales of Holocene and late-glacial records around the globe. Extension further back in time and refinement of the calibration curve will facilitate application of similar ap-proaches to older time periods.
ReferencesGulliksen, S., Birks, H.H., Possnert, G. and Mangerud, J., 1998: A calendar
age estimate of the Younger Dryas-Holocene boundary at Kråkenes, western Norway, Holocene, 8: 249-259.
Goslar, T., Wohlfarth, B., Björck, S., Possnert, G. and Björck, J., 1999: Varia-tions of atmospheric C-14 concentrations over the Allerod-Younger Dryas transition, Climate Dynamics, 15: 29-42.
Hajdas, I., Lowe, D.J., Newnham, R.M. and Bonani, G., 2006: Timing of the late-glacial climate reversal in the Southern Hemisphere using high-resolution radiocarbon chronology for Kaipo bog, New Zea-land, Quaternary Research, 65: 340-345.
Newnham, R.M. and Lowe, D.J., 2000: Fine-resolution pollen record of late-glacial climate reversal from New Zealand, Geology, 28: 759-762.
Ramsey, C.B., 2001: Development of the radiocarbon calibration program, Radiocarbon, 43: 355-363.
For full references please consult: www.pages-igbp.org/products/newsletters/ref2006_3.html
Marine 14C reservoir ages oscillateP. M. GROOTES1 AND M. SARNTHEIN2
1Leibniz Laboratory and 2Institute of Geosciences, Christian Albrechts University, Kiel, Germany; [email protected]
The current 14C calibration scale, IntCal04, is tree-ring based up until 12.4 cal kyr BP but relies for the older part, up to 26 cal kyr BP, on surface-ocean data from planktic fora-minifera and corals at a number of carefully selected locations (Reimer et al., 2004). In order to do so, it is assumed that a constant global marine reservoir age of 405 ± 22 yr, obtained by box modeling the period AD 1350-1850, and a constant local deviation from this global value, ΔR, can be applied beyond the range of tree-ring calibration. The (local) marine reservoir age under equilibrium conditions is determined by the balance between restricted ocean-at-mosphere gas exchange and limited mix-ing between the mixed layer and the deep ocean. For the selected locations, reservoir ages close to 400 yr indicate that this lim-ited exchange results in a ~5% 14C deficit in the ocean mixed layer. The assumption that this reservoir age has remained constant in the past implies that (i) this mixing balance has been maintained, (ii) the general ocean circulation “pipeline” system, that is the system of thermohaline currents has not changed, and (iii) equilibrium has not been
disturbed by changes in the production rate of cosmogenic isotopes, or (iv) in the size of the atmospheric carbon reservoir.
Dramatic climate changes occurred during the early stages of the last glacial to interglacial transition 19-14.5 kyr. They were accompanied by the most fundamental re-cent changes in ocean circulation, which also likely contributed to major shifts in CO
2
transfer from ocean to atmosphere, leading to the well-known deglacial rise in atmo-spheric pCO
2 from 190 to 240 ppmv at 14.5
kyr (Monnin et al., 2001; Köhler et al., 2005). For the preceding glacial period, back to the limit of radiocarbon dating around 50 kyr, ice core records provide further evidence for frequent large and rapid changes in climate and low atmospheric CO
2 concen-
trations in the range of 190 to 230 ppmv. Marine records now have confirmed these findings and shown that these events were in many cases coeval with large changes in the meridional overturning circulation of the oceans. During this period, global sea level also dropped, with stadial-interstadial related fluctuations, to a low of more than 120 m below present sea level at the last
glacial maximum (23-19 kyr), before rising over the deglacial and early Holocene to present levels. Reconstructions of the pa-leointensity of the Earth’s magnetic field from various ocean sediments (GLOPIS 75; Laj et al., 2004) give evidence of several epi-sodes with a very weak earth magnetic field leading to increased production of cosmo-genic isotopes, especially around 41 kyr BP; the Laschamp Event (Hughen et al., 2004a; Voelker et al., 2000). Thus, it seems that most of the conditions for constant marine reservoir ages—constant basin geometry, ocean circulation, ocean–atmosphere and surface–deep ocean mixing, 14C produc-tion, and atmospheric reservoir size—have been violated. Although careful application of U/Th dating, supplemented by volcanic time markers—identified and dated in ice cores and/or terrestrial records—may sup-ply absolute ages for the marine data set, the atmospheric 14C content cannot be re-constructed as long as the local marine res-ervoir age at each particular point in time is not known.
Therefore, a secure correlation be-tween single events in the ocean and on
Scie
nce
Hig
hlig
hts:
14C
- C
hro
nol
ogy
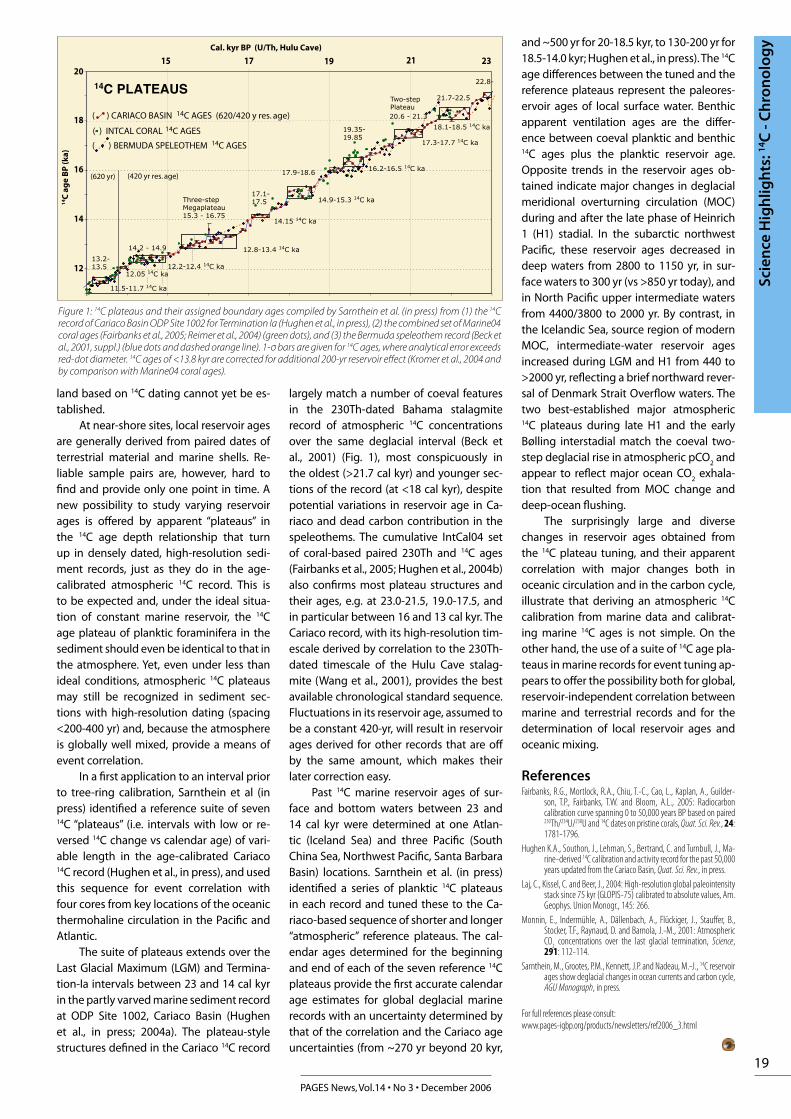
19
PAGES News, Vol.14 • No 3 • December 2006
Scie
nce
Hig
hlig
hts:
14C
- C
hro
nol
ogy
land based on 14C dating cannot yet be es-tablished.
At near-shore sites, local reservoir ages are generally derived from paired dates of terrestrial material and marine shells. Re-liable sample pairs are, however, hard to find and provide only one point in time. A new possibility to study varying reservoir ages is offered by apparent “plateaus” in the 14C age depth relationship that turn up in densely dated, high-resolution sedi-ment records, just as they do in the age-calibrated atmospheric 14C record. This is to be expected and, under the ideal situa-tion of constant marine reservoir, the 14C age plateau of planktic foraminifera in the sediment should even be identical to that in the atmosphere. Yet, even under less than ideal conditions, atmospheric 14C plateaus may still be recognized in sediment sec-tions with high-resolution dating (spacing <200-400 yr) and, because the atmosphere is globally well mixed, provide a means of event correlation.
In a first application to an interval prior to tree-ring calibration, Sarnthein et al (in press) identified a reference suite of seven 14C “plateaus” (i.e. intervals with low or re-versed 14C change vs calendar age) of vari-able length in the age-calibrated Cariaco 14C record (Hughen et al., in press), and used this sequence for event correlation with four cores from key locations of the oceanic thermohaline circulation in the Pacific and Atlantic.
The suite of plateaus extends over the Last Glacial Maximum (LGM) and Termina-tion-Ia intervals between 23 and 14 cal kyr in the partly varved marine sediment record at ODP Site 1002, Cariaco Basin (Hughen et al., in press; 2004a). The plateau-style structures defined in the Cariaco 14C record
largely match a number of coeval features in the 230Th-dated Bahama stalagmite record of atmospheric 14C concentrations over the same deglacial interval (Beck et al., 2001) (Fig. 1), most conspicuously in the oldest (>21.7 cal kyr) and younger sec-tions of the record (at <18 cal kyr), despite potential variations in reservoir age in Ca-riaco and dead carbon contribution in the speleothems. The cumulative IntCal04 set of coral-based paired 230Th and 14C ages (Fairbanks et al., 2005; Hughen et al., 2004b) also confirms most plateau structures and their ages, e.g. at 23.0-21.5, 19.0-17.5, and in particular between 16 and 13 cal kyr. The Cariaco record, with its high-resolution tim-escale derived by correlation to the 230Th-dated timescale of the Hulu Cave stalag-mite (Wang et al., 2001), provides the best available chronological standard sequence. Fluctuations in its reservoir age, assumed to be a constant 420-yr, will result in reservoir ages derived for other records that are off by the same amount, which makes their later correction easy.
Past 14C marine reservoir ages of sur-face and bottom waters between 23 and 14 cal kyr were determined at one Atlan-tic (Iceland Sea) and three Pacific (South China Sea, Northwest Pacific, Santa Barbara Basin) locations. Sarnthein et al. (in press) identified a series of planktic 14C plateaus in each record and tuned these to the Ca-riaco-based sequence of shorter and longer “atmospheric” reference plateaus. The cal-endar ages determined for the beginning and end of each of the seven reference 14C plateaus provide the first accurate calendar age estimates for global deglacial marine records with an uncertainty determined by that of the correlation and the Cariaco age uncertainties (from ~270 yr beyond 20 kyr,
and ~500 yr for 20-18.5 kyr, to 130-200 yr for 18.5-14.0 kyr; Hughen et al., in press). The 14C age differences between the tuned and the reference plateaus represent the paleores-ervoir ages of local surface water. Benthic apparent ventilation ages are the differ-ence between coeval planktic and benthic 14C ages plus the planktic reservoir age. Opposite trends in the reservoir ages ob-tained indicate major changes in deglacial meridional overturning circulation (MOC) during and after the late phase of Heinrich 1 (H1) stadial. In the subarctic northwest Pacific, these reservoir ages decreased in deep waters from 2800 to 1150 yr, in sur-face waters to 300 yr (vs >850 yr today), and in North Pacific upper intermediate waters from 4400/3800 to 2000 yr. By contrast, in the Icelandic Sea, source region of modern MOC, intermediate-water reservoir ages increased during LGM and H1 from 440 to >2000 yr, reflecting a brief northward rever-sal of Denmark Strait Overflow waters. The two best-established major atmospheric 14C plateaus during late H1 and the early Bølling interstadial match the coeval two-step deglacial rise in atmospheric pCO
2 and
appear to reflect major ocean CO2 exhala-
tion that resulted from MOC change and deep-ocean flushing.
The surprisingly large and diverse changes in reservoir ages obtained from the 14C plateau tuning, and their apparent correlation with major changes both in oceanic circulation and in the carbon cycle, illustrate that deriving an atmospheric 14C calibration from marine data and calibrat-ing marine 14C ages is not simple. On the other hand, the use of a suite of 14C age pla-teaus in marine records for event tuning ap-pears to offer the possibility both for global, reservoir-independent correlation between marine and terrestrial records and for the determination of local reservoir ages and oceanic mixing.
ReferencesFairbanks, R.G., Mortlock, R.A., Chiu, T.-C., Cao, L., Kaplan, A., Guilder-
son, T.P., Fairbanks, T.W. and Bloom, A.L., 2005: Radiocarbon calibration curve spanning 0 to 50,000 years BP based on paired 230Th/234U/238U and 14C dates on pristine corals, Quat. Sci. Rev., 24: 1781-1796.
Hughen K.A., Southon, J., Lehman, S., Bertrand, C. and Turnbull, J., Ma-rine-derived 14C calibration and activity record for the past 50,000 years updated from the Cariaco Basin, Quat. Sci. Rev., in press.
Laj, C., Kissel, C. and Beer, J., 2004: High-resolution global paleointensity stack since 75 kyr (GLOPIS-75) calibrated to absolute values, Am. Geophys. Union Monogr., 145: 266.
Monnin, E., Indermühle, A., Dällenbach, A., Flückiger, J., Stauffer, B., Stocker, T.F., Raynaud, D. and Barnola, J.-M., 2001: Atmospheric CO
2 concentrations over the last glacial termination, Science,
291: 112-114.Sarnthein, M., Grootes, P.M., Kennett, J.P. and Nadeau, M.-J., 14C reservoir
ages show deglacial changes in ocean currents and carbon cycle, AGU Monograph, in press.
For full references please consult: www.pages-igbp.org/products/newsletters/ref2006_3.html
��
��
��
��
��
11.5-11.7 14C ka
13.2-13.5
14.2 - 14.9
Three-stepMegaplateau15.3 - 16.75
17.1-17.5
17.9-18.6
19.35-19.85
21.7-22.5
22.8-
12.2-12.4 14C ka
12.8-13.4 14C ka
14.15 14C ka
14.9-15.3 14C ka
16.2-16.5 14C ka
17.3-17.7 14C ka
18.1-18.5 14C ka
����������������� �����������������
������������ ����� ��� ����
����������������������� ��� �������������������������� 20.6 - 21.3
Two-stepPlateau
12.05 14C ka
14C PLATEAUS
�������������
���
�������������������������������
�� ���� �� ��
��������� ������������������ ��������
Figure 1: 14C plateaus and their assigned boundary ages compiled by Sarnthein et al. (in press) from (1) the 14C record of Cariaco Basin ODP Site 1002 for Termination Ia (Hughen et al., in press), (2) the combined set of Marine04 coral ages (Fairbanks et al., 2005; Reimer et al., 2004) (green dots), and (3) the Bermuda speleothem record (Beck et al., 2001, suppl.) (blue dots and dashed orange line). 1-σ bars are given for 14C ages, where analytical error exceeds red-dot diameter. 14C ages of <13.8 kyr are corrected for additional 200-yr reservoir effect (Kromer et al., 2004 and by comparison with Marine04 coral ages).
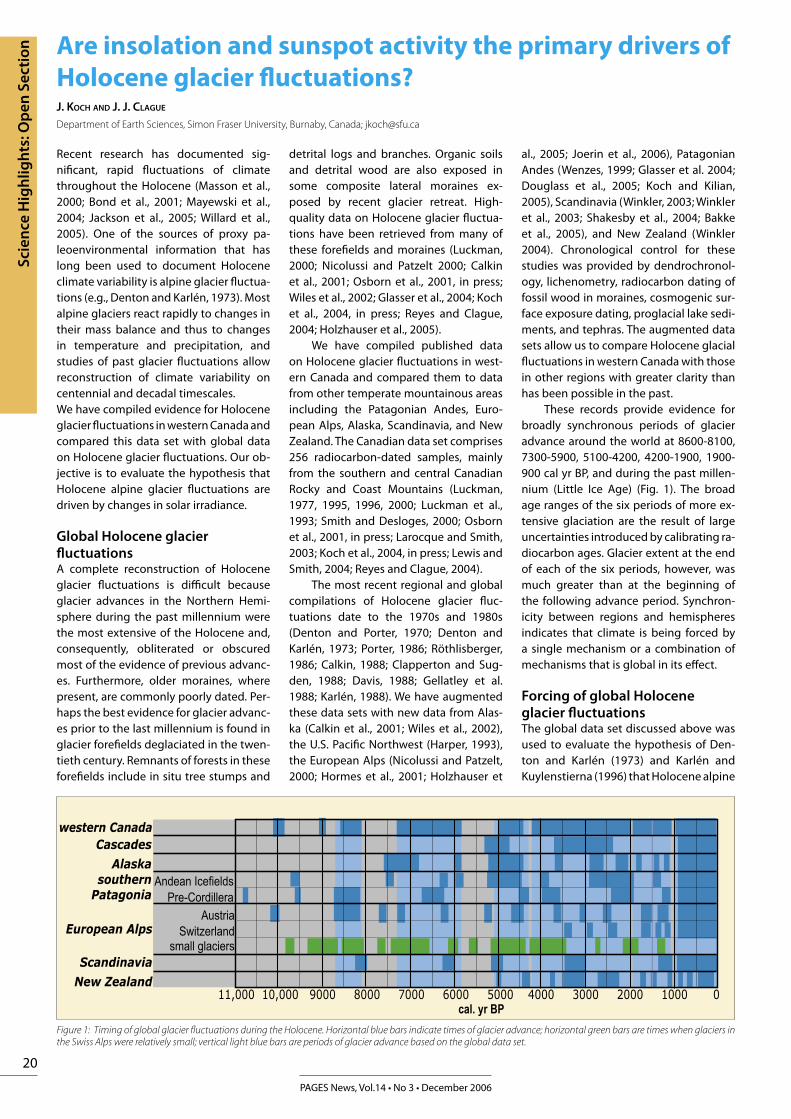
20
PAGES News, Vol.14 • No 3 • December 2006
Are insolation and sunspot activity the primary drivers of Holocene glacier fluctuations?J. KOCH AND J. J. CLAGUE
Department of Earth Sciences, Simon Fraser University, Burnaby, Canada; [email protected]
Recent research has documented sig-nificant, rapid fluctuations of climate throughout the Holocene (Masson et al., 2000; Bond et al., 2001; Mayewski et al., 2004; Jackson et al., 2005; Willard et al., 2005). One of the sources of proxy pa-leoenvironmental information that has long been used to document Holocene climate variability is alpine glacier fluctua-tions (e.g., Denton and Karlén, 1973). Most alpine glaciers react rapidly to changes in their mass balance and thus to changes in temperature and precipitation, and studies of past glacier fluctuations allow reconstruction of climate variability on centennial and decadal timescales.We have compiled evidence for Holocene glacier fluctuations in western Canada and compared this data set with global data on Holocene glacier fluctuations. Our ob-jective is to evaluate the hypothesis that Holocene alpine glacier fluctuations are driven by changes in solar irradiance.
Global Holocene glacier fluctuationsA complete reconstruction of Holocene glacier fluctuations is difficult because glacier advances in the Northern Hemi-sphere during the past millennium were the most extensive of the Holocene and, consequently, obliterated or obscured most of the evidence of previous advanc-es. Furthermore, older moraines, where present, are commonly poorly dated. Per-haps the best evidence for glacier advanc-es prior to the last millennium is found in glacier forefields deglaciated in the twen-tieth century. Remnants of forests in these forefields include in situ tree stumps and
detrital logs and branches. Organic soils and detrital wood are also exposed in some composite lateral moraines ex-posed by recent glacier retreat. High-quality data on Holocene glacier fluctua-tions have been retrieved from many of these forefields and moraines (Luckman, 2000; Nicolussi and Patzelt 2000; Calkin et al., 2001; Osborn et al., 2001, in press; Wiles et al., 2002; Glasser et al., 2004; Koch et al., 2004, in press; Reyes and Clague, 2004; Holzhauser et al., 2005).
We have compiled published data on Holocene glacier fluctuations in west-ern Canada and compared them to data from other temperate mountainous areas including the Patagonian Andes, Euro-pean Alps, Alaska, Scandinavia, and New Zealand. The Canadian data set comprises 256 radiocarbon-dated samples, mainly from the southern and central Canadian Rocky and Coast Mountains (Luckman, 1977, 1995, 1996, 2000; Luckman et al., 1993; Smith and Desloges, 2000; Osborn et al., 2001, in press; Larocque and Smith, 2003; Koch et al., 2004, in press; Lewis and Smith, 2004; Reyes and Clague, 2004).
The most recent regional and global compilations of Holocene glacier fluc-tuations date to the 1970s and 1980s (Denton and Porter, 1970; Denton and Karlén, 1973; Porter, 1986; Röthlisberger, 1986; Calkin, 1988; Clapperton and Sug-den, 1988; Davis, 1988; Gellatley et al. 1988; Karlén, 1988). We have augmented these data sets with new data from Alas-ka (Calkin et al., 2001; Wiles et al., 2002), the U.S. Pacific Northwest (Harper, 1993), the European Alps (Nicolussi and Patzelt, 2000; Hormes et al., 2001; Holzhauser et
al., 2005; Joerin et al., 2006), Patagonian Andes (Wenzes, 1999; Glasser et al. 2004; Douglass et al., 2005; Koch and Kilian, 2005), Scandinavia (Winkler, 2003; Winkler et al., 2003; Shakesby et al., 2004; Bakke et al., 2005), and New Zealand (Winkler 2004). Chronological control for these studies was provided by dendrochronol-ogy, lichenometry, radiocarbon dating of fossil wood in moraines, cosmogenic sur-face exposure dating, proglacial lake sedi-ments, and tephras. The augmented data sets allow us to compare Holocene glacial fluctuations in western Canada with those in other regions with greater clarity than has been possible in the past.
These records provide evidence for broadly synchronous periods of glacier advance around the world at 8600-8100, 7300-5900, 5100-4200, 4200-1900, 1900-900 cal yr BP, and during the past millen-nium (Little Ice Age) (Fig. 1). The broad age ranges of the six periods of more ex-tensive glaciation are the result of large uncertainties introduced by calibrating ra-diocarbon ages. Glacier extent at the end of each of the six periods, however, was much greater than at the beginning of the following advance period. Synchron-icity between regions and hemispheres indicates that climate is being forced by a single mechanism or a combination of mechanisms that is global in its effect.
Forcing of global Holocene glacier fluctuationsThe global data set discussed above was used to evaluate the hypothesis of Den-ton and Karlén (1973) and Karlén and Kuylenstierna (1996) that Holocene alpine
Andean Icefields
AustriaSwitzerland
11,000 10,000 9000 8000 7000 6000 5000 4000 3000 2000 1000 0
western Canada
southernPatagonia
European Alps
Pre-Cordillera
Cascades
Alaska
small glaciers
cal. yr BP
Scandinavia
New Zealand
Figure 1: Timing of global glacier fluctuations during the Holocene. Horizontal blue bars indicate times of glacier advance; horizontal green bars are times when glaciers in the Swiss Alps were relatively small; vertical light blue bars are periods of glacier advance based on the global data set.
Scie
nce
Hig
hlig
hts:
Op
en S
ecti
on
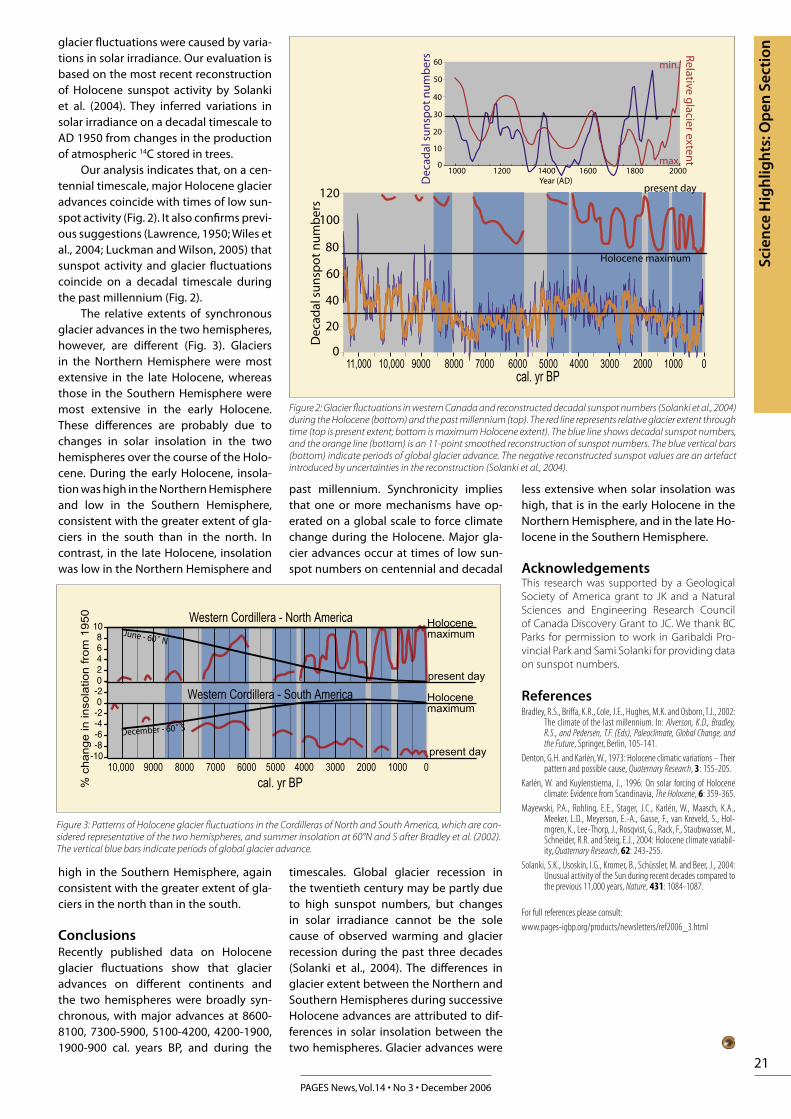
21
PAGES News, Vol.14 • No 3 • December 2006
Scie
nce
Hig
hlig
hts:
Op
en S
ecti
on
glacier fluctuations were caused by varia-tions in solar irradiance. Our evaluation is based on the most recent reconstruction of Holocene sunspot activity by Solanki et al. (2004). They inferred variations in solar irradiance on a decadal timescale to AD 1950 from changes in the production of atmospheric 14C stored in trees.
Our analysis indicates that, on a cen-tennial timescale, major Holocene glacier advances coincide with times of low sun-spot activity (Fig. 2). It also confirms previ-ous suggestions (Lawrence, 1950; Wiles et al., 2004; Luckman and Wilson, 2005) that sunspot activity and glacier fluctuations coincide on a decadal timescale during the past millennium (Fig. 2).
The relative extents of synchronous glacier advances in the two hemispheres, however, are different (Fig. 3). Glaciers in the Northern Hemisphere were most extensive in the late Holocene, whereas those in the Southern Hemisphere were most extensive in the early Holocene. These differences are probably due to changes in solar insolation in the two hemispheres over the course of the Holo-cene. During the early Holocene, insola-tion was high in the Northern Hemisphere and low in the Southern Hemisphere, consistent with the greater extent of gla-ciers in the south than in the north. In contrast, in the late Holocene, insolation was low in the Northern Hemisphere and
���
����
���
���
���
��
��
���
���
��
���
��
��
��
�11,000 10,000 9000 8000 7000 6000 5000 4000 3000 2000 1000 0
cal. yr BP
����������������
�����������
������������������������ �����������������������������������������������������������������������������
����
����
��
���
���
��
���
�
��
��
��
��
��
��
�
����������
�������������
����
����
Figure 2: Glacier fluctuations in western Canada and reconstructed decadal sunspot numbers (Solanki et al., 2004) during the Holocene (bottom) and the past millennium (top). The red line represents relative glacier extent through time (top is present extent; bottom is maximum Holocene extent). The blue line shows decadal sunspot numbers, and the orange line (bottom) is an 11-point smoothed reconstruction of sunspot numbers. The blue vertical bars (bottom) indicate periods of global glacier advance. The negative reconstructed sunspot values are an artefact introduced by uncertainties in the reconstruction (Solanki et al., 2004).
high in the Southern Hemisphere, again consistent with the greater extent of gla-ciers in the north than in the south.
ConclusionsRecently published data on Holocene glacier fluctuations show that glacier advances on different continents and the two hemispheres were broadly syn-chronous, with major advances at 8600-8100, 7300-5900, 5100-4200, 4200-1900, 1900-900 cal. years BP, and during the
past millennium. Synchronicity implies that one or more mechanisms have op-erated on a global scale to force climate change during the Holocene. Major gla-cier advances occur at times of low sun-spot numbers on centennial and decadal
10,000 9000 8000 7000 6000 5000 4000 3000 2000 1000 0
cal. yr BP
Western Cordillera - South America
Western Cordillera - North America Holocenemaximum
present day
Holocene maximum
present day
% c
hange in
inso
latio
n f
rom
1950
-10-8-6-4-20-20246810
������������
����������������
Figure 3: Patterns of Holocene glacier fluctuations in the Cordilleras of North and South America, which are con-sidered representative of the two hemispheres, and summer insolation at 60°N and S after Bradley et al. (2002). The vertical blue bars indicate periods of global glacier advance.
timescales. Global glacier recession in the twentieth century may be partly due to high sunspot numbers, but changes in solar irradiance cannot be the sole cause of observed warming and glacier recession during the past three decades (Solanki et al., 2004). The differences in glacier extent between the Northern and Southern Hemispheres during successive Holocene advances are attributed to dif-ferences in solar insolation between the two hemispheres. Glacier advances were
less extensive when solar insolation was high, that is in the early Holocene in the Northern Hemisphere, and in the late Ho-locene in the Southern Hemisphere.
AcknowledgementsThis research was supported by a Geological Society of America grant to JK and a Natural Sciences and Engineering Research Council of Canada Discovery Grant to JC. We thank BC Parks for permission to work in Garibaldi Pro-vincial Park and Sami Solanki for providing data on sunspot numbers.
ReferencesBradley, R.S., Briffa, K.R., Cole, J.E., Hughes, M.K. and Osborn, T.J., 2002:
The climate of the last millennium. In: Alverson, K.D., Bradley, R.S., and Pedersen, T.F. (Eds), Paleoclimate, Global Change, and the Future, Springer, Berlin, 105-141.
Denton, G.H. and Karlén, W., 1973: Holocene climatic variations – Their pattern and possible cause, Quaternary Research, 3: 155-205.
Karlén, W. and Kuylenstierna, J., 1996: On solar forcing of Holocene climate: Evidence from Scandinavia, The Holocene, 6: 359-365.
Mayewski, P.A., Rohling, E.E., Stager, J.C., Karlén, W., Maasch, K.A., Meeker, L.D., Meyerson, E.-A., Gasse, F., van Kreveld, S., Hol-mgren, K., Lee-Thorp, J., Rosqvist, G., Rack, F., Staubwasser, M., Schneider, R.R. and Steig, E.J., 2004: Holocene climate variabil-ity, Quaternary Research, 62: 243-255.
Solanki, S.K., Usoskin, I.G., Kromer, B., Schüssler, M. and Beer, J., 2004: Unusual activity of the Sun during recent decades compared to the previous 11,000 years, Nature, 431: 1084-1087.
For full references please consult: www.pages-igbp.org/products/newsletters/ref2006_3.html
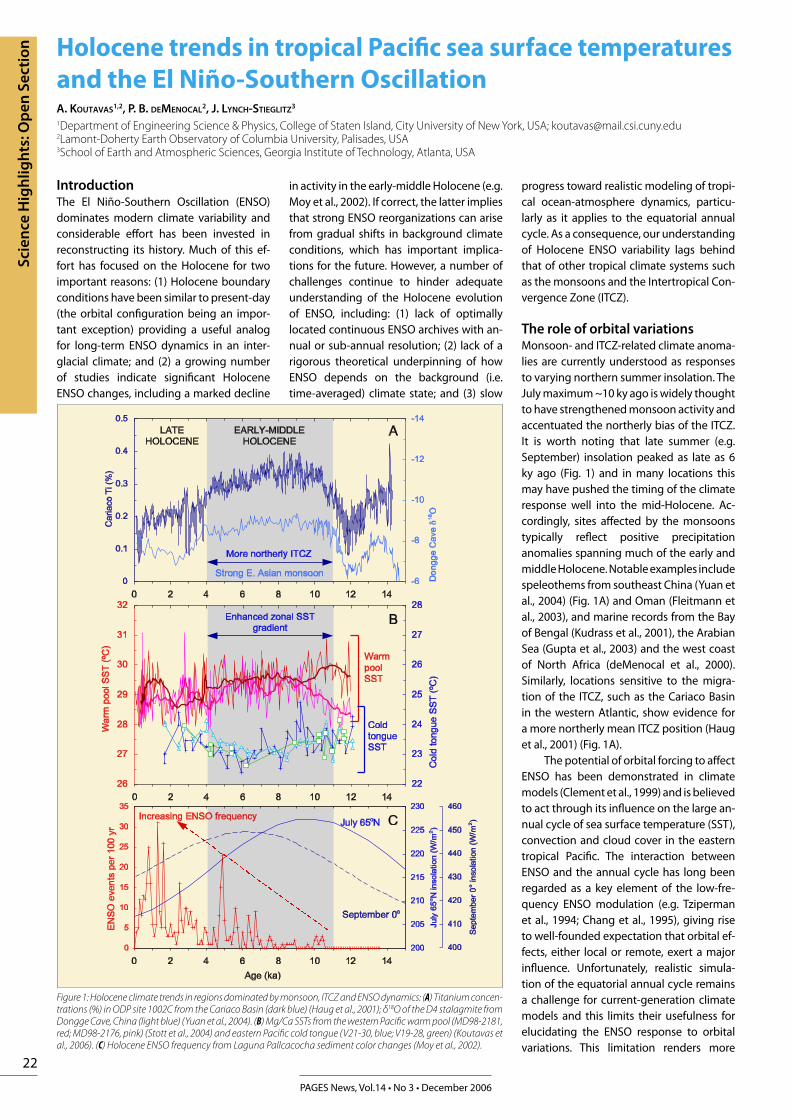
22
PAGES News, Vol.14 • No 3 • December 2006
IntroductionThe El Niño-Southern Oscillation (ENSO) dominates modern climate variability and considerable effort has been invested in reconstructing its history. Much of this ef-fort has focused on the Holocene for two important reasons: (1) Holocene boundary conditions have been similar to present-day (the orbital configuration being an impor-tant exception) providing a useful analog for long-term ENSO dynamics in an inter-glacial climate; and (2) a growing number of studies indicate significant Holocene ENSO changes, including a marked decline
in activity in the early-middle Holocene (e.g. Moy et al., 2002). If correct, the latter implies that strong ENSO reorganizations can arise from gradual shifts in background climate conditions, which has important implica-tions for the future. However, a number of challenges continue to hinder adequate understanding of the Holocene evolution of ENSO, including: (1) lack of optimally located continuous ENSO archives with an-nual or sub-annual resolution; (2) lack of a rigorous theoretical underpinning of how ENSO depends on the background (i.e. time-averaged) climate state; and (3) slow
progress toward realistic modeling of tropi-cal ocean-atmosphere dynamics, particu-larly as it applies to the equatorial annual cycle. As a consequence, our understanding of Holocene ENSO variability lags behind that of other tropical climate systems such as the monsoons and the Intertropical Con-vergence Zone (ITCZ).
The role of orbital variationsMonsoon- and ITCZ-related climate anoma-lies are currently understood as responses to varying northern summer insolation. The July maximum ~10 ky ago is widely thought to have strengthened monsoon activity and accentuated the northerly bias of the ITCZ. It is worth noting that late summer (e.g. September) insolation peaked as late as 6 ky ago (Fig. 1) and in many locations this may have pushed the timing of the climate response well into the mid-Holocene. Ac-cordingly, sites affected by the monsoons typically reflect positive precipitation anomalies spanning much of the early and middle Holocene. Notable examples include speleothems from southeast China (Yuan et al., 2004) (Fig. 1A) and Oman (Fleitmann et al., 2003), and marine records from the Bay of Bengal (Kudrass et al., 2001), the Arabian Sea (Gupta et al., 2003) and the west coast of North Africa (deMenocal et al., 2000). Similarly, locations sensitive to the migra-tion of the ITCZ, such as the Cariaco Basin in the western Atlantic, show evidence for a more northerly mean ITCZ position (Haug et al., 2001) (Fig. 1A).
The potential of orbital forcing to affect ENSO has been demonstrated in climate models (Clement et al., 1999) and is believed to act through its influence on the large an-nual cycle of sea surface temperature (SST), convection and cloud cover in the eastern tropical Pacific. The interaction between ENSO and the annual cycle has long been regarded as a key element of the low-fre-quency ENSO modulation (e.g. Tziperman et al., 1994; Chang et al., 1995), giving rise to well-founded expectation that orbital ef-fects, either local or remote, exert a major influence. Unfortunately, realistic simula-tion of the equatorial annual cycle remains a challenge for current-generation climate models and this limits their usefulness for elucidating the ENSO response to orbital variations. This limitation renders more
Figure 1: Holocene climate trends in regions dominated by monsoon, ITCZ and ENSO dynamics: (A) Titanium concen-trations (%) in ODP site 1002C from the Cariaco Basin (dark blue) (Haug et al., 2001); δ18O of the D4 stalagmite from Dongge Cave, China (light blue) (Yuan et al., 2004). (B) Mg/Ca SSTs from the western Pacific warm pool (MD98-2181, red; MD98-2176, pink) (Stott et al., 2004) and eastern Pacific cold tongue (V21-30, blue; V19-28, green) (Koutavas et al., 2006). (C) Holocene ENSO frequency from Laguna Pallcacocha sediment color changes (Moy et al., 2002).
Holocene trends in tropical Pacific sea surface temperatures and the El Niño-Southern OscillationA. KOUTAVAS1,2, P. B. DEMENOCAL2, J. LYNCH-STIEGLITZ3
1Department of Engineering Science & Physics, College of Staten Island, City University of New York, USA; [email protected] Earth Observatory of Columbia University, Palisades, USA3School of Earth and Atmospheric Sciences, Georgia Institute of Technology, Atlanta, USA
Scie
nce
Hig
hlig
hts:
Op
en S
ecti
on
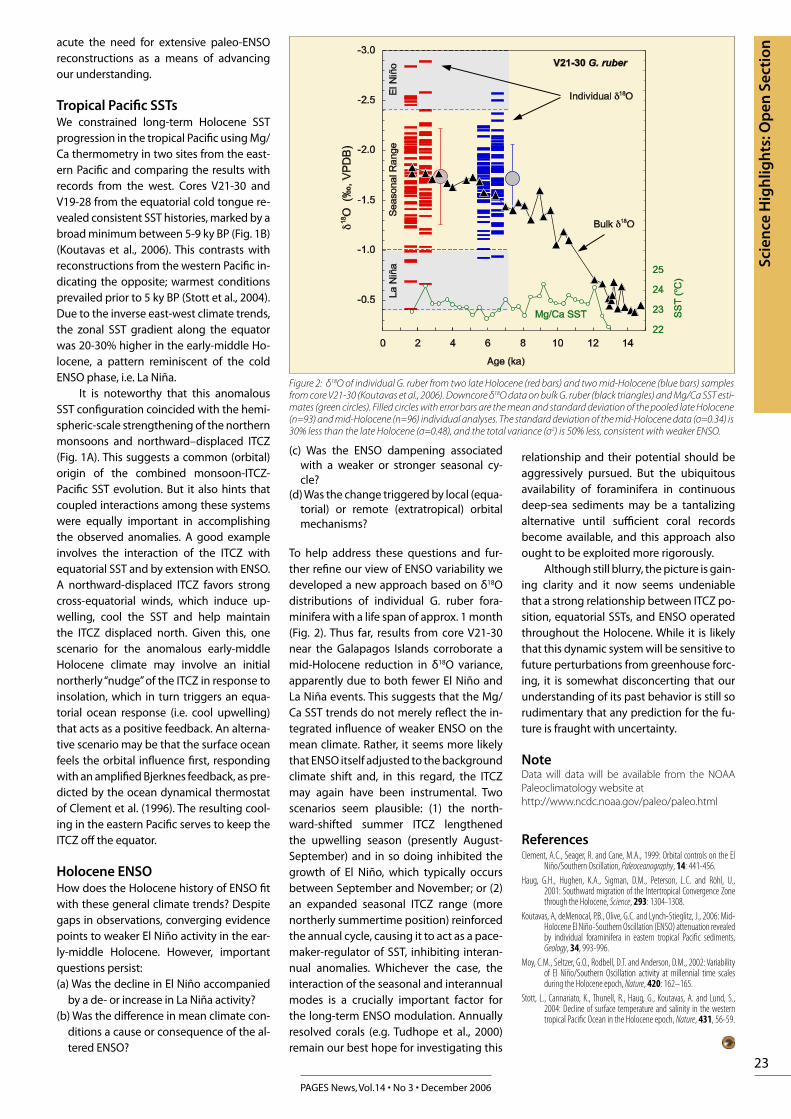
23
PAGES News, Vol.14 • No 3 • December 2006
Scie
nce
Hig
hlig
hts:
Op
en S
ecti
on
acute the need for extensive paleo-ENSO reconstructions as a means of advancing our understanding.
Tropical Pacific SSTsWe constrained long-term Holocene SST progression in the tropical Pacific using Mg/Ca thermometry in two sites from the east-ern Pacific and comparing the results with records from the west. Cores V21-30 and V19-28 from the equatorial cold tongue re-vealed consistent SST histories, marked by a broad minimum between 5-9 ky BP (Fig. 1B) (Koutavas et al., 2006). This contrasts with reconstructions from the western Pacific in-dicating the opposite; warmest conditions prevailed prior to 5 ky BP (Stott et al., 2004). Due to the inverse east-west climate trends, the zonal SST gradient along the equator was 20-30% higher in the early-middle Ho-locene, a pattern reminiscent of the cold ENSO phase, i.e. La Niña.
It is noteworthy that this anomalous SST configuration coincided with the hemi-spheric-scale strengthening of the northern monsoons and northward–displaced ITCZ (Fig. 1A). This suggests a common (orbital) origin of the combined monsoon-ITCZ-Pacific SST evolution. But it also hints that coupled interactions among these systems were equally important in accomplishing the observed anomalies. A good example involves the interaction of the ITCZ with equatorial SST and by extension with ENSO. A northward-displaced ITCZ favors strong cross-equatorial winds, which induce up-welling, cool the SST and help maintain the ITCZ displaced north. Given this, one scenario for the anomalous early-middle Holocene climate may involve an initial northerly “nudge” of the ITCZ in response to insolation, which in turn triggers an equa-torial ocean response (i.e. cool upwelling) that acts as a positive feedback. An alterna-tive scenario may be that the surface ocean feels the orbital influence first, responding with an amplified Bjerknes feedback, as pre-dicted by the ocean dynamical thermostat of Clement et al. (1996). The resulting cool-ing in the eastern Pacific serves to keep the ITCZ off the equator.
Holocene ENSOHow does the Holocene history of ENSO fit with these general climate trends? Despite gaps in observations, converging evidence points to weaker El Niño activity in the ear-ly-middle Holocene. However, important questions persist:(a) Was the decline in El Niño accompanied
by a de- or increase in La Niña activity?(b) Was the difference in mean climate con-
ditions a cause or consequence of the al-tered ENSO?
(c) Was the ENSO dampening associated with a weaker or stronger seasonal cy-cle?
(d) Was the change triggered by local (equa-torial) or remote (extratropical) orbital mechanisms?
To help address these questions and fur-ther refine our view of ENSO variability we developed a new approach based on δ18O distributions of individual G. ruber fora-minifera with a life span of approx. 1 month (Fig. 2). Thus far, results from core V21-30 near the Galapagos Islands corroborate a mid-Holocene reduction in δ18O variance, apparently due to both fewer El Niño and La Niña events. This suggests that the Mg/Ca SST trends do not merely reflect the in-tegrated influence of weaker ENSO on the mean climate. Rather, it seems more likely that ENSO itself adjusted to the background climate shift and, in this regard, the ITCZ may again have been instrumental. Two scenarios seem plausible: (1) the north-ward-shifted summer ITCZ lengthened the upwelling season (presently August-September) and in so doing inhibited the growth of El Niño, which typically occurs between September and November; or (2) an expanded seasonal ITCZ range (more northerly summertime position) reinforced the annual cycle, causing it to act as a pace-maker-regulator of SST, inhibiting interan-nual anomalies. Whichever the case, the interaction of the seasonal and interannual modes is a crucially important factor for the long-term ENSO modulation. Annually resolved corals (e.g. Tudhope et al., 2000) remain our best hope for investigating this
relationship and their potential should be aggressively pursued. But the ubiquitous availability of foraminifera in continuous deep-sea sediments may be a tantalizing alternative until sufficient coral records become available, and this approach also ought to be exploited more rigorously.
Although still blurry, the picture is gain-ing clarity and it now seems undeniable that a strong relationship between ITCZ po-sition, equatorial SSTs, and ENSO operated throughout the Holocene. While it is likely that this dynamic system will be sensitive to future perturbations from greenhouse forc-ing, it is somewhat disconcerting that our understanding of its past behavior is still so rudimentary that any prediction for the fu-ture is fraught with uncertainty.
NoteData will data will be available from the NOAA Paleoclimatology website athttp://www.ncdc.noaa.gov/paleo/paleo.html
ReferencesClement, A.C., Seager, R. and Cane, M.A., 1999: Orbital controls on the El
Niño/Southern Oscillation, Paleoceanography, 14: 441-456.Haug, G.H., Hughen, K.A., Sigman, D.M., Peterson, L.C. and Röhl, U.,
2001: Southward migration of the Intertropical Convergence Zone through the Holocene, Science, 293: 1304-1308.
Koutavas, A, deMenocal, P.B., Olive, G.C. and Lynch-Stieglitz, J., 2006: Mid-Holocene El Niño-Southern Oscillation (ENSO) attenuation revealed by individual foraminifera in eastern tropical Pacific sediments, Geology, 34, 993-996.
Moy, C.M., Seltzer, G.O., Rodbell, D.T. and Anderson, D.M., 2002: Variability of El Niño/Southern Oscillation activity at millennial time scales during the Holocene epoch, Nature, 420: 162–165.
Stott, L., Cannariato, K., Thunell, R., Haug, G., Koutavas, A. and Lund, S., 2004: Decline of surface temperature and salinity in the western tropical Pacific Ocean in the Holocene epoch, Nature, 431, 56-59.
Figure 2: δ18O of individual G. ruber from two late Holocene (red bars) and two mid-Holocene (blue bars) samples from core V21-30 (Koutavas et al., 2006). Downcore δ18O data on bulk G. ruber (black triangles) and Mg/Ca SST esti-mates (green circles). Filled circles with error bars are the mean and standard deviation of the pooled late Holocene (n=93) and mid-Holocene (n=96) individual analyses. The standard deviation of the mid-Holocene data (σ=0.34) is 30% less than the late Holocene (σ=0.48), and the total variance (σ2) is 50% less, consistent with weaker ENSO.
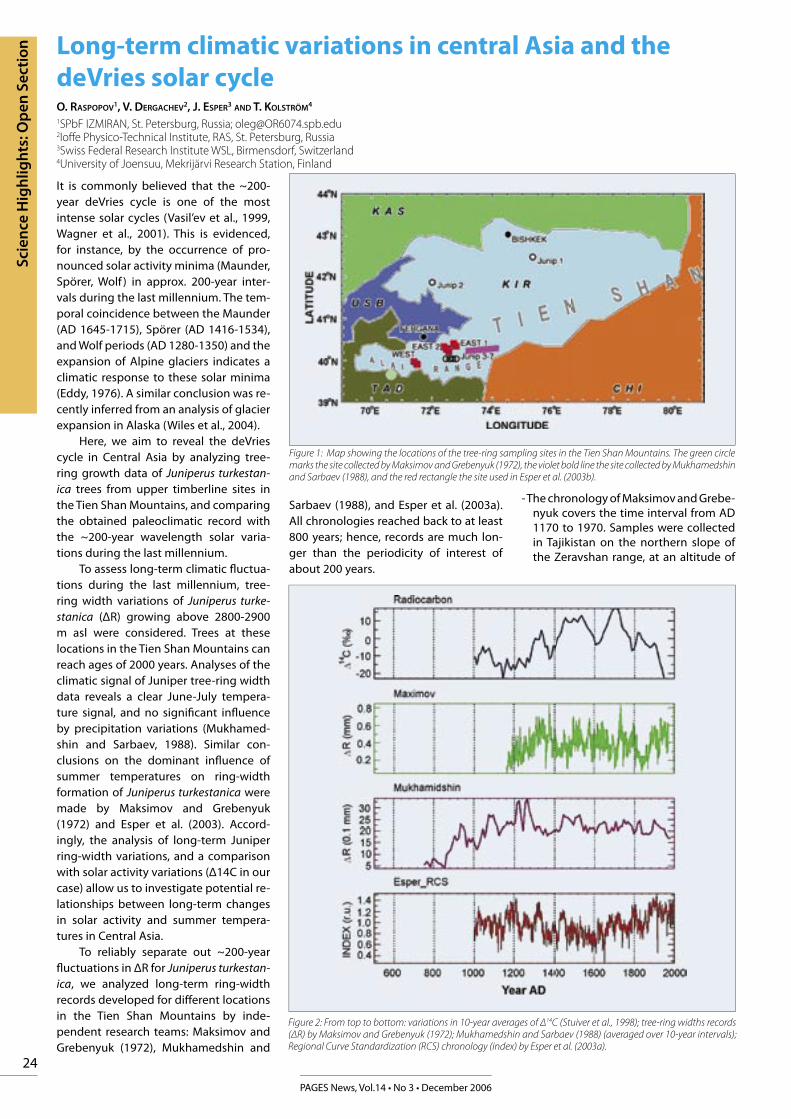
24
PAGES News, Vol.14 • No 3 • December 2006
Long-term climatic variations in central Asia and the deVries solar cycleO. RASPOPOV1, V. DERGACHEV2, J. ESPER3 AND T. KOLSTRÖM4
1SPbF IZMIRAN, St. Petersburg, Russia; [email protected] e Physico-Technical Institute, RAS, St. Petersburg, Russia3Swiss Federal Research Institute WSL, Birmensdorf, Switzerland4University of Joensuu, Mekrijärvi Research Station, Finland
It is commonly believed that the ~200-year deVries cycle is one of the most intense solar cycles (Vasil’ev et al., 1999, Wagner et al., 2001). This is evidenced, for instance, by the occurrence of pro-nounced solar activity minima (Maunder, Spörer, Wolf ) in approx. 200-year inter-vals during the last millennium. The tem-poral coincidence between the Maunder (AD 1645-1715), Spörer (AD 1416-1534), and Wolf periods (AD 1280-1350) and the expansion of Alpine glaciers indicates a climatic response to these solar minima (Eddy, 1976). A similar conclusion was re-cently inferred from an analysis of glacier expansion in Alaska (Wiles et al., 2004).
Here, we aim to reveal the deVries cycle in Central Asia by analyzing tree-ring growth data of Juniperus turkestan-ica trees from upper timberline sites in the Tien Shan Mountains, and comparing the obtained paleoclimatic record with the ~200-year wavelength solar varia-tions during the last millennium.
To assess long-term climatic fl uctua-tions during the last millennium, tree-ring width variations of Juniperus turke-stanica (ΔR) growing above 2800-2900 m asl were considered. Trees at these locations in the Tien Shan Mountains can reach ages of 2000 years. Analyses of the climatic signal of Juniper tree-ring width data reveals a clear June-July tempera-ture signal, and no signifi cant infl uence by precipitation variations (Mukhamed-shin and Sarbaev, 1988). Similar con-clusions on the dominant infl uence of summer temperatures on ring-width formation of Juniperus turkestanica were made by Maksimov and Grebenyuk (1972) and Esper et al. (2003). Accord-ingly, the analysis of long-term Juniper ring-width variations, and a comparison with solar activity variations (Δ14С in our case) allow us to investigate potential re-lationships between long-term changes in solar activity and summer tempera-tures in Central Asia.
To reliably separate out ~200-year fl uctuations in ΔR for Juniperus turkestan-ica, we analyzed long-term ring-width records developed for diff erent locations in the Tien Shan Mountains by inde-pendent research teams: Maksimov and Grebenyuk (1972), Mukhamedshin and
Sarbaev (1988), and Esper et al. (2003a). All chronologies reached back to at least 800 years; hence, records are much lon-ger than the periodicity of interest of about 200 years.
- The chronology of Maksimov and Grebe-nyuk covers the time interval from AD 1170 to 1970. Samples were collected in Tajikistan on the northern slope of the Zeravshan range, at an altitude of
Figure 1: Map showing the locations of the tree-ring sampling sites in the Tien Shan Mountains. The green circle marks the site collected by Maksimov and Grebenyuk (1972), the violet bold line the site collected by Mukhamedshin and Sarbaev (1988), and the red rectangle the site used in Esper et al. (2003b).
Figure 2: From top to bottom: variations in 10-year averages of Δ14С (Stuiver et al., 1998); tree-ring widths records (ΔR) by Maksimov and Grebenyuk (1972); Mukhamedshin and Sarbaev (1988) (averaged over 10-year intervals); Regional Curve Standardization (RCS) chronology (index) by Esper et al. (2003a).
Scie
nce
Hig
hlig
hts:
Op
en S
ecti
on
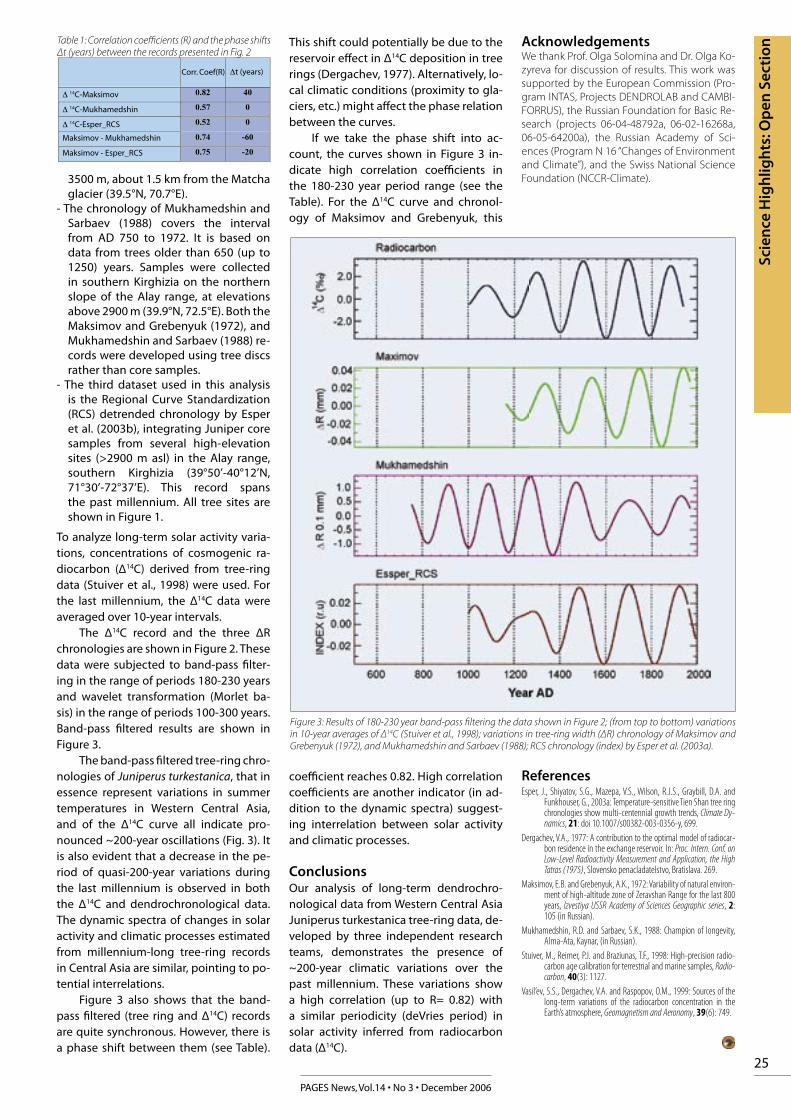
25
PAGES News, Vol.14 • No 3 • December 2006
Scie
nce
Hig
hlig
hts:
Op
en S
ecti
on
3500 m, about 1.5 km from the Matcha glacier (39.5°N, 70.7°E).
- The chronology of Mukhamedshin and Sarbaev (1988) covers the interval from AD 750 to 1972. It is based on data from trees older than 650 (up to 1250) years. Samples were collected in southern Kirghizia on the northern slope of the Alay range, at elevations above 2900 m (39.9°N, 72.5°E). Both the Maksimov and Grebenyuk (1972), and Mukhamedshin and Sarbaev (1988) re-cords were developed using tree discs rather than core samples.
- The third dataset used in this analysis is the Regional Curve Standardization (RCS) detrended chronology by Esper et al. (2003b), integrating Juniper core samples from several high-elevation sites (>2900 m asl) in the Alay range, southern Kirghizia (39°50’-40°12’N, 71°30’-72°37’E). This record spans the past millennium. All tree sites are shown in Figure 1.
To analyze long-term solar activity varia-tions, concentrations of cosmogenic ra-diocarbon (Δ14С) derived from tree-ring data (Stuiver et al., 1998) were used. For the last millennium, the Δ14С data were averaged over 10-year intervals.
The Δ14С record and the three ΔR chronologies are shown in Figure 2. These data were subjected to band-pass fi lter-ing in the range of periods 180-230 years and wavelet transformation (Morlet ba-sis) in the range of periods 100-300 years. Band-pass fi ltered results are shown in Figure 3.
The band-pass fi ltered tree-ring chro-nologies of Juniperus turkestanica, that in essence represent variations in summer temperatures in Western Central Asia, and of the Δ14С curve all indicate pro-nounced ~200-year oscillations (Fig. 3). It is also evident that a decrease in the pe-riod of quasi-200-year variations during the last millennium is observed in both the Δ14С and dendrochronological data. The dynamic spectra of changes in solar activity and climatic processes estimated from millennium-long tree-ring records in Central Asia are similar, pointing to po-tential interrelations.
Figure 3 also shows that the band-pass fi ltered (tree ring and Δ14С) records are quite synchronous. However, there is a phase shift between them (see Table).
0.82 40
0.57 0
0.52 0
0.74 -60
0.75 -20
�������������
�����������������
��������������
�����������������������
��������������������
������������� ���������
Table 1: Correlation coeffi cients (R) and the phase shifts Δt (years) between the records presented in Fig. 2
This shift could potentially be due to the reservoir eff ect in Δ14С deposition in tree rings (Dergachev, 1977). Alternatively, lo-cal climatic conditions (proximity to gla-ciers, etc.) might aff ect the phase relation between the curves.
If we take the phase shift into ac-count, the curves shown in Figure 3 in-dicate high correlation coeffi cients in the 180-230 year period range (see the Table). For the Δ14С curve and chronol-ogy of Maksimov and Grebenyuk, this
coeffi cient reaches 0.82. High correlation coeffi cients are another indicator (in ad-dition to the dynamic spectra) suggest-ing interrelation between solar activity and climatic processes.
ConclusionsOur analysis of long-term dendrochro-nological data from Western Central Asia Juniperus turkestanica tree-ring data, de-veloped by three independent research teams, demonstrates the presence of ~200-year climatic variations over the past millennium. These variations show a high correlation (up to R= 0.82) with a similar periodicity (deVries period) in solar activity inferred from radiocarbon data (Δ14C).
Figure 3: Results of 180-230 year band-pass fi ltering the data shown in Figure 2; (from top to bottom) variations in 10-year averages of Δ14С (Stuiver et al., 1998); variations in tree-ring width (ΔR) chronology of Maksimov and Grebenyuk (1972), and Mukhamedshin and Sarbaev (1988); RCS chronology (index) by Esper et al. (2003a).
AcknowledgementsWe thank Prof. Olga Solomina and Dr. Olga Ko-zyreva for discussion of results. This work was supported by the European Commission (Pro-gram INTAS, Projects DENDROLAB and CAMBI-FORRUS), the Russian Foundation for Basic Re-search (projects 06-04-48792a, 06-02-16268a, 06-05-64200a), the Russian Academy of Sci-ences (Program N 16 “Changes of Environment and Climate”), and the Swiss National Science Foundation (NCCR-Climate).
ReferencesEsper, J., Shiyatov, S.G., Mazepa, V.S., Wilson, R.J.S., Graybill, D.A. and
Funkhouser, G., 2003a: Temperature-sensitive Tien Shan tree ring chronologies show multi-centennial growth trends, Climate Dy-namics, 21: doi 10.1007/s00382-003-0356-y, 699.
Dergachev, V.A., 1977: A contribution to the optimal model of radiocar-bon residence in the exchange reservoir. In: Proc. Intern. Conf. on Low-Level Radioactivity Measurement and Application, the High Tatras (1975), Slovensko penacladatelstvo, Bratislava. 269.
Maksimov, E.B. and Grebenyuk, A.K., 1972: Variability of natural environ-ment of high-altitude zone of Zeravshan Range for the last 800 years, Izvestiya USSR Academy of Sciences Geographic series, 2: 105 (in Russian).
Mukhamedshin, R.D. and Sarbaev, S.K., 1988: Champion of longevity, Alma-Ata, Kaynar, (in Russian).
Stuiver, M., Reimer, P.J. and Braziunas, T.F., 1998: High-precision radio-carbon age calibration for terrestrial and marine samples, Radio-carbon, 40(3): 1127.
Vasil’ev, S.S., Dergachev, V.A. and Raspopov, O.M., 1999: Sources of the long-term variations of the radiocarbon concentration in the Earth’s atmosphere, Geomagnetism and Aeronomy, 39(6): 749.
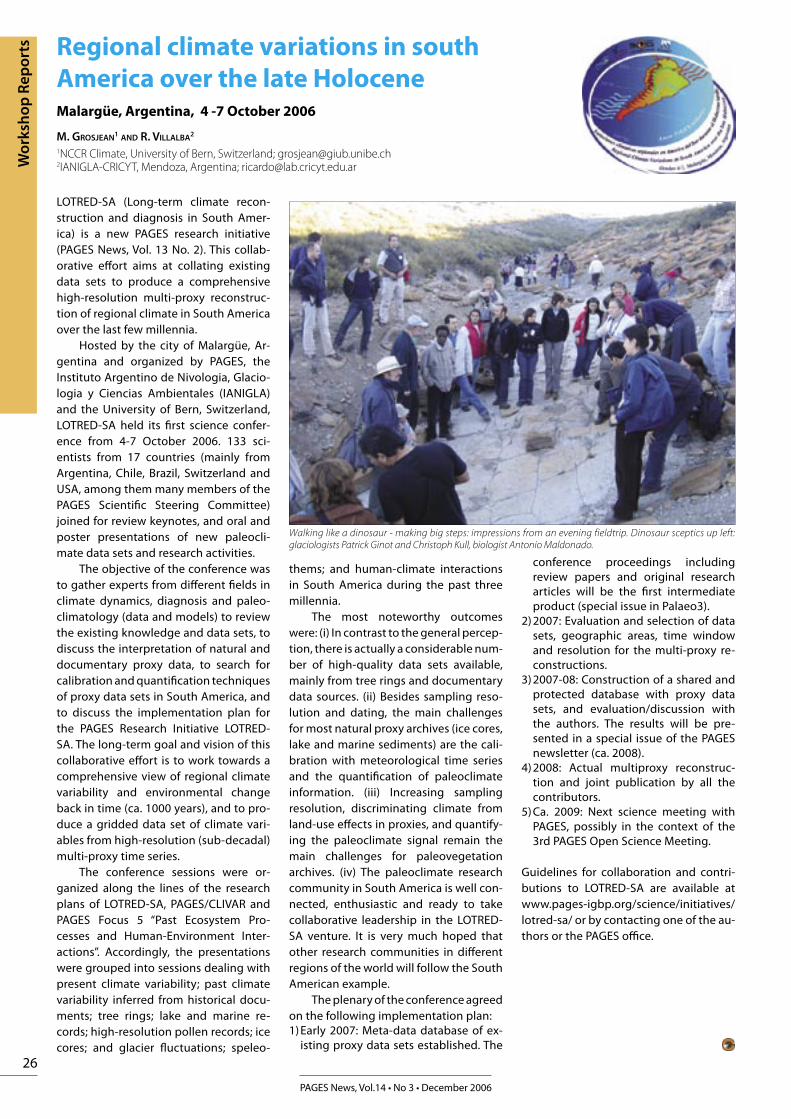
26
PAGES News, Vol.14 • No 3 • December 2006
Regional climate variations in south America over the late HoloceneMalargüe, Argentina, 4 -7 October 2006
M. GROSJEAN1 AND R. VILLALBA2 1NCCR Climate, University of Bern, Switzerland; [email protected], Mendoza, Argentina; [email protected]
LOTRED-SA (Long-term climate recon-struction and diagnosis in South Amer-ica) is a new PAGES research initiative (PAGES News, Vol. 13 No. 2). This collab-orative effort aims at collating existing data sets to produce a comprehensive high-resolution multi-proxy reconstruc-tion of regional climate in South America over the last few millennia.
Hosted by the city of Malargüe, Ar-gentina and organized by PAGES, the Instituto Argentino de Nivologia, Glacio-logia y Ciencias Ambientales (IANIGLA) and the University of Bern, Switzerland, LOTRED-SA held its first science confer-ence from 4-7 October 2006. 133 sci-entists from 17 countries (mainly from Argentina, Chile, Brazil, Switzerland and USA, among them many members of the PAGES Scientific Steering Committee) joined for review keynotes, and oral and poster presentations of new paleocli-mate data sets and research activities.
The objective of the conference was to gather experts from different fields in climate dynamics, diagnosis and paleo-climatology (data and models) to review the existing knowledge and data sets, to discuss the interpretation of natural and documentary proxy data, to search for calibration and quantification techniques of proxy data sets in South America, and to discuss the implementation plan for the PAGES Research Initiative LOTRED-SA. The long-term goal and vision of this collaborative effort is to work towards a comprehensive view of regional climate variability and environmental change back in time (ca. 1000 years), and to pro-duce a gridded data set of climate vari-ables from high-resolution (sub-decadal) multi-proxy time series.
The conference sessions were or-ganized along the lines of the research plans of LOTRED-SA, PAGES/CLIVAR and PAGES Focus 5 “Past Ecosystem Pro-cesses and Human-Environment Inter-actions”. Accordingly, the presentations were grouped into sessions dealing with present climate variability; past climate variability inferred from historical docu-ments; tree rings; lake and marine re-cords; high-resolution pollen records; ice cores; and glacier fluctuations; speleo-
thems; and human-climate interactions in South America during the past three millennia.
The most noteworthy outcomes were: (i) In contrast to the general percep-tion, there is actually a considerable num-ber of high-quality data sets available, mainly from tree rings and documentary data sources. (ii) Besides sampling reso-lution and dating, the main challenges for most natural proxy archives (ice cores, lake and marine sediments) are the cali-bration with meteorological time series and the quantification of paleoclimate information. (iii) Increasing sampling resolution, discriminating climate from land-use effects in proxies, and quantify-ing the paleoclimate signal remain the main challenges for paleovegetation archives. (iv) The paleoclimate research community in South America is well con-nected, enthusiastic and ready to take collaborative leadership in the LOTRED-SA venture. It is very much hoped that other research communities in different regions of the world will follow the South American example.
The plenary of the conference agreed on the following implementation plan:1) Early 2007: Meta-data database of ex-
isting proxy data sets established. The
conference proceedings including review papers and original research articles will be the first intermediate product (special issue in Palaeo3).
2) 2007: Evaluation and selection of data sets, geographic areas, time window and resolution for the multi-proxy re-constructions.
3) 2007-08: Construction of a shared and protected database with proxy data sets, and evaluation/discussion with the authors. The results will be pre-sented in a special issue of the PAGES newsletter (ca. 2008).
4) 2008: Actual multiproxy reconstruc-tion and joint publication by all the contributors.
5) Ca. 2009: Next science meeting with PAGES, possibly in the context of the 3rd PAGES Open Science Meeting.
Guidelines for collaboration and contri-butions to LOTRED-SA are available at www.pages-igbp.org/science/initiatives/lotred-sa/ or by contacting one of the au-thors or the PAGES office.
Walking like a dinosaur - making big steps: impressions from an evening fieldtrip. Dinosaur sceptics up left: glaciologists Patrick Ginot and Christoph Kull, biologist Antonio Maldonado.
Wor
ksh
op R
epor
ts
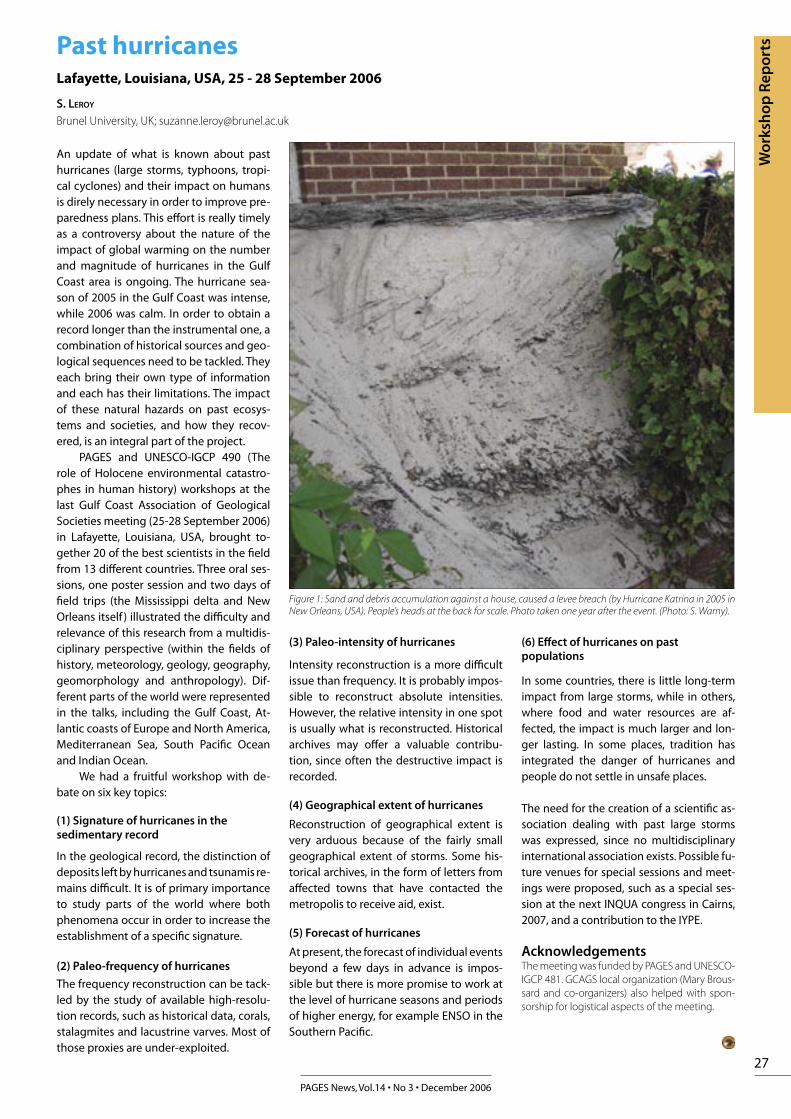
27
PAGES News, Vol.14 • No 3 • December 2006
Wor
ksh
op R
epor
tsPast hurricanesLafayette, Louisiana, USA, 25 - 28 September 2006
S. LEROY
Brunel University, UK; [email protected]
An update of what is known about past hurricanes (large storms, typhoons, tropi-cal cyclones) and their impact on humans is direly necessary in order to improve pre-paredness plans. This effort is really timely as a controversy about the nature of the impact of global warming on the number and magnitude of hurricanes in the Gulf Coast area is ongoing. The hurricane sea-son of 2005 in the Gulf Coast was intense, while 2006 was calm. In order to obtain a record longer than the instrumental one, a combination of historical sources and geo-logical sequences need to be tackled. They each bring their own type of information and each has their limitations. The impact of these natural hazards on past ecosys-tems and societies, and how they recov-ered, is an integral part of the project.
PAGES and UNESCO-IGCP 490 (The role of Holocene environmental catastro-phes in human history) workshops at the last Gulf Coast Association of Geological Societies meeting (25-28 September 2006) in Lafayette, Louisiana, USA, brought to-gether 20 of the best scientists in the field from 13 different countries. Three oral ses-sions, one poster session and two days of field trips (the Mississippi delta and New Orleans itself ) illustrated the difficulty and relevance of this research from a multidis-ciplinary perspective (within the fields of history, meteorology, geology, geography, geomorphology and anthropology). Dif-ferent parts of the world were represented in the talks, including the Gulf Coast, At-lantic coasts of Europe and North America, Mediterranean Sea, South Pacific Ocean and Indian Ocean.
We had a fruitful workshop with de-bate on six key topics:
(1) Signature of hurricanes in the sedimentary record
In the geological record, the distinction of deposits left by hurricanes and tsunamis re-mains difficult. It is of primary importance to study parts of the world where both phenomena occur in order to increase the establishment of a specific signature.
(2) Paleo-frequency of hurricanes
The frequency reconstruction can be tack-led by the study of available high-resolu-tion records, such as historical data, corals, stalagmites and lacustrine varves. Most of those proxies are under-exploited.
(3) Paleo-intensity of hurricanes
Intensity reconstruction is a more difficult issue than frequency. It is probably impos-sible to reconstruct absolute intensities. However, the relative intensity in one spot is usually what is reconstructed. Historical archives may offer a valuable contribu-tion, since often the destructive impact is recorded.
(4) Geographical extent of hurricanes
Reconstruction of geographical extent is very arduous because of the fairly small geographical extent of storms. Some his-torical archives, in the form of letters from affected towns that have contacted the metropolis to receive aid, exist.
(5) Forecast of hurricanes
At present, the forecast of individual events beyond a few days in advance is impos-sible but there is more promise to work at the level of hurricane seasons and periods of higher energy, for example ENSO in the Southern Pacific.
(6) Effect of hurricanes on past populations
In some countries, there is little long-term impact from large storms, while in others, where food and water resources are af-fected, the impact is much larger and lon-ger lasting. In some places, tradition has integrated the danger of hurricanes and people do not settle in unsafe places.
The need for the creation of a scientific as-sociation dealing with past large storms was expressed, since no multidisciplinary international association exists. Possible fu-ture venues for special sessions and meet-ings were proposed, such as a special ses-sion at the next INQUA congress in Cairns, 2007, and a contribution to the IYPE.
AcknowledgementsThe meeting was funded by PAGES and UNESCO-IGCP 481. GCAGS local organization (Mary Brous-sard and co-organizers) also helped with spon-sorship for logistical aspects of the meeting.
Figure 1: Sand and debris accumulation against a house, caused a levee breach (by Hurricane Katrina in 2005 in New Orleans, USA). People’s heads at the back for scale. Photo taken one year after the event. (Photo: S. Warny).
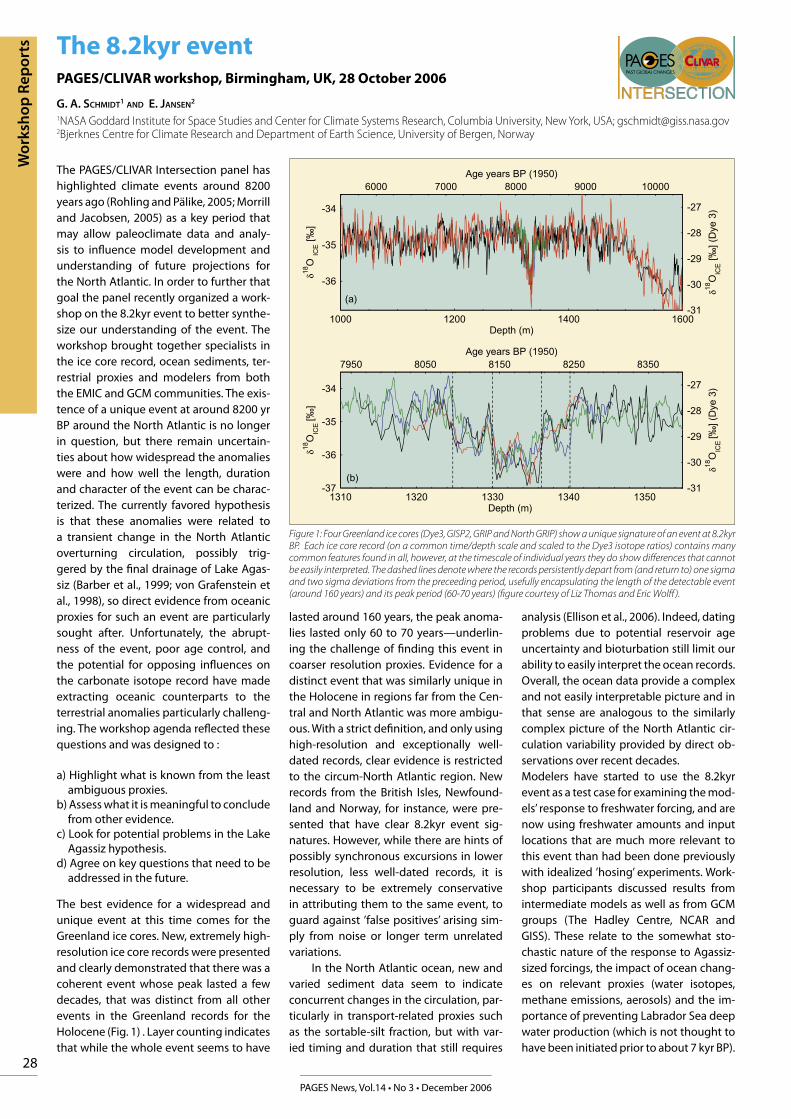
28
PAGES News, Vol.14 • No 3 • December 2006
The 8.2kyr eventPAGES/CLIVAR workshop, Birmingham, UK, 28 October 2006
G. A. SCHMIDT1 AND E. JANSEN2
1NASA Goddard Institute for Space Studies and Center for Climate Systems Research, Columbia University, New York, USA; [email protected] Centre for Climate Research and Department of Earth Science, University of Bergen, Norway
The PAGES/CLIVAR Intersection panel has highlighted climate events around 8200 years ago (Rohling and Pälike, 2005; Morrill and Jacobsen, 2005) as a key period that may allow paleoclimate data and analy-sis to infl uence model development and understanding of future projections for the North Atlantic. In order to further that goal the panel recently organized a work-shop on the 8.2kyr event to better synthe-size our understanding of the event. The workshop brought together specialists in the ice core record, ocean sediments, ter-restrial proxies and modelers from both the EMIC and GCM communities. The exis-tence of a unique event at around 8200 yr BP around the North Atlantic is no longer in question, but there remain uncertain-ties about how widespread the anomalies were and how well the length, duration and character of the event can be charac-terized. The currently favored hypothesis is that these anomalies were related to a transient change in the North Atlantic overturning circulation, possibly trig-gered by the fi nal drainage of Lake Agas-siz (Barber et al., 1999; von Grafenstein et al., 1998), so direct evidence from oceanic proxies for such an event are particularly sought after. Unfortunately, the abrupt-ness of the event, poor age control, and the potential for opposing infl uences on the carbonate isotope record have made extracting oceanic counterparts to the terrestrial anomalies particularly challeng-ing. The workshop agenda refl ected these questions and was designed to :
a) Highlight what is known from the least ambiguous proxies.
b) Assess what it is meaningful to conclude from other evidence.
c) Look for potential problems in the Lake Agassiz hypothesis.
d) Agree on key questions that need to be addressed in the future.
The best evidence for a widespread and unique event at this time comes for the Greenland ice cores. New, extremely high- resolution ice core records were presented and clearly demonstrated that there was a coherent event whose peak lasted a few decades, that was distinct from all other events in the Greenland records for the Holocene (Fig. 1) . Layer counting indicates that while the whole event seems to have
lasted around 160 years, the peak anoma-lies lasted only 60 to 70 years—underlin-ing the challenge of fi nding this event in coarser resolution proxies. Evidence for a distinct event that was similarly unique in the Holocene in regions far from the Cen-tral and North Atlantic was more ambigu-ous. With a strict defi nition, and only using high-resolution and exceptionally well-dated records, clear evidence is restricted to the circum-North Atlantic region. New records from the British Isles, Newfound-land and Norway, for instance, were pre-sented that have clear 8.2kyr event sig-natures. However, while there are hints of possibly synchronous excursions in lower resolution, less well-dated records, it is necessary to be extremely conservative in attributing them to the same event, to guard against ’false positives’ arising sim-ply from noise or longer term unrelated variations.
In the North Atlantic ocean, new and varied sediment data seem to indicate concurrent changes in the circulation, par-ticularly in transport-related proxies such as the sortable-silt fraction, but with var-ied timing and duration that still requires
analysis (Ellison et al., 2006). Indeed, dating problems due to potential reservoir age uncertainty and bioturbation still limit our ability to easily interpret the ocean records. Overall, the ocean data provide a complex and not easily interpretable picture and in that sense are analogous to the similarly complex picture of the North Atlantic cir-culation variability provided by direct ob-servations over recent decades.Modelers have started to use the 8.2kyr event as a test case for examining the mod-els’ response to freshwater forcing, and are now using freshwater amounts and input locations that are much more relevant to this event than had been done previously with idealized ’hosing’ experiments. Work-shop participants discussed results from intermediate models as well as from GCM groups (The Hadley Centre, NCAR and GISS). These relate to the somewhat sto-chastic nature of the response to Agassiz-sized forcings, the impact of ocean chang-es on relevant proxies (water isotopes, methane emissions, aerosols) and the im-portance of preventing Labrador Sea deep water production (which is not thought to have been initiated prior to about 7 kyr BP).
-36
-35
-34
1000 1200 1400 1600
6000 7000 8000 9000 10000
-31
-30
-29
-28
-27
(a)
Depth (m)
�81O
CIE
‰[ ]
�8
1O
CIE
eyD( ]
‰ [ 3)
Age years BP (1950)
-37
-36
-35
-34
1310 1320 1330 1340 1350
7950 8050 8150 8250 8350
-31
-30
-29
-28
-27
(b)
Depth (m)
�8 1O
CIE
]‰[
�81O
CIE
eyD( ]
‰[)3
Age years BP (1950)
Figure 1: Four Greenland ice cores (Dye3, GISP2, GRIP and North GRIP) show a unique signature of an event at 8.2kyr BP. Each ice core record (on a common time/depth scale and scaled to the Dye3 isotope ratios) contains many common features found in all, however, at the timescale of individual years they do show diff erences that cannot be easily interpreted. The dashed lines denote where the records persistently depart from (and return to) one sigma and two sigma deviations from the preceeding period, usefully encapsulating the length of the detectable event (around 160 years) and its peak period (60-70 years) (fi gure courtesy of Liz Thomas and Eric Wolff ).
Wor
ksh
op R
epor
ts
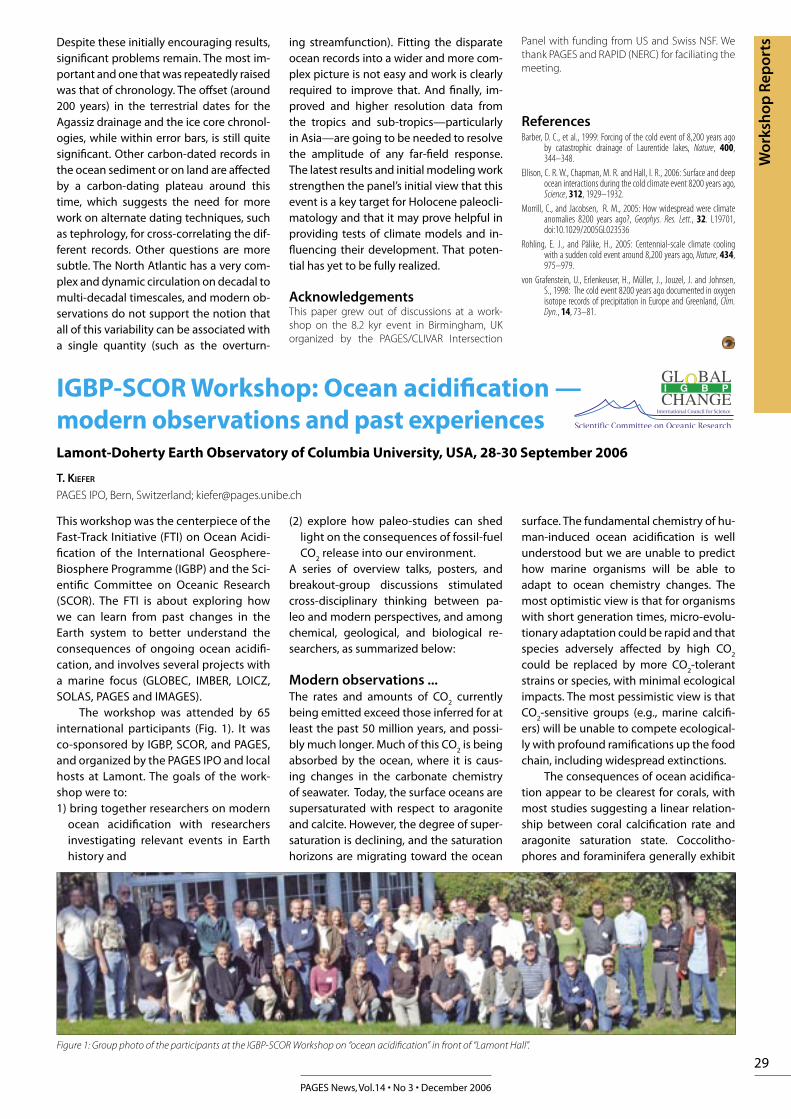
29
PAGES News, Vol.14 • No 3 • December 2006
Wor
ksh
op R
epor
tsDespite these initially encouraging results, significant problems remain. The most im-portant and one that was repeatedly raised was that of chronology. The offset (around 200 years) in the terrestrial dates for the Agassiz drainage and the ice core chronol-ogies, while within error bars, is still quite significant. Other carbon-dated records in the ocean sediment or on land are affected by a carbon-dating plateau around this time, which suggests the need for more work on alternate dating techniques, such as tephrology, for cross-correlating the dif-ferent records. Other questions are more subtle. The North Atlantic has a very com-plex and dynamic circulation on decadal to multi-decadal timescales, and modern ob-servations do not support the notion that all of this variability can be associated with a single quantity (such as the overturn-
ing streamfunction). Fitting the disparate ocean records into a wider and more com-plex picture is not easy and work is clearly required to improve that. And finally, im-proved and higher resolution data from the tropics and sub-tropics—particularly in Asia—are going to be needed to resolve the amplitude of any far-field response. The latest results and initial modeling work strengthen the panel’s initial view that this event is a key target for Holocene paleocli-matology and that it may prove helpful in providing tests of climate models and in-fluencing their development. That poten-tial has yet to be fully realized.
AcknowledgementsThis paper grew out of discussions at a work-shop on the 8.2 kyr event in Birmingham, UK organized by the PAGES/CLIVAR Intersection
Panel with funding from US and Swiss NSF. We thank PAGES and RAPID (NERC) for faciliating the meeting.
ReferencesBarber, D. C., et al., 1999: Forcing of the cold event of 8,200 years ago
by catastrophic drainage of Laurentide lakes, Nature, 400, 344–348.
Ellison, C. R. W., Chapman, M. R. and Hall, I. R., 2006: Surface and deep ocean interactions during the cold climate event 8200 years ago, Science, 312, 1929–1932.
Morrill, C., and Jacobsen, R. M., 2005: How widespread were climate anomalies 8200 years ago?, Geophys. Res. Lett., 32. L19701, doi:10.1029/2005GL023536
Rohling, E. J., and Pälike, H., 2005: Centennial-scale climate cooling with a sudden cold event around 8,200 years ago, Nature, 434, 975–979.
von Grafenstein, U., Erlenkeuser, H., Müller, J., Jouzel, J. and Johnsen, S., 1998: The cold event 8200 years ago documented in oxygen isotope records of precipitation in Europe and Greenland, Clim. Dyn., 14, 73–81.
IGBP-SCOR Workshop: Ocean acidification — modern observations and past experiencesLamont-Doherty Earth Observatory of Columbia University, USA, 28-30 September 2006
T. KIEFER
PAGES IPO, Bern, Switzerland; [email protected]
This workshop was the centerpiece of the Fast-Track Initiative (FTI) on Ocean Acidi-fication of the International Geosphere-Biosphere Programme (IGBP) and the Sci-entific Committee on Oceanic Research (SCOR). The FTI is about exploring how we can learn from past changes in the Earth system to better understand the consequences of ongoing ocean acidifi-cation, and involves several projects with a marine focus (GLOBEC, IMBER, LOICZ, SOLAS, PAGES and IMAGES).
The workshop was attended by 65 international participants (Fig. 1). It was co-sponsored by IGBP, SCOR, and PAGES, and organized by the PAGES IPO and local hosts at Lamont. The goals of the work-shop were to:1) bring together researchers on modern
ocean acidification with researchers investigating relevant events in Earth history and
(2) explore how paleo-studies can shed light on the consequences of fossil-fuel CO
2 release into our environment.
A series of overview talks, posters, and breakout-group discussions stimulated cross-disciplinary thinking between pa-leo and modern perspectives, and among chemical, geological, and biological re-searchers, as summarized below:
Modern observations ...The rates and amounts of CO
2 currently
being emitted exceed those inferred for at least the past 50 million years, and possi-bly much longer. Much of this CO
2 is being
absorbed by the ocean, where it is caus-ing changes in the carbonate chemistry of seawater. Today, the surface oceans are supersaturated with respect to aragonite and calcite. However, the degree of super-saturation is declining, and the saturation horizons are migrating toward the ocean
surface. The fundamental chemistry of hu-man-induced ocean acidification is well understood but we are unable to predict how marine organisms will be able to adapt to ocean chemistry changes. The most optimistic view is that for organisms with short generation times, micro-evolu-tionary adaptation could be rapid and that species adversely affected by high CO
2
could be replaced by more CO2-tolerant
strains or species, with minimal ecological impacts. The most pessimistic view is that CO
2-sensitive groups (e.g., marine calcifi-
ers) will be unable to compete ecological-ly with profound ramifications up the food chain, including widespread extinctions.
The consequences of ocean acidifica-tion appear to be clearest for corals, with most studies suggesting a linear relation-ship between coral calcification rate and aragonite saturation state. Coccolitho-phores and foraminifera generally exhibit
Figure 1: Group photo of the participants at the IGBP-SCOR Workshop on “ocean acidification” in front of “Lamont Hall”.
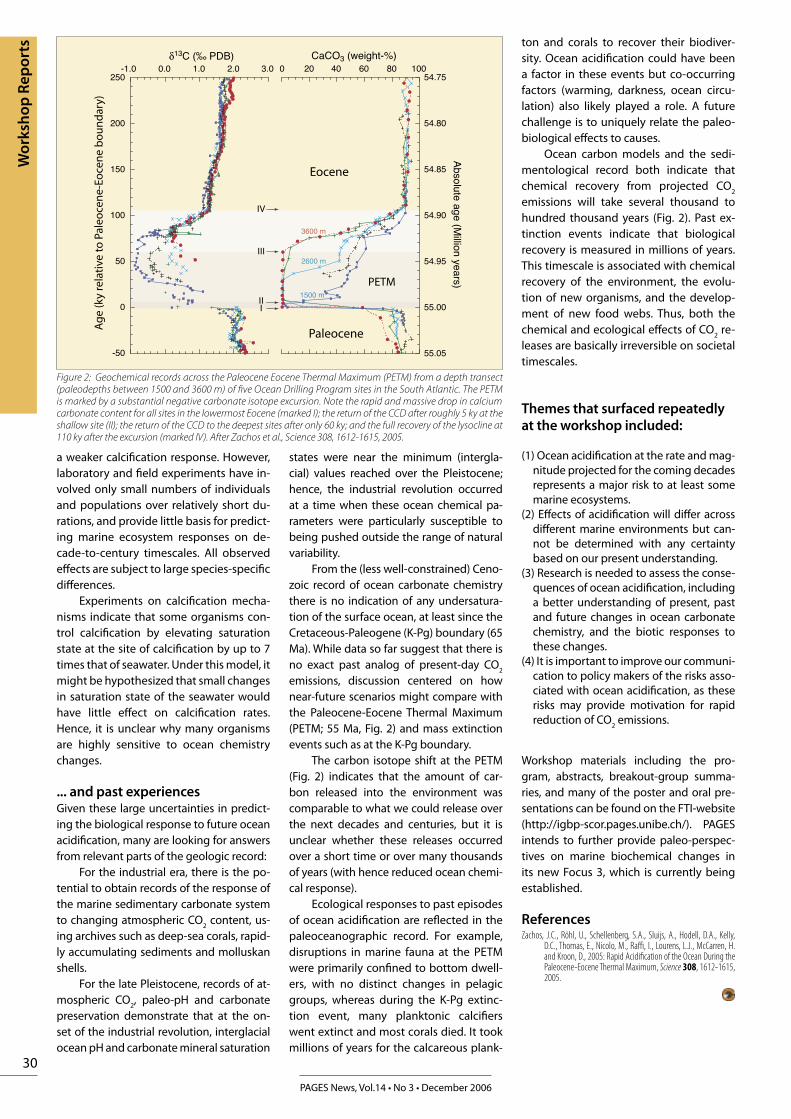
30
PAGES News, Vol.14 • No 3 • December 2006
a weaker calcification response. However, laboratory and field experiments have in-volved only small numbers of individuals and populations over relatively short du-rations, and provide little basis for predict-ing marine ecosystem responses on de-cade-to-century timescales. All observed effects are subject to large species-specific differences.
Experiments on calcification mecha-nisms indicate that some organisms con-trol calcification by elevating saturation state at the site of calcification by up to 7 times that of seawater. Under this model, it might be hypothesized that small changes in saturation state of the seawater would have little effect on calcification rates. Hence, it is unclear why many organisms are highly sensitive to ocean chemistry changes.
... and past experiencesGiven these large uncertainties in predict-ing the biological response to future ocean acidification, many are looking for answers from relevant parts of the geologic record:
For the industrial era, there is the po-tential to obtain records of the response of the marine sedimentary carbonate system to changing atmospheric CO
2 content, us-
ing archives such as deep-sea corals, rapid-ly accumulating sediments and molluskan shells.
For the late Pleistocene, records of at-mospheric CO
2, paleo-pH and carbonate
preservation demonstrate that at the on-set of the industrial revolution, interglacial ocean pH and carbonate mineral saturation
states were near the minimum (intergla-cial) values reached over the Pleistocene; hence, the industrial revolution occurred at a time when these ocean chemical pa-rameters were particularly susceptible to being pushed outside the range of natural variability.
From the (less well-constrained) Ceno-zoic record of ocean carbonate chemistry there is no indication of any undersatura-tion of the surface ocean, at least since the Cretaceous-Paleogene (K-Pg) boundary (65 Ma). While data so far suggest that there is no exact past analog of present-day CO
2
emissions, discussion centered on how near-future scenarios might compare with the Paleocene-Eocene Thermal Maximum (PETM; 55 Ma, Fig. 2) and mass extinction events such as at the K-Pg boundary.
The carbon isotope shift at the PETM (Fig. 2) indicates that the amount of car-bon released into the environment was comparable to what we could release over the next decades and centuries, but it is unclear whether these releases occurred over a short time or over many thousands of years (with hence reduced ocean chemi-cal response).
Ecological responses to past episodes of ocean acidification are reflected in the paleoceanographic record. For example, disruptions in marine fauna at the PETM were primarily confined to bottom dwell-ers, with no distinct changes in pelagic groups, whereas during the K-Pg extinc-tion event, many planktonic calcifiers went extinct and most corals died. It took millions of years for the calcareous plank-
54.75
54.80
54.85
54.90
54.95
55.00
55.05
CaCO3 (weight-%)
Absolute age (Million years)
�13C (‰ PDB)
II
III
IV
1500 m
3600 m
2600 m
250
200
150
100
50
-50
0
20 40 60 80 100-1.0 0.0 1.0 2.0 3.0 0
I
��
����
����
����
�����
����
����
���
����
���
��
��
���
��
���������
������
����
Figure 2: Geochemical records across the Paleocene Eocene Thermal Maximum (PETM) from a depth transect (paleodepths between 1500 and 3600 m) of five Ocean Drilling Program sites in the South Atlantic. The PETM is marked by a substantial negative carbonate isotope excursion. Note the rapid and massive drop in calcium carbonate content for all sites in the lowermost Eocene (marked I); the return of the CCD after roughly 5 ky at the shallow site (II); the return of the CCD to the deepest sites after only 60 ky; and the full recovery of the lysocline at 110 ky after the excursion (marked IV). After Zachos et al., Science 308, 1612-1615, 2005.
ton and corals to recover their biodiver-sity. Ocean acidification could have been a factor in these events but co-occurring factors (warming, darkness, ocean circu-lation) also likely played a role. A future challenge is to uniquely relate the paleo-biological effects to causes.
Ocean carbon models and the sedi-mentological record both indicate that chemical recovery from projected CO
2
emissions will take several thousand to hundred thousand years (Fig. 2). Past ex-tinction events indicate that biological recovery is measured in millions of years. This timescale is associated with chemical recovery of the environment, the evolu-tion of new organisms, and the develop-ment of new food webs. Thus, both the chemical and ecological effects of CO
2 re-
leases are basically irreversible on societal timescales.
Themes that surfaced repeatedly at the workshop included:
(1) Ocean acidification at the rate and mag-nitude projected for the coming decades represents a major risk to at least some marine ecosystems.
(2) Effects of acidification will differ across different marine environments but can-not be determined with any certainty based on our present understanding.
(3) Research is needed to assess the conse-quences of ocean acidification, including a better understanding of present, past and future changes in ocean carbonate chemistry, and the biotic responses to these changes.
(4) It is important to improve our communi-cation to policy makers of the risks asso-ciated with ocean acidification, as these risks may provide motivation for rapid reduction of CO
2 emissions.
Workshop materials including the pro-gram, abstracts, breakout-group summa-ries, and many of the poster and oral pre-sentations can be found on the FTI-website (http://igbp-scor.pages.unibe.ch/). PAGES intends to further provide paleo-perspec-tives on marine biochemical changes in its new Focus 3, which is currently being established.
ReferencesZachos, J.C., Röhl, U., Schellenberg, S.A., Sluijs, A., Hodell, D.A., Kelly,
D.C., Thomas, E., Nicolo, M., Raffi, I., Lourens, L.J., McCarren, H. and Kroon, D., 2005: Rapid Acidification of the Ocean During the Paleocene-Eocene Thermal Maximum, Science 308, 1612-1615, 2005.
Wor
ksh
op R
epor
ts
31
PAGES News, Vol.14 • No 3 • December 2006
Wor
ksh
op R
epor
tsReconstruction of past Mediterranean climate: Unexplored sources of high resolution data in historic time1st MedCLIVAR Workshop, Carmona, Spain, 8-11 November 2006
R. GARCÍA-HERRERA1, J. LUTERBACHER2, P. LIONELLO3, F. GONZÁLEZ-ROUCO1, P. RIBERA4, X. RODÓ5 , C. KULL6 AND C. ZEREFOS7
1Facultad de CC Físicas, Universidad Complutense, Ciudad Universitaria, Madrid, Spain; [email protected] Climate, University of Bern, Switzerland 3Department of Material Sciences, University of Lecce, Italy 4Universidad Pablo de Olavide, Sevilla, Spain5Climate Research laboratory LRCPCB-UB, Barcelona, Catalunya (Spain)6PAGES IPO, Sulgeneckstrasse 38, 3007 Bern, Switzerland7 University of Athens, Panepistimiopolis, Zografou, 157 84, Greece
This workshop was the first in a series of five meetings planned by MedCLIVAR (www.medclivar.eu), which is a program funded by the European Science Foun-dation (ESF) aiming to coordinate and promote research on different aspects of Mediterranean climate. The main Med-CLIVAR activities include: (1) reconstruc-tion of past climate, (2) description of patterns and mechanisms characterizing space-time variability, (3) comparisons of coupled climate model simulations with empirical reconstructions, (4) sea-sonal forecasting, and (5) identification of the forcing responsible for the observed changes.
The workshop was attended by 64 re-searchers from 15 countries (Fig. 1), 15% being PhD students. The main purpose of the meeting was to identify sources of early instrumental data, and natural and documentary climate proxies, which had not been previously explored but which are relevant for the reconstruction of cli-mate in the Mediterranean region during past millennia. The first session reviewed the availability of documentary sources in the larger Mediterranean region, with reports from different countries and archives. The second part of the work-shop analyzed the availability of natural archives in the area, such as tree-rings, lake sediments, speleothems and mol-lusk shells, and their suitability to recon-structions of different climate parameters such as temperature, precipitation or drought. Several examples of modeling past Mediterranean climate were shown in the third session, with emphasis on the comparison between model outputs and proxy evidence.
The main conclusions can be sum-marized as follows:
The Mediterranean region is rich in natu-ral and documentary proxies of past regional climate. They resolve differ-ent temporal and spatial scales and
reflect a wide range of climate param-eters (SST, salinity, temperature, pre-cipitation, sea level, geochemistry, etc). However, the currently available proxy data sets are not sufficiently dense to reconstruct climate with a high spatial variability as would be required for the Mediterranean basin. The main gaps in information come from Northern Afri-ca, the Eastern Mediterranean and the Balkans.
There are numerous ongoing initiatives from different research teams to re-trieve information from documentary collections and natural proxies but there is not a general strategy to search data and proxies on a basin-wide scale. This should be the target of an inter-disciplinary approach, with research-ers from different fields collaborating towards a common understanding of past climate change of the last 1000 to 2000 years using high-resolution prox-ies.
The simulation of past climates is ac-complished using models of different complexity: EMICs and full complexity GCMs. Comparison with proxies at the Mediterranean scale is based on the use of GCMs. Simulations of the last millennium climate are subject to limi-tations by model resolution, orography representation, parameterization, as well as to model and external forcing uncertainties but still can provide some interesting comparisons with climate reconstructions.
Exercises comparing documentary and natural proxies, and model outputs are scarce for the region. They should improve the quality of all types of data sets and models but should be com-pared with care, taking into account the uncertainties in the proxy recon-structions, the complexity in the trans-fer functions from proxy parameters to climate variables, and the internal vari-ability of the models, which is highly dependent on the modeled variable.
The workshop was the starting point to-wards building a community working together on the past climate of the Medi-terranean region, incorporating scien-tists and data from the north African and Eastern Mediterranean communities, and creating links between paleoscientists, climatologists, and modelers. The next step will be the creation of a web-sup-ported meta-database to increase data interchange. The database will be hosted by MedCLIVAR and will be supported by PAGES.
AcknowledgementsThe workshop was generously supported by the ESF, PAGES, The Spanish Ministry of Sci-ence and Education, the National Observatory of Athens, and the University Pablo de Olavide of Spain.
Figure 1: Participants at the 1st MedCLIVAR workshop.
32
PAGES News, Vol.14 • No 3 • December 2006
Impressum
PAGES International Project OfficeSulgeneckstrasse 383007 Bern - SwitzerlandTel.: +41 31 312 31 33Fax: +41 31 312 31 [email protected]
Editors:Series editors: Christoph Kull and Thorsten Kiefer
Guest editor:Irka Hajdas
Text editing: Leah ChristenLayout: Christoph Kull
Circulation: 3750
ISSN 1563-0803
printed on recycled paper by Läderach AG Bern, Switzerland
Contents:
Announcements 2 – Editorial: 14C-Chronology 2
– PAGES calendar 2
– Inside PAGES 3
– New on the PAGES bookshelf 3
Program News 4 – The Millennium project: European climate of the last millennium 4
– Paleoenvironments in south India: Monsoon records from rainfed reservoirs 5
Science Highlights: 14C-Chronology 6
– Cosmogenic isotope 14C: Production and carbon cycle 6
– Assuring measurement quality: The international 14C laboratory inter-comparison 7
– IntCal and the future of radiocarbon calibration 9
– The potential for extending Intcal04 using OIS-3 New Zealand sub-fossil Kauri 11
– Marine reservoir corrections and the calibration curve 12
– New approaches to constructing age models: OxCal4 14
– 21st century suck-in or smear: Testing the timing of events between archives 15
– High-resolution radiocarbon chronologies and synchronization of records 17
– Marine 14C reservoir ages oscillate 18
Science Highlights: Open Section 20 – Are insolation and sunspot activity the primary drivers of Holocene glacier
fluctuations? 20
– Holocene trends in tropical Pacific sea surface temperatures and the El Niño- Southern Oscillation 22
– Long-term climatic variations in central Asia and the deVries solar cycle 24
Workshop Reports 26
– Regional climate variations in south America over the late Holocene Malargüe - Argentina, 4 - 7 October 2006 26
– Past hurricanes Lafayette - USA, 25 - 28 September 2006 27
– The 8.2 kyr event Birmingham - UK, 28 October 2006 28
– Ocean acidification — modern observations and past experiences Palisades - USA, 28 - 30 September 2006 29
– Unexplored sources of high resolution data in historic time Carmona - Spain, 8 - 11 November 2006 31
The PAGES International Project Office and its publications are supported by the Swiss and US National Science Foun-dations and NOAA.
Con
tent
s
Call for contributions: general PAGES activitiesAll PAGES Newsletters now have an open section for general contributions. If you would like to contribute a “Science Highlight“, “Workshop Report“, “Program News“, or an amusing “Tales from the field“ story for the forthcoming April 2007 issue of PAGES News, please contact Thorsten Kiefer ([email protected]).
The deadline is 28 February 2007.Information and guidelines are available at:http://www.pages-igbp.org/products/newsletters/instructions.html