eduardo borensztein and prakash lounganieduardo borensztein and prakash loungani ... matsumoto,...
TRANSCRIPT

Asian Financial Integration: Trends and Interruptions
Eduardo Borensztein and Prakash Loungani
WP/11/4
© 2010 International Monetary Fund WP/11/4
IMF Working Paper
Research Department
Asian Financial Integration: Trends and Interruptions
Prepared by Eduardo Borensztein and Prakash Loungani
January 2011
Abstract
The paper compares trends in financial integration within Asia with those in industrialized countries and other regional groups. Declines in cross-country dispersion in equity returns and interest rates suggest increased Asian integration, with the process interrupted by crises and global volatility. Cross-border equity and bond holdings have also increased, but Asian countries remain considerably more financially integrated with major countries outside the region than with those within the region. The paper also discusses whether potential benefits of regional financial integration, such as increased risk-sharing and stability of the investor base, have materialized.
JEL Classification Numbers: F15, F2, F36, G10, G15
Keywords: financial integration; Asia; equity premium; bond markets; gravity model; home bias; risk-sharing; herding
Author’s E-Mail Address: [email protected]; [email protected]
We thank Robert Barro, David Cook, Hans Genberg, Warwick McKibbin, Jong-Wha Lee and other participants at the ADB-HKIMR workshop on “Quantifying the Costs and Benefits of Regional Economic Integration in Asia” for very useful comments on the first draft of this paper. We thank Ioannis Tokatlidis, Jair Rodriguez and Hites Ahir for numerous discussions on this topic and excellent research assistance. We are also grateful for data and advice from Gianni De Niccolo, Ayhan Kose, Akito Matsumoto, Martin Schindler, Ken Singleton, Bent Sorenson and Christian Thimann. Andrew Rose’s website was also a source for the data used in this paper. The views expressed in this paper should not be attributed to either the IMF or the IDB.
This Working Paper should not be reported as representing the views of the IMF.
The views expressed in this Working Paper are those of the author(s) and do not necessarily represent those of the IMF or IMF policy. Working Papers describe research in progress by the author(s) and are published to elicit comments and to further debate.

2
Contents Page
I. Introduction ............................................................................................................................3
II. Convergence in Interest Rates and Equity Premia ................................................................7
III. Portfolio Holdings and Home Bias ....................................................................................12 3.1 Portfolio Holdings: Summary Statistics.....................................................12 3.2 Portfolio Holdings: Gravity Model Estimates ...........................................18 3.3 Home Bias ..................................................................................................22
IV. Risk-sharing and financial stability ...................................................................................27
4.1 Risk-sharing ...............................................................................................27 4.2 Financial Integration and Crises ................................................................30 4.3 Local vs. Foreign Investors: Recent Studies ..............................................31 4.4 Investor Behavior during the Subprime Crisis: Evidence from Brazil ......33
V. Conclusions .........................................................................................................................36
Tables
Table 1. List of Countries Used in the Various Sections of the Paper.......................................5
Table 2. Convergence in Equity Premia ..................................................................................11
Table 3. Convergence in Interest Rates ...................................................................................12
Table 4. Equity Security Holdings: Summary Statistics ..........................................................14
Table 5. Debt Securities Holdings: Summary Statistics ..........................................................16
Table 6. Equity and Debt Securities Holdings towards the U.S. and Japan ............................17
Table 7. Determinants of Bilateral Equity and Debt Holdings, 2001-2007.............................19
Table 8. Determinants of Bilateral Equity Holding by Group, 2001-2007 .............................21
Table 9. Determinants of Bilateral Debt Holding by Group, 2001-2007 ................................22
Table 10. Summary Statistics of Equity and Bond Home Bias ...............................................24
Table 11. Determinants of Average Bilateral Home Bias for Equities and Bonds ..................26
Table 12. Determinants of Dispersion in GDP and Consumption Growth..............................29
Figures
Figure 1. Dispersion in Equity Premia .......................................................................................8 Figure 2. Dispersion of the Interest Rates (in percent)………………………………………...9 Figure 3. Cross-country Dispersion in Output and Consumption Growth, 1971-2007 ...........28
Figure 4. Total Asset Holdings of Foreign Investors in Brazil, January 95 to May 09 ...........34
Figure 5. Portfolio Foreign Investment in Brazil, January 07 to May 09 ................................35
References ...............................................................................................................................39

3
I. INTRODUCTION
Financial integration has been prominent on the agenda of Asian policymakers over the last decade ―as a platform for regional development‖ and ―as a safeguard against the vagaries of the global market‖ (ADB 2008). This paper provides a selective survey and some new evidence on the extent of regional financial integration in Asia and compares it with the extent of Asian countries‘ global financial integration.
The drive toward regional financial integration in Asia was in large measure motivated by the financial crisis of 1997-98. The fact that a large share of corporate and bank liabilities were denominated in a foreign currency has been recognized as a major factor that contributed to the vulnerability of financial positions throughout Asian economies. A local bond market would be the natural environment to develop long-term, local-currency denominated debt instruments that would provide a more stable and reliable financing framework. Many Asian economists and policymakers have argued that an integrated Asian bond market would be valuable in achieving such a liability structure (see Ito and Park, 2004).
An integrated Asian bond market could bring about a number of benefits. It would help to increase the scale and liquidity of markets, reducing costs and improving the value of price signals, which would be especially valuable for the smaller economies in the region. It is not obvious, however, whether a regional market would provide the same strong support for local currency instruments that domestic markets do. In other words, would Asian investors reveal a consistent preference for Asian assets similar to the preference for domestic assets that domestic investors tend to show? The latter tendency has been termed ―home bias‖ in the economic literature. Would there be an equivalent ―regional bias‖ with the proper regional market infrastructure in place?
In this paper we investigate the degree of financial market integration in Asia, both equity and debt, and the strength of home and regional bias tendencies of Asian investors. In section 2, we look at the degree of integration of equity and bond markets as gauged by the convergence in equity premia and in interest rates across different countries. Standard economic theories suggest that as a group of countries becomes more financially integrated, dispersion in asset returns across countries should get smaller, cross-border flows should increase and home bias in investments should get smaller. The broad trends in cross-country dispersion suggest a fairly rapid progress towards convergence in Asian equity markets, broadly similar to that among Eastern European markets and more pronounced than trends toward convergence among Latin American markets. In the case of interest rates, convergence among Asian markets was already pretty high, but other regional groups have now caught up.
In section 3 we take a direct look at international investors‘ preferences by examining data for 2001 to 2007 from the Coordinated Portfolio Investment Survey (CPIS) that estimates international portfolio holdings by investors from 75 countries. We perform several tests of the extent of home bias and regional bias and benchmark tendencies in Asia with comparable evidence for Latin America and Eastern Europe as well as for a group of industrialized countries. Broadly speaking, Asia as a region appears slightly more ―home biased‖ than other regions as

4
concerns equity holdings, although this may be related to home bias in the individual countries towards their domestic stock markets rather than a preference for assets from the region.
Of course, financial integration is not an end in itself but is sought because it can confer benefits in the form of increased risk sharing and greater financial stability. In section 4, we show the extent of cross-country dispersion of consumption expenditures and GDP, which provides an indirect measure of the extent of market integration and risk sharing. If financial markets were fully integrated, and consumers across the world shared risks in an optimal way, economic theory would predict lower dispersion in consumption over time. The evidence suggests that while dispersion in consumption has declined, so has the cross-country dispersion in output.
In the Asian context, the case for greater regional integration is sometimes made by claiming that local investors provide a more stable basis for funds than investors outside the region. Hence, in section 4 of the paper, we also review studies of recent crisis episodes that have tried to establish the extent to which local — and regional — investors have in fact been less prone to financial panics and a source of stability in markets. We also examine the recent experience in one country, Brazil, which has had considerable success in shifting its finance sources to domestic markets, where foreign investors have filled the gap when local savings are insufficient. In recent months, the global financial crisis is testing the resilience of this model of financing based on local currency instruments issued in the home markets.
The list of countries used in the various sections of the paper is given in Table 1.

5
Table 1.List of Countries Used in the Various Sections of the Paper
(Except where indicated otherwise by a ‗x‘)
Section 2 Section 3 Section 4
Govt. Equity Consumption
Asia Interest Rates Premium CPIS GDP
China, People‘s Rep. of x Hong Kong, China x India Indonesia Japan Korea, Republic of Malaysia Pakistan Philippines Singapore x Sri Lanka x x x Taiwan x x Thailand Govt. Equity Consumption
Industrialized Interest Rates Premium CPIS GDP
Australia Austria Belgium Canada Denmark Finland France Germany Greece Iceland x x x Ireland x Italy Luxembourg x x x x Netherlands New Zealand Norway Portugal Spain Sweden Switzerland United Kingdom United States

6
Table 1 (continued) Section 2 Section 3 Section 4
Govt. Equity Consumption
Latin America Interest Rates Premium CPIS GDP
Argentina Barbados x x x Bermuda x x x x Bolivia x x x Brazil x Cayman Islands x x x x Chile Colombia Costa Rica x x Ecuador x x x El Salvador x x x Guatemala x x x Honduras x x x Mexico Nicaragua x x x Panama x x x x Paraguay x x x Peru x Uruguay x x Venezuela x x Govt. Equity Consumption
Eastern Europe Interest Rates Premium CPIS GDP
Bulgaria x Croatia x x Czech Republic x Estonia x Hungary x Kazakhstan x x x Latvia x Lithuania x x Poland x Romania x Russian Federation x Slovak Republic x Slovenia x x Ukraine x x x Govt. Equity Consumption
Other Interest Rates Premium CPIS GDP
Bahrain x x x Cyprus x x x Egypt x x Israel x x Kuwait x x x Lebanon x x x Malta x x x Mauritius x x

7
South Africa x x Turkey
II. CONVERGENCE IN INTEREST RATES AND EQUITY PREMIA
The typical approach to testing for integration in equity markets is to compute the pairwise correlations between stock indices for different countries and see if those correlations have increased over time (see ADB, 2008). Solnik and Roulet (2000) showed that the evolution of the cross-country dispersion of equity premia is inversely related to the pairwise correlations. Furthermore, as discussed in Adjaoute and Danthine (2004), convergence in equity premia is directly associated with convergence in the cost of capital.
Following De Nicolo and Ivaschenko (2008), we construct σ (t), the cross-country standard deviation (or dispersion) of equity premia, using monthly data on equity prices and the yield on short-term government securities for the 52 countries listed in Table 11. The equity premium is defined as the annualized rate of change in the equity prices minus the annualized yield on government securities at maturities ranging from one to three months, depending on the availability of data. The period covered is January 1984 to March 2009, though as indicated in Figures 1 and 2 some countries enter the sample at different points over this period.
The top panel of Figure 1 shows the evolution of σ(t) when available observations for all countries in the sample are used in computing the dispersion. Over the period as a whole dispersion in equity premia has averaged about 75 percent, albeit with sharp spikes. While there is no discernible linear downward trend overall, there was a marked decrease in dispersion during the period 2002 to mid-2007 that was dramatically reversed by the onset of the current financial crisis.
The other panels of Figure 1 show the evolution of σ(t) for specific country groups: Asia, industrialized countries, Latin America and Eastern Europe. The impression from these panels is that though convergence in equity premia may be taking place within these groups, the process is often interrupted by periods of unusual volatility, during which, within-group dispersion increases. After the Asian crisis of the late 1990s, the pace of regional convergence within Asia has been almost as fast as that for any other region. Overall, though, the Eastern European economies have converged to each other faster than any other group. Nevertheless, the present crisis has disrupted once again the convergence process within and across all regions.

8
Figure 1.Dispersion in Equity Premia (in percent) Figure 1. Dispersion in Equity Premia (in percent)
All Economies, Feb-84 to Mar-09
0
50
100
150
200
250
300
Feb-84
Feb-86
Feb-88
Feb-90
Feb-92
Feb-94
Feb-96
Feb-98
Feb-00
Feb-02
Feb-04
Feb-06
Feb-08
Percen
tage P
oints
Industrialized, Feb-84 to Mar-09
0
50
100
150
200
250
300
Feb-84
Feb-86
Feb-88
Feb-90
Feb-92
Feb-94
Feb-96
Feb-98
Feb-00
Feb-02
Feb-04
Feb-06
Feb-08
Percen
tage P
oints
Asia, Jan-90 to Mar-09
0
50
100
150
200
250
300
Jan-90
Jan-92
Jan-94
Jan-96
Jan-98
Jan-00
Jan-02
Jan-04
Jan-06
Jan-08
Percen
tage P
oints
Latin America, Jan-96 to Mar-09
0
50
100
150
200
250
300
Jan-96
Jan-98
Jan-00
Jan-02
Jan-04
Jan-06
Jan-08
Percen
tage P
oints
Eastern Europe, Jan-98 to Mar-09
0
50
100
150
200
250
300Jan
-98
Jan-00
Jan-02
Jan-04
Jan-06
Jan-08
Percen
tage P
oints
Note: In each panel we show the cross-country standard deviation in equity premia across the economies in the group, in percent, and a linear trendline.
Similarly, Figure 2 shows the cross-country dispersion in government interest rates. In the top panel, where we take into account available observations for all the economies in the sample, the dispersion in interest rates averaged 5% over the decade 1984-94, was elevated during the following years of the emerging market financial crises, and since 2002 has declined to below its pre-crisis average. Among the industrialized countries, dispersion has declined from an average of about 5% to about 1%. Among the Asian economies, dispersion has averaged about 4%, well below the heights observed during the time of crises in the 1990s. Since 2002, dispersion in Asia declined to about 2%, before rising again during the present financial crisis. Latin America and Eastern Europe display a qualitatively similar pattern: dispersion has fallen from very high levels in the mid-1990s to much lower levels in recent years. In the case of Latin America, the decline has been from about 16% to 4%; for Eastern Europe, the decline has been more dramatic—from 35% to 1.5%, before increasing again with the onset of the crisis.

9
Figure 2.Dispersion of the Interest Rates (in percent) Figure 2. Dispersion of Interest Rates (in percent)
All Economies, Jan-84 to Mar-09
0
10
20
30
40
50
60Ja
n-84
Jan-
86
Jan-
88
Jan-
90
Jan-
92
Jan-
94
Jan-
96
Jan-
98
Jan-
00
Jan-
02
Jan-
04
Jan-
06
Jan-
08
Perce
nt
Industrialized, Jan-84 to Mar-09
0
2
4
6
8
10
12
14
16
Jan-
84
Jan-
86
Jan-
88
Jan-
90
Jan-
92
Jan-
94
Jan-
96
Jan-
98
Jan-
00
Jan-
02
Jan-
04
Jan-
06
Jan-
08
Perce
nt
Asia, Jan-84 to Mar-09
0
2
4
6
8
10
12
14
16
Jan-
84
Jan-
86
Jan-
88
Jan-
90
Jan-
92
Jan-
94
Jan-
96
Jan-
98
Jan-
00
Jan-
02
Jan-
04
Jan-
06
Jan-
08
Perce
nt
Latin America, Jan-94 to Mar-09
02468
101214161820
Jan-
94
Jan-
96
Jan-
98
Jan-
00
Jan-
02
Jan-
04
Jan-
06
Jan-
08
Perce
nt
Eastern Europe, Jan-96 to Mar-09
0
10
20
30
40
50
60
70
Jan-
96
Jan-
98
Jan-
00
Jan-
02
Jan-
04
Jan-
06
Jan-
08
Perce
nt
Note: In each panel we show the standard deviation in government interest rates across the economies in the group, in percent. For the group of all economies and Asia we also show a linear trendline. For the other groups we show a quadratic trendline.

10
Tables 2 and 3 confirm the visual impression given by these figures. We estimate regressions along the lines of equation (1) for the dispersion in equity premia in table 2, and for the dispersion in interest rates in table 3: σ (t) = A0 + A1 σ (t-1) + A2 σ (t-2) + A3 Z (t) + A4 TREND (1) Z (t) is a vector of controls to be described below. Convergence in equity premia or in interest rates occurs if A4 is negative.
We include in the vector of controls Z(t) two indicators to reflect periods of unusual volatility. The first indicator is VIX, a measure of the implied volatility of S&P 500 index options.2 The second, CRISIS, is an indicator of the number of banking, currency and sovereign debt crises that occurred throughout the world in a given year, taken from Laeven and Valencia (2008). A third control is the cross-section MEAN of either the equity premia or the interest rates, depending on the dependent variable of the regression.
The regression results for dispersion in equity premia are given in Table 2. VIX is crucial in accounting for the dispersion in equity premia for the group of all countries as well as for all four individual country groups: periods of higher volatility are associated with higher cross-section dispersion. On the other hand, the mean equity premium is not significant in any of the regressions. CRISIS is significant in the All countries sample, or Asia, [columns (1) and (3) respectively], but not for the other groups. Notice that the estimated trend decline in dispersion is faster in Eastern Europe [column (5)], then Asia [column (3)], the Industrialized countries [column (2)], and, finally, Latin America [column (4)]. Trend decline would be even faster in the case of Eastern Europe, but for the effects of the ongoing financial crisis.3

11
Table 2.Convergence in Equity Premia
All countries Industrialized Asia Latin America E. Europe
(1) (2) (3) (4) (5)
Log Dispersion in EqPrem(t-1) 0.186*** 0.153** 0.194** 0.0875 0.122(0.058) (0.059) (0.081) (0.080) (0.079)
Log Dispersion in EqPrem(t-2) 0.105* 0.0635 0.0669 0.0295 0.0681(0.057) (0.057) (0.080) (0.080) (0.079)
VIX 0.0116*** 0.0182*** 0.0162*** 0.0131** 0.0173***(0.0025) (0.0033) (0.0042) (0.0050) (0.0049)
Cross-section Mean Equity Premium -0.000462 -0.000296 0.000197 -0.0000949 0.0000346(0.00028) (0.00039) (0.00044) (0.00063) (0.00042)
Crisis 0.0242*** -0.00518 0.0371** 0.00724 -0.0297*(0.0052) (0.024) (0.015) (0.019) (0.017)
Time trend -0.0000806 -0.00162*** -0.00231*** -0.00148* -0.00278***(0.00022) (0.00028) (0.00080) (0.00084) (0.00076)
Constant 2.620*** 2.742*** 2.912*** 3.301*** 3.469***(0.27) (0.27) (0.41) (0.43) (0.45)
Observations 279 279 159 159 159
R-squared 0.41 0.39 0.44 0.11 0.27
Sample Period Jan. 1986 Jan. 1986 Jan. 1996 Jan. 1996 Jan. 1996to Mar. 2009 to Mar. 2009 to Mar. 2009 to Mar. 2009 to Mar. 2009
Note: *,** and *** indicate signficance at, or below the 10%, 5% and 1% levels respectively.
Robust standard errors are reported in parentheses.
Dependent variable: Log of Dispersion in Equity Premia
The regression results for dispersion in interest rates are given in Table 3. In contrast to
the results for dispersion in equity premia, VIX is significant only for the Asian and East European country groups, whereas the mean interest rate is very significant in all regressions. In this case, a quadratic trend provided a better fit than a linear trend. The results suggest a drop in dispersion in Asia and Eastern Europe [columns (4) and (5)] over the last decade. In the case of industrialized countries and for Latin America, despite the visual impression conveyed by Figure 2, it appears that there is no decline in dispersion, once we control for the shift in the cross-section mean of interest rates.

12
Table 3.Convergence in Interest Rates
All countries Industrialized Asia Latin America E. Europe
(1) (2) (3) (4) (5)
Log Dispersion in Int Rates (t-1) 0.992*** 0.842*** 0.347*** 0.823*** 0.612***(0.060) (0.060) (0.069) (0.080) (0.076)
Log Dispersion in Int Rates (t-2) -0.120** 0.0823 0.250*** 0.0510 0.0205(0.057) (0.060) (0.063) (0.081) (0.068)
VIX 0.00153 -0.000891 0.00572*** 0.000787 0.0109***(0.00095) (0.00062) (0.0013) (0.00099) (0.0018)
Cross-section Mean Interest Rate 0.0383*** 0.0150*** 0.101*** 0.00992** 0.0410***(0.0058) (0.0045) (0.011) (0.0045) (0.0049)
Crisis -0.00465*** -0.0187*** -0.0173*** 0.00229 -0.00694(0.0017) (0.0064) (0.0064) (0.0048) (0.0077)
Time trend 0.00126** 0.000123 0.00650*** 0.00107 0.0118***(0.00050) (0.00056) (0.0013) (0.0011) (0.0024)
Time trend squared -0.00000328* 0.0000000826 -0.0000349*** -0.00000622 -0.0000716***(0.0000019) (0.0000014) (0.0000068) (0.0000054) (0.000012)
Constant -0.159*** -0.0484 -0.353*** 0.0999 -0.401**(0.050) (0.077) (0.100) (0.11) (0.17)
Observations 279 279 159 159 159
R-squared 0.97 0.98 0.94 0.95 0.98
Sample Period Jan. 1986 Jan. 1986 Jan. 1996 Jan. 1996 Jan. 1996to Mar. 2009 to Mar. 2009 to Mar. 2009 to Mar. 2009 to Mar. 2009
Note: *,** and *** indicate signficance at, or below the 10%, 5% and 1% levels respectively.
Robust standard errors are reported in parentheses.
Dependent variable: Log of Dispersion in Interest Rates
III. PORTFOLIO HOLDINGS AND HOME BIAS
3.1 Portfolio Holdings: Summary Statistics
We follow Kim, Lee and Shin (2006) in using the Coordinated Portfolio Investment Survey (CPIS) to study the cross-border portfolio holdings among countries. The CPIS provides information on a country‘s portfolio holdings of foreign equity securities and debt securities, valued at market prices, classified by the economy of residence of the issuer of the securities. Participation in the CPIS is voluntary and some 75 economies currently participate in the survey. Though the CPIS was initiated in 1997, it was expanded significantly in 2001 and data are available annually since that year. The data used in this paper are from 2001 to 2007, the latest year available.4

13
Table 4 provides summary statistics on the pattern of cross-border flows from each of the 10 Asian economies in our sample for year-end 2007. Each row shows the share of the holdings accounted for by the four major groups of economies that we have used thus far in this paper, viz., Industrialized, Asia, Latin America and Eastern Europe, and to a fifth group of Other countries, which are mostly emerging markets. Also shown, in the last column of the table, is the total year-end holding in millions of US dollars.
The size of the holdings varies enormously across the Asian countries, ranging from roughly $500 billion for Japan to $5 million for Pakistan. There is also considerable heterogeneity in the distribution of holdings across country groups. Several countries—such as Singapore, Malaysia and the Republic of Korea (hereafter Korea)—are making significant equity investments within Asia.5 The simple (equally-weighted) average shows that nearly 40% of investments are within Asia, but the average drops to just over 20% if each country‘s numbers are weighted by the size of its holdings. This is higher than the corresponding figures for Latin America and Eastern Europe; as shown in the table, on a weighted basis the respective figures are about 12% for Latin America and 14% for Eastern Europe. Of course, all three regional groups differ considerably from the pattern for the Industrialized countries, where on a weighted basis 75% of the investments are within that group of countries. In this sense, all three regions have a fair distance to go before they approach the industrialized country benchmark.

14
Table 4.Equity Security Holdings: Summary Statistics
Latin Eastern In mill US$Investor Economy Industrialized Asia America Europe Other Total
Asia
Hong Kong, China 0.7751 0.2231 0.0002 0.0003 0.0012 105,047.0
India 0.3036 0.5187 0.0572 0.0156 0.1051 236.7
Indonesia 0.0343 0.9656 0.0001 0.0000 0.0000 507.4
Japan 0.8889 0.0821 0.0146 0.0096 0.0049 479,145.3
Korea, Republic of 0.4077 0.5170 0.0534 0.0127 0.0092 79,073.8
Malaysia 0.2600 0.7291 0.0023 0.0002 0.0084 7,150.8
Pakistan 0.9788 0.0000 0.0000 0.0000 0.0212 5.0
Philippines 0.9546 0.0454 0.0000 0.0000 0.0000 115.4
Singapore 0.3992 0.5825 0.0088 0.0045 0.0051 92,625.6
Thailand 0.8189 0.1811 0.0000 0.0000 0.0000 2,209.7
Average 0.5821 0.3845 0.0136 0.0043 0.0155
Weighted average 0.7576 0.2139 0.0158 0.0079 0.0049
Latin America
Average 0.9034 0.0107 0.0841 0.0005 0.0014
Weighted average 0.8604 0.0123 0.1258 0.0006 0.0007
Eastern Europe
Average 0.7687 0.0155 0.0021 0.1838 0.0299
Weighted average 0.7819 0.0168 0.0005 0.1415 0.0592
Industrialized countries
Average 0.8529 0.0957 0.0155 0.0218 0.0141
Weighted average 0.7508 0.1737 0.0379 0.0195 0.0181
Issuer Economy Group
Investment in Equity Securities from the Investor Economy to the Issuer Economy Groups in 2007
As a Ratio of the Total Invested by the Investor Economy

15
Table 5 presents a similar set of summary statistics for cross-border debt holdings. As with equity, several Asian countries hold a significant share of their overall debt portfolios in the form of within-region investments; Singapore, for instance, holds 30% of international debt in within-Asia investments. The simple average of within-Asia investments is 15%. On a weighted basis, however, the average drops to less than 7% because Japan‘s $1.4 trillion investments are largely held outside of Asia. The weighted average is in the ballpark of the corresponding figures for Eastern Europe and Latin America but much lower than the industrialized country benchmark.
To summarize, the extent of regional financial integration within Asia, using cross-border portfolio investments as an indicator, is broadly similar to that in other regional groups but far below the industrialized country average.

16
Table 5.Debt Securities Holdings: Summary Statistics
Latin Eastern In mill US$Investor Economy Industrialized Asia America Europe Other Total
Asia
Hong Kong, China 0.7799 0.2101 0.0018 0.0019 0.0062 205,591.0
India 1.0000 0.0000 0.0000 0.0000 0.0000 5.7
Indonesia 0.6563 0.2368 0.0000 0.0000 0.1069 1,350.0
Japan 0.9706 0.0140 0.0067 0.0061 0.0026 1,363,105.9
Korea, Republic of 0.9048 0.0710 0.0111 0.0113 0.0018 45,986.6
Malaysia 0.5741 0.3778 0.0000 0.0011 0.0470 2,006.7
Pakistan 0.9996 0.0004 0.0000 0.0000 0.0000 214.7
Philippines 0.7977 0.2023 0.0000 0.0000 0.0000 4,880.9
Singapore 0.6946 0.3003 0.0017 0.0015 0.0020 168,745.9
Thailand 0.8807 0.0938 0.0073 0.0034 0.0148 10,659.2
Average 0.8258 0.1506 0.0029 0.0025 0.0181
Weighted average 0.9197 0.0662 0.0058 0.0053 0.0031
Latin America
Average 0.8631 0.0519 0.0844 0.0001 0.0005
Weighted average 0.8961 0.0678 0.0358 0.0000 0.0002
Eastern Europe
Average 0.8640 0.0091 0.0050 0.0962 0.0257
Weighted average 0.9003 0.0206 0.0019 0.0523 0.0249
Industrialized countries
Average 0.9390 0.0285 0.0113 0.0143 0.0068
Weighted average 0.9372 0.0291 0.0130 0.0131 0.0075
Issuer Economy Group
Investment in Debt Securities from the Investor Economy to the Issuer Economy Groups in 2007
As a Ratio of the Total Invested by the Investor Economy
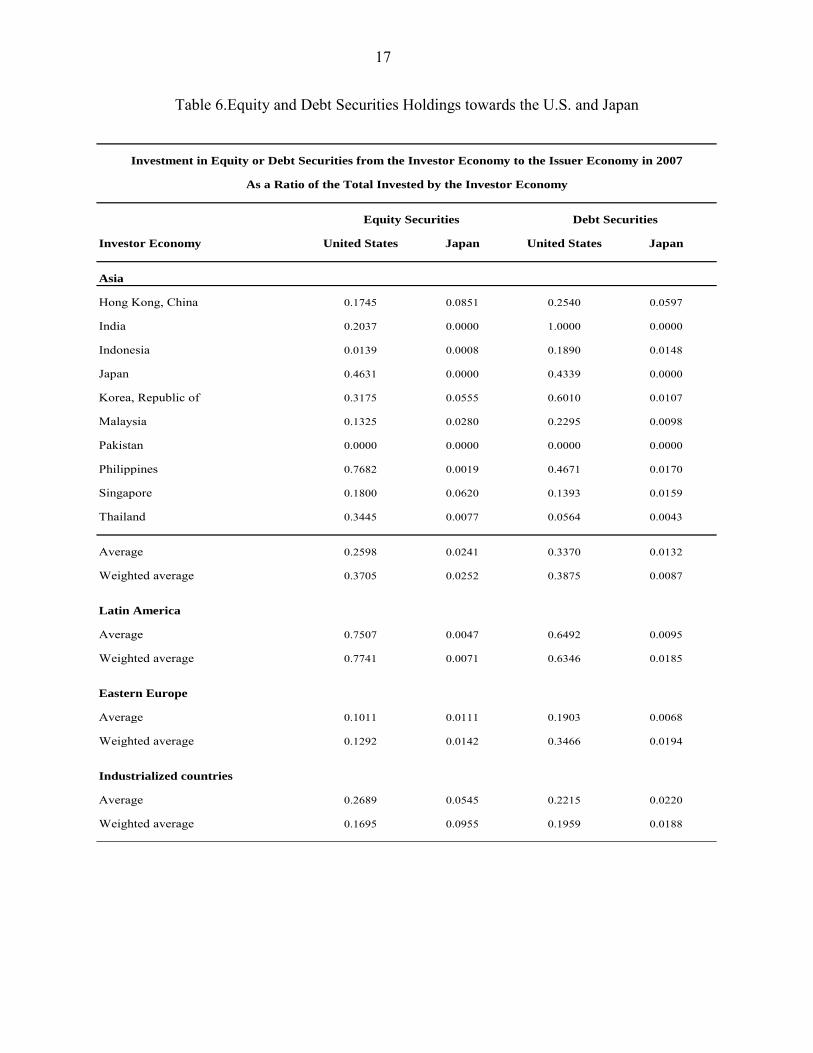
Table 6 shows the relative shares of US and Japanese assets at end-2007 in equity and
debt holdings of Asian countries. It is evident that the US looms large in the portfolio allocation of Asian countries (including that of Japan itself) relative to Japan. For equity holdings, only Hong Kong, China, Singapore and Korea have a share of greater than 5% of their portfolios in Japanese assets, while for debt only Hong Kong, China‘s holdings exceed 5%. Some countries such as the Philippines display a very marked tilt towards US assets.
17
Table 6.Equity and Debt Securities Holdings towards the U.S. and Japan
Investor Economy United States Japan United States Japan
Asia
Hong Kong, China 0.1745 0.0851 0.2540 0.0597
India 0.2037 0.0000 1.0000 0.0000
Indonesia 0.0139 0.0008 0.1890 0.0148
Japan 0.4631 0.0000 0.4339 0.0000
Korea, Republic of 0.3175 0.0555 0.6010 0.0107
Malaysia 0.1325 0.0280 0.2295 0.0098
Pakistan 0.0000 0.0000 0.0000 0.0000
Philippines 0.7682 0.0019 0.4671 0.0170
Singapore 0.1800 0.0620 0.1393 0.0159
Thailand 0.3445 0.0077 0.0564 0.0043
Average 0.2598 0.0241 0.3370 0.0132
Weighted average 0.3705 0.0252 0.3875 0.0087
Latin America
Average 0.7507 0.0047 0.6492 0.0095
Weighted average 0.7741 0.0071 0.6346 0.0185
Eastern Europe
Average 0.1011 0.0111 0.1903 0.0068
Weighted average 0.1292 0.0142 0.3466 0.0194
Industrialized countries
Average 0.2689 0.0545 0.2215 0.0220
Weighted average 0.1695 0.0955 0.1959 0.0188
Investment in Equity or Debt Securities from the Investor Economy to the Issuer Economy in 2007
As a Ratio of the Total Invested by the Investor Economy
Equity Securities Debt Securities

18
3.2 Portfolio Holdings: Gravity Model Estimates
To investigate further these trends in regional vs. global integration, we next estimate a gravity model using these data.6 The dependent variable is the bilateral investment holding between countries in our sample. Following Kim, Lee and Shin (2006) we pool the data for all years from 2001 to 2007. The independent variables are a mix of time-varying and time-invariant ones. The former set comprises the product of real GDP and the product of real per capita GDP of the investor and issuer countries. The latter set was taken from Rose (2005) and includes: (a) the distance between countries; (b) three (0,1) dummy variables to indicate whether they share a common border, if one of them is an island, and if they have a regional trade agreement; and (c) the bilateral trade between them in 1998.
In addition to these standard determinants, we follow Fidora, Fratzcher and Thimann (2007) in including the real exchange rate volatility as an additional variable. From the point of view of a domestic investor, real exchange rate volatility adds to the volatility of the return of foreign assets, and reduces their appeal. Fidora et al expect this effect to be stronger for bonds than stocks because bond returns are normally less volatile than stock returns and thus the increase in volatility coming from the exchange rate would be relatively more important.
Columns (1) and (3) in Table 7 present the results from estimating the gravity model for cross-border bilateral equity and debt holdings. As in several previous studies, the estimates have the expected sign and nearly all are statistically significant. Bilateral holdings rise with the product of GDPs, the product of per capita GDP and the strength of trading links between the countries. Real exchange rate volatility lowers holdings, as conjectured by Fidora et al. One interesting finding is that distance appears to matter far more for debt holdings than for equity.7
To investigate regional financial integration among Asian countries, and to compare it to trends outside Asia, we follow an empirical strategy suggested by Kim, Lee and Shin (2006). This consists of adding to the basic gravity model specification some dummy variables that are defined as follows: the (0,1) variable Asia_Single takes the value 1 if either the investor or issuer country belongs to Asia, whereas the (0,1) variable Asia_Pair takes on the value 1 if both countries belong to Asia. The difference in the estimated coefficients of these two dummies can measure the difference between the level of integration of these economies among themselves relative to their level of integration with the rest of the world. Furthermore, constructing dummy variables for the other goupings in a similar manner, we examine how Asia compares in this respect to the other regions.8
As shown in column (2), neither Asia_Single nor Asia_Pair is significant in the equity holdings equation. This is in contrast to the Industrialized or Eastern European economies‘ case, where the corresponding Pair dummy has a large and significantly positive coefficient. In other words, we fail to detect, according to this test, a preference among Asian economies for each other‘s equity holdings that is above the sample average, unlike what may be happening in other regions. A similar result for debt holdings is shown in column (4). Here again, the coefficients for the Asia dummies, Single or Pair, are insignificant whereas the coefficient for the Industrialized_Pair is positive and very significant.9

19
Table 7.Determinants of Bilateral Equity and Debt Holdings, 2001-2007
(1) (2) (3) (4)
Product of GDPs (log) 0.488*** 0.490*** 0.462*** 0.430***(0.11) (0.11) (0.083) (0.091)
Product of per capita GDP (log) 0.904*** 0.772*** 0.679*** 0.517***(0.11) (0.14) (0.072) (0.11)
Distance (log) -0.187 0.146 -0.379*** -0.256*(0.17) (0.15) (0.12) (0.13)
Common Language 0.909*** 0.894*** 0.0506 0.0888(0.33) (0.28) (0.21) (0.24)
Island 0.564* 0.487 0.802*** 0.968***(0.33) (0.31) (0.22) (0.31)
Regional Trade Agreement 0.537 0.683** 1.095*** 0.591**(0.39) (0.32) (0.28) (0.25)
Bilateral Trade (log) 0.510*** 0.504*** 0.328*** 0.377***(0.099) (0.10) (0.072) (0.071)
Real Exchange Rate Volatility (Log) -0.661** -0.294 -0.890*** -0.891***(0.30) (0.27) (0.22) (0.21)
Asia_Single -0.584 -0.442(0.42) (0.37)
Asia_Pair 0.0347 0.122(0.78) (0.58)
Industrialized_Single 0.211 0.211(0.50) (0.39)
Industrialized_Pair 0.761* 0.979**(0.44) (0.43)
LatAm_Single -1.523*** 0.0608(0.55) (0.40)
LatAm_Pair -0.370 -0.107(1.36) (0.58)
EEurope_Single -0.136 0.0330(0.52) (0.37)
EEurope_Pair 1.557** 0.330(0.78) (0.50)
Constant -16.05*** -16.51*** -9.968*** -10.99***(2.40) (2.61) (1.71) (1.86)
Observations 10815 10815 11545 11545R-square overall 0.571 0.597 0.596 0.607Year Fixed Effects Yes Yes Yes Yes
Note: *,** and *** indicate signficance at, or below the 10%, 5% and 1% levels respectively. Robust standard errors corrected for clustering by the investor economy are reported in parentheses.
Dependent Variable:
Log of Equity Holdings Log of Bond Holdings
We also looked for regional differences by estimating the gravity model separately for
groups of countries classified by the investor economy. Table 8 presents the results for equity holdings and Table 9 presents the results for bond holdings. With the loss in cross-country variation that comes with estimating the regression for smaller sub-samples, variables that remain consistently significant are the product of per capita GDPs (with the exception of of the

20
debt holdings regression for E. Europe) and the extent of bilateral trade(with the exception of the debt holdings regression for Latin America). The last decade has been marked by a strong increase in the number of regional trade agreements in the Asia-Pacific region. While the impact of regional trade agreements on both cross-border Asian equity and debt holdings is positive, it is not precisely measured.10
The results suggest that there is scope in future work to look for specific determinants that may matter for individual country groups. In the case of Asia, the role of foreign direct investment, the effects of the presence of financial centers, the impact of China‘s gravitational pull, and the role played by the overseas Chinese community may be worth investigating.

21
Table 8.Determinants of Bilateral Equity Holding by Group, 2001-2007
(Based on the Investor Economy)
Asia Industrialized Latin America E. Europe
(1) (2) (3) (4)
Product of GDPs (log) 0.149 0.642*** 0.628* 0.269(0.22) (0.089) (0.33) (0.21)
Product of per capita GDP (log) 1.027*** 0.847*** 0.406* 0.413*(0.14) (0.078) (0.23) (0.23)
Distance (log) -0.664*** 0.0246 -0.440 -0.312(0.25) (0.14) (0.62) (0.20)
Common Language 0.453 0.681*** -0.434(0.37) (0.22) (1.28)
Island 0.730* 0.0897 -1.002* -0.276(0.44) (0.18) (0.56) (0.69)
Regional Trade Agreement 0.802 -0.0502 1.109(0.61) (0.34) (1.12)
Bilateral Trade (log) 0.651*** 0.622*** 0.540** 0.352*(0.24) (0.12) (0.26) (0.20)
Real Exchange Rate Volatility (Log) -0.647 -0.218* -0.953 -0.216(0.60) (0.12) (0.96) (0.44)
Constant -11.55*** -17.10*** -15.51** -8.474***(3.80) (1.74) (6.19) (1.72)
Observations 1504 5729 912 1416
R-square overall 0.603 0.709 0.423 0.302
Year Fixed Effects Yes Yes Yes Yes
Note: *,** and *** indicate signficance at, or below the 10%, 5% and 1% levels respectively.
Robust standard errors corrected for clustering by the investor economy are reported in parentheses.
Dependent Variable: Log of Bilateral Equity Holdings

22
Table 9.Determinants of Bilateral Debt Holding by Group, 2001-2007 (Based on the Investor Economy)
Asia Industrialized Latin America E. Europe
(1) (2) (3) (4)
Product of GDPs (log) 0.242 0.760*** 0.283** 0.349***(0.19) (0.10) (0.12) (0.12)
Product of per capita GDP (log) 0.810*** 0.597*** 0.754*** 0.140(0.18) (0.11) (0.21) (0.19)
Distance (log) -0.0673 -0.626*** -0.839*** -0.334*(0.41) (0.14) (0.24) (0.20)
Common Language 0.0691 -0.169 0.337(0.42) (0.28) (0.49)
Island 0.981** 0.123 -0.583 0.473***(0.40) (0.34) (0.46) (0.16)
Regional Trade Agreement 0.381 1.101*** 0.758(0.72) (0.30) (0.73)
Bilateral Trade (log) 0.499*** 0.281** 0.170 0.242**(0.19) (0.12) (0.11) (0.094)
Real Exchange Rate Volatility (Log) -0.463 -0.199 -1.570** -1.102***(0.34) (0.16) (0.69) (0.29)
Constant -11.39** -6.792*** -5.042 -8.025***(5.02) (1.91) (3.72) (1.79)
Observations 1662 5770 1150 1492
R-square overall 0.607 0.677 0.312 0.314
Year Fixed Effects Yes Yes Yes Yes
Note: *,** and *** indicate signficance at, or below the 10%, 5% and 1% levels respectively.
Robust standard errors corrected for clustering by the investor economy are reported in parentheses.
Dependent Variable: Log of Bilateral Bond Holdings
3.3 Home Bias
There is a large literature on the determinants of home bias in cross-border financial flows; see Fidora et al (2007) for a recent example. The determinants tend to fall into two clusters: (i) variables that capture the barriers to flows imposed by geography and by information frictions (e.g. distance; lack of a common language); (ii) variables that capture barriers imposed by policies and institutions (e.g. capital controls; transparency; political risk). In our work thus

23
far in this paper we have focused mainly on the first set of variables, though studies have found the second set to be important as well and hence they should be included in a fuller investigation.11
Following Fidora et al (2007)and others in the literature, we compute home bias by comparing actual portfolio allocations to those predicted by a simple benchmark, viz., the share of a country‘s market capitalization in the world market. Hence, home bias ―measures the degree to which investors in a given country are overweight in domestic assets and underweight in international assets, as compared to the benchmark portfolio that would weigh home and foreign assets, according to the respective shares in the global financial market‖ (Fidora et al, p. 635).
Let wi* denote the market weight of the rest of the world seen from the perspective of
country i and wi denote the share of international assets in the country‘s portfolio. Then, home bias is given by: HBi = 1 - (wi/ wi
*) (2) Similarly, bilateral home bias can be computed by comparing wij, the actual allocation of financial assets of country i vis-à-vis country j with the benchmark weight:
HBij = 1 - (wij/ wj*) (3)
With full international diversification, wij equals wj
* and home bias is zero; if investors from country i do not hold any of country j‘s assets, home bias against that country is 1.
Table 10 provides summary statistics on the home bias indices for the Asian economies in our sample, and the regional groups. In particular, for each investor economy in Asia, the table shows the 2001-2007 average home bias towards the five regional groups. Regarding bias in equities holdings (Panel A), the Asian economies seem very home-biased towards the industrialized group, with the exception of Singapore and the Philippines. With the exception of Japan and the Philippines, they tend to be slightly less home-biased towards other Asian ecconomies than they are towards the industrialized ones. When we compare the Asian regional average to that of the other groups, Asia shows a lower regional home bias than Latin America (.841 vs. .907) but not as low as that of Eastern Europe (.755) or the industrialized countries (.617).
Panel B of Table 10 presents the corresponding set of statistics for home bias in bond holdings. In general, home bias in bonds tends to be below home bias in equities. Most numbers in this panel are lower than the corresponding entries in Panel A. Notice again, that some Asian economies, such as Hong Kong, China, Indonesia or the Philippines are significantly less home- biased in bond holdings than other Asian economies, towards either the industrialized, or the Asian group. With respect to the regional averages at the bottom of the panel, Asia is the second less home-biased region in bond holdings (.791), after the Industrialized (.512), but before Latin America (.851) or Eastern Europe (.879)

24
Table 10.Summary Statistics of Equity and Bond Home Bias
Latin EasternInvestor Economy Industrialized Asia America Europe Other
Hong Kong, China 0.933 0.896 1.000 1.000 1.000
India 1.000 1.000 0.999 1.000 1.000
Indonesia 0.960 0.903 1.000 1.000 0.648
Japan 0.951 0.994 0.999 1.000 1.000
Korea, Republic of 0.966 0.938 0.995 0.998 0.999
Malaysia 0.973 0.829 0.999 1.000 0.994
Pakistan 0.915 0.928
Philippines 0.857 0.978
Singapore 0.754 0.100 0.952 0.977 0.926
Thailand 0.949 0.931 1.000 1.000 0.998
Asia Average 0.926 0.841 0.993 0.997 0.943
Industrialized Average 0.617 0.782 0.963 0.950 0.941
Latin America Average 0.781 0.853 0.907 0.970 0.909
Eastern Europe Average 0.628 0.865 0.881 0.755 0.872
Other Countries Average 0.774 0.894 0.833 0.921 0.795
Latin EasternInvestor Economy Industrialized Asia America Europe Other
Hong Kong, China (*) 0.613 0.347 0.884 0.828 0.779
India 0.998 1.000 1.000
Indonesia 0.524 0.633 0.691 0.996 1.000
Japan 0.959 0.999 0.999 1.000 1.000
Korea, Republic of 0.926 0.982 0.998 0.999 1.000
Malaysia 0.789 0.895 0.985 0.993 0.972
Pakistan 0.923 0.982 0.976
Philippines 0.501 0.421 0.841 0.545 0.882
Singapore (*) 0.649 0.918 0.982 0.965 0.888
Thailand 0.799 0.730 0.988 0.996 0.947
Asia Average (*) 0.768 0.791 0.921 0.915 0.944
Industrialized Average 0.512 0.956 0.965 0.958 0.984
Latin America Average 0.800 0.978 0.851 0.971 0.977
Eastern Europe Average 0.677 0.939 0.895 0.879 0.963
Other Countries Average 0.836 0.658 0.688 0.742 0.916
Issuer Country Group
Panel A. Equity Investment Home Bias, Average 2001-2007
Panel B. Debt Investment Home Bias, Average 2001-2007 (*)
Note: In panel B, due to data limitations, we report the average 2001-06 rather than 2001-07 for Hong Kong, Chinaand Singapore. Consequently the Asia Average takes into account of these 2001-06 values for these two countries,but relies on the 2001-07 values reported for the rest of the group.
Issuer Economy Group
In Table 11, we examine the determinants of the 2001-2007 average bilateral home bias in our sample. Looking across the columns of the table, the standard gravity variables come in

25
with the expected signs and are statistically significant in most cases. In addition, as in Fidora et al (2007), real exchange rate volatility raises home bias and the effect is larger for bonds than for equities. Then, in columns (2) and (4), we add to the basic specifications the regional dummies that we discussed before. As shown in column (2), bilateral equity home bias is higher, if either, or both, the investor and issuer economies are in Asia, in contrast to the industrialized group. In the case of the average bilateral home bias in bond holdings, in column (4), we detect, ceteris paribus, an increased home bias when one of the economies in the pair, investor or issuer, is in Asia, but not both. In contrast, pairs of Latin American or Eastern European economies seem less (bilaterally) home biased in bond holdings than the rest.12

26
Table 11.Determinants of Average Bilateral Home Bias for Equities and Bonds
(1) (2) (3) (4)
Product of GDPs (log) 0.0341*** 0.0297*** 0.0781*** 0.0605***(0.010) (0.011) (0.013) (0.013)
Product of per capita GDP (log) -0.0669*** -0.0547*** -0.0829*** -0.0877***(0.0072) (0.0089) (0.0092) (0.012)
Distance (log) 0.0865*** 0.0647*** 0.0766*** 0.0306(0.015) (0.020) (0.020) (0.024)
Common Language -0.0757** -0.111*** -0.0874** -0.0661(0.034) (0.037) (0.042) (0.045)
Island -0.0724*** -0.130*** -0.125*** -0.168***(0.024) (0.025) (0.029) (0.031)
Regional Trade Agreement -0.0153 0.0268 -0.0392 -0.0267(0.058) (0.067) (0.063) (0.073)
Bilateral Trade (log) -0.0293*** -0.0400*** -0.0452*** -0.0481***(0.0090) (0.0097) (0.012) (0.013)
Real Exchange Rate Volatility (Log) 0.0902*** 0.118*** 0.136*** 0.218***(0.022) (0.026) (0.027) (0.031)
Asia_Single 0.0853*** 0.193***(0.033) (0.041)
Asia_Pair 0.138** -0.0658(0.057) (0.086)
Industrialized_Single -0.00255 0.0437(0.029) (0.042)
Industrialized_Pair -0.0824 0.125**(0.054) (0.060)
LatAm_Single -0.0835** -0.0363(0.034) (0.044)
LatAm_Pair 0.0167 -0.262**(0.081) (0.11)
EEurope_Single -0.0563* 0.0128(0.030) (0.039)
EEurope_Pair -0.204*** -0.257***(0.077) (0.092)
Constant 0.704*** 1.167*** 0.682*** 1.517***(0.17) (0.21) (0.22) (0.26)
Observations 2840 2840 2871 2871
F-Statistics (Prob>F) 50.74 (.000) 29.30 (.000) 64.45 (.000) 38.18 (.000)
Note: *,** and *** indicate signficance at, or below the 10%, 5% and 1% levels respectively. Robust standard errors are reported in parentheses.
Bilateral Home Bias in Equities Bilateral Home Bias in BondsDependent Variable: Average over 2001-2007 of
27
IV. RISK-SHARING AND FINANCIAL STABILITY
4.1 Risk-sharing
Standard theory predicts that financial integration should be reflected in higher cross-country correlations in consumption and lower cross-country correlations in output (Backus, Kehoe and Kydland (1994), Lewis (1999). It should also lower correlations between domestic saving and domestic investment (Feldstein and Horioka 1980).
Imbs (2006) presents empirical evidence for a large panel of countries that financial integration (which he measures using CPIS data for 2001) does raise cross-country consumption correlations, indicating increased risk sharing. However, puzzlingly from the perspective of the theory, financial integration also raises cross-country output correlations. Kose, Prasad and Terrones (2007) argue that any increase in international risk sharing is modest and well below the levels suggested by theory; moreover, the gains in risk sharing thus far have accrued largely to industrialized countries. Bekaert, Harvey and Lundblad (2006) find that financial liberalization is associated with lower consumption growth volatility, but that the effect is weaker for emerging market countries. For the Asian economies, the thrust of this evidence raises some doubts about whether financial integration is conferring some of the ultimate benefits that is expected to confer. The Asia-specific literature on this issue delivers somewhat mixed results (see Kim and Lee, 2008; Kim, Kim and Wang, 2006; Kim, Oh and Jeong, 2005).
Following our approach in section 2, we rely on cross-country dispersions of output and consumption growth to provide some evidence on the degree of risk sharing in Asia compared to other regional groups. Figure 3, indicating a decline in the dispersion of consumption growth, shows that there is some evidence for increased risk sharing among countries. However, consistent with the literature review, there is also a decline in dispersion in output growth.

28
Figure 3.Cross-country Dispersion in Output and Consumption Growth, 1971-2007 Figure 3. Cross-country Dispersion in Output and Consumption Growth, 1971-2007
All Economies
0
2
4
6
8
10
12
71 77 83 89 95 01 07
Perc
ent
Industrialized
0
2
4
6
8
10
12
71 77 83 89 95 01 07
Perc
ent
Asia
0
2
4
6
8
10
12
71 77 83 89 95 01 07
Perc
ent
Latin America
0
2
4
6
8
10
12
71 77 83 89 95 01 07
Perc
ent
Note: In each panel we show in black the standard deviation of GDP growth across the economies in the group and the associated linear trendline. We show in grey the standard deviation of consumption growth and the corresponding linear trendline.

29
Then in table 12, we show that regressions of the kind presented earlier for the dispersion in equity premia and interest rates confirm the visual impression of figure 3. In panel A, the dependent variable is the standard deviation of real GDP growth across the economies in the respective samples, and in panel B, it is the corresponding dispersions of consumption growth. In each case, the other regressors are a lagged dependent variable, the cross-country mean GDP (or consumption) growth, the CRISIS indicator used earlier and a time trend. While the performance of the other variables is mixed, the time trend is very significant in all cases. 13
Table 12.Determinants of Dispersion in GDP and Consumption Growth
All countries Industrialized Asia Latin America
(1) (2) (3) (4)
Standard Deviation of GDP Growth (t-1) 0.106 0.303* 0.162 -0.101(0.17) (0.16) (0.15) (0.15)
Per Capita World GDP Growth -0.0602 -0.120 0.0822 0.0843(0.10) (0.084) (0.19) (0.24)
Crisis 0.0776** 0.0403 0.280 0.141(0.034) (0.096) (0.20) (0.086)
Time trend -0.0236*** -0.0282*** -0.0294** -0.0317*(0.0085) (0.0079) (0.014) (0.018)
Constant 3.216*** 2.050*** 2.973*** 4.107***(0.66) (0.46) (0.72) (0.97)
Observations 37 37 37 37
R-squared 0.40 0.59 0.32 0.20
All countries Industrialized Asia Latin America
(1) (2) (3) (4)
Standard Deviation of Consum. Growth (t-1) -0.0543 0.00715 0.0732 0.213(0.20) (0.15) (0.11) (0.16)
Per Capita World Consumption Growth -0.318** 0.0589 -0.333 -0.705**(0.13) (0.14) (0.23) (0.29)
Crisis 0.0693 0.336** 0.357 0.0336(0.043) (0.14) (0.33) (0.11)
Time trend -0.0453*** -0.0469*** -0.0395* -0.0553**(0.012) (0.012) (0.021) (0.024)
Constant 5.469*** 2.940*** 5.143*** 5.835***(0.80) (0.49) (0.64) (1.03)
Observations 35 35 35 35
R-squared 0.38 0.50 0.20 0.34
Note: *,** and *** indicate signficance at, or below the 10%, 5% and 1% levels respectively.
Robust standard errors are reported in parentheses.
Panel B. Dependent variable: Standard Deviation of Consumption Growth
Panel A. Dependent variable: Standard Deviation of GDP Growth

30
4.2 Financial Integration and Crises
There is broad agreement on a number of benefits that would follow from a fuller development of local financial markets. Prominent among these would be the achievement of higher scale, which makes markets more liquid and prices more meaningful, and provides firms with a richer choice of instruments to manage their capital structure, including bond debt and equity; and enhancement of the ability to issue long-term, local currency-denominated debt, which improves the firms‘ ability to manage debt more efficiently. These issues, as they pertain to the development of Asian bond markets, have been studied extensively in the context of the Asian Bond Markets initiative. (see ADB, 2008).
There is weaker consensus, however, on whether the development of local Asian regional financial markets can contribute to reducing the likelihood of financial crises. The discussion in Ito and Park (2004) sets out the arguments for and against this important potential benefit. On the one hand, it is argued that Asian investors will probably display a ―regional bias‖ in their portfolio choices given their familiarity with Asian companies and assets and a more favorable perception of risk, which would make them less likely to fall into a panic-driven sale of assets. On the other hand, it is replied that non-transparent corporate governance and accounting in Asia makes any informational advantage less reliable and that there is no solid evidence that Asian investors would have a stronger preference for Asian financial assets than global investors. Further, the fact that Asian investors have a vested interest in the regional economies would not affect their portfolio decisions. Nevertheless, the development of financial markets in the Asian region would provide a better set of instruments (more long-term, local currency debt, for example) which would make it less crisis-prone even if investors themselves are equally fickle. That point was also disputed, as the structure of financial portfolios is probably related to deeper reasons such as risk diversification and macroeconomic fundamentals, and was not believed to change even with better market infrastructure and liquidity in the region‘s markets.
One direction in which an integrated Asian market could help lower costs of borrowing and enhance market stability would be through the creation of a single currency market. This seems to have been a lesson from the experience of European bond markets. After the introduction of the euro, borrowing costs fell sharply for the countries that had higher yield spreads before the introduction of the common currency. Of course, the introduction of the euro had multiple effects, including gaining confidence in the future strength of the exchange rate compared to the traditionally less stable currencies of Europe, such as the Italian lira. Furthermore, the Maastricht Treaty imposed fiscal targets and limits that helped to boost the credibility of the public finances in many of the member countries. Nevertheless, there were also factors that were more directly linked to the change in the market structure, in particular the gains in liquidity and broadening of the investor base that was facilitated by the larger scope of a market denominated in a major currency like the euro instead of the smaller, fragmented bond markets. Investors perceived bonds issued by countries in the euro group as belonging to the same asset class. Thus, the creation of a much larger asset class of euro-denominated bonds helped achieve more favorable borrowing conditions and a deeper, more stable market. This suggests that benefits from Asian financial integration would be enhanced in the presence of a currency union, even if the institutional framework on which the currency union is based were not as extensive as in the case of the European Union. 14

31
It would seem that the key factor in this debate is whether global hedge funds, or non-Asian investors more generally, are more prone to panic and freeze funding on a broad scale than local investors, and by extension, regional investors. It is true that international capital flows, particularly in the 1990s, followed cycles of surges in inflows and ―sudden stop‖ episodes. Is there evidence, however, that domestic investors have a different temperament with regard to mood changes toward domestic assets and currencies? More to the point, do we know if regional investors behave differently from more distant international investors?
In the remainder of the paper, we review studies that have investigated these questions during recent financial crises in Mexico and Asian economies, and we note developments in recent months in the context of the global financial distress that followed the subprime mortgage crisis. We focus on the case of Brazil, which has gone a long way in recent years in developing local markets in domestic currency, and has relaxed the rules that regulate the participation of foreign investors, attracting significant amounts of foreign investment into the local securities markets. As the events are still unfolding, this discussion is obviously only a preliminary analysis of the impact on the Brazilian capital markets of the current financial crisis, and the extent to which a structure of capital flows that emphasizes local currency instruments has had a beneficial effect.
4.3 Local vs. Foreign Investors: Recent Studies
We can divide the issue in two parts. Are local investors a more stable investor base that provide resilience against financial panics and, if the answer is in the affirmative, do these benefits extend to regional foreign investors too? I t is true that some groups of local investors — heavily regulated domestic institutions like banks and pension funds in particular — are in many cases a ―captive audience‖ in domestic securities markets (Borensztein, Levy Yeyati and Panizza, 2007). Pension funds, for example, are often required by law to maintain a large proportion of their portfolios in domestic assets, and sometimes specifically in government debt instruments. Likewise, commercial banks frequently must hold reserve requirements in some form of government liability, and sometimes are subject to ―moral suasion‖ to hold even more. Nevertheless, these requirements usually do not apply to holdings of regional securities beyond the national borders. If regional financial integration resulted in the creation of a single market, as in Europe, then regional institutional investors would be subject to the same rules that now apply to home investors, and this may enhance market stability, particularly in smaller economies.
Alternatively, it may be possible that, by being better informed than global investors about domestic developments, local (or regional) investors would be less likely to fall into panics and liquidate positions in a wholesale manner, at times of economic or financial distress. While this conjecture has some intuitive appeal, and does enjoy some popularity, evidence from recent financial events — albeit essentially anecdotal and fragmented — does not suggest a clear-cut injunction of fickle international investors. The case against global investors gained popularity in the wake of the speculative attacks on the Hong Kong dollar in October 1997. The alleged scheme was that a number of global investors would short the Hong Kong currency ―a little‖ and
32
short the Hong Kong stock market ―a lot.‖ The pressure on the currency would cause a large increase in domestic interest rates through the mechanical operation of the currency board, which in turn triggered a sharp fall in the stock market. Although it is true that many global hedge funds had short positions on the Hong Kong stock market at the time, some observers have cast a skeptical view on the story, because of the practical difficulties of implementing the scheme and by tracking the short positions of foreign investors in the Hang Seng index (see International Monetary Fund, 1998).
Regarding the Mexican peso crisis of December 1994, Frankel and Schmukler (1996) find evidence that Mexican investors turned pessimistic on the sustainability of the exchange rate before international investors. They compare the prices of equity ―country funds‖ trade in New York City with their net asset values, namely the value of the constituent shares that are traded and determined in Mexico City. They find that net asset values declined sharply relative to the value of country funds two weeks before the devaluation. This is in line with the view expressed at the time by the IMF‘s Global Financial Stability Report and The Economist. In fact, applying a similar approach, Frankel and Schmukler (1998) find that the domestic investors lead market trends over foreign investors in similar ways in a study of 61 country (and multi-country) funds based in New York City.
In the Asian context, a detailed study of the behavior of international investors in the Korean stock market during the currency crisis period did not find support for the view that global investors exerted a major destabilizing influence. Choe, Kho and Stulz (1998) took a detailed look at daily trades of foreign investors in the Korean stock market throughout 1997. They found that, although foreign investors tended to follow ―positive feedback strategies,‖ in the sense of selling stocks that fell in price and buying those that had appreciated, there was no evidence that their trades had a lasting impact on market prices, particularly during the last three months of 1997.
Borensztein and Gelos (2003) studied the behavior of international mutual funds that invest in emerging markets over the period 1996 to 1999, particularly around the currency crises episodes in various countries. They found that, although these funds have a tendency to ―herd,‖ that is, to be concentrated on one side of the transactions, the extent of herding is actually small. Although herding is statistically significant, it is unlikely to exert a major influence on prices. On average, international mutual funds were 7% more concentrated on one side of the market (either buying or selling). Furthermore, by examining the behavior of mutual funds around crisis episodes, they found that funds tended to cut their exposure in the month before the crisis, but again that the extent of their sales was relatively modest. Similarly, Bekaert, Harvey and Lundblad (2004) studied countries that liberalized their equity markets to international investment, and did not find evidence of increased market instability after the liberalization.
There are few studies and little information regarding the behavior of regional foreign investors. One special case is a study of lending patterns by banks from seven OECD economies during the Asian crises (Siregar and Choy, 2008). The study reports that Japanese banks reduced their loan exposure to East Asian markets by about 30% in 1998-99, whereas UK and US banks cut back by only 13 and 17%, respectively. Moreover, loans by Japanese banks failed to recover to levels anywhere close to pre-crisis values as late as nearly 10 years after the Asian crisis. The

33
econometric analysis suggests that a higher sensitivity to financial risk (an index including variables such as external debt and international reserves) seems to explain this behavior by Japanese banks.
4.4 Investor Behavior during the Subprime Crisis: Evidence from Brazil
The financial crisis that hit global markets in 2008 provides a new and important opportunity to assess the impact of global financial stress on domestic markets in the presence of foreign investors. While at the time of this writing—early 2009—it is too soon to form a well-defined account of the impact of the crisis, some developments are surfacing that are informative. Global financial markets have changed a lot since the Asian crisis, and more so since more recent events. The pattern of capital flows and asset positions of domestic firms and banks, as well as foreign investors have significantly evolved. We take the case of Brazil as the subject of study. It has a rich set of financial relations with the global markets and good availability of data, but we think that the pattern must be broadly similar in other emerging economies with a similar degree of financial development.
The presence of foreign investors in the local Brazilian securities markets started to change dramatically since 2005, as a result of changes in global investors‘ risk appetite, the liberalization of rules and the lowering of taxes on inflows into the Brazilian markets. The net asset value of the total holdings of local securities by foreign investors, which hovered below $50 billion during the previous decade, started to grow sharply. They surpassed $250 billion by mid-2008. These figures are reported by the Securities Commission of the Brazilian government, and are broadly consistent with the figures collected from the investor side through the Coordinated Portfolio Investment Survey (CPIS) used in previous sections.

34
Figure 4.Total Asset Holdings of Foreign Investors in Brazil, January 95 to May 09
0
50
100
150
200
250
300
95 96 97 98 99 00 01 02 03 04 05 06 07 08 09
Bill
ions
US
$
Notice that two factors may contribute to the sharp increase in foreign holdings of local securities: the capital inflows themselves and the asset value appreciation. The latter was largely driven by the booming stock market and the appreciating exchange rate of the real. For example, during 2007, net inflows amounted only to less than $34 billion, but the asset holdings of foreign investors increased by over $112 billion. The rise in the stock market (that gained over 40% in the year) and the strengthening of the real (that appreciated by 16% in the year) help explain this divergence. International investors‘ holdings comprised mostly stocks, which accounted for around 80% of the total asset value in 2007. Naturally, although the appreciation acts mechanically on the value of the holding, it was the investors‘ choice to increase the size of their Brazilian asset holdings by effectively reinvesting those capital gains in Brazilian securities.
Similarly, the large contraction in the net asset holdings of foreign investors since September 2008 was mostly the result of the large drop in asset prices. While outflows predominated, net outflows in September-November amounted to about $13 billion, which contrasts with the decline of over $116 billion in asset holdings. The stock market collapse and the sharp real depreciation resulted in a compound loss of 55% of the value of the stock market index (the Bovespa) in US dollar terms, which explains this large drop in the value of international investors‘ asset position. It is noteworthy that despite the relatively large outflows by international investors, the situation did not suggest a stampede by foreign investors, as gross

35
flows ran in both directions. In fact, gross inflows amounted to about $25 billion during the September-November period.
Figure 5.Portfolio Foreign Investment in Brazil, January 07 to May 09
0
5
10
15
20
25
30
35
Jan-07 May-07 Sep-07 Jan-08 May-08 Sep-08 Jan-09 May-09
Bill
ions
US
$
-10
-8
-6
-4
-2
0
2
4
6
8
10
Bill
ions
US
$
Inflows Outflows Net (right scale)
These developments highlight the fact that the change in the structure of liabilities to international investors relative to the ―original sin‖ structure that predominated in the 1990s has involved an important change in the impact of the financial crisis on solvency and liquidity factors. The new liability structure implies improvements in solvency but possibly an increase in liquidity problems. In the previous ―original sin‖ period, most liabilities were foreign currency-denominated debt issued in international markets. In the event of a sudden stop, governments, and usually the private sector as well, were unable to roll over these instruments and the shortage of international finance resulted in large exchange rate depreciations that increased the burden of the foreign currency debt. With the new liability structure, where a large part of the debt liabilities are denominated in local currency and local equity positions are also a large fraction of foreign investors‘ portfolios, a sudden stop that results in a depreciation of the local currency in fact spreads the losses to foreign investors and reduces the dollar value of the liabilities. This bolsters the financial solvency of the government, as well as firms and banks that have debts in local currency. But the other side of the coin is that liquidity pressures can be stronger. Global

36
investors can sell their securities immediately and put pressure on the exchange rate as they repatriate their positions.15 In the ―original sin‖ world the liquidity crunch was limited to the rollover needs; attempts to liquidate positions remained within the international investors‘ realm and did not have a direct effect on the foreign exchange market of the country. With the current financial structure, the potential sell-off of the domestic currency is the total investment position in domestic markets, albeit devalued by the crash in asset prices that is likely to take place.
Available data suggest that outflows by Brazilian investors and firms amounted to just under $6 billion in the September-November period. This is a relatively modest outflow but it does not include the foreign currency facilities and currency swaps that the central bank of Brazil made available to local banks and firms that were facing financing pressure in their foreign currency debts. For example, there were some notorious cases of losses suffered by some Brazilian firms, which had entered derivative contracts as a protection against an appreciation of the real. These trades were originally designed for exporting firms that are vulnerable to a currency appreciation. However, they also included a multiple liability for the case of a depreciation of the real beyond a certain level that ultimately caused the heavy losses.
While it is certainly premature to draw definitive lessons, the Brazilian case does not suggest a clear cut distinction between foreign and local investors in terms of their impact on local financial markets.
V. CONCLUSIONS
Using Kim, Lee, Shin (2006) and ADB (2008) as a guide, we have surveyed the empirical terrain used in past studies to assess the extent of regional financial integration in Asia. We have provided updates of the evidence by using recent data (e.g. using data on equity premia through March 2009 and the CPIS data to 2007), in some cases by looking at the evidence from a different angle, and by providing a comparison of Asia with other country groups. Our conclusions from this selective survey are as follows: 1. There is a process of convergence in equity premia and interest rates among Asian countries, particularly over the period 2000 to 2006 (see section 2 of the paper, Tables 2 and 3, and Figures 1 and 2). However, with some exceptions, much the same process has occurred in Latin America and Eastern Europe. Convergence has tended to be faster in the Eastern European case than in Asia. In all regions, crises interrupt the process of convergence. 2. Cross-border holdings among Asian countries are significant in many cases and have increased over the last decade. But their pattern is not strikingly different from that in other regional groups (Latin America; Eastern Europe) and not near industrialized country ‗benchmarks‘ (section 3.1; Tables 4 and 5). U.S. assets continue to play a dominant role relative to Japanese assets in the portfolio allocations of Asian countries (Table 6). 3. The gravity model, not surprisingly, continues to describe successfully cross-border equity and bond holdings. We were unable to find evidence that financial integration in Asia has reached such a point that it can counter the effects of the gravity variables (section 3.1; Tables 7 to 9)

37
4. Several Asian economies display departures from regional home bias comparable to that in Latin American countries but lower than that in Eastern Europe or industrialized countries (section 3.2; Table 10). A gravity model works well for explaining home bias, with real exchange rate volatility an important addition to the standard model. There is again little evidence to suggest that Asia no longer conforms to the standard model (section 3.2; Table 11). 5. The trends in ‗prices‘ (equity premia, interest rates) and ‗quantities‘ (cross-border equity and bond holdings) are also reflected in convergence in consumption growth rates among Asian countries (section 4.1; Figure 3 and Table 12). However, we do not find evidence that the increased risk sharing within Asia, a presumed great benefits of deeper regional financial integration, is occurring at a faster rate than in other country groups. Puzzlingly from the perspective of standard economic theory, but consistent with the evidence from previous studies, we find that there is convergence not just in consumption growth but also in GDP growth. 6. In the Asian context, the stability of a local investor base is put forward, often, as one of the benefits of regional financial integration (section 4.2). However, our survey of the evidence invites some caution about this claim (section 4.3). Our case study of Brazil‘s experience to date with the ongoing financial crisis does not point to a clear distinction between foreign and local investors in terms of their impact on local financial markets (section 4.4; Figures 4 and 5).
Our bottom-line assessment is that though Asian regional financial integration is clearly increasing, at least in tranquil times, the Asian economies remain more integrated with global financial markets than with their regional neighbors. As far as economic considerations are concerned, this is not necessarily undesirable: as shown by Imbs and Mauro (2007), the gains from global diversification may be higher than those achievable solely through regional integration.

38
Endnotes
1 Table 1 at the end of this paper provides the list of economies that we were able to include based on data availability and quality in the sequence of empirical exercises we have undertaken in the sections of this paper. 2 We use the new series of VIX from 1990 onwards and the older VXO series for 1986 through 1989. 3 If the sample period is truncated in December 2006, the coefficient on the trend for Eastern Europe is -.00364 compared with the -.00278 reported in column (5) and the -.00231 estimate for Asia in column (3). 4 Data for 5 countries—Bermuda, the Cayman Islands, Ireland, Luxembourg and Panama—represent huge outliers relative to the rest of the sample and are excluded from the regressions that follow. In addition, some of the 2007 bond holdings data for Hong Kong, China and Singapore also are huge outliers relative to their 2001 to 2006 data. As indicated where appropriate in the rest of the paper, for the bond holdings and bond home bias indices for these two economies we used data for 2001 to 2006.. 5 The includsion of Bermuda heavily biases the figures on Asian investment in Latin America upwards. 6 The standard errors reported in tables 7, 8 and 9 take into account clustering by the investor economy. The main conclusions presented in those tables are not sensitive to this choice. Also, estimating separate regressions for each year, rather than pooling the data, does not affect the thrust of the results. 7 See Portes and Rey (2005) and Loungani, Mody and Razin (2007) for a discussion of the importance of distance in gravity models for trade, financial assets and FDI. 8 Two global financial markets, the US and the UK, loom large in these data. In order to examine the extent to which Asia relies on these global markets relative to regional markets, Kim et al suggest constructing a set of dummy variables as follows. The (0,1) variable Global takes the value 1, if the issuer is either the US or the UK. The (0,1) variable Asia_Global takes the value 1, if the investor country is in Asia and the issuer country is either the US or the UK, and similarly for the other regional groups. The coefficient variable Global is very significant, showing the importance of the US and UK in cross-border financial flows. However, the other interactions were not generally significant, and adding them did not change our conclusions about the sign or significance of the other variables. 9 We also implemented a variant of the empirical strategy suggested by Kim, Lee and Shin (2006) by interacting the variables of the basic gravity model with Asia_Pair to examine whether regional integration in Asia has modified the effects of the gravity variables. However, the magnitude, signs and significance of the gravity variables did not change appreciably, while the interaction terms, by and large, were not significant. 10 See Tumbarello (2007). Also, Fernald, Edison and Loungani (1999) and Ahearne, Fernald, Loungani and Schindler (2009) discuss the growing trade linkages among Asian countries. 11 We investigated the effect of capital controls on cross-border asset holdings and home bias using a new and comprehensive data set on controls (Schindler (2009)). For equities and bonds separately, we constructed a measure of capital controls by summing, for every investor-issuer pair of countries in our sample, the 1995-2005 average of the index of restrictions on outflows by the investor country and the 1995-2005 average of the index of restrictions on inflows by the issuer country. We did not find any systematic or significant effect of controls on asset holdings using the regressions discussed above. The results were somewhat clearer in the home bias regressions: while there was no effect on equities, capital controls increased home bias in the regressions for bond holdings in the all-countries sample and in the country-group regressions for the industrialized countries, Latin American and Eastern Europe (but not Asia). 12 We also estimated the home bias regressions for the different country groups. The product of per capita GDPs reduces home bias across all country groups and for both equities and bonds, but the performance of the other gravity variables is mixed. Real exchange rate volatility raises home bias, but the effect is not significant for industrialized countries for both equities and bonds and for Asian countries in the case of bonds. 13 Flood, Marion and Matsumoto (2008) suggest that risk sharing should be thought of as a long-term phenomenon, ―driven perhaps by output-growth-rate convergence related to trade in ideas and technologies and to diffusion of institutions.‖ Their measure shows that risk sharing has improved over time as industrial countries‘ consumption growth rates have converged dramatically since the 1960s and consumption growth rates for emerging markets started converging in the 1990s. 14 Of course, countries can always issue debt denominated in a major international currency — and they often do — but in this case, they are shifting the currency risk from investors to themselves rather than eliminating it. 15 However, one can argue that the foreign investors‘ urge to flee the domestic markets and the sharp depreciation of the real caused the crash in the Bovespa in the first place. Thus, gains in reducing solvency risk may be offset by increased market volatility in the post-original sin world.

References
Adjouate, K. and J-P. Danthine. 2004. Equity Returns and Integration: Is Europe Changing? Oxford Review of Economic Policy. 20(4). pp. 555-570. Ahearne, A., J.Fernald, P. Loungani and J. Schindler. 2006. Flying Geese or Sitting Ducks? China‘s Impact on the Trading Fortunes of other Asian Economies. Federal Reserve Board
International Finance Discussion Paper 887. Asian Development Bank. 2008. Emerging Asian Regionalism: A Partnership for Shared
Prosperity. Backus, D.,P. Kehoe and F. Kydland. 1994. Dynamics of the Trade Balance and the Terms of Trade: the J-curve? American Economic Review. 84(1). pp. 84-103. Bekaert, G., C.R. Harvey and C. Lundblad. 2006. Growth Volatility and Financial Liberalization. Journal of International Money and Finance. 25 (3). pp. 370-403. Borensztein, E., E. Levy Yeyati and U. Panizza. 2007. Living with Debt.How to Limit the Risks
of Sovereign Finance. Inter-American Development Bank Report on Economic and Social Progress in Latin America. Cambridge: Harvard University Press. Borensztein, E. and R. G. Gelos. 2003. A Panic-Prone Pack? The Behavior of Emerging Market Mutual Funds. IMF Staff Papers. 50(1). pp. 43-63. Choe, H., B-C. Kho and R. Stulz. 1998. Do Foreign Investors Destabilize Stock Markets? The Korean Experience in 1997. Mimeo. De Nicolo, G. and I. Ivaschenko. 2008. Financial Integration and Risk-Adjusted Growth Opportunities. IMF Working Paper WP/08/126. Engel, C. and A. Matsumoto. 2009. The International Diversification Puzzle when Goods Prices are Sticky: It‘s Really about Exchange-Rate Hedging, not Equity Portfolios. IMF Working Paper 09/12. (forthcoming in American Economic Journal: Macroeconomics). Feldstein, M. and C. Horioka. 1980. Domestic Saving and International Capital Flows. The
Economic Journal. 90(358). pp. 314–329. Fernald, J., H. Edison and P. Loungani.1999. Was China the First Domino? Assessing Links Between China and Other Asian Economies. Journal of International Money and Finance. 18(4). pp. 515–535. Fidora, M., M. Fratzcher and C. Thimann. 2007. Home Bias in Global Bonds and Equity Markets: The Role of Real Exchange Rate Volatility. Journal of International Money and
Finance. 26(4). pp. 631-655. Flood, R., N. Marion and A. Matsumoto. 2008. International Risk Sharing During the Globalization Era. Mimeo.

40
Frankel, J. and S. Schmukler. 1996. Country Fund Discounts and the Mexican Crisis of December 1994: Did Local Residents Turn Pessimistic before International Investors? International Finance Discussion Paper 563. Board of Governors of the Federal Reserve System. _________________ 1998. Country Funds and Asymmetric Information. Policy Research
Working Paper 1886. The World Bank. Imbs, J. 2006. The Real Effects of Financial Integration. Journal of International Economics. 68(2). pp. 296-324. Imbs, J. and P. Mauro. 2007. Pooling Risk among Countries. IMF Working Paper 07/132. International Monetary Fund. 1998. World Economic Outlook. Financial Crises: Causes and
Indicators. Washington DC: IMF. Ito, T. and Y. C. Park. 2004. Overview—challenges and strategies. In Ito T. and Y. C. Park, ed. Developing Asian Bondmarkets. Australian National University: Asia Pacific Press. Kim, S., S. Kim and Y. Wang. 2006. Financial Integration and Consumption Risk Sharing in East Asia. Japan and the World Economy. 18(2). pp. 143-157. Kim, S. and J-W. Lee. 2008. Real and Financial Integration in East Asia. ADB Regional
Cooperation and Integration Working Paper 17. Kim, S., J-W. Lee and K. Shin. 2006. Regional and Global Financial Integration in East Asia. MPRA Paper 695. (Available online at http://mpra.ub.uni-muenchen.de/695) Kim, H., K-Y. Oh and C-W. Jeong. 2005. Panel Cointegration Results on Capital Mobility in Asian Economies. Journal of International Money and Finance. 24(1). pp. 71-82. Kose, M. A., E. Prasad and M. Terrones. 2007. How does Financial Globalization Affect Risk Sharing? Patterns and Channels. IMF Working Paper 07/238. Laeven, L. and F. Valencia. 2008. Systemic Banking Crises: A New Database. IMF Working
Paper 08/224. Lewis, K. 1999. Trying to Explain Home Bias in Equities and Consumption. Journal of
Economic Literature. 37(2). pp. 571-608. Loungani, P., A. Mody and A. Razin. 2007. The Global Disconnect: the Role of Transactional Distance and Scale Economies in Gravity Equations. In Mody A. ed. Foreign Direct Investment
and the World Economy. London: Routledge. Portes, R. and H. Rey. 2005. The determinants of Cross-border Equity Flows. Journal of
International Economics. 65(2). pp. 269-296. Rose, A. 2005. Which International Institutions Promote International Trade. Review of
International Economics. 13(4) pp. 682-698.

41
Schindler, M. 2009. Measuring Financial Integration: A New Data Set. IMF Staff Papers. 56(1). pp. 222-238. Siregar, R. and K. M. Choy. 2008. Determinants of International Bank Lending from the Developed World to East Asia. Mimeo. IMF-Singapore Training Institute and Nanyang Technological University, Singapore. Solnik, B. and J. Roulet. 2000. Dispersion as Cross-Sectional Correlation. Financial Analysts
Journal. 56(1). pp. 54-61. Sorenson, B. , Y-T. Wu, O. Yosha and Y. Zhu. 2007. Home Bias and International Risk Sharing: Twin Puzzles Separated at Birth. Journal of International Money and Finance. 26(4). pp. 587-605. Tumbarello, P. 2007. Are Regional Trade Agreements in Asia Stumbling or Building Blocks? Some Implications for the Mekong-3 Countries. IMF Working Paper 07/53.