education: a defense industry in transition · education: a defense industry in transition colonel...
TRANSCRIPT
W-A262 200
1992
Executive Research ProjectS85
Education:A Defense Industry
in Transition
Colonel
James J. SterzingerU. S. Air Force
Faculty Research Advisor
Colonel Paul A. Reid, USAF
~tr TI3x 0
The Industrial College of the Armed ForcesNational Defense University
Fort McNair, Washington, D.C. 20319-6000
OJT 093-0635098 Z9 01" ,•I,•ApprovedI' •
i .I | i
UnclassifiedSECURITY CLASSIFICATION OF THIS PAGE
REPORT DOCUMENTATION PAGEla. REPORT SECURITY CLASSIFICATION lb. RESTRICTIVE MARKINGS
Unclassified2a. SECURITY CLASSIFICATION AUTHORITY 3 DISTRIBUTION /AVAILABILITY OF REPORT
N/A .Distribution Statement A: Approved for public2b.NECLASSIFICATiONIDOWNGRADING SCHEDULE release; distribution is unlimited.
N/A _ _ _ _ _ _ _ _ _ _ _ _ _ _ _ _ _ _ _ _ _
4, PERFORMING ORGANIZATION REPORT NUMBER(S) S. MONITORING ORGANIZATION REPORT NUMBER(S)
NDU-ICAF-92- Same6a. NAME OF PERFORMING ORGANIZATION 6b OFFICE SYMBOL 7a. NAME OF MONITORING ORGANIZATION
Industrial College of the (If applicable)Armed Forces I ICAF-FAP National Defense University
6c. ADDRESS (City, State, and ZIP Code) 7b. ADDRESS (City, State, and ZIP Code)Fort Lesley J. McNair Fort Lesley J. McNairWashington, D.C. 20319-6000 Washington, D.C. 20319-6000
Ba. NAME OF FUNDING/SPONSORING Bb, OFFICE SYMBOL 9- PROCUREMENT INSTRUMENT IDENTIFICATION NUMBERORGANIZATION (if applicable)
Bc. ADDRESS (City, State, and ZIPCode) 10, SOURCE OF FUNDING NUMBERS
PROGRAM PROJECT TASK WORK UNITELEMENT NO. NO. NO. ACCESSION NO
11. TITLE (Include Security Classification)
12. PERSONAL AUTHZR(S(),k--
13a. TYPE OF REPORT 13b. TI4E COVERED 14, DATE OF REPORT (Year, Month, Day) 15. PAGE COUNT ,Research FROM Aug 91 TO Apr 921 April 92 31r
16. SUPPLEMENTARY NOTATION
17. COSATI"CODES 18. SUBJECT TERMS (Continue on reverse if necessary and identify by block number)
FIELD GROUP SUB-GROUP
19. ABSTRACT (Continue on reverse if necessary and identify by block number)
SEE ATTACHED
20. DISTRIBUTION/AVAILABILITY OF ABSTRACT 21. ABSTRACT SECURITY CLASSIFICATION[3UNCLASSIFIED/UNLIMITED 0 SAME AS RPT. Q DTIC USERS Unclass ied
22a. NAME OF RESPONSIBLE INDIVIDUAL 22b. TELEPHONE (Include Area Code) 22c. OFFICE SYMBOLJudy Clark. (202) 475-1389 I
DD FORM 1473,84 MAR 83 APR edition may be used until exhausted. SECURITY CLASSIFICATION OF THIS PAGEAll other editions are obsolete Unclassified
EDUCATION:A DEFENSE INDUSTRY IN TRANSITION
Abstract
In 1983, the National Commission on Excellence in Education's
Report, A Nation at Risk: The Imperative for Education Reform,
confirmed the public perception that something is wrong with the
nation's education system. AMERICA 2000 with six national
educational goals is President Bush's strategy to transform
America's education system. Implementation of the plan will have
a beneficial influence on Department of Defense recruiting and
,raining. Recruiters will have a higher quality applicant pool.
Training managers should see reduced attrition rates and more
efficient use of training time. The military will feel the biggest
impact when it transitions to a "train before buy" system. In
"train before buy" the military satisfies its needs by recruiting
fully trained individuals. This is essential in an era when a
reduced force size dictates that all the services examine the ratio
between training and operational requirements.
1992Executive Research Project
S85
Education:A Defense Industry
in Transition
Colonel
James J. SterzingerU. S. Air Force ccjSIon Fo r
NTIS c[7 &7DTIC 1ALULrarnoucýd_
Jdz~titf cat~om
Faculty Research Advisor ......... ..Colonel Paul A. Reid, USAF By
Ds Avail and/fori , • Di stpecial
The Industrial College of the Armed ForcesNational Defense University
Fort McNair, Washington, D.C. 20319-6000

DISCLAIMER
This research report represents the views of the author and does not necessarilyreflect the official opinion of the Industrial College of the Armed Forces, the NationalDefense University, or the Department of Defense.
This document is the pioperty of the United States Government and is not to bereproduced in whole or in part for distribution outside the federal executive branchwithout permission of the Director of Research and Publications, Industrial Collegeof the Armed Forces, Fort Lesley J. McNair, Washington, D.C. 20319-6000.
EDUCATION: A DEFENSE INDUSTRY IN TRANSITION
Introduction
On April 25, 1983, David Pierpont Gardner, President-Elect of
the University of California and Chairperson of the National
Commission on Excellence in Education, made what he labeled "A
Report to the Nation". The commission formed "as a result of the
widespread public perception that something is seriously remiss in
our education."' Their red-letter document, A Nation at Risk: The
Imperative for Education Reform, is both a rallying cry and a bible
for a country making a historic effort to transform its educational
system.
A Nation at Risk focused America on its educational system and
kindled a number of initiatives. President Bush released the most
important of these initiatives, AMERICA 2000: An Education
Strategy, in April, 1991. AMERICA 2000 is a long range plan that
contains the national education strategy. That strategy is to
produce immediate improvements in the school system while preparing
citizens to meet the challenges of the 21st century.
What is the impact of these initiatives on military recruiting
and training with the approach of the 21st century? As the
military services move toward the year 2000 they forecast an
escalating requirement for personnel who can deal with advancing
technologies. Two reasons are driving this demand. First, with
reduced military manpower needs there are fewer low skill jobs.
New areas of concentration such as space, information systems, and
avionics, skyrocketed the requirement for qualified workers with
1
high tech skills. Second, shrinking budgets force the military to
retire older weapons systems that now require the highest mix of
low to high skill jobs. An example is the high technology B-2
replacing the B-52.
The essential question is whether Department of Defense
recruiting policies alone can meet the requirements for a quality
force considering the improvements precipitated by AMERICA 2000.
The second question is whether improving the input into the
military training system (the recruit) alone guarantees that the
current military training system can meet those future high
technology demands.
This paper will analyze these issues. The objectives of this
essay are fourfold and encompass the following:
1. A summary of the findings and recommendations in A Nation at
Risk.
2. A thorough examination of the transformation of these
recommendations into a national strategy and achievable goals
through a series of presidential initiatives designed to lead
America into the 21st Century.
3. A review of Department of Defense accessions in the light of a
shrinking military and the available applicant pool.
4. A commentary on the potential adjustments in recruiting and
training required to maintain the technological edge of the
military.
2
A Nation at Risk
Secretary of Education, T.H. Bell, created the National
Commission on Excellence in Education on August 26, 1981. He
directed that within 18 months the Commission report to him. The
Commission achieved that goal by making a report on April 25, 1983.
Its findings confirmed that the public's perceptions were in fact
a reality. It concluded that:
"Our Nation is at risk. Our once unchallenged preeminencein commerce, industry, science and technologicalinnovation is being overtaken by competitors throughoutthe world .... We report to the American people that whilewe can take justifiable pride in what our schools andcolleges have historically accomplished and contributedto the United States and the well-being of its people,the educational foundations of our society are presentlybeing eroded by a rising tide of mediocrity thatthreatens our very future as a Nation and a people.'' 2
The Commissions's sources, in addition to papers from experts
on a diversity of educational issues, included students, business
leaders, citizens, and representatives from professional and public
groups. They testified at a series of public hearings, panel
discussions, meetings, and a symposium.
Indicators of Risk
The Commission's first task, after digesting the data, was to
assess the risk. They stated that risk as follows:
"History is not kind to idlers. The time is long pastwhen America's destiny was assured simply by an abundanceof natural resources and inexhaustible human enthusiasm,and by our relative isolation .... America's position inthe world may once have been reasonably secure with onlya few exceptionally well-trained men and women. It is nolonger."3
3

The Commission compiled a sizeable listing that documented the
dimensions of this risk facing the Nation. They labeled them their
"Indicators of Risk". Some of the examples are:
o On 19 academic tests Americans were never first orsecond (in comparison to other industrialized nations)and were last seven times.
o 23 million Americans are functionally illiterate.
o 13% of 17-year-olds are functionally illiterate.
O Average achievement on standardized tests by highschool students is now lower than it was 26 years ago.
o Scholastic Aptitude Test (SAT) scores have declinedsteadily since 1963.
O The number of students demonstrating superiorachievement on the SAT also declined.
O Science Achievement Scores of U.S. 17-year-olds havebeen on a decline since 1963.
o In the five year period from 1975 to 1980, remedialmathematics courses in public 4-year colleges increasedby 72 per cent.
O Business and the military spend millions of dollars onremedial education programs in basic skills as reading,writing, spelling, and computation.'
What do these observations imply? In a modern world that is
demanding an ever increasing knowledge of technology, the United
States is not only failing to keep pace, but is actually losing
ground. Educational researcher Paul Hurd succinctly defined the
problem when he concluded, "We are raising a new generation of
Americans that is scientifically and technologically illiterate."' 5
This ceaseless dwindling of the requisite skills for analysis and
problem solving is being further compounded by an absolute
necessity to emphasize the essential skills of reading and
4

mathematics for citizens who lack even the basic competence
required for their daily lives.
Findings
What are the causes of this chilling decline in American
education? According to the findings of The National Commission on
Excellence in Education, they divide into the four categories of
content, expectations, time, and teaching. Content is the
curriculum. When the commission scrutinized the differences in
curriculum between 1964-69 and 1976-81, they proposed that:
"Secondary school curricula have been homogenized,diluted, and diffused to the point that they no longerhave a central purpose .... This curricular smorgasbord,combined with extensive student choice, explains a greatdeal where we find ourselves today." 6
With the abandonment of the traditional vocational and college
preparation track programs, students in both tracks are moving in
the direction of a less rigorous studies program. A lack of
mastery (depth) in specific course areas such as mathematics,
science, foreign languages, and writing characterize this program.
The Commission defined expectations "in terms of the level of
knowledge, abilities, and skills school and college graduates
should possess." 7 Measures of these expectations are grades,
graduation requirements, examinations, admission standards, and the
difficulty of the subject matter. The conspicuous weaknesses in
the American education system include a lack of homework, inflated
grading, few requirements, inadequate time on science and math, no
minimum competency exams, and a depreciation in the selectivity of
colleges and universities.
5

The findings concerning time focused on two distinct domains.
First, is the amount of time actually spent in school. Americans
spend fewer hours in school, and fewer days in school per year,
than most all the other industrialized nations. Second, is the
effectiveness of the time used in the classroom. For example, in
some states drivers' education can count towards graduation.
Teachers are the cornerstone of the final area of findings.
The Commission concluded that the teaching career field doesn't
attract the best students. It notes "too many teachers are being
drawn from the bottom quarter of 4raduating high school and college
students."'8 The Commission observed that the teacher curriculum
at colleges and universities emphasizes instructional theory at the
expense of subject matter expertise. Lastly, the working
conditions of teachers is precipitating a teacher shortage
characterized by a high turnover of teachers.
Recommendations
The National Commission on Excellence in Education made five
recommendations to the Secretary of Education. In their
introduction to the segment delineating the recommendations, they
espoused the obvious when they stated "The topics are familiar;
there is little mystery about what needs to be done."'9 Their
recommendations are:
Recommendation A: That high schools strengthen graduationrequirements including minimum standards in core subjects.
Recommendation B: That all schools adopt measurable standards andthat colleges boost their entrance requirements.
6

Recommendation C: That schools must use the school day moreeffectively and increase the length of the school day and theschool year.
Recommendation D: That colleges and universities improve teacherselection, preparation, and working conditions.
Recommendation E: That the nation must hold educators and electedofficials accountable.
America 2000
The challenges defined in A Nation at Risk do not chart a
future course for effective action. President Reagan first faced
the concerns identified in the report. In his State of the Union
address on January 27, 1987, he declared, "The quest for excellence
into the twentieth century begins in the schoolroom, but we must go
next to the workplace." President Reagan clearly established his
belief that education is a means to an end. That end is production
of a workforce with the necessary skills to meet the needs of
industry and business. This includes the worker's ability to adapt
(retrain) if necessary in the face of a rapidly changing workplace.
Three reports are the foundation of the presidential
initiatives that are leading the nation in its effort to strengthen
the American educational system. These documents merit review
since they are the roadmap to the year 2000. They are:
"O Building a Quality Workforce
"O What Work Recruires of Schools: A SCANS Report forAmerica 2Q00
"o America 2000 - An Education Strategy
7
Bu.ilding a Oualitv Workforce
Building A Quality Workforce is a joint initiative of the U.S.
Departments of Labor, Education, and Commerce. Distributed in July
1988, it is a coordinated attempt by the executive branch to create
a bridge between business and education. It recognizes the
concerns raised in A Nation at Risk are not an end in themselves.
Educators must address these concerns within the context of
employer needs. The findings and conclusions parallel those found
in A Nation at Risk:
Findings
1. The rate of change in the workplace is rapidlyaccelerating.
2. Job skill requirements are changing regardless of thetype of business.
3. The skills gap between entry level workers andbusiness is widening.
4. Entry level workers are deficient in the basicskills of reading, writing, mathematics, andcommunications. They lack initiative, adaptability,teamwork, and the capability to solve problems.
5. Loss of productivity and competitiveness costAmerican business.
6. Educators agree with overall goals, but musttranslate that understanding into what happens in theclassroom.
7. Business must anticipate future needs and developways to convey those needs to educators.
8. Non-college bound and dropouts have been leastaffected by educational reform. 10
Conclusions
I. Strengthen our Educational System
8

"o Increase accountability of schools"o Strengthen curriculum"o Recruit good teachers"o Improve performance of the disadvantaged"o Increase competitiveness of schools
2. Expand Business Involvement
o Advocate schools in the communityo Increase collaboration between the business and
education communitieso Promote good management practices such as
accountability and merit pay.o Improve projections of labor force needs.
Buildina a Ouality Workforce firmly rooted the principle that
there is a direct link between a quality workforce and quality
education." This approach required the mobilization of not only
the education system, but also the businesses and the community.
How did the Departments of Labor, Commerce, and Education undertake
this mobilization? They did it by supporting what they labeled
"Community Partnerships that Work".
Prince George's County, Maryland, is one of the three
examples. There is an Advisory Council for Business and Industry
of the Prince George's County Public School System which funnels
assistance and resources into a variety of programs. The Prince
George's County Private Industry Council matches high school
graduates to available jobs. Local businesses helped the
Superintendent recruit better teachers by offering perks such as
reduced rents and interest rates on car loans. The results
produced by this business-education partnership are measurable. In
1984, California Achievement Scores were below the national norm
and only 40% of secondary black students passed the comprehensive
9

reading exam. By 1988, CAT scores were at the 73rd percentile and
89% of the black students passed the state functional reading exam.
Ultimately the business-education partnership identified a
weak area that needed further investigation. A Prince George's
County Career Education Task Force studied the problem of "what are
the basic employability skills needed to succeed in the world of
work?" Their Task force recommended that every student should have
these skills upon graduation. The question that remained is "What
are these skills?"
What Work R equires of Schools -- A SCANS Report for America 2000
In June 1991, through The Secretary's Commission on Achieving
Necessary Skills (SCANS), the Secretary of Labor answered this
question. The Commission completed their report after spending
12 months talking to employers, workers, union officials and
educators. Their three major conclusions are not surprising:
1. All American high school students must develop a newset of competencies and foundation skills if they areto enjoy a productive, full, and satisfying life.
2. The qualities of high performance that today charac-terize our most competitive companies must become thestandard for the vast majority of our companies, largeand small, local and global.
3. The nation's schools must be transformed into high-
performance organizations in their own right. 12
Eight areas form the heart of the SCANS program. The first
five areas are competencies that students must attain to be
productive as members of the workforce. These five SCANS
competencies (see Figure 1) are the bridge between the educational
system and the workplace. 13 These competencies are distinct from
10

FIVE COMPETENCIES
Resources: Identifies, organizes, plans and allocates resources
A. Time -- SeLects goaL-reLevant activities, ranks them, allocates time, prepares and follows schedulesB. on -- Uses or prepares budgets, makes forecasts, keeps records, makes adjustments to meet objectivesC. Material and Facilities -- Acquires, stores, allocates, and uses material or space efficientlyD. Human Resources -- Assesses skills, distributes work accordingly, evaluates performance, provides
feedback
Interpersonal: Works with others
A. Participates as Member of a Team -- contributes to group effortS. Teaches others new skillsC. Serves Clients/Customers -- works to satisfy customers expectationsD. Exercises Leadership -- communicates ideas to justify position, persuades and convinces others,
responsibly challenges existing procedures and policies.E. Negotiates -- works toward agreements involving exchange or resources, resolves divergent interestsF. Works with Diversity -- works wetl with men and women from diverse backgrounds
Informtion: Acquires and uses information
A. Acauires and Evaluates InformationB. Organizes and Maintains InformationC. Interprets and Communicates InformationD. Uses Computers to Process Information
System: Understands complex inter-reLationships
A. Understands Systems -- knows how social, organizational, and technological systems work and operateseffectively with them.
S. Monitors and Corrects Performance -- distinguishes trends, predicts impacts on system operations,diagnoses deviations ins systems' performance and corrects malfunctions
C. Imaroves or Designs Systems -- suggests modifications to existing system and develops new oralternative systems to improve performance
Technodogy: Works with a variety of technologies
A. Selects Technology -- chooses procedures, tools or equipment including computers and relatedtechnologies
B. Applies Technology to Task -- Understands overall intent and proper procedures for setup and operationof equipment
C. Maintains and Troubteshoots Eouinient -- Prevents, identifies, or solves problems with equipmentincluding computers and other technologies
Figure IL
technical skills. They are competencies required by workers at all
levels in the workforce.
The underpinning for these competencies is a three-part
foundation which covers both basic skills and personal qualities.
This Three-Part Foundation divides into:
1. Basic Skills: Reads, writes performs arithmetic and
mathematical operations, listens and speaks.
11

2. Thinking Skills: Thinks creatively makes decisions,solves problems, visualizes, knows how to learn andreasons.
3. Personal Qualities: Displays responsibility, selfesteem, sociability self-management, and integrity,and honesty.
These basic skills transcend the traditional 3 R's of reading,
writing and computation. These are "intellectual skills and
personal qualities that are part of each of the five
competencies. ,14
How is the Labor Department implementing the Commission's
strategy? Through a program outlined in their publication --
Blueprint for Action: Building Community Coalitions. This
publication includes all the information needed to start a
community business-education coalition and eventually engage the
entire community in SCANS activities. In addition to the
information contained in the publication, their SCANS TOOLBOX
includes:
"O A SCANS Hotline"O The SCANS Information Kit
-Sample Press Releases-Sample letters to engage support by parents, etc.-Radio/TV/Newspaper announcements-SCANS Workplace Know-How Card
"O Contacts in the Labor Department and regional offices"O Bibliography of relevant publications"O A sampling of SCANS-related examples.
The Labor Department met their goal. As Secretary of Labor,
Lynn Martin stated, "SCANS defines a common core of skills that
constitute work readiness for the jobs of today and tomorrow.
Defining core skills is an important step, but only a first
step." 15 SCANS provided the structure and conduit for getting
12

information to the schools on what business needs. Now it is up to
the schools to act.
America 2000: An Education Strategy
President Bush declared himself the "Education President"
during his 1988 presidential campaign. At the White House on April
18, 1991, he presented his National Education Strategy. AMERICA
2000: An Education StrateQy is the label for this long range plan
that can lead the nation into the 21st Century. This statement
summarizes the direction for America 2000:
Our vision is of four big trains, moving simultaneouslydown four parallel tracks: Better and more accountableschools; a New Generation of American Schools; A Nationof Students continuing to learn throughout our lives; andcommunities where learning can happen.16
AMERICA 2000 is a community and state blueprint -- not a
Federal program. It is the implementing strategy for the
attainment of the six national education goals adopted by the
President and the Governors in 1990. The Federal government helps
"by setting standards, highlighting examples, contributing some
funds, providing flexibility in exchange for accountability, and
pushing and prodding.0 1 7
Making all schools better and more accountable is the first
part of the President's four part plan. He wants the National
Educational Goals Panel to establish World Class Standards for the
five core subjects of English, mathematics, science, history, and
geography. Carrying out a nationwide testing system based on these
world class standards will nurture good teaching and learning.
13

Students who distinguish themselves on these achievement tests earn
Presidential Citations for Educational Excellence. Needy students
can receive Presidential Achievement Scholarships.
This national examination system will provide a report card
for parents to correlate how their children are doing compared to
other students in the same school. Local schools can relate their
performance to other schools in their district, the state, or even
the entire nation. This ability to tell students and schools how
they are doing induces accountability. An effective means of
enforcement for this program of accountability is choice. "If
standards, tests, and report cards tell parents and voters how
their schools are doing, choice gives them leverage to act.'' 18
Choice allows parents to determine the school their children
attend. Choice is an incentive for schools to adopt policies that
make them better. Some of the Federal government initiatives to
spur those changes are:
o The school as a site of reform: Cut Federal red tape"to create state and local policy environments inwhich school-by-school reform can succeed."19
O Merit Schools Program: Provide Federal funds for useas rewards.
O Governors' Academy for School Leaders and Teachers:Academies established with Federal funds to improveschool leaders, principals, and teachers.
o Differential Pay and Honors Teachers: Differentialpay and honors for the best teachers.
o Alternative Teacher and Principal Certification:Insures well qualified subject experts can overcomebarriers to entering the teaching career field.
14
Creating a New Generation of American Schools is the second
part of the President's four part plan. American business people
and educators will get together to create and set up innovative
schools that meet the national education goals of AMERICA 2000.
The Federal government provides funds for the first 535+ New
American Schools (one for every congressional district).
The third part of the President's plan focuses on the "85 per
cent of America's workers for the year 2000 (who) are already in
the work force." 20 Concentrating on today's and tomorrow's
students is not enough. To meet the challenges of the future
today's workers must continue to improve through continuing
education and strengthened job training programns. His strategy
includes pushing for a renewed Adult Education Act. He would set
up Skills Clinics in every community where workers can receive help
to improve themselves.
The final part of the President's four part plan takes aim at
communities. Learning takes place only in communities where
business, schools, and parents are all involved. Learning occurs
in communities which are safe from violence and drugs. The
President intends to strengthen Federal programs that would aid
local officials in reaching his goals. He also is reducing the
Federal bureaucracy that limits local community flexibility and
innovation.
This discussion of AMERICA 2000: An Education Strategy
identified the Who, When, Where, and How. Who? is the President of
the United States. When? is by the year 2000. Where? is at the
15

local community level. How? is through the four part strategy
outlined in AMERICA 2000. The question that remains is What? --
what are the goals? The goals are the six National Education Goals
adopted by President Bush and the nation's governors in 1990.
Figure 2 clearly presents these by simply stating them: 21
THE NATIONAL EDUCATION GOALS
GoaL 1: By the year 2000. all children in America will start school ready to learn.
Goal 2: By the year 2000, the high school graduation rate will increase to at least 90 percent.
Goat 3: By the year 2000, American students wilt leave grades four, eight, and twelve havingdemonstrated competency in challenging subject matter including English, mathematics, science,history, and geography; and every school in America wilL ensure that all students learn to usetheir minds well, so them may be prepared for responsible citizenship, further Learning, andproductive employment in our modern economy.
Goal 4: By the year 2000, U.S. students will be first in the world in science and mathematicsachievement.
Goal 5: By the year 2000, every adult American will be literate and will possess the know'.-dge andskills necessary to compete in a global economy and exercise the rights and respor biLities ofcitizenship.
Goat 6: By the year 2000, every school in America will be free of drugs and violence and will offer adisciplined environment conducive to Learning.
Figure 2
These goals are the basic ingredient in the four part AMERICA
2000 Education Strategy. Goal 4, first in science and math,
emphasizes part one. All six goals "are the principal standard
against which every New American School will be measured." 22 Goal
#5 and part three affect those already in the workforce. AMERICA
2000 communities are only possible with a reduction in drug use
(Goal 6). Will the attainment of these goals guarantee a better
military force in the year 2000? Before answering that question,
an analysis of current DOD accessions will provide some insights.
16

DOD Accessions
The President's 1993 budget request forecasts a 25% reduction
in the size of the U.S. military forces by FY 1997. Added to the
15% reduction that has already occurred since 1982, this is a
significant decrease resulting in our military forces numbering
less than 1.6M by FY 1997. Members of the Congressional staff are
DOD ACCESSIONSThousands
290280270250250240230220210 .
200190180
1987 1988 199 1990 1991 1992DOD TOTALS 290.51 265.51) 258,043 215,,,97 194 024 190,018
Fiscal year
IDOD TOTALS
Figure 3
already predicting that 1.6M is not a good number. What is the
effect on accessions? Figure 3 shows the decline in accessions
just since 1987. This 35 percent decline in the number of yearly
17
2 9 0 .......................................................... ......... ..... ......

accessions since 1987 reflects the significant decline in the total
manpower needs of the military over the last five years. From the
1987 baseline, this is a cumulative reduction of more than 325,000
men and women. From now until the year 2000 the number of
accessions is uncertain. Based on the continuing reduction in the
size of the military, 190,000 a year is probably the top line.
Applicant Pool
What is the impact of these declining DOD accessions on the
quality of the men and women actually recruited? A Nation at Risk
caused the military to ask -- was the overall quality of their
recruits declining? In the Reagan era of increasing budgets, the
military perceived an environment in which increased recruiting
demands would clash with a declining population of competent and
prepared 18-20 year-olds. In 1992, the answer is notably different
from DOD expectations in the 1983-1988 timeframe.
To understand the current recruiting situation we must first
examine the demographics of those recruits entering the military.
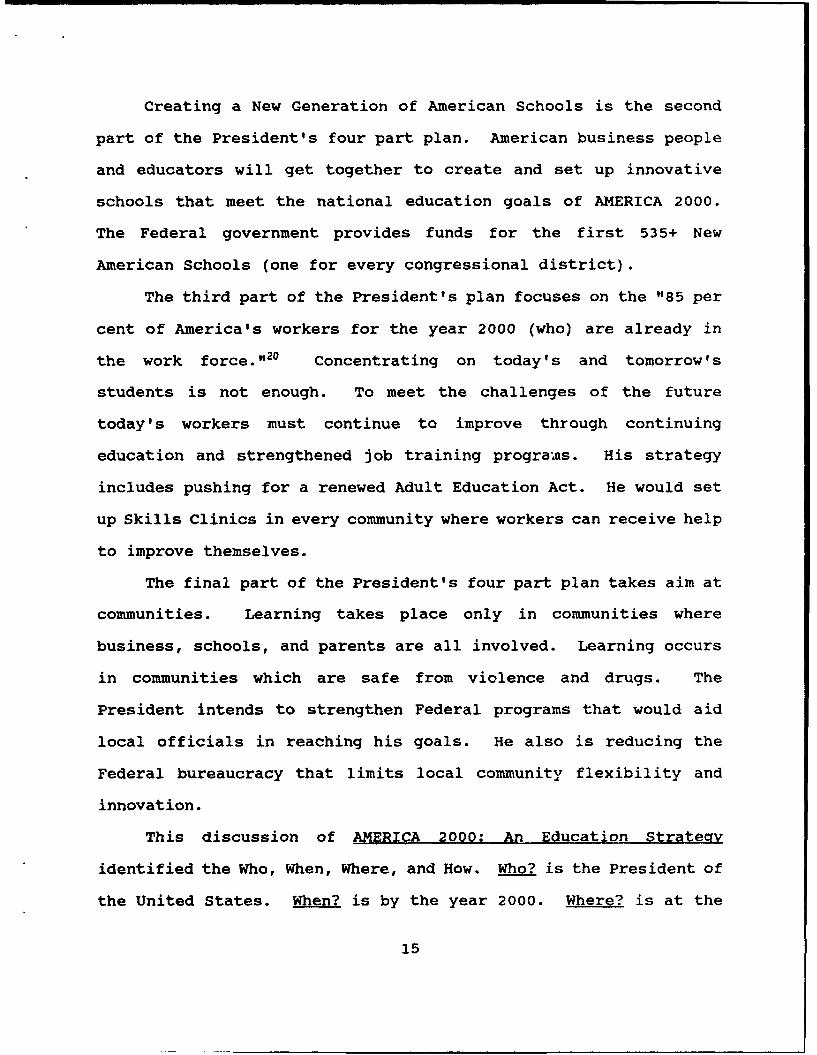
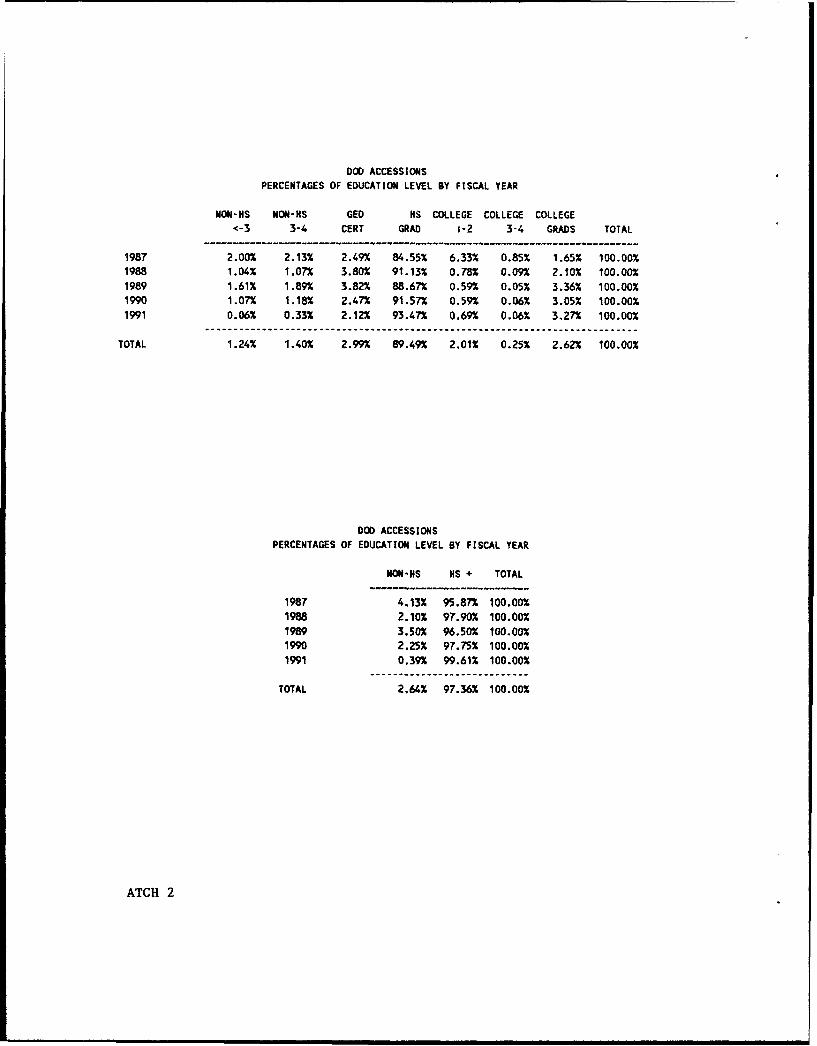
Since 1987, there has been a prominent increase in the education
levels of those entering military service. This continues the
trend begun when Congress created the all volunteer force in the
1970s. As Figure 4 (page 18) illustrates, by 1991 the number of
non-high school graduates shrunk to less than .4 of one percent of
the total. Out of 194,567 accessions (minus unknowns) in 1991,
only 781 were non-high school graduates. Those with high school
diplomas, vs GED certificates, grew from 85% of the total in 1987
to 93% of the total in 1991. College graduates are supporting this
18
DOD ACCESSIONSEducation Levels
PER CENT
100-1/9 8 ........
9 4 ..-- .. .... . ..... .....- .. .. .. . .
902.
1987 1988 1989 1990 1991
NON HIGH SCHOOL 4.13 2.1 3,5 2.25 0.39HIGH SCHOOL 4 95.87 97.9 96.5 97.75 99.61
FISCAL YEAR
ie =HIGH SCHOOL s iNON HIGH SCHOOL
Figure 4
trend. As a percentage of the total, college graduates entering
the military doubled from 1987 to 1991 (see ATCH #2).
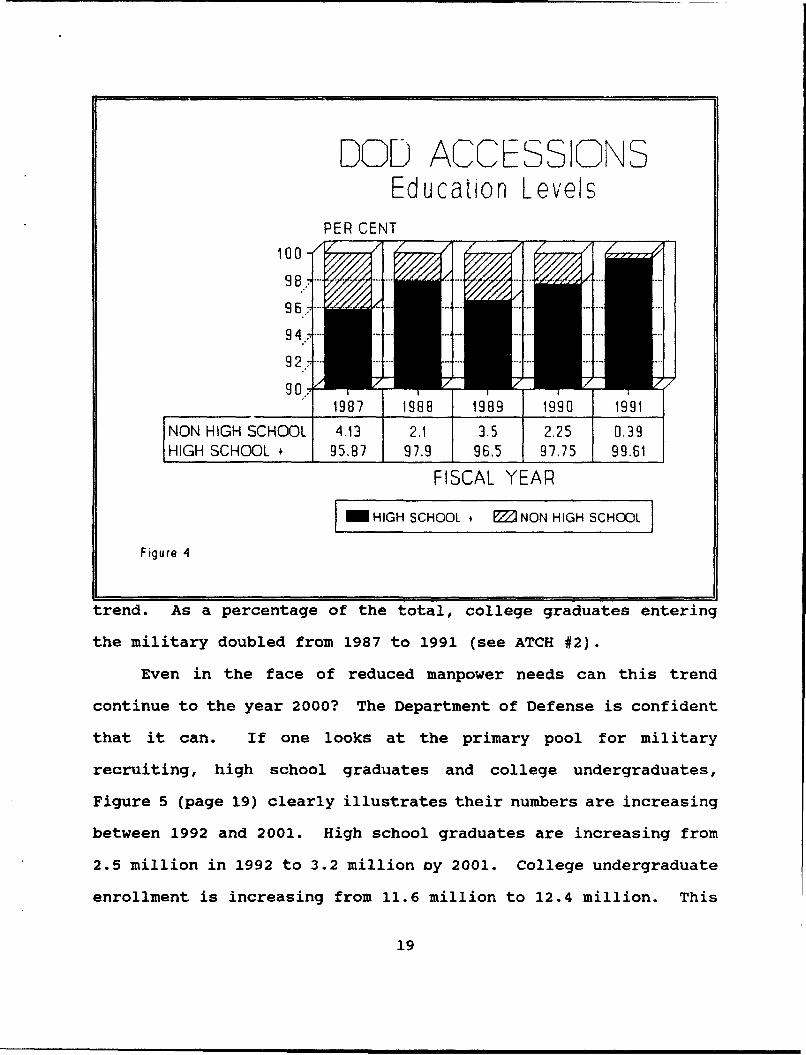
Even in the face of reduced manpower needs can this trend
continue to the year 2000? The Department of Defense is confident
that it can. If one looks at the primary pool for military
recruiting, high school graduates and college undergraduates,
Figure 5 (page 19) clearly illustrates their numbers are increasing
between 1992 and 2001. High school graduates are increasing from
2.5 million in 1992 to 3.2 million by 2001. College undergraduate
enrollment is increasing from 11.6 million to 12.4 million. This
19
EducationProjections
Millions16
8,:. .• ,..-Hi.•,., ... ...
6: ... . // ... / .. >., .. ...
4... . •.. ,
0 .... - --- . .,. ,,, z?
0P1992 1993 1994 1995 1996 19'97 19'98 19'99 2 0'00 2001
Calendar Year
MHS GRADS M UNDERGRAD ENROLLMENT
F igure 5
is a direct result of the children of the baby boomers reaching the
18-20 year-old age bracket. The military is recruiting fewer
people from a primary pool of applicants that is increasing.
The first part of the discussion on the applicant pool
addressed the question of quantity. This doesn't answer the
concerns raised about quality in A Nation At Risk. Isn't the
quality of our high school and college graduates diminishing? We
must examine this question of quality from two different
directions.
20

First, the nations' schools have improved since the National
Commission on Excellence made their report in 1983. In his 1988
report to the President and the American people, American
Education: Making it Work, William J. Bennett, U.S. Secretary of
Education stated:
American education has made some undeniable progress inthe last few years. The precipitous downward slide ofprevious duaades has been arrested .... we are doing betterthan we were in 1983.23
American Education: Making it Work assessed the question of
"How Far Have We Come?" and found some positive trends. Most
states have increased their high school graduation requirements.
Per capita spending for elementary and secondary education has
increased by 40%. Combined SAT scores have recovered 16 points
since 1980.24 Student performance on achievement tests in reading,
writing, mathematics, science, and geography is measurably
better. 25 More students are taking and completing advanced science
and math courses. The number of students taking Advanced Placement
courses doubled. For high school students, the primary military
recruiting target, the indicators are nearly all positive.
Second, there is an objective method to measure the quality of
recruits that actually enter the military. From 1F50 to 1976, the
Department of Defense measured the aptitude of all potential
recruits with the Armed Forces Qualification Test (AFQT). In 1976,
the military went to a service-common test, the Armed Services
Vocational Aptitude Battery (ASVAB). The AFQT comprises the verbal
21
and mathematical ASVAB subtests and is the most important composite
for making comparisons. The Department of Defense knows through 40
years of research that aptitude scores strongly relate to training
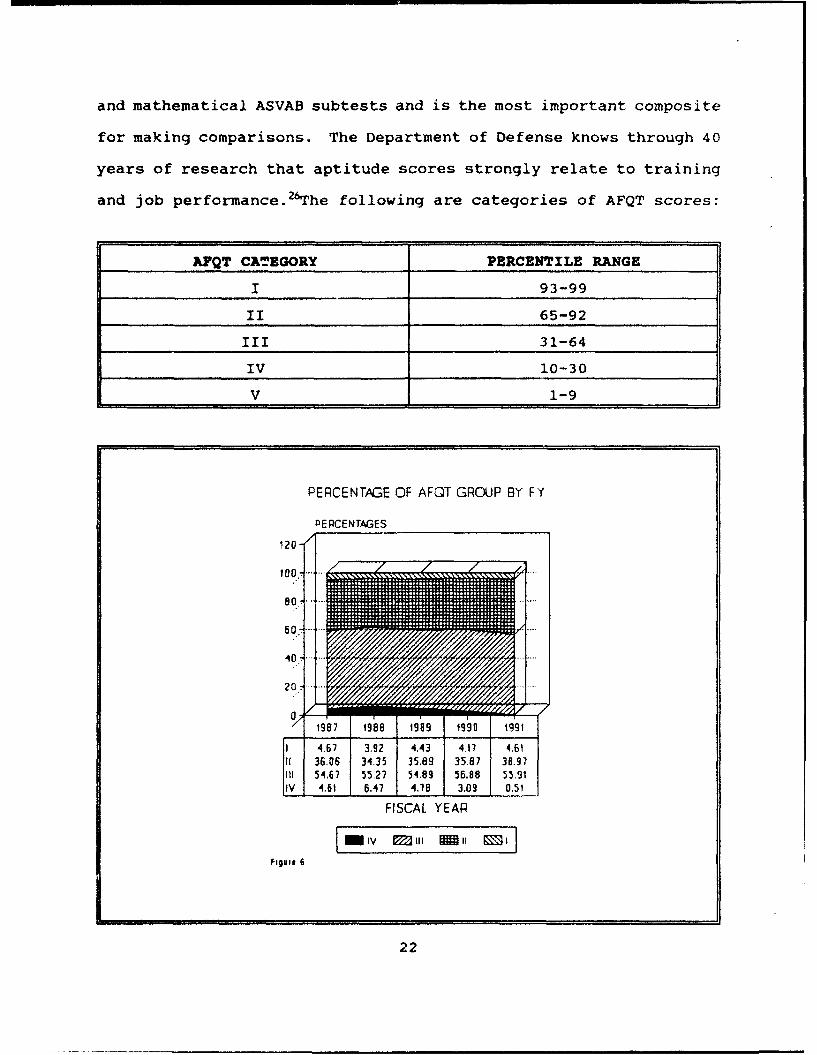
and job performance. 2 6The following are categories of AFQT scores:
AFQT CATEGORY PERCENTILE RANGE
I 93-99
II 65-92
III 31-64
IV 10-30
V 1-9
PERCENTAGE OF AFQT GROUP BY FY
PERCENTAGES
120-..... .....
1987 1988 199 ,990 49911 4,67 3.92 .... 4.43 4.17 4,61
36.06 34,35 35.89 35.87 35.97K 54.67 55.27 54.89 56.88 55.91IV 4.61 6.47 4.78 3.09 0.51
FISCAL YEAR
Im Iv M ill gu ll MI I
FIgull 6
22
The services vigorously recruit individuals in Category I
through Category III. Public law prevents individuals in Category
V from joining the military. The services further divide Category
III into Category IIIA (50-64) and Category IIIB (31-49). Very few
people from Category IIIB or Category IV enter the service. In
fiscal year 1991, only 994 individuals (.5 of one percent) enlisted
from Category IV.
The data in Figure 6 reveals from 1987 to 1991 the recruitment
in each aptitude category remained stable. This stability excluded
a desirable trend of reduced accessions in the lowest categories.
The market for recruiting has been very favorable over the last
decade and DOD expects no major changes to this environment. 27 One
trend is notable. As the educational levels of the military
recruit increased, a reasonable expectation is that AFQT scores
should also have risen. Figure 6 doesn't reflect this tendency.
Military Recruitment and Training 2000
This paper's starting point is the decline in American
education identified in A Nation at Risk. BuildinQ a Quality
Workforce confirmed the concept that a specific purpose of
education is to prepare the individual for the workplace. The
Secretary's Commission on Achieving Necessary Skills identified the
skills needed in the workplace and is building bridges between
business and education. AMERICA 2000 proposed a National Education
Strategy to take America into the 21st Century. The strategic
question for the military is -- so what? What is the impact of
23

these initiatives on military recruiting and training with the
approach of the 21st Century?
The discussion on DOD recruiting points to the assumption that
the military can be discriminating about accessions. An increasing
applicant pool with a diminishing need insures the military can
attract high quality recruits. The services stick to a valid rule
that they "try to set standards as high as applicant supply and
recruiting permit. For, no matter where it is set, a higher
standard will yield more productive results.",28 If the services
can continue to recruit the "best of the best" does this guarantee
that recruits will be easily trainable, and perform satisfactorily
in their jobs? On a graph we would say it is a question of slope.
Can the growing quality of recruits stay ahead of an increasing
need to operate in an environment of increasing technology? The
military services perceive their recruits reflect current America
society and that society is failing to keep pace.
Will AMERICA 2000 improve the quality of the military recruit?
If the states and local communities implement the four part plan
and achieve the six national educational goals, it certainly
should. Discussions about recruits with senior and mid-level NCO's
and petty officers center on the same goals identified in AMERICA
2000 and What Work Reauires of Schools. New members of the
military need to improve their basic skills of reading, writing,
and computation. In my job as the Air Training Command Training
Advisor to Strategic Air Command, the largest user of enlisted
24

training in the Air Force, the most common demands of supervisors
in addition to basic skills was:
- Better troubleshooting skills- Capability to work as part of a team- Mastery of computers and information management systems
Their desires closely parallel many of the six goals in AMERICA
2000 and the five competencies in What Work Requires of Schools.
Savings
A better education system will enhance training capability,
but the question is -- how much? The military services spend more
than 5 billion dollars per year on initial and advanced recruit
training.2 Even improvements on the margins produce noticeable
savings on an expenditure this large.
Increasing the quality of recruits generates savings by
decreasing attrition rates and cutting remedial training for
initial training courses. The military services spend millions of
dollars each year on remedial training. The prevalent focus of
this training is on the basic 3 R's and computers. Often forgotten
is costly remedial training in the areas of drug abuse, domestic
violence, and interpersonal relationships. AMERICA 2000 and What
Work Requires of Schools target these same areas.
Savings are achievable in other ways. Decreasing course
lengths or completing more training in the same period creates
savings. Better prepared students permit managers to reduce course
lengths. Cutting or reducing the extensive knowledge leveling
process occurring at the front end of many training courses also
generates savings. Better students absorb the same amount of
25

material in a shorter time. Fiscal restraints usually take
precedence over curriculum in specifying course lengths and better
prepared students means more material covered in the same period.
Shortening courses or increasing training in the same period are
both hignly desirable goals. Both also help trainers avoid a
collision between a decreasing military training budget and the
ever increasing complexity of new systems.
Industrial Training Model
The impact of these presidential initiatives, although
significant, is only effective on the margins because of the
training system used by the military services. This system is the
industrial training model. The industrial revolution gave birth to
this system and World War II perfected it.
An unskilled new-hire is the assumed input into the industrial
training system. Initial training for that worker is a building
block system of skill levels and tasks. The skill levels for each
task range from "Can perform the task under supervision with only
minor deviations" to "Can teach other individuals the task". A
worker learns simple tasks and then combines individual tasks
together to form more complex task elements. When these task
elements are combined they describe a worker's job.
In World War II, on a fighter assembly line, a trainer might
first have taught a worker to install rivets on a wing. After the
worker mastered that task, the trainer added and combined tasks
until the worker could produce the entire wing assembly or even the
entire airplane. As systems became more complicated, supervisors
26

permanently divided tasks into specialties. In the above example,
the workers who assembled and installed the engine became a
separate specialty from the sheet metal workers.
This system of training and division into specialties is the
structure still used by the military services. The Air Force
divides their enlisted personnel into Air Force Specialty Codes
(AFSCs). The Army calls them Military Occupational Specialties
(MOS) and the Navy term is Naval Enlisted Code (NEC). A growing
complexity of both the missions and weapons systems forced the
services to divide and subdivide into a labyrinth of specialties to
meeting training and mission standards.
For some specialties a dilemma results because the course
lengths for even the most basic apprentice courses are a year or
longer. Some Air Force apprentice avionics courses are more than
260 training days. If you add basic military training and primary
on-the-job training as part of the initial training cycle, the
payback on a four year enlistment may be only two years. The
training-payback dilemma should improve with better recruiting and
achieving the goals in AMERICA 2000. The military services are
also improving training delivery thorough new computer-aided
instruction technologies such as inter-active video disk and
intelligent tutoring. These are short term answers that may not
produce long term solutions.
Solutions
"Train before buy" may be the long term solution. In this
model, the military would contract with institutions that could
27
attract, train, and supply individuals with specific skills. An
example might be automobile mechanics. A school such as the Wausau
Vocational-Technical School would contract with the military to
provide automobile mechanic courses meeting certain specifications.
The military would write two-way contracts with individuals
enrolled in the courses guaranteeing enlistment upon successful
completion of the course.
Through a series of these partnerships, similar to the
Community-Education partnerships advocated in the SCANS report, the
military could realize significant savings. These savings would
include not only the training costs, but also the normal costs
associated with maintaining a person on active duty while they are
basically not contributing to the mission.
This is not a new proposal. The Air Force, Army, and Navy are
all studying assorted renditions of this concept. Many factors
prevented any real implementation of this concept. It is not
possible to quantify the trust in the American education system as
the key factor, however, A Nation at Risk didn't provide a high
level of confidence in those exploring the concept. Achieving the
goals in AMERICA 2000 will overcome this reluctance to deal with
the American education system.
As the length of training courses for sophisticated
technologies continues to increase, the military service will
gradually implement the "train before buy" concept. Reduced
training budgets and a reduced force size requires the services to
examine the ratio of those in training to operational requirements.
28

Operational requirements always win the battle with training. More
effective training delivery is a factor, but will lag operational
technologies.
The military will feel the major impact of AMERICA 2000 when
the "train before buy" system produces large numbers of recruits
who by-pass the traditional military training system. The military
now depends only indirectly on the American education system since
it retrains all recruits. In the "train before buy" system the
quality of the United States military banks on the quality oL the
education system.
Recommendations
One of the profound lessons of Desert Storm is the high
technology weapons systems of the United States work. These
weapons require a high quality force to operate and maintain them.
This quality directly results from high quality accessions and a
superb training system. Challenging this training system is an
increasingly complicated technological workplace. AMERICA 2000
could help meet those challenges. The recommendations are:
1. The Department of Defense study and support the goalsin AMERICA 2000 and the SCANS report. An excellentstart is the new Educational Defense Industry Studyat the Industrial College of the Armed Forces.
2. The Office of the Secretary of Defense should reportthe results of these studies to the Departments ofEducation and Labor for their action and long rangeplanning.
3. The Department of Defense must uphold accessionspolicies that insure the services receive the highestquality recruits.
29

4. The military training communities should explore the"train before buy" concept as a possible solution tothe challenges facing future training.
Prospects
The governors and President Bush are forging ahead with their
national education strategy. The prospects for implementation of
programs that pursue achievement of their six national education
goals look promising. The governors in thirty-two states have
inaugurated America 2000 programs and that number should quickly
climb to forty. The goals are challenging. Educators face
difficulties when trying to check progress toward those goals, but
measurable improvements in the educational system are occurring.
If a national focus on education persists, those improvements
should continue.
The prospects for military recruiting also appear bright. The
quality of DOD accessions should remain high and AMERICA 2000
should improve that quality. The military can recruit all high
school graduates who are in the highest aptitude categories.
The future of military training is unclear. The current
system is still the best for most military training. Reduced
training dollars, however, will force the military to restructure
training. The first choices for the "train before buy" system are
skills that are easily transferrable from the civilian to the
military workforce. Savings are also possible for the longer
training courses. The improvements generated by AMERICA 2000
cannot meet all the future training needs of the military.
30
ENDNOTES
1. A Nation at Risk: The Imperative for Educational Reform. AReport to the Nation and the Secretary of Education. WashingtonD.C., U.S. Government Printing Officer, April 26, 1983. p.1.
2. Ibid., p.5.
3. Ibid., p.6.
4. Ibid., p.8-9.
5. Ibid., p.10.
6. xki., p.18.
7. Ibid., p.19.
8. Ibid., p.22.
9. Ibid., p. 23.
10. Buildina a Quality Workforce. A Joint Initiative of the U.S.Department of Labor, U.S. Department of Education, and U.S.Department of Commerce. Washington D.C., U.S. Government PrintingOffice, July, 1988, pp. 4-5.
11. Ibid., p.35.
12. What Work Reguires of Schools: A SCANS Report for America 2000.Washington D.C., U.S. Government Printing Office, June, 1991, p.vi.
13. Ibid., p. xvii.
14. Ibid., p.15.
15. Blueprint for Action: Building Community Coalitions. WashingtonD.C., U.S. Government Printing Office, June, 1991, p.1.
16. AMERICA 2000: An Education Strategv. Washington D.C., U.S.Government Printing Office, April 18, 1991, p. 13.
17. Ibid., p.12.
18. Ibid., p.22.
19. Ibid., p.23.
31

20. Ibid., p.55.
21. Ibid., p.19.
22. Ibid., p.25.
23. American Education:Making it Work. Washington D.C., U.S.Government Printing Office, April, 1988, p.1.
24. Ibid. p.8.
25. Ibid. pp. 10-14.
26. Janice H. Laurence, Peter F. Ramsberger and Mnnica A. Gribben,Effects of Military Experience on the Post-Sery.ce Lives of Low-Aptitude Recruits: Project 100,000 and the 3VAB Misnorming(Alexandria, VA:Human Resources Research Organization, December,1989), p.2.
27. Ibid., p.3.
28. Ibid., p.5.
29. Ibid., p.4.
32

DEPARTMENT OF DEFENSE NPS ACCESSIONS FISCAL YEARS 1987 - 1991
NON-HS NON-HS GED HS COLLEGE COLLEGE COLLEGEAFQT GROUPS <-3 3-4 CERT GRAD 1-2 3-4 GRADS TOTAL----- ~-----------------------------------------------------------------------------
PERCENTAGE OF AFQT GROUP BY YEAR GROUPFISCAL YEAR 1987
1 0.02% 0.04% 0.06% 3.12% 0.85% 0.17% 0.40% 4.67%II 0.74% 0.92% 1.01% 28.87% 3.24% 0.42% 0.86% 36.06%III 1.24% 1.18% 1.42% 48.08% 2.14% 0.24% 0.37% 54.67%IV 0.00% 0.00% 0.00% 4.47% 0.11% 0.01% 0.01% 4.60%
-----------------------.----- 4 I .............................-- ................
TOTAL 2.00% 2.13% 2.49% 84.54% 6.34% 0.85% 1.64% 100.00%
FISCAL YEAR 1988
1 0.01% 0.03% 0.07% 3.43% 0.06% 0.01% 0.31% 3.92%I1 0.51% 0.66% 1.39% 30.32% 0.31% 0.03% 1.14% 34.35%1II 1.10% 1.19% 2.36% 48.71% 0.20% 0.02% 1.68% 55.27%IV 0.00% 0.01% 0.01% 6.20% 0.02% 0.00% 0.22% 6.47%
TOTAL 1.62% 1.89% 3.82% 88.66% 0.59% 0.05% 3.36% 100.00%
FISCAL YEAR 1989
0 0.02% 0.03% 0.09% 3.81% 0.09% 0.01% 0.39% 4.43%1! 0.40% 0.47% 1.52% 32.09% 0.39% 0.05% 0.97% 35.89%111 0.62% 0.56% 2.18% 50.51% 0.29% 0.02% 0.70% 54.89%IV 0.00% 0.01% 0.00% 4.73% 0.02% 0.00% 0.02% 4.78%
--- --- ......................... ...........-...................-...........TOTAL 1.04% 1.07% 3.80% 91.14% 0.78% 0.09% 2.08% 100.00%
FISCAL YEAR 1990
1 0.01% 0.02% 0.03% 3.72% 0.06% 0.01% 0.32% 4.17%II 0.36% 0.48% 0.94% 32.61% 0.29% 0.04% 1.16% 35.87%II 0.70% 0.69% 1.50% 52.25% 0.23% 0.02% 1.49% 56.88%IV 0.00% 0.01% 0.00% 2.98% 0.01% 0.00% 0.09% 3.09%
TOTAL 1.07% 1.18% 2.48% 91.56% 0.59% 0.06% 3.05% 100.00%
FISCAL YEAR 1991
1 0.00% 0.01% 0.04% 4.00% 0.07% 0.01% 0.47% 4.61%Ii 0.02% 0.13% 0.87% 36.08% 0.39% 0.03% 1.44% 38.97%111 0.04% 0.19% 1.21% 52.86% 0.24% 0.01% 1.36% 55.91%IV 0.00% 0.00% 0.00% 0.50% 0.00% 0.00% 0.01% 0.51%
TOTAL 0.06% 0.33% 2.12% 93.45% 0.71% 0.06% 3.27% 100.00%
ALL FISCAL YEARS
1 0.19% 0.24% 0.29% 9.79% 0.83% 0.11% 0.49% 11.93%1I 0.56% 0.63% 1.28% 36.63% 0.78% 0.09% 0.98% 40.95%III 0.51% 0.54% 1.45% 40.33% 0.21% 0.02% 1.01% 44.05%IV 0.00% 0.01% 0.00% 2.98% 0.01% 0.00% 0.07% 3.07%
TOTAL 1.25% 1.41% 3.01% 89.13% 1.83% 0.21% 2.55% 100.00%
ATCH 1
DOD ACCESSIONSPERCENTAGES OF EDUCATION LEVEL BY FISCAL YEAR
NON-HS NON-HS GED NS COLLEGE COLLEGE COLLEGE<-3 3-4 CERT GRAD 1-2 3-4 GRADS TOTAL
1987 2.00% 2.13% 2.49% 84.55% 6.33% 0.85% 1.65% 100.00%1988 1.04% 1.07% 3.80% 91.13% 0.78% 0.09% L.104 100.00%
1989 1.61X 1.89% 3.82% 88.67% 0.59% 0.05% 3.36% 100.00%1990 1.07% 1.18% 2.47% 91.57% 0.59% 0.06% 3.05% 100.00%1991 0.06% 0.33% 2.12% 93.47% 0.69% 0.06% 3.27% 100.00%
TOTAL 1.24% 1.40% 2.99% 89.49% 2.01% 0.25% 2.62% 100.00%
DOD ACCESSIONSPERCENTAGES OF EDUCATION LEVEL BY FISCAL YEAR
NON-HS HS + TOTAL
1987 4.13% 95.87% 100.00%1988 2.10% 97.90% 100.00%1989 3.50% 96.50% 100.00%1990 2.25% 97.75% 100.00%
1991 0.39% 99.61% 100.00%
TOTAL 2.64% 97.36% 100.00%
ATCH 2