education and development in the englis -h speaking
TRANSCRIPT
EDUCATION AND DEVELOPMENT IN THE ENGLISH - SPEAKING CARIBBEAN A Contemporary Survey
UNESCO ECLA UNDP
; »UUU I4221 - BIBLIOTECA CEPAL I
;
PROJECT DEVELOPMENT AND EDUCATION IN LATIN AMERICA AND THE CARIBBEAN


Organización de las N a c i o n e s U n i d a s para la Educación, la Ciencia y la Cultura
proyecto "Desarrollo y Educación en América Latina y el Caribe"
Naciones Unidas
Comisión Económica para América Latina
Programa de Jas Naciones Unidas
para ei D e s a r r o l l o
Laurence D. Carrington
EDUCATION AND DEVELOPMENT IN THE ENGLISH-SPEAKING CARIBBEAN
A CONTEMPORARY SURVEY
Introduction by GermSn W. Rama
Distr. GENERAL DEALC/16 October 19 78
780801 ORIGINAL: ENGLISH


CONTENTS
Chapter Page
INTRODUCTION i
FOREWORD . 1
I ECONOMIC INDICATORS 3 Area and Population 3 External trade and its direction 5 Government Revenue and Expenditure 12 Gross Domestic Product 13 Tourism 17 Political Status and Orientation 18 Summary 20
II LABOUR FORCE 21 Jamaica 21 Barbados 25 Guyana 26 Trinidad and Tobago 28 Windward and Leewards 29 Summary 31
III REGIONAL CHARACTERISTICS 33 Primary and secondary 33 Common Problems 35 Pre-Primary Level 35 Primary Level 36 Secondary Level 39
IV EDUCATION WITHIN NATIONAL GOALS 43 Barbados 43 Primary Level 44 Secondary Level 45
Guyana 48 The Pre-primary Sector 54 Primary Education 54 Secondary Education 57 School types at the secondary level 61 Other provisions . . . 61 Guyana National Service 62
Jamaica 62 Pre-primary Level 65 Primary Education 65 Secondary Education 68
Trinidad and Tobago 70 Primary Level 70
- i -
Chapter Page
Secondary Level 73 Technical and Vocational 75 Windwards and Leewards .. 79
V THE UNIVERSITIES 81
VI LANGUAGE AND DEVELOPMENT 85 Language and Development Problems 85 Attitudes toward Creoles 86 The Effects of Language Conflict 86 Policy development 87
VII OVERVIEW 89
SUMMARY - .RESUME - RESUME*! 93
APPENDIX I - Dependency ratios 97
APPENDIX II - Notes on the labels for types of schools . . . 99
APPENDIX III 101
APPENDIX IV - Jamaica. Flow diagram: Pre-primary, Primary and Secondary Levels 113
APPENDIX V - Barbados. Flow chart of school system . . . . 115
APPENDIX VI - Guyana. Flow chart of school system 117
BIBLIOGRAPHY . . . . . . . . 119
List of tables
Number Page
1 Area and population of English-speaking Caribbean States . . 4
2 Urban population - English-speaking Caribbean 5
3 Direction of trade, Barbados, Guyana, Jamaica, Trinidad 6 Tobago, 1967 and 1974 6
4 Direction of trade. Barbados, Guyana, Jamaica, Trinidad £ Tobago, 1967 and 1974 7
5 Barbados - Selected domestic exports of total domestic exports, 1975 . . . . . . . . . . . . . . . . 8
- ii -
imb'
6
7
8
9
10
11
12
13
14
15
16
17
18
19
20
21
22
23
24
25
Trinidad £ Tobago. Exports and imports
Trinidad £ Tobago. Exports of petroleum sector vs. agricultural sector . .
Exports, imports and trade balances. Barbados, Guyana, Jamaica, Trinidad £ Tobago
Imports, exports and balances 1975
Government revenue and expenditure .
Gross Domestic Product at current factor cost, 1976 . . . .
Comparative growth of GDP, Guyana, Jamaica, Trinidad £ Tobago, Selected years
Barbados: Contribution to GDP of sectors
Guyana: Contribution to GDP of industrial sectors
Jamaica: Contribution to GDP of industrial sectors, purchasers' values, current cost
Trinidad £ Tobago: Contribution to GDP of industrial sectors
Jamaica: Labour force by training received
Jamaica: Unemployed labour force by training received . . .
Labour Force, employed and unemployed highest level of education attained
Jamaica: Occupational grouping of the unemployed labour force
Sectoral distribution of unemployed labour force
Working population 15 years and over by level of education. Jamaica, Trinidad £ Tobago, Guyana, Barbados, 1970
Vacancies available, Guyana, 1970
Industrial distribution of labour force, Trinidad £ Tobago, 1970 and 1974
Working population by main occupation groups, Windwards and Leewards, 1970
- iii -

Number P ag e
26 Working population by major industrial groups, Windwards and Leewards, 1970 30
27 Working population 15 years and over by level of education, Windwards and Leewards, 1970 31
28 Barbados. Teachers actually in government owned and/or maintained schools at June 30, 1973 47
29 Guyana: Regional distribution of schools, places and surplus/deficit, 1970 and 1975 55
30 Guyana: Involvement ratio of pupils, primary schools, first level 56
31 Guyana: Trained teachers by educational administrative districts, 1970 and 1975 57
32 Guyana: Schools designated secondary by administrative district, 1970 and 1975 . . 58
33 Guyana: Distribution of students enrolled in the secondary departments of all age schools, 1970 and 1975 59
34 Involvement ratios, secondary cycle, 1970 and 1975 59
35 Guyana: Teachers in schools designated secondary by qualifications and status, 1970 and 1975 60
36 Jamaica: Schools, places and overcrowding in primary and all age schools, 1975-76, by parish 66
37A. Jamaica. Teacher: Pupil ratios by parish showing overall ratios and trained teacher ratios, primary schools 67
37B. Jamaica. Teacher: Pupil ratios by parish showing overall ratios and trained teacher ratios, all age schools 67
38 Jamaica. Levels of teacher training in new secondary and secondary high, 1974 70
39 Trinidad S Tobago. Distribution of schools places and enrolment by planning regions 71
40 Trinidad & Tobago. Distribution and training of teachers and teacher: pupil ratios 72
41 Trinidad 6 Tobago. Regional distribution of secondary school places, October 1977 74
- iv -

Number
4-2 Graduate and non-graduate proportions secondary schools. Trinidad £ Tobago 1977 75
4-3 Under-graduate student registration, full-time degrees, 1976-1977 82
44 University of Guyana: distribution of students by faculty, 1975 84
- v -


INTRODUCTION
The study made by L.D. Carrington is part of an overall investigation by the Project on styles of educational development.
Two lines were explored in carrying out the programme. Following one of these, an investigation was made of the role of education in countries where priority was assigned to education within a modernization and national integra-tion policy. Two case studies were made following this line.
In one case, arrangements were made with the National Planning and Co-ordi-nation Board of Ecuador (JUNAPLA) to conduct a study on "Education in the Modernization Process of Ecuador", to be published in 1978. In this case, petroleum was the instrument that set in motion the dynamic forces of the economy, and its exploitation gave rise to certain changes in the Ecuadorian development process. This economic change made it possible to undertake a social development policy wherein education began to play an important role in the modernization of the country, while at the same time experiencing the contradictions of the overall process of change.
o The second case study was made in Peru, on "Social Structure, Development
and Education in Peru (1950-1975)", which will shortly be completed. The outstanding feature of the Peruvian process is the political decision to introduce changes in various social spheres - education among them - and the balance between the achievements and the limitations resulting from the inertia of the social system vis-a-vis the changes originated in the political power.
At the same time, the information available indicated that small countries of the Latin American region, as they attained social status as a nation, supported educational policies which led to significant achievements which appeared to be far beyond what might be expected from their economic resources and other structural conditions. The explanation for such educational policies had to be sought in different reasons, and their results would make it possible to consider from another angle the relative backwardness in education in other Latin American societies.
In response to this concern, and following the second line of research, two studies were published by the Project: "Education and Development in Costa Rica" (DEALC/2), and "Education and Development in Paraguay. Basic Education" DEALC/7), and now presents a study on development and education in the principal English-speaking Caribbean countries: Barbados, Guyana, Jamaica and Trinidad and Tobago.
Notwithstanding the fact that the first two countries are of Spanish tradition and the rest are former British colonies in the West Indies, a detailed analysis shows that these national cases have common features in their social structure and in the orientation of their educational policies, which justify their inclusion in the same line of exploration.
In the social sciences, comparison between different social structures has recognized limits and problems. Each national society possesses a history and a cultural significance of its own which encourage anthropological analysis, and
- vii -

what Pierre Bourdieu and Jean-Claude Passeron called "resignation to non-compa-rability" "/ or else, a reduction of the social specificity of the phenomena under study, restricting the approach to some of their dimensions, which, while it facilitates comparison, does not reflect the complexity of the social situation.
Moreover, it should be borne in mind that an analysis of education should not overlook the social use of education, of its significance in terms of employment, status, political participation, etc., and of the society and its various groups. Similar indicators can conceal different and even opposed configurations, since each indicator can only be evaluated in accordance with the significance it acquires in society.
Consequently, the following remarks are aimed merely at describing a minimun of common features and trends that make it possible to reflect on the importance of socio-political factors in educational development. In the parti-cular cases of Costa Rica, Paraguay and the Caribbean countries, the significance of the socio-political variables should be placed in the context of what is often called small nations. While this has not yet been the subject of special studies in Latin America, it can be argued that the small size of the nation is associated with two main features: on the one hand, the spectrum of possible styles of development is much more limited than that of large countries; on the other hand, in certain conditions, its small size is a contributing factor to the emergence of trends towards national integration in which education plays an important role.
While it is not possible in this Introduction to consider the general problem of the small countries, it should be noted that, in reviewing their unfavourable and favourable forms, Carlos Real de Azua recognized among the latter cohesion and mobilization, stating that "... cohesion or homogeneity above the average can be diagnosed as traces of nature, if not of the essence of the small size of the nation" .*According to our assumption, in those societies which turn to become nations the problem of national viability, affected by the weakness of the international system of power and the economic disadvantages of scale, strengthens the mechanisms of social, integration and/or
V in "La comparabilité des systèmes d'enseignement", included in Robert Castel and Jean-Claude Passeron: Education, développement, démocratie, Ed. Mou-ton, Paris, 1967.
*"/ In Latin America, national and social integration policies based on education had an important precedent in the case of the River Plate countries, starting in the last third of the nineteenth century. These were analysed by Gregorio Weinberg in Modelos educativos en el desarrollo histórico de America Latina (DEALC/5) and Carlos Filgueira in Expansión educacional y estratifica-ción social en américa Latina 1960-1970 (DEALC/4).
""/ Carlos Real de Azûa, "Las pequeñas naciones y el estilo de desarrollo constrictivo" in Revista de la CEPAL, Second Semester, 1977. United Nations Publication, Sale- No.S.77.II.G.5 , page 67. The' article presents a comprenhen-sive bibliography on the subject, to which should be added, in view of the importance it assigns to education in structuring the type of society defined as a nation, the work of Kalman H. Silvert and Leonard Reissman, Education, Class and Nation. The Experiences of Chile and Venezuela. Ed. Elsevier, New York,1976.
- viii -

requires a special consideration of the problem of the quality of human resources. In both cases 3 and particularly when they appear simultaneously, the role of education becomes a key factor in the difficult development strategy in small nations *_/.
In the first place, the countries mentioned have in common their small size in relation to the Latin American scale. The largest is Paraguay, with an area of 406,752 kin2, and Barbados is the smallest, with 430 km2. But the former, owing to its history and to ecological reasons, has a region to the west of the Paraguay river which, while it covers 60% of the country's total area, contains only 3% of the total population, whereas 70% of that population lives in an oval, the largest diameter of which is approximately 200 km, with Asuncion, the capital city, in its centre. Guyana - the second country in size - is in a similar situation to that of Paraguay for, although it is 214,970 km2 in area, its 790,000 inhabitants are concentrated in very limited coastal areas; consequently, in both countries the larger size is in reality of virtual use.
As well, the populations are small. Paraguay, Jamaica and Costa Rica, in decreasing order, fluctuate around 2,000,000 inhabitants, while Trinidad and Tobago has approximately 1,000,000; in the rest of the English-speaking countries the figures are lower still.
In the third place, these countries are undergoing a phase of demographic transition insofar as urbanization is concerned. In 1975, Paraguay's urban population was 39.6%, Costa Rica's 42.2%. In 1970, Jamaica had an urban population of 37.1%; Guyana, 40%; Trinidad and Tobago, 45%; and Barbados, 54.3%. In other words, except in Barbados, which is a special case because of its small territory, in all other cases the majority of the population still lives in rural areas.
In the fourth place, these countries, according to the World Bank's rating, are in the per capita income category of 500-1,999 dollars. The two South American countries had a per capita income in 1975 of about 500 dollars; Costa Rica, 800 dollars; Barbados and Jamaica, 1,200 dollars; while Trinidad and Tobago, with its 1,700 dollars, reflects the favourable position of a petroleun-producing country. Dispersion of the figures is considerable, and there is a broad range of countries which, because of their intermediate economies, has been defined as the world's middle class, transferring to the international sphere the elusive concept of the social sciences and establishing, in the same way that they do, a negative definition: the countries that are neither notoriously poor nor admitted-ly wealthy are included in this category.
Finally, the cases considered in this study present a special educational configuration in the context of Latin America. As regards illiteracy in the population under 15 years of age, some countries have almost eradicated it: the percentage of illiteracy in Barbados was 5% in 1974; in Trinidad and Tobago, 4% in
*/ An example of the problems, with particular reference to human resources and social democracy as components of the national definition for New Zealand can be found in W. B. Sutch, Colony or Nation, Sydney University Press, Second edition, QirHnov 1 QR 8 . J 3

1975; on the other hand, in other cases, although the percentage ranges from 10% to 20% (Costa Rica, 11.6% in 1973; Guyana 15% in 1970; Jamaica, 18.1% en 1960; and Paraguay, 19.8% in 1972), the literacy strategies in Jamaica and the educa-tional policies in the remaining societies have caused significant drops in the illiteracy rate in the 10-19 age group, as revealed by the examples of Costa Rica and Paraguay (4.8% and 13.9%, respectively) /, thus making it possible to consider those countries as candidates for the residual illiteracy category.
With regard to the coverage of primary education, as in the case of literacy, these countries are among those that undertook to modernize education at an early stage.
While in 1960 the gross rate for primary education was 100% (even higher in some cases) the corresponding rates for intermediate education were very weak: 10% in two countries - Jamaica and Paraguay -, 20% in Costa Rica and Trinidad and Tobago, and higher rates in: Barbados and Guyana. Coverage for higher education in all countries was 1% to 2% in the 20-24 age-group, with the sole exception of Costa Rica, where it was already 5%.
In the following fifteen years, the most salient feature was the expansion of intermediate education: slow in Paraguay, intermediate rates in Costa Rica and Jamaica, and higher in Barbados and Guyana, which had started off with higher rates, and where they reached a gross attendance of the order of 50% ••*/
Insofar as higher education is concerned, while the rate of growth during the period under review was not negligible, considering the starting point, with the exception of Costa Rica these countries barely attain a coverage of around 5%, which places them in a similar, or even lower, position than the countries with the weakest educational development of the region. (In 1975, the rate in Nicaragua was 6.7%; in Honduras, 4.5%; in El Salvador, 7%, and in Guate-mala, 4.3%) ***/.
As a whole, these trends show the main characteristics of the educational strategies of the countries concerned. In all cases, priority was always given to literacy and primary education; furthermore, policies were implemented in a systematic manner, and succeeded in reducing illiteracy and in reaching a considerable coverage in basic education. In the meantime, intermediate educa-tion was limited to training of the manpower indispensable for employment in the tertiary sector and, to a lesser degree, to the teaching of manual techniques. The training of cadres and skilled technicians was restricted to the minimun
Source of data: ECLA: Indicators of economic and social development in Latin America, 1976, E/CEPAL/1021, 18 November 1976 ; and Inter-American Develop-ment Bank: Economic and Social Development in Latin America, Report 1976, Washing-ton D.C.
**/ Unesco, Statistical Yearbook 1975, Paris, 1976. The rates are different from those given by Lawrence Carrington, since he uses net rates, for one type of intermediate education only.
"**/ See Table No. 5 in DEALC/7, Educación y desarrollo en el Paraguay. La enseñanza básica, Buenos Aires, September 1977.
- x -

requirements. Thus, Costa Rica kept its university closed until 1940, while in Barbados and Trinidad and Tobago, with primary education rates of 100% and over, the higher education rate was not above 1%.
The desire for social integration reflected by this policy is obvious. In one way or another, the centres of power in these societies set about obtaining the participation of the population in a common - written - code, and providing access to the basic levels of reasoning; in other words, based .on certain social values, to become integrated for the purpose of defining its national identity and internalizing the values of the dominant social group (and, in certain societies, other stabilizing values of the model of society). In the case of the island in the Caribbean, the British Empire appeared interested in the socialization of its colonies in their transition to independence. Later, the independent states turned to the building of a democratic nation on the basis of multiracial and multilingual populations.
In the case of Costa Rica, the educational proccess which started at the end of the nineteenth century reflects throughout the formation of a social system characterized by a class alliance. This alliance is at the base of a society wherein the national identity and a democratic political concept are closely linked by the fact that education is the support of both and the most suitable instrument of social advancement. Concentration on primary education indicated the role of the middle classes of coffee-growers in the structure of power, in the same way that the recent expansion of intermediate education, and particularly of higher education, indicate the role played by middle-class paid workers closely connected with the State and the services.
The peculiar phenomenon of national integration in Paraguay is no less evident Its Spanish-Guarani bilingualism and the constant factor of its evolution as a dramatic sanguinary experience of two wars with Latin American countries, were reinforced by a long history of international isolation, all of which nurtured a type of identity based on strong traditional roots. In this country, the most markedly rural one of those reviewed, elementary education could hardly be oriented toward the training of human resources, which the economic system even today only requires in limited numbers. The key to the social demand for education must be sought in the need of the Guarani-speaking population to have access to the Spanish language, and in the necessary sociali-zation prior to the international or internal emigration; as for the key to the official supply of education it must be sought in the desire to incorporate and transmit those values suitable to social stabilization.
Furthermore, the purpose of controlling the social demands of emerging groups is another constant factor, as notorious as bilingualism. The economic structure of the countries under review did not call for large volumes of human resources graduated from intermediate and higher education to provide education for those levels at an early stage of educational development would have meant less resources for integration activities and favoured the consolidation of new social groups that would have demanded employment, consumption, and power in keeping with their educational levels. In the Caribbean, the colonial powers had avoided this type of educational development; and in the case of higher education, the reasons that led them to choose the socialization of local elites

in metropolitan universities is obvious -jj.
While, in the independent stage, the English-speaking states of the Caribbean expand opportunities for receiving intermediate and higher education, they are doing so in accordance with a development plan, with different types of interme-diate eduqation which are not equal as regards academic and social education, which imply the expansion and controlled incorporation of new social strata. At the same time, a functional relationship is established between the employment market and education, whereby the former tends to recruit employees maintaining the correlation of a hierarchy of certificates and degrees and a hierarchy of employment. Consequently, education plays the role of an adjudication court of social status.
In the case of Costa Rica, the policy of constraint was so evident that the university was closed from 1888 to 1940, and intermediate education concen-trated on teacher training. The stages subsequent to the 1948 revolution marked the rise of urban middle-class social groups which, in a circular relationship with the transformations in the economic structure and with the new duties of the State, influenced the vigorous change in the orientation of the educational system. Thus, in 1975, the gross school attendance rates were 50% in intermeJ diate education, and 15% in higher education.
In all cases, the educational model would appear to be changing. However, Paraguay is the country that maintains its previous orientation most strictly. On the one hand, the output or primary education is very low, which implies a lower demand for intermediate education; on the other, the country's style of development causes a greater subordination of the different variables to the problems of power and a definite policy in terms of limited social participation.
As regards educational strategy, the State plays a dominant role in the countries under study. The resulting educational styles cannot be explained by the demands of the economic system which, as already mentioned, had and still has limited differences in most of the countries. Neither is it possible to refer to the income levels of societies and explain the education policy as a result of prosperous economies, since the per capita income of three of the countries are well below the regional averages, in opposition of the three remaining countries, which are over. Not only is there economic disparity, but in all structure's there are problems characteristic of the economies of small countries which produce a single primary product for exports.
It should be borne in mind that the democratizing effectiveness of a policy which assigns priority to elementary education depends on the presence of other democratizing factors in society. In this regard, education is one of the agents that take part in the process, and its effects are significant when
*/ In accordance with the 1960 censuses of Barbados, Guyana and Trinidad and Tobago, the persons who had obtained some degree of higher education in relation to the total persons with some degree of completed study amounted to 0.4%, 0.3% and 0.5% respectively. Source: America en cifras, 1970. Situación cultural. Educación y otros aspectos culturales, Table 501-04, Washington, 1971.
- xii -

they strengthen the rest of the social actions.
The countries under review only comprise a very small part of the population of Latin America - approximately 2.7% of the total for the region; consequently, their characteristics are not indicative of general trends. However, although their quantitative weight may be small, these cases are significant inasmuch as they carry an implicit political will in their educational development, particu-larly when compared with the situation prevailing in Latin America */.
In this context, L.D. Carrington's study contributes a number of facts concerning the characteristics of the educational process in the English-speaking countries of the Caribbean, and establishes its relationships with the economic and social process at different levels of analysis.
The point of departure for the analysis is the long history lived by these Countries under colonial conditions which accounts for the traits they have inherited. These range from their configuration as small territorial scale states to problems of integration in society of population of the most varied ethnical and cultural contexts, which still preserve even different language codes, transferred to those countries to supply the manpower requirements of the colonial system.
The role of education in social integration is stressed by L.D. Carrington, who points out not only the importance of the increased proportion of literate citizens, but also the dissemination to the population as a whole of certain levels of education formerly reserved for dominant social sectors protected by the ruling powers.
However, his analysis does not stop at an elementary dimension of democra-tization, but serves as a starting point for considering the difference between development plans and development philosophies, and for including a complex analysis on the relationship between the educational system and the cultural pattern of the metropolis, on the problem of the values transmitted by the educational system and the need for- a democratic process. This enables him to show the contradiction between still strongly agricultural economies and the pedagogical orientation of the educational system toward codes and evaluations of an intellectualistic type which are not only contrary to the social status of large majorities but introduce a form of social and intellectual selection that can affect the democratic building of the new nations.
Finally, the study contains a shrewd survey of statistical, programmatic and educational policy data in the English-speaking countries of the Caribbean, viewed for the first time from a regional angle.
The detailed description of situations and problems within the framework
Brazil is a clear example that development policies have not chosen education as the major channel for social integration. The 1970 census reveals that 7.5% of the people in the 20-24 age group had received 12 or more years of schooling, which places them in the higher education level, while 29.8% had received no type of education whatsoever.
- xiii -

of an analysis of development, also makes it possible for Latin American autho-rities and specialists in education to gain information and understanding of a model of social and educational development with plenty of suggestions for the Latin-speaking countries.
- xiv -

FOREWORD
The education systems and practices of the formerly British, English-speaking Caribbean countries were originally transplanted from the United Kingdom during the colonial period. Initially, the concern was for the education of expatriate children who were expected either to be re-integrated into metropolitan society or to fulfil purposes of the metropolis if they continued residence in the colonies. Admission of non-expatriates at a later stage was primarily intended to provide cadres of clerks and middle-order administrators or professionals whose ultimate function would be determined by the metropolitan government or if not, would be in keeping with that government's purposes. Change and development in education in the colonies lagged far behind the "home country", when developments took place they were sporadically initiated, partial in their application to the educational systems, and conceived as adjuncts to the metropolitan mainstream. Prior to the development of representative government, expansion of the capacity and range of the school system was related to increases in the needs of the bureaucracy and to placatory responses to popular pressures for expansion of opportunity.
In the period between the inception of representative government and independence (or quasi-independence), managerial transfer to regional controllers was effected. This transfer did not necessarily involve revision of the form, content or aims of the systems. Where such revisions took place, continued economic control by the metropolis effectively restricted the usable leeway for re-orientation. Post-independence developments show that the patterns of borrowed systems and practices continue to dominate education. Articulation of different societal goals and of indigenously based developmental patterns has not substantially affected the orientation as distinct from the range of education. If the influence of these inconsistencies is not to be self-perpetuating, a searching study of education for development must be undertaken.
As a step in the direction of such analysis, this study aims at providing a concise summary of the state of education in the English-speaking countries of the Caribbean in general but with special emphasis on Barbados, Guyana, Jamaica and Trinidad and Tobago. The state of education will be examined against the background of the economic conditions and social directions of these countries in such a manner as to highlight any functional relationships that exist between education and development.
There is an important constraint that limits the fullness of the study. It has been difficult to acquire statistical data which are at once recent, reliable and comparable for all countries. Equally variable is the availability in published form, of details on curricula in the region If. The reasons for this are several. Firstly, most of the countries have only recently assumed responsibility for their social and economic development and have relatively recently established either statistical units, educational planning units or both. Consequently, the range and accuracy of the published statistical information varies from one country to another. Secondly, ministries of education and
1/ To some extent, the degree of data availability is a comment on the attitudes of the regional governments towards their education planning.
- 1 -

statistical offices in the region have different attitudes to the release of information that is not yet published. Where some are willing to provide unpublished information as recent as 1977, others commit themselves only to published information.
Finally, government agencies differ in promptness of reply to correspondence. Overcoming these restrictions would have required a much longer time for the preparation of the study since it would have been necessary to extrapolate considerable secondary information from restricted primary sources as well as visit each country for periods which would have been impracticable 2/. However, every reasonable effort has been made to reduce the adverse effects of the unevenness of data by careful screening of available information.
A second limitation on the possible completeness of the study is that it does not incorporate a historical review. Full appreciation of the rate of expansion and evolution of the systems is only possible by reference to the history of education and society in the region. However, in the case of this study, such an inclusion risks a shift of its focus to a record of achievement rather than an analysis of the current situation and its possible future orientation. The historical background can be obtained from other studies which are listed in the bibliography.
Basic indicators of the economies of the region are presented in the first section along with brief summaries of the socio-political orientation of the governments. This is followed by a survey of the labour force in the region with particular emphasis on levels of employment and of education and training within the labour force. Against this background, a survey of the formal provision for education is provided. The whole is used as a referential base for critical discussion of general and specific problems of education and development in the region.
It is important to note that the study is not comparative in intent. Comparisons are inevitably made but they are not the main goals of the work.
2/ Countries visited for data collection and verification purposes were Antigua, Barbados, Guyana, Jamaica, St. Lucia and Trinidad and Tobago.
I. ECONOMIC INDICATORS
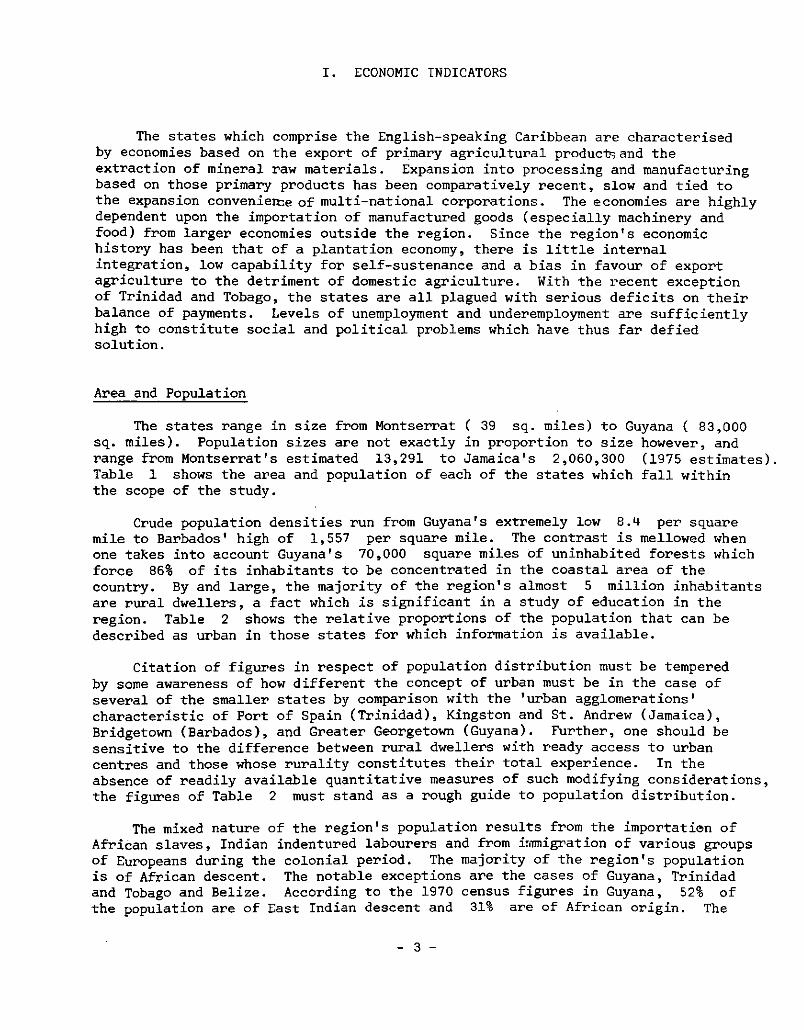
The states which comprise the English-speaking Caribbean are characterised by economies based on the export of primary agricultural products and the extraction of mineral raw materials. Expansion into processing and manufacturing based on those primary products has been comparatively recent, slow and tied to the expansion convenierce of multi-national corporations. The economies are highly dependent upon the importation of manufactured goods (especially machinery and food) from larger economies outside the region. Since the region's economic history has been that of a plantation economy, there is little internal integration, low capability for self-sustenance and a bias in favour of export agriculture to the detriment of domestic agriculture. With the recent exception of Trinidad and Tobago, the states are all plagued with serious deficits on their balance of payments. Levels of unemployment and underemployment are sufficiently high to constitute social and political problems which have thus far defied solution.
Area and Population
The states range in size from Montserrat ( 39 sq. miles) to Guyana ( 83,000 sq. miles). Population sizes are not exactly in proportion to size however, and range from Montserrat's estimated 13,291 to Jamaica's 2,060,300 (1975 estimates). Table 1 shows the area and population of each of the states which fall within the scope of the study.
Crude population densities run from Guyana's extremely low 8.4 per square mile to Barbados' high of 1,557 per square mile. The contrast is mellowed when one takes into account Guyana's 70,000 square miles of uninhabited forests which force 86% of its inhabitants to be concentrated in the coastal area of the country. By and large, the majority of the region's almost 5 million inhabitants are rural dwellers, a fact which is significant in a study of education in the region. Table 2 shows the relative proportions of the population that can be described as urban in those states for which information is available.
Citation of figures in respect of population distribution must be tempered by some awareness of how different the concept of urban must be in the case of several of the smaller states by comparison with the 'urban agglomerations' characteristic of Port of Spain (Trinidad), Kingston and St. Andrew (Jamaica), Bridgetown (Barbados), and Greater Georgetown (Guyana). Further, one should be sensitive to the difference between rural dwellers with ready access to urban centres and those whose rurality constitutes their total experience. In the absence of readily available quantitative measures of such modifying considerations, the figures of Table 2 must stand as a rough guide to population distribution.
The mixed nature of the region's population results from the importation of African slaves, Indian indentured labourers and from immigration of various groups of Europeans during the colonial period. The majority of the region's population is of African descent. The notable exceptions are the cases of Guyana, Trinidad and Tobago and Belize. According to the 1970 census figures in Guyana, 52% of the population are of East Indian descent and 31% are of African origin. The
- 3 _

Table 1. Area and population of English-speaking Caribbean states
State Area sq.miles
1970 population-
Later Estimates
Antigua & Barbuda 170 65,850- 70,52 0 Barbados 166 237,701 258,500 Dominica 305 70,513 ... Grenada 120 93,858 .. . Guyana 83,000 701,885 Jamaica 4,411 1,848,512 2,060,300 Montserrat 39 11,698 13,291 St. Kitts-Nevis-Anguilla 139 45,608 . . . St. Lucia 233 100,893 111,800 St. Vincent 150 87,305 128,300 Trinidad S Tobago 1,980 940,719 1,066,950
>2/
!¡/
Sources: a/ Census Research Programme,U.W.I.:1970 Population Census of the Commonwealth Caribbean, Vol.3, Table A, p.2, 1973. b/ Government of Antigua: Antigua Statistical Yearbook 1976, Statistics Division, Ministry of Finance, 1977. c/ Barbados Statistical Services: Monthly Digest of Statistics, No.12, Dec. 1976, Bridgetown, April 1977. d/ Government of Jamaica: Economic and Social Survey, Jamaica 1975, National Planning Agency, Kingston, undated, e/ Government of Montserrat: Fourth Statistical Digest 1976, Plymouth, undated, fj Government of St. Lucia: Annual Statistical Digest 1975, Castries 1976. g/ Trinidad £ Tobago Central Statistical Office: Population and Vital Statistics~1974 Report, Port of Spain, 1977.
remaining 17% are comprised in descending order of numbers of persons of mixed blood, Amerindian, Portuguese, Chinese and European descendants and a couple hundred person of unspecified ethnicity. In Trinidad and Tobago, 42.8% of the population is of African descent and they exceed only slightly the East Indian population - 40.1% . The remainder of the population is distributed as follows: Mixed - 14.2% , White (European) - 1.2% , Chinese - 0.9% , Other - 0.8% . In Belize, it is the group classified as 'Mixed' which is the largest - 32.8% , while the population of African descent stands at 30.7% . Amerindians comprise 18.6% of the population. The category 'Other' stands at 11.4% , while the remaining 3.7% is comprised of Whites, smaller proportions of East Indians, Chinese and other groups.
- 4 _

Table 2. Urban population - English-speaking Caribbean (percentages)
Country
Antigua £ Barbuda Barbados Dominica Grenada Guyana Jamaica Montserrat St. Kitts-Nevis St. Lucia St. Vincent Trinidad £ Tobago
33.7 3.7 (54.3)-b/
40.0 37.1 11 .1 34.1 n. a n.a 12.4 (45.0)-
Sources: a/ United Nations Demographic Yearbook 1975, New York 1976, Table 6. Figures based on 1970 census except where indicated to the contrary.The definition of 'urban' differs from one country to the other but the following information indicates what the figures'represent. Antigua's figures are based on the population of St. John's; Barbados on Bridgetown alone (see note b/); Jamaica on Kingston and the metropolitan area together with selected main towns; Montserrat on the town of Plymonth. The basis for Guyana and St. Kitts-Nevis is not available. See note d/ for Trinidad and Tobago, b/ If one includes the parishes of St. Michael and Christchurch which are, for all practical purposes, the major part of the urban complex, the figure would be 54.3%. c/ U.W.I. Development mission: The economic and social development of Grenada, unpublished, ISER, 1968. d/ Harewood (1975) includes the special urban areas west of Port of Spain and along the Eastern Main Road strip. This inclusion provides the much more realistic figure of 45% based on the 1960 census.
External trade and its direction
The strong dependence of the economies from the commercial exchange is a visible manifestation of the colonial past of the region. The agriculture basis of all of them, mining for exportation and, recently in Trinidad, the discovery of new oil reserves, draw a panorama with large opening in relation with the foreign trade. This high sensibility of the performance of the internal economy to commercial exchange shows how convenient the analysis and the direction of the trade are, in order to consider afterwards its Contribution to form the GDP in the different countries of the region.
5
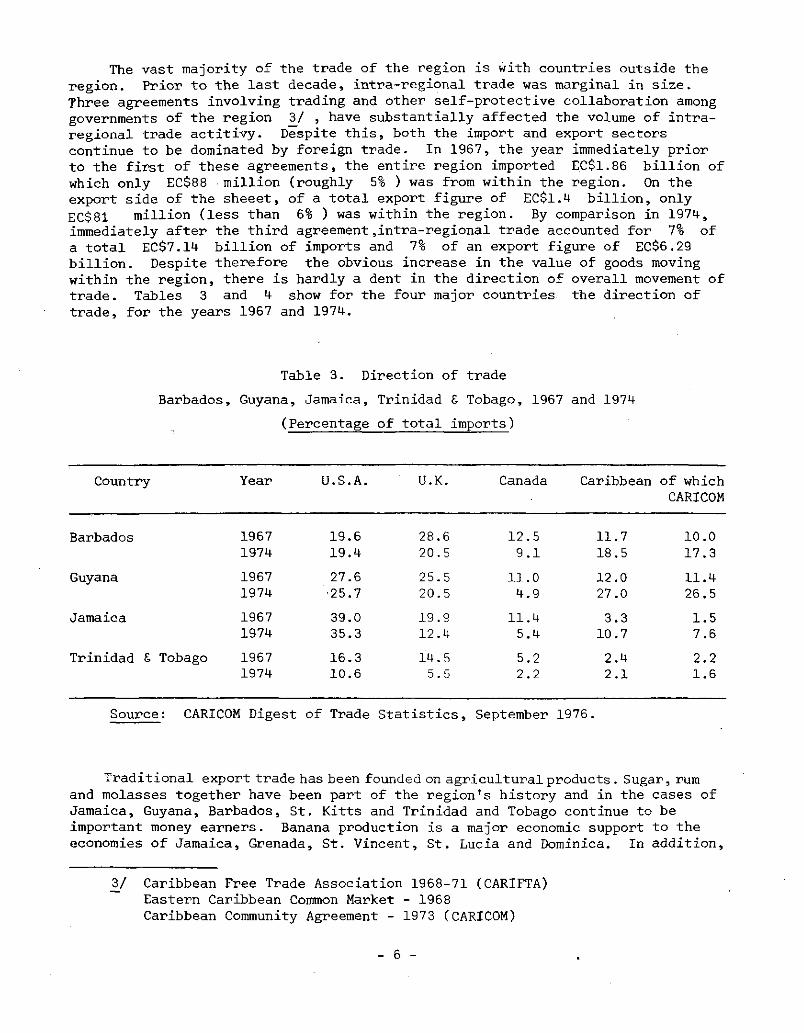
The vast majority of the trade of the region is with countries outside the region. Prior to the last decade, intra-regional trade was marginal in size. Three agreements involving trading and other self-protective collaboration among governments of the region 3/ , have substantially affected the volume of intra-regional trade actitivy. Despite this, both the import and export sectors continue to be dominated by foreign trade. In 1967, the year immediately prior to the first of these agreements, the entire region imported EC$1.86 billion of which only EC$88 million (roughly 5% ) was from within the region. On the export side of the sheeet, of a total export figure of EC$1.4 billion, only EC$81 million (less than 6% ) was within the region. By comparison in 1974, immediately after the third agreement,intra-regional trade accounted for 7% of a total EC$7.14 billion of imports and 7% of an export figure of EC$6.29 billion. Despite therefore the obvious increase in the value of goods moving within the region, there is hardly a dent in the direction of overall movement of trade. Tables 3 and 4 show for the four major countries the direction of trade, for the years 1967 and 1974.
Table 3. Direction of trade Barbados, Guyana, Jamaica, Trinidad £ Tobago, 1967 and 1974
(Percentage of total imports)
Country Year U.S.A. U.K. Canada Caribbean of which CARICOM
Barbados 1967 19.6 28.6 12.5 11.7 10.0 1974 19.4 20.5 9.1 18.5 17.3
Guyana 1967 27.6 25.5 11.0 12.0 11.4 1974 •25.7 20.5 4.9 27.0 26.5
Jamaica 1967 39.0 19.9 11.4 3.3 1.5 1974 35.3 12.4 5.4 10.7 7.6
Trinidad £ Tobago 1967 16.3 14.5 5.2 2.4 2.2 1974 10.6 5.5 2.2 2.1 1.6
Source : CARICOM Digest of Trade Statistics, September 1976.
Traditional export trade has been founded on agricultural products . Sugar, rum and molasses together have been part of the region's history and in the cases of Jamaica, Guyana, Barbados, St. Kitts and Trinidad and Tobago continue to be important money earners. Banana production is a major economic support to the economies of Jamaica, Grenada, St. Vincent, St. Lucia and Dominica. In addition,
3/ Caribbean Free Trade Association 1968-71 (CARIFTA) Eastern Caribbean Common Market - 1968 Caribbean Community Agreement - 1973 (CARICOM)
- 6 _

Table 4. Direction of trade Barbados, Guyana, Jamaica, Trinidad Ê Tobago, 1967 and 1974
(Percentage of total exports)
Country Year U.S.A. U.K. Canada Caribbean of which CARICOM
Barbados 1967 17.9 54.4 8.6 12.9 10.4 1974 36.4 19.8 7.4 26.2 24.2
Guyana 1967 23.3 24.5 18.6 11.7 10.4 1974 25.2 20.9 4.5 12.1 11.2
Jamaica 1967 40.0 26.3 13.9 5.4 2.7 1974 46.6 15.6 4.6 5.5 4.4
Trinidad £ Tobago 1967 38.8 12.7 4.4 14.3 5.9 1974 60.2 2.3 1.3 19.0 7.1
Source : CARICOM Digest of Trade Statistics, September 1976.
each country has a number of specialities which constitute part of its export trade (e.g. citrus, coffeee and pimento in Jamaica, citrus in Dominica, cotton in Antigua, cocoa, nutmeg and spices in Grenada, cocoa and citrus in Trinidad and Tobago). By far the most important intra-regional agricultural export is Guyana's supply of rice to the region.
Twentieth century exploitation of mineral resources has diversified the export trade of Guyana, Jamaica and Trinidad and Tobago. Both Guyana and Jamaica rely very heavily on export of bauxite and alumina for their financial survival. The petroleum and natural gas resources of Trinidad and Tobago provide products which dominate that country's export activity. This dominance has been exaggerated within this decade by the world demand for fuel and anxiety over its continued availability. The pattern of regional economic expansion has involved provision of favourable investment conditions for several multi-national corporations and a large number of foreign companies. Their interest in relatively cheap labour has combined with the desire of regional governments to show development with highly visible technology to produce an increasing number of both heavy and light assembly and processing industries. These contribute in varying degrees to the export trade of the region but their importance is reduced by the fact that many of the raw materials are themselves imported.
The most significant imports of the countries of the region are fuels, chemicals, food, machinery and equipment. In all of the countries, except Trinidad and Tobago, importation of fuels is mainly for consumption and resale. In Trinidad and Tobago, such imports are for refining and re-export at arguable gain to the economy.
In 1975, the value of Barbados' domestic exports amounted to BD$178.2 million out of a total export of BD$217.9 million. Compared to this, imports amounted
- 7 _
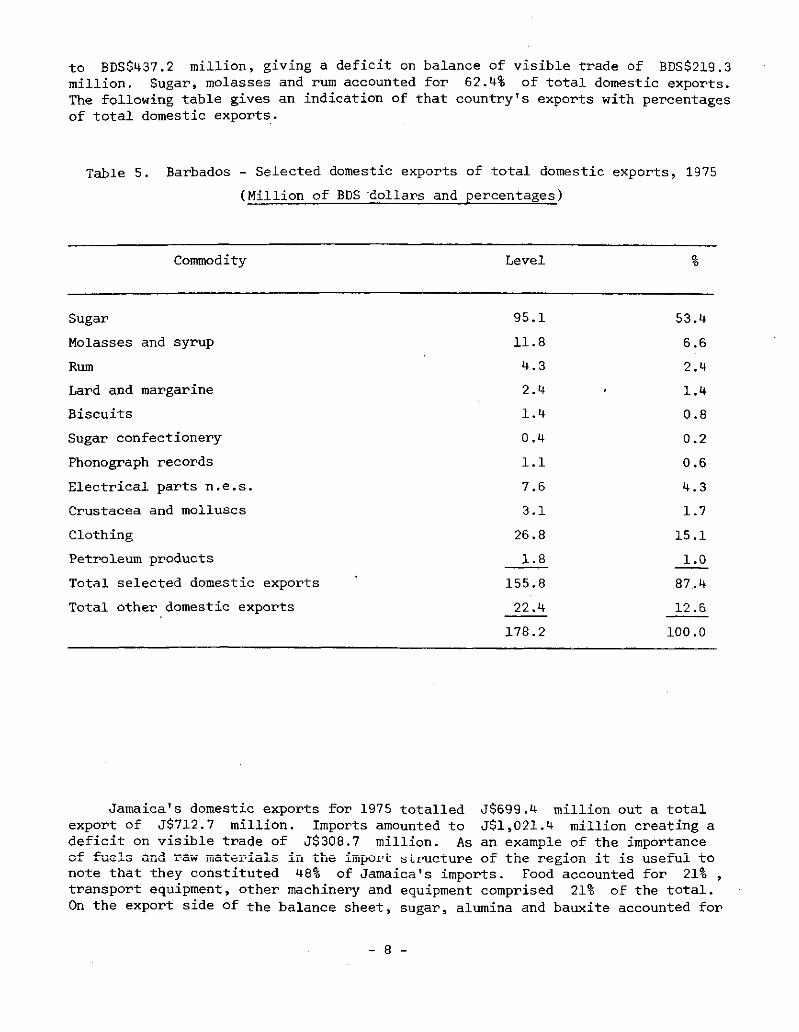
to BDS$437.2 million, giving a deficit on balance of visible trade of BDS$219.3 million. Sugar, molasses and rum accounted for 62.4% of total domestic exports. The following table gives an indication of that country's exports with percentages of total domestic exports.
Table 5. Barbados - Selected domestic exports of total domestic exports, 1975 (Million of BPS 'dollars and percentages)
Commodity Level %
Sugar 95.1 53.4 Molasses and syrup 11.8 6.6 Rum 4.3 2.4 Lard and margarine 2.4 1.4 Biscuits 1.4 0.8 Sugar confectionery 0.4 0.2 Phonograph records 1.1 0.6 Electrical parts n.e.s. 7.6 4.3 Crustacea and molluscs 3.1 1.7 Clothing 26.8 15.1 Petroleum products 1.8 1.0 Total selected domestic exports 155.8 87.4 Total other domestic exports 22.4 12.6
178.2 100.0
Jamaica's domestic exports for 1975 totalled J$699.4 million out a total export of J$712.7 million. Imports amounted to J$l,021.4 million creating a deficit on visible trade of J$308.7 million. As an example of the importance of fuels and raw materials in the import structure of the region it is useful to note that they constituted 48% of Jamaica's imports. Food accounted for 21% , transport equipment, other machinery and equipment comprised 21% of the total. On the export side of the balance sheet, sugar, alumina and bauxite accounted for
- 8 _

84.9% of total exports, with sugar having a share of 20% . In the agricultural sector (primary products), bananas exceeded all other export crops. Under semi-processed products, sugar fetched J$139.7 million. The actual value of bauxite and alumina exported was J$453.8 million. Most of the manufactured goods exported were based on agricultural products.
Since 1974, Trinidad and Tobago has had substantial surpluses on its balances of visible trade. In 1975, the country exported in excess of TT$3.8 billion with an import bill of TT$3.2 billion. Actual figures are shown in Table 6 .
Table 6. Trinidad £ Tobago. Exports and imports (Thousands of Trinidad £ Tobago dollars)
Year Domestic Exports
Re-Exports
Total Exports
Total Imports
Balance of visible trade
1974 3,933,851 228,913 4,162,764 3,774,892 387,872 1975 3,839,390 35,769 3,875,159 3,239,216 635,942 1976^/ 5,331,556 61,962 5,393,518 4 ,826,937 566,581
Source: Central Statistical Office: Quarterly Economic Report, Oct.-Dec. 1976 Port of Spain, 1977 (Table 1 ).
a/ Provi s ional.
This healthy state of transactions relates directly to.capitalization on the fuel crisis and recent discovery of additional reserves of petroleum and natural gas within the country and its exploitable territorial waters. A look at the preceding years shows deficits of TT$287.6 million in 1971, TT$399.6 million in 1972 and TT$189.1 million in 1973. The major part of the exports of the country are petroleum (crude and refined), petroleum products and petrochemicals. Table 7 shows the contrast between the earnings from this sector and earnings from all agricultural based exports.
Within the agricultural export figures, sugar and molasses were responsible for TT$168.3 and TT$124.6 in 1975 and 1976 respectively.
Petroleum for refining and petroleum products also dominate the imports of Trinidad and Tobago, for its refining capacity is far in excess of its local production. In 1975, imports of crude and partially refined petroleum and petroleum products amounted to TT$1.64 billion and in 1976 to TT$2.7 billion. In addition, importation of industrial machinery, of which a large portion was for the petroleum industry, amounted to TT$190.2 million and TTS306.0 million in 1975 and 1976 respectively.
- 9 _

Table 7. Trinidad and Tobago. Exports of petroleum sector vs. agricultural sector
(Thousands of Trinidad S Tobago dollars)
Year Petroleum crude and
partly refined
Petroleum products
Petro-chemicals
Total petroleum
Agricul-tural products
1974 263,940 2,532,081 64,896 2,860,917 137,278 1975 1,439,140 1,925,758 45 ,283 3,410,181 201,833 1976 1,820,156 3,063,918 63,967 4,948,041 158,777
Source: Central Statistical Office: Quarterly Economic Report Oct.-Dec. 1976 Port of Spain, 1977. (Tables 6 and 23 ).
Goods for use in the assembly of motor vehicles and electrical equipment, together with finished electrical equipment were also major items in both years amounting to TT$131.7 million in 1975 and TT.$187.5 million in 1976. Imports of food amounted to TT$186.9 million and TT$205.7 million in the years under reference. When one considers that in 1975 only 12% , and in 1976 only 8.2% of the exports of Trinidad and Tobago were not derived from oil, it becomes clear that, more than any other country, Trinidad and Tobago can be considered to have a non-agricultural mineral export economy.
The point is even more strongly made by removing the trade in petroleum from the trading accounts. The Ministry of Finance (1976) puts it as follows:
"The dominating influence of the petroleum sector is highlighted when the trade in all petroleum products is removed from the trading accounts. In this non-oil account which mirrors the performance of the other sectors of the economy, the deficit has been growing steadily from $238.2 mn in 1969 to $502 mn in 1973 and on to $655.6 mn in 1974, with a jump to $1,101.5 $1,101.5 mn in 1975. It is acknowledged that imports of machinery etc. into the petroleum sector are included in this 'non-oil' account. However, the sizes of the deficits have been so increasingly large that they portend gloom for the rest of the economy." 4/ .
Like Jamaica, Guyana's export of bauxite and alumina is a major part of its trade earnings. Similarly, sugar dominates the agricultural sector. In 1975 5/ , Guyana's exports totalled G$848.2 million of which sugar accounted for
4/ Ministry of Finance. Trinidad and Tobagn: Review of the economy 1976, Port of Spain, Dec. 1976, p.64.
5/ Source: Statistical Bureau: Quarterly Statistical Digest September 1976, Georgetown, 1976.
- 10 _

G$ 413.1 million, almost half, and bauxite contributed G$262.9 million ( 31%). Rice was the other major export with a total value of G$84.8 million. In the same year, imports amounted to G$810.6 million leaving a favourable surplus of G$ 37.5 million on the balance of visible trade. The largest single item in the import bill was machinery and transport equipment ( $239.1 m). Manufactured goods ($192 m) and fuels and lubricants ( $135.0 m) are the two other items which dominate the import sector. The 1976 external trade of Guyana was less favourable. The deficit of G$242.6 million resulted from an import bill of G$927.5 million, and an export outrun of $684.9 million. No complete breakdown of sectors of export or import is available for 1976. For purposes of comparison of the external trade of the four larger economies, Table 8 presents the values of imports, exports and balances converted to a common currency (US$).
Table 8. Exports, imports and trade balances. Barbados, Guyana, Jamaica, Trinidad S Tobago
a/ (Thousands of United States dollars)—
Country Total Exports
Imports Balance
Barbados 1974 86.2 208.8 -122.6 1975 109.0 219.0 -210.0 1976 n.a. n.a. n.a.
Guyana 1974 236.2 222.4 13.8 1975 332.6 317.8 14.8 1976 268.5 363.7 -95.2
Jamaica 1974 730.1 934.9 -204.8 1975 783.1 1,122.4 -339.3 1976 n.a. n.a. n.a.
Trinidad S Tobago 1974 1,734.5 • 1,572.8 161.7 1975 1,614.4 1,349.6 264.8 1976 2,247.2 2,011.2 236.0
a/ At current rates of exchange.
Table 9 shows the comparative imports , exports and balance of visible trade for 1975 of the region's smaller economies. Apart from transactions related to the refining of petroleum in Antigua, all of the other export activity of the countries listed relates to agricultural products. Manufacturing and processing of goods are a small part of the export sector. Without exception the countries listed live with deficits on their external trade.
- 11 _

Table 9. Imports, exports and balances 1975 (Thousands of United States dollars)—^
Country Imports Total Exports
Balance
Antigua 46,976.3 22,144.4 -24,831.9 Belize 54,591.0 47,500.0 — 7,091.0 Dominica 16,680.0 9,128.5 - 7,551.5 Grenada 13,733.0 7,135.2 - 6,597.8 Montserrat 6,127.4 377.4 - 5,750.0 St. Lucia 37,194.0 12,760.3 -24,433.7 St. Vincent 23,070.3 5,888.8 -17,181.5
a/ Converted from citation in local currencies at current rates of exchange.
Government Revenue and Expenditure
Imbalances between government revenue and expenditure are characteristic of the region. All of the governments seek financial assistance either through grants-in-aid or loans on the international market. Trinidad and Tobago is the least dependent upon such sources of revenue. Although it borrows internationally for large scale capital investment, it readily meets its own recurrent expenditure and has provided financial assistance to other regional governments. The Associated States can be viewed as chronically short of revenue and essentially operating at subsistence levels- Jamaica and Guyana are in serious financial distress without short-term likelihood of alleviation of their predicament.. Barbados is perhaps less critically affected by financial difficulties than Jamaica and Guyana but its situation cannot be considered to be healthy. Table 10 shows the 1976 revenue and expenditure of the region's governments expressed in US currency for ease of comparison.
- 12-

Table 10. Government revenue and expenditure (Millions of United States dollars)
Country Year Revenue Recurrent a/
Expenditure Recurrent
Expenditure Capital
Barbados 1975 1976
96.95 100.85
87.65 103.30
22.35 26.25
Guyana
Jamaica
1975 1976 ./ 1975 1976
Trinidad £ Tobago 1975 1976
Antigua
Dominica
Montserrat
St. Kitts-Nevis-Anguilla
1975
1976
1975
1976
1975
1976
1975 1976
191.14 149.14
622.63 690.00
720.70 841.83
<1.77)^-7 12.91 13.40
(1.59)—7 7.19 6.43
(0 .66) 2.70
a/
(0.98)-7
3.05
8.14 (1.16)-' 12.37
/
126.43 185.33
691.86 786.92
316.79 392.20
13.24 13.40
7.45 8.74
2.94
3.13
8.12
n.a.
101.29 126.50
361.31 468.35
420.20 504.37
1.35 n.a.
1.42 5.83
1.56
2.16
1.57
n.a.
St. Lucia
St. Vincent
1975 1976
1975
1976
10.65 12.48
(0.95)-7
8.84 n.a.
12.68 13.06
8.81 9.93
9.41 10.51
0.82 4.92
a/ Bracketed figures represent grants-in-aid. b/ Provisional.
Note: Capital revenue is not available.
Gross Domestic Product
Comparison of the economies of the various states of the region shows the same wide contrast as examination of their population and sizes. Regrettably
- 13 _

Table 11. Gross Domestic Product at current factor cost, 1976 (Millions of United Stages dollars -/)
Antigua and Barbuda 44.2 Barbados 334.4 Dominica ' 22.6 Grenada 37.2-Guyana 411.8 Jamaica 3,044.8 Montserrat 9.0 St. Kitts-Nevis-Anguilla 30.3 St. Lucia 44.0 St. Vincent 25.1 Trinidad £ Tobago 2,065.5
Source: ECLA: Economic Activity in Caribbean Countries 1976, Port of Spain, 1977.
a/ Converted from local currency, b/ 1976 not available-, 1975 figure cited.
Table 12. Comparative growth of GDP, Guyana, Jamaica, Trinidad and Tobago, Selected Years
(percentages)
1972-73 1973-74 1974-75- 1975-76-
Guyana 8.9 50.0 22.5 -1.0 Jamaica 20.3 28.5 18.1 4.1 Trinidad and Tobago 19.0 40.4 32.0 15.3
«
Source: ECLA: Economic Activity in Caribbean Countries 1976, Port of Spain 1977.
a/ Provisional, b/ Estimated.
- 14 _

unavailable are comparable quotations of Net National Income which, in view of the fact that much of the region's Gross Domestic Product is generated by foreign investment, would have been a most revealing statistic. It is worthwhile noting that although Jamaica's GDP is one and a half times that of Trinidad, its population is more than twice as large. Table 11 shows the comparative GDP at current factor cost of those countries of the region for which data are available. Comparison of contribution of industrial sectors to GDP is made a little awkward by differences in the "headings under which information is collated. Lack of detail.in the case of Barbados (see Table 13 ) is unfortunate. However, reference to the Development Plan 1973-76 6/ indicates (pp. 1-8) that the period 1960-1972 the contribution of sugar declined from 21.3% to 7 7% Over the same period, manufacturing and mining increased from 8.3% to 12.2% The implication that the country is moving from dependence orr sugar should not however be extended to mean movement away from agriculture. Table 13 shows sectoral contribution to the GDP of Barbados.
Table 13. Barbados: Contribution to GDP of sectors (percentages)
Sectors 1973^ 1974-7 1975-7 1976-7
Sugar 7.1 8.7 11.3 7.4 Distribution 25.0 24.7 22.5 22.2 Government 16.6 16.4 15.9 16.1 Other 51.3 50.2 50.3 53.8
Source : ECLA (1977) op. cit. aj ECLA preliminary estimate, b/ Revised.
In the case of Guyana (see Table 14),it is clear that activity in agriculture fishing and forestry is of great sigiiificance. The mining and quarrying sector is dominated by bauxite which also accounts for a substantial part of the manufacturing sector.
Sectoral contribution in Jamaica (see Table 15 ) appears to be more balanced than in the case of Guyana or Trinidad and Tobago (see Table 16 ). In Jamaica, the largest single area is manufacturing. Part of this sector however, is based on bauxite mining which accounts for the majority of the mining and quarrying sector.
Reliance of Trinidad and Tobago on activity in the petroleum industry is clearly evidenced by Table 16 . Of all four of the region's major economies it is the least dependent on agriculture in terms of its GDP.
6/ Government of Barbados: Development Plan 1973-'/'/. Bridgetown, undated, various pagination.
- 15 _

Table 14. Guyana: Contribution to GDP of industrial sectors. (percentages)
Sectors 1973 1974 1975-"l-/
Agriculture 16.2 28.0 30.2 Fishing • 1.2 1.2 1.1 Forestry 1.0 0.9 0.9 Mining £ Quarrying 14.0 13.5 12.8 Manufacturing 11.2 14.0 14.2 Transport £ Communication 6.4 5.1 5.2 Engineering £ Construction 8.2 6.2 6.4 Distribution 11.2 8.9 8.8 Rental of dwellings - Financial and other services 9.7 7.4 6.7 Government 21.0 14.9 13.7
Source: ECLA (1977) op. cit. a/ Provisional
Table 15. Jamaica: Contribution to GDP of industrial sectors, purchasers' values, current cost
(percentages)
Sectors 1973 1974 1975 1976
Agriculture 7.3 7.2 7.6 8.3 Mining, quarrying & refining 8.5 13.2 10.2 8.7 Manufacturing 16.7 16.8 17.1 19.5 Construction £ installation 12.4 11.6 11.5 9.3 Distributive trades 18.9 16.2 17.0 13.9 Producers of government services 10.6 11.2 12.3 13.8 Electricity and water 1.1 1.0 1.4 2.1 Transportation,storage £ communication 6.7 6.0 5.9 6.2 Financial institutions 4.2 4.2 4.0 4. 7 Real estate 8.5 8.0 8.1 9.1 Household £ private (non-profit institution) 2.0 1.8 1.9 2.0
Miscellaneous 6.1 5.8 5.9 5.8 Less imputed service charge 3.0 2.9 2.9 3.3
Source : ECLA (1977) op. cit.
- 16 _
*

Table 16. Trinidad £ Tobago: Contribution to GDP of industrial sectors (percentages)
Sectors 1973 1974 1975 1976
5.7 5.7- 5.1
30.9 36.1- 31.5 14.7 12.7 13.8 5.0 4.9 5.8
15.2 13.8- 13.5 12.1 11.6 12.9
16.4 15.3— 17.3
Source: Draft Third Five-Year Plan 1969-73, and ECLA staff estimates. See also dependency ratios in Appendix I, page 97.
a/ Revised
Comparable details of sectoral activity are not available for other countries in the region.
Tourism
The possession of relaxing vacationing resources which appeal to travellers from temperate climates has to be viewed as a natural resource of the Caribbean region. The importance of tourism as a source of foreign exchange is demonstrated by its contribution to an economy as large as that of Jamaica 7/ . In 1975, estimated expenditure by tourists was J$116.8 million, a figure which placed the tourist sector third as an earner of foreign exchange for Jamaica after bauxite/alumina and sugar. Indeed, in 1974 the industry brought in J$121.2 million and was second only to bauxite/alumina as a source of foreign exchange. Employment generated directly and indirectly by tourism is of primary importance too. In 1975, 9,423 persons were directly employed by tourism. An equal number of persons were indirectly employed by this sector. Barbados is also highly dependent on successful tourism. In 1972, an estimated tourist expenditure of $120.0 million BDS represented 34% of the country's GDP. According to the 1970 census, 4,069 persons were employed directly in the hotel
7/ National Planning Agency: Economic and Social Survey Jamaica 1975, Kingston 1976.
Agriculture, fishing and forestry 5.0 Mining £ refining of petroleum, asphalt £ gas 22.5 Manufacturing 17.8 Construction 5.3 Transport £ distribution 17.3 Government 12.5 Public utilities ) 4.9 Ownership of dwellings ) g Banking and finance ) Other services )
- 17 _

industry. In 1976, 222,000 visitors provided BDS$165.4 million in foreign exchange for Barbados 8/ .
Of the Associated States 9/ , Antigua has the largest trade in tourism. Earnings in 1973 were EC$15.7 million from 72,786 visitors and in 1974 EC$ 12.2 million from 69,854 visitors. St. Lucia's tourist industry has been growing and between 1973 and 1976 its trade has grown from 45,809 visitors spending EC$8.7 million to 56,440 visitors spending an estimated EC$13.3 million. Estimates for 1974' for all of the Associated States indicate that 180 000 visitors spent $16.3 million (US). It should be noted that an extremely large part of expenditure by tourists leaks out of the economy and does not necessarily produce economic results in proportion to its size.
Political Status and Orientation
All of the English-speaking Caribbean states were British colonies for the most recent part of their European attachments. The periods differ considerably but for all practical purposes relevant to education the effect is roughly similar. Barbados endured uninterrupted British ownership from 1624, Jamaica from 1655. By comparison, Guyana's 1803 acquisition and Trinidad's 1797 capture by the British are relatively recent. Five of the states are at the time of writing autonomous sovereign states - Barbados (from 1966), Grenada (from 1975), Guyana (from (1966), Jamaica (from 1962), and Trinidad and Tobago (from 1962). All the other countries, except Montserrat, which remains a colony, are currently described as independent states in association with the United Kingdom or more briefly, "Associated States", the most modern British label for self-governing protectorates. Of these states, Dominica and St. Lucia are negotiating their full independence. Of the sovereign states, Guyana and Trinidad and Tobago have adopted republican constitutions, the former in 1970 and the latter in 1976. All •the others recognize H.M. Queen Elizabeth II of Great Britain as titular head of state within the understandings of the British Commonwealth.
All of the constitutions of the states of the region provide for what is known in western hemisphere political jargon as 'freely elected constitutional governments'. Given the imprecision of ideological labels, it seems advisable to attach a label to a state only where the government of the state applies the label to itself.
In Guyana, the ruling political party since 1964 has been the People's National Congress which as early as 1955 declared itself a 'socialist' party. In pursuance of this position, the party and the government enunciated in April 1970 the principle of ownership and control of resources by Guyanese. The Government, not without some tactical resistance, has gradually taken control of several major exploitative concerns. In 1971, the Demerara Bauxite Company, a subsidiary of the Aluminium Company of Canada (ALCAN) was nationalized as Guyana Bauxite Company; in 1972, Guyana Timbers passed into public control; in 1973, the Government assumed ownership of all idle ur unused land held by sugar companies; in January
8/ Data source: ECLA: Economic Activity 1976 in Caribbean countries» • Part X , p. 18 , Table VI .
9/ ECLA: op. cit. Pt. Ill , p. 19 , Table VI .
_ 18 _

1975, Reynolds Mines at Kwakwani were acquired under the name Bermine; in May 1975 Jessel's Holdings (Demerara Company Limited) were nationalized as Demerara Sugar Company Limited. Finally, in May 1976, Guyana acquired all the holdings, interests and properties of Booker Brothers (Booker McConnell). This last act ended the cruel joke that Guyana (formerly British Guiana) had remained Booker's Guiana in spite of its independence.
Jamaica has been governed since 1972 by the People's National Party which from its inception in 1938 was viewed (in.terms of the day) as leftist. Prior to the most recent election in 1976, the party stated that it was committed to "democratic socialism". The recency.of this declaration does not permit full assessment of the Government's interpretation of the label. It is worth noting however that the state has recently purchased the interests of a major international commercial bank in Jamaica. A number of hotels have also recently been purchased by the Jamaican Government, but these purchases appear to relate more to maintenance of employment in the face of threatened closure than to pursuance of a policy of nationalization of means of production. The government also has investments in a variety of commercial enterprises as part or main share-holder. By contrast with Guyana where the Opposition Party, the People's Progressive Party, is itself committed to socialism, Jamaica's socialist orientation may be co-terminous with the life of the present Government, for its Opposition Party, the Jamaica Labour Party, eschews that philosophy.
The Government of Trinidad and Tobago does not apply a specific label to itself. The ruling party, the People's National Movement, has been in power since 1956. Public utilities and public transport are operated by state-owned corporations. In the area of petroleum, the government owns 50.1% shares in one company, Trinidad-Tesoro, fully owns Trintoc (The Trinidad and Tobago Oil Company) and controls the distribution of petroleum products through National Petroleum. Several ventures in oil exploration and exploitation have been jointly undertaken by the government and various multi-national corporations. All of the sugar companies are now owned by the government. Besides this, the government through various public corporations, notably the Industrial Development Corporation, has shares in a numher of other enterprises. One commercial bank is also wholly owned by the government. It should be noted that the Trinidad and Tobago government's involvement in sugar and oil partially relates to a period of civil unrest in 1970 and did not constitute a policy prior to those pressures.
The continued existence of extremely large multi-national corporations in the petroleum and industrial sector and of others, including nationally based conglomerates in other sectors would suggest that despite its increasing involvement in commercial and industrial enterprise, the Government of Trinidad and Tobago would be best viewed as a participant in a capitalist market. The country's recently realized petroleum riches have also invited comments that it has some traits of a neo-imperialist mini-power within the Caribbean region.
In Barbados, neither the recently elected (1976) Government, the Barbados Labour Party, nor its opponent the Democratic Labour Party, has applied an internationally understood label to itself. Government participation in commercial activity is small and little of the political rhetoric of the major political groups points to shift from association with private enterprise.
_ 19 _
The position in the Associated States and Grenada is more akin to that of Barbados than to the other independent states. Political 'isms' of a contentious nature (i.e. which are counter to the status quo) are not seriously pursued. The restricted resources of the governments and their continued dependence on grants-in-aid from Canada and the United Kingdom nullify the importance of ideological positions that may be inimical to the continued free hand of the private investor Nevertheless, in both Dominica and St. Kitts.political statements of government officials make reference to the 'socialist' positions of the government. Actions in keeping with such statements are too few to permit evaluation.
Summary
The preceding sections provide a summary view of state of the economies of the region under survey. It is clear that in gross terms, financial resources are restricted. In addition, the generative capacity of the economies is linked to sensitive areas - subject to variations related to climatic variation as well as to fluctuations of international markets; light industry and processing based either on agriculture or imported raw and semi-finished goods; oil (in Trinidad alone) currently strong and possibly so for some time but still linked to international politics and technological control of external agencies. Further-more, since almost all the economies can be described as open (Guyana is a possible exception), the proportion of the economic gains within the societies that can be mobilized for public purposes is restricted. Distribution of incomes within the societies is provably sufficiently unequal to constitute the source of substantial hindrance to the rate and scope of development. Continued foreign ownership and/ or control of the major productive sectors of the economies reduces the flexibility and freedom of governments.
- 20 _

II. LABOUR FORCE
Comparison and description of the labour force in different Caribbean States is made awkward by differences in frequency, thoroughness and methodology of surveys conducted by different governments 10/. The only detailed study of the labour force which offers comparability for almost every country is by Abdullah (1977) 11/ , but that study is based on analysis of statistics provided by the censuses of 1960 and 1970. Nevertheless, its scope is wide enough that the analyses are still important indicators for the labour force.
Employment and unemployment in the region fluctuate in relation to the seasonal nature of the demand for labour in the agricultural sector. Equally important is the seasonal demand of the tourist industry. Unemployment and under-employment related to this seasonality is considerable. Unemployment attributable to lack of skills required in the labour market is linked to two factors: firstly, the rate of change from unskilled labour to partially or fully skilled manpower needed in various sectors of the economy; secondly, to a failure in the orientation of the educational systems to produce skills in proportion to labour demands in the productive sectors of the economy. This latter observation directs attention to unemployability within Caribbean societies. The traditional post-plantation values attached to white collar professional, clerical and scribal activities generate unrealistic desires within the labour force which cannot be sustained by the impoverished nature of the economies. Further, in addition to fostering these values and desires, much of the established education creates the clearly erroneous expectation that such desires can be fulfilled within the society. Consequently, there is a considerable section of the labour force which does not seek employment in sectors in which it may be available. At the same time, the supply of persons with such desires, expectations and qualifications exceeds the absorptive capacity of the sector which can use such skills. The result is unemployability.
Jamaica
Jamaica's publication in 1976 of a statistical study of its labour force 12/ is the most up-to-date on the labour force anywhere in the region and deserves detailed attention. The estimated total population of the country at the end of the October 1975 survey period was 2,048,300 . Of that total, 40.4% were under 14 years old, leaving an over- 14 population of 1,220,500 . (Compare 1970, 46.1 % under 15 ; /Abdullah (1977) Table 2_/. The labour force was estimated at 869,400 persons or 42.4% of the total population and 71.2% of the population aged 14 years and over. Within the labour force, 685,100 persons ( 78.8% ) were employed leaving 184,300 ( 21.2% ) unemployed. It is important
10/ Harewood, (1975 b) discusses the effects of differences of definition of unemployment and survey method on the results of surveys of employment.
11/ Abdullah, N: The Labour Force in the Commonwealth Caribbean: A Statist-ical Analysis. I.S.E.R., St. Augustine, 1977.
12/ Jamaica Department of Statistics: The Labour Force 1975. Kingston 1976. See also National Planning Agency: Economic and Social Survey Jamaica 1975. pp. 283 - 294 .
- 21 _

to examine more closely the age group 14-24 (i.e. recent school leavers in the earliest category of the labour force). The participation rate in October 1975 of the 14 - 24 age group was calculated at 57.5% . The total 14 - 24 labour force of 242,700 had only 150,600 employed persons in it. The rate of unemployment 13/ then was 38% in that age group, the highest for any group. Of particular concern is.the disparity between male and female unemployed in this group - the rate of unemployment for.males was 25.3% and for females 52.2% . In the general labour force the unemployment rate for men was 12.1% of the male force and 31.9% of the female force.
An alarmingly high proportion of the labour force ( 83.4% ) had received no specific training for the jobs which they held or sought. Table 17 shows the labour force by training received.
Table 17. Jamaica: Labour force by training received
%
Total labour force 869,400 100.00 Vocational training - no certificate 11,900 1.37 Vocational training - certificate 29,500 3.39 Professional - no degree or diploma 14,600 1.67 Professional - degree or diploma 22,100 2.54 Apprenticeship 8,500 0.97 On-the-job training 46,700 5.37 No training 725,400 83.43 Not stated 10,700 1.23
Source: Table 2.3 , p. 26 of The Labour Force 1 Q7R Honan-(-mon+ — , 1—- ~ of Statistics, Kingston, 1976.
It is clear that the labour force does not haye anywhere near a reasonable level of training. Study of Table 18 by comparison with Table 17 is instructive. As one would expect the highest proportion of the unemployed falls in the 'no training' category ( 89.36% ). What is disturbing though is that of the section of the labour force which had vocational training (no certificate) unemployment was higher than in the sector which had no training ( 36.97% was compared to 22.7 % ). Furthermore, workers who had been trained in apprenticeship schemes VilH VfitrhoY"» imomnl 7TTiDn+ ( OQ 111 & \ — ~ . • —• v / I.ÜU11 L11WQC VVJLl.ll 11U L i-d _Li 1 -LUg .
13/ Definition of an unemployed person - "one who had no job but wanted work and was available to accept a job, whether or not this person actively sought one", p. 8 of The Labour Force 1975.
- 22 _
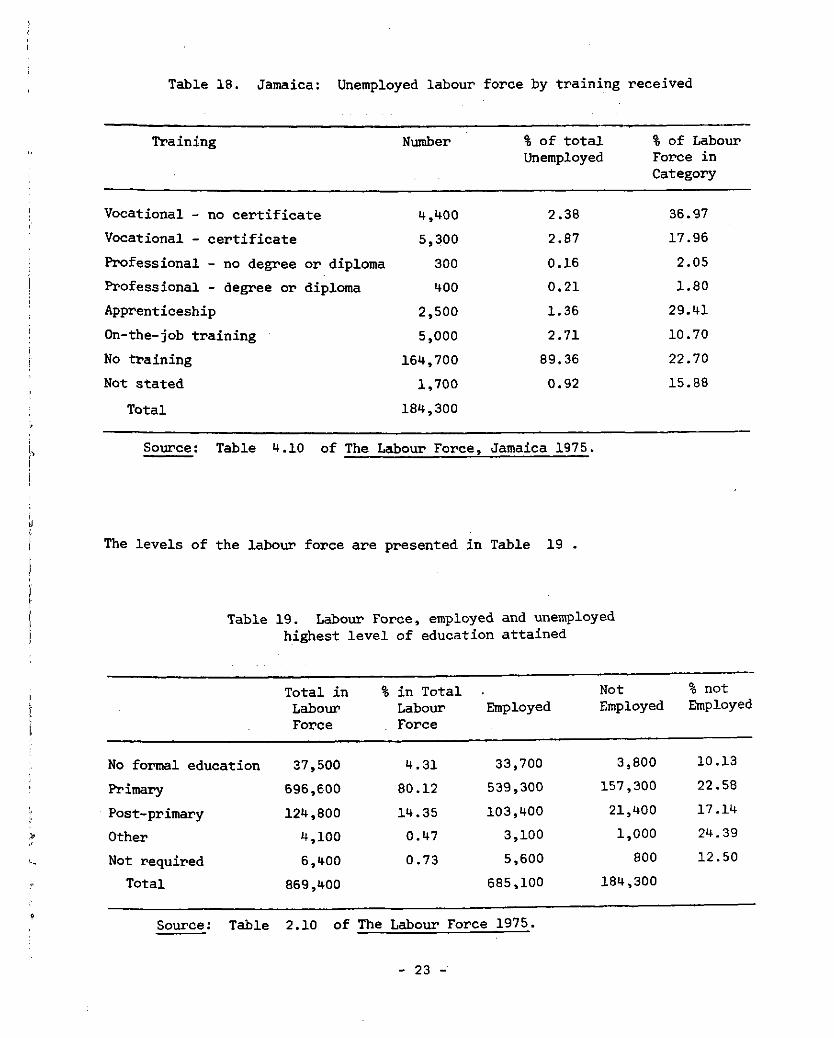
Table 18. Jamaica: Unemployed labour force by training received
Training Number % of total Unemployed
% of Labour Force in Category
Vocational - no certificate 4,400 2.38 36.97 Vocational - certificate 5,300 2.87 17.96 Professional - no degree or diploma 300 0.16 2.05 Professional - degree or diploma 400 0.21 1.80 Apprenticeship 2,500 1.36 29.41 On-the-job training 5,000 2.71 10.70 No training 164,700 89.36 22.70 Not stated 1,700 0.92 15.88
Total 184,300
Source : Table 4.10 of The Labour Force, Jamaica 1975.
ii | The levels of the labour force are presented in Table 19 . i I I
| Table 19. Labour Force, employed and unemployed | highest level of education attained
1 i'
Total in Labour Force
% in Total Labour Force
Employed Not Employed
% not Employed
No formal education 37,500 4.31 33,700 3,800 10.13 I,
Primary 696,600 80.12 539,300 157,300 22.58 I/ Post-primary 124,800 14.35 103,400 21,400 17.14
Other 4,100 0.47 3,100 1,000 24.39
Not required 6,400 0.73 5,600 800 12.50
* Total 869,400 685,100 184,300
Source: Table 2.10 of The Latour Force 1975.
- 23 _

'other', it can be concluded from the table that whereas in Barbados 14/ 75% of the working population had been exposed to secondary education, in Jamaica only 12.7% had had similar exposure. In Guyana, the proportion of 21.9% was almost twice as high while Trinidad and Tobago was slightly higher than Guyana. Regardless therefore, of the ambiguity of the term 'post-primary' in the Jamaican labour force study of 1975, the level of education of the Jamaican labour force remains disturbingly low.
The Barbados working population of 1970 also had a higher porportion of the secondary exposure group holding some kind of certificate for their pains. Yet, despite this advantageous situation, unemployment is not non-existent in Barbados. According to figures provided by the Barbados Statistical Services based on the continuous household sample survey, at March 1977, the unemployed 15/ represent-ed 15.3% of the total labour force of 103,500 persons. Labour force participation was 62.2% of the total adult population. Unemployment in Barbados too was highest in the age group under 24 ( 30% ), and.higher among females of this group ( 40% ) than among males ( 22% ). No contemporary breakdown of industrial distribution or occupational structure of the labour force is available but according to the 1970 census 17.7% of the labour force was engaged in agriculture. In that year too unemployment stood at 9% .
Barbados provides one example of the validity of the remarks made earlier in respect of the unemployed not seeking available jobs. The Development Plan 1973-77, p. 5 - 9 , reads as follows:
"The shortage of domestic labour which has been plaguing the sugar industry for the last four years is responsible for high costs of production. This shortage has forced local producers to resort to the importation of foreign workers to harvest sugar crops. The cost of transporting these workers to Barbados and of housing them has served to increase labour costs. Some 975 workers were imported into Barbados in 1972."
The shortage clearly did not result from full employment in the labour force, but from unwillingness or inability of the unemployed sector to undertake the tasks available.
Guyana
Reliable information for the Guyana labour force is somewhat dated and new information may not be available before completion of this study. (The Ministry of Education, Social Development and Culture launched in August of 1977 a survey intended to ascertain the country's needs for skilled manpower). The Draft Development Plan 16/ listed as major problems for Guyana's development, unemployment and conflict between work attitudes on the one hand and production
14/ Roberts (1974) asserts that in.Barbados the distinction primary and secondary was based on the age of the pupil, (p. 17 ). The figures for Barbados must therefore be viewed with considerable caution.
15/ Definition of unemployed not available. 16/ Government of Guyana: Draft Second Development.Plan 1972-76, Ministry
of Economic Development, Georgetown, Guyana, 1972, 372 p. mimeo.
- 26 _

potential and demands of the .country on the other. The plan based its discussion of the unemployment problem partially on a manpower survey dating from 1965 17/. According to that study, 21% of the labour force was unemployed in 1965. The -
level of underemployment was calculated at 1/3 of the labour force on the assumption that those who worked less than 7 months in the year of the survey were underemployed. The Plan (p. 54 ) also observed that if the criterion were shifted to those who had worked less than 10 months in that year, then the proportion would have been greater than 1/2.
Abdullah (1977, Table 7 ) cites 13.9% of the male force and 16.6% of the female force as unemployed in 1970 according to the census (week's activity). More recently a document criticising the 1977 budget of the country 18/ put the unemployment situation as follows:
"The most conservative estimate would make unemployment no less than 25% of the labour force. Among young people between 18 and 23 the figure is probably over 60% in the urban areas." (p. 9 - 1 0 ).
The government's reply to this was as follows:
"The estimated level of unemployment, particularly that for urban areas, is so high that it must have been based upon some special definition of employment." 19/
The barb in the response must not be allowed to obscure the government's consciousness of the problem. The Development Plan (72-76) recognized the "spatial problem" of high unemployment in tie urbanized area of Georgetown. It also noted the problem of unemployability but in a sense different from that previously treated. According to the Francis survey (1965) a substantial proportion of those unemployed who had never worked, had received less than tne statutory period of schooling and little or no vocational training. Among those who had worked at some time, 80% required training before they could be used in skilled positions. This figure is to be compared with Jamaica's 83.43% (1975) with no training. Indeed, documentation in the plan describes the 1970 situation as follows:
1. 30% of the labour force was between the ages of 14 and 24 ; 2. 75% of the unemployed were under 25 years of age; 3. of that group (2 above) 26% had little or no training.
At that same period the distribution of vacant posts was as shown in the TabJ e 23.
17/ Francis, O.J.C. "Survey on manpower requirements and the labour force", Vol. TT , Ministry of Labour and Social Security, Georgetown, 1965. Definition of unemployed - "a person who did not work but who looked for work or wanted work during the week preceding the survey."
18/ "The Budget, the current economic situation and the interests of the working people - a summary record of the representations made by the joint delegation of four trade unions to the Trade Union Congress". RORAIMA, Vol. 1 , No. 1 , 1977. pp. 1 - 9 .
19/ Ministry of National Development, "An examination of the Budget, the current economic situation and the interests of the working people." RORAIMA, Vol. 1 , No. 1 , 1977, pp. 20 - 33 .
- 27 _

Table j
Manual occupations Clerical and service Administrative workers Professional grades
23. Vacancies available, Guyana, 1970
20% of numbers employed 1% of numbers employed 2% of numbers employed 8% of numbers employed
The level of education of the labour force has already been mentioned in Table 2 2 .
Trinidad and Tobago
In the six-month period ending June 1975 the size of the non-institutional population over 15 years of age in Trinidad and Tobago 20/ was estimated at
Table 24. Industrial distribution of labour force, Trinidad and Tobago, 1970 and 1974
(percentages)
Labour Force
1970 1974
The Employed
1970 1974
Agriculture, forestry, hunting anrl -f-î aV>-î nor 22 2 1 "Ï 7 Mining and quarrying 20.2 19.0 Construction including electricity and gas 16.0 16.6 Commerce 13.3 16.8 Transport and communications 6.1 7.8 Services 19.2 22.0 Never worked 3.0 3.1
20.6
14.3 14.6 6.2 20.8
io. ó 20.0
14.7 18.0 8.7
23.2
20/ Source: C.S.O., Trinidad £ Tobago: Quarterly Economic Report Oct.-Dec. 1976. Port of Spain, 1977, Tables 38 £ 39 .
- 28 _

670,700. Of this population, 59% of 395,800 constituted the labour force. Fifteen per cent ( 15% ) of the labour force ( 60,100 persons) were listed as unemployed. 21/ . The male proportion of the labour force was 81% while the female proportion was 36% , but unemployment among males stood at 13% whilst among females it was stated as 20% .
The 'Review of the Economy 1976' draws attention to shifts in industrial distribution between 1970 and 1974 which are relevant to our discussions 22/ .
There is a clear decrease in involvement in agriculture over the four year period- which is taken up by commerce and services. The writers of the Review specifically note the point in the following terms:
"It is felt in some quarters that the educational system, with the production of G.C.E. graduates trained for urban-based jobs, has resulted in a large proportion of additions to the labour force gravitating towards these sectors. This educational bias, combined with the financial attractiveness of the non-agricultural sectors, may have contributed to the increases in labour force in these sectors. Government, in recognition of the educational bias referred to has set up a committee, which since reported, to look into the re-education of the '0' level graduates 23/.
It must be noted immediately that the Review recognizes that unemployment is concentrated in the younger section of the labour force 24/ although an actual figure is not cited. Taking the stated need for re-education of recent secondary graduates and the concentration of unemployment at the lower end of the labour force age range together with the already stated proportion of the labour force exposed to secondary education (see Table 21 ), it is not unreasonable to state that large numbers of persons are being educated for unemployment. The aptness of this observation is not restricted to Trinidad and Tobago for we have noticed similar tendencies in the Barbados labour force, and in the high levels of unemployment in the same age group documented for Jamaica and suggested for Guyana.
Windwards and Leewards
The tables which classify the working population into occupation groups and major industrial groups both show that the agricultural sector is of major importance in the Windward and Leeward islands for which data are presented. (See Tables 25 and 26 ). According to the 1970 census figures, in all of the islands it accounted for over 30% of the work force by occupation group and similarly over 30% of the classification by major industrial group. In both St. Lucia and Dominica, agriculture accounted for over 40% of the employment of the labour force. Both these islands showed markedly higher proportions in agriculture than in other countries of the region.
21/ Definition of unemployed: persons without work and seeking jobs. 22/ Trinidad S Tobago, Ministry of Finance: Review of the economy 1976,
Port of Spain, Dec. 1976, 112 p., Appendix 5 . 23/ p. 22 , our emphasis. 24/ p. 19 .
29
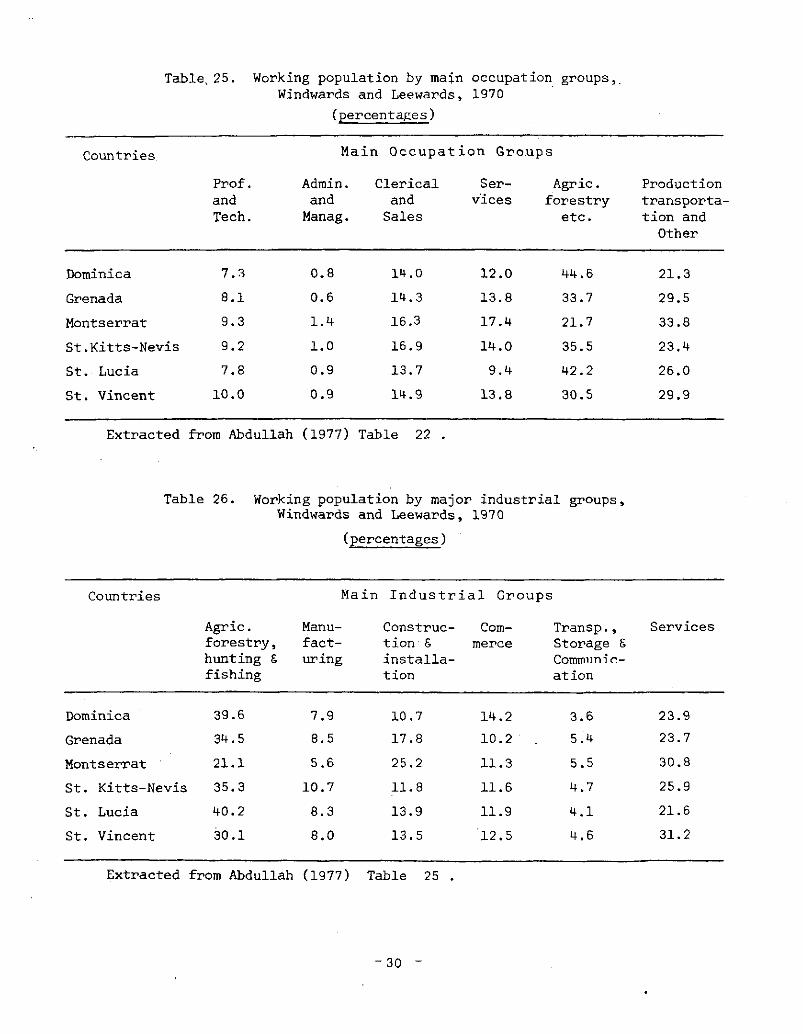
Table, 25. Working population by main occupation groups,. Windwards and Leewards, 1970
(percentages)
Countries, Main Occupation Groups
Prof. Admin. Clerical Ser- Agric. Production and and and vices forestry transporta-Tech. Manag. Sales etc. tion and
Other
Dominica 7.3 0.8 14.0 12.0 44.6 21.3 Grenada 8.1 0.6 14.3 13.8 33.7 29.5 Montserrat 9.3 1.4 16.3 17.4 21.7 33.8 St.Kitts-Nevis 9.2 1.0 16.9 14.0 35.5 23.4 St. Lucia 7.8 0.9 13.7 9.4 42.2 26.0 St. Vincent 10.0 0.9 14.9 13.8 30.5 29.9
Extracted from Abdullah (1977) Table 22 .
Table 26. Working population by major industrial groups, Windwards and Leewards, 1970
(percentages)
Countries Main Industrial Groups
Agric. Manu- Construc- Com- Transp., Services forestry, fact- tion £ merce Storage £ hunting £ uring installa- Communic-fishing tion ation
Dominica 39.6 7.9 10.7 14.2 3.6 23.9 Grenada 34.5 8.5 17.8 10.2 5.4 23.7
Montserrat 21.1 5.6 25.2 11.3 5.5 30.8 St. Kitts-Nevis 35.3 10.7 11.8 11.6 4.7 25.9 St. Lucia 40.2 8.3 13.9 11.9 4.1 21.6 St. Vincent 30.1 8.0 13.5 12.5 4.6 31.2
Extracted from Abdullah (1977) Table 25 .
- "30 -

The level of education of the labour force presented a fairly grim picture in 1970 in St. Lucia where 51.1% of the labour force had less than 5 years of•schooling. In all other countries of the region the largest proportion of the labour force fell into the category over 5 years of pirimary education. In St. Lucia alone did it fall into the lower category. It must be noted here that St. Lucia is one of the two islands (Dominica being the other) in which a large proportion of the population does not normally communicate in English or an English related language but in French Creole. The education system however recognizes only English as a medium of instruction. This point is taken up later in the study.
Table 27. Working population 15 years and over by level of education, Windwards and Leewards, 1970
Countries Primary Secondary
Working Less 5+ No. Less 5+ Dip./ Other population than years cert. than 'O'/'A' Peg.
5 yrs. 5 '0' Level lvls.
% % % % % % %
Dominica 19,627 12.9 69.1 3.8 8.9 1.5 1.9 1.5 Grenada 25,589 9.0 77.4 3.3 4.9 2.5 1.4 1.2 Monteerrat 3,693 10.6 65.3 3.4 12.6 2.4 4.1 1.1 St. Kitts-Nevis 12,197 6.3 71.0 3.6 10.1 2.3 2.6 3.9 St. Lucia 26,416 51.1 30.1 2.1 11.4 1.5 1.7 1.9 St. Vincent 20,713 14.1 70.3 3.5 7.2 2.1 1.7 0.8
Summary
We may summarize by observing that the Caribbean area under review is characterized by untenable levels of unemployment, underemployment and unemployability. These characteristics.related already to the following:
1. underdeveloped economies; 2. low levels of training within the labour force; 3. low levels of general education;
mis-orientation of the education system in relation to the employment market.
- 31 _

The situation is obviously not static. Changes in the availability of training and education are taking place. What is doubtful is whether these changes are being accompanied by sufficiently substantial re-orientation of the education system.
- 32 _

III. REGIONAL CHARACTERISTICS
Primary and secondary
The common British colonial exposure of the English-speaking Caribbean countries has resulted in educational patterns, institutions and practices which are basically similar. Differences in the current labelling of parts of the systems in the scope of formal education, in quantitative offering and quality of schooling as well as incipient divergences in orientation are as much the result of disparit ies in the importance to the British of different countries during the colonial period as they are the result of dissimilar rates of socio-economic growth, constitutional advance and accession to sovereignty. Recent developments in the region have been aimed mainly at the increase of the numbers of persons who are exposed to secondary education of some kind. There is also some impetus to increase the breadth of the curriculum at that level beyond the traditional humanities and natural sciences regimen to encompass technical and vocational areas previously considered to be the consolation of the unfortunate.
Throughout the region, the history of schools has involved religious organizations. Government schools have co-existed with church schools within the public sector. Within the second half of this century though, there has been increased secularization of school control. Government financial assistance to church schools has gradually reduced the involvement of denominational bodies to a nominal recognition of building ownership (reflected in some cases in the names of the schools) and to consultation on staffing. In Guyana, secularization was completed in 1976, the centenary of the Education Act of 1876. In all the other countries of the region of our concern, partnership between state and churches continues. Nevertheless, criteria for staffing, management and curriculum are the responsibilities of the governments.
Different formulae exist for financial assistance. For example, in Trinidad and Tobago, denominational schools or "assisted schools as they are called, receive a grant for maintenance based on student numbers, while all teaching staff are paid directly by the government. In Barbados, "approved independent schools" receive staff emoluments on the basis of a formula related to pupil:teacher ratios. The dual control system has not been free of problems, some of which have retarded change in the systems. However, it is uncertain whether full governmental control of schools at dates when some of the governments wished to be solely responsible would have substantially affected the ultimate direction of development.
At the present time, all of the countries have laws which make schooling of children compulsory between ages which vary from one country to another, the longest period being 5 - 1-5 and the shortest 7 - 14 . The extent to which compulsion is, or can be, exercised varies. Later discussion of participation rates at the primary level will show how effective the legal provisions are. Moderating factors on insistence on school attendance include shortages of places, absence of adequate welfare provisions to assist indigents, distances to be travelled by pupils, and the cost of administering truancy monitoring systems. In addition, the existence in some countries of unregistered private primary schools outside of ministerial control reduces the central authorities' ability to confirm non-attendance.
- 33 _
No fees are payable in any.public primary school - i.e. 'government' or 'assisted' school. Fee-paying private primary schools exist at two levels: the prestigious high-cost level of the 'preparatory' school and the low-cost child-minding level. Increasingly, legal provisions are made for registration of such schools and for their observance of certain minimum standards of building type, space allocation and sanitary provisions. The efficacy of the provisions in ensuring minimum standards is doubtful, especially where public school provisions fall below the standards. Far more than for the primary level, these institutions cater for pre-primary education. By and large, few governments have become involved at this level.
Movement through the primary sector is in most cases by automatic promotion or at least by restricted age-grading criteria. The curriculum throughout the region comprises basically language arts, mathematics and social studies. Provision is stated for art and craft, physical culture, health education, agriculture and basic science teaching. The proportion of schools which attempt to offer the fully prescribed range with any regularity is low. The scope and consistency of offering varies depending on the availability of equipment and appropriately trained and motivated teachers, whim of the teachers, principals or supervisors, school location, weather, and the pupils level in the school. The higher the level, the less likely the involvement in activities other than the basics.
Secondary education is the area of highest priority of most governments and the area of most confusing transition as well. The traditional and still under-lying pattern is the grammar school type education. Experiment and flirtation with variously labelled alternatives have been heavily affected by the high value which continues to be placed on such education. Basically., the grammar school pattern involves:
a) five years of exposure to combinations of subjects selected from among English language and literature, modern foreign languages, mathematics, natural sciences, history, geography, art and music divided into various sub-sections to facilitate subject choices. Combinations of these subjects are examined at the London General Certificate of Education, Ordinary level ('0'_level), or Cambridge General Certificate of Education (Ordinary level). /Note that both these examinations are administered by foreign examining boards^/
b) an additional two years of exposure to a reduced selection from among the subjects listed above examinable by the same authorities at the Advanced Level;
c) tuition by staff comprised mainly of university graduates, in a majority of cases without specific pedagogical training.
Schools which have offered such education date back in many cases to the 19th century, a few much earlier. They have acquired high prestige by virtue of their production of now prominent citizens, success in (foreign) university scholarship entrance, their association with religious orders, or their involvement in the social history of their countries.
- 34 _

The first development at the secondary level within recent times was the expansion of this style of education by the increase of schools (or numbers of places) offering this type of education. Recognition that continuous increase in this mould solely did not suit the needs of developing societies came long before any attempt to modify it. A shift to a more comprehensive style of education has begun. Generally speaking, this shift has involved:
a) broadening of the curriculum to include provision for agricultural science, industrial arts, craft, and commercial education*,
b) the development of 3 - year institutions offering the expanded curriculum examinable at the national, rather than foreign, level;
c) the development of 2 - year institutions or equivalent programmes as a follow-up to the 3 - year patterns, offering on paper the expanded curriculum examinable partly nationally and partly by foreign boards;
d) tuition by staff comprised mainly of non-graduates a large proportion of whom have professional training.
In a majority of cases, the newer institutions referred to above are structural showpieces, well provided with modern teaching aids and equipment, advantageously located and assured of administrative attention at the ministry level. Despite this, the transition to broader education is hamstrung by several problems related to the place of these schools within the system. In general terms, provisions for technical and vocational education have been highly inadequate throughout the region. Where these provisions have been made in separate institutions, they have suffered the traditional prejudice of being viewed as suitable only for rejects from the academic stream. Nor is this problem overcome by the incorporation of these facilities into general school systems. The tendency to stream children into the academics and the non-academics within those schools is still an effective block to truly egalitarian comprehensive education.
Common Problems
The educational systems of all the countries in the region have a large number of common characteristics which, in the context of their developmental goals, constitute problems. As one would expect, the extent to which development is impeded by these problems varies.
Pre-Primary Level 25/
Generally speaking, governments have not concerned themselves with pre-primary education. Only in Jamaica and Guyana is this an area of official concern. The Jamaican government has been actively supporting this sector both by financial subvention and by engaging in the training of the teachers for this level. By virtue of its total control of the education system, the Guyanese government has
25/ See Appendix II .
- 35 _

greater responsibilities in this area than that of Jamaica. The responsibility-is new though, because prior to the take-over mentioned earlier, the Guyanese government was only marginally involved. In the remainder of the region, pre-primary education is the special preserve of charitable organizations and private citizens.
Lack of government involvement in the pre-primary sector is a serious deficiency of the region systems. Given the social conditions in all of the countries, it is.clear that majorities of the child population are ill-prepared for full participation in the existing formal education systems. The opportunities and stimuli provided within their familiar and local environments are frequently at variance with the assumptions of the primary school systems. This is not to imply that the assumptions of the primary school system are either correct or justifiable. Indeed, they frequently are not. But the existence of a gap is recognizable and needs attention.
Regardless of the socio-political.ideologies of the governments, they all profess some concern for equality of opportunity for children within the society» Given this, it would seem to be important that social imbalances inherent within post-colonial societies should be re-dressed as early as possible within the life of young citizens. Neglect of this sector indicates a failure to grasp the importance of this level of education in establishing social attitudes and learn-ing strategies which might more readily favour success at later levels and attitudes more complementary to the developmental interest of the countries. Even if specifically positive goals were not envisaged within the pre-primary sector, governmental involvement would, more than likely, reduce the harmful effects of exposure of the 3 - 5 age group to 'teachers' of dubious education and marginal training.
It is noteworthy that it is only in the two countries which have unequivocally stated socialist goals that pre-primary education is an official area of involvement. It may be that they are more serious about redresss of social imbalances.
Primary Level
The primary level of education in "the region has suffered neglect in favour of the expansion of the secondary sector. Given the early restriction of secondary education to members of the ruling classes in the region, the populations place high value on attendance at secondary schools. This social fact has been responsible for governmental focus on expansion of the secondary offering with a consequent reglect of the primary sector within the limited financial resources of the countries.
Primary schools are generally older and less substantial in construction than the secondary schools and, even without comparing them in this manner, are far below acceptable construction standards. A majority of primary schools would be best demolished or almost completely re-built. Even those which are structurally acceptable need major repairs, re-modelling or renovation if they are to be presentable to their communities and conducive to the purposes of education.
Certainly, the nature of school buildings is partially responsible for stagnation in teaching styles at that level. Absence of basic modern amenities
- 36 _

reduces the quality of the schools as places in which adults wish to work and children to learn 26/ . Poor physical conditions at this level appear to have several effects:
i) reluctance of teachers to remain in the primary sector;
ii) reluctance of parents, especially those with moderate means, to send their children to these schools;
iii) restriction of the learning activities that can be undertaken;
iv) deterioration of discipline and over-assertion of authoritarianism on the part of the teachers;
v) low effectiveness of the education offered.
Overcrowding is commonplace throughout the.primary level. The obligations implied in free compulsory education have been poorly met by the region's governments. The location of new schools has frequently been a matter of partisan political decision-making rather than a planning matter. Within recent years, decreases in the birth rates have lessened the pressures in all four of the more developed countries. Expansion of the secondary intake has also relieved over-crowding, but the statistics cited in subsequent sections indicate that the problem continues to restrict the quality of primary education.
None of the countries of the region has a fully trained teaching force. At the primary level, this fact is exacerbated by unsatisfactorily low levels of educational attainment among persons employed as teachers. Some general remarks on problems in attracting better quality personnel are appropriate here.
At the period of each country's evolution when race, colour and economic standing were less covertly related to career possibilities and high education opportunity, the teaching profession was a highly valued means of escape for and to the middle classes. The fact that the cost of training was a government responsibility and that training was available within the region made it particularly attractive to the ambitious without means to educate himself professionaly outside of the region. The intellectual capability and level of commitment of those recruited into the profession was consequently high. This pattern has been modified by the following changes within the region:
i) University level education is now available within the region affording access to independent professions, employment at the higher levels of the civil service or teaching at secondary level (which is more prestigious than teaching at the primary level).
ii) Changes in wage structure of the society have reduced the financial desirability of teaching at primary level.
26/ Extravagance is not suggested as a desirable norm.
- 37 _

Persons who have university entrance qualifications prefer to enter university. Consequently, the teaching profession receives applications from less well qualified persons.
The.curriculum of the teachers' colleges is such that the academic component can be used as preparation for the successful completion of examinations required for university entrance and is used as such.
The regional university has provision for entry of persons who have completed teachers' college and taught for a prescribed period of years.
Entry to the teaching profession is therefore used as a stepping-stone to what is viewed as more desirable careers. The result of these considerations is that the general educational level of personnel who enter the service and the teachers' colleges is less sound than it ought to be at this stage of the region's development. For the same reasons, the level of professionalism of the teaching force in the region is suspect. The poor conditions in which they operate do not encourage repair of this deficiency. Morale among primary school teachers is institutionally affected by the hierarchical prejudice by which primary school teachers are traditionally non-graduate whereas secondary teachers are traditionally graduates. If there were an established pattern of remuneration by qualification regardless of the level of the systems at which one operated, this particular prejudice might be eliminated with a resultant motivation of primary teachers to seek higher qualifications and return to primary education as a career.
• Teaching in the primary sector suffers from pressure to prepare students for secondary school entrance .examinations. Given the high premium placed on secondary education and the insufficiency of places at secondary level, a number of attitudes deleterious to proper education exist within the populations in respect of these examinations. Most teachers see the rate of placement and type of school in which their pupils are placed as a measure of their teaching ability.
There exists, therefore, hoth inter-colleague and inter-school 'competition' to achieve highest percentages of placements. Parental anxiety over' the examination is high and pupils absorb this spirit both from their schools and homes 27/ . Since the test is restricted to language and mathematical skills, the range of teaching at the primary level becomes progressively restricted as the child approaches age 11 . In addition, since the examination is a multiple choice test, drill in this kind of work replaces educational exposure. The implications of such anxiety and restriction are all pervasive. Children who do not succeed at this examination are viewed and view themselves as having failed in life '. Primary teaching then takes the shape of preparation for entry to a secondary education which most of the children do not attain. The wastage resulting from such mis-directed effort is a fundamental shortcoming of the primary sector throughout the region.
27/ The anxiety seems to increase in proportion to the expansion of the secondary sector. In Trinidad and Tobago where 62% of children writing the examination were admitted in 1977, anxiety seems to be higher than in Jamaica where only 17.8% were admitted in-1976.
iii)
iv)
- 38 -

The primary curriculum has staggered slowly with inadequate changes over the several years of its existence. Serious attempts to change the content and practices of primary curriculum are being made in Jamaica and Guyana. In both these countries the revision of curricula has been accompanied by direct development of new materials by the ministries concerned. In the other countries, syllabus changes have not been supported by new materials specific to the syllabuses. Reliance on the work of foreign publishing houses sometimes employing regionally-based authors and consultants, has been the main means of changing materials in use. Even so, the vast majority of curriculum material in use is as antiquated as the school buildings. It is accurate to summarize the relationship between the stated curricula and the practice of teaching in the primary sector as inadequate. Much of the direction of the teaching is determined by the textbooks in use in a particular school where it is not determined by the secondary school entrance examination. The central problem here is that, barring the increasingly productive efforts in Guyana and Jamaica, curriculum development has not been established sufficiently within the region's ministries to ensure change and modernization of practices and materials within the system. This is not to deny the presence within ministries of education, of personnel who are assigned to curriculum development activities and in some cases competent to perform them. The key is that the structures within which these personnel are made to fit are generically unsuited to the academic approaches demande by curriculum development activities. Their effectiveness is hence either incomplete in system coverage (i.e. subjects or regions) or sporadic.
It is particularly significant that agriculture is not an established area of the primary school curriculum (nor for that matter the secondary) despite the fact that so much of the regional economy is based on agriculture. In most countries of the region, agricultural based activity in schools is casual, unsustained and frequently involves only the post-primary sector (i.e. those who have not been placed in the secondary schools). Traditional negative attitudes toward manual occupations reduce the willingness of teachers, parents and pupils to engage in such tasks related to the programmes in agricultural science that exist 2 8/.
Secondary Level
Education designated secondary is an area of considerable unevenness through-out the region. Genuine attempts to diversify the nature of secondary education have been reduced in their value by the political urgency to increase the number of children receiving such education. Several governments (e.g. Guyana, Jamaica, Barbados) have deemed the post-primary sections of all-age schools to be secondary departments. This strategy enhances the numerical count of students receiving secondary education. However, no substantial modification to plant, equipment or staffing is undertaken in order to make.the offering even marginally comparable to the offerings of schools which are specifically secondary. This practice of self-deception is particularly undesirable where the programme attempted is nominally similar to that of the comprehensive schools. It fosters the notion that comprehensive secondary education is inferior to academic secondary education and increases the lower valuation of the newer comprehensive programmes in the
28/ See however discussion on Guyana.
- 39 _

eyes of the public, the teachers and the students. • As a result, diversification of secondary education, which is so much to be desired within the developmental frameworks of the several countries, fails to achieve its purposes and instead, favours the continued elitism of academic style education. Egalitarian goals cannot be achieved where there is obvious fostering of an order of preference - academic, comprehensive, technical, vocational.
The error does not only lie in the failure to provide the tools of secondary education for these 'secondary departments'. There is a further more systematic error. In all of the countries, access to the secondary school is by means of a common entrance examination. The type of school to which a student is assigned depends on his performance in that examination. The highest scoring students are allocated to academic style schools within their intake capability; the next highest scoring group is assigned to comprehensive style schools. Performance ranking then, on an academically based test, is the basis for assignment not only to academic style schools but to the comprehensives as well.
The problem does not end at the entry point. Children in 3 - year programmes may gain access to the next level of two years to '0' level by a further placement examination at age 14- . Candidates who are placed, go either to the two year institutions or to longer established secondaries which have pre '0' Level and '0' level classes. No such examination is taken by students of the same age in the latter type of school. It is therefore, the "new scheme" children who have to compete to enter the other schools while children in the latter schools do not have to show similar performances to maintain their places.
In the face of these factors, it is not difficult to recognize that the two styles of secondary education are officially recognized as unequal. It must be clearly understood that the writer of this study does not believe that all children ought to have identical education. It is neither ii their own interest nor that of the society. Neverthelsss, there is little doubt that the current patently unbalanced situation is undesirable.
Efforts to modify the curriculum of the academic style schools, which are almost all long established institutions, have been minimally successful for several reasons:
1. the efforts have not been serious;
2. the bureaucratic phrase "subject to the availability of equipment and staff" is allowed to delay changes;
3. in many cases the older schools belong to religious organizations, or are managed by independent boards of governors. While, under normal circumstances, these boards can be overruled or bypassed by the ministries, in cases where change appears to be likely to lower the prestige of the school, the boards find themselves championning a cause of resistance supported by large sectors of the public and by many educators as well. The political loss likely if most governments overruled the resistance is one which no regional government has thus far attempted to test. (The problem no longer arises in Guyana where the government has total control of the system.)
- 40 _

Equality of opportunity within the secondary system is also hampered by differences in the staffing of the comprehensive schools by comparison with the traditional institutions. The secondary sector has traditionally been staffed by graduate teachers. It is important to note that the proportion of these graduates who are trained as teachers has never been a source of contention. A university qualification at the Bachelor's level was the norm for several decades. The comprehensive style schools do not have a proportion of graduate teachers equal to that of the older schools. Whether or not this is a measurable disadvantage, it is a severe shortcoming in the perception of the public. Factually, it is fair to state that the documentable educational background of the majority of teachers in comprehensive schools is lower than that of the majority of teachers in academic style schools. Another factor which permits retention of the classification of schools which has grown up within the community is the absence of a policy of zoning of secondary schools and their primary feeders. Such a step is perhaps premature given the absence of at least a uniform curriculum.
Following from these considerations, one needs to examine the supply of teachers at the secondary level. Diversification.of the curriculum at the secondary level has not been co-ordinated with a programme of training for teachers of the technical and vocational subjects demanded by the curriculum. Quite apart from the shortage of suitably trained personnel for non-traditional subjects, financial constrainsts (in some cases), and genuine shortages (in others), have also prevented recruitment to new schools of personnel in traditional subject are as.
In summary then, the diversification of the secondary curriculum has been hampered by inadequate provisions of suitable staffing, selection processes that negate its desirability and failure to break traditional assumptions about the nature of secondary education in the minds of the public. Public education on the nature of the new expanded comprehensive education has not been undertaken in any organized manner. No attempt has been made to counteract anticipatable negative attitudes to the new systems. Moreover, the expanded comprehensive curriculum has been introduced at the same time as new institutions and only in those institutions initially. They and their programmes suffer automatically by comparison with the longer standing institutions. A more sound strategy would have been to effect expansion of the curriculum within the older institutions before developing the new ones. In terms of regional development, attitudinal shift from the high valuation of white-collar employment will not be generated by the secondary systems within the near future.
The statistical data presented in subsequent sections demonstrates the underdevelopment of the technical and vocational areas of the secondary level. We have already discussed the inadequacies of these areas within the secondary schools. Where technical and vocational education is separated into independent institutions, the numbers of students catered for is too low to meet the stated needs of economic development.
Expansion of the secondary sector also suffers from the purely financial constraint of the economies. Most governments have had to engage in long-term borrowing to finance the capital cost of secondary school construction and equipment. The high cost relates only partially to the cost of materials and labour. A considerable part of the cost relates to the assumptions about what should be the norm for such schools' appearance. Related to this is a failure to
- 41 _

seek methods and materials for construction which do not rely on imports both of hardware and technology. Seeking external financing implies other restrictive factors both at the level of materials, design and curriculum. External funding agencies tend to underwrite only those projects, which in terms of curriculum styles, appeal to them. Proof of this is exemplified by the 1966 goals of the 'New Deal for Education' in Jamaica in which the criteria for grant of the loan so closely resemble the stated goals of the education system as to give the impression that the latter were written to suit the former.
- -

IV. EDUCATION WITHIN NATIONAL GOALS
It is vital in assessing the relationships between the region's educational systems and stated national goals to be conscious that the design of the education system does not post-date the statements of developmental goals. In all cases, the systems pre-date the goals and each country is faced with problems of system re-design rather than system elaboration. These problems are made less manageable by the fact that the current national goals differ sharply from the goals that can be assumed in the pre-independence period. Fair critical appraisal must be aware of this.
Barbados
As in the case of all other Caribbean countries, the Government of Barbados sees education as one of the mechanisms for achieving its social objectives. In the Development Plan 1973/1977, apart from the areas of personal development which can be stated as goals for education universally, the govern-ment states:
"The third function of education and the one to which increasing attention is being paid is to produce the range of skills required in a dynamic economy." (p.10 - 2)
The writers of the plan see the country as undergoing rapid social, political and economic change "from an elitist to an egalitarian society, from a colony to an independent country and from a mono-crop agricultural society dominated by the sugar industry to an increasingly complex and diversified economy." The government committed itself to upgrading and expanding primary level facilities and achieving adequate universal free primary education. At the secondary level, it indicated an intention to increase emphasis on technical and vocational education. It also stated as its policy the provision of a system of secondary education,
"universal and free to all pupils between the ages of 11 and 14 and thereafter, on a selective basis, to those pupils who have demonstrated the ability to profit from further secondary education up to the age of 17 or 18." (p.10-11).
At the time of preparation of the plan, the government envisaged capital expenditure within the life of the plan of BDS$11.5 million. This was earmarked for construction of new secondary comprehensive schools and extension ,of existing secondary comprehensives and grammar schools to a total of 7,000 additional places. At the primary level, an outlay of BDS$2.8 million was envisaged for rehousing 11,400 students in new or extended primary school facilities. It is difficult to ascertain how completely the targets have been achieved. Nevertheless, the provisions cited indicate the direction of piovement of the system. It should be noted that at that time, the government
- 43 _

"was spending 21% of its total expenditure in the educational sector. In the 1975/1976 estimates, 29/ of a total recurrent expenditure of BDS$175.4 million, BDS$43.4 million (24.7%) was earmarked for education, while of $48.3 million capital, $6.8 million was allocated to education.
Primary Level
The most recent publication of a comprehensive set of educational statistics for Barbados dates from 1967. This is most unfortunate because it makes discussion of the contemporary picture sketchy and difficult to compare with other countries.
In 1976, there were 120 government primary schools in Barbados including one special school for the deaf and three pre-primary schools. The schools are sub-classified on the basis of the ages of the children for whom they cater as follows:
1. Nursery (under 5 years)
2. Infant (5-7)
3. Primary (5-9)
4. Junior (7-11)
5. All age (5-14) 30/
The total number of pupils in those schools was 35,829 distributed as follows:
Infants Juniors Seniors Total
12,538 19,726 3,565 35,829
No figures are available for private schools outside the control of the »J.11J.O Li. .
It is worth noting that there has been a decline in the number of children under 11 enrolled in primary and all age schools from 43,934 in 1967 31/ to 35,829 in 1976 32/
29/ Central Bank of Barbados: Economic and Financial Statistics, April 1977.
30/ Two schools cater for children aged 7-14 and 9-14. 31/ Ministry of Education: Digest of Education Statistics 1966/1967
Bridgetown (undated) Table p.l. At that time an additional 1,346 children were registered in unaided independent primary schools.
32/ Ministry of Education, Barbados, private communication.
- 44 _

The decrease appears to relate partially to a fall in the birth rate in the country. No information is available for the size of the age cohort in 1976. However in 1972, the total population aged 5-11 was estimated 42,537. The rate of participation for that age group was 85.5% (in government primary schools). In 1973, the proportion of primary school teachers who were trained was 44.5%. The ratio of teachers to pupils was 1:30 and the ratio of trained teachers to pupils was roughly 1:74 33/» (Table 28 shows teachers actually in government owned and/or maintained schools at June 30th 1973).
Secondary Level
Secondary schools in Barbados are classified as 'grammar' or 'older secondary' schools, 'comprehensive' or 'newer secondary' schools, 'aided' or 'approved independent' secondary schools and 'unaided independent' or 'private' schools. Grammar schools and comprehensive schools are fully financed by the government. Approved independent secondary schools are financed in accordance with the following formula: emoluments of 1 teacher per 100 pupils between ages 10-17 up to 500 pupils, and thereafter 1 to every 200 or part thereof being not less than 60% of 200. In addition, a number of bursaries are offered to students attending these schools on the basis of the C.E. Exam (1973, 464 bursaries).
In 1976, there were 10 grammar schools, 10 comprehensive schools and 18 approved independent schools. Enrolment was as follows:
Grammar Schools 5,626
Comprehensive schools 13,438
Approved independent 5,777 TOTAL
It should be noted here that in the senior department of all-age schools the programme of work is supposed to be equivalent to the programme of the first 3 years in a school labelled 'secondary'. One should therefore reckon another 3,565 pupils who are supposed to be receiving secondary exposure bringing the total secondary to 28,406. No information on the size of the age group in the total population for 1976 is available.
The 1973 report states that entrance to the grammar schools is by means of a competitive Common Entrance Examination (C.E.E.)'bpen to pupils over 10 but under 12 on the 1st September in the year of the examination. It does not state the means of entrance to comprehensive schools.
The C.E.E. in Barbados is a two-part examination in which Part I is a
33/ Ratios do not include headteachers.
- 45 _

qualifying test for entry to Part II. The examination is set by an educational research unit of the University of Edinburgh in collaboration with the Ministry of Education. In 1973, 10,445 children sat Part I and of these, 4,455 (42.6%) qualified for Part II. Of those who sat Part II, 818 were placed in grammar schools and 464 were awarded bursaries to approved independent schools. In other words, less than one-third of the pupils writing Part II were placed in one of these school types. This represents only 12.2% of the original 10,445 who entered at Part I. No indication of the placement in comprehensive schools for that year is available. However, the Form I enrolment in 1973 for the comprehensive schools was 2,934. If we assume that these children were placed wholly or partially on the basis of the same examination, we may calculate a total secondary entry in that year of 4,216 or 40% of the original 10,445 entered at Part I.
Examination of the types of schools from which pupils enter the older government secondary schools by means of the Common Entrance examination is indicative of a strong bias in favour of children from private preparatory schools. This bias must be considered in the light of the patronage of these schools by the middle and upper socio-economic groups. It should not be automatically assumed to reflect a disparity in the quality of education offered in government and private schools. In 1973, 93% of the entrants at Part I were from government primary and all age schools. Only 39% of them reached Part II and of those sitting that examination only 14.5% of them were placed in one of the older government secondary schools. By contrast, the private schools supplied '7% of the Part I entrants of whom 70% reached Part II. of "those sitting Part II, 48 % were placed in similar schools. Hence, although entrants from government schools outnumbered those from private schools by 13 to 1, their placement rate was only 2.3:1. This disadvantage to the mass of the population in secondary placement is repeated throughout the region.
Staffing in the grammar schools stood at 261 and in comprehensive secondary schools at 521, providing ratios of 1:21 in the former and 1:22 in the latter. The proportion of trained teachers in the grammar schools was 42% and in comprehensive schools 51%. (See Table 28 for details).
Between 1973 and the present time, a significant increase in the proportion of trained secondary school teachers should have taken place, since training for graduate teachers is now available in Barbados at the University Campus there.
It is important to observe here that the comprehensive schools do not really offer the same programme as the grammar schools if one is to judge by the fact that they prepare students for different examinations. The 1971 report of the Ministry of Education makes this quite clear:
"All pupils of the Grammar Schools are expected to work towards examinations set by various overseas bodies.... In the Comprehensive schools, pupils who show ability are also allowed to work towards examinations set by overseas bodies, the other pupils write subjects of the Barbados School Leaving Examination which is organised
- 46 _

Tabic 28. Barbados. Teachers actually in government owned-and/or maintained schools at June 30, 1973
Type Graduates Completed Not Total Grand % of Ratio of of Secondary a/ Completed Total Total Teachers cj
School Secondary Trained (excluding Trained Un-Trained Trained Un-Trained Un-Trained Trained Un-Trained Headteachers)
y to pupils
Primary 1 1 639 233 564 640 798 1,438 44.5 1:30 S All-Age
Newer 40 50 226 144 61 266 255 521 51.1 1:22 Secondary
Grammar 66 114 44 27 10 110 151 261 42.1 1:21
Total 107 165 909 ' 404 635 1,016 1,204 2,220
a/ "Completed Secondary" means having obtained four certificates at G.C.E. Ordinary level, including English Language or the equivalent of this.
b/ A "trained teacher" is one who has attended and successfully completed an approved course of professional training at a Teachers' College, a University Department of Education or other training Institution.
c/ These ratios give the "overall" picture. Variations occur between schools because of differences in total enrolment, single sex or mixed, number of subject options, etc.
and supervised by the Ministry of Education". 34/
In the secondary schools, including grammar schools, provisions exist for teaching of technical and vocational subjects - Industrial Arts, Commercial subjects, Art, Handicraft, Home Economics and Agricultural Science. It is not clear how well subscribed the courses are, but given that those students who offer them do so mainly for the School Leaving Certificate, it can be assumed that their importance is low in the grammar schools and higher in the comprehensives. The Barbados Community College with a 1973 enrolment of 923 students offers 6th Form education as well as vocational programmes in commerce and technical subjects. The Samuel Jackson Prescod Polytechnic provides full-time and part-time courses in Building trades, Electrical and Engineering trades with certification by the City and Guilds of London Institute and the Associated Examining Board. Its enrolment in 1973 stood at 1,284 students.
Teacher education for the primary level is provided in the Erdiston Teachers Training College. The college's enrolment in 1977 was 242 students in a two-year programme taugth by 23 full-time and 5 part-time staff. Mihimun entry requirements are 4 '0' levels including English Language.
Guyana
Guyana is committed to socialism and sees co-operativism as the means to .achieving its ideals. The perspectives of the government are stated in the 1972-76 draft development plan 35/ in the following terms:
1. The society must be truly Guyanese - true unity of its ethnic groups must accompany spread of economic activity and development regionally and societally;
2. Guyanese must be self-reliant - in managing their own affairs, producing to meet their needs, controlling technological change in their society;
3. The society must be egalitarian - co-operatives are seen as the main vehicle for achieving this end.
34/ Report of the Ministry of Education Barbados for the period 1st. September 1970 to 31st. August 1971, p.29.
35/ Government of Co-operative Republic of Guyana: Draft Second Development Plan 1972-1976, Ministry of Economic Development, Georgetown, 372 p. mimeojl972.
- 48 _

The national objectives of Guyana are stated by the government as follows:
1. The creation of employment opportunities for all Guyanese.
2. The attainment of an equitable distribution of income.
3. The achievement of an equitable geographical distribution of economic activities.
4. The establishment of the foundation for the attainment of self-sustained economic growth. 36/
In 1972, the government set itself the goals of feeding, clothing and housing the nation by 1976. It saw this target as a duty of the Government and people, a duty which offered opportunity for creation of employment, expansion of the economy and for extending geographically and functionally, economic activity within the country. That the total goals have not yet been achieved may provide a heated talking point for partisan politics. However, as far as any assessment of education within Guyana goes, the statement of the task and an attempt to achieve it rather than the date for its realization is of paramount importance.
Against the background of concerns expressed in the development plan, the political philosophy of socialism, the social vehicle of co-operativism and the .specific perspectives stated above, the leadership of Guyana sees education as a tool for development of the nation. The Prime Minister puts it as follows:
"Education in former times was used as an instrument of division and class prejudice in support of the imperialist capitalist system. Now it must be used as an instrument of true democracy and a tool for fashioning the socialist society." 37/
The Development Plan stated a consonant focus:
"Developments in education are important not only because they can contribute to the supply of skills but because they can lead to a deeper appreciation and understanding of the desire for Guyanese social and
36/ Planning Unit, Ministry of Education and Social Development: Nine Year Report 1965-1973, Georgetown, 1974, p. 25
37/ Burnham, L.F.S. : Towards the Socialist Revolution. Office of the Prime Minister, Georgetown 1975. p. 26.
- "49 -

cultural values and to a greater equality of opportunity where merit, rather than privilege at birth, determines status in our society." (p.60).
The specific goals of the educational system are stated in the Nine Year Report 38/ in the following terms:
"The educational system is expected to prepare citizens who will appreciate and understand the social circumstances of Guyana and their roles in the Guyanese environment."
The system therefore, will in particular aim at:
i) the creation of a learning environment which would develop a feeling of self-worth in the individual and promote harmonious inter-personal relationships;
ii) the inculcation of patterns of human behaviours which support strategies determined for national development
iii) the supply of academic training relevant to the wide range of occupational skills necessary for the economic and social development of Guyana;
iv) the orientation of the school population to occupations relating to the three major goals of feeding, clothing and housing the nation;
v) the involvement of the school population in community schemes which identify job opportunities and job needs in the rural, urban and hinterland areas in which they live;
vi) the provision of organizing skills which prepare young people for self-employment in accordance with their skills and interests and the observed needs of particular communities.
To achieve these ends, the Government of Guyana spent in 1975 G$47.9 mn (recurrent) and G$ll.l mn (capital) representing 11.1% of its total public expenditure and 5.5% of its GDP. This proportion was in fact the lowest
38/ Planning Unit, Ministry of Education and Social Development (1974), op.cit. p. 25-26.
- 50 _

percentage of total government public expenditure between 1966 and 1975. Unfortunately, figures are not available for 1976, the year in which the government took full responsability for all levels of education.
The complete takeover by the government of all educational institutions in Guyana is a factor which muddles evaluation of their educational system. Takeover of the private sector brings within governmental responsibility and accountability both the liabilities and the assets of the private sector. To the government's credit or discredit, now fall such poor provisions as exist in the pre-primary sector (plant, equipment and personnel) as well as the above average provisions of the prestigious preparatory schools. In other words, statistical indicators for several years after the takeover may show 'worsening' of the teacher training levels, 'deterioration' in plant, 'increase' in overcrowding, etc. at some levels of the system, while the opposite may be noticeable in other areas of the system. It seems best then, to comment on the fact of government control per se rather than to comment on the system in terms of its control by the government.
The egalitarian goals envisaged within the socialist ideal make government control in education a logical necessity. That the Guyana government has taken the step 39/ is therefore consistent with its position. There is some doubt though, whether adequate planning preparations preceded the takeover. Documentation to the contrary is not available.
Guyana is at the present time some distance away from equality of educational opportunity. The statement is applicable at all levels of the system and in respect both of qualitative and quantitative measures, discounting the pre-primary level for which the government had no responsability prior to 1976, the primary and secondary levels show extensive variations in the adequacy of physical plant, the levels of training and education of teachers, the supply of teachers 40/ and the likelihood that students at one level will be admissible at subsequent levels of education. At the primary level, overcrowded, dilapidated and outmoded buildings and furnishings restrict the quality of teaching possible in far too large a proportion of schools. Documentation on regional differences in school conditions is not available. However, the differences in distribution of trained teachers suggest continuing biases in favour of urban areas.
It is of value here to note the findings of Bynoe (1972) 41/ on a section of the pupils successful at secondary entrance. He notes that in 1969,
39/ The government of Jamaica has not yet stated an intention to do so.
40/ See Tables 29, 31, 33, 35.
41/ Bynoe, J.G 'Equality and High School Opportunity - A Guyanese Case Study'""1972.
- 51 _

despite a rural primary school population four times as large as that of Georgetown, there were only 2 ^ / 2 times as many rural children in the secondary sector. In 1971, rural children obtained only 25% of the places for entry to government secondary schools. He observes too, that although the number of children in public primary schools exceeds the number in "expensive private preparatory schools" by a factor of at least 15, 53% of free place winners came from the latter schools. In addition, in a country where the working class (non-clerical) occupational group comprised 54% of the population, in 1967 only 16%, and in 1971 only 14% of free places went to children of working class parents. In other words, access to secondary education is still biased in favour of urban middle class children despite the movement towards equalization which can be credited to the government's efforts. 42/ Bynoe (1974) 43/ documents the improvement in relative ethnic representation and regional-
representation between the mid-fifties and the seventies.
Revaluation of the purposes of education in Guyana is exemplified in the development of community high schools.and multilateral high schools with programmes that point clearly to equipping children for work that is supportive of community goals. The seriousness of the government's intention is exemplified by a look at the programme of the teachers' colleges far better than by consideration of the schools themselves. The Cyril Potter College of Education is concerned with the preparation of teachers for the primary and the post-primary (tops of primary) sectors of the system. The college has made agriculture one of its central concerns to the extent that it cultivates 10 ^/2 acres of rice, 3 acres of vegetables and maintains a poultry farm of over 4,000 birds. Labour and management in the enterprise are provided by the student teachers. The Lillian Dewar College of Education which is concerned with secondary teachers will be, when it moves to a new suitable location, similarly involved in such an integration of teacher education with a stated developmental goal. This inclusion of work experience in a traditionally negatively valued area within the scheduled activities of a teachers' college is unique in the region.
The disgression here indicates that the level or seriousness with which Guyana views its educational re-orientation is sufficiently high that a complete shift to the multilateral and community high school style of secondary education is a real likelihood in Guyana. It should be noted here too, that Guyana has committed itself unreservedly to supporting the Caribbean Examinations Council which in 1979 should begin to offer a regionally designed and administered secondary level certifying examination in a phased replacement of the foreign based examinations of Cambridge and London.
42/ See comments on Barbados - p. 71, Jamaica - p. 102 and Trinidad and Tobago - p. .108.
43/ Bynoe, J. G. 'Education and Development' Text of Radio Broadcast 1974
- 52 -
There are however certain areas or concern in the future of Guyana's educational orientation. These relate to the work-study plans for the multilaterals and especially for the community high schools and to the govern-ment's complete control of the education system.
The programme of the community high schools envisages that senior students will actually engage in work related to their area of vocational choice during the final two years of their schooling. This means that even if, for purposes of the statistical measurement of the labour force, they are considered to be students and not reckoned as part of the force, they will be technically 'competing' for jobs with the unemployed within the labour force. Even if one accepts the government's retort to the suggested 25% unemployment figure (see p.42) and the figure is reduced to a more conservative 16%, there is no reason to suppose that the economy can generate enough employment to absorb both the genuine unemployed and the student-workers. In addition, if one accepts both the criticism of high unemployment in the 19-23 age group and the likelihood (given knowledge about the nature of unemployment in the region) that the figure _is_ high, it seems that introduction of an additional cadre of 'workers' might create some further problems for the economy. It must be recognized that part of the anxiety to expand secondary schooling as well as to develop the Pioneer Corps within the Guyana National Service stems from a desire to reduce unemployment by encreasing the number of persons usefully occupied within educational institutions.
The second area of concern is that - the government's takeover of the entire educational system, unless accompanied by a deliberate policy of equalization of standards within the system, can lead to continued, but hidden elitism within the state system. It has been shown that prior to the takeover, 'prestigious private preparatory schools' provided a disproportionately high percentage of the winners of free place to secondary schools. These schools have not ceased to exist; they have merely ceased to be 'private' or 'preparatory. Given their geographical concentration and location, it is quite likely that they will continue to be patronised by the children of above average socio-economic and educational backgrounds and that their success in preparing children for secondary school entrance examinations will continue. The danger is that, because they too are now within the public sector, their continued advantage over other schools may not be noted in the statistical documentation. Consequently, they may continue to offer a safe route for the middle classes through to secondary education at the expense of the mass of the population. Two courses of action immediately suggest themselves. Firstly, the aspects of these schools which are worthy of preservation should as far as possible be generated within the rest of the system; 44/ secondly, pre-primary education, especially of children of lower socio-economic groups, should be accelerated within the system.
44/ It is vitally important that attempts at system equalization should not take the form of stripping these institutions of those of their characteristics which are desirable.
- 53 _

The Pre-primary Sector
Up to 1976, pre-primary éducation was not an area in which the Government exercised control or was involved. Estimates made in 1974 indicated that approximately 80,000 children were enrolled in 200-300 45/ nursery schools, none of which was government controlled. At that date, the government described its position as "not yet ready to control pre-primary education but interested in the future of the 80,000 children....". The main area of official concern over these schools was the appalling accomodation and the unacceptably high proportion of untrained 'teachers' who functioned in them. In that year, therefore, G$1.0 million was provided for training in and observation of proper nursery school education. With the active collaboration of the government, the Guyana Association of Childhood Education began several schemes in 1973 for the improvement and ultimate transformation of pre-primary education. Developments envisaged for pre-primary education are about to move beyond the planning stages.
Primary education
By the Education Ordinance of 1876, schooling became compulsory for all children between 6 and 12 years old except in Georgetown, New Amsterdam and Buxton where the requirement was 6 to 14 years old. Schools however, admitted pupils from age 5 until the Memorandum on Education of 1968 fixed the minimum age of 5 years 9 months. Part of the reason for this change in practice was to reduce overcrowding in schools. In 1977, there were 399 schools designated primary, all controlled by the government. 46/ Given the government's stated concern with the elimination of geographical disadvantage in education as well as for the 'spatial' aspects of unemployment, it is worth looking at the distribution of school places in the several administrative districts of the country.
In East Coast Demerara, Essequibo and North West, shortages of places in 1970 were converted to surplus elbow room by 1975 and in East Bank Demerara the underprovision was substantially reduced . With the exception of the above, of the Interior and West Berbice, overcrowding remains a problem.
The potential effectiveness of provision of primary school places must relate partially to both the involvement of the age cohort in school and to the ratios of teachers and trained teachers to pupils. Table 30 shows involvement proportions for 1970 and 1975 in government and assisted schools. The 9 years report (1965-1973) estimated that 15% of the age group for first level primary attended private schools and on that basis suggested an overall involvement of 85%.
45/ Nine Year Report 1965-1973. There is a discrepancy in the figures - page 5 says 300, page 39 says 200.
46/ Up to the previous year only 44.6% were 'government', the rest were denominational.
- 54 _

Table 29. Guyana: Regional distribution of schools, places and surplus/deficit, 1970 and 1975 a/ bj
District No. of Enrolment Places Surplus/ schools Provided deficit
1970 1975 1970 1975 1970 1975 1970 1975
Corentyne 29 29 21,572 21,995 17,810 18,268 -3,742 -3,727 New Amsterdam 44 46 16,252 16,788 15,840 15,837 -412 -952 West Berbice 31 32 12,286 13,303 13,551 14,569 1,265 +1,266 East Coast Demerara 45 42 24,932 24,837 22,692 25^688 -2,240 + 851 Georgetown 35 36 29,123 28,921 23,522 23,109 -5,601 -5,812 East Bank Demerara 33 36 16,316 16,872 12,622 15,486 -3,694 -1,386 West Demerara 45 45 22,368 22,062 19,522 18,533 -2,846 +3 ,527 Essequibo 44 44 13,466 13,603 11,744 13,642 -1,702 + 39 North West 31 34 3,942 4,078 3,602 4,201 -340 + 123 Interior 51 55 6,341 7,746 8,043 9,232 +1,702 +1,486
Total 388 399 166,578 170,205 148,948 158,564
a/ 1970 data from Planning Division, Ministry of Education. A Digest of Educational Statistics 1970-1971. Georgetown, 1972, 130 p. Table 2. 1975 data from Planning Unit, Ministry of Education and Social Development: A Digest of Educational Statistics 1974-1975. Georgetown, 1976, 183 p. Table 10.
b/ Places needed: 1970 - 20,597; 1975 - 15,406.
- 55 _

Table 30. Guyana: Involvement ratio of pupils, primary schools, first level a/
Year School Population
Estimated % Involvement Total Cohort
1974-75 1969-70 129,527
132,063 170,220 175,786 75.13
76.09
Sources: 1970-1971 Digest, Table 8. 1974-1975 Digest, Table 2.
a/ First level = up to age 12
Since in Guyana the all age school is divided into a first level (primary) and a second level (secondary department), the figures for staffing will be kept separate where the data permit. In 1970, 3,788 teachers were available for the 129,527 pupils at the primary level at a ratio of 1:34. By comparison in 1975, the school population of 132,063 was catered to by 4,096 teachers at a ratio of 1:32. The 1975 Digest of Educational Statistics (p.57) cautions that the overall ratio appears more favourable than it is because there is a large number of schools with enrolments under 100 which, however small, must be staffed by a minimum of two teachers. In 1975, the proportion of trained teachers at first level was 44.4%. A comparable figure for first level primary is not available for 1970, However, for both sections of the ail-age school, the figure in 1970 was 38.2% and by 1975 it had risen to 47.0%. The ratio of trained teachers to pupils (both sections) was 1:81 in 1970 and 1:60 in 1975. Table 31 shows the percentages of trained teachers by educational administrative districts.
56

Table 31. Guyana: Trained teachers by educational administrative districts, 1970 and 1975
Districts 1
Total .
9 7
. %
0
Trained
1
Total
9 7 %
5
Trained
Corentyne 712 34.0 707 43.4 New Amsterdam 522 34.3 568 41.0 West Berbice 435 30.7 456 42.1 East Coast Demerara 828 39.9 840 44.4 Georgetown 1,035 54.4 1,133 69.0 East Bank Demerara 581 30.4 578 43.9 West Demerara 747 31.7 750 43.9 Essequibo 475 31.4 503 35.9 North West 159 22.6 167 28.1 Interior 254 19.6 282 27 .3
Secondary Education
Education designated 'secondary' is offered in Guyana in the following types of institutions:
1. Tops (or secondary departments) of primary schools 2. Senior secondary schools 3. General secondary schools
Multilateral schools 5. Community high schools The variety of experiments which the differences of names indicate,
reflects the transitional nature of the system and the level of attention directed at the secondary system. The order of 2-5 above indicates roughly the order of experiment. Lest gross current figures and detailed examination obscure the progress that has been made in this area, it is worthwhile to quote the statement of Bynoe (1974) 47/ on the expansion of opportunities for secondary education:
47/ Bynoe, J.G.: "Education and Development" Broadcast May 1974.
- 57 _
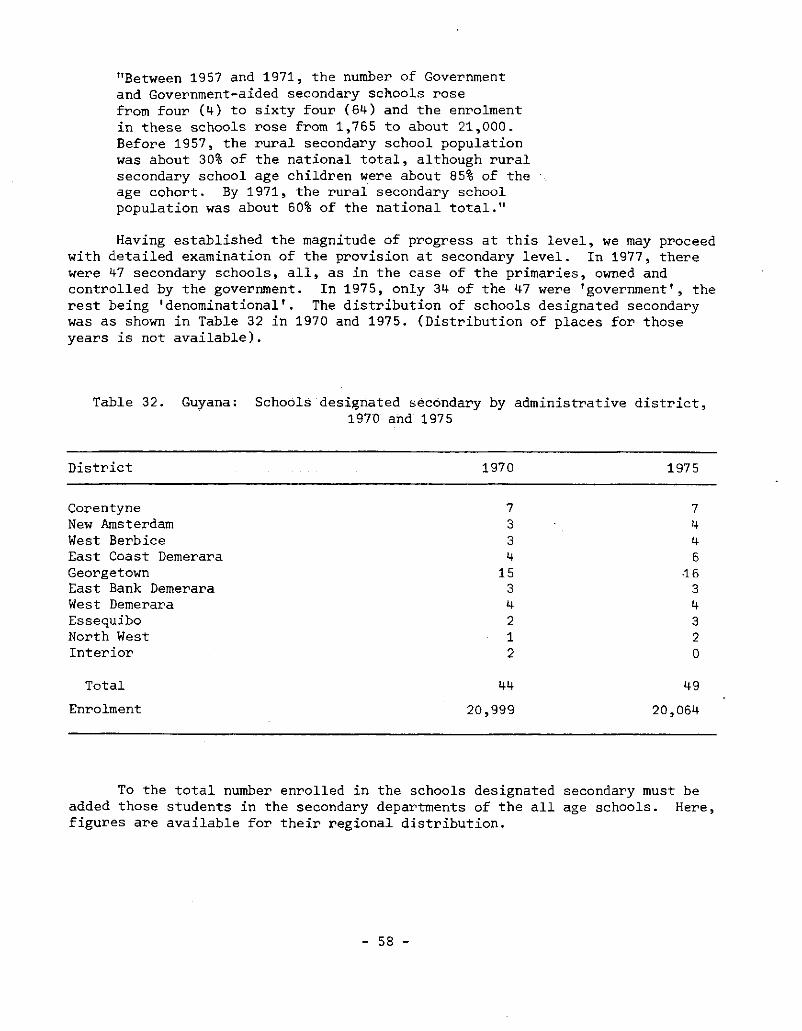
"Between 1957 and 1971, the number of Government and Government-aided secondary schools rose from four (4) to sixty four (64) and the enrolment in these schools rose from 1,765 to about 21,000. Before 1957, the rural secondary school population was about 30% of the national total, although rural secondary school age children were about 85% of the age cohort. By 1971, the rural secondary school population was about 60% of the national total."
Having established the magnitude of progress at this level, we may proceed with detailed examination of the provision at secondary level. In 1977, there were 47 secondary schools, all, as in the case of the primaries, owned and controlled by the government. In 1975, only 34 of the 47 were 'government', the rest being 'denominational'. The distribution of schools designated secondary was as shown in Table 32 in 1970 and 1975. (Distribution of places for those years is not available).
Table 32. Guyana: Schools designated secondary by administrative district, 1970 and 1975
District 1970 1975
Corentyne 7 7 New Amsterdam 3 4 West Berbice 3 4 East Coast Demerara 4 6 Georgetown 15 •16 East Bank Demerara 3 3 West Demerara 4 4 Essequibo 2 3 North West 1 2 Interior 2 0
Total 44 49 Enrolment 20,999 20,064
To the total number enrolled in the schools designated secondary must be added those students in the secondary departments of the all age schools. Here, figures are available for their regional distribution.
- 58 _

Table 33. Guyana: Distribution of students enrolled in the secondary departments or all age schools, 1970 and 1975
District 1970 1975
Corentyne 4,155 4,120 New Amsterdam 3,848 4,031 West Berbice 3,072 3,348 East Coast Demerara 5,732 5,700 Georgetown 5,788 6,461 East Bank Demerara 3,540 3,895 West Demerara 5,636 5,334 Essequibo 2,682 3,156 North West 615 726 Interior 1,026 1,371
Total 33,315 38,142
Of the total secondary exposure therefore of 54,134 pupils in 1970, 61.3/% were in fact in the secondary departments of all age schools. In 1975, of 64,206 secondary students, 59.4% were similarly placed. The involvement ratios for 12-18 population are shown in Table 34.
Table 34. Invôlvéméht ratios, secondary cycle, 1970 and 1975
Year 12-18 Secondary Ratio Population Enrolment
1970 132,846 52,618 39.6 1975 119,287 64,206 53.8
Pupils to teacher ratios in schools designated secondary moved from 1:27 in 1970 to 1:21 by 1975. The training and education of teachers in secondary schools is provided in Table 35. It should be noted too that 52.4% of the teachers in the secondary departments of primary schools were listed as trained in 1975. No separate figure is available for 1970.
- 59 _

Table 35. Guyana: -Teachers in schools designated secondary by qualifications and status, 1970 and 1975
Year Graduate Oualified Unqualified Acting Total Trained Trained Untrained Non-Grad.
Trained Untrained
1970 107 139 204 310 37 71 868 35.8 1975 208 200 259 350 14 129 1,160 42.6
(Regional distribution of trained teachers is not available)
Entry to schools designated 'secondary' (i.e. excluding tops of primaries), is by means of a Secondary Schools' Entrance Examination which is competitive in the sense that placement is restricted by the number of places available in those schools. The examination is taken by children between 10 and 12 years old. In 1975, 16,316 pupils, or 35.9% of the age cohort of 45,499 sat the examination. A total of 3,834 or 23.5% of those who sat the exam (i.e. 8.4% of the age group) were placed in a secondary school. 'Country-wide free places' giving entry to Senior Secondary Schools were awarded to 364 students and 'Area free places' affording entry to Junior Secondary Schools were offered to the remaining 3,740. Children who are not placed by this examination remain in the secondary department of the primary schools and work towards one of two other examinations, both of which can earn them places in a secondary school. They are (a) the Preliminary Certificate examination which is the official school leaving certificate and must be passed by age 13, and (b) the College of Preceptors Examination 48/ for which the age limit is i5 years. In 1975, 24,303 children sat the Preliminary Certificate exam, 2,369 or 9.7% being successful. In the case of the College of Preceptors examination 34.3% (1,746) of the 5,076 students who sat were successful. No information on how many were placed in secondary schools as a result of these two examinations is available.
48/ Discontinued with effect from 1977.
- 60 _

School types at the secondary level
One has to he careful not to assume that the labels 'junior' and 'senior' in the Guyanese secondary system have the same meanings as they do elsewhere in the region. Indeed, all of the terminology needs explanation. General secondary education is offered in two types of schools:
1. The junior secondary schools which offer 5 years of education up to the London '0' level G.C.E. examination;
2. The senior secondary schools which offer a 7_ year programme leading to the London 'A' level G.C.E. examination.
The'multilateral' school offers a five year programme in which the first three years are a comprehensive style programme comprising English Language, Modern Languages, Modern Mathematics, Integrated Science, Social Studies, Music and Drama, Art, Home Economics, Agriculture and Commercial subjects. In the last two years, students may opt to specialize in areas of their interests and aptitude. In the second period the students are exposed to real work conditions In the areas of their specialization. The community high school was introduced in 1973 to improve the type of secondary exposure offered in the tops of primary schools. The community high school is a central school fed by the local primaries in which a four year programme of study in two phases of two years is offered. In the first two years, basic academic subjects are offered together with pre-vocational activities in Art and Craft, Agriculture, Home Economics, Industrial Arts and any other specific vocational activities related to the particular community. In the second two year phase, the emphasis is shifted to the vocational activities from the academic base and students are guided to the selection of one vocational area. It should be noted that the government has stated its intention of shifting the junior and senior secondary type of school in the direction of the multilateral schools.
Independently of the exposure possible within the secondary sector to technical and vocational subjects, six institutions offer courses in these areas. The Georgetown Government Technical Institute and the New Amsterdam Technical Institute had in 1974/1975, total enrolments of 2,042 and 802 students respectively. Their programmes include a wide range of engineering, electronic, construction, commercial and craft skills. The Guyana Industrial Training Centre offers craft courses for tradesmen and in 1975 trained 116 students. The Carnegie School of Home Economics operated a 3 year programme in Home Economics with a 1975 registration of 172. In addition, 625 persons were registered in evening courses. A much smaller institution, the Fredericks School of Home Economics, provided training for 41 students in 1975.
Other provisions
The Guyana School of Agriculture is perhaps b e s t classified as a tertiary level institution. It offers a two years Diploma in Agriculture and a two year Certificate in Agriculture. Total enrolment in 1975 was 148 students.
- 61 _

Teacher education in Guyana is established in two Teachers' Colleges. (See also university provision). The 1976 registration at the Cyril Potter College of Education was 660 students who were being prepared to function at the primary level and in the programmes of tops of primary schools. The college operates a 2 year programme. The Lillian Dewar College prepares secondary teachers in particular for multilateral schools. The registration for 1976 is not available, but 1975 registration was 123 students in a three year programme.
Guyana National Service
Discussion of education in Guyana must consider the provisions within the Guyana National Service. The GNS has a volunteer Pioneer Corps within which a wide range of technical skills and academic tuition is listed as available. After 6 months of military training, volunteers serve a further 12 months during which they may acquire training in language, mathematics, building trade crafts, technical engineering skills, handicraft, electrical and electronic subjects, agriculture and the arts. The extent to which the opportunities listed can be fully exploited is a subject of disagreement. It is clear that agricultural production takes precedence over the training component and that the military component is heavily weighted. GNS was responsible for the development of cotton growing to the extent of being able to export G$300,000 worth of cotton •to Trinidad in 1976. GNS farms also grow, in commercial quantities, black-eye peas, pineaples, peanuts and vegetables. Civic education of 'political education' is one of the main areas of GNS interest.
Jamaica
Jamaica, like Guyana, professes a socialist political ethic and accepts the logical necessity for an egalitarian educational system. Because, however, of the grossly underdeveloped educational exposure of the population, the priorities are differently perceived. The most pressing need is to provide some kind of basic primary education for all children and to achieve literacy in that part of the adult population which has not benefited from effective schooling. To achieve the latter, the Jamaican Government established in 1972, a National Literacy Board aimed at the elimination of illiteracy. The Board was replaced in 1974 by the JAMAL Foundation (Jamaican Movement for the Advancement of Literacy). The programmes of JAMAL involve a staff of 845 persons with several thousand volunteer teachers. In 1975, 85,471 persons were enrolled at 2,748 centres manned by 8,850 volunteer teachers. It is not possible to state the effect of the programme on the rate of illiteracy in the country. Indeed, it seems definite that a psychological breakthrough has been effected in having the illiterate recognize that his handicap is remediable and not a personal fault of stupidity. Evaluation of the programme appears to be urgently required.
The plight of the primary school in Jamaica is fully documented in the "Report in depth of Primary Education in Jamaica" submitted to the Minister of Education in 1974. 49/ One of the most alarming aspects of the primary schools
49/ Ministry of Education: Report in depth of Primary Education in Jamaica. Kingston 1974.
- 62 _

is the low basic education of teachers within the system. The report comments:
"Another feature deserving study is the rarity of cases in which persons who have come up through a High School take up a career in the Primary School system. There exists, therefore, a vicious circle in which, coming from the Primary Schools with a poor education and rising via the teacher's colleges where remedial work can only be partially done, people return to the Primary School to reinforce the unsatisfactory intellectual situation there'" (p. 10).
When one considers the inadequacy of space, the low attendance figures in relation to enrolment and the alarming level of education of the teachers? it becomes clear that the egalitarian goal has to start at the point of simply providing places and higher quality teachers at the primary level. Appreciation of the point is sharpened by reference to the number of children between the ages of 6 and 15 years who are not registered in a school. In 1973, it was estimated that 35,600 children between 6 and 11 year old (i.e. 10% of the age cohort) were not registered in a schoool. At the 12-15 age level, 35,900 (20% of the age cohort) were not registered. 50/ The problem of teacher supply is worsened by the estimated 20% per annum mobility of teachers (graduate, trained and interns) from the education system. 51/ Jamaica, it seems, has to be judged more on the basis of how it meets these problems than on the basis of re-direction of system.
A new national plan for education is in the discussion stages and the system is about to undergo substantial overhaul. The most recent changes and introductions in the system therefore, have the character of purely interim measures. The kinds of targets being proposed in the current discussion include the following:
1. provision of a place in school or of appropriate alternative
educational facilities for all children between the ages 6 and 15;
2. automatic transfer of pupils from the primary to the secondary level;
3. movement to the tertiary level based on manpower requirements;
4. full supply of teachers for all levels of the system;
5. development of the concept of total school including;
- political education - manual work - economic production - school - community relationships - cultural development
In discussing these targets, the Government has recorded its awareness of
50? Ministry of Education: The Education Thrust of the 70's, Jamaica, 1973; Appendix I.
51/ The Education Thrust of the 70's, p.3.
- 63 _

a very wide range of problems already prest nt within the education system. 52/ At the primary level the following can be listed as major problems:
1. Inadequate, outmoded physical plant with similarly deficient amenities;
2. Shortages of materials for classroom use;
3. An undesirably large proportion of untrained teachers;
4. Poor distribution of trained teachers;
5. Signficantly high incidence of late entry to school;
6. Poor reading abilities among childres (approximately 50% of children in Grades 7-9 read below Grade 4 levels);
7. Malnutrition.
At the secondary level, it perceives the need for system rationalization both in terms of entry requirements and standards expected. The following areas of particular concern can be cited:
1. Secondary education in different types of schools is unbalanced -either over-practical or over - academic;
2. Parental pressures insist on an academic orientation with a resultant low self-concept among students in low prestige schools;
3. Unbalanced distribution of teacher resources within the system;
4. Secondary education has generally failed to produce positive work attitudes;
5. Vocational training suffers from fragmentation among several different ministries.
In its 1975/76 budget, the Government of Jamaica provided J$138.5 million or 22.7% of its recurrent expenditure for education, training and cultural development. Under capital expenditure, J$38.9 million was earmarked for the same area representing 10.5% of its total capital budget. Of these amounts, J$129 million recurrent and J$25.8 million capital were allocated to the Ministry of Education. 53/ It should be noted that the capital and recurrent expenditure combined represents the second largest proportion of government expenditure (18.1%), the largest being General Administration - 19.3%.
52/ It should be noted here that many of these problems are nos specific to Jamaica, but they are discussed here because the government has articulated its awareneness of them.
53/ Ministry of Education, Jamaica. "Education Statistics 1975/76". Kingston, 1976, Tables 6-1 and 6-2.
- 64 _

Pre-primary level
Pre-primary (or Early Childhood) Education in Jamaica is offered in three types of institutions: a) government financed infant schools and infant departments of primary and all age schools; b) 'Basic Schools' operated by private individuals and non-governmental organizations; c) independent or private preparatoy schools. In the case of the Basic Schools, the government provides a subsidy to those schools which meet criteria stipulated by the Ministry of Education. These are referred to as "recognized basic schools". In 1977, 54/ there were 1,010 recognized basic schools with an enrolment of 70,649 children catered for by 1,023 teachers. Unrecognized basic schools numbered 629 with an enrolment of 25,321 and a staffing of 628 teachers. 55/ The curriculum consists of basic social training through play and is derived largely from materials compiled by the Centre for Early Childhood Education at U.W.I. The government operates 26 infant schools and infant departments in 69 primary and all age schools. Total enrolment is 21,361. 56/
Primary Education Normal age of entry to the primary or all age school is 6 years. As
mentioned earlier however, this is not universal and there is a fairly high level of later first registration. Insistence on registration at age 6 is impracticable in view of the already overcrowded conditions of the primary sector. Indeed, insistence on attendance after registration could be similarly embarrassed. Table 36 shows the distribution of schools and places and the excess enrolment for Jamaica by parishes in primary and all age schools„some of which include infant departments.
The severity of the under provision of places in the primary sector is made less obvious in actual terms by the attendance figures. For Jamaica as a whole, the average attendance for primary schools is 71% of enrolment and for all age schools 63% of enrolment. 57/ Where low attendance does not reduce the problem, some schools have been placed on a double shift system 58/, and in most cases this has provided some relief. In the face of this predicament, compulsory attendance cannot be seriously envisaged.
54/ Ministry of Education, private communication. 55/ The discrepancy of one school without a teacher is not explained. 56/ Ministry of Education: Education Statistics 1975-76, Tables 1-2A
and 3-4, 57/ Table 3-1A Education Statistics 1975-76. 58/ In the double shift system, two sets of children use the same buildings
at different times of an extended day. Each school has two staffs but a single administrative head.
- 65 _
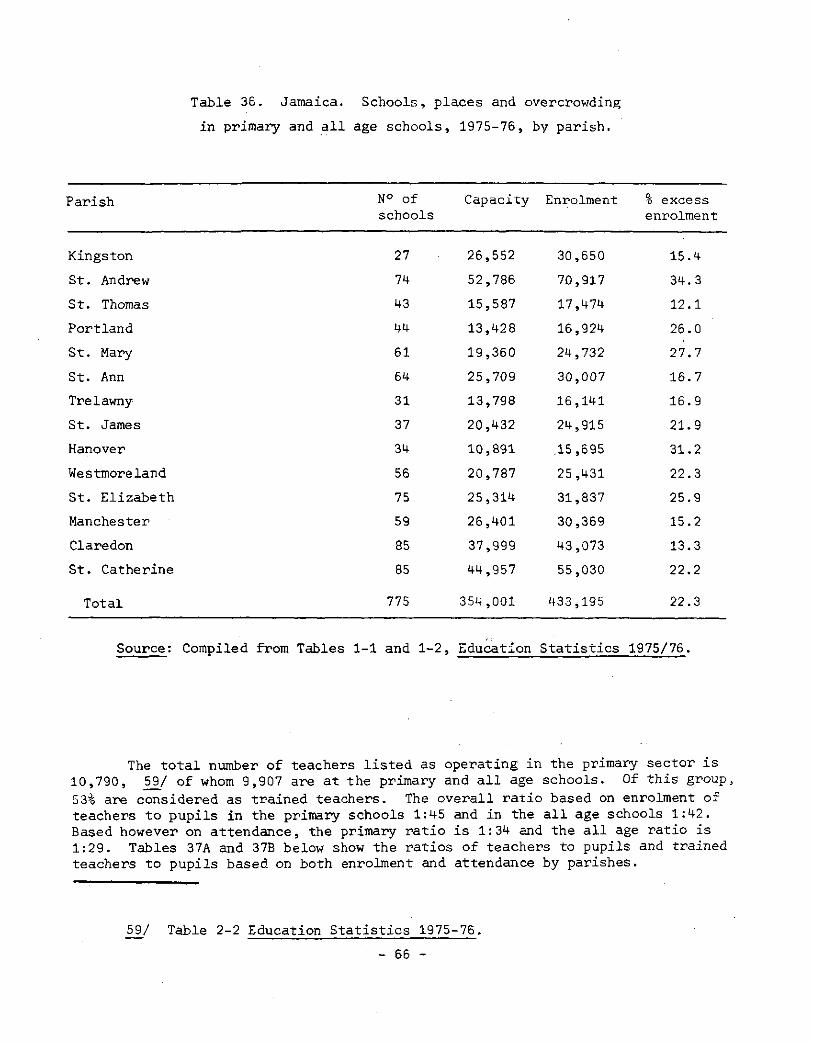
Table 36. Jamaica. Schools, places and overcrowding in primary and all age schools, 1975-76, by parish.
Parish N° of Capacity Enrolment % excess schools enrolment
Kingston 27 26,552 30,650 15.4 St. Andrew 74 52,786 70,917 34. 3 St. Thomas 43 15,587 17,474 12.1 Portland 44 13,428 16,924 26.0 St. Mary 61 19,360 24,732 27.7 St. Ann 64 25,709 30,007 16.7 Trelawny 31 13,798 16,141 16.9 St. James 37 20,432 24,915 21.9 Hanover 34 10,891 .15,695 31.2 Westmoreland 56 20,787 25,431 22.3 St. Elizabeth 75 25,314 31,837 25.9 Manchester 59 26,401 30,369 15.2 Claredon 85 37,999 43,073 13.3 St. Catherine 85 44,957 55,030 22.2
Total 775 354,001 433,195 22.3
Source: Compiled from Tables 1-1 and 1-2, Education Statistics 1975/76.
The total number of teachers listed as operating in the primary sector is 10,790, 59/ of whom 9,907 are at the primary and all age schools. Of this group, 53% are considered as trained teachers. The overall ratio based on enrolment of teachers to pupils in the primary schools 1:45 and in the all age schools 1:42. Based however on attendance, the primary ratio is 1:34 and the all age ratio is 1:29. Tables 37A and 37B below show the ratios of teachers to pupils and trained teachers to pupils based on both enrolment and attendance by parishes.
59/ Table 2-2 Education Statistics 1975-76. - 66 _

Table 37A. Jamaica. Teacher: Pupil ratios by parish showing overall ratios and trained teacher ratios, primary schools
Parish N° of Teachers
Enrolment Trained Overall Teacher Ratio Ratio
Attendance Trained Overall Teacher Ratio
Kingston 327 1 61. 1 46 1 52 1 39 St. Andrew 615 1 60 1 49 1 50 1 41 St. Thomas 169 1 91 1 42 1 65 1 30 Portland 137 1 84 1 46 1 56 1 31 St. Mary 104 1 74 1 40 1 54 1 29 St. Ann 179 1 59 1 43 1 48 1 35 Trelawny 72 1 93 1 44 1 75 1 35 St. James 154 1 66 i 43 1 54 1 35 Hanover 104 1 85 1 35 1 65 1 27 Westmoreland 258 1 85 1 45 1 61 1 33 St. Elizabeth 293 1 80 1 40 1 57 1 29 Manchester 121 1 56 1 46 1 39 1 32 Claredon 394 1 83 1 44 1 60 1 32 St. Catherine 340 1 73 1 46 1 56 1 35
Table 373. Jamaica. Teacher:Pupil ratios by parish showing overall ratios and trained teacher ratios, all age schools
No of Enrolment Attendance P a r i s h Teachers Trained Overall Trained Overall
Teacher Ratio Teacher Ratio Ratio Ratio
Kingston 335 1 58 1 42 1 46 1 42 St. Andrew 879 1 60 • 1 42 1 46 1 29 St. Thomas 238 1 113 1 43 1 77 1 29 Portland 279 1 114 1 38 1 73 1 24 St. Mary 496 1 101 1 41 1 70 1 29 St. Ann 508 1 96 1 45 1 60 1 28 Trelawny 242 1 92 1 51 1 69 1 38 St. James 413 1 83 1 45 1 61 1 33 Hanover 295 1 114 1 39 1 82 1 28 Westmoreland 395 1 127 1 40 1 84 1 27 St. Elizabeth 484 1 95 1 40 1 63 1 27 Manchéster 630 1 77 1 41 1 45 1 24 Claredon 653 1 94 1 40 1 60 1 25 St. Catherine 793 1 90 1 47 1 65 1 34
Total 6640 86 42 59 29
- 67 _

The state of primary education in Jamaica has been the subject of a very extensive report 60/ which has documented the failings which the statistical data provided here cannot reveal.
Secondary Education
Secondary schools in Jamaica are classified as:
a) new(er) secondary schools; b) secondary high schools; c) comprehensive, technical and vocational high schools; d) independent schools.
The term new(er) secondary schools requires some explanation. In September 1974, 18,000 15 year olds who would have been leaving then the Junior Secondary Schools in Grade 9 were offered additional education through to Grades 10 and 11. The result was the conversion of the 3 year programme into a 5 year secondary programme. The schools where this extension has been affected are now referred to as "newer secondary schools". "Secondary high" schools are the established academic oriented secondary schools of Jamaica. Comprehensive, technical and vocational are self-explanatory labels while 'independent' refers to private secondary schools not assisted by the government.
Free places and scholarships for entry to secondary high schools are awarded on the basis of a common entrance examination. In 1976, 34,773 children wrote the examination and 6,211 (17.8%) were placed in secondary high schools. It is important to note that a quarter of the children placed entered from private fee-paying preparatory schools. The disproportionate share of the private sector primary students in the placement at secondary level has been of sufficient concern in Jamaica that in 1962, the government found it necessary to legislate a mandatory maximum of 30% placement for students from these preparatory schools. Figures for 1976 placement of the private schools as against the public sector are not available.
In addition to entry by means of the C.E.E. , a small proportion of students may enter secondary high schools, technical or comprehensive schools on the basis of the Grade 9 Achievement Test. In 1976, 1,035 children (9,7%) of a total of 10,613 who sat this examination were placed in secondary schools. Finally, entry to technical schools can be gained by the 13+ examination but the proportion of children admitted to secondary education through this route is small. In 1976, 799 (6.4%) of a total of 12,454 entered for this examination were placed.
According to the 1975-76 statistics on education, the government owns and operates directly 62 newer secondary and technical, 3 vocational and 4
60/ Ministry of Education, Jamaica: Report in depth of Primary Education in Jamaica. Unpublished 1974, 128 p. and appendices.
- 68 _

comprehensive schools. 61/ It also provides grants-in-aid to 42 secondary high schools. The private sector comprises 418 registered independent schools offering secondary education.
Is is significant that it is only by operation of the double shift system in the newer secondary schools that their enrolments can be accommodated at all; even so overcrowding is noted in Kingston, St. James, Westmoreland and St. Catherine. Only in Manchester is there an oversupply of places in the secondary high schools. Among the technical and comprehensives, it is only in Clarendon that the technical sector has elbow room.
The secondary sector staffing (1976) comprised 7,580 teachers distributed as follows: 62/
New secondary 3 ,436 secondary high 1 ,694 technical 294 comprehensive 169 independent 1 ,795
It is difficult to state the proportions of trained personnel for all types of schools in the secondary sector since the main data source for 1976 (Table 2-3 of Educational Statistics) is, in the case of the new secondaries, compiled from payroll data which uses criteria other than training levels of classification. In the case of the secondary high schools, the data (Table 2-4) does not separate trained graduates from untrained graduates. An indication of training level is available though, for 1974.
61/ Another unpublished Ministry paper (1977) gives the following figures new secondary - 71, secondary high - 44, comprehensive - 5, technical - 6, vocational trade - 1. The discrepancy cannot be immediately explained.
62/ Source: Table 2-1 of Educational Statistics. Accuracy of these figures is not guaranteed given their difference from other incomplete sources. In particular, figures for newer secondaries and independent schools may be inaccurate.
- 69 _

Table 38. Jamaica. Levels of teacher training in new secondary and secondary high, 197 4
Total Non-Graduates Graduatef
Untrained Trained Interns Untrained Trained Specialist
New Secondary 1,971 9.1 73.4
Secondary High 1,325 7.4 31.5
13.0
40.9
0.7
16.3
2.4
3.2
Technical Education at the secondary level in Jamaica is offered in six technical high schools with a 1976 enrolment of 4,939 students. Three of the four vocational institutions have recently been integrated into new secondary schools by the addition of grades 10 and 11 programmes leaving one institution (Carron Hall) as the only separate institution of its kind.
Jamaica's traininf of teachers is conducted basically in 10 institutions including the U.W.I. The 1975 output of teachers from these 10 was 1,110 teachers. In addition, the College of Arts, Science and Technology trains teachers of technical subjects, while teachers of agriculture pursue courses at the Jamaica School of Agriculture (J.S.A.). The number of teachers in the J.S.A. Agricultural Science Teacher Training Programme stood at 57 in 1975. The College of Arts, Science and Technology is a major institution offering diplomas and certificates in Building, Commerce, English, Institutional Management, Science, Technical Education. The 1975 enrolment of both full and part-time students was 3,547. Four community colleges with a total of 846 students in 1975 complete the formal education available under the aegis of the Ministry of Education in Jamaica.
Trinidad and Tobago
Trinidad and Tobago's expenditure on education in 1976 was TT$270.6 million and representd 13.3% of the country's total expenditure. Given that 75% of this was allocated to salaries, the provision is not as healthy as it at first appears. Since the secondary sector is so large and the new programmes require a high equipment maintenance and replacement cost, the financial allocations per institution approach subsistence levels. The government is however conscious of this shortcoming and in the school year 1977-78, a specific allocation was made for maintenance and supply of the new secondary sector at a substantial higher level than previously.
Primary level
The Government of Trinidad and Tobago is not up to the present formally
- 70 _

involved in pre-primary education. Schoolii.^ is compulsory from the age of 6 until age 14- but children are admitted to puulic (government or assisted) primary schools at age 5 and may remain enrolled until age 15, unless selected for secondary schooling at age 11+.
In 1976, 97.5% of the entire 5-11+ population of 199,120 children was enrolled in public primary schools. Of the 462 schools, the government owned only 113, the remainder being 'assisteddenominational'. Rapid expansion of the secondary sector and a noticeable drop in the birth rate has placed Trinidad and Tobago in the position of having, in gross terms, adequate capacity in its primary schools. Table 39 shows the distribution of school places and enrolment by planning regions.
Table 39. Trinidad and Tobago. Distribution of school places and enrolment by planning regions
Region N° of schools
Capacity Enrolment Surplus/ Deficit of places
Port of Spain £ environs 70 36,592 35,170 1,422 St. George Central 60 31,594 29,694 1,900 St. George East 18 7,987 8,663 -676 North Eastern Counties 40 11,393 9,823 1,570 Caroni 63 25,380 27,165 -1,785 South Eastern Counties 22 7,486 7,336 150 Victoria 98 41,002 42,412 -1,410 St. Patrick 55 24,742 23,005 1,737 Tobago 36 11,043 9,315 1,728
Total 462 196,549 192,583 3,996
It is only in St. George East, Caroni and Victoria that there are regional shortfalls. The overall picture should not be interpreted to mean that overcrowing is marginal. 63/ Indeed, far too many schools are still pressed for space; the
63/ It is important to note that the Trinidad and Tobago Ministry of Education uses a norm of 8 sq. ft. per child. Guyana and Jamaica use a norm of 10 sq. ft. per child.
- 71 _

problem of space redistribution within regions is of greater urgency. The main deficiency of plant at the primary level is the outmoded character of the open-hall partitioned schools which comprise the majority. Large numbers are in urgent need of repair, reconstruction and re-decoration. According to Ministry plans, this undertaking will be a main focus of the 1980's. The overall teacher: pupil ratio in 1976 was 1:30 and the ratio of trained teachers (including headteachers) to pupils was 1:47. Table 40 shows distribution and training of teachers and teacher:pupil ratios by planning regions.
Table 40. Trinidad and Tobago. Distribution and training of teachers
and teacher: pupil ratios
Region No. of No. % Overall Trained Teachers Trained Trained Teacher: Teacher
Pupil to Pupil Ratio Ratio
Port of Spain & environs 1,197 St. George Central 950 St. George East 256 North East Counties 332 Caroni 843 South East Counties 242 Victoria 1,371 St. Patrick 799 Tobago 315
Total 6,305
810 67.6 1:29 1:43 682 71.7 1:31 1:43 167 65.2 1: 34 1:52 218 65.6 1:30 1:45 571 67.7 1:32 1:47 121 50.0 1:30 1:61 922 67.2 1:31 1:46 435 54.4 1:29 1:53 164 52.0 1:30 1:56
090 64.8 1:30 1:47
The South-Eastern counties, St. Patrick and Tobago fall below the norm for distribution of trained teachers. As far as the ratio of pupils to trained teachers can be ascertained, St. George East, South Eastern counties, St. Patrick and Tobago are less well served than the other districts.
- 72 _
Secondary Level
As elsewhere in the region, access to secondary education is by means of a common entrance examination taken at age 11+. In 1976-77, 17,765 children entered secondary schools on the basis of this examination. This figure represented 62% of the eligible age cohort. 64/ At that time, total registration in public secondary schools was 75,878. Some indication of the size of the secondary registration is afforded by reference to 1975-76 school year -approximately 55% of the 12-14 age group, and 31% of the 15-16 age group were enrolled in* public secondary schools.
The 77 Dublic secondaries fall into several types on the basis of the programmes offered. Twenty junior secondaries established between 1972 and 1977 offer the comprehensive programme which has been designated the national model for the first 2 years of secondary education. Nine Senior Comprehensives offer the national model follow-up five year programme which includes academic, pre-technician and specialized craft. Three Senior Secondaries offer a two year academic an pretechnician programme but not specialized craft. The latter were established at a time when government policy envisaged the development of separate vocational schools. One Composite school offers both the three year junior secondary and the two year senior secondary programme.
The remaining 44 schools offer conventional academic programmes for 5 years to the '0' level examination and in some cases a 7 year programme to 'A! level examination. Sixth form registration in 1975-76 was 2,479 which is 4,9% of the 17-18 age group of 50,530. 65/ Table 41 shows the regional distribution of secondary school places.
Provision is made for the registration of private schools but statistical returns from amy of these schools are frequently not submitted and often unreliable. The Ministry of Education estimates'that in 1976/77, 16,642 children were registered in 79 such schools.
64/ No contemporary data on socio-economic bias on selection for secondary schooling is available. Cross and Schwartzbaum (1969) ascertained a selectivity index of 3.0 for children of professional and entrepreneurial fathers but at the time access to secondary schools was so much more restricted that the figure is more than likely inapplicable to the present situation.
65/ Age group comparisons are only rough indicators since the 6th Form population included 226 children under 17 and 471 nineteen year olds.
- 73 _

Table 41. Trinidad and Tobago. Regional distribution of secondary school places, October 1977
Regions School Type
Junior Senior ' Senior Secondary Comprehensive Secondary
Composite All Age Sec.
Port of Spain S environs 7,680 St. George Central 9,600 St. George East North Eastern Counties 1,440 Caroni 3,840 South Eastern Counties Victoria 9,120 St. Patrick 5,760 Tobago
Total 37,440
1,564 3,128 1,564
1,564
3,128 3,128
14,076
1,400
608
760
962
3,122
3 O r+ 0) < PJ H> H (H tr H <n
608
Students who complete junior secondary education are placed in senior secondary schools on the basis of a 14 examination. In 1976/66, 9,413 students wrote the examination and were all placed. Those students who remained in the post-primary section of the primary schools may write a primary school leaving certificate examination. In 1975-76, of 17,015 children writing that examination, 4,985 (19.2%) were awarded certificates.
Available information on levels of training of teachers in secondary schools is considerably dated. However, information is available on the educational levels of these teachers. Table 42 shows the proportions of graduates to non-graduates in the secondary sector in 1977.
The difference in ratio of graduates to non-graduates between the Junior Secondary schools and other secondary schools supports the observations made earlier on the inequality of provisions for Junior Secondary Schools.
- 74 _

Table 42. Graduate and non-graduates proportions secondary schools. Trinidad and Tobago 1977
School Type Total %
Graduate %
Non-Graduate
Junior Secondary 1,110 16.6 83.4 All age Secondary (Government) 910 60.9 39.1 All age Secondary (Asst) 786 68.8 31.2 Senior Comprehensive 420 63.7 36.3 Composite 25 16.0 84.0
Total 3,241 52.2 47.8
Source: Figures provided by Ministry of Education and Culture, Planning Unit.
Technical and Vocational
The provisions for technical and vocational education in Trinidad and Tobago are surprisingly low when one considers that even before 1974, the country had a substantial industrial sector in petroleum and manufacturing. There are only two technical institutes in the country - the John Donaldson Technical Institute in Port of Spain and the San Fernando Technical Institute. Since the last published educational statistics for the country date from 1971/72, details of registrations cannot be provided here. The institutions offer 2 year full-time day programmes, 3 year part-time programmes, day release and short term courses leading to the National Technician Diploma and the National Craft Certificate. For craft courses, minimum entry requirement is the Primary School Leaving Certificate or equivalent (variously determined). Technicians' programmes require 'o' level Mathematics, English and a science subject, appropriate to the intended course of study, or a National Craft Certificate.
Courses offered within these institutions include Business Education and Management, Distributive Education and Management, Graphic and Applied Arts, Home Economics, Electrical Engineering, Mechanical and Building Engineering. In 1975, full-time attendance was 568 and part-time attendance 959. At the San Fernando institute, full-time registration was 414 and part-time 741. In addition, 1,078 apprentices were attached to establishments operating schemes leading to national certification.
The Point Fortin Vocational Centre prepares students for craft level certification only and had a total registration in 1975 of 350 part-time and
- 75 _

10"+ full-time students. Five youth camps and six trade centres complete the public provision for this sector. Students 'graduating' from youth camps numbered 875 in 1975 and from trade centres, 751 in the same year. The trade centres and youth camps prepare students for the Craftsman's Assistant Certificate.
This area of education has been the subject of a very recent report 66/ which will presumably be the basis for policy elaboration at some future date. The recommendations of the report have organizational and regulatory implications but hardly scratch the surface in an assessment of needs in the country. It seems likely that the government will continue to rely on the secondary comprehensive schools for technical skills and pre-training. It is doubtful whether this policy will bear fruit given the marginal provision for preparation of teachers of technical subjects at this level.
The Eastern Caribbean Institute of Agriculture and Forestry provides two year programmes for the trining of agricultural officers and forestry officers drawn from Trinidad and Tobago and the Eastern Caribbean.
Teacher education for the primary sector in Trinidad and Tobago is currently conducted at five colleges with an annual output of about 630 teachers of which one college produces 330. The government's intention is to reduce the number of training centres to two large establishments within the next two years.
The major current preoccupation of the Government of Trinidad and Tobago is the industrialization of the economy. Since the oil crisis and the discovery of large petroleum and natural gas resources in the exploitable territorial waters of the country, there has been a shift in focus of the government's perception of the future and consequently, in its plans for the education system. The change of perspectives is stated in the submissions by the Prime Minister to the Cabinet of the government as follows:
"The original Education Plan formulated some ten years ago and agreed to some two years after, was designed on the basis of a small relatively poor developing country to provide a reasonably good education, for as many of its citizens, but within very limited resources. It was also formulated on the basis that Trinidad and Tobago has embarked on an industrial development programme which was neither dramatic nor revolutionary. This programme envisaged a slow evolution to light manufacture but without any plan for heavy industrial development particularly in the fields of petrochemicals and metallurgy. In fact, the Plan coincided with severe recession in the oil industry of the day even with its limited scope (the desertion of BP). This situation has completely changed. Trinidad and Tobago is now on the threshold of achieving its critical mass in the field of high level technology and large-scale industrial development. Any educational plan must recognize this with urgency." 67/
66/ Government of Trinidad and Tobago: Report of Working Party on Craft Training and National Apprenticeship Scheme, Port of Spain, 1976.
67/ 'Prime Minister's proposals to Cabinet on education' 18th September 1975 - Government Printery, 1975, p.8.
- 76 -

The Draft Plan for Educational Development 1968-1983 envisaged a norm of 2 years of secondary education with a 37% through-flow of pupils ti the senior secondary school system. It also envisaged the development of technical and vocational schools, as separate institutions to cater for 12% of the output of the junior secondary schools. The proposals of 1975 shift the norm for post-primary education to 5 years, retaining the junior secondary school programme for the first three years. It formally rejects the original idea of technical and vocational training conducted in separate institutions and instead proposes an "integrated comprehensive programme embracing the traditional academic, pre-technician, commercial, general industrial and limited specialized craft training, utilizing common facilities and with common management" as the national model for 14+ education. The proposals speak of assigning a proper priority to technology within the education system and express the view that isolation of vocational education from the traditional academic programme has the "serious dangers" (p.6) of
(a) allowing the vocational sector to become a repository for droputs from the junior and senior secondary areas;
(b) fostering social fragmentation;
(c) being difficult to staff;
(d) having high per capita costs.
In order to develop plans for this mid-course adjustment in policy, the government appointed two separate working parties whose reports 68/ will probably provide the guidelines for the policy elaboration. It should be noted that the decision to extend the norm for secondary schooling from 3 years to 5 years comes at a time when the secondary intake from primary school is in the vicinity of 17,500 or 60% of the children sitting the Common Entrance Examination. In other words, full provisons for the age cohort have not yet been effected. Plans exist for the construction of 5 more senior comprehensives, 5 junior secondaries and 4 composite schools.
The decision to extend the norm of secondary education to 5 years is one which many more of the region's governments would like to able to make. It is clear that the Trinidad government can afford the capital outlay. The problem which the expansion poses is the problem of teacher supply and of curriculum development.
The Government of Trinidad and Tobago has been singularly slow in developing its capability for the training of teachers of technical and vocational subjects. Although the development of this component of the •education programme was envisaged within the Junior Secondary framework since 1968, it is only in 1977 that extension to the John Donaldson Technical Institute has been undertaken to provide a wing for training teachers of
68/ Government of Trinidad and Tobago: Report of Working Party on Education. Port of Spain, 1976, 148 p. Government of Trinidad and Tobago: Report of Working Party on Craft Training and National Apprenticeship Scheme, Port of Spain, 1976, 98 p.
- 77 _

technical subjects. This inverse planning procedure and the small output envisaged for the programme augur badly for the effective expansion of technical and vocational teaching required by the new focus on technology at both the junior and senior secondary levels.
A less obvious point related to this expansion is that it will require a major revision of curriculum materials and teachingprocedures in all areas of education, not simply the areas of the new focus. Expansion of the numbers of students who are moved from the primary to the junior secondary, and thence to the senior secondary, increases the range of aptitudes with which the receiver system must cope and decreases the number of valid assumptions about levels of attainment that can be made. This circumstance demands a high level of attention to the development of flexible teaching modules and methods for the curriculum in these schools. There is no evidence that this consideration has entered the planning processes of the Government. Unlike the Ministries of Guyana. Jamaica and Barbados, the Ministry of Education and Culture of Trinidad and Tobago continues to function without a formally constituted curriculum and materials development unit. This error presages large scale failure of the expansion effort in anything other than quantitative terms.In addition, the rate of training of teachers has not been accelerated sufficiently to cope with the expansion process envisaged.
The shift of emphasis to industrial technology as the future area of development of the economy seems to have ignored the important consideration that despite the size of its input to the economy, the petroleum sector is not a high labour employer. Furthermore, each of the industrial ventures envisaged is high in technological demand but low in labour requirement. Some re-valuation of emphasis seems to be required if the education system is to achieve more than a shift in the qualifcations of the unemployed and unemployable. The danger inherent in the development of the Trinidad and Tobago system is that it risks becoming a national training programme rather than a national education system.
These observations and the newness of the technological push should not be allowed to over-shadow the rapid expansion and the qualitative reorientation of the secondary system which has taken place since the early sixties in Trinidad and Tobago. Up to 1972. the only secondary education available within the public sector (i.e. government and assisted secondary schools) was strictly academic in its offering. Where other subjects were included, they were either not examined or had low subscription as examination subjects. The first attempt to re-orient the system came in 1961 when the government began a programme of school construction with the intention that the new schools would operate as three year comprehensives. However, the intention was not fulfilled, because public pressure favoured conformity of the new schools to the existing academic pattern. The new secondaries therefore became five year institutions leading to the Ordinary level examination. The comprehensive pattern was eventually established in 1972, with the initiation of the Junior Secondary programme. This programme has been victim of the problems mentioned earlier but despite this, stabilization of the pattern seems to be desirable within the goals stated by the government.
The Government has mooted very recently the notion of community based
- 78 _

schools. 69/ The expression is too recent and unelaborated at this juncture to permit further comment.
Windwards and Leewards
The education systems of the Windward and Leeward Islands have all the problems of the rest of the region. Inadequate plant and low levels of teacher education and training are exaggerated by the reduced possibility for rapid improvement within their tiny economies. Almost all their activity in activity in education, as in other areas of governmental responsibility, is at the subsistence level of survival. Re-orientation of the educations systems faces two major problems: firstly, unclear postures on directions of development and secondly, the herculean task of operating a system with small numbers of trained personnel.
Already, the levels of expenditures on the education in many of the states are high in relation to total expenditure (e.g. St. Vincent - 22%, Montserrat - 36%, St. Lucia 20%). Yet, most of this expenditure is tied up in personal emoluments. Very little can be spent on materials, buildings or programmes. Almost all of the much needed capital requirement for new construction or improvements to buildings has to come from grants-in-aid. Increase of the proportions of trained teachers implies increases in recurrent expenditure without any provision for better personnel to function in better teaching conditions.
It seems clear that regional pressures to expand secondary education have had their effect in these states. Furthermore, the pressure to shift to comprehensive style secondary education has begun to characterize their efforts. There is little doubt that they need this type of shift but the question must be put - will this shift have the same effect of neglect of the primary sector as it has already had in the larger economies? Neglect of systems which are already so far below an acceptable standard would be a disaster as much because it is the only level of education which a majority of the citizens can hope to have, as because it predicts failure for any secondary super-structure placed on it.
The curriculum in the smaller states is as much in need of review as anywhere else. In the absence of implementable developmental plans which the governments can really control, it is very difficult to determine useful directions. The obvious area in which one can suggest a developmental thrust is in agriculture. This is, however, sufficiently unfashionable and negatively valued an area that decision-making can be easily imperilled by political consequences. It would be folly, however, for these countries not to attempt a significant re-development of this sector with a concomitant re-direction of their education systems since there is no other natural resource which might bail them out of their predicaments. Indeed, all of the governments are conscious of the need to develop agriculture. St. Lucia is particularly articulate on this point. Yet, there is little indication that the formation of teachers of agriculture is being seriously envisaged within the established teachers' colleges. A recent statistical survey of Teachers' Colleges
69/ Address by the Minister of Education and Culture to the Teacher's Section-of the Public Service Association, 21st.May 1977.
- 79 _

undertaken by the School of Education 70/ shows no provision for Agriculture in the programmes of the Teachers' Colleges of Dominica, Antigua, St. Kitts or St. Lucia. In Grenada, Agriculture has the same time allocation in the first year programme as Health Education/Nutrition, Religious Education, Reading, Drama, Micro-teaching and student council activities, (i.e. one 4-0-minute period per week). In the second year, it is optional with the same time provisions. In the St. Vincent first year programme, it has a more promising time provision, the same allocation (200 minutes per week) as English/English Literature (Secondary), Health Education/Nutrition, Industrial Arts, and Physical Education. In the second year, it is optional but with an 80-minute allocation per week. The implications of the above are clear. Agriculture has not been integrated into the consciousness of the educational establishment sufficiently deeply to be reflected in the training patterns of teachers or into the normal school exposure of children.
Regardless of what developmental directions evolve in the future, the problem of teacher supply needs to be solved. The establishment of the individual island colleges is recent and will doubtless go some distance towards improving the statistical statement on levels of teacher training. The educational levels of the teachers though, will still require considerable attention. Yet improvement of the system will still lag if the only input is higher proportions of trained teachers. Loss of teaching personnel to migration or to other levels of the service is a serious difficulty. In all of the states of the region, the monolithic structure of the education sector makes the nature of progress into a movement from teacher to principal to education officer (ministry based) a standard procedure. Promotion in education means that one stops teaching with further loss from the school system of trained personnel. This practice of promotion and salary classification needs careful review. There is no reason why the professional distinction between the curriculum officer, the administrative officer and the teacher should not be recognized to the extent of treating them as separate careers, all with related goals, but each with its own promotional possibilities.
70/ Some statistics relating to Teachers' College Organization in the Eastern Caribbean 1976-77. School of Education, U.W.I. Cave Hill, April 1977.
- 80 _

V. THE UNIVERSITIES
The University of the West Indies and the University of Guyana provide the region with study, training and research facilities at the tertiary level. Beginning in 1948 as a college of the University of London with a single campus in Jamaica, the U.W.I, became an autonomous institution in 1962. It now operates out of three campuses, the original Mona campus in Jamaica, St. Augustine in Trinidad and Cave Hill in Barbados. In each of the English-speaking states, the U.W.I. Department of Extra-Mural Studies maintains a presence by means of a resident tutor and a university centre. Guyana was formerly a contributory territory to the U.W.I, but withdrew and founded its own university in 1963.
The University of the West Indies is the victim of several problems related to interaction between the nature of its structure, the method of its control and funding, the financial resources of the region and the politics of the region. First of all, there is no denying that it began as an elitist institution. It therefore faces the internal problem of transition to a more functional and service-oriented institution. The transition is clearly well in process. Secondly, it is funded through the University Grants Committee by the several governments of the region, only three of whom attempt to meet readily their financial obligations and only one of which can clearly afford the growing expense. Each of the goverments which has a campus in its country (i.e. Barbados, Jamaica and Trinidad and Tobago) is reluctant to invest money in developments which fall outside its country or which do not appear to be immediately beneficial to its needs. Consequently, financial decisions become political power plays.
A third factor affecting the institution is that, depending on the warmth or coolness of relationships between the three governments mentioned, and specially the latter two, the integrity of the institution as a regional institu-tion waxes or wanes. Governmental attitudes toward the institution and its regional nature also vary depending on the extent to which faculty or students of the institution are perceived as political threats to the ruling parties.
To these must be added a fourth consideration. The three campus structure of the institution has become too unwieldy for a central administrative framework. Yet, there is ambivalence within the University about decentralization, lest the political factors mentioned above result in the absorption of each campus by the government of the country in which it is located. The above conspire to reduce the rate of expansion and efficiency of the institution and its ability to effect even more fundamental change than it has achieved within the society which it serves.
These several factors climax in the most recent threat to the U.W.I, as a regional institution in the form of a White Paper 71/, published by the Government
71/ Government of Trinidad and Tobago: White Paper on National Institute of Higher Education (Research, Science and Technology), Government Printery, Trinidad, 1977. 39
- 81 _

of Trinidad and Tobago in 1977. The document suggests a number of modifications in the structure and control of the U.W.I., which would have the effect of decentralizing it and increasing the autonomy of the component campuses. It would also impose greater financial responsibility on the governments of Jamaica, Barbados and Trinidad and Tobago for the campuses within their states. In themselves, the proposals appear to be most desirable with the exception of certain details which need not be discussed here. However, they are largely similar to proposals made from within the University but ignored by the governments at an earlier date. Their modified re-appearance under the authorship of the Trinidad and Tobago government at a time when that government's relationships with other Caribbean governments are extremely poor and well nigh unto cold, leaves some doubt about the motivation of the proposals.
The 1976/1977 registration of students at U.W.I, totalled 7 453 at all three campuses - 1 105 at Cave Hill, 4 038 at Mona and 2 310 at St. Augustine. The eight existing faculties are Agriculture, Arts and General Studies, Education, Engineering, Law, Medicine, Natural Sciences and Social Sciences. Table 43 shows the registration of under-graduate students for full-time degrees by campus and faculty.
Table 43. Under-graduate student registration, full-time degrees,1976-1977
Faculty Cave Hill
Campus Mona St. Augustine Total
Agriculture _ _ 270 270 Arts and General Studies 250 660 475 ls385 Education - 56 - 56 Engineering - - 441 441 Law 240 31 26 297 Medicine ( n v i a _ n 1 i'ri \ ¿•A. V, ^-^XiJ •îonl a+* M/~\-r\ T» /-*•»«» 1 tr -1. N—«-4. W U I JW11U /nl -r-. -,*/-. -i 1 C C 7
yj >J t
in other campus countries as well) Natural Science 237 937 336 1,540 Social Science 49 426 244 719
Total 776 2,667 1 ,772 5,215
Source: Statistical information $>n U.W.I, provided by Student Affairs section of U.W.I, administration, St. Augustine.
The only faculty having a lower under-graduate registration than Agriculture is Education. Lest this observation be misleading, it is necessary to add to both faculties the registration for certificates, diplomas, and higher degrees, particularly because most of the work of the School of Education is at the diploma
- 82 _
and certificate level. .There were 35 full-time and 37 part-time higher degree students in Agriculture giving a total agriculture registration of 342 students or 4.6% of the total University registration. Similar inclusion of higher degrees, certificates and diplomas in Education increases the total faculty registration to 425 or 5.7% of the total student registration. When compared with the registration in Arts and Natural Sciences the figures in Education and Agriculture look rather dismal.
Within recent years there has been a clearly increasing demand among applicants for entry to the university for admission to the Faculty of Agriculture. The continued overly modest registrations (when one considers the base of the region's economy) relates quite clearly to inadequacy of governmental response to requests for provision of increased facilities and funding of that Faculty. It must be recognized too, that the growth in interest in the subject is relatively recent and was unlikely to have been foreseen early enough by governments that provision could have been made for expansion on a basis more appropriate to the needs of the agricultural sector.
The case of Education is somewhat different. It is only recently that thé region's governments have understood that graduate teachers need professional training as prerequisites to their proper functioning. Up to 1973, only a very small number of graduates were trained in Education at the Mona campus. Graduates of the Arts and Natural Sciences Faculties were absorbed into the region's teaching services without further training as graduate teachers. Since that date however, the governments of Jamaica, Barbados, and Trinidad and Tobago have funded programmes for the in-service training of their graduate personnel. At the present time, plans are under discussion for the inclusion of Education as a component of first degrees in the Arts and Natural Sciences Faculties.
The Faculty of Engineering, with a total registration at all levels of 464 students in 1976/1977, has become the focus of financial attention of the Government of Trinidad and Tobago which sees its destiny in industry as discussed earlier. The rate of future development of this faculty is likely to outstrip that of all others at the St. Augustine campus. Medicine has also attracted attention from the same government and there are plans for the development of a
• teaching hospital in Trinidad and Tobago and a consequent expansion of the activities of the Faculty of Medicine.
One of the most sadly neglected areas of the institution's potential is the area of adult education in territories not served by a campus. Part of the reason for this is the maintenance of the inappropriate tradition that university activity requires a campus base. The other part, and by far the most influential, is the unavailability of funding within the countries that can benefit most from non-campus public and adult education and the reluctance of those countries which are better placed financially to spend money outside their territorial boundaries.
! The most importantinput which the U.W.I, makes on a continuing basis to education in non-campus territories is its service to teachers' colleges in the Eastern Caribbean. These colleges are supported in their efforts by university staff participation in their teacher training and teacher assessment exercises. In Jamaica, there is also a formal relationship between the School of Education and the Teachers' Colleges through the Joint Board of Teacher Training. No similar formal arrangement exists in Trinidad and Tobago although staff of the
- 83 _

St. Augustine campus, as individuals, are involved in similar excercises.
Unlike the U.W.I., the University of Guyana does not depend on several governments. The institution is funded by the Government of Guyana which appears to exercise more direct control over its management than the other governments appear to do in the case of U.W.I. The institution has five faculties - Arts, Social Sciences, Natural Sciences, Education and Technology. In 1975, the most recent year for which figures are available, the distribution of students was as shown in Table 44.
Table 44. University of Guyana: distribution of students by faculty, 1975
•Faculty Students Percentage
Arts 355 20.2 Social Sciences 534 30,5 Natural Sciences 285 16.3 Education 138 7.9 Technology 254 14,5 Special students 186 10.6
Total 1, 752
Source : Planning Unit, Ministry of Education and Social Development: A digest of educational statistics 1974-75, Georgetown 1976.
It is worth noting that between 1966 and 1975, of the 1 557 students graduating from the University of Guyana, 51.2% had been in degree courses and the remainder in certificate and diploma courses. The registration pattern that this reflects is in sharp contrast to that of U.W.I, where degree registrations accounted for 78% of students. The University of Guyana has adopted a very direct approach to the need for developing cadres of personnel who fit closely defined needs within the Guyanese society. Consequently, their certificate and diploma programmes have been given greater priority than at U.W.I. The two institutions appear to be attempting to achieve different goals but the question is legitimate whether U.W.I, ought not to be attempting to achieve similar goals in the specific design of shorter courses to meet closely delimited developmental needs.
- 84 _

VI. LANGUAGE AND DEVELOPMENT
Language and Development Problems
One of the most serious inhibitors to development within the Caribbean region is wastage of human resources that can beattributed unequivocally to problems of language, communication and language policies. Reference to the states discussed in this study as 'English-speaking' is a convenient inexactitude which excuses itself simply because English is the official language of the states. The fact of the matter is that English is, in this region, a superimposed language which is not spoken natively by a vast majority of the populations. The most easily recognizable examples are the cases of St. Lucia and Dominica. In both these countries, there exist varieties of Creole referred to by linguists as 'French lexicon Creoles' and by their speakers as 'patois'. Census estimates of numbers of speakers are outdated but nevertheless worth citing. In 1946, 24,9% of Dominica's population and 43.4% of St. Lucia's were exclusive speakers of French lexicon Creole. In addition, 68.3% of Dominica's population and 54% of St. Lucia's were listed as bilingual. This means that at that time, English monolinguals in St. Lucia amounted to only 2.6% and in Dominica to 6.8%. Carrington (1967) offered an impressionistic assessment that monolingual Creole speakers had decreased significantly with a compensatory increase in bilinguals.
Although apparently less forbidding, the case of Trinidad is important. Carrington, Borely and Knight (1974) reported on the extent to which pupils aged 5 to 11 years were exposed to languages other than English. Exposure covered use of other languages by the children, being addressed in other languages within their households, or hearing other languages used within their households. In that study, 46.4% of the sample of children were exposed to Bhojpuri, an Indie language of the Bihar, brought from India with indentured labourers in the late 19th century and early 20th century. French Creole is also part of the language complex of Trinidad but with less influence on the school population than Bhojpuri.
Given that in Guyana 52% of the population are of Indian descent and of the same historical provenience as the Indian population of Trinidad it is reasonable to suppose similarly high importance of Indie languages. In addition to this, Guyana retains small numbers of native speakers of at least 9 indigenous pre-Columban languages.
With the exception of the special cases of St. Lucia and Dominica, residents of all the region use as their major daily language of communication different varieties of English lexicon Creole and creolized dialects having historical evolutions similar to that of the French lexicon Creoles. The co-existence of those speech varieties with English over several centuries has resulted in a complicating factor - the Creoles impressionistically and technically are not easily separable from English. Sets of overlapping quasi-dialects provide a link between English on the one hand and what may be described as basic Creole. The existence of this post Creole dialect continuum contributes to the persistence of strongly negative attitudes toward the Creoles in the region.
- 85 _

Attitudes toward Creoles
The regional Creole languages are considered by most of the population to be 'inferior, badly spoken, ungrammatical, unwritable' versions of the standard languages to which their vocabularies are historically related. Their low prestige aeises from their genesis in the European colonial expansion, the slave trade and the plantation society as well as from the long years of prejudices against black peoples and their cultures within the region. The proposition of ungrammaticallity is given credence by the absence of popularly accessible descriptions of the grammars of these languages and by the historical accidents which prevented the evolution of a recognized standard variety of Creole.
Within the framework of the education systems it is not until the 1970's that any official language syllabuses have discussed the existence of Creoles and their educational implications with any degree of enlightenment. Prior to this the languages have been variously proscribed, ignored or rejected as nuisances causing persistent errors in English which have to be eradicated by punishment and drastic language drills in English grammar (most of which have doubtful practical value).
Consequent upon the above, children who enter school with no language other than their Creole vernaculars undergo severe psychological trauma from the institutional rejection of their language and, by inference, their thought. The inappropriateness of the methods used for teaching English has for years ensured that a majority of the school population (and ultimately the entire population) achieves less than workable proficiency in English. This automatically affects the extent to which any knowledge presented in that language can be assimilated. Within the regiqn's classrooms then, conflict between the children's language and the official language is continuous. The effectiveness of all teaching is reduced by the lack of validity of the language teaching procedures and the absence of a clearly articulated policy on language supported by appropriately developed . curriculum materials.
The Effects of Language Conflict
The economic loss of stunting the growth of skills within the society by excision of vernacular languages from public education systems as accepted languages of instruction or as powerful conditioning factors of language teaching and general educat ion is immeasurably great 72/. Low competence in the use of the
72/ There has been no research which has directly measured the loss.However,some indication of likely man (and brain) power loss can be gained from the following extract from The Education Thrust of the 70's /fhich shows differences in scores of Jamaican students at three levels of examinations in mental .ability, language and mathematics: "The mental ability of the students is not matched by their basic educational attainments in language and mathematics. For the nine years of education for pupils of 6-15 years old the point is best illustrated by results in three critical selection (or rejection) examinations.The following are the percentage passes at over 40% of the marks in each case: Examination Mental Ability Language Mathematics Common Entrance, 11+ 71 15. 5 24 Technical High, 13+ 71 11.0 11 Grade Nine, 15+ 80.6 29.6 21.4 (page 4, op.cit. ). Jamaica is by no means unique in this disparity of scores.
- 86 _

official language resulting from these considerations reduces the rate at which the countries of the region can generate the professional and managerial level personnel needed for their development.Quite apart from this direct diminution of manpower evolution, the psychological damage in inhibiting the growth of articulate public expressiveness in the official language reduces the capacity of the societies to generate new ideas appropriate to their needs. Instead there is persistent boirrowing of 'solutions' to problems with the language/culture in which these 'solutions' have been conceived. The region hence remains an importer not only of materials but of ideas.
Policy development
The Ministries of Education in Guyana, Jamaica and Trinidad and Tobago have begun to come to terms with these problems. In the case of Jamaica, the ministry's position is summarized in the preamble to the English syllabus for grades 7-9:
"English is the official language of Jamaica. Nearly all our children learn to speak Jamaican Creole, which has taken nearly all its vocabulary from English but much of its syntax from other sources; but in order to play a productive role in modern Jamaican society, they must be able to communicate effectively and accurately in English. We must strive to make Jamaican children highly competent in the Language most widely spoken in the world, while teaching them to appreciate the local Creole."
The Hamaican ministry has been actively engaging in the preparation and testing of language teaching materials that are based upon a clear appreciation of the linguistic facts of the co-existence of English and Creole. These efforts are conducted in close collaboration with the School of Education at the U.W.I. Mona campus.
This type of collaboration is not present in the case of Trinidad and Tobago for very special political reasons. Equally non-existent are any efforts within the Ministry,or sponsored by them, to develop appropriate curriculum materials in English language. These absences effectively vitiate the promise of improved approaches contained in that ministry's 1975 publication of a new syllabus for primary schools.
In the case of Guyana, the Ministry of Education through its curriculum development unit is actively producing experimental language teaching materials which, like those of Jamaica, show enlightened modern approaches. Nowhere else in the region is there any formal commitment to evolving rational language teaching procedures although a sizeable literature has been generated by the regional Universities on the need for such procedures and on the techniques for achieving them. There is an urgent need for active consideration in all of the region's countries of language policies that would improve the effectiveness of public education and popular participation in developmental movement. These policies must also achieve revaluation of the vernaculars to the point of achieving confidence of the people in the validity of their thought and expression.
- 87 -


V I I . OVERVIEW
Within the limitations mentioned in the introductory remarks, this study has presented a summary description of the economic condition of the English-speaking Caribbean region and a documentation of the major provisions for formal education in terms of plant, personnel and system operation. Critical observations have been made on various aspects of the education systems. But these observations only partially examine education and development in the region. One has to probe much deeper to recognize the nature of the real, the potential and the desirable relationship between education and development.
Over the past fifteen to twenty years, the main concerns throughout the region have been quantitative expansion of the provisions for education - school buildings, numbers of persons employed as teachers and numbers of certificate holders among school leavers. Insofar as this has been a goal, the region has not been static. Every country has improved its ability to school its citizens and if one were examining achievement, the movement could be termed successful, in some cases highly successful. This thrust has been' necessary for several reasons. Firstly, ana very importantly, it has served to increase the proportion of citizens who are literate. Secondly, it has fulfilled and is fulfilling the socio-historically based desire of the mass of the population for its children to benefit from exposure to what was formerly only offered to the upper classes of the society. Thirdly, it has provided the indispensable cadres of functionaries for the region's governments and other institutions. The importance of this cannot be denied. However, all of this has been undertaken in most countries (in all, until recently) by reference to a past rather than to a future.
Let us take the case of expansion of secondary education. The political motivation for this expansion derives from a consciousness within the society of injustice in the colonial reservation of secondary education for the privileged classes. The first effect (and perhaps intention) of an expansion on this basis is the creation of a new class of privileged nationals. Since it is generated by a desire to remedy social injustice, the expansion process cannot stop at class replacement or class creation;it must continue logically to expand towards apparent equality of opportunity. All that this can achieve is exposure, ultimately, of all citizens to an education that can be demonstrated to be irrelevant to many of their personal needs and those of their society.
It is imperative then, that system expansion have some reference point other than simple social fairness. A philosophy of national development seems to offer such a reference point. Unfortunately, what exists in most of the Caribbean countries are development plans not philosophies of development. The latter are only very recently beginning to become evident.
development plans within the region have to a great extent involved attempts at industrialization using foreign capital and imported technology in the hope or with the intention that these investments would stimulate economic growth. When such growth begins to take place, the previously mentioned desire to replace the foreigner propels the education system into a new type of expansion. Demands for a specific type of skill within the labour market invite the government to provide training for that area - a training which becomes appended to the educational
- 89 -
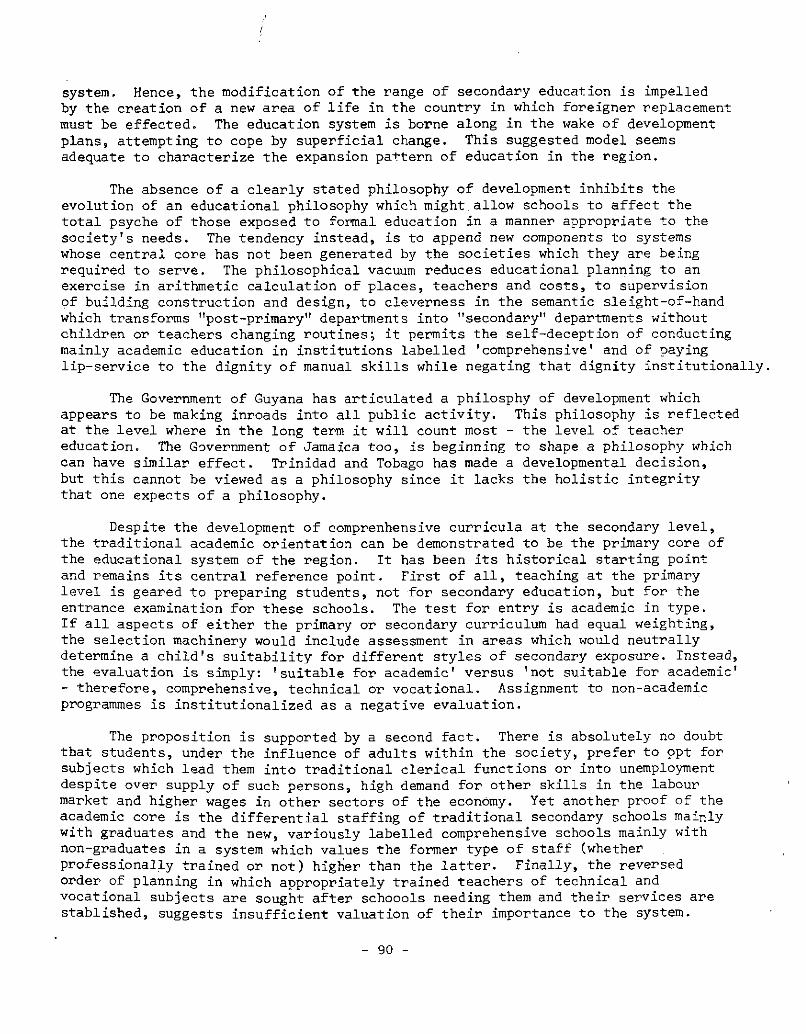
system. Hence, the modification of the range of secondary education is impelled by the creation of a new area of life in the country in which foreigner replacement must be effected. The education system is borne along in the wake of development plans, attempting to cope by superficial change. This suggested model seems adequate to characterize the expansion pattern of education in the region.
The absence of a clearly stated philosophy of development inhibits the evolution of an educational philosophy which might allow schools to affect the total psyche of those exposed to formal education in a manner appropriate to the society's needs. The tendency instead, is to append new components to systems whose central core has not been generated by the societies which they are being required to serve. The philosophical vacuum reduces educational planning to an exercise in arithmetic calculation of places, teachers and costs, to supervision of building construction and design, to cleverness in the semantic sleight-of-hand which transforms "post-primary" departments into "secondary" departments without children or teachers changing routines; it permits the self-deception of conducting mainly academic education in institutions labelled 'comprehensive' and of paying lip-service to the dignity of manual skills while negating that dignity institutionally.
The Government of Guyana has articulated a philosphy of development which appears to be making inroads into all public activity. This philosophy is reflected at the level where in the long term it will count most - the level of teacher education. The Government of Jamaica too, is beginning to shape a philosophy which can have similar effect. Trinidad and Tobago has made a developmental decision, but this cannot be viewed as a philosophy since it lacks the holistic integrity that one expects of a philosophy.
Despite the development of comprenhensive curricula at the secondary level, the traditional academic orientation can be demonstrated to be the primary core of the educational system of the region. It has been its historical starting point and remains its central reference point. First of all, teaching at the primary level is geared to preparing students, not for secondary education, but for the entrance examination for these schools. The test for entry is academic in type. If all aspects of either the primary or secondary curriculum had equal weighting, the selection machinery would include assessment in areas which would neutrally determine a child's suitability for different styles of secondary exposure. Instead, the evaluation is simply: 'suitable for academic' versus 'not suitable for academic' - therefore, comprehensive, technical or vocational. Assignment to non-academic programmes is institutionalized as a negative evaluation.
The proposition is supported by a second fact. There is absolutely no doubt that students, under the influence of adults within the society, prefer to opt for subjects which lead them into traditional clerical functions or into unemployment despite over supply of such persons, high demand for other skills in the labour market and higher wages in other sectors of the economy. Yet another proof of the academic core is the differential staffing of traditional secondary schools mainly with graduates and the new, variously labelled comprehensive schools mainly with non-graduates in a system which values the former type of staff (whether professionally trained or not) higher than the latter. Finally, the reversed order of planning in which appropriately trained teachers of technical and vocational subjects are sought after schoools needing them and their services are stablished, suggests insufficient valuation of their importance to the system.
- 90 -

The reference points of the school sj stem have been as foreign as the system itself. This is understandable, but what is less readily explained is that this 4iould have lasted so long. The recent establishment of the Caribbean Examinations Council (1973) is the first step towards breaking the foreign reference points. If the Council resists the push to become a Caribben based replica of Cambridge or London examining authorities, the direction of curriculum movement at all levels in the schools system can be substantially influenced.
The influence may lie not only in the nature of the syllabuses for which the examining authority will cater, but in the very fact of the authority being regionally based. That symbol of regional sef-assessment should invite some transformation of the region's perception of what criteria the education system should attempt to fulfil.
The place of agriculture in education in the region is out of keeping with its role in the economy of the region. Its function as a major sector in the generation of the gross domestic product of all the countries (except Trinidad and Tobago), its importance in earning foreign exchange and further in employing a large percentage of the labour force appears to be uninfluential in determining its place in education. These remarks do not exclude Trinidad and Tobago despite its lower dependence on this sector in its external trade, for agriculture still provides a large employment base in that economy. Furthermore, the size of the food import bill in the region suggests that much of the capital that might be invested in socially desirable enterprises is flowing outwards without hope of recovery. If these outflows are to be reduced, greater attention will have to be paid to self-sufficiency in food either by diversified production or by change of palate or both. Without question then, the educational sector has to be re-directed to focus on the obvious need for development of the agricultural sector. Indeed, it is not simply a question of sectoral development, it is a matter of mental readjustment of the population's relationship with its environment.
All the new curricula include agriculture as part of the secondary programmes. There is also inclusion at the primary level. Shortage of staff and inadequacy of training levels have already been recognized here. So too has the effort to change that shortcoming. In addition to the provision of staff and facilities for agriculture within the framework of school, what seems to be needed is a publicly understood ethic relating to agriculture within the society. That ethic must derive from the philosophy of development. Without it, Agriculture will become another subject to be failed or passed and forgotten at the end of the experience.
The above proposition recognizes fully that the history of the region as a plantation economy is an important hindrance to the evolution of workable policies on agricultural education. Bus the history will always be there and cannot be changed. This leads to a further prerequisite of greater fit between education and development. The region needs to attempt major education of the public on the nature of education. A revision of consciousness has to be deliberately initiated with a view to reducing public resistance to all but the stereo-typed forms of schooling which it considers to be education. Civic re-education must be dynamically conceived with attitudinal change as its main goal. Attempts to effect attitudinal change towards work, productivity, language or food cannot be restricted to the school system. They must be accompanied by public, adult-level programmes which will exploit the influence of adults over children in the interest of national development.
- 91 -

It is not within the scope of this study to examine the politics of the region's separateness into a chain of small states and tiny states. It is sufficient to note that the Windward and Leeward states operate such restricted budgets that it is difficult to see how they could possibly spe^id more than their current proportions of revenue on education. Their solution to their developmental problems and the relationship of the education systems to them will doubtless have to be substantially different from the solution likely in Jamaica, Barbados, Guyana and Trinidad and Tobago. Regardless Of the likely difference in their possible solutions, they all share the common need to improve their efficiency in implementation of plans in education. This efficiency must relate to planning logic as well as to plan execution. It must also be borne of close collaboration between economic planners and educational planners.
Within the stated intentions of the region's governments the record of expansion of their system is not to be scoffed at. Clear documentable improvement of basic provisions for education has been made. It is to be hoped that a philosophy of development to which an educational philosophy can be linked will evolve within the near future in each of the region's states.
- 92 -
SUMMARY - RESUME - RESUMEN
As stated by the author in the introduction, "This study aims at providing a concise summary of the state of education in the English-speaking countries of the Caribbean in general but with special emphasis on Barbados, Guyana, Jamaica, and Trinidad and Tobago". The frame of reference for outlining the relationship between education and development is constituted by the economic conditions and social prospects of each country.
The first chapter contains an overall economic description of the region, with statistical indicators of its domestic and foreign trade, productivity levels, industrial sectors, etc. With the exception of Trinidad, whose principal production is the petroleum industry, the common base is agriculture. The overall economic picture is completed in the next chapter with the description and comparison of the labour force, according to its education levels.
In the third chapter the author gives a detailed description of the British education system adopted in the region, its development and transformations in each level, and common problems arising in the region. After the various countries obtained their independence, the British system, with different peculiarities for each country was accepted as the national system.
The fourth chapter is devoted to education in each of the countries mentioned above: its own organization, types of schools,., selection of schools, quality of teachers, educational plant and infrastructure, statistical information. In Jamaica and Guyana, their political socialist orientation is reflected in the direction and goals of education.
The fifth chapter is devoted to the universities, which are only two: the University of the West Indies, with its headquarters in Jamaica and campuses in Trinidad and Barbados, and the University of Guyana. Their organization, background, development and present status are described in this study, as well as the careers offered by the existing faculties.
The sixth chapter, entitled "Language and Development", deals with the subject of multilingualism in the region: although the official language is English and general literacy is based on this language, there are others of Oriental and African origin, as well as various forms of Creole and dialects spoken by a relatively high percentage of the population; this is undeniably a source of difficulties for national integration, creates tension and seriously hampers the goals of education of children and curtails their possibilities of reaching higher levels of education.
In the last chapter the author questions the adoption of an educational model that does not take into account the region's needs. He remarks on the lack of a true philosophy of development, with the logical consequences on educational policies: a traditional academic orientation prevails, and agriculture - the main economic activity in nearly all the countries - does not occupy its proper place in education. He concludes by stressing the need to improve efficiency in the implementation of education plans with the co-operation of economic and educational planners.
- 93 -

Tel que l'auteur annonce dans l'introduction, l'objet de cette étude tient à donner un résumé concis sur l'état de l'éducation dans des pays anglophones du Caraïbe, mettant particulièrement l'accent sur ceux de la Barbade, la Jartïque, la Trinité, la Tobago et la Guyane. Les conditions économiques et les perspec-tives sociales de chaque pays constituent le point de repère pour mettre en relief les rapports existents entre éducation et développement.
Au premier chapitre, on trouve une description générale sur l'économie de la région avec des indicateurs statistiques se rapportant à son commerce interne et externe, aux niveaux de productivité, aux secteurs industriels, etc. A excep-tion faite de la Trinité dont la production principale est celle du pétrole, l'agriculture est la plus grande activité économique. Au deuxième chapitre,cette vue économique générale est complétée par la description et la comparaison de la force du travail d'après les différents niveaux d'éducation.
Au troisième chapitre, on fait une minutieuse description du système d'édu-cation anglais implanté dans la région, développement et changements dans chacun des niveaux ainsi que les problêmes que ledit système pose dans la région. Après 1'indépendence des différents pays, ce système devient national présentant quel-ques particularités y efférentes.
Le quatrième chapitre est consacré à l'éducation dans les pays nommés ci-dessus dont: organization propre, type de scolarité, sélection scolaire, quali-té d'enseignants, emplacement et infrastructure éducatifs, information statistique. La direction et les objectifs de l'éducation à la Jamaïque et à la Guyane répon-dent à une orie'ntation politique socialiste.
Le cinquième chapitre est consacré aux universités. Il n'en a que deux: celle the University of West Indies dont le siège principal se trouve à la Ja-maïque, ayant des campus sectionnels à la Trinité et a la Barbade, et celle the University of Guyane. On y en montre 1'organization, le curriculum, le développe-ment, l'état actuel ainsi que les carrières offertes aux facultés existentes.
Au sixième chapitre, nommé "Langues et développement", l'auteur aborde le sujet du multilanguisme dans la région. Il y explique que l'anglais est la lan-gue officielle et que toute l'alphabétization s'est développée en anglais mais qu'il y en d'autres d'origine orientale et africaine ainsi que plusieurs formes de créole et de dialecte parlés par un nombre assez grand de la population. Ceci pose d'indiscutables problèmes en vue de l'intégration nationale; provoque tension et rend vraiment difficile les objectifs à atteindre sur l'éducation des enfants ainsi que les possibilités de réussite des niveaux supérieurs de la scolarité.
Au dernier chapitre, l'auteur met en question l'adoption d'un modèle édu-catif que n'a pas compte de besoins de la région. Il remarque l'absence d'une véritable philosophie du développement et ses inéluctables conséquences sur les politiques éducationnelles. C'est ainsi que l'orientation académique tradition-nelle a une place prépondérante tandis que l'apprentissage rapporté à l'agricul-ture - source de la plus grande activité économique dans presque tous les pays -n'a pas celle qu'elle devrait avoir dans l'éducation. Il conclue du besoin d'une meilleure application des plans d'éducation comptant sur l'aide des planifica-teurs économiques et éducatifs.
- 94 -

Como lo anticipa el autor en la inti • Jucción, "el estudio tiene como obje-tivo dar un resumen conciso del estado de ia educación en los países de habla inglesa del Caribe en general pero con especial mención de Barbados, Guyana, Ja-maica y Trinidad 6 Tobago". El marco de referencia para poner de relieve las relaciones existentes entre educación y desarrollo lo constituyen las condicio-nes económicas y las perspectivas sociales de cada país.
En el primer capítulo se encuentra una descripción económica general de la región, con indicadores estadísticos sobre su comercio interior y exterior, niveles de productividad, sectores industriales, etc. Con la excepción de Tri-nidad cuya producción principal es la industria del petróleo, la base común es la agricultura. Esta visión económica general se completa en el capítulo si-guiente con la descripción y comparación de la fuerza de trabajo según sus nive-les de educación.
En el tercer capítulo el autor hace una descripción pormenorizada del sis-tema de educación inglés implantado en la región, su desenvolvimiento y trans-formaciones en cada uno de los niveles y problemas comunes que presenta en la región. Después de la independencia de los diferentes países, se convierte en el sistema nacional, con algunas peculiaridades en cada caso.
El capítulo cuarto está dedicado a la educación en cada una de las nacio-nes citadas arriba: su organización propia, tipos de escolaridad, selección es-colar, calidad de docentes, planta e infraestructura educativas, información estadística. Los casos de Jamaica y de Guyana responden a orientación política socialista, lo que se expresa en la dirección y objetivos de la educación.
El quinto capítulo está dedicado a las universidades. Sólo hay dos: the University of the West Indies, cuya sede principal está en Jamaica y tiene cam-pus seccionales en Trinidad y Barbados; y the University of Guyana. Cada una es presentada con su organización, antecedentes, desarrollo y estado actual y las carreras que ofrecen las facultades existentes.
En el capítulo sexto, titulado "Lenguas y desarrollo", el autor aborda el tema del multilingüismo en la región: aunque la lengua oficial es el inglés y la alfabetización se ha desarrollado sobre la base de dicha lengua, hay otras de origen oriental y africano, lo mismo que varias formas de creóle y dialectos, hablados por porcentajes de población relativamente altos, lo que constituye una fuente de problemas innegables para la integración nacional, crea tensiones y dificulta seriamente los objetivos de la educación de los niños y sus posibili-dades de logro de los niveles superiores de la escolaridad.
En el último capítulo el autor cuestiona la adop ción de un modelo educa-tivo que no tiene en cuenta las necesidades de la región. Comenta la carencia de una verdadera filosofía del desarrollo, con las lógicas consecuencias sobre las políticas educacionales: prevalece la orientación académica tradicional, y el aprendizaje relacionado con la agricultura - que es la fuente de mayor acti-vidad económica en casi todos los países - no ocupa el lugar que le corresponde en la educación. Se concluye postulando la necesidad de mejor implementación de los planes de educación con el aporte de planificadores económicos y educa-tivos.
- 95 -


APPENDIX I
Dependency r a t i o s
Indices of the burden of dependency borne by members of the labour force are provided by Abdullah (1977). The table below is extracted from that source. Method of calculation is not economically active ^ ^ qqq
economically active '
English-speaking Caribbean, 1970 (Dependency Ratios)
State 1970
Antigua & Barbuda Barbados Dominica Grenada Guyana Jamaica Montserrat St. Kitts-Nevis-Anguilla St. Lucia St. Vincent Trinidad £ Tobago
n .a. 1,639 2,334 2',267 2'957 2,342 1,980 2,484 2,486 2,715 2,270
Source: Abdullah, N.: The Labour Force in the Commonwealth Caribbean: Statistical Analysis, I.S.E.R., 1977, Table 9, p. 23.
- 97 -


APPENDIX I I
Notes on the l a b e l s foi types o f schools
The labels which are applied to schools relate to the ages of the pupils, the programmes which they follow, ownership and funding of the schools.
On the basis of funding the schools may be divided into public and private. The descriptors which indicate private sector institutions are private, independent, unaided, and (at the primary level only) preparatory.
The public sector includes all schools for which financial provision is made by the government. On the basis of ownership they fall into two categories:
- schools wholly owned by the government and designated government;
- schools owned by religious groups, lay organizations or citizens and described as assisted, aided, approved or recognized.
Pre-primary education
The education of children between the ages of 3 and 5 years is conducted in institutions (or parts of institutions) called infant schools (departments), nursery schools, kindergarten or basic schools. The term basic school is used in Jamaica, to refer to private infant schools. It should be noted that in Barbados the terms infant school refers to schools catering for the 5-7 age group and contrasts with nursery school which refers to under-5.
Primary education
The term covers the education offered to children between the ages of 5 and 11 years. Children of these ages may be found in either of two types of schools in the public sector:
- primary schools - all age schools
An all-age school differs from a primary school in that it caters for children aged 12-15 as well. In a few isolated cases there are schools having enrolments between the ages 7-11 and these are referred to as junior schools.
In the private sector, schools catering for the 5-11 age group are called preparatory schools.
The education of the 11-15 age group is one of the areas of transition in the region. Some of it takes place in institutions called all age schools and the rest in schools described as secondary. Where the age group is provided for all age schools the following terms refer:
- 99 -
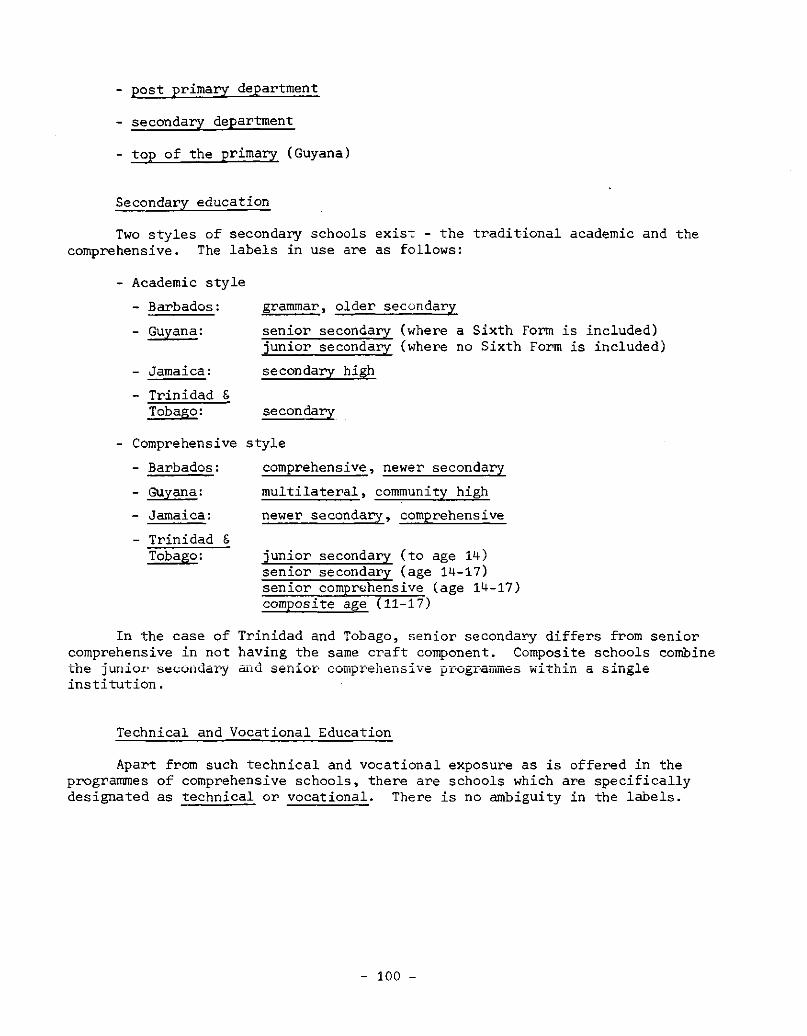
- post primary department
- secondary department
- top of the primary (Guyana)
Secondary education
Two styles of secondary schools exist - the traditional academic and the comprehensive. The labels in use are as follows:
- Academic style - Barbados : - Guyana:
- Jamaica: - Trinidad £
Tobago:
grammar, older secondary senior secondary (where a Sixth Form is included) junior secondary (where no Sixth Form is included) secondary high
secondary
- Comprehensive style - Barbados : - Guyana: - Jamaica: - Trinidad &
Tobago:
comprehensive, newer secondary multilateral, community high newer secondary, comprehensive
junior secondary (to age 14) senior secondary (age 14-17) senior comprehensive (age 14-17) composite age (11-17)
In the case of Trinidad and Tobago, senior secondary differs from senior comprehensive in not having the same craft component. Composite schools combine the junioi" secondary and senior comprehensive programmes within a single institution.
Technical and Vocational Education
Apart from such technical and vocational exposure as is offered in the programmes of comprehensive schools, there are schools which are specifically designated as technical or vocational. There is no ambiguity in the labels.
- 100 -

APPENDIX I I I
Data for the Windwards and Leewards are compiled in this appendix for reference. The information varies from one territory to the other but all relevant available information is included, a/
Antigua
General educational objectives 1974-75:
Ci) integration of education system; (ii) new curriculum for first three years of secondary
education - comprehensive; (iii) increase in quantity of staff; (iv) improvement in quality of staff by shift to two
year training programme ; (v) review of school texts in use;
(vi) expansion of education planning unit; (p.1-2 of Source 3).
Plant
1975-76 Primary schools - public 32 private 26
Secondary schools - public 8 private 9* (including 8 previously
counted at primary which have secondary and primary grades.)
(Source 1)
Enrolment
1975-76 Primary schools - public 9,374 (1,545 in post primary) private 3,501 Total 12,875
Secondary schools - public 3,532 private 1,552 Total 5,084
a/ No information is available for Dominica except the enrolment at the Teachers* College - 49 in 1977. Staffing full-time 5; part-time 11.
- 101 -

Compulsory schooling ages 5-16 Primary to secondary promotion: 1. by examination at age 12;
2. automatic in Eastern section of island;
3. by examination at age 15.
All secondary schools are comprenhensive types except Antigua Grammar School. Post-primary sections of primary schools follow comprehensive secondary programmes except that they do not offer modern foreign languages.
Participation rates
197L.-76
Age group 5 - 1 1 79% 12 - 15 70% 15 - 19 35%
Calculated from Source 1.
Teachers 1975-76 P R I M A R Y
Total Ho. % Teacher: Teacher : Trained Trained Pupil Ratios Pupil Ratios
Public 409 243 59.4 1: 23 1:39 Private 146 34 23.2 1: 24 1:103
S E C 0 N D A R Y
Total Graduates Non--Graduates % % ToapVion • Trained Untrained Trained Untrained Trained Graduate Pupil Ratios
Public 179 26 24 70 59 53.6 27.9 1:20 Private 67 10 10 9 38 28.3 29.8 1:23
Technical College 1975-65 Students - 215 including part-time and short courses. Includes : Commercial training, Hotel and catering skills,
Engineering trades, Construction trades.
1974 : Industrial arts centres operational - 10 catering to 1038 boys but slow down in programme in 1975. Programmes include woodwork, drafting and principles of design. Metal work at one centre.
- 102 -

Teachers' College (1977) (Source 4)
Students - 93 Staff : full-time - 9
part-time - 4
Entry requirements - a) 4 '0' levels including English language or Mathematics; and
b) Two years teaching experience
Teachers college and technical college administered by one principal from April 1977.
Expenditure on education
1975 EC$ 6.2 million 5.7% of GDP 1976 (budgeted) EC$ 7.6 million 13.7% of total budgeted expenditure
including foreign aid
Expenditure on personal emoluments within education allocation
1975 43.5% 1976 39.8% Sources: 1) Educational Statistics Unit: Antigua Educational Statistics
1975-76, Antigua, undated. 2) Statistics Division: Antigua - Statististical Yearbook 1976. Antigua, 1976, 96 p. 3) State of Antigua and Barbuda: Report of Education Division 1974 and 1975. Antigua 1976, 47 p. 4) School of Education: Some Statistics relating to teachers' college organization in the Eastern Caribbean 1976-77. Cave Hill, 1977, 6 p. mimeo. 5) Antigua and Barbuda: Report of the Education Division 1974 and 1975, Ministry of Education, Health and Culture, 1976, 47 p.
Grenada
Plant 1975-76
Primary schools (government and grant-aided) 63 Secondary schools (government and grant-aided) - Junior Secondary -2 - Comprehensive "-8 - Grammar - 4 14
- 103 -

Enrolment 1975-76
Primary schools Secondary - Junior - Comprehensive - Grammar
-613 -2,832 -1,622
26,255
5,067
Teachers 1975-76 P R I M - R Y
Total No.' % Teacher : Trained Teacher : Trained Trained Pupil Ratio Pupil Ratio
786 286 36.4 1:33 1: 92
Secondary schools (not available for 1975-76)
S E C O N D A R Y (1972)
Total Graduates Non-Graduates % % Teacher : Trained Untrained Trained Untrained Graduate Trained Pupil Ratio
182 27 48 6 101 41 18 n.a.
Teachers' College 1977
Students 74 Staff - full-time 5
- part-time 10
Expenditure on education Not available.
Source: 1) Educational Statistics 1975-76, unpublished documents, Ministry of Education, Grenada. 2) Fernando, W.D.: Grenada - Perspectives for the development programmes 1974-83, Ministry of Education 1974. 173 p.
- 104 -

Montserrat
Plant 1975
Primary schools (government and assisted 14 (unaided) 2
Secondary junior secondary 1 secondary 1 technical 1 3
Enrolment 1975
Primary 2,623 Secondary 486 Technical 60
Teachers 1975
Primary 107 Secondary 34 Technical 8
Teacher • Pupil ratios Primary 1:25 Secondary 1:14 Technical 1:8
No information available on levels of training.
Expenditure on education 197 5
EC$ 2.8 million - 36% of total recurrent expenditure.
Sources: 1) Government of Montserrat: Fourth Statistical Digest 1976. 2) Government of Montserrat: Estimates of Review and Expenditure 1975.
- 105 -

St. Kitts-Nevis
Plant 1976-77
St. Kitts - Primary schools:
5-12 age group 12 5-16 age group 5 5-8 age group 2 19
Nevis - Primary schools:
5-12 age group 7 5-16 age group 2 5-8 age group 1 10
29
St. Kitts - Secondary schools 4 Nevis - Secondary schools 2 6
Enrolment 1976-77
St. Kit is Nevis Total
Primary 6,411 2,142 8,553 Secondary 3,518 1,222 4,740 Total 9,929 3,364 i 3,293
Teachers 1976-77 P R I M A R Y
Total No. % Teacher : Trained Teacher -Trained Trained Pupil Ratice Pupil Ratios
St. Kitts 225 82 36.4 1:29 1.78 Nevis 87 50 57.4 1:25 1:43
Total 312 132 42.3 1:27 1:65
77% of teachers in St. Kitts hold less than 5 '0' levels. 71% of teachers in Nevis hold less than 5 '0' levels.
- 106 -

S E C O N D A R Y
Total Graduate 6 Non-Graduate % % Teacher : Specialist Trained Untrained Trained Graduate Pupil Ratios
St.Kitts 181 37 55 89 30.4 20.4 1:19 Nevis 64 13 29 22 45.3 20.3 1:19
Total 245 50 84 111 34.3 20.4 1:19
Teachers' College - 1977 Students 75 Staff: full-time 10
part-time 2
Entry requirements - 4'0' levels including English Language.
Expenditure on educations
1975 EC$ 2.7 million 7.4% of total public expenditure
Sources: Education Department, St. Kitts-Nevis Educational Statistics 1976-77s St. Kitts9 19779 43 p.
St. Lucia
Educational objectives
i) elimination of illiteracy; a/ ii) establishment in all schools of education and practical training in
agriculture and co-operative activity as integral parts of their curricula ;
iii) expansion of technical and vocational education; iv) improvement in the quality of teaching; v) expansion of facilities in pace with demand to eliminate overcrowding
of schools; " vi) the raising of environmental standards in schools through progressive
replacement of obsolescent buildings and through policies to ensure that new schools are designed to adopted standards in terms of space and recreational facilities.
a/ 1970 illiteracy estimated at 22% of population over 14 years.
- 107 -
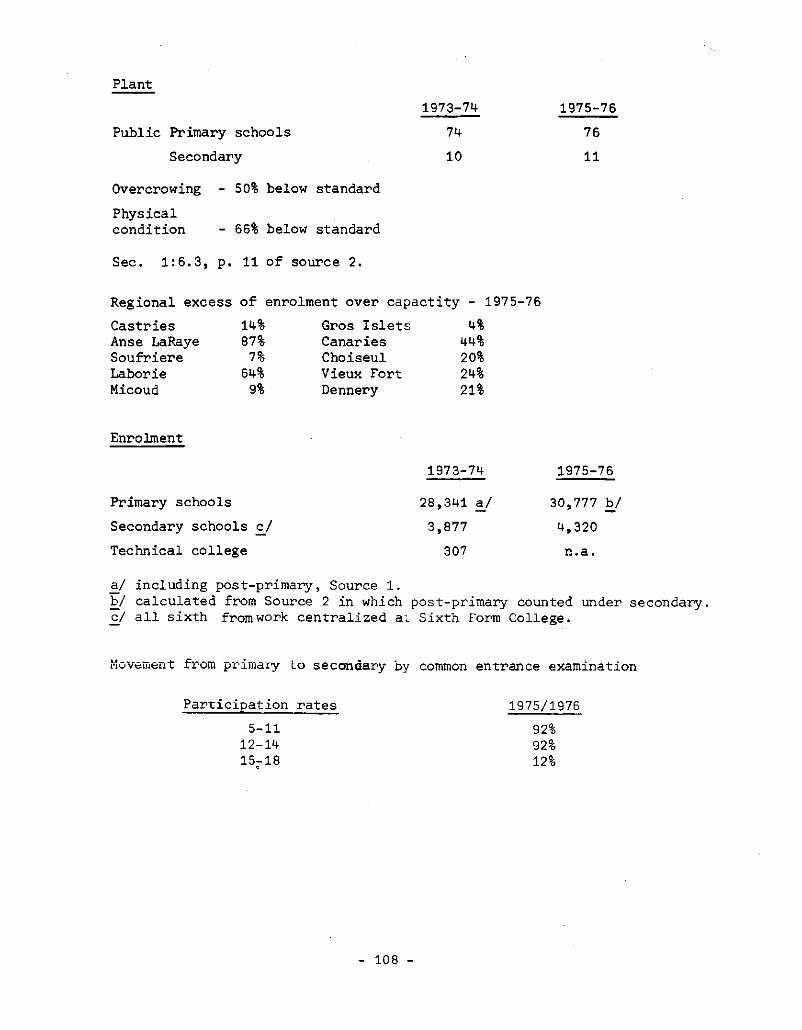
Plant 1973-74
Public Primary schools 74 Secondary 10
Overcrowing - 50% below standard Physical
condition - 66% below standard
Sec. 1:6.3, p. 11 of source 2. Regional excess of enrolment over capactity - 1975-76 Castries 14% Gros Islets 4% Anse LaRaye 87% Canaries 44% Soufriere 7% Choiseul 20% Laborie 64% Vieux Fort 24% Micoud 9% Dennery 21%
1975-76 76 11
Enrolment
1973-74 1975-76
Primary schools 28,341 a/ 30,777 b/ Secondary schools c/ 3,877 4,320 Technical college 307 n.a.
a/ including post-primary, Source 1. b/ calculated from Source 2 in which post-primary counted under secondary, c/ all sixth from work centralized at Sixth Form College.
MuVeuient from priiudiy to secondary by common entrance examination
Participation rates 5-11
12-14 15-18 e
1975/1976 92% 92% 12%
- 108 -
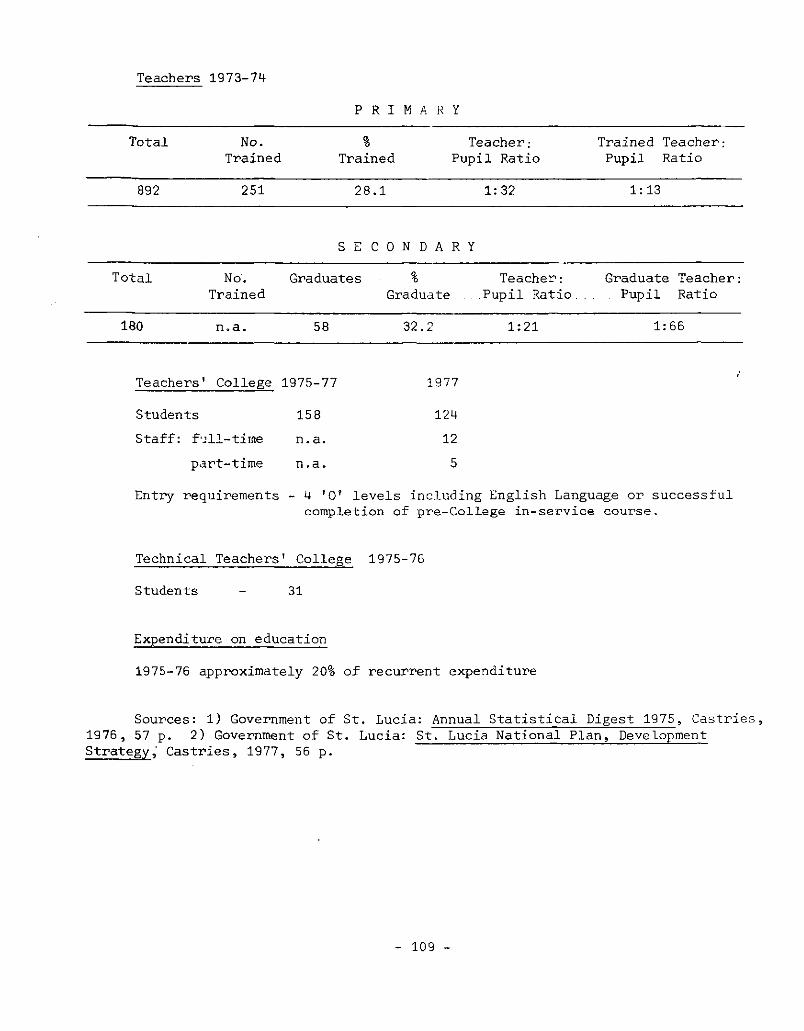
Teachers 1973-74
P R I M A R Y
Total No. % Trained Trained
Teacher; Pupil Ratio
Trained Teacher; Pupil Ratio
892 251 28.1 1: 32 1:13
S E C O N D A R Y
Total No. Graduates % Trained Graduate
Teacher : . Pupil Ratio.
Graduate Teacher: Pupil Ratio
180 n.a. 58 32.2 1:21 1:66
Teachers' College 1975-77 1977
Students 158 124 Staff: f'jll-time n.a. 12
part-time n.a. 5
Entry requirements - 4 '0' levels including English Language or successful completion of pre-College in-service course.
Technical Teachers' College 1975-76
Students - 31
Expenditure on education
1975-76 approximately 20% of recurrent expenditure
Sources: 1) Government of St. Lucia: Annual Statistical Digest 1975, Castries, 1976, 57 p. 2) Government of St. Lucia: St. Lucia National Plan, Development Strategy, Castries, 1977, 56 p.
- 109 -

S t . Vincent
Plant 1974-75
Primary schools 60 Secondary Schools 7
Enrolment 1974-75
Primary Secondary (estimated) (does not include private schools)
26,122 5,138
I
Teachers ' 1974-75
P R I M A R Y
Total No. Trained
% Teacher: Trained Pupil Ratio
Trained Pupil
Teacher : Ratio
1,098 209 19* 1:24 1:125
S E C O N D A R Y
Total Graduate Trained Untrained
Non-Graduate % Trained Untrained Graduate
% Teacher: Trained Pupil
Ratio
Graduate Teacher: Pupil Ratio
161 36 31 46 69 41=6 50,9 1:32 1: 77
* (Note: In 1966, only 10% of primary teachers were trained; only 33.5% had completed secondary education.
(Source 3)
Teachers' College (1977)
Studentes 139 Staff: full-time 7
part-time 6
Entry requirements: 4 '0' levels including English Language.
- 110 -

Expenditure on éducation
1975-76 EC$5.2 million - 22% of estimated recurrent expenditure: personal emoluments account for 94% of thar figure.
Sources: 1) 1975-76 Estimates of St. Vincent, Government Printery, 1975, 155 p. 2) Digest of Statistics 1975, No. 25, Statistics Unit of St. Vincent, 1975, 46 p. 3) U.W.I.: The Development Problem in St. Vincent, U.W.I. Development Mission, unpublished, 1969.
- I l l -


APPENDIX IV - JAMAICA
Flow diagram: Pre-primary, Primary and Secondary Levels
^ = Principal's Discretion
O = C. E. E.
[~~| - Grade 9 Achieyement Test
0 = J. S. E.
0 = R. S. A.
Vf. = "0" Level
[\ = Common Entrance Examination for Technical


® O © e o • o t- r ci (73 en o 0 ra ID m ri o O 3 3 H" CU Oí n> ID m H* H' i 1 n cn tu 01 rt W O. ( - - M. Ci O r» £ 3' •o O 3 w- O w ra ! - • O Q •s •S rt O. t- 3 ri ri œ M 0. >••• [n H !"tl Hl ri D CD O H. H. X 0> rç O O Hl 9" < 01 01 O 3 H- n rt rt >í w. 3 ra (!• 01 a M •í U1 c» rt O o <0 ri n> H- Mi 1 ¡1 O H- x Ht Mi •O O (U h'. ra ® 3 3 3 O n. a M M* 01 c t: tu 3 ri o -s » a 01 oj rt rt rt H. H H. <n 0 o O o 3 3 3 3* O
z O > O l-J
w l- H* <r tt>
< o » H
("i en
ilotel School evening Instituto Domestic Centre .y-ranerciai Instit
o o œ w ro
O
o o c o o 3 o. 1- M. n ^ < H- m m 3 09 (K> a. rt H. O 0 rt 3 H) O > 0 O •i Hi 1—' rt H* U! •c (B W <?1 re • cn
O M. (0 3 O <t
<P
O
<P
h-1 CO O S ¡3 M O •V D" M (U 55 l-i <-i O ai rt O
M X
Hi < i-* 01 se 1 a- CJ o > o ?D -o H te >
i—* W a es o CO * r+ fD i 1 3


APPENDIX VI - GUYANA
Flow chart of school system
THIRD LEVEL
EDUCATION
r — I 1 University of
Guyana
Degrees Coursei
(Five Years)
Under Graduate Diploma Courses; (Two Years)
GENERAL
SECOND
I^EVEL
EDUCATION
I Teacher Train-ling for Prima-cy- Schools I (Two Years)
r* b e m o r Secondary Schools ( r )
«-4-L Junior Second-I aiy Schooisí1*) j (Seven Years) j
Post Graduate tjDi^oma in Ed. I (? Years)
UNIVERSITIES ABROAD
Teacher Ed. Cert, in Ed.
(2 Years)
College for Secondary Teachers
FIRST LEV"t.
EDUCATION
Secondary Department of Primary Schools (2£3)
(Three Years) A,
School of Agriculture <Two to three Years)
School of Home Economics (Two Years)
- - Í Technical Institute (1-5 Years)
G.I.T.C. (One Year)
I L..
Primary Schools Six Grades - Prep. A, B.
Stds. 1, 2, 3, 4. (Six to eight years (1)
PRE-PRIMARY EDUCATION
Kindergarten (Private)
(One to three years)
Examinations: 1. ^Secondary Schools Ev. trance Examination 2. Proj'•li-'r.ary Certificate
Co i.] vi',-: of Preceptors 4. General Certificate of. Education Ordinary I,»vol 5. Geno-ai ~ert:ticate of í™. a ri-r-inrr-'1
- 117 -


BIBLIOGRAPHY


ALLEYNE, Michael H. "Educational Planning in Trinidad and Tobago", Caribbean Studies, Vol. II, n° 4, 1972.
ANTIGUA, Government of. Antigua Estimates 1975, Government Printing Office, Antigua, 1975.
ANTIGUA, Government of. Policy Statement on Long Term Educational Programme. Antigua, Government Printing Office, 1967.
ANTIGUA, Government of. Educational Statistics 1975-1976. Ministry of Education, Health and Culture, 1976, 36 p. mimeo.
ANTIGUA, Government of. Statistical Yearbook 1976, Ministry of Finance, 96 p. ANTIGUA, Government of. Annual Report of the Labour Department - 1974: Government
Printing Office, 1976, 85 p. ANTIGUA, Government of. Report on the Education Division 1971-1972, Government
Printing Office, 1973, 35 p. ANTIGUA, Government of. Report on the Education Division 1971-1973, Government
Printing Office, 1974, 23 p. ANTIGUA, Government of. Report of the Education Division 1974-1975, Government
Printing Office, 1976, 47 p. ANTIGUA, Government of. The Education Act 1973, N° 7 of 1973, Government Printing
Office, 1974, 21 p. ANTIGUA, Government of. Budget Speech 1975, Government Printing Office, Antigua,
1975, 12 p. ANTIGUA, Government of. Budget Speech 1976, Government Printing Office, 1976,
47 p. ANTIGUA, Government of. Curriculum for the primary schools in Antigua and Barbuda
(undated but possibly 1968). BACCHUS, M.K. "Social Factors in Secondary School selections in British Guiana".
Social and Economic Studies, Vol 15, n° 1, 1966. BACCHUS, M.K. "Social Factors in Secondary School selections in British Guiana".
Social and Economic Studies, Vol. 15, March 1966, pp 40-52. BACCHUS, M.K. "The development of educational planning with special reference to
the West Indies". Part I Teacher Education, Vol. 7, n° 3, Feb. 1967, p. 221-231. Part. II Teacher Education, Vol. 8, n° 1, May 1967, p. 36-62.
BACCHUS, M.K. "Education and socio-cultural integration in a plural society". Occasional paper series, n° 6; Centre for developing area studies, McGill University, Montreal, 1970, 42 p.
BACCHUS, M.K. "A quantitative assessment of the levels of education required in Guyana by 1975". Social and Economic Studies, Vol 17, n° 2, 1968.
BACCHUS, M.K. "Patterns of educational expenditure in an emergent nation: A study of Guyana 1945-1965", Social and Economic Studies, Vol 18, n° 3, 1968.
BACCHUS, M.K. "Education and Decolonization", Mimeo 35 p. Undated. BARBADOS, Government of. Development Plan 1973-1977 undated, various pagination. BARBADOS, Government of. Barbados Community College Calendar 1969, Government
- 121 -

Pr in t ing O f f i c e , 1969, 35 p.
BARBADOS, Government of. Report of the Mi..Istry of Education, Barbados, for the period 1st. September 1970 to 31st August 1971. Ministry of Education, Bridge-town, Barbados (undated), 75 p. mimeo.
BARBADOS, Government of. Report of the Ministry of Education, Barbados, for the period 1st September 1971 to 31st August 1972. Ministry of Education, Bridgetown, 77 p., mimeo (undated).
BARBADOS, Government of. Report of the Ministry of Education, Barbados, for the period 1st September 1972 to 31st August 1973, Ministry of Education, Bridgetown, 77 p., mimeo (undated).
BARBADOS, Government of. Monthly Digest of Statistics n° 12, December 1976, Bridgetown, April 1977, 38 p.
BENN, Brindley H. "Education for a new Guiana"; Speech to British Guiaia Teachers1
Association, Georgetown, Arcade Printery, 1959, 12 p. BOLLAND, 0. N. "Literacy in a rural area of Jamaica", Social and Economic Studies,
Vol. 20, n° 1, 1971. BRAITHWAITE, L. "The development of higher education in the West Indies". Social
and Economic Studies, Vol 7, n°l, 1958. BRITISH Development Division in the Caribbean. Economic Survey and Projections
St. Lucia, September 1970. BRITISH Development Division in the Caribbean. Comparative data associated states
and dependencies, April 1970. BR00MES, D. R. (Editor) Crossroads in Teacher Education - a search for relevance.
Test Development Unit, Ministry of Education, Guyana, 1972 or 1973. BURNHAM, L. F. S. On the Road tu Socialism. Pamphlet 24 p., Office of the Prime
Minister, Guyana, 22/2/76. (Address on 6th Anniversary of the Republic of Guyana).
BURNHAM, L. F. S. On the Road to Socialism. Address by L.F.S. Burnham at special congress marking 10th anniversary of PNC in government, 14/12/72. Georgetown, Guyana, 1974.
BURNHAM, L. F. S. The Pursuit of Perfection. Address on 10th Anniversary of Independence, 25 th May 1976. Pamphlet, 44 p. Guyana Printers, Georgetown, Guyana.
BURNHAM, L. F. S. Towards the Socialist Revolution. Pamphlet 52 p. Address at 1st Biennial congress of PNC, Sophia, 18/8/75. Guyana Printers, Georgetown, Guyana.
BURNHAM, L. F. S. "Declaration of Sophia", Pamphlet 38 p. BURNHAM, L. F. S. On National Service (extracts from speeches 6/11/73, 9/1/74
and state paper 20/12/73). Militant Library Series, Vol. 1, N° l. BYNOE, J. G. "Education for Political Socialization" 1977. BYN0E, J. G. "Equality and High School Opportunity: A Guyanese Case Study", 1973,
26 p. , mimeo (Text of a lecture). BYNOE, J. G. "Education and Development" 1974, 27 p. , mimeo (Text of three radio
broadcasts).
- 122 -
CARIBBEAN Development Bank. Caribbean Development Bank Annual Report 1976. Bar-bados, 1976.
CARRINGTON, L. D. "Determining language education policy in Caribbean socio-linguistic complexes", International Journal of the Sociology of Language, N° 8, 1976, p. 27-43.
CAMACHO, A. G. J. Education for 20th century Trinidad and Tobago. Pamphlet, Open Lecture Series, 1967.
CAMACHO, A. G. J. "Comments on the Draft plan for educational development in Trinidad and Tobago 196 8-73 as modified by the 3rd Five-year development plan" (Uncorrected) mimeo 20 p.
CROSS, M. and Schwartzbaum, A. "Social Mobility and Secondary School Selection in Trinidad and Tobago", Social and Economic Studies, Vol. 18, n° 2, p. 189-207, 1969.
CROSS, M. and Schwartzbaum, A. "Secondary School Environment. The case of Trini-dad and Tobago". Social and Economic Studies, Vol 19, n° 3, 1970.
COMMONWEALTH Secretariat. Report on progress in Curriculum development in commonwealth coumtries, August 1967, 34 p., mimeo.
COMMONWEALTH Secretariat, Sixth Commonwealth Education Conference Report. Govern-ment Printers, Jamaica, 1974, 180 p.
DEMAS, William. "The World of School and the World of Work", Caribbean Contact, Vol. 1, n° 9, September 1973, p. 14.
ECONOMIC Commission for Latin America. Economic Activity 1975 Caribbean Community Countries. Port of Spain, 1976.
ECONOMIC Commission for Latin America. Economic Activity in Caribbean Countries 1976, Port of Spain, 1977.
ECONOMIC Commission for Latin America. An evaluation of the integration movement (CARIFTA to CARICOM), Port of Spain, 1977.
EDWARDS, P. A. Education for development in the Caribbean, Caribbean Ecumenical Consultation for Development, 1971, CADEC Study paper n° 3, 15 p.
EMERSON, L. H. S., Hennequin, R. P. and Hutmacher, W. Barbados - Education and Priorities for its Development, UNESCO, Paris, 1969, 42 p.
FERNANDO, W. D. Grenada, West Indies - Perspectives for the Development of Educa-tional Programmes 1974-1983. Ministry of Education, St. Georges, 1974. 173 p., mimeo.
FIGUER0A, John J. Society, Schools and Progress in West Indies, Pergamon Press, 1971, 208 p.
GORDON, S. C., McPherson, P., et al. "Proposals for education development in St. Vincent, 1965". Institute of Education, 35 p. and appendices, mimeo.
GORDON, S. C. A Century of West Indian Education^Longmans, 1963. GORDON, S. C. Reports and Repercussions - West Indian Education, 1836-1933,
Kingston, Jamaica, 1968, 190 p. GREIG, J. W., Braithwaite, R.H.E., and Maraj, J. Teacher Education in Trinidad
and Tobago. Report submitted to Ministry of Education and Culture, Trinidad and Tobago, 1969, 39 p. mimeo.
- 123 -

GRENADA, Government of. Reports of the inspection of secondary schools in Grenada 1965. Mimeo, various pagination.
GRENADA, Government of. Educational statistics and school directory, 1972. Ministry of Education, Grenada, 1973.
GRENADA, Government of. A review of the historical development of education in Grenada with particular reference to the period 1969-72. Ministry of Education., Grenada,1973 , 183 p. mimeo.
GUYANA, Government of. Memorandum of Education Policy. Ministry of Education. January 1968.
GUYANA, Government of. (Draft) Second Development Plan 1972-1976. Ministry of Economic Development, Georgetown, 372 p. mimeo.
GUYANA, Government of. Economic Survey of Guyana, 1974. Statistical Bureau, Georgetown, 1975, 99 p. mimeo.
GUYANA, Government of. Ministry of Education and Social Development - Nine Year Report 1965-1973. Ministry of Education and Social Development February 1974. 205 p. mimeo. Georgetown.
GUYANA, Government of. Quarterly Digest of Statistics, September 1976, Ministry of Economic Development, Georgetown. 46 p. mimeo.
GUYANA, Government of and UNDP. National Physical Development Strategy -Background Study. Guyana, March, 1977.
HAREW00D, J. "Employment in Trinidad and Tobago" Trinidad and Tobago CSO Research Papers, No. 1, Dec. 1963, p.1-81.
HAREW00D, J. "A comparison of Labour Force Data in Trinidad and Tobago 1946-64", CSO Research Papers, No.2, Dec. 1965, p.1-35.
HAREW00D, J. "Education and Manpower" Caribbean Development Bank Seminar -Manpower Planning, Grenada, 1974, p.31-44.
HAREWOOD, J. The Population of Trinidad and Tobago C.I.C.R.E.D. Series, 1975. HAREW00D, J. Problems of unemployment in the Caribbean, ISER, St. Augustine, 1975. HENRY, R. "Earnings and Education in Trinidad and Tobago: Some evidence for 1970".
Trinidad and Tobago CSO Research Papers No. 7, Feb. 1974. p.1-28. JAMAICA, Government of. New Deal for Education. Ministry of Education, 1966.
107 p., Kingston. JAMAICA, Government of. Five Year Plan 1968-1972. Proposals by the Ministry of
Education, Jamaica. 16 p. mimeo. JAMAICA, Government of. The Education Thrust of the 70's. Ministry of Education,
1973. 23 p. and appendices. JAMAICA, Government of. Report of the Working Party on Post '0' Level Education,
1973, 53 p. and appendices. JAMAICA, Government of. Statistical Abstract Jan-March 1975 (Dept. of Statistics)
Nov. 1975, Kingston. JAMAICA, Government of. The Labour Force 1975 (Dept. of Statistics), Kingston,
April 1976.
- 124 -

JAMAICA, Government of. Economic ans Social Survey, Jamaica 1975, National •' Planning Agency Kingston, undated.
JAMAICA, Government of. Education Statistics 1975-76, Ministry of Education, 114 p. 1976.
JAMAICA, Government of. Directory of Educational Institutions 1976-77, Ministry of Education, 69 p. 1977.
JEFFCOCK, D. (Ed.) Eastern Caribbean Standing Conference on Technical Education, St. Lucia, 1973.
LEWIS, W. Arthur. "Secondary Education and Economic Structure", Social and Economic Studies, Vol. 13, No. 2S 1964.
LEWIS, W. Arthur. "Education and Economic Development" Social and Economic Studies, Vol. 10, No. 2, 1961.
LEWIS, W. Arthur. "Education and Economic Development" Social and Economic Studies, Vol. 10, No. 2. 1961.
LIVERPOOL, P.R. "A note on some dilanmas of cooperative development in post-colonial Guyana". Studies in Post Colonial Society Ed. Aubrey Armstrong et al, African World Press, Nashville, Tennessee June 1975, p. 158-201.
LUTCHMAN, H., Mars, P., and Addo9 H. Selected Issues in Guyana Politics, Georgetown 1976.
MANLEY, D.R. 'Mental ability in Jamaica'. Social and Economic Studies, Vol.12, No. 1, 1963.
MANLEY, Michael. The Politics of Change: A Jamaican Testament. Andre Deutschs1974, 223 p.
MARAJ, J.A. Education in an Emerging Society, Unpublished, mimeo, 13 p. March 1967.
MURRAY, R.N. Report of Education in Grenada, Ministry of Labour and Social Affairs, The West Indies, 1961, 48 p., mimeo.
MURRAYs R.N. Report in depth of primary education in Jamaica. Ministry of Education,Kingston. 128 p. and appendices 1974.
MONTSERRAT, Government of. Fourth Statistical Digest - 1976 Plymouth, undated. PUJADAS, Leo. "A Note on educational development" Trinidad and Tobago CSO
Research Papers, No. 6, June 1969, p.1-46. RISKE, R. S Rust, V. f!- Non Formal Education and the labor force in Port of
Spain, Trinidad!'in Thomas J. La Belle: Educational Alternatives in Latin America, p.293-333, UCLA, Los Angeles 1975.
ROBERTS, G.W. "The Working Force of the Commonwealth Caribbean at 1970" in Caribbean Development Bank Seminar - Manpower Planning, Grenada 1974. p.1-25 and unnumbered appendices.
SHOREY, L. 'Caribbean Education: The need for relevance'. 1973, 24 p.mimeo (Text of an address).
SIMPSON, J.M. A Demographic Analysis of Internal Migration in Trinidad and Tobago. I.S.E.R. 1973, 63 p.
SMITH, M.G. "Education and Occupational Choice in Rural Jamaica". Social and Economic Studies, Vol.9, No.3, 1960.
- 125 -

ST. KITTS-NEVIS, Government of. Estimates for the year 1974, Government Printery, St. Kitts 1974.
ST. KITTS-NEVIS, Government of. Report of Ministry of Education, 1975-1976. 72 p. mimeo.
ST. LUCIA, Government of. Budget (1974) address by J.G.M. Compton, Premier and Minister of Finance, St. Lucia, 1973.
ST. LUCIA, Government of. Estimates of St. Lucia, Government Printer, Castries, 1974, 187 p.
ST. LUCIA, Government of. Handbook on the Junicr Secondary School June 1969. Ministry of Education, Castries, 24 p. mimeo.
ST. LUCIA, Governmente of. Annual Statistical Digest 1975 Castries, 1976. ST. VINCENT, Government of. 1975/76 Esti-w.-qs o* St, Vinr.ent, ^ovarnment Pr>-intary
1975, 155 p. ST. VINCENT, Government of. Report on the Department of Education 1967-69.
Government Printery 1972, 29 p. ST. VINCENT, Government of. Digest of Statistics for the year 1975, Statistical
Unit. TRINIDAD and Tobago, Government of. University Education in the West Indies with
special reference to Trinidad and Tobago. Government Printing Office, Trinidad and Tobago 1962. 8 p.
TRINIDAD and Tobago, Government of. The Concordat - assurances for the preservation and character of denominational schools, Port of Spain, 1968, 2 p. mimeo.
TRINIDAD and Tobago, Government of. Report of the Education Working Party Chaguaramas Secondary Schools Conference April 1972. Government Printery, Trinidad, 54 p.
TRINIDAD and Tobago, Government of. Report of the Caribbean Task Force to Government of Trinidad and Tobago 1974. 134 p. Government Printing Office, Trinidad. Double pagination. Part I -art II 1-40.
TRINIDAD and Tobago, Government of. Prime Minister's proposals to Cabinet on -i o /n /He r"< l. r> i i A n r 1 r — £ u u v . q t . j . m i J .U/ ^ / / ~J . o u v CL-JIIUCIIL r i ' X l i L t i i ' y ± 3 / a . -LO p .
TRINIDAD and Tobago, Government of. Prime Minister's proposals to Cabinet on working party to deal with craft training and a national apprenticeship scheme. 25/9/75 Government Printery, Trinidad 1975, 4 p.
TRINIDAD and Tobago, Government of. Prime Minister's further proposals to Cabinet on education 2/10/75 Government Printery, Trinidad, 1975, 12 p.
TRINIDAD and Tobago, Government of. Report of Working Party on Craft Training and National Apprenticeship Scheme. Dec. 1975. 95 p.
TRINIDAD and Tobago, Government of. Population and Vital Statistics 1974 Report. Central Statistical Office, Port of Spain.
TRINIDAD and Tobago, Government of. Report of Working Party on Education. January 1976, 154 p.
TRINIDAD and Tobago, Government of. A symposium on the mobilization of domestic financial resources. May 1967. Mimeo, 5 p. (paper prepared by Planning Unit of the Ministry of Education and Culture).
- 126 -

TRINIDAD and Tobago, Government of. Quarterly Economic Report Oct.-Dec. 1976, Central Statistical Office, Port of Spain.
TRINIDAD and Tobago, Government of. Review of the economy, 1976. Ministry of Finance, Dec. 1976, 112 p.
TRINIDAD and Tobago, Government of. White Paper on National Institute of Higher Education (Research, Science and Technology), Governmente Printery, 1977, 39 p.
UNESCO. Conference of Ministers of Education and Ministers responsible for Economic Planning in Latin America and the Caribbean. Buenos Aires, 20-30 June 1966.
UNESCO. Education and Development in Latin America, Bases for an Educational Policy, Santiago, Chile, 1966.
UNITED NATIONS. Demographic Yearbook 1975, New York, 1975 UNITED NATIONS. Demographic Yearbook 1976, New York, 1976. U.W.I. The Economic and Social Development of Grenada. Unpublished draft,
1968, 237 p. mimeo. U.W.I. The Development problem in St. Vincent, unpublished draft, ISER, U.W.I.
Jamaica, 1969, 153 p. mimeo. U.W.I. Report of West Indian Conference on Educational Statistics held in
Barbados, April 1966. Institute of Education, Barbados, July 1966. Various pagination. 36 p.
U.W.I. Report of assessment of the Montserrat Secondary School 1977. Institute of Education: 65 p. and appendices.
U.W.I. "Some Statistics Relating to Teachers' College Organization in the Eastern Caribbean", School of Education: Cave Hill, 1977, 6 p. mimeo.
U.W.I. Report of the Workshop on Secondary Education held at U.W.I., St. Augustine, Trinidad, August 1965. Institute of Education. 1965. 40 p. mimeo.
VERNON , P.E. Selection for secondary education in Jamaica. Government Printery, Kingston 1961. 106 p.
WALTERS , E.H. 6 Jensen, J.C. Report on Leeward Islands Teachers' Training College, Golden Grove, Antigua, 1962. 26 p. mimeo.
WILLIAMS 9 E.E. The University in the Caribbean in late 20th Century 1980-1999. PNM Publishing Company, undated, 34 p.
WILLIAMS 9 R.L. Industrial Development of Dominica, ISER, U.W.I., Jamaica 1971. 100 p.
- 127 -

Project on Development and Education in Latin America and the Caribbean
To avoid copies going astray, we ask recipients to please acknowledge receipt of each publication and to let us know immediately of any errors in the address used, or of any changes of address. price of each publication: u.s.$ 2.00 (including surface mail) Publications will be sent upon receipt of checks made out to "Naciones Unldas" for the corresponding amount.
List of publications
Educación e industrialización en la Argentina. DEALC/1.
Educación y desarrollo en Costa Rica. DEALC/2.
Financiamiento de la educación en América Latina. Una aplicación a la Argentina. DEALC/3.
Expansión educacional y estratificación social en América Latina (1960-1970). DEALC/4.
Modelos educativos en el desarrollo histórico de América Latina. DEALC/5.
Educación, imágenes y estilos de desarrollo. DEALC/6.
Educación y desarrollo en el Paraguay. La enseñanza básica. DEALC/7.
Seminario Desarrollo y educación en América Latina y el Caribe. Informe final. DEALC/8.
Industria y educación en El Salvador. DEALC/9.
Educación, lengua y marginalidad rural en el Perú. DEALC/10.
Educación para el desarrollo rural en América Latina. DEALC/11.
La escuela en áreas rurales modernas. DEALC/12. (in press)
Bibliografía sobre educación y desarrollo en América Latina y el Caribe DEALC/13.
Bibliografía. Universidad y desarrollo en América Latina y el Caribe. DEALC/14.

'Púoiicadun ¡ffiMfusa por Reprografías JMA S.A.
SAN JOSE 1573 Buenas Aires

PROJECT COORDINATING OFFICE ECONOMIC COMMISSION FOR LATIN AMERICA BUENOS AIRES OFFICE
CERRITO 264 - 59 P CASILLA DE CORREO 4191 TELEPHONES 35-2947 - 2988 - 3122 - 3138 CABLE ADDRESS UNATIONS BUENOS AIRES'- REPUBLICA ARGENTINA