education and economic growth: a case …_siddique,_giles.pdf · education and economic growth: a...
TRANSCRIPT
EDUCATION AND ECONOMIC GROWTH:
A CASE STUDY OF AUSTRALIA
Sawami Matsushita
Centre for Labour Market Research The University of Western Australia
Abu Siddique
Economics programme The University of Western Australia
Margaret Giles1
UWA Business School The University of Western Australia
Abstract
The purpose of this paper is to measure the contribution of education to growth in per capita
real GDP in Australia over the period 1969-2003 using the growth accounting method. Also
estimated is the contribution of total factor productivity to growth. Over the period, per capita
real GDP in Australia increased by 1.9 percent per annum. Of this, about 31 percent was
contributed by education. This finding has important implications for policy makers in
Australia. For example, in order to promote economic growth in coming years, access to post
compulsory education, particularly vocational education and training and higher education,
for all Australians should be made easier and cheaper. This contradicts recent trends at the
federal level towards increasing the student share of education costs.
Keywords Growth Accounting, Education, Economic Growth
JEL Code(s) O47 O56 I29
1 Dr Margaret Giles, UWA Business School, The University of Western Australia, Crawley, Western Australia, 6009, Phone: 08 6488 1440, Email: [email protected]
2
I Introduction
There is a general consensus, borne out empirically and theoretically, that
improvements in human capital contribute to economic growth. These improvements, both
quantitative and qualitative, come about from education (World Bank, 2000), on-the-job
training and work experience. They have a huge impact on productivity in the labour market
(with returns to the individual (Mincer 1991 cited in Saxton 2000)), and on the economy as a
whole.
The primary purpose of this paper is to measure the contribution of education, in terms
of quantity and quality, to economic growth in Australia over the period 1969-2003 by
employing growth accounting methodology. A secondary purpose is to provide an estimate
for total factor productivity - the level of efficiency underlying the Australian economic
growth experience. The paper is divided into four further sections. The next section reviews a
selection of empirical literature in the field. Methodology and data used in the paper are
discussed in section III, which is followed by analysis of the empirical results in section IV.
As usual, section V offers some concluding remarks to end the paper.
II Education and Economic growth: An overview of selected literature
Empirical estimation of the contribution of education to economic growth dates back
to 1957 when Robert Solow published his seminal paper in The Review of Economics and
Statistics. Solow’s aim was to estimate the contribution of labour, capital and technological
change to economic growth in the United States over the period 1909-1949 using the
aggregate production function approach. He estimated the contributions of labour and capital
and attributed the unexplained part of the total growth (i.e. the residual) to technological
progress. The value of the residual, known as total factor productivity (TFP), in Solow’s
model was excessively large (87.5 percent) and this drew the attention of many economists
(for example, Kendrick (1961), Denison (1962) and Jorgenson and Griliches (1967)) to the
problem of analysing the effect of technological change (Elias 1992: 25). Jorgenson and

3
Griliches estimated TFP for the US at less than ten percent (Elias 1992: 26).
The interpretation and measurement of total factor productivity has not been precise.
As Lipsey and Carlaw (2004) point out there are many interpretations that are often
contradictory. Some argue that TFP reflects technological change (Barro, 1998a); others that it
only reflects supernormal changes in technical progress (Hulten, 2000).
Denison (1962) adopted the conventional method of decomposing the growth of
output into the growth of an array of production inputs (labour, capital, and land) together
with the growth in TFP for the US for the period of 1909-57. For labour inputs, Denison took
into account education, the gender and age composition of the labour force, hours of work and
unemployment. He measured quality improvements in labour inputs by utilizing data on the
change in the educational attainment profile of the labour force. For capital inputs, Denison
took into account, inter alia, change in the stock of capital composition by economic sector
and foreign trade (Elias, 1992: 25). His evidence demonstrated that education has a significant
impact on the quality of labour, thereby affecting long-run economic growth. That is, as more
educated people enter the labour force, the average level of educational attainment of the
workforce increases, and the more able is this workforce to implement technological
advances.
Later studies by Jorgenson, Gollop and Fraumeni (1988), Jorgenson and Fraumeni
(1992), Mankiw, Romer and Weil (1992) and Hall and Jones (1999) also estimated the
contribution of education to economic growth by utilising the growth accounting
methodology.
The contribution of education to economic growth has also been the focus of the new
growth theory which emerged in the 1980s. Two of the architects of this theory are Romer and
Lucas. Romer (1986) argued that investing in education, training and research and other forms
of human capital may help overcome the problem of diminishing returns and thus assist in
achieving long-run economic growth. He further asserts that the acquisition of human
4
knowledge, which has increasing marginal productivity, should be included as a part of factor
inputs for production. His model, based on the analysis of the role of research and
development (R & D) in long run growth, placed emphasis on incentives to generate new
ideas by firms. According to Temple (2001: 4), Romer’s framework “opens up the possibility
that even a one-off increase in the stock of human capital will raise the growth rate
indefinitely”. Lucas (1988) argued that the level of output is a function of the stock of human
capital, where human capital refers to knowledge, obtained through education, rather than
skills. In other words, the Lucas model is based on knowledge accumulation as in the Romer’s
model, but in a more direct way. His model made it possible to take into account the policy
interventions and nature of institutions that influence the long run economic growth rate
(Dowrick, 2003).
Temple (2001) mentioned that there are three reasons why the model of new growth
theory is so important. First, it highlights education as a central determinant of economic
growth. Second, it shows that even a laissez faire approach to the acquisition of human capital
can stimulate growth. Finally, it exposes opportunities for policymakers to target growth by
subsidising education and by providing tax and other incentives to private firms for their R &
D expenditure. These are the arguments used by third world countries and their sponsors - the
International Monetary Fund and the World Bank - to use donated and cheap loan funds to
increase participation in education as the first step toward economic independence.
Whilst the literature unanimously supports the inclusion of human capital in models of
economic growth, it is less clear regarding which education measures best represent its impact
on growth. Chou (2003) used average years of schooling for employed workers in his
estimation, using the growth accounting framework of the influences on economics growth in
Australia between 1960 and 2000. Other parameters in his model were research intensity
(measured by number of scientists and engineers engaged in research and development) and
population growth.

5
Proxies for the quantity and quality of human capital include primary or secondary
school enrolments as a percentage of the appropriate age population (see Barro (1989) for an
example of this use.) In the main these are seen as quantity measures of human capital.
However, Clements et al. (2003) used secondary education enrolments as a measure of the
quality of human capital. Other proxies for human capital are average levels of educational
attainment and various characteristics of the labour force (Denison, 1962; Selowsky 1969;
Griliches and Mason 1972; Hu 1976; Maglen 1991; Griliches 1997; Sianesi and Van Reenen
2000; Dowrick 2002; 2003; Ok and Tergeist, 2002; and Soto, 2002)
In Australia, some attention has been paid to the measurement of real GDP and real
GDP per capita over time and the long and short run determinants of economic growth,
including education. Two examples are McLean and Pincus (1983) who used educational
attainment as a measure of living standards and Pope and Alston (1989) who studied the
effect of human capital accumulation on growth. Recently Australia's data clearing house, the
Australian Bureau of Statistics (ABS), has turned its attention to the construction of a measure
of human capital within a national accounting framework (Wei, 2004).
A number of studies have previously looked at the broad contribution of schooling to
growth in Australia, namely the effect on growth rates or levels from a one year increase in
the average level of schooling. Benhabib and Spiegel (1994) found an extra year of schooling
contributed 0.3 percentage points to long run economic growth in Australia. Estimates by
Frantzen (2000) and Dowrick and Rogers (2002) are 0.8 percentage points and between 0.2
and 0.5 percentage points, respectively.
Dowrick (2003) argued that the available evidence pointed to real GDP growth of up
to 8 percent (a transition over four decades that shifts the long run trend rate of growth
upwards) if the average level of educational attainment of the working-age Australian
population grew by one year. Dowrick’s estimate concurs with the aforementioned annual
long run growth estimates of Benhabib and Spiegel (1994), Frantzen (2000) and Dowrick and

6
Rogers (2002), together with growth in earnings estimates by Miller, Mulvey and Martin
(1995) and Preston (1997) of 4.5 to 8.3 percent and 12.8 to 63.0 percent respectively.
No studies of long run economic growth in Australia have examined the influence of
schooling beyond the aggregate level. Neither have there been growth studies examining
quality aspects of schooling. The time is ripe for both of these issues to be addressed.
III Methodology and Data
Methodology
The growth accounting methodology is employed in this study to examine the relative
contribution of education to the promotion of economic growth in Australia. This enables the
decomposition of annual economic growth into components associated with the change in
factor inputs and total factor productivity in a less restrictive framework (Barro 1998a).
Although we follow Denison’s general approach in this study, we have utilised econometric
techniques to estimate the partial elasticities that reflect the contribution of education (and
other factors) to economic growth in Australia over the period 1969 to 2003.
The basic formula of the growth accounting method starts with the neoclassical
production function as given below:
Yt = F (At, Kt, Lt) (1)
where:
Yt = output level or real GDP in year t
At = level of technology in year t
Kt = level of capital in year t
Lt = level of labour in year t
In Solow's model, At is used to capture the general efficiency with which inputs are used and
reflects the effects of such things as policies and institutions (Perkins et al. 2001: 71) or what
Chou (2003: 402) refers to as "the total stock of useful ideas". It is generally referred to as
total factor productivity (TFP).
7
Determining the value of TFP for developed and developing countries has produced a
range of values. Hall and Jones (1999) estimated the contribution of TFP to economic growth
at 61 percent. Their 1988 data were compiled from 127 countries. An earlier cross country
study by Mankiw et al. (1992) using 1985 data for 195 countries found estimates of 22
percent, 23 percent and 76 percent for different country groupings - non-oil producing
countries, intermediate countries and OECD countries, respectively. Jorgenson and Fraumeni
(1992) used time series analysis to estimate TFP at 17 percent for the US for the period 1948 -
1986.
The general approach to estimating TFP requires converting equation (1) into a form
that makes it possible to isolate TFP. That is, TFP is defined as the residual once the effects of
capital and labour are determined. Perkins et al. (2001) in their appendix to Chapter 2 provide
six steps from equation (1) to equation (2). The following is a useful exposition:
GY = (WK * GK) + (WL * GL) + a (2)
where:
GY = (dY/dt)/Y = the rate of growth of real GDP
GK = (dK/dt)/K = the rate of growth of capital
GL = (dL/dt)/L = the rate of growth of the labour force
WK = the share of capital in real GDP
WL = the share of labour in real GDP
a = total factor productivity (TFP)
Equation (2) can be rearranged in terms of TFP as follows:
a = GY - (WK * GK) - (WL * GL) (3)
Thus, given values for the rates of growth in output (real GDP), capital and labour and the
shares of capital and labour in output, the efficiency with which resources in Australia are
used to promote growth can be determined.
There are a number of ways to estimate the right hand side variables in equation (3). In

8
this paper, we develop the production function described in equation (1) to include quality and
quantity aspects of both labour and capital. Then, data (logged) for Australia, 1969 to 2003,
are used in an ordinary least squares regression to estimate the output elasticities of capital
and labour. These partial elasticities can be used in lieu of the respective income shares of
these factors, WK and WL in equation (3) (under the assumption of competitive factor markets
as argued by Iwata et al. 2003: 158). Means of the annual growth rates of output and the
labour and capital variables provide the values for GY, GK and GL. Equation (3) is thus
identified and TFP can be derived. In the following, we develop the first stage of this process.
The second and final stage is shown in the empirical results section.
Returning to equation (1), capital can be disaggregated into physical capital and
human capital. As mentioned earlier, the importance of human capital in the process of
economic growth is recognised in the ‘new growth theory’ (for further details, see Mankiw,
Romer and Weil, 1992; Gemmell, 1996; Foss 1997; Barro 1998b; Agiomirgianakis, Asteriou,
and Monastiriotis, 2002; and Cohen and Soto, 2001). Education, as the primal mechanism for
acquiring human capital, can be included as an explanatory variable in the model. Equation
(1) becomes:
Yt = F (At, Pt, Et, Lt) (4)
where:
Yt = output level or real GDP in year t
At = level of technology in year t
Pt = level of physical capital in year t
Et = level of education in year t
Lt = level of labour in year t
The education and labour inputs are then disaggregated into quantity and quality
components approximating those used in the Denison study. De Meulemeester and Rochat
(1995) found a causal relationship between GDP per capita and higher education in four
9
countries but not in Australia. In their conclusion, they suggested testing for a qualitative
component of education as well as effort. The quantity of education input is measured by
three variables. First, the number of persons who enrolled full-time in secondary school is
included (primary schooling being excluded on the basis that it is compulsory). Second,
persons who were enrolled in Higher Education (HE) courses are included, and, finally,
persons who enrolled in Technical and Further Education Institution (TAFE) are included as a
proxy for all VET enrolments.
Educational quality is difficult to measure, particularly at the aggregate level. To
illustrate, student outcomes - such as test results or proportion of students achieving a
benchmark level of attainment - can be meaningfully compared across schools within a given
school system at a certain point in time. For example, average tertiary entrance scores a
particular year can be compared. However, if these averages are compared across time, there
may be little or no variation because they are constructed from the means and standard
deviations of students in the graduating cohort each year.
Pupil-teacher ratios (PTR) have often been considered a good measure of educational
quality, particularly when comparing classes or year levels. That is, the fewer students per
class, the better the average class outcomes, such as test results. Data for PTR are available
from the ABS, but these are sensitive to the mix of government, independent and catholic
schools across the country. It is generally acknowledged that private schools have lower PTR
than government schools and that the proportion of students in non-government schools in
Australia has grown over time. Thus the PTR data are not only reflecting changes in
educational outcomes across time but also changes in the mix of schools. Teasing out these
two effects from the data is beyond the scope of this paper, although it would be an interesting
study in its own right.
In this study, educational quality is measured by the private-public school enrolment
ratio. There are three reasons for this. First, the ratio is considered a measure of dissatisfaction

10
with government schools (Freebairn, Porter, & Walsh, 1987: 101). The argument is that
dissatisfaction reflects parent assessment of the worth of government schooling. That is,
parents might think that non-government schooling will enhance their children's ability to
achieve subsequent tertiary entrance. Indirectly, parents might think that non-government
schooling gives their children an edge in the labour market. Second, whilst it is recognised
that the high achievements of private school students do not necessarily translate to high
achievements at university, a recent ACER report confirms that student performance in
tertiary entrance tests differs by school sector with both independent and catholic schools
outperforming government schools. This result continues even when controlling for prior
achievement and socioeconomic background (Marks, McMillan, & Hillman, 2001). Finally,
the enrolment data for public and private schools were consistent across years and available
for the time period of our analysis.
The quantity component of labour is measured by the sum of full-time employed
persons and full-time equivalent employees who were working part-time; and the quality is
measured by labour composition in terms of occupation. It is assumed that the higher the
proportion of workers with occupational status such as managers, professionals or
administrators, so-called "white collar workers", the better the quality of the labour force.
Data utilized for this variable do not include persons who were unemployed or who were
classified as ‘not in the labour force’. Hence, when the economy experiences an increase in
the proportion of white collar workers, it generally implies that the average level of
educational attainment has risen. This then reflects an improvement in the quality of labour.
Physical capital stock level is included but is not disaggregated by quantity and quality
components since it is not the main concern for this study. The data is time series and
therefore could be analysed using some autoregressive technique. However, this is not
appropriate in this growth accounting approach as it would render the weights uninterpretable.
Instead, a time index or trend variable which acts as a proxy for a variable that affects the
11
dependent variable and is not directly observable, but is highly correlated with time, can be
used (Northwest Econometrics Ltd, 2004). This allows separation of component effects on
GDP growth from any underlying annual trend due to unobserved forces. Thus, equation (4) is
expanded to include the disaggregated capital and labour variables and to exclude the
technology (TFP) variable which has previously been defined as the residual:
Yt= F (GFCFt, FTEt, OCCUPt, HEt, SCDt, VETTAFEt, PRIVPUBt, Timetrendt) (5)
where:
Yt= output level of real GDP per capita in year t
GFCFt= level of real gross fixed capital formation in year t
FTEt= level of full-time equivalent employed persons in year t
OCCUPt= level of white collar employment in year t
HEt= amount of people enrolled in higher education in year t
SCDt= amount of people enrolled in secondary school in year t
VETTAFEt= amount of people enrolled in Vocational Education and Training and/or
Technical and Further Education in year t
PRIVPUBt= private-public school ratio in year t
Timetrendt = 1 for t = 1969
or the equation can be written as the following:
Yt=β0+β1GFCFt+β2FTEt+β3OCCUPt+β4HEt+β5SCDt+Β6VETTAFEt+β7PRIVPUBt
+β8Timetrendt +εt (6)
Since the focus of this study is to determine partial elasticities for economic growth
with respect to relevant factor inputs (WK and WL, in equation (3)), the log-linear functional
form is appropriate2. This is shown below:
lnYt=β0+β1lnGFCFt+β2lnFTEt+β3lnOCCUPt+β4lnHEt+β5lnSCDt+Β6lnVETTAFEt
2 The log linear specification of the model allows the estimation of partial elasticities of factors in the model by a direct application of the Ordinary Least Square (OLS) technique. See Gerking and Boyes (1980) for a similar application.
12
+β7 lnPRIVPUBt+ β8Timetrendt +εt (7)
where:
lnYt= natural logarithm of output level of real GDP per capita in year t
lnGFCFt= natural logarithm of level of real gross fixed capital formation in year t
lnFTEt= natural logarithm of level of full-time equivalent employed persons in year t
lnOCCUPt= natural logarithm of level of white collar employment in year t
lnHEt= natural logarithm of number of people enrolled in higher education in year t
lnSCDt= natural logarithm of number of people enrolled in secondary school in year t
lnVETTAFEt= natural logarithm of number of people enrolled in Vocational Education and
Training and Technical and Further Education in year t
lnPRIVPUBt= natural logarithm of private-public school ratio in year t
Β0 is the intercept in this model and the slope coefficients, β1……β8, measure the partial
elasticities of economic growth with respect to each explanatory variable.
Data
The data for this study are listed in the Appendix.
IV Empirical Results
Table 1 shows the minimum, maximum, mean, and standard deviation for the annual
growth rate for each variable. The growth rate rather than the values used in the regression
analysis are described here for consistency with the growth accounting framework. Real GDP
per capita grew by an average of 1.90 percent p.a. between 1969 and 2003, with the best
performance between 1969 and 1970 and the 1982/83 recession giving the poorest economic
growth rate of around -4 percent. Average GFCF performance was 1 percent p.a., with
strongest growth between 2002 and 2003 and poorest performance in the recession of
1982/83.
The rate of growth of employment averaged 1.68 percent p.a. over the period 1969 to
2003 with strong growth in 1977/78 and shrinkage between 1979 and 1980. White collar

13
employment has grown by over 3 percent p.a., with strongest growth in 1989/90 and
contraction in 1974/75. Enrolments at the secondary level, in VET and in higher education
grew 1.07 percent, 4.34 percent and 7.40 percent p.a. on average. VET enrolment growth
showed considerable volatility, however, with strongest growth in 1973/74 of 42.38 percent
and declining enrolments of 27.60 percent in 1980/81 (both possibly attributed to definitional
changes but this could not be verified). Upheavals in the tertiary education sector in the late
1980s, namely the expansion of new universities, are apparent in the growth of higher
education enrolments of 40.40 percent between 1986 and 1987 (under the Dawkin reforms).
Weakest growth (-1.32 percent) in higher education enrolments occurred in 1979/80.
The ratio of private to public schools has shown periods of decline (1969/70 to
1972/73 and 1974/75 to 1975/76) and strong growth (1979/80 to 1989/90). Growth after that
period ranged from 0.04 percent in 1990/91 to 2.52 percent in 1995/96.
Insert Table 1 here
As mentioned earlier, we have employed the log linear functional form of the
regression model in this study - equation (5) - and the parameters, β0,…,β8, are estimated
using the Ordinary Least Square (OLS) technique. The coefficients, βi (i = 1 … 8), give the
partial elasticities of GDP per capita with respect to each variable, that is, the percentage
change in GDP per capita for a given percentage change in the variable concerned, holding all
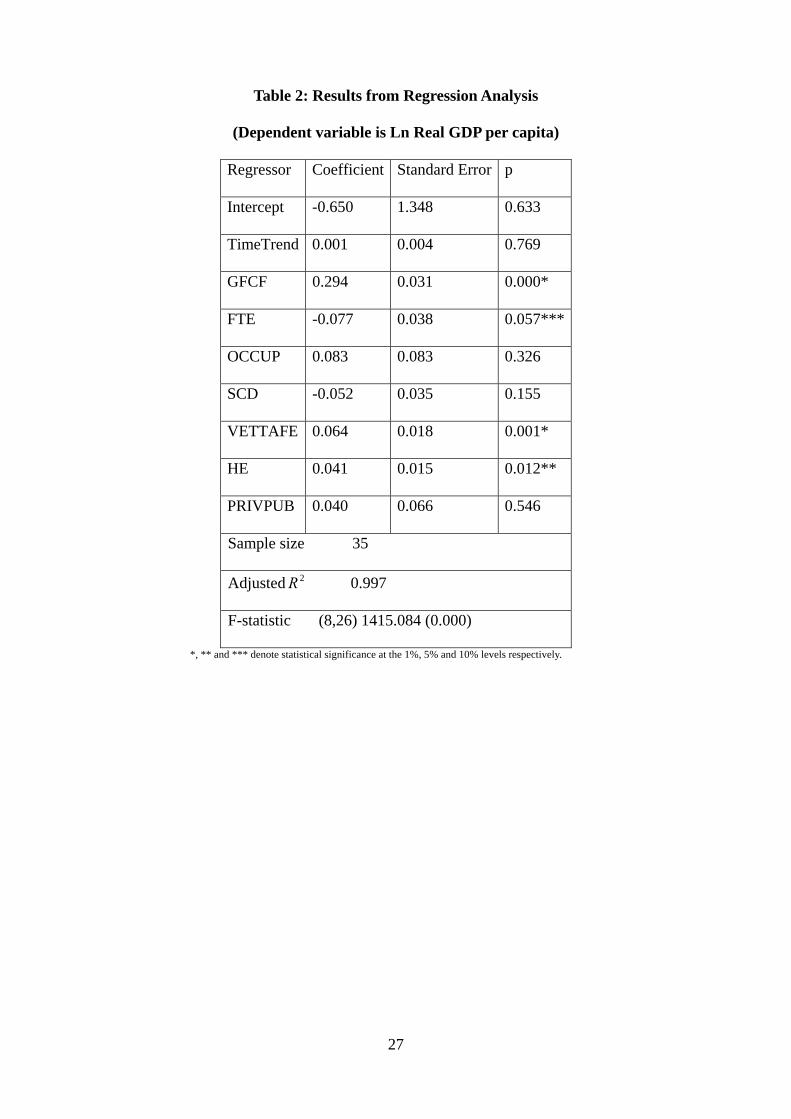
other factors constant. Table 2 shows the empirical results from the estimation of equation (5).
Interpretation of these results is cognisant of both magnitude and significance (see
McCloskey, 2003).
Insert Table 2 here
Table 2 shows that the GFCF and VETTAFE variables are significant at the one
percent level. The elasticity of real GDP per capita with respect to GFCF is 0.294 percent,
suggesting that if total real gross fixed capital formation goes up by one percent, on average
the level of real GDP per capita goes up by 0.294 percent. The elasticity of real GDP per

14
capita with respect to VETTAFE enrolments is about 0.064 percent, suggesting that if the
level of enrolments in vocational education and training in TAFE institutions increases by one
percent, on average, the level of real GDP per capita increases by 0.064 percent.
Coefficients of the FTE and HE variables are statistically significant at the ten and five
percent levels respectively. Table 2 shows that if the level of full-time equivalent employed
persons increases by one percent, on average the level of real GDP per capita decreases by
0.077 percent. This result is somewhat surprising. However, given that it is the quality and not
necessarily the quantity of labour that is important for growth, this negative effect is less
troublesome. Moreover, the contribution of an expanding workforce to productivity may be
confounded by such influences as discouraged workers returning to the workforce (see
Quiggin (1996)). Gittens refers to the phenomenon of employment growth without economic
growth. (2004).
An increase in higher education enrolments of 1 percent will increase real GDP per
capita by 0.041 percent. This result supports the continued (and even increased) funding of
the university sector.
The coefficient of the SCD variable shows that, if the level of enrolment in secondary
schools increases by one percent, then, on average, the level of real GDP per capita decreases
by 0.052 percent. Some of the increase in secondary enrolments is due to population effects
and some is due to higher retention rates into later years of secondary schooling. The negative
result is not unexpected as school enrolments act as a proxy for the labour force dependency
ratio. That is, as students choose, or have their parents choose for them, to stay at school for
longer, they are effectively delaying their entrance to the labour market and their concomitant
contribution to productivity and economic growth. However, as demonstrated later, although
rising secondary enrolments might dampen growth in the short to medium term, they benefit
economic growth in the long term through the improvement in the quality of labour.
The coefficient of the time trend variable is negligible in magnitude and statistically
15
insignificant. Finally, the constant term in the estimated equation accounted for -0.650
percentage points and was statistically insignificant. Diagnostic tests for heteroskedasticity,
serial correlation and functional form had results that were statistically insignificant.
The econometric results can now be used to estimate total factor productivity (TFP).
However, equation (3) needs to be expanded to recognise the disaggregation of the capital
variable into physical and human capital components and the labour variable into quality and
quantity components. Hence we can write:
∑∑==
−−=2
1
4
1)()(
jLjLj
iKiKiY GWGWGa (8)
where i represents the five components of physical and human capital (GFCF, SCD,
VETTAFE, HE and PRIVPUB) and j represents the quantity and quality components of
labour (FTE and OCCUP). Substituting in the mean and share values gives the following:
a = 1.90 - 0.8906 - 0.1304 = 0.8790 (9)
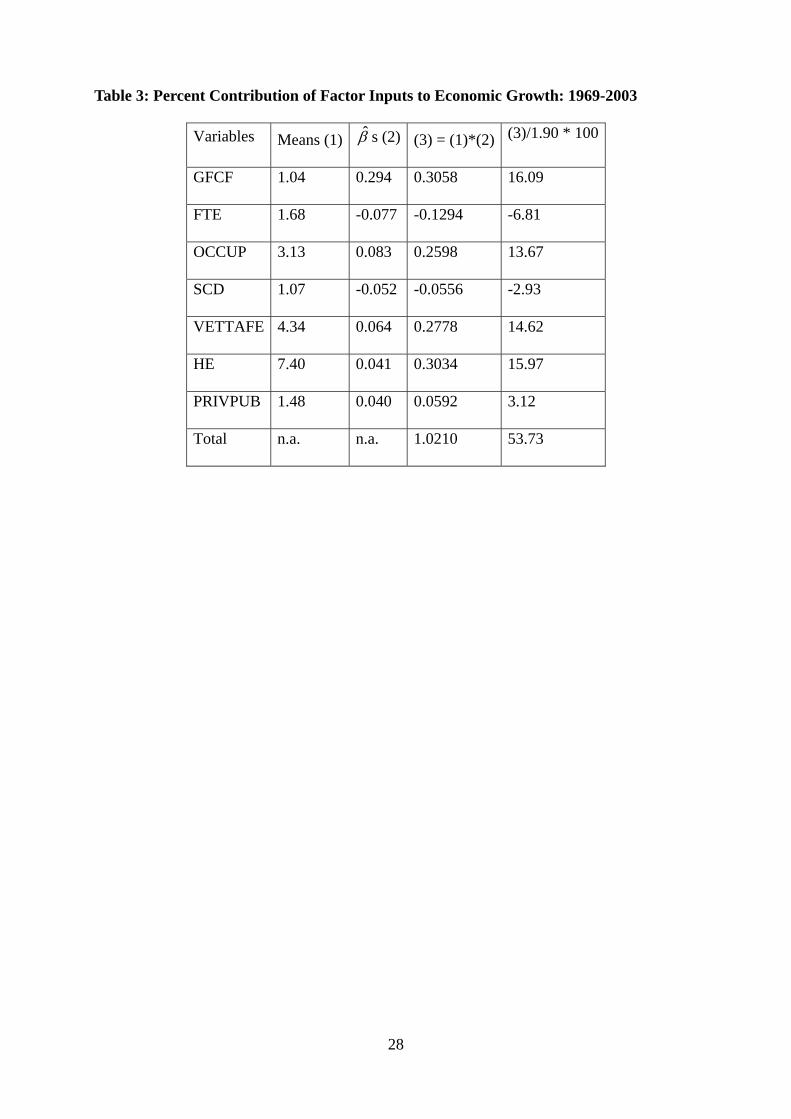
Insert Table 3 here
Thus, human and physical capital growth appear to contribute about 47 percent
(0.8906/1.90*100) of growth in real GDP per capita; labour growth contributes less than 7
percent and TFP contributes about 46 percent. This finding is more or less consistent with
previous studies. Hall and Jones (1999) conducted a cross-sectional analysis by including 127
countries in 1988. Their study found that the TFP accounted for sixty-one percent of
economic growth. Mankiw, Romer and Weil (1992), in their cross-country analysis in 1985,
estimated TFP at twenty-two percent. Chou (2003) found annual TFP growth for Australia
between 1960 and 2000 of 0.82 or 48 percent of economic growth. In the current study,
physical capital alone (GFCF) contributes 16.1 percent to real GDP per capita growth in
Australia for the period 1969-2003.
Including the human capital variables with physical capital, however, appears to
undervalue the contribution of labour to economic growth. If all the education variables

16
(SCD, VETTAFE, HE and PRIVPUB) are included with the labour quantity (FTE) and
quality (OCCUP) variables, the contributions of labour and capital to output growth are 38
percent (1.0210-0.3058)/1.90*100 = 37.64%) and 16 percent (0.3058/1.90*100 = 16.09 %)
respectively.
At the disaggregate level, this study shows that labour quality (OCCUP) contributes to
13.67 percent of economic growth. Earlier studies measuring the contribution of improvement
in labour quality to economic growth also found similar results. For example, Jorgenson,
Gollop and Fraumeni (1988) found that labour quality accounted for about one tenth of the
growth in value added in the US during the period 1948 to 1979. They measured
improvements in the quality of labour in terms of changes in the composition of total hours
worked by age, sex, education, and occupation. Another study by Jorgenson and Fraumeni
(1992) found that twenty-six percent of the 2.93 percent per year economic growth has been
due to improvements in labour quality in the US for the period 1948-86.
In the current study, growth in enrolments in higher education and vocational
education and training contributed 16.0 percent and 14.6 percent to economic growth,
respectively. The contribution of the white collar workers is 13.7 percent of total real GDP per
capita growth. These results confirm the importance of having more qualified persons in
order to achieve higher economic growth.
IV Conclusions and Policy Implications
This study has estimated the contribution of education to economic growth in
Australia for the period of 1969-2003 by employing the growth accounting method. The
findings of the study suggest that, excluding enrolments in secondary education, all other
components of education in terms of quantity and quality have favourable impacts on
economic growth. Importantly, enrolments in VET/TAFE and higher education are
fundamental to long term economic growth. About 16.0 percent of annual growth of real GDP
per capita is contributed by higher education enrolments and about 14.6 percent is contributed
17
by VET/TAFE enrolments. This has important implications for the subsidisation of further
education in Australia, namely the proportion of university costs to be passed to students in
the form of HECS and the level of fees charged by TAFEs.
The contribution of secondary enrolments to economic growth has been shown in this
study to be negative. This is not surprising as upper secondary students are increasingly
choosing schooling instead of entering the labour market. The latter path would enable them
to directly contribute to national product. However, remaining in school (whether public or
private) requires government funding to a greater or lesser extent and delays entry to the
labour market. The resulting increase in the labour force dependency ratio has been shown to
be correlated with, at best, slower economic growth (Austen and Giles, 2003, have a useful
summary of the key issues related to dependency ratios). This finding appears to reject
policies aimed at improving secondary school retention rates. However there is an upside to
this story. That is, the growth in secondary enrolments may be reflecting higher retention of
students into pre-tertiary courses which, themselves, have large positive influences on growth.
The net outcome of the two opposing influences on growth is therefore positive and large.
The quality of education, measured in this study by the ratio of private and public
school enrolments, accounts for about 3.1 percent of growth in real GDP per capita. Further
work is required on developing this measure and isolating the true improvements in
educational outcomes from increases resulting from structural change in the sector.
There is a positive relationship between growth in the quality of labour force,
measured by number of people who are classified as white collar workers, and real GDP per
capita. About 13.7 percent of annual growth in real GDP per capita is contributed by the
quality of the labour force. In other words, an increased number of highly educated workers in
an economy increases the supply of skilled labour, which is more productive and thus
promotes economic growth. This confirms that higher education and VET/TAFE programs are
relatively important determinants of economic growth in Australia.

18
From a funding point of view, the new millenium is seeing an emphasis on cost
effectiveness that pervades all levels of education. The Nelson Review in 2003 will see
further changes in the higher education sector in terms of fees, courses and research. For
example, new funding of 2.6 billion is allocated for university over the next five years. This
new funding includes more than 34,000 new universities places (DEST 2004). VET delivery
will continue to target marginalised groups and a changing industrial focus. Government will
fund 7,500 new VET places for older workers, parents returning to work and people with
disability, worth $20.5 million, to improve their employment prospects and re-enter the labour
market. In addition, schools are under pressure to deliver good outcomes at least cost.
The impact of changes in funding rules over the last few decades on enrolments in
each sector has yet to be fully determined. The countervailing forces of education-for-growth
and value-for-money in educational provision form polarities that, without care, could
undermine the advances that enrolment growth has thus far produced.
Given increased enrolments in both higher education and VET/TAFE, the government
should reconsider its position regarding its funding principle for higher education. Recent
increases in public funding for VET and TAFE have been steps in the right direction.
However, more recent attempts to increase the student price of higher education (HECS) may
severely handicap a large number of students waiting to enrol in higher education. The exact
impact on enrolments will depend on the elasticity of demand for higher education. This
should not be too high given that HECS repayments occur after graduates commence work
and earn income above a de minimis threshold (A$35,000 in 2004 rising to A$36,184 in 2005-
06). Nonetheless, if higher education enrolments are cut back, the impact on growth could be
as large as 0.274 percentage points or 15.97 percent of the 1.90 percent annual growth of GDP
per capita. Such slower growth in the uncertain world of the first decade of the 21st century
may hinder the achievement of Australia’s long term growth plans.
19
REFERENCES
Austen, S., & Giles, M. (2003). "The Likely Effects of Ageing on Women's Involvement in the Paid
Workforce", Australian Bulletin of Labour, 29(3): 253-273.
Australian Bureau of Statistics, (1969-2004). Year Book Australia. Canberra: ABS.
Australian Bureau of Statistics, (2001), Australian Standard Classification of Occupations 2nd ed, Cat.
No. 1220.0. Canberra: ABS.
Australian Bureau of Statistics, (2003), Australian System of National Accounts, Cat. No. 5204.0.
Canberra: ABS.
Australian Bureau of Statistics, (2003), Population by Age and Sex, Australian States and Territories,
Cat. No. 3201.0. Canberra: ABS.
Australian Bureau of Statistics, (2004), Labour Force, Australia, Detailed - Electronic Delivery,
Monthly, Cat. No. 6291.0.55.001. Canberra: ABS.
Agiomirgianakis, G.., Asteriou, D. and Monastiriotis, V., (2002), “Human Capital and Economic
Growth Revisited: A Dynamic Panel Data Study”, International Advances in Economic
Research (IAER), 8: 177-187.
Barro, R., (1989), “Economic Growth in a Cross-Section of Countries”, National Bureau of Economic
Research Working Paper, 3120.
Barro, R. J., (1998a), “Notes of Growth Accounting”, National Bureau of Economic Research Working
Paper, 6654.
Barro, R. J., (1998b), “Human Capital and Growth in Cross-Country Regressions”, Economic Growth
- Literature Surveys. Downloadable at http://hassler-j.iies.su.se/conferences/papers/barro.pdf
(January 18, 2006)
Benhabib, J. and Spiegel, M., (1994), “The Role of Human Capital in Economic Development:
Evidence from Aggregate Cross-Country Data”, Journal of Monetary Economics, 34(2): 143-
173.
Chou, Y.K., (2003), “The Australian Growth Experience, 1960-2000: Human Capital, R&D or Steady-
State Growth?”, The Australian Economic Review, 36(4): 397-414.
Clements B., Bhattacharya, R. and Nguyen, T., (2003), “External Debt, Public Investment, and Growth

20
in Low-Income Countries”, International Monetary Fund Working Paper, 249: 1-24.
Cohen, D. and Soto, M., (2001), “Growth and Human Capital: Good Data, Good Result”,
Organisation for Economic Co-operation and Development Center Technical Paper, 179.
De Meulemeester, J-L. and Rochat, D., (1995), “A Causality Analysis of the Link Between Higher
Education and Economic Development”, Economics of Education Review, 14: 351-361.
Denison, E.F., (1962), The Sources of Economic Growth in the United States and the Alternatives
Before Us. New York: Committee for Economic Development.
Department of Education, Science and Training (DEST), (2000), Higher Education Students Time
Series Tables, 2000: Selected Higher Education Statistics. Canberra: DEST.
Department of Education, Science and Training (DEST), (2004), Budget Information 2004 at a
Glance. Canberra: DEST.
Dowrick, S., (2002), “The Contribution of Innovation and Education to Economic Growth”. Paper
presented at the Melbourne Institute Economic and Social Outlook Conference: Towards
Opportunity and Prosperity. Melbourne: Melbourne Institute. Downloadable at
http://melbourneinstitute.com/conf/prevconf/top2002/pdffiles/DowrickSteve2A.pdf (January
18, 2006)
Dowrick, S., (2003), “Ideas and Education: Level Or Growth Effects?”, National Bureau of Economic
Research Working Paper, 9709.
Dowrick, S. and Rogers, M., (2002), “Classical and Technological Convergence Beyond the Solow-
Swan Growth Model”, Oxford Economic Papers, 54: 369 - 385.
Elias, V.J., (1992), Sources of Growth: a Study of Seven Latin American Economies. San Francisco
California: ICS Press.
Foss, N.J., (1997), “The New Growth Theory: Some Intellectual Growth Accounting”, Department of
Industrial Economics and Strategy Working Paper, 97-2.
Frantzen, D., (2000), “R&D, Human Capital and International Technology Spillovers: A Cross-
Country Analysis”, Scandinavian Journal of Economics, 102(1): 57-75.
Gemmell, N., (1996), “Evaluating the Impacts of Human Capital Stocks and Accumulation on
Economic Growth: Some New Evidence”, Oxford Bulletin of Economics and Statistics, 58: 9-
21
28.
Gerking, S. D., & Boyes, W. J. (1980). "The role of Functional Form in Estimating Elasticities of
Housing Expenditures", Southern Economic Journal, 47(2): 287 - 302.
Gittens, R., (2004), "Looks and Smells Like a Slowdown, But …", Sydney Morning Herald, December
5.
Griliches, Z., (1997), “Education, Human Capital, and Growth: A Personal Perspective”, Journal of
Labor Economics, 15: 330-344.
Griliches, Z. and Mason, W. M., (1972), “Education, Income and Ability”, The Journal of Political
Economy, 80: 74-103.
Hall, E. and Jones, C. I., (1999), “Why Do Some Countries Produce So Much More Output per
Worker than Others?”, The Quarterly Journal of Economics, 114: 83-116.
Hu, S.C., (1976), “Education and Economic Growth”, The Review Of Economic Studies, 43: 509-518.
Hulten, C.R., (1979), “Total Factor Productivity: A Short Biography”, National Bureau of Economic
Research Working Paper, 7471.
International Labor Office (ILO), (2004), “Database on Labour Statistics LABORSTA”, Geneva: ILO.
Downloadable at http://laborsta.ilo.org/ (January 18, 2006)
Iwata, S., Khan, M.S. and Murao, H., (2003), “Sources of Economic Growth in East Asia: A
Nonparametric Assessment”, International Monetary Fund Staff Papers, 50(2): 157-177.
Jorgenson, D.W. and Fraumeni, B., (1992), “Investment in Education and US Economic Growth”, The
Scandinavian Journal of Economics, 94: 51-70.
Jorgenson, D.W. and Griliches, Z., (1967), “The Explanation of Productivity Change”, The Review of
Economic Studies, 34: 249-280.
Jorgenson, D.W., Gollop, F. and Fraumeni, B., (1988), Productivity and U.S. Economic Growth.
Amsterdam: North-Holland.
Kendrick, J.W., (1961), Productivity Trends in the United States. (Princeton, New Jersey: Princeton
University Press.
Lipsey, R.G. and Carlaw, K.I., (2004), “Total Factor Productivity and the Measurement of
Technological Change”, Canadian Journal of Economics, 37(4):1118-1150.
22
Lucas, R.E., (1988), “On the Mechanism of Economic Development”, Journal of Monetary
Economics, 22: 3-42.
Maglen, L.R., (1991), “The Impact of Education Expansion on the Distribution of Earnings in
Australia”, Australian Bulletin of Labor, 17: 132-159.
Mankiw. N.G., Romer, D. and Weil, D.N., (1992), “A Contribution to the Empirics of Economic
Growth”, Quarterly Journal of Economics, 107: 407-437.
McCloskey, D., (2003), “Statistical Significance –Getting Back to Seeking Oomph”. Paper presented
at the 32nd Conference of Economists, Canberra: Economics Society of Australia.
Downloadable at http://www.ecosoc.org.au/docs/Program%20Abstracts%202003.pdf (January
18, 2006)
McLean, I.W., (2004), “Australian Economic Growth in Historical Perspective”, The Economic
Record, 80(250): 330-345.
McLean, I.W., and Pincus, J.J., (1983), “Did Australian Living Standards Stagnate Between 1890 and
1940? ”, Journal of Economic History, 43, pp. 193-202.
Miller, P.W., Mulvey, C. and Martin, N., (1995), “What do Twin Studies Reveal about the Economic
Returns to Education? A Comparison of Australian and US Findings”, American Economic
Review, 85(3): 586-599.
Mincer, J., (1991), “Education and Unemployment”, National Bureau of Economic Research Working
Paper, 3838.
National Centre for Vocational Education Research (NCVER), (2004), Australian Vocational
Education and Training Statistics, Adelaide, South Australia. Downloadable at
www.ncver.edu.au/statistic/21052.html (January 18, 2006)
Nelson, B., (2003), “Our Universities: Backing Australia's Future”, Canberra: Commonwealth of
Australia.
Northwest Econometrics Ltd, (2004), “SHAZAM Econometrics Software”. Downloadable at
http://shazam.econ.ubc.ca/intro/trend.htm (January 18, 2006)
Ok, W. and Tergeist, P., (2002), “Supporting Economic Growth Through Continuous Education and
Training-Some Preliminary Results”, Paper presented at OECD Meeting Of National
23
Economic Research Organisations: Investment in Human Capital, Paris: OECD.
Downloadable at www.oecd.org/dataoecd/36/46/34949858.PDF (January 18, 2006)
Perkins, D.H., Radelet, S., Snodgrass, D.R., Roemer, M. and Gillis, M., (2001), “Economics of
Development”. Fifth Edition, New York: WW Norton and Co.
Pope, D., and Alston, L., (1989), “Australia's Greatest Asset: Human Resources in the Nineteenth and
Twentieth Centuries”. Annandale: The Federation Press.
Preston, A., (1997), “Where Are We Now With Human Capital Theory in Australia? ”, The Economic
Record, 73(220): 51-78.
Quiggin J., (1996), “Jobless Rate Still on Track”, Australian Financial Review, September 30.
Romer, P.M., (1986), “Increasing Return and Long-Run Growth”, Journal of Political Economy, 94:
1002-1037.
Saxton, J., (2000), “Investment in Education: Private and Public Returns”, U.S. Congress Joint
Economic Committee. Downloadable at http://www.house.gov/jec/educ.pdf (January 18,
2006)
Selowsky, M., (1969), “On the Measurement of Education’s Contribution to Growth” The Quarterly
Journal of Economics, 83: 449-463.
Sianesi, B. and Van Reenen, J., (2000), “The Returns to Education: a Review of the Macro-economic
Literature”, Centre for the Economics of Education Discussion Paper, 6. Downloadable at
http://cee.lse.ac.uk/cee%20dps/CEEDP06.pdf (January 18, 2006)
Solow, R.M., (1957), “Technical Change and the Aggregate Production Function”, Review of
Economics and Statistics, 39(3): 312-320.
Soto, M., (2002), “Rediscovering Education in Growth Regressions”, OECD Development Center
Technical Paper, 202.
Temple, J., (2001), “Growth Effects of Education and Social Capital in the OECD Countries”, Centre
for Economic Policy Research Discussion Paper, 2875. Downloadable at
http://www.cepr.org/pubs/dps/DP2875.asp. (January 18, 2006)
Wei, H., (2004), “Measuring Human Capital for Australia: Issues and Estimates”, Paper presented to
the Australian Labour Market Research Workshop, The University of Western Australia, Perth,
24
December 6 - 7.
World Bank, (2000), The Development Education Program (DEP), Washington, DC: The World Bank.
Downloadable at http://www.worldbank.org/depweb/english/beyond/global/chapter7.html

25
Appendix: Data sources
Variable Source1 Reference year
Real Gross Domestic Product per capita
ABS: Australian System Of National Accounts Cat. No. 5204.0
2001-02
Real Gross Fixed Capital Formation As Above 2000-01
Full-Time Equivalent Employment ABS: Labour Force, Australia, Detailed - Electronic Delivery, Monthly Cat. No. 6291.0.55.001 : Year Book Australia
1972 data used for 1969 and 1970
ABS: Year Book Australia ABS: Australian Standard Classification of Occupations
1994 data derived from 1993 and 1995
Proportion of White Collar Workers (using ASCO 2nd and 1st editions)
ILO: LABORSTA
Secondary School Enrolments2 ABS: Year Book Australia
1974 data derived from 1973 and 1975
Vocational Education and Training Enrolments2
ABS: Year Book Australia NCVER: Australian Vocational Education And Training Statistics
2002 figure used for 2003
Higher Education Enrolments2 DEST: Selected Higher Education Statistics Private-Public Ratio ABS: Year Book Australia
Notes: 1. Each of the data series appeared to suffer discontinuities. For some data, this related to sector changes. For example, in higher education, new universities were created in the late eighties from pre-existing colleges of advanced education and institutes of technology. Their combined enrolments led to an almost doubling of the size of the sector. For some of the data, reporting measures changed over time. For example, in some years, employed workers were shown as either full-time or part-time with no obvious working hours' threshold used to separate the two categories. In other years, the number employed was disaggregated in terms of working hours per week (0 hours, 1 to 15 hours, 16 to 29 hours, 30 to 34 hours, 35 to 39 hours, 40 hours, 41 to 45 hours, etc). In this case the weekly working hours' threshold for distinguishing between full- and part-time workers is flexible. In this study, 40 hours or more per week was classified as full-time for those years in which ABS reporting did not clearly specify full-time employed workers. 2. Per capita enrolments derived using ABS (2003b).

26
Table 1: Descriptive Statistics
Variables (annual percentage change) Symbols Minimum Maximum Mean
Real GDP Per Capita Y -3.96 4.79 1.90
Real Gross Fixed Capital Formation GFCF -9.91 14.45 1.04
Full-Time Equivalent Employment FTE -3.84 9.89 1.16
Proportion of White Collar Workers OCCUP -3.30 11.82 3.13
Secondary School Enrolments SCD -1.74 5.33 1.07
Vocational Education and Training
Enrolments VETTAFE -27.60 42.38 4.34
Higher Education Enrolments HE -1.32 40.40 7.40
Private-Public Ratio PRIVPUB -1.77 5.67 1.48
Time Trend TimeTrend 1 35 18
27
Table 2: Results from Regression Analysis
(Dependent variable is Ln Real GDP per capita)
Regressor Coefficient Standard Error p
Intercept -0.650 1.348 0.633
TimeTrend 0.001 0.004 0.769
GFCF 0.294 0.031 0.000*
FTE -0.077 0.038 0.057***
OCCUP 0.083 0.083 0.326
SCD -0.052 0.035 0.155
VETTAFE 0.064 0.018 0.001*
HE 0.041 0.015 0.012**
PRIVPUB 0.040 0.066 0.546
Sample size 35
Adjusted 2R 0.997
F-statistic (8,26) 1415.084 (0.000)
*, ** and *** denote statistical significance at the 1%, 5% and 10% levels respectively.
28
Table 3: Percent Contribution of Factor Inputs to Economic Growth: 1969-2003
Variables Means (1) β̂ s (2) (3) = (1)*(2) (3)/1.90 * 100
GFCF 1.04 0.294 0.3058 16.09
FTE 1.68 -0.077 -0.1294 -6.81
OCCUP 3.13 0.083 0.2598 13.67
SCD 1.07 -0.052 -0.0556 -2.93
VETTAFE 4.34 0.064 0.2778 14.62
HE 7.40 0.041 0.3034 15.97
PRIVPUB 1.48 0.040 0.0592 3.12
Total n.a. n.a. 1.0210 53.73