education financial planning in asia - unesdoc...
TRANSCRIPT


Education Financial Planning in Asia
Implementing Medium-Term Expenditure Frameworks
Nepal
Education Financial Planning in Asia: Implementing Medium-Term Expenditure Frameworks — Nepal. Bangkok: UNESCO Bangkok, 2010.
28 pp.
1. Financial administration. 2. Education. 3. Case studies. 4. Nepal
ISBN 978-92-9223-274-0 (Electronic version)ISBN 978-92-9223-298-6 (Print version)
© UNESCO 2010
Published by theUNESCO Asia and Pacific Regional Bureau for Education920 Sukhumvit Rd., Prakanong, KlongtoeyBangkok 10110, Thailand
Printed in Thailand
The designations employed and the presentation of material throughout the publication do not imply the expression of any opinion whatsoever on the part of UNESCO concerning the legal status of any country, territory, city or area or of its authorities, or concerning its frontiers or boundaries.
EPR/09/EP/035-200

Table of Contents
Abbreviations iv
Foreword v
Acknowledgement vi
Executive Summary vii
I Education System 1Policy and Planning . . . . . . . . . . . . . . . . . . . . . . . . . . . . . . . . . . . . . 2
II Financing the Education Sector 5Budget Preparation Process . . . . . . . . . . . . . . . . . . . . . . . . . . . . . . . . 5Budget Classification . . . . . . . . . . . . . . . . . . . . . . . . . . . . . . . . . . . . 6
III Medium-Term Expenditure Framework 7Evolution of the MTEF in Nepal . . . . . . . . . . . . . . . . . . . . . . . . . . . . . . . 7Evolution of the Education MTEF . . . . . . . . . . . . . . . . . . . . . . . . . . . . . 8Strategic Planning and Prioritization . . . . . . . . . . . . . . . . . . . . . . . . . . . . 8
IV Resource Allocation 11Key Steps in Formulating the MTEF . . . . . . . . . . . . . . . . . . . . . . . . . . . . 11Pro-poor and gender budgeting . . . . . . . . . . . . . . . . . . . . . . . . . . . . . . 13Trends in Education Budgeting and Expenditure . . . . . . . . . . . . . . . . . . . . . . 13Targets and Achievements . . . . . . . . . . . . . . . . . . . . . . . . . . . . . . . . . 15Monitoring and Evaluation . . . . . . . . . . . . . . . . . . . . . . . . . . . . . . . . . 16
V Issues for Further Consideration 17
References 19
Annex 20Annex 1. Public Expenditure on Education . . . . . . . . . . . . . . . . . . . . . . . . . 20Annex 2. Prioritization of Development Expenditure . . . . . . . . . . . . . . . . . . . . 21Annex 3. Prioritization of General Administrative/Regular Expenditure . . . . . . . . . . . 24Annex 4. Examples of Priority Ranking . . . . . . . . . . . . . . . . . . . . . . . . . . . 27

iv
AbbreviationsASIP Annual Strategic Implementation PlanAWPB Annual Work Plan and BudgetCBO Community Based OrganizationCBS Central Bureau of StatisticsDDC District Development CommitteeDEO District Education OfficeDOE Department of EducationEFA Education for AllE-MTEF Education Medium-Term Expenditure FrameworkEMIS Education Management Information SystemGDP Gross Domestic ProductGER Gross Enrolment RateGON Government of NepalMDG Millennium Development GoalsMOES Ministry of Education and SportsMOF Ministry of FinanceMTEF Medium-Term Expenditure FrameworkNPC National Planning CommissionNRs. Nepali RupeesPEM Public Expenditure ManagementPERC Public Expenditure Review CommissionPMAS Poverty Monitoring and Analysis SystemPRS Priority Ranking ScorePRSP Poverty Reduction Strategy PaperSESP Secondary Education Support ProgrammeSIP School Improvement PlanSWAp Sector-wide ApproachTVE Technical and Vocational EducationUGC University Grants CommissionUNESCO United Nations Educational, Scientific and Cultural Organization VDC Village Development Committee
v
ForewordEducation Financial Planning in Asia: Implementing Medium-Term Expenditure Frameworks - Nepal is part of a series of in-depth studies on education financial planning in Asia, commissioned by the UNESCO Asia and Pacific Regional Bureau for Education - UNESCO Bangkok in 2008. The studies initially covered five countries, including Mongolia, Nepal, the Republic of Korea, Thailand and Viet Nam. Additional studies are now underway in Cambodia, Indonesia, Singapore and Tajikistan.
Medium-term expenditure frameworks (MTEFs) have been used in Organization for Economic Cooperation and Development (OECD) countries for a while, but their history of use in developing countries is more recent, having started in the late 1990s. Over the past decade, however, donor support provided for MTEFs aimed at strengthening the link between policy, planning and budgeting in many developing countries. Some of the best experiences in introducing and using MTEFs come from African countries. In Asia, a number of countries have introduced or are planning to introduce MTEFs, but no studies have been conducted nor any attempts made to document the experiences that Asian countries have had in using MTEFs until this research.
Thus, the country case studies commissioned by UNESCO Bangkok are an attempt to address this knowledge gap. They look at Asian experiences with MTEFs, and thereby contribute to understanding the diverse practical aspects of introducing MTEFs, in general, and for the education sector, in particular.
The case studies were written as part of UNESCO Bangkok’s clearinghouse project on education financing for the implementation of Education for All (EFA) programming in Asia and Pacific countries. The clearinghouse has been developed as an e-resource portal on the UNESCO Bangkok website. Through this portal, UNESCO shares the Organization’s long-standing experience and expertise in working with national and international partners on education policy analysis and planning. The portal also features more recent on-going work about education financing and the MTEF.
The portal has been designed for easy access by professionals who work on education planning and finance. Included in the portal is a range of practice-oriented information concerning modern planning techniques and medium-term planning and expenditure frameworks in individual country contexts. The site also contains training materials and tools, briefing notes on technical topics, updates on research and a glossary.
It is hoped that this reservoir of resources will provide Asia-Pacific countries with strengthened knowledge to use MTEF and, thereby, to contribute to effective implementation of their planned education reforms.
Gwang-Jo KimDirector
UNESCO Bangkok
vi
AcknowledgementThis publication forms part of a series studying the application of the medium-term expenditure framework in financial planning in the education sector in Asia. The studies were initiated and their implementation co-ordinated by the Education Policy and Reform (EPR) Unit at UNESCO Bangkok. The unit was able to draw on a wide range of local and international expertise available at research institutes, universities and ministries in the participating countries.
The country case study in Nepal was written by Prof. Mana Prasad Wagley (Dean, School of Education, Kathmandu University), Prof. Shreeram Lamichhane (Faculty, Kathmandu University), and Mr. Teertha Dhakal (Under Secretary, National Planning Commission). The authors wish to thank the National Planning Commission, Ministry of Education and Sports, Department of Education, and Fulbright Consultancy for their collaboration in data collection and information contained in this report.
The regional project receives a generous financial contribution from the Japanese Government.
vii
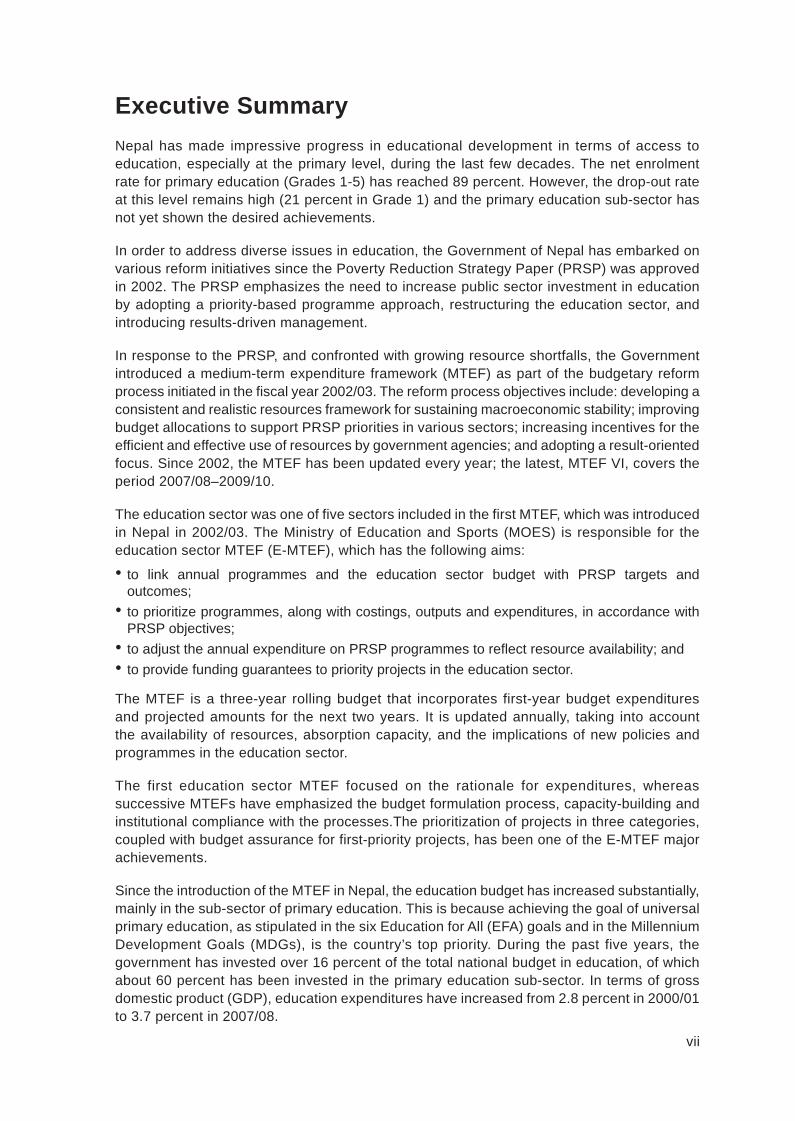
Executive SummaryNepal has made impressive progress in educational development in terms of access to education, especially at the primary level, during the last few decades. The net enrolment rate for primary education (Grades 1-5) has reached 89 percent. However, the drop-out rate at this level remains high (21 percent in Grade 1) and the primary education sub-sector has not yet shown the desired achievements.
In order to address diverse issues in education, the Government of Nepal has embarked on various reform initiatives since the Poverty Reduction Strategy Paper (PRSP) was approved in 2002. The PRSP emphasizes the need to increase public sector investment in education by adopting a priority-based programme approach, restructuring the education sector, and introducing results-driven management.
In response to the PRSP, and confronted with growing resource shortfalls, the Government introduced a medium-term expenditure framework (MTEF) as part of the budgetary reform process initiated in the fiscal year 2002/03. The reform process objectives include: developing a consistent and realistic resources framework for sustaining macroeconomic stability; improving budget allocations to support PRSP priorities in various sectors; increasing incentives for the efficient and effective use of resources by government agencies; and adopting a result-oriented focus. Since 2002, the MTEF has been updated every year; the latest, MTEF VI, covers the period 2007/08–2009/10.
The education sector was one of five sectors included in the first MTEF, which was introduced in Nepal in 2002/03. The Ministry of Education and Sports (MOES) is responsible for the education sector MTEF (E-MTEF), which has the following aims:
to link annual programmes and the education sector budget with PRSP targets and •outcomes;to prioritize programmes, along with costings, outputs and expenditures, in accordance with •PRSP objectives;to adjust the annual expenditure on PRSP programmes to reflect resource availability; and•to provide funding guarantees to priority projects in the education sector. •
The MTEF is a three-year rolling budget that incorporates first-year budget expenditures and projected amounts for the next two years. It is updated annually, taking into account the availability of resources, absorption capacity, and the implications of new policies and programmes in the education sector.
The first education sector MTEF focused on the rationale for expenditures, whereas successive MTEFs have emphasized the budget formulation process, capacity-building and institutional compliance with the processes.The prioritization of projects in three categories, coupled with budget assurance for first-priority projects, has been one of the E-MTEF major achievements.
Since the introduction of the MTEF in Nepal, the education budget has increased substantially, mainly in the sub-sector of primary education. This is because achieving the goal of universal primary education, as stipulated in the six Education for All (EFA) goals and in the Millennium Development Goals (MDGs), is the country’s top priority. During the past five years, the government has invested over 16 percent of the total national budget in education, of which about 60 percent has been invested in the primary education sub-sector. In terms of gross domestic product (GDP), education expenditures have increased from 2.8 percent in 2000/01 to 3.7 percent in 2007/08.

viii
The E-MTEF has strengthened the budget formulation, along with management and resource allocation processes, by improving the predictability of budgets in the second and third years. Projections are more needs-based and realistic, better aligned with the absorption capacity of the MOES and its agencies, and linked to sectoral strategies and outcomes.
Similarly, the MTEF approach has contributed to a shift away from traditional incremental financing and toward broad-based negotiations that enable ministries and relevant agencies to harmonize and coordinate sector-based strategies in accordance with PRSP objectives. The result has been an increase in the government’s ability to secure a sector-wide approach (SWAp) in the primary education sub-sector and a corresponding increase in donor confidence.
While the achievements of the MTEF in Nepal are significant, the introduction of the E-MTEF has identified a number of challenges that must be addressed. There is a need to strengthen the linkage between planning and budgeting in the education sector and to enhance the predictability of resources that need to be mobilized in this sector. Improvements are needed to generate more credible unit costing as part of budget formulation, as well. Internalization and institutionalization of the MTEF process in the MOES, along with a strong commitment to the MTEF across the government and its agencies, will further advance the process.

1
I Education SystemPublic education in Nepal has been transformed since the 1950s by a national initiative to promote school enrolment and build schools. The growth of primary schools has been such that about 91 percent of households have access to a primary school within a walking distance of 30 minutes (CBS, 2004). In terms of infrastructure, there are 34,000 primary schools (Grades 1–5), 12,000 lower secondary schools (Grades 6–8), 4,000 secondary schools (Grades 9–10), and 1,500 higher secondary schools (Grades 11–12). The net enrolment rate (NER) for primary education has reached 89.1 percent, and the adult literacy rate is 52 percent (NPC, 2007b). The success rate for completion of national-level testing at the secondary level has doubled in the past five years, climbing from 32 percent to 64 percent.
Inclusive policies promote and facilitate equal access to education for all. Disadvantaged children, girls and children with disabilities are encouraged to attend school. To this end, incentive programmes have been launched, including scholarships for Dalits (so-called “untouchables”) and for girls, with an additional incentive that provides cooking oil to families of girl students who live in remote areas. These programmes are motivating parents to send their children to schools. Moreover, the expansion of non-formal educational opportunities has engendered educational benefits for educationally deprived children, adolescents and adults.
However, despite these achievements and the priority accorded to the primary education sub-sector, in 2006 the drop-out rate remained very high at 14.5 percent (Grade 1). In 2005, only 78 percent of students reached Grade 5; of these, there were more boys (79 percent) than girls (75 percent). Similarly, the gross enrolment rate (GER) was only 56.7 percent at the secondary level and plummeted to 11 percent at the higher secondary level. Furthermore, as of 2006, the GER in tertiary education was only six percent (HSEB, 2005; MOES, 2007a; UIS, 2008).
In order to address education issues on both qualitative and quantitative fronts, the Government of Nepal has undertaken reform initiatives in the education sector, especially since embracing the Poverty Reduction Strategy Paper (PRSP) in 2002. This strategy promotes increased public sector investment in education through the priority-based programme approach of the medium-term expenditure framework (MTEF) process, restructuring the education sector, and introducing results-driven management.
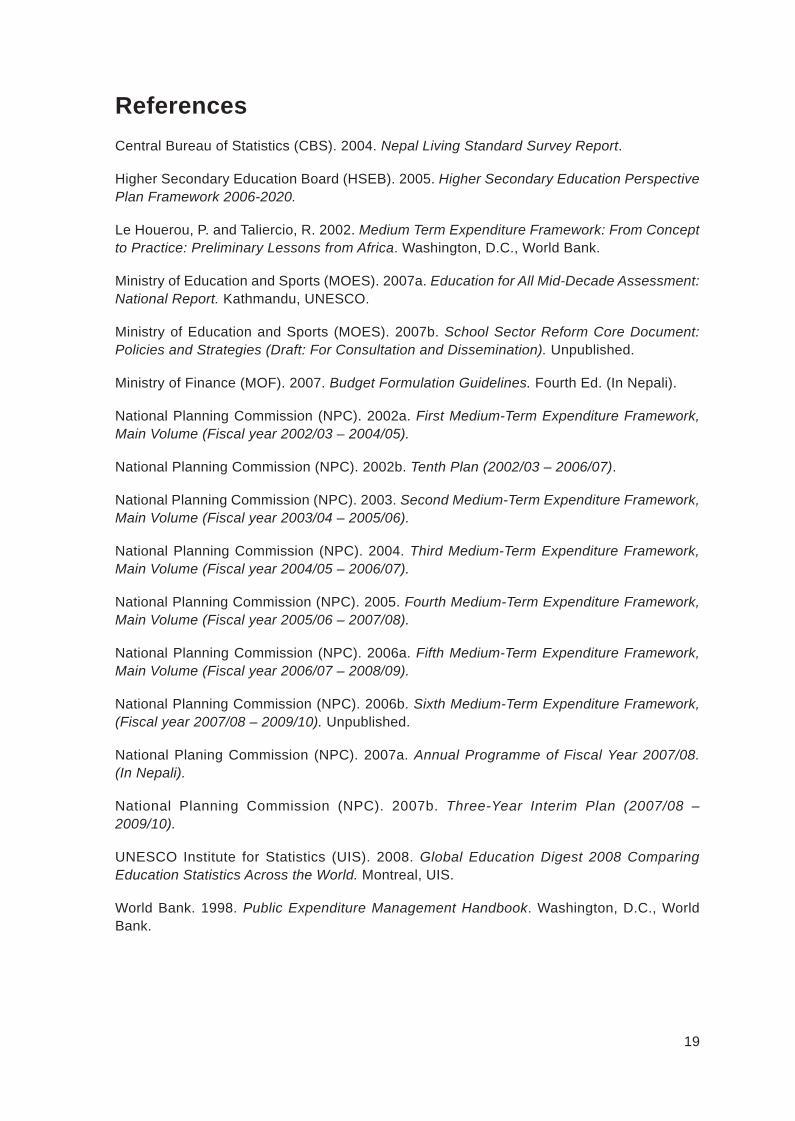
During the past five years, the Government has invested over 16 percent of the total national budget in education, of which about 60 percent in the primary sub-sector. In terms of the gross domestic product (GDP), the education share increased from 2.8 percent in 2000/01 to 3.7 percent in 2007/08, and it is now nearly triple the 1.3 percent of 1975/76 (see Annex 1). Moreover, the Government is now preparing for a restructuring process known as the School Sector Reform (2009–2012), which envisions Grades 1–8 as basic education and Grades 9–12 as secondary level. The scope of this reform also highlights major concerns about educational governance, such as accountability, responsibility, transparency, efficiency and effectiveness (MOES, 2007b).
The Nepal Government is working to strengthen the quality of education by transferring school management to local communities, thereby cultivating feelings of ownership among the local stakeholders. School management committees are starting to recruit teachers; until recently, teacher recruitment had been an entirely centralized responsibility. Mandatory teacher training and compulsory licensing are requirements in Nepal, and steps are being taken to strengthen the Educational Management Information System (EMIS) and to advance results-based management through improved monitoring and evaluation.

2
Policy and PlanningMany different administrative levels and organizations are involved in educational management, planning, and delivery of services in Nepal. As the central-level organization responsible for the entire education sector, the MOES develops educational policies based on guidelines provided by the National Planning Commission (NPC). The Department of Education (DOE) is the programme-implementing body. Five regional offices coordinate district-level education offices and are involved in monitoring and evaluation programmes in their respective development region. A total of 75 District Education Offices (DEOs) implement, supervise and monitor the teaching and learning activities in schools with the assistance of about 1,300 resource persons throughout the country. The Curriculum Development Centre develops school curricula at the national level, using a national framework that provides guidelines for reform. Higher education programmes operate outside this system and are implemented by autonomous universities in Nepal.
National planning and development was introduced for the education sector in 1956. To date, 10 mid-term development plans have been implemented. In addition, the Local Self-Governance Act of 1995 requires district development committees (DDCs), village development committees (VDCs) and municipalities to prepare periodic plans for their respective jurisdictions. These periodic plans need to incorporate education components, and provide the basis for the development of a national-level education plan.
Thus, as shown in Table 1, educational planning in Nepal can be categorized into four levels: national, district, village or municipality, and institutional.
Table 1 Educational Planning in Nepal by Level
Level Development plan Responsible agencies
Educational plan Responsible agencies
National National medium-term periodic plan (PRSP)
NPC MOES
Education Chapter of the National Plan
EFA National Plan of Action
MOES
District District Development Plan
DDCs/DEOs District Education Plan
DEOs
Village/ Municipality
Village/Municipality Development Plan
VDCs/Municipality Village/Municipality Education Plan
Village/Municipality Education Committees
Institutional School Improvement Plan
School Management Committees
The NPC co-ordinates the national periodic plan preparation process, sets the main objectives, determines macro-level targets, total investment requirements and financing. The NPC also takes on co-ordinating roles to ensure that the sectoral plans drafted by ministries contribute to achieving macro-level objectives and targets. The respective ministries develop drafts of the sectoral plans that are finalized with the guidance of the National Development Council, and based on suggestions provided by experts of the respective sectors. These plans are inserted as specific chapters in the medium-term national plan. Finally, the line ministries start implementing the national plan once it is approved by the NPC and the Council of Ministers.

3
The NPC provides guidelines to prepare periodic plans for their respective districts. DDCs should prepare district development plans on a participatory basis by covering all development sectors, including education. District education offices (DEOs) provide information and technical services to the DDCs in this process. More than 50 districts have already developed and implemented their first periodic plans, but the mandatory provision for village and municipality development plans has been derailed by political instability and the lack of elected representatives in local bodies. As a result, most districts have no periodic plan in place. Nonetheless, the DEOs should submit their annual plans to the DDCs, which compile all sectoral plans and budgets at the district level. These integrated annual plans and budget proposals are then submitted to the NPC, as shown in Figure 1.
Figure 1 Budget Preparation Process in Education
National Planning Commission
Resource Committee
Ministry of Finance
MOES
Tripartite discussion
AWPB
Department and Central Level Education Offices
Reviewing, refinement and discussion also with donors
ASIP
DEOs
SIPs
Schools
Programmes and Projects
Guidelines for budget preparation
Budget proposals
Budget discussion and refinement points
MOES : Ministry of Education and SportsDEO : District Education OfficeSIP : School Improvement Plan
AWPB : Annual Work Plan and BudgetASIP : Annual Strategic Implementation Plan
The sectoral chapter of the national medium-term periodic plan is the main guiding document for educational plans. As the responsible authority, the MOES takes into account needs and demands, as well as international commitments, and uses data from both household surveys and EMIS. Consultations are held with professionals, policy makers, sectoral experts and development partners at the national, district and local levels. At the district level, DEOs

4
prepare district education plans. They are expected to use the guidelines issued by the DOE/MOES, to consider prioritized educational components identified in the District Development Plan, and to take into account the local needs expressed in village/municipal plans and school improvement plans (SIPs), if there are any. District education committees also provide guidance for the DEOs to develop district education plans. Because the DEOs lack the capacity to reflect on national and local interests, the plans are viewed more like a shopping list without prioritization of programmes and activities.
At the village/municipality level, education plans are not prepared (despite the mandatory provision) due to the lack of elected representatives in local bodies. At the lowest tier, schools should prepare SIPs to get the budget released, but inadequate training for school personnel means these plans are very weak and serve mainly to meet administrative requirements. Moreover, since the non-salary education budget for the school level is less than 10 percent, the SIPs have very little scope to include development activities. Thus, the process of preparing SIPs is not effective, though it ensures local participation in the development of schools.
As shown, systematic and procedural arrangements are in place to link top-down and bottom-up planning in the education sector. However, the reality of continued political instability and inadequate local representation, as well as low capacity among participants at different levels, have had a negative impact on the implementation of these arrangements.

5
II Financing the Education Sector
Budget Preparation Process Top-down and bottom-up approaches are incorporated in national budgeting in Nepal (see Figure 1). Budget ceilings and guidelines flow in a top-down direction, whereas budget proposals are prepared at local and project levels and sent in a bottom-up direction to the National Planning Commission and the Ministry of Finance (MOF). Proposals are routed through central-level departments and offices and through the MOES.
Every year, the NPC makes preliminary estimates of resources by fixing macro and sectoral ceilings for the next fiscal year, and submits its resource envelope and proposed sectoral ceilings to the Resource Committee for review. Committee members include a member of the NPC (macroeconomic portfolio), the Finance Secretary, the Governor of the Central Bank, and the Financial Comptroller General. While preparing estimates of resources, the NPC takes into account projections of the medium-term plan, national account figures provided by the Central Bureau of Statistics, and the mid-term evaluation of the current fiscal year’s budget utilization, with particular attention to revenue growth, committed and potential external resources, and the absorption capacity of different sectors.
Once approval is received from the Review Committee, the NPC invites line ministries to submit development budget proposals in line with its guidelines and sectoral budget ceilings. The MOF also issues detailed guidelines to the ministries, which must submit their budget estimates in the required format and within a stipulated time to both the NPC and MOF. Approval by the NPC is mandatory for every development project included in the budget.
The MOES co-ordinates both the top-down and bottom-up processes, sending budget preparation guidelines to its departments and central level offices that, in turn, forward guidelines and formats to DEOs and local agencies/projects. The DEOs also instruct schools on the submission of SIPs, and start to prepare Annual Strategic Implementation Plans (ASIPs) and educational programmes/projects for the next fiscal year. Budget proposals from local offices and projects go through a bottom-up process of preliminary review by higher central-level departments. In addition, past performance regarding the absorption capacity, and the realization of physical targets by DEOs and other offices are assessed at the departmental level. Because departments are not provided with a sectoral budget ceiling, they usually do not take into account resource constraints, so project targets largely guide budget estimates up to this level.
The respective departments prepare the Annual Work Plan and Budget (AWPB) based on the information received from district and local-level offices and projects. Proposals are also shared with the donor agencies that fund programmes. In the case of the sub-sector-wide approach in Education for All (EFA) and the Secondary Education Support Programme (SESP), the draft AWPB is reviewed jointly by government authorities and donor partners. With respect to EFA, a mission of the donor partners usually discusses the AWPB with government officials each May. This provides the resource base for implementing the work plan.
The MOES reviews the proposals for conformity to education sector policies, priorities and targets. The MOES also examines budget proposals prepared by departments and agencies, taking into account overall sectoral priorities, linkages with periodic plan objectives, and the guidelines and ceilings set by the NPC and the MOF. After in-depth review, budget proposals are sent up the ladder to the NPC, which then organizes tripartite discussions among its officials and representatives of the MOF and the concerned line ministries.

6
This tripartite process starts with analysis of how the budget estimates and prioritization of projects and programmes in the education sector compare to the MTEF projection for that particular fiscal year. The discussion tries to explore the extent to which annual programmes contribute to achieving macro and sectoral objectives. Similarly, the education sector budget is assessed with respect to budget ceilings. At this point, the NPC and the MOF may re-think the need to increase the ceiling in order to achieve programme targets for the forthcoming fiscal year. This may require readjusting intra-sectoral ceilings or increasing the overall ceiling amount through domestic borrowing.
The MOF holds a second round of tripartite discussions that concentrate on keeping budgets and line items, including administration and recurrent costs, within revised budget ceilings. In addition, the MOES assigns programme priority areas and develops plans to achieve targets in the education sector each year. This involves further development of implementation processes and guidelines to address responsibilities and accountability measures.
The programmes and projects thus prepared are reviewed by the NPC and prioritized when the budgetary process is synchronized within the financial package approved by the MOF. At this point, theory, practice and subsequent allocation of resources come together to constitute the budgetary process in the education sector.
The final stage involves several steps: the NPC, which is chaired by the Prime Minister, approves the next year’s fiscal budget in the presence of the Finance Minister, and the budget is then submitted to the Council of Ministers for approval. The Finance Minister submits the detailed budget, which is published by the NPC, for the approval of the Parliament. Programme implementation in the education sector starts only after parliamentary approval.
Budget ClassificationIn Nepal, the annual budget was traditionally divided into development and regular budgets. All development-related programmes were included in expenditure estimates in the development budget, whereas the regular budget was limited to general administration expenditures. In general, development budgets were higher than regular budgets, but the absence of clear-cut criteria to distinguish categories of expenses meant that development budgets often included recurrent expenditures of an administrative nature. This resulted in criticism from professionals and donors about inconsistencies in budget categories. In response, the MOF consulted with the NPC and line ministries about reforming the budget classification process.
Starting from fiscal year 2004/05, Nepal has adopted the internationally recognized budget classification of capital and recurrent spending. Capital expenditure includes investments made to create infrastructure or improve existing assets, such as the construction of new roads, as well as the procurement of machinery and equipment. Recurrent budgets include expenditures to acquire services, including rent, salaries and wages.
However, even after 2004/05, it was sometimes necessary to use the development and regular classification to facilitate review and analysis of the PRSP, which predates the budget classification reform. The current MTEF planning and budgeting process has adopted the capital and recurrent classification.

7
III Medium-Term Expenditure Framework
Evolution of the MTEF in NepalActing on the recommendations of the Public Expenditure Review Commission (PERC), which was constituted in 2000/01 to review and recommend measures to improve public resource management, the Government of Nepal introduced the MTEF as part of the budgetary reform process initiated in the fiscal year 2002/03. At that time, the MTEF was introduced as a three-year rolling process for the education sector.
The MTEF has become a core element of public expenditure management (PEM) reforms aimed at strengthening connections between planning and budgeting. It provides what is widely known as a “linking framework” that allows expenditures to be “driven by policy priorities and disciplined by budget realities” (World Bank, 1998, p. 32). MTEF has received renewed attention in the context of the Poverty Reduction Strategy Papers (PRSPs) (Houerou and Taliercio, 2002, p. 1) and as a tool to enhance co-operation between the MOF, planning agencies and line ministries over a longer period of time.
In Nepal, where the Government was confronted with growing resource shortfalls, the following objectives accompanied the introduction of the MTEF:
to develop a consistent and realistic resource framework for sustaining macroeconomic •stability;
to improve budget allocations in keeping with PRSP priorities among and within sectors; •to increase incentives for the efficient and effective use of resources by government agencies; •and
to make development budgets more results-oriented (NPC, 2006a, p. i). •The National Planning Commission (NPC) coordinates the MTEF process in Nepal. Since 2002, the MTEF has been updated every year; the latest update, the sixth MTEF, covers the fiscal period 2007/08–2009/10. The MTEF is both a top-down and bottom-up process of resource allocation, and each updated version reflects on previous implementation experiences. To date, there have been improvements in refining prioritization criteria, establishing pro-poor and gender coding for every programme and project, and assessing the contribution of development interventions with respect to the PRSP.
The first MTEF, for 2002/03–2004/05, evolved as a process of expenditure rationalization. It was prepared simultaneously with the PRSP Tenth Plan, so they complement each other. Initially, sectoral MTEFs were prepared for the core ministries responsible for agriculture, education, health, water resources and physical planning and works. These preliminary sectoral MTEFs were distributed for consultation and subsequently refined. Then, all other sectors were included in a comprehensive MTEF implementation process.
The second MTEF, for 2003/04–2005/06, further consolidated the budget formulation process. It encompassed public expenditure programmes of all line ministries and departments, covering both development and regular budgets.
The third MTEF, for 2004/05–2006/07, strengthened the linkages between goals and objectives, outputs and inputs. It also strengthened unit costing, project prioritization processes, and forecasting of government expenditure. Specifically, it focused on capacity-building within ministries to help manage the MTEF process (NPC, 2006a, pp. 9-10).
8
The fourth MTEF, for 2005/06–2007/08, attempted to establish linkages between pro-poor planning and budgeting. It started to classify the budget from pro-poor and pro-gender perspectives by coding each programme and project. In addition, efforts continued to further internalize the MTEF process across the government through capacity-building at the ministerial level.
The fifth MTEF, for 2006/07–2008/09, is even more consolidated in terms of internalization, capacity-building, database management, implementation strategy, monitoring and evaluation. It also further improved resource allocation in accordance with national priorities by streamlining existing programmes and projects and by linking them to output and unit cost estimates.
Evolution of the Education MTEF Based on the resource ceilings and guidelines of the NPC, the MOES formulates the education sector MTEF (E-MTEF). It aims to link the annual education sector programme and budget with PRSP targets and outcomes; to prioritize programmes along with costing, outputs and expenditures in accordance with PRSP objectives; to adjust the annual expenditure programmes of the PRSP to a level consistent with resource availability; and to provide funding guarantees to priority projects in the education sector.
The E-MTEF has evolved as part of the integrated national MTEF, but it also has its own distinct rationale. Recent years have seen a significant increase in public investment in education, so it was essential to rationalize expenditures to ensure the optimum returns on this investment.
The E-MTEF is revised annually, keeping the focus on programme and project prioritization, and on linkages of annual programmes and budgets to PRSP targets and outcomes. Because officials prepared the first E-MTEF concurrent to the education sector chapter of the PRSP, linkages between them have existed from the outset. Annual updates further link E-MTEFs to planning and public expenditure management (PEM) tools.
The education sector PRSP emphasizes the importance of access, quality and equity in the education system, and observes the results chain: inputs, process, outputs, outcomes and impact. Furthermore, it includes results-based targets and indicators that facilitate monitoring for outcomes on an annual basis, as well as a framework for sector-wide approaches (SWAps) to harmonize external assistance. In Nepal, EFA and the SESP are implemented as sub-sector-wide approaches.
Strategic Planning and Prioritization At the national level, the implementation of the MTEF has internalized strategic planning and budgeting processes for all sectors. The MOES prepared sectoral MTEF papers to address vision, mission statements, objectives, strategies, major programmes, intended outputs, and a prioritized list of programmes and projects. In order to support and expedite the implementation process, authorities have designed monitoring mechanisms and performance indicators. A Working Group was formed within the MOES with representation from both the Ministry and other central-level implementing agencies. The Working Group convened a workshop to formulate strategies based on participants’ experiences with the education sector business plan. Strategic planning exercises were also supported by consultants to develop linkages between MTEF sectoral outputs and the PRSP.
9
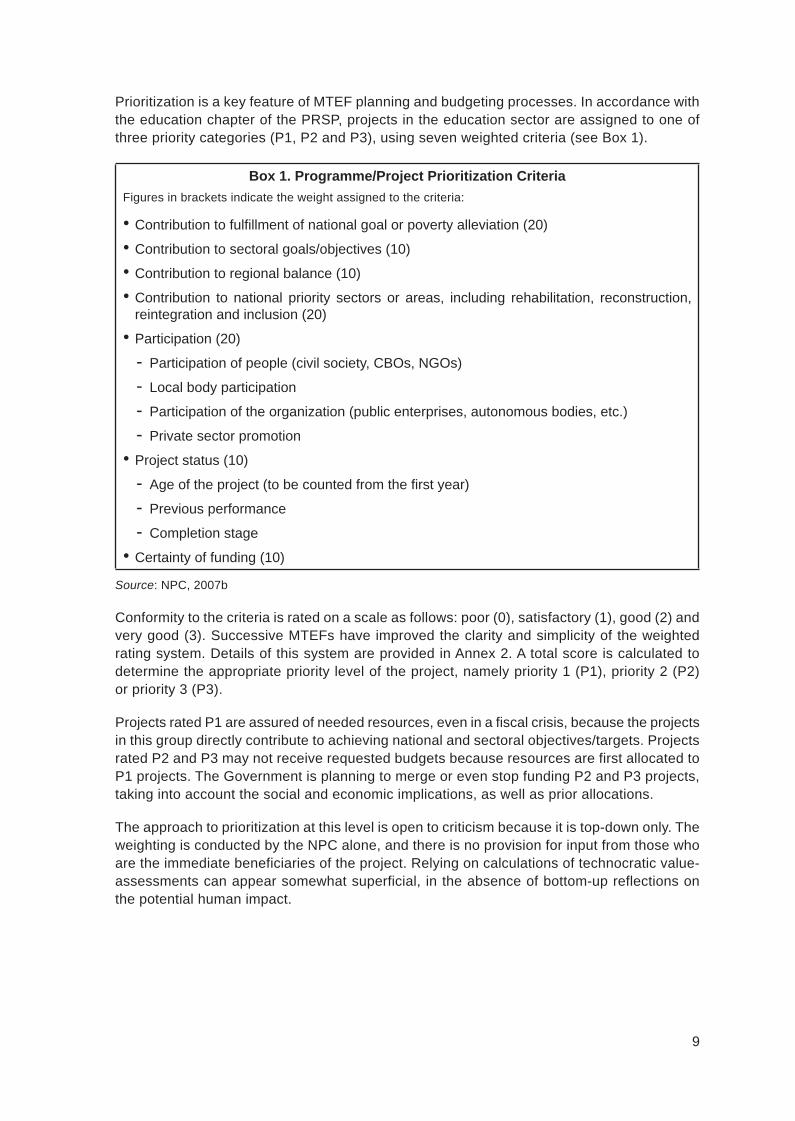
Prioritization is a key feature of MTEF planning and budgeting processes. In accordance with the education chapter of the PRSP, projects in the education sector are assigned to one of three priority categories (P1, P2 and P3), using seven weighted criteria (see Box 1).
Box 1 Programme/Project Prioritization CriteriaFigures in brackets indicate the weight assigned to the criteria:
Contribution to fulfillment of national goal or poverty alleviation (20)•Contribution to sectoral goals/objectives (10)•Contribution to regional balance (10)•Contribution to national priority sectors or areas, including rehabilitation, reconstruction, •reintegration and inclusion (20)
Participation (20)•Participation of people (civil society, CBOs, NGOs) -Local body participation -Participation of the organization (public enterprises, autonomous bodies, etc.) -Private sector promotion -
Project status (10)•Age of the project (to be counted from the first year) -Previous performance -Completion stage -
Certainty of funding (10)•Source: NPC, 2007b
Conformity to the criteria is rated on a scale as follows: poor (0), satisfactory (1), good (2) and very good (3). Successive MTEFs have improved the clarity and simplicity of the weighted rating system. Details of this system are provided in Annex 2. A total score is calculated to determine the appropriate priority level of the project, namely priority 1 (P1), priority 2 (P2) or priority 3 (P3).
Projects rated P1 are assured of needed resources, even in a fiscal crisis, because the projects in this group directly contribute to achieving national and sectoral objectives/targets. Projects rated P2 and P3 may not receive requested budgets because resources are first allocated to P1 projects. The Government is planning to merge or even stop funding P2 and P3 projects, taking into account the social and economic implications, as well as prior allocations.
The approach to prioritization at this level is open to criticism because it is top-down only. The weighting is conducted by the NPC alone, and there is no provision for input from those who are the immediate beneficiaries of the project. Relying on calculations of technocratic value-assessments can appear somewhat superficial, in the absence of bottom-up reflections on the potential human impact.

10
Starting with the fourth MTEF, the Government introduced further criteria to prioritize general administrative or regular expenditure by agency. A similar design has been adopted, using five weighted criteria and a ranking scale of 0-5 to assess contribution. Once again, the scoring determines the placement in one of three categories (see Annex 3). The five criteria are:
Involvement in providing direct services•Contribution to maintaining good governance•Contribution to raising revenue•Contribution to development works•Other contributions (human resources development, environmental conservation, regional •balance)
The programme and project prioritization by the MOES uses a Programme Priority Ranking Score (PRS) template with seven weighted criteria, as illustrated in Annex 4. This is a straightforward template, in which the programme or project is entered, along with the prioritization criteria and sub-criteria with their weightage scores. Once again, the total score achieved determines whether the priority status is P1, P2 or P3.

11
IV Resource Allocation
Key Steps in Formulating the MTEF The Government of Nepal has implemented a series of comprehensive steps for both top-down and bottom-up contributions to the preparation of a credible MTEF. The first step is to prepare an estimate of resources, both domestic and external, that may be mobilized in the three-year MTEF period. This generates a macroeconomic framework from the top down, and provides a base for the resource envelope that determines sectoral budget ceilings. National targets and guidelines are also provided to the various levels involved in the planning process.
Next, an initial expenditure framework is developed through a bottom-up process to establish linkages between PRSP objectives/targets and the resource allocation decisions that will be made. Line agencies prepare sectoral MTEF papers that contain sector-specific priorities while taking into account national targets, sectoral guidelines and ceilings. Estimates of the resources required to implement sectoral policy and embark on programme and project initiatives are put forward.
Resources are then attached to priorities and cost estimates; this finalizes the expenditure framework. This is a very important step in the MTEF formulation. It may be necessary to refine sectoral resource ceilings at this stage, based on inter-sectoral resource demands. Estimates for the first year of the MTEF become the agreed annual budget, whereas projections are made for expenditures in the second and third years of the rolling budget.
Budget estimates at each step of the planning process are based on unit costing, which is a key element of PEM. The two major approaches to unit cost estimation are: a) costing based on project-level outputs, or b) costing based on national or sectoral level outcome/impact level indicators.
Nepal’s MTEF process has adopted the project-level output approach, and unit costs are determined from the project document or project feasibility study, if available. If it is not available, input/activity costing or service/output costing methods are used. Guidelines prepared by the NPC are used by the MOES when estimating unit costs (see Box 2).
Accurate costing is one of the basic prerequisites of sound financial management, from project appraisal, selection and budget allocation through subsequent implementation, monitoring and evaluation. Project viability depends on the soundness of cost estimates, both initially and for annual programme budgets. The ultimate success or failure of a project derives from a clear understanding of cost analysis.
Many problems have arisen in the past as a result of the unrealistic costing of outputs and activities. It may also be said that unnecessary burdens have been imposed upon future generations. One of the main problems caused by inaccurate project estimates, whether these are too high or too low, is the waste of time and energy during budget formulation. In the absence of realistic costing, wrangling is inevitable.
The outcome of unsound cost estimates varies, according to the nature of the problem. For example, over-funding results in a misuse of funds, whereas under-funding may cause delays in project completion, as well as failure to achieve expected outputs or results. In all cases, unrealistic costing leads to difficulty in sound monitoring and evaluation.

12
Box 2 Basis of Project/Activity/Unit Cost Estimates The following points, in order of priority, should be taken into account to arrive at unit cost estimates related to programme/project activities and outputs:
Project activities, outputs and unit cost estimates based on detailed design, updated to 1. present price
Project activities, outputs and unit cost estimates based on feasibility study, updated to 2. present price
For those projects having no detailed design or feasibility study, the following should be 3. considered:
Historical trends of the past three years, taking note of the project’s salient features a) and associated with different situations, covering estimated and tendered amounts for development/capital costs and regular/recurrent costs
Inputs/activity-based project and unit cost estimates considering human resources, b) materials, machines/equipment, money and management, etc. (considering capital costs, with the addition of regular overhead and administrative costs)
Output/service-based cost analysis to come up with unit cost per output/service, c) followed by the project cost estimate
As costs vary under different conditions, the following factors are to be considered in 4. estimating project unit costs:
project location – regional/topographical/ecological belt•project level – central or local•project cycle – phasing/stage•complexity of the project•project type – (i) new project or service, (ii) rehabilitation, upgrading, improvement, •(iii) periodic work/service and (iv) operation and management
implementation – modality/method/process•level of output/service quality desired•results in terms of quantity desired/area coverage desired•time allocation/availability•resource budget availability•use of local resources and technology•availability of skilled and professional human resources•
Cost estimates for programmes of study/survey/planning/design/research/training can be 5. derived with the following, or a combination of these methods:
historical cost updated to present cost•input/activity costing leading to unit cost and programme cost estimate•output/services costing leading to unit cost and programme cost estimate•
Source: NPC, 2006a

13
Pro-poor and gender budgeting Pro-poor and gender coding are provided separately to every programme and project. As per the coding in the fiscal year. As per the coding in the fiscal year 2007/08, about 25.36 percent of the total education budget was directed to pro-poor programmes and about 18.31 percent was devoted to gender equality and women’s empowerment (NPC, 2007a).
With respect to gender coding, five indicators are used, with an equal weight of 20 percent. These indicators include:
Capacity-building that enhances women’s abilities•Participation of women in project formulation and implementation•Women’s share in benefit distribution•Contribution to women’s employment and increase in income•Contribution to qualitative improvement in women’s lives through reduced work burden •
Assessment of gender sensitivity is based on the five indicators, and the total score determines the category of the programme (MOF, 2007). The three categories are: direct contribution (programmes with a score of more than 50 percent); indirect contribution (programmes with a score of 20 to 50 percent); and gender neutral (programmes with a score of less than 20 percent).
In addition, all programmes and projects are coded into two groups to reflect their contribution to poverty alleviation (MOF, 2007). Code1 means direct contribution to poverty reduction, and code 2 means indirect contribution to poverty reduction. The criteria used for pro-poor codes include:
programmes for rural areas -programmes that contribute to income generation in rural areas -capacity enhancement programmes in rural areas -expenditure for social mobilization -social sector investment -social security programmes -grants to local bodies -direct expenditure for poverty reduction -targeted programmes for the advancement of indigenous groups, disadvantaged groups and -regions
Trends in Education Budgeting and Expenditure The prioritization of projects and the budget assurance for the first priority projects (P1) are major achievements of the MTEF process in education. The planning and budgeting reform process that was introduced in Nepal with the first MTEF for 2002/03–2005/06 has strengthened budget formulation and management. Linkages between PRSP and expenditures are now clearer and more direct. The budget formulation has become more systematic, co-ordinated, predictable, results-oriented and performance-based. Moreover, the MTEF has contributed to a substantial increase in the education budget, mainly directed to the goal of achieving universal primary education.

14
The projected and actual MTEF budgets in the education sector since 2002/03 are shown in Table 2. One reason for the variations in actual and proposed budgets is the introduction of the EFA SWAp in education, which led to a substantial increase in pooled resources in primary education in 2003/04 and 2004/05, as compared to the projections in the first MTEF. In absolute terms, the development budget for education in 2007/08, the first year of the current MTEF, is more than triple the budget of 2002/03.
Table 2 Development Budget Projections of E-MTEFs (NRs in millions)
2002/03 2003/04 2004/05 2005/06 2006/07 2007/08 2008/09 2009/10
MTEF I *3,076 3,260 3,328
MTEF II *4,369 5,166 6,707
MTEF III *6,299 7,386 7,760
MTEF IV *7,047 8,969 9,771
MTEF V *8,016 8,801 9,589
MTEF VI *9,698 10,333 11,105
Note: * Actual development budget allocation
Source: NPC, 2002a; NPC, 2003; NPC, 2004; NPC, 2005; NPC, 2006a; NPC, 2006b
The E-MTEF has also contributed to the increase in the education sector budget as a share of the GDP (see Annex 1). In 2007/08, education expenditure accounted for 3.7 percent of the GDP as compared to 3.1 percent in 2002/03. Furthermore, the budget allocation pattern in the education sector is more in line with policy priorities in recent years (see Figure 2). As part of a national strategy for achieving poverty reduction, the PRSP has accorded high priority to primary education, and this sub-sector accounts for almost 60 percent of education expenditures in Nepal. There is a smaller, but visible, trend toward increased allocation to both secondary and higher education. However, there continues to be very little investment in technical and vocational education due to the PRSP policy of promoting private sector involvement in this sub-sector.
Figure 2 Sub-sectoral Allocation in the Education Sector
14
Amount (NRs. million)
6
8
10
12
2001/02
2003/04
0
2
4
6
Primary Secondary Higher TVE Educational Monitoring &
2005/06
Primary Secondary Higher TVE EducationalDevelopment
Monitoring &Administration
Source: NPC, 2002a; NPC, 2003; NPC, 2004; NPC, 2005.
15
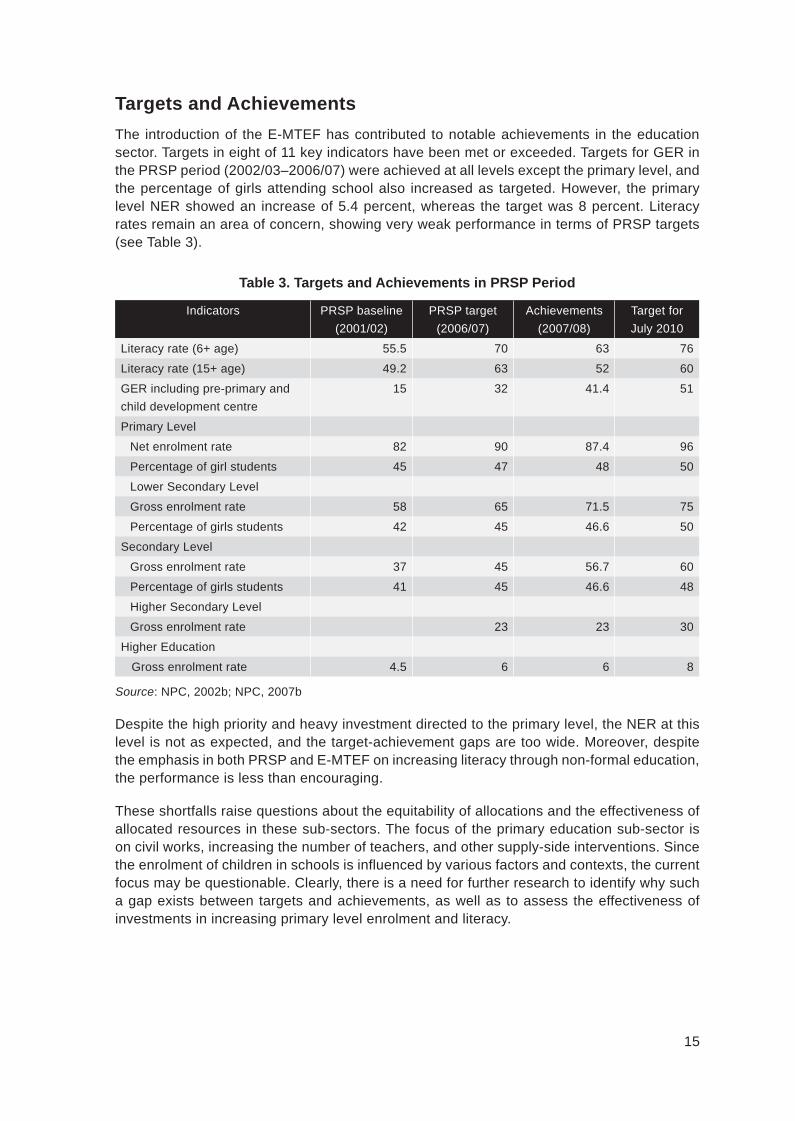
Targets and AchievementsThe introduction of the E-MTEF has contributed to notable achievements in the education sector. Targets in eight of 11 key indicators have been met or exceeded. Targets for GER in the PRSP period (2002/03–2006/07) were achieved at all levels except the primary level, and the percentage of girls attending school also increased as targeted. However, the primary level NER showed an increase of 5.4 percent, whereas the target was 8 percent. Literacy rates remain an area of concern, showing very weak performance in terms of PRSP targets (see Table 3).
Table 3 Targets and Achievements in PRSP Period
Indicators PRSP baseline (2001/02)
PRSP target (2006/07)
Achievements (2007/08)
Target for July 2010
Literacy rate (6+ age) 55.5 70 63 76
Literacy rate (15+ age) 49.2 63 52 60
GER including pre-primary and child development centre
15 32 41.4 51
Primary Level
Net enrolment rate 82 90 87.4 96
Percentage of girl students 45 47 48 50
Lower Secondary Level
Gross enrolment rate 58 65 71.5 75
Percentage of girls students 42 45 46.6 50
Secondary Level
Gross enrolment rate 37 45 56.7 60
Percentage of girls students 41 45 46.6 48
Higher Secondary Level
Gross enrolment rate 23 23 30
Higher Education
Gross enrolment rate 4.5 6 6 8
Source: NPC, 2002b; NPC, 2007b
Despite the high priority and heavy investment directed to the primary level, the NER at this level is not as expected, and the target-achievement gaps are too wide. Moreover, despite the emphasis in both PRSP and E-MTEF on increasing literacy through non-formal education, the performance is less than encouraging.
These shortfalls raise questions about the equitability of allocations and the effectiveness of allocated resources in these sub-sectors. The focus of the primary education sub-sector is on civil works, increasing the number of teachers, and other supply-side interventions. Since the enrolment of children in schools is influenced by various factors and contexts, the current focus may be questionable. Clearly, there is a need for further research to identify why such a gap exists between targets and achievements, as well as to assess the effectiveness of investments in increasing primary level enrolment and literacy.

16
Monitoring and EvaluationTo strengthen monitoring and evaluation, Nepal has been institutionalizing the Poverty Monitoring and Analysis System (PMAS). The PMAS, a sub-set of the PRSP, is comprised of a total of 20 education indicators, both intermediate (input, process, output) and final (outcome, impact), along with information on sources and time periods associated with monitoring. Further consolidation of the PMAS and the Education Management Information System (EMIS) is envisioned. At the same time, the education sector MTEFs have been designed in such a way that expected annual outputs and the intermediate and outcome level indicators of the PRSP are strongly linked. However, agencies responsible for programme and project implementation continue to encounter barriers in their attempts to monitor and evaluate progress. A robust monitoring mechanism for the E-MTEF still needs to be put in place, based on improvements that are identified in consultation with stakeholders.

17
V Issues for Further ConsiderationThe MTEF marks a milestone in public expenditure management in Nepal, bringing into sharper focus the potential benefits of a co-ordinated and prioritized approach to sector-wide resource allocation. MTEF planning and budgeting processes were phased in, which enabled the Government to increase coverage and build on the experiences of the five ministries covered in the first year, including the MOES. In the second year, the MTEF was used in the formulation of development budgets for all ministries, and the expansion in the fourth year brought regular or recurrent budgets into the MTEF.
All sectors face serious challenges in their efforts to design and implement robust linkages between planning and budgeting, targets and achievements. The predictability envisioned by the MTEF has been weakened in Nepal, due in part to political instability and the unreliability of resources, including unrealized pledges by foreign donors. Pressure from politicians, development partners, and other vested interest groups seeking to advance their priorities and interests that are not in line with national or sectoral priorities also creates conflict. The likelihood remains that, in some instances, the MTEF process may be derailed because its objective guidelines for programme and project prioritization do not serve individual or institutional interests. This makes it all the more urgent to ensure commitment at the policy level and to demonstrate the credibility of the MTEF.
This case study review of the MTEF in the education sector has shown that it is possible to channel resources to priority sub-sectors through rationalized prioritization. Investment in primary education, the top priority in the education sector, has increased rapidly since the introduction of the E-MTEF, and now receives more than 60 percent of the total education budget. Moreover, the MTEF process has started to build capacity and staff skills in the MOES, so that policy makers now have more information and awareness about priority projects. Despite the fiscal crisis that accompanied political instability and conflict during the recent PRSP period, the primary education sub-sector did not suffer from budget cuts.
For the past four years, training in MTEF planning and budgeting processes has been provided through the MOES Working Group, in accordance with the National Planning Commission (NPC) guidelines. Internal knowledge and skills related to the MTEF are evolving gradually, and the group was able to prepare the fifth and sixth E-MTEFs with very little external assistance. Nonetheless, an overall lack of capacity in the Ministry, and in agencies that report to the MOES, continues to be an obstacle to timely budget formulation and implementation.
Specifically, the refinement of unit costing is an issue that must be addressed. Budget estimates based on analysis and understanding of unit costs are a very important feature of the PEM reform initiative. Under the MTEF, accurate and realistic unit costing is a prerequisite for budgeting in every programme and project in the education sector, but refining the way direct and indirect costs are calculated demands major policy decisions. The MOES has lagged behind in the use of cost estimates as a tool for expenditure planning. There has been a general feeling in the Ministry that unit costing is required only for estimating expenditure on infrastructure-related projects, not for other kinds of programmes and projects (NPC, 2006a).
A related issue is the need to reduce the differential (NPC, 2005, p. 46) between development or capital budgets (NRs. 26.5 billion) and recurrent or regular budgets (NRs. 44.5 billion). This is especially challenging because adequate funds must be directed to improve the quality of education, including hiring teachers and purchasing supplies, without introducing high fees that further deter the poor from accessing primary education.
18
The MTEF has proved its value in the education sector, bringing systematic processes to prioritized resource allocation and budgeting. Before it was introduced, budget estimates in the education sector were largely based on bargaining between the MOES and the NPC/MOF. There was also institutional conflict among implementing agencies because of the absence of guiding principles for deriving medium-term resource projections. Under the MTEF, the traditional practice of focusing exclusively on budget ceilings has shifted to a needs-based approach. In addition to enhancing the predictability of expenditure projections, the planning process now focuses on linkages between targets and achievements. Goals and objectives for the education sector are incorporated in the PRSP, district education plans, village/municipality education plans and school improvement plans, and the three-year rolling budget of the framework ensures updates on an annual basis. Further, there is a continuous reform process that has added new features to successive MTEFs, such as gender coding and pro-poor coding.
Effective implementation and monitoring is still one of the outstanding issues in the E-MTEF process. Some efforts have been made to introduce a results-based monitoring system, but this has not been well institutionalized. In order to close the gap between targets and achievements in the education sector, and to secure greater donor investment in education in Nepal, the weakness of monitoring and evaluation systems has to be addressed. Despite the problems that have been identified in this report, the MTEF has significantly improved the co-ordination between top-down and bottom-up participants in the education sector. In effect, the E-MTEF has become a widely accepted referee.
The fact remains that the education sector is still under-funded. About 11 percent of school-age children do not attend school; one in every two adults is illiterate; and the quality of public education is very low. Still, the introduction of the E-MTEF has contributed to increased involvement by donor agencies. A clear identification of strategic sectoral priorities has motivated donors to invest in the development of education in a collaborative manner. For EFA implementation, there are nine donors, and the Secondary Education Support Programme (SESP) has four donors in common programmes.
There is a pressing need for research and analysis to relate policy processes in Nepal to the reality of peoples’ lives. The feeling persists that decision-making is dominated by elitism, rather than empowered by the concerns and needs of the majority of the population. Nonetheless, Nepal’s attempts to promote development, including the reform of the education sector, are increasingly forward-looking. In this spirit, the MTEF planning and budgeting processes have been introduced and continue to be implemented with optimism. Only a sustained, positive outlook by everyone concerned with the work of updating and refining the MTEF will ensure its future as a credible framework of public expenditure management.
19
ReferencesCentral Bureau of Statistics (CBS). 2004. Nepal Living Standard Survey Report.
Higher Secondary Education Board (HSEB). 2005. Higher Secondary Education Perspective Plan Framework 2006-2020.
Le Houerou, P. and Taliercio, R. 2002. Medium Term Expenditure Framework: From Concept to Practice: Preliminary Lessons from Africa. Washington, D.C., World Bank.
Ministry of Education and Sports (MOES). 2007a. Education for All Mid-Decade Assessment: National Report. Kathmandu, UNESCO.
Ministry of Education and Sports (MOES). 2007b. School Sector Reform Core Document: Policies and Strategies (Draft: For Consultation and Dissemination). Unpublished.
Ministry of Finance (MOF). 2007. Budget Formulation Guidelines. Fourth Ed. (In Nepali).
National Planning Commission (NPC). 2002a. First Medium-Term Expenditure Framework, Main Volume (Fiscal year 2002/03 – 2004/05).
National Planning Commission (NPC). 2002b. Tenth Plan (2002/03 – 2006/07).
National Planning Commission (NPC). 2003. Second Medium-Term Expenditure Framework, Main Volume (Fiscal year 2003/04 – 2005/06).
National Planning Commission (NPC). 2004. Third Medium-Term Expenditure Framework, Main Volume (Fiscal year 2004/05 – 2006/07).
National Planning Commission (NPC). 2005. Fourth Medium-Term Expenditure Framework, Main Volume (Fiscal year 2005/06 – 2007/08).
National Planning Commission (NPC). 2006a. Fifth Medium-Term Expenditure Framework, Main Volume (Fiscal year 2006/07 – 2008/09).
National Planning Commission (NPC). 2006b. Sixth Medium-Term Expenditure Framework, (Fiscal year 2007/08 – 2009/10). Unpublished.
National Planing Commission (NPC). 2007a. Annual Programme of Fiscal Year 2007/08. (In Nepali).
National Planning Commission (NPC). 2007b. Three-Year Interim Plan (2007/08 – 2009/10).
UNESCO Institute for Statistics (UIS). 2008. Global Education Digest 2008 Comparing Education Statistics Across the World. Montreal, UIS.
World Bank. 1998. Public Expenditure Management Handbook. Washington, D.C., World Bank.
20
Annex
Annex 1 Public Expenditure on EducationPublic Expenditure on Education at Current Prices (NRs in millions)
Fiscal Year
GDP Government expenditure
Education expenditure
Government expenditure as share of GDP (%)
Education expenditure as share of GDP
(%)
Education expenditure as share of Government
expenditure (%)1975/76 17394 1913 229 11.0 1.3 12.01980/81 27307 4092 384 15.0 1.4 9.41990/91 116128 23550 2082 20.3 1.8 8.81991/92 144931 26418 2868 18.2 2.0 10.91992/93 165262 30898 4150 18.7 2.5 13.41993/94 191540 33597 4284 17.5 2.2 12.81994/95 209976 38795 5066 18.5 2.4 13.11995/96 239388 46544 6150 19.4 2.6 13.21996/97 269570 53424 7203 19.8 2.7 13.51997/98 289798 56118 7804 19.4 2.7 13.91998/99 330018 59579 7682 18.1 2.3 12.91999/00 366251 66273 9329 18.1 2.5 14.12000/01 393566 79835 11045 20.3 2.8 13.82001/02 405632 80072 13050 19.7 3.2 16.32002/03 435531 84006 13287 19.3 3.1 15.8
2003/04 472424 92107 14526 19.5 3.1 15.82004/05 493683 111690 18060 22.6 3.7 16.22005/06 582950 126885 21250 21.8 3.7 16.82006/07 628506 143912 23005 22.9 3.7 16.02007/08 773437 169950 28390 21.8 3.7 16.8
Source: Compiled and calculated by the authors based on the Economic Survey of the Government of Nepal for the fiscal years 1994/95, 2000/01 and 2007/08.

21
Annex 2 Prioritization of Development ExpenditureThe prioritization of development expenditure in the MTEF is based on criteria that were revised and clarified while preparing the third MTEF, with weightage as follows:
Contribution to fulfillment of national goal of poverty alleviation (20)•Contribution to sectoral goals/objectives (15)•Contribution to regional balance (10)•Role of the government (10)•Participation (20). If revenue collection is more than expenditure, the score is 5. If revenue •collection is not less than 50 percent of expenditure, the score is 3.5; if it is less than 50 percent, the score is 2. If revenue collection is less than 5 percent, the score is 0. The four sub-criteria assessed are: people/civil society, local body, organizations (public enterprises, autonomous bodies, etc.), and enhancement of the private sector
Project status (15). Age of the project (to be counted from the first year), previous performance, •and completion stage are considered
Certainty of funding (10)•Project prioritization criteria ratings are: very good (3), good (2), satisfactory or ordinary (1), or poor (0).
Contribution to Fulfillment of National Goal of Poverty Alleviation (Scoring should indicate which poverty indicators the project serves to improve)
Prioritization Criteria
a Direct and significant contribution to increase production, income, employment or productive education, skills, functional health facilities, physical infrastructure, capital or access to other means of production
Very good or 3
b Indirect but very specific and clear contribution to above Good or 2
c Indirect and general contribution to poverty alleviation Ordinary/Satisfactory or 1
d Very general, far and distant, not clear or not related to poverty alleviation
Poor or 0
Contribution to Sectoral Goals/Objectives
a Direct and clear contribution to sectoral goal/objectives Very good or 3
b Indirect but clear contribution to sectoral goal/objectives Good or 2
c Indirect and general contribution to above Ordinary/Satisfactory or 1
d None or unclear contribution to above Poor or 0
Contribution to Regional Balance (Based on List of Districts Ranking)
a District with composite index Very good or 3
b District with composite index Good or 2
c District with composite index Ordinary/Satisfactory or 1
d District with composite index Poor or 0
Contribution to National Priority Sectors or Areas (Rehabilitation, Reconstruction, Reintegration, Inclusion)
a Direct and significant contribution to rehabilitation, reconstruction, reintegration, and social inclusion
Very good or 3
b Activities that support rehabilitation, reconstruction, reintegration, and social inclusion
Good or 2
c Indirect and general contribution to above Ordinary/Satisfactory or 1
d None or unclear contribution to above Poor or 0
22
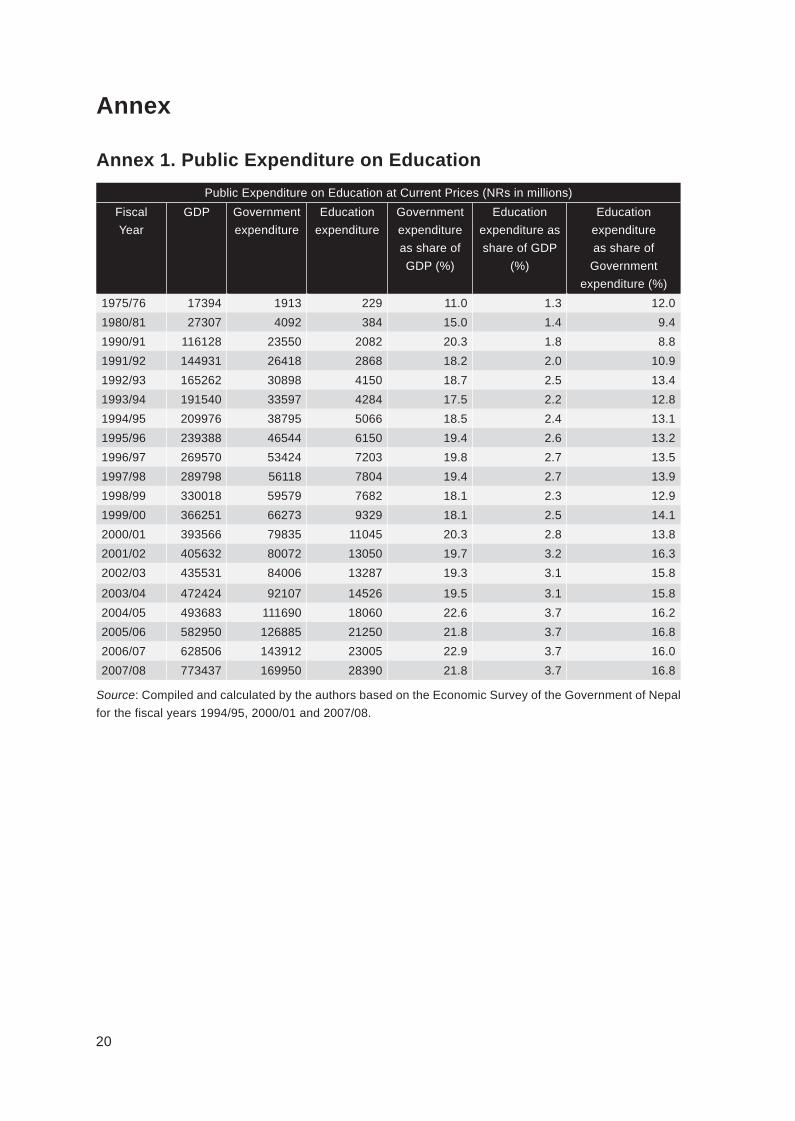
Participation
It is proposed to treat all kinds of participation under one criteria, assigning up to the full mark of 3, so that various kinds of participation do not get separate marks which would cause overweighting with respect to the other criteria. Thus, a project or programme is asked to use only one of the four sub-criteria given below (1-4), choosing whichever is most applicable to the project. If more than one sub-criteria is used, the average score of the sub-criteria becomes the obtained score for the participation criteria.
Participation – only one from these sub-criteria
1. Participation of people (civil society, CBOs, NGOs etc.)
a Participation in design, implementation and cost sharing at present and complete management in future (as per GoN norm)
Very good or 3
b Participation in design, implementation and cost sharing at present only (as per GoN norm)
Good or 2
c Participation in design, implementation with cost sharing in kinds but not in cash
Ordinary/Satisfactory or 1
d No people’s participation Poor or 0
2. Local Body Participation
a As 1(a) with 15% or more local cost sharing Very good or 3
b As 1(b) with 10–14% local cost sharing Good or 2
c As 1(c) with up to 9% local cost sharing Ordinary/Satisfactory or 1
d As 1(d) Poor or 0
3. Participation of Organizations (public enterprises, autonomous bodies, etc)
a As 1(a) with 15% or more public enterprise local-level cost sharing Very good or 3
b As 1(b) with 10–14% public enterprise local-level cost sharing Good or 2
c As 1(c) with up to 9% public enterprise local-level cost sharing Ordinary/Satisfactory or 1
d As 1(d) Poor or 0
4. Private sector promotion
a Activities promoting private sector competition/partnership Very good or 3
b Activities continued in joint partnership with private sector Good or 2
c Activities competing with the private sector Ordinary/Satisfactory or 1
d Activities supporting monopoly or subsidization that create a hindrance to private sector entry
Poor or 0
Project Status (Average of scores of sub-criteria 1-3 should be used for the project status score)
1. Age of the project, to be counted from the first year (for ongoing projects, use judgment)
a One to two years Very good or 3
b Two to five years Good or 2
c Five to ten years Ordinary/Satisfactory or 1
d Above ten years Poor or 0
2. Previous performance
a Previous physical performance (up to last three years) 90% or more Very good or 3
b Previous physical performance (up to last three years) 75% to 89% Good or 2
c Previous physical performance (up to last three years) 50% to 74% Ordinary/Satisfactory or 1
d Previous physical performance (up to last three years) less than 50% Poor or 0

23
3. Completion stage
a Certain to be completed next year Very good or 3
b To be completed within two to three years Good or 2
c To be completed within four to five years Ordinary/Satisfactory or 1
d To be completed after more than five years or not certain Poor or 0
Certainty of Funding
a Grant/Loan already signed Very good or 3
b Grant/Loan committed but not signed Good or 2
c Committed through Cabinet decision in co-ordination with NPC Ordinary/Satisfactory or 1
d Availability of financing not clear, not certain or to be explored Poor or 0
Ministries and departments review the above criteria and scoring, and they are asked to reprioritize programmes and projects as necessary. In some cases, new prioritization will also have to be completed. Using the rated scores (0-3), the total score is calculated according to the weightage assigned, as all criteria are not equally important. Proper justification and explanation for awarding the specific programme or project an overall score is provided through supplementary notes.
Additionally, while conducting priority ranking and budget allocation, due consideration is to be given to the pro-poor focus of the program, along with gender equality and women’s empowerment. Further coding for poverty and gender needs to be done, using the Program Priority Ranking Score (PRS) Sheet, as shown in Annex 4.

24
Annex 3 Prioritization of General Administrative/Regular ExpenditureThe following are prioritization criteria for general administrative expenses:Items Included Under Priority 1 Programmes
All budget sub-heads funded from the Consolidated Fund and budget sub-head related to the •Royal Palace
Agencies or programmes responsible for maintaining law and order, including Nepalese Army, •Police, Investigation Authority, District Administration and Jails
Agencies or programmes responsible for direct services to the people, including citizenship •distribution, registration, passport distribution, primary education, primary health care, maternal care, and drinking water
Agencies or programmes contributing to social security through the provision of services to •the disabled, elderly, widows, and pensioners
Agencies or programmes contributing to the provision of justice (Courts and the Office of the •Attorney General)
Agencies or programmes responsible for promoting foreign relations•Cultural heritage as stipulated by the world heritage list, including palaces, and rare biological •resources (conservation areas)
Offices involved in tax administration•Basic services handed over to community or local bodies, including education and health•Agencies or programmes directly involved in corruption control•Agencies involved in the planning, implementation and monitoring of poverty alleviation •programs
Agencies or programmes related to conducting elections•Organizations involved in forest resources•
Items Included Under Priority 2 ProgrammesMinistries, constitutional bodies and commissions not included in the Priority 1 list•Agencies or programmes that are attached to ministries, constitutional bodies and commission •and contribute indirect support to Priority 1 programmes
Items Included Under Priority 3 ProgrammesAgencies and programmes that can be merged into other programmes, or closed, or whose •functions can be conducted under an outsourcing arrangement
Programmes that are not included in the above categories and those included under •miscellaneous contingency budget headings of the Ministry of Finance
Line item costs were further scrutinized in the fifth MTEF (2006/07–2008/09), and five criteria were adopted. The basis for selecting criteria was the contribution made to: direct services, good governance, raising revenue, development work, and other significant areas (human resource development, environmental conservation, regional balance, etc.). Rankings were designed so that very high contribution scores 5; high contribution scores 3.5; general contribution scores 2; and no contribution scores 0.

25
Minimum total scores were set for each category: P1 (17.5), P2 (10) and P3 (less than 10). However, all general administrative expenditures charged to the Consolidated Fund have been brought under P1. Under Priority 1, up to 80 percent of the budget can be proposed. The remainder is to be included under second and third priority. However, this provision will not be applicable to agencies with a single budget sub-heading.
The following are detailed prioritization criteria for general administrative/regular expenditure:
Expenditures for Providing Direct Services Citizenship certificate and passport related works•Primary and basic health care services•Land management services•Water supply and sanitation services•Communication services, such as radio, television, telephone and postal services•Public transportation service•Education•Social security•Works related to providing justice•
Expenditures for Maintaining Good Governance Works related to promoting public accountability and transparency•Works related to enhancing the economy through efficient mobilization of public resources •and effectiveness of government agencies
Works related to ensuring increased transparency and clarity in administrative, financial and •managerial procedures
Works related to standardizing working style•Works related to identifying weaknesses and suggesting practical measures to improve •existing procedures, modalities and the legal system
Works related to corruption control•Works related to maintaining law and order•
Contribution to Raising Revenue Offices collecting tax revenues•Works related to collecting non-tax revenues•
Contribution to Development Works Works of institutions/agencies contributing to poverty alleviation•Works of institutions/agencies involved in rural development works•Works of institutions/ agencies involved in infrastructure development•Works related to tourism promotion•Works related to industrial services•

26
Other Contributions Works related to increasing participation in the development, management and conservation •of land and forest resources
Works related to environmental conservation, biological diversity, hereditary resources, flora •and fauna
Works providing benefits to local people through biodiversity and tourism development•Works related to scientific exploration, excavation, research, analysis, conservation, promotion, •and publication of the historical, cultural and archaeological heritage of the Kingdom of Nepal
Works related to the existence and importance of Nepal and Nepalese people in the national •and international arena through efforts to conserve and promote the culture of ethnic and linguistic communities residing in different parts of the country
Works related to training and capacity-building•

27
Annex 4 Examples of Priority RankingProgrammes/Projects Priority Ranking Score (PRS) Sheet
Sector: EducationName of the Ministry: Ministry of Education and SportsName of the Department:.......................................................
Bud
get C
ode
Pro
gram
me
Nam
e/P
roje
ct N
ame
1 2 3 4 5 6 7 8 9 10 11 12
Nat
iona
l Goa
l/ O
bjec
tive
Sec
tora
l Goa
ls/
Obj
ectiv
e
Reg
iona
l Bal
ance
Gov
ernm
ent R
ole
Par
ticip
atio
n (P
eopl
e, L
ocal
G
over
nmen
t, G
over
nmen
t E
nter
pris
es,
Priv
ate
Sec
tor)
Pro
ject
Sta
tus
(Age
of P
roje
ct,
Pas
t Per
form
ance
, S
tage
of
Com
plet
ion)
Cer
tain
ty o
f fu
ndin
g
Tota
l Ove
rall
obta
ined
sco
re
Wei
ghte
d O
vera
ll S
core
Prio
rity
Ran
king
S
core
Pro
-poo
r Cod
ing
Gen
der C
odin
g
Proposed weightages (%)
20 15 10 10 20 15 10
Full Mark 3 3 3 3 3 3 3 I II III IV Avg I II III Avg 65-#-417 Education for All 3 3 3 3 3 3.0 2 2 1 1.7 3 93.7 93.3 P1 01 01
65-#-620 Primary School Nutrition Program
2 2 2 3 1 1.0 1 1 1 1.0 3 67.6 62.3 P2 01 01
65-#-810 Scholarship for Martyr’s Children
2 2 2 3 1 1.0 2 2 2 2.0 3 72.4 67.3 P2 02 03
65-#-600 Non-formal education & National Campaign
3 3 3 3 1.0 1.0 3 2 3 2.7 1 79.4 78.3 P1 01 01
65-#-421 Teacher Education Project
3 3 3 3 0 0.0 1 2 1 1.3 3 77.8 71.7 P1 02 03
65-#-430 Secondary Education Support Program 3 3 3 2 1 1.0 1 0 1 0.7 3 74.6 71.7 P1 02 03

28
Bud
get C
ode
Pro
gram
me
Nam
e/P
roje
ct N
ame
1 2 3 4 5 6 7 8 9 10 11 12
Nat
iona
l Goa
l/ O
bjec
tive
Sec
tora
l Goa
ls/
Obj
ectiv
e
Reg
iona
l Bal
ance
Gov
ernm
ent R
ole
Par
ticip
atio
n (P
eopl
e, L
ocal
G
over
nmen
t, G
over
nmen
t E
nter
pris
es,
Priv
ate
Sec
tor)
Pro
ject
Sta
tus
(Age
of P
roje
ct,
Pas
t Per
form
ance
, S
tage
of
Com
plet
ion)
Cer
tain
ty o
f fu
ndin
g
Tota
l Ove
rall
obta
ined
sco
re
Wei
ghte
d O
vera
ll S
core
Prio
rity
Ran
king
S
core
Pro
-poo
r Cod
ing
Gen
der C
odin
g
65-#-830 Secondary Education Support Programme 3 3 3 2 1 1.0 1 0 1 0.7 3 74.6 71.7 P1 02 03
65-#-471 Manamohan Polytechnic Institute 2 2 2 2 0 0.0 3 2 0 1.7 1 50.8 48.3 P2 02 03
65-#-412 School Management Transfer Programme (LIL) 2 2 2 3 3 3.0 2 3 2 2.3 3 80.2 80.0 P1 01 02
65-#-416 EFA (CDP) 2 2 2 2 0 0.0 3 1 3 2.3 1 51.6 50.0 P2 02 0265-#-440 Higher Secondary
Education 2 2 2 2 0 0.0 3 1 3 2.3 1 51.6 50.0 P2 02 0365-#-470 UGC 3 1 2 2 0 3.0 1.5 3 1 3 2.3 1 58.7 61.7 P2 02 0365-#-681 Budhanilkantha
School 1 1 2 2 0 0.0 3 3 3 3.0 1 45.2 41.7 P3 02 0265-#-630 Population
Education 1 2 0 2 0 0.0 3 2 3 2.7 1 41.3 40.0 P3 02 0265-4-699 Youth & Sports
Development Programme 1 2 0 2 0 0.0 3 2 3 2.7 1 41.3 40.0 P3 03 03
65-#-691 National Sport Council 1 2 0 2 0 0.0 3 2 3 2.7 1 41.3 40.0 P3 03 03
65-#-804 Education for All 3 3 3 3 3 3.0 2 2 1 1.7 3 93.7 93.3 P1 01 0165-#-455 Skill for
Employment 3 3 3 3 0 0.0 1 0 0 0.3 3 76.3 70.3 P1 01 02
