education funding brief 2015 - british columbia teachers ... · education funding brief 2015 ......
TRANSCRIPT


BCTF Education Funding Brief September 2015 1
Education Funding Brief 2015 BC Teachers’ Federation
bctf.ca/BriefsAndPositionPapers.aspx
Continue to recommend adequate funding for public education
We do not like to be repetitive, but the situation with funding of public education has,
unfortunately, not improved, despite the best efforts of the Select Standing Committee on
Finance and Government Services—as well as of ourselves, many parents, and others who
support public education.
The British Columbia Teachers’ Federation (BCTF) would like to express its appreciation for the
recommendations made on funding for K–12 education in the past two reports of the Select
Standing Committee on Finance and Government Services (the Committee).
The Committee, in November 2014, called for the government to undertake the following:
22. Provide stable, predictable, and adequate funding to enable school districts to
fulfill their responsibility to provide continued equitable access to quality
public education, and to meet required repair and maintenance needs.
23. Provide adequate capital funding to school districts for facility improvements,
seismic upgrades, and additional schools in rapidly growing communities.
24. Provide support for proposed new K–12 initiatives such as personalized
learning and enhanced trades and technology training.
25. Provide resources to identify and address the growing number of students with
special needs and those with minimal English language skills.
(Report on the Budget 2015 Consultations1, p.39)
1 www.leg.bc.ca/cmt/40thparl/session-3/fgs/reports/PDF/Rpt-FGS-40-3-Report-on-Budget-2015-Consultations-
2014-NOV-13.pdf

BCTF Education Funding Brief September 2015 2
In November 2013, the Committee called for the following:
24. Provide sufficient funding for the K–12 system to enable BC students to
become top performers nationally; and address cost increases for school
districts (e.g., rising BC Hydro rates).
27. Review the increasing demands on school district budgets and ensure that
funding is appropriately directed to meet the growing support required for
students with special needs.
(Report on the Budget 2014 Consultations2, p.48)
The above are previous Committee recommendations to government—and the Federation
wholeheartedly agrees with them; the following are our recommendations for consideration by
the Committee for your next report.
2 www.leg.bc.ca/cmt/40thParl/session-1/fgs/reports/PDF/Rpt-FGS-40-1-1stRpt-Budget2014Consultations-2013-
NOV-14.pdf

BCTF Education Funding Brief September 2015 3
Recommendation 1
Act on the recommendations from the Select Standing Committee on Finance and
Government Services of the past two years that have called for additional funding
for K–12 public education.
The problems identified by the BCTF regarding inadequate provincial funding for BC public
schools have not been addressed by the government in response to your recommendations. They
have been dismissed or ignored when the Finance Minister has proposed BC’s budget. (The
government did provide some new funding for the teachers’ settlement, but then imposed a
funding cut in district operating grants.) With the $29 million cut to operating grants in 2015–16,
and another $25 million cut in 2016–17, the government has added further to the downloaded
costs that districts are already expected to absorb to resolve budget shortfalls.
We thank the Committee for the recommendations of the past two years, and provide you with
appendices of up-to-date information that support a repeat of your recommendations.
See Appendix 1 for an overview of changes in operating grants funding.
Please take the previous recommendations forward again and urge that they be acted on in the
next budget.

BCTF Education Funding Brief September 2015 4
Recommendation 2
Increase public education funding to ensure that the Teacher Education Fund is
actually adding teachers to increase support for areas of greater need, rather
than just making up for other teaching positions that have been cut.
In previous briefs to the Committee, the BCTF has expressed concern that improvements in
teaching support from additional funding provided by the Learning Improvement Fund have
been largely offset by a significant decrease in the district operating grants expenditures on
teachers.3
One area we would like to emphasize has to do with the impact of the Teacher Education Fund.
This is the fund that was negotiated into the six-year collective agreement reached in September
2014, that was supposed to provide for an increase in the number of teachers to meet high-need
areas in the school districts, adding to the number of teaching positions funded by district
operating grants.
This is not what is happening in our schools. In the spring when districts prepare their
preliminary budgets, many have had to reduce the number of teaching positions to make their
budget balance, as required by the province. Then, when the staffing covered by the Teacher
Education Fund is put into place, the number of teaching positions created is about the same as
the number eliminated in the preliminary budget. For this reason, the Teacher Education Fund
has not solved the need for more teachers to address class size and composition issues.
Only an increase in operating grants funding sufficient to restore teaching positions that were cut
will make possible the improvements that were supposed to be accomplished with the Teacher
Education Fund.
See Appendix 2 for background information relating to this recommendation.
3 For information on “Bait and Switch” of teaching positions, see the 2013 and 2014 BCTF Education Funding
briefs, and the document “Teachers gained and lost—Will the Teacher Education Fund make a difference?”
Available at: www.bctf.ca/IssuesInEducation.aspx?id=10720

BCTF Education Funding Brief September 2015 5
Recommendation 3
Reinstate tuition-free education for adults taking adult basic education to
upgrade secondary courses so they can apply to post-secondary training
programs, and for adults needing to learn English as a second language.
Who’s not in school this year?
Many adults seeking to upgrade their qualifications have been the victims of provincial budget
cuts and new regulations.
Adults needing to upgrade qualifications or learn English had been encouraged during the last
several years through free tuition for courses to help improve their economic situation and
promote social inclusion. The government sensibly subsidized the education of this group. The
funding to cover these students contributed not just to their own development, but helped them
integrate into the economy and society successfully.
The BCTF has surveyed its members who have been teaching in adult education to find out
about the context of the service provided. A very common theme is that many of the adult
education students are marginalized and/or living in poverty or working in precarious, often
minimum wage, positions. Many must overcome multiple barriers to participate in education,
even when the courses are tuition-free.4 Charging tuition creates an impossible barrier, reflected
in the dramatic decline in the number of students and programs offered immediately following
implementation of the new policy on tuition.
While these adult students may be the ones who gain the most from access to free education, on
an individual basis, society as a whole benefits by having a more skilled and educated workforce,
with families that can, in turn, help in making their own children successful; see Appendix 3 for
more.
4 “Adult Education in BC’s public schools: Lost opportunities for students, employers, and society—A BCTF study
of working and learning conditions”, www.bctf.ca/AdultEducationStudy/. See Chapter 6 (Adult educators’ views on
the impact of poverty on adult learners and the adequacy of resources to support them), Chapter 8 (Recent policy
changes and funding cuts to Adult Education: Moving towards a less equal and more unjust society), and Chapter 9
(Implications and possible directions for BCTF advocacy in support of Adult Education in public schools – A
discussion paper).

BCTF Education Funding Brief September 2015 6
Recommendation 4
Increase K–12 public education funding to cover all the costs downloaded to
school districts, as well as inflationary costs.
Year after year, it is the same story. More and more costs are downloaded onto school districts
without increases in funding to cover those expenditures.
Some of these downloads have been with us for years and just keep increasing, BC Hydro rates,
MSP, and WorkSafe BC as examples. And each year new downloads are added. Without
additional funding, these cost pressures accumulate each year. The BC Association of School
Business Officials estimates school districts faced $192.7 million in cost pressures in 2014–155
(based on a provincial cumulative total for the years 2012–13 to 2014–15).
Paying for the Next Generation Network and MyEducation BC
The Ministry of Education has pressured school districts to sign on to a new student information
system, MyEducation BC, to replace BCeSIS. Shifting to a new technology has significant costs
that are often hidden. In the case of MyEducation BC, the costs are substantial.
In order to have the Internet bandwidth required to take full advantage of the program
and many other new applications of technology, the Provincial Learning Network is
being upgraded through a project called the New Generation Network. Rather than
covering the costs of an upgraded system required for the new software, those charges are
placed on school districts.
The use of a new technology requires a range of resources to make it work on a systemic
basis. It may require new hardware, because to fully implement MyEducation BC every
teacher has to have constant access to a computer, tablet, or smartphone. It may require
upgrading networks within the schools. It definitely requires training for every one of
some 36,000 teachers who are expected to use the technology. When BCeSiS was
implemented, significant grants were provided to school districts to support
implementation. With MyEducation BC, no funding is being provided, but districts are
required to sign a Memo of Understanding saying that they will provide all the resources
necessary for implementation.
5 Source: 2014–15 figure from a document obtained in a Freedom of Information Request: Ministry of Education
Estimates Note: School District Cost Pressures 2014.

BCTF Education Funding Brief September 2015 7
Presumably, all of these costs of a computer program, hardware, and network are considered
“administrative.” While the Ministry has imposed these costs on the districts, it has also ordered
that “low hanging fruit” administrative costs be reduced by $29 million this year and more next
year. The reality, of course, is that many of the administrative costs will be assigned to a broad-
range of educational services, cutting back on what the district is able to offer to students.
Administrative costs are not meaningless “low hanging fruit” waiting to be cut.
See Appendix 1 for the results of a BC School Trustees Association (BCSTA) survey
documenting the impact of budget cuts in BC school districts as of September 2015, most of
which will directly or indirectly erode learning conditions for students.
Elimination of bussing for some students
For many years the allocation from the Ministry for school bussing was frozen, but the costs
continued to rise. To run the busses, funding was cut to educational programming. Eventually,
boards no longer had capacity to continue the subsidy of bussing to and from educational
programs. Some districts have continued to run busses, but charge families for the cost. This is a
cost downloaded onto families that limits basic access to public education, especially for rural
students who must travel by bus to attend school.
Short-changing students with special needs
The most important problem that teachers identify is the ability to meet the needs of students
with special needs, and at the same time, meet the needs of the rest of the class as well. This is
the essence of what we call “class composition.”
We have heard many rumours over the past years about the Ministry planning to, in effect, end
the system of identifying students with high needs and funding school districts for the special
levels of support they require. The special needs funding approach should be reviewed, we agree.
However, the major problem is inadequate funding for special needs.
We worry when we see a media release from the Ministry, such as the one on April 17, 2015.
The government claimed there are “more classes where there are four or more students with
IEPs. This shift reflects a move towards grouping students with similar learning needs so
districts can make better use of specialist teachers and educational assistants, and an increase in
BCTF Education Funding Brief September 2015 8
specialized courses specifically designed to help students with learning challenges or special
needs.”
If this were accurate, it would result in a backward move toward the segregated classrooms that
the system abandoned more than 25 years ago.
While the Ministry’s media relations staff may believe that having more students with Individual
Education Plans (IEPs) grouped together is better, no such decision has been made or policy
generally discussed with teachers. Rather than seeking to resegregate our schools, the
government should be increasing funding for special needs so that our classrooms continue to be
inclusive, and not have students with IEPs grouped together in specific classrooms.

BCTF Education Funding Brief September 2015 9
Recommendation 5
Provide the time and resources necessary for a successful implementation of the
curriculum changes mandated by the Ministry of Education.
The Ministry has undertaken a shift in the curriculum of BC schools. The BCTF has played a
positive role in this process, appointing more than 100 teachers who have brought their expertise
to this updating of the curriculum.
The current schedule for formal adoption of the K–9 curriculum is 2016 and for Grades 10–12 is
2017. In both cases, there is a year when teachers are encouraged to review and explore the
curriculum.
Changes in curriculum require a teacher to understand how the new curriculum is similar to or
different from the existing curriculum. It is also necessary to find and be familiar with new
resources and to identify what needs to change in their approach to classroom practice.
These are challenges when teachers are already working full-out in their existing teaching
situation and are expected at the same to develop an understanding of new curriculum and
related resources. This process is a challenge when one subject area is changed at a time, but the
new curriculum is being changed in every subject area at the same time. This is particularly a
problem for elementary teachers who teach all the subjects and have something new in every
area. Some have described the process as similar to building a new airplane at the same time as
one is flying it.
In addition to curriculum change, new areas of core competencies have been identified, and these
require additional work by teachers individually and collectively to incorporate assessment
practices that are new additions to the curriculum.
Successful curriculum change requires time, resources, and sharing of ideas among teachers who
are all part of the process of change.
The time required must be non-classroom time in order to concentrate on exploring the new
expectations. It cannot be done at the same time one is working with students. To give a sense of
what is required, the Changing Results for Young Readers program by the Ministry had
$10 million over about two years to have a few teachers from each district take part in an inquiry
project on improving reading in primary grades. What all 35,000 classroom teachers face are

BCTF Education Funding Brief September 2015 10
changes that are applied in Grades K–9 in all subject areas, as well as a new version of core
competencies.
Some of the curricular changes require new resources such as textbooks and other concrete
materials—as new areas are added or moved to different grade levels than in the past. Regardless
of the subject area, all students deserve to have accurate and up-to-date learning resources. The
integration of technology into more and more of the programs also requires access to training
and mentoring support, as well as adequate hardware, software, broadband networks, and
training.
Parents and the public are not going to be satisfied to have what is widely acknowledged as an
excellent education system undermined because changes were imposed without providing the
resources to make them a success.

BCTF Education Funding Brief September 2015 11
Recommendation 6
Provide funding to address issues of student mental health.
Concerns about mental health problems of young people have led to hearings by the Select
Standing Committee on Children and Youth. Experience in the education system supports the
need for action to respond to these growing needs.
The BCTF submission6 to the Select Standing Committee on Children and Youth made six
recommendations, all of which will require funding from government. Please include these in the
report of the Select Standing Committee on Finance and Government Services:
1. Support efforts to build positive and pre-emptive approaches to the mental health of
children and youth.
2. Address the serious children/youth mental health issues by ensuring mental health
services are accessible in schools.
3. Establish a commission to initiate and co-ordinate province-wide mental health
approaches and resource development in K–12 public schools.
4. Provide a grant to the BC Teachers’ Federation to support its Teaching to Diversity
online resource.
5. Increase the number of school counsellors and other specialist support teachers to address
students’ mental health issues.
6. Address the mental health needs of youth who are often additionally marginalized.
6 Available online, at www.bctf.ca/uploadedFiles/Public/Publications/Briefs/SSCCY--MentalHealthJune2015.pdf.

BCTF Education Funding Brief September 2015 12
Recommendation 7
Eliminate the funding for independent schools, on a gradual basis, starting by
reducing the funding for all qualifying independent schools to 30% of the per
capita amount for public schools in the district in which the school is located.
The government has been increasing the funding to independent schools at a much faster rate
than for public schools.
Over the last decade, funding for independent schools has increased by 61.1%—three times the
percentage increase for public schools (19.7%).
Of even more concern is that Budget 2015 projections over the three-year plan (2015–16,
2016–17, and 2017–18) show K–12 funding increasing by 33.4% for independent schools, and
by only 3.3% for public schools.
See Appendix 5 for illustrative charts and references.
A portion of this increase is a result of increases in enrolment in independent schools, but
additional amounts have come through quiet changes in funding policies.
This additional funding has been accomplished by incremental changes to policies that have not
been publicly announced.
The incremental increases have included:
Increasing Distributed Learning (DL) grants to 63% of the public funding for DL
Grade 10–12 students cross-enrolled with a public school. Face-to-face independent
school programs are funded at 50%, but DL programs are funded at this higher
percentage. This provides room for larger “resource grants” to parents as a de facto
recruiting offer for parents to sign up for independent school DL programs.
Adjusting the funding formula for independent schools so that students with special needs
who are eligible for supplemental funding are funded at 100% of public funding levels.
Using the labour settlement funds from the BCTF strike as a base for increasing funding
to independent schools in 2014–15 by $5 million.
Changing the basis for the enrolment count of students for funding purposes. If a student
left the independent school during the year, previously the school lost funding for the

BCTF Education Funding Brief September 2015 13
student. This was changed so the school receives a grant for every student enrolled as of
September 30, even if they drop out or are expelled from the independent school.
The Ministry estimated that this policy change would produce $4.7 million more funding
in the current 2015–16 school year.
Introducing legislation to exempt from taxation property that is auxiliary to independent
schools.
These incremental changes should be reversed and all independent schools funded on the same
basis—30% of the per student amount in the public school district in which the independent
school is located.
Public funds should be used for public schools and not to fund private education. The Ministry
should stop increasing funding through incremental policies adopted in stealth. Rather, the
government should take steps to reduce funding over time, starting with reducing the per-student
funding for all qualifying independent schools to 30% of public school funding.

BCTF Education Funding Brief September 2015 14
Summary of recommendations
Recommendation 1
Act on the recommendations from the Select Standing Committee on Finance and Government
Services of the past two years that have called for additional funding for K–12 public education.
Recommendation 2
Increase public education funding to ensure that the Teacher Education Fund is actually adding
teachers to increase support for areas of greater need, rather than just making up for other
teaching positions that have been cut.
Recommendation 3
Reinstate tuition-free education for adults taking adult basic education to upgrade secondary
courses so they can apply to post-secondary training programs, and for adults needing to learn
English as a second language.
Recommendation 4
Increase K–12 public education funding to cover all the costs downloaded to school districts, as
well as inflationary costs.
Recommendation 5
Provide the time and resources necessary for a successful implementation of the curriculum
changes mandated by the Ministry of Education.
Recommendation 6
Provide funding to address issues of student mental health.
Recommendation 7
Eliminate the funding for independent schools, on a gradual basis, starting by reducing the
funding for all qualifying independent schools to 30% of the per capita amount for public
schools in the district in which the school is located.

BCTF Education Funding Brief September 2015 15
Appendix 1
What’s new in public education funding?
The following chart shows the percentage change in operating grants funding from year-to-year,
between 2004–05 up to 2015–16, and the Ministry of Education estimates for 2016–17 and
2017–18. These figures are from the Ministry’s three-year plan published each year in the
Operating Grants Manual. Based on the Ministry’s figures for total operating grants, there is no
increase in operating grants for the first two years of the new collective agreement (2013–14 and
2014–15) followed by a very large increase in year three of the collective agreement (2015–16).
In 2014–15, the Ministry added a Labour Settlement Fund table7 on the K–12 funding allocation
page (in November 2014) showing the district allocations to cover the cost of the collective
agreement for 2014–15. But this amount was not added to the total for 2014–15 operating grants.
Instead, the full amount of the Labour Settlement Fund for 2014–15 and for 2015–16 was added
to the 2015–16 operating grants total8. This makes the total increase in operating grants funding
in 2015–16 appear larger than it is.
Source: BCTF calculations with figures from: Ministry of Education. Operating Grants Manual for years 2004–05
to 2015–16, available at: www.bced.gov.bc.ca/k12funding/. Note: For some years, the Ministry of Education updates
total operating grants figures in the following year. For this reason, BCTF bases its calculations on the most recent
figures provided in the operating grants manual, for any given year.
7 Ministry of Education. Labour Settlement Funding for Public School Districts, 2014/15 (November 2014),
2014/15 Final Operating Grants page: www.bced.gov.bc.ca/k12funding/funding/14-15/welcome.htm 8 Ministry of Education. Table 15: Labour Settlement Funding, 2015/16 (March 2015), 2015/16 Estimated
Operating Grants page: www.bced.gov.bc.ca/k12funding/funding/15-16/welcome.htm
2.3%
3.9%
5.0%
2.7% 2.8%
1.9%
2.5%
1.2%
0.1% 0.0% 0.0%
2.2%
0.3%
0.8%
0%
1%
2%
3%
4%
5%
6%
Operating grants year-to-year percentage change: 2003-04/2004-05 to 2016-17/2017-18 Plan
(Based on totals reported in operating grants manuals)
Teachers' Labour Settlement: July 1, 2013 to June 30, 2019
BCTF Education Funding Brief September 2015 16
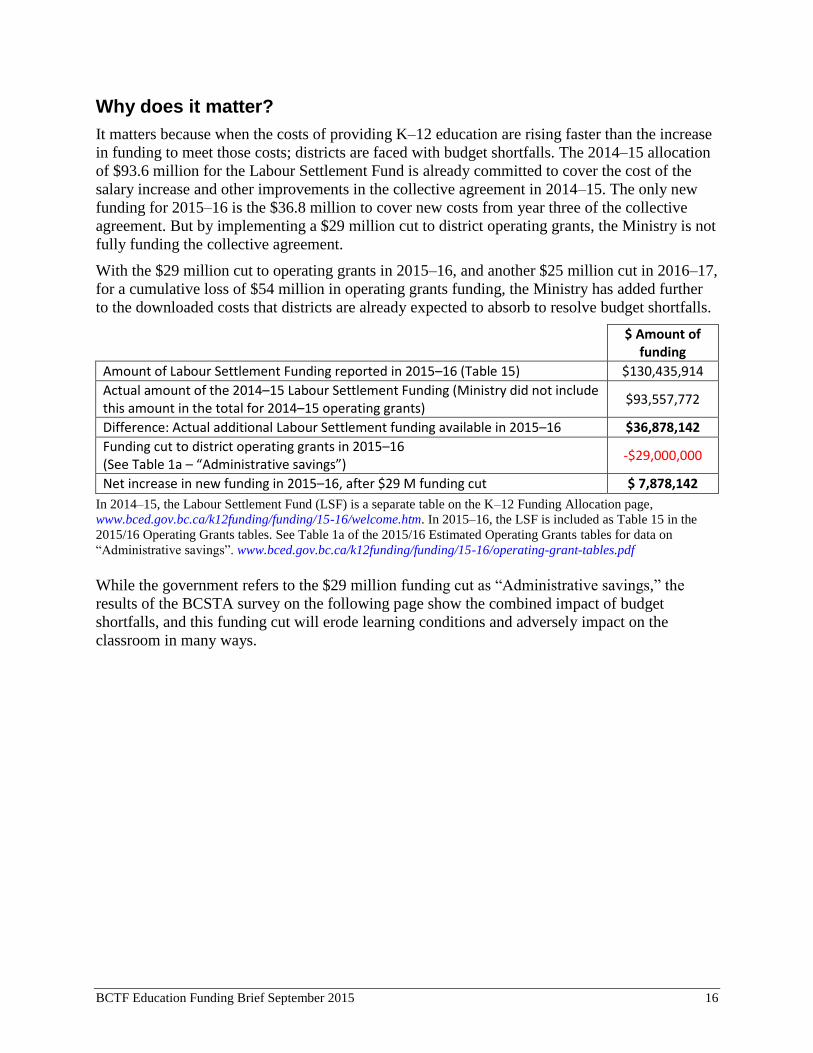
Why does it matter?
It matters because when the costs of providing K–12 education are rising faster than the increase
in funding to meet those costs; districts are faced with budget shortfalls. The 2014–15 allocation
of $93.6 million for the Labour Settlement Fund is already committed to cover the cost of the
salary increase and other improvements in the collective agreement in 2014–15. The only new
funding for 2015–16 is the $36.8 million to cover new costs from year three of the collective
agreement. But by implementing a $29 million cut to district operating grants, the Ministry is not
fully funding the collective agreement.
With the $29 million cut to operating grants in 2015–16, and another $25 million cut in 2016–17,
for a cumulative loss of $54 million in operating grants funding, the Ministry has added further
to the downloaded costs that districts are already expected to absorb to resolve budget shortfalls.
$ Amount of
funding
Amount of Labour Settlement Funding reported in 2015–16 (Table 15) $130,435,914
Actual amount of the 2014–15 Labour Settlement Funding (Ministry did not include this amount in the total for 2014–15 operating grants)
$93,557,772
Difference: Actual additional Labour Settlement funding available in 2015–16 $36,878,142
Funding cut to district operating grants in 2015–16 (See Table 1a – “Administrative savings”)
-$29,000,000
Net increase in new funding in 2015–16, after $29 M funding cut $ 7,878,142
In 2014–15, the Labour Settlement Fund (LSF) is a separate table on the K–12 Funding Allocation page,
www.bced.gov.bc.ca/k12funding/funding/15-16/welcome.htm. In 2015–16, the LSF is included as Table 15 in the
2015/16 Operating Grants tables. See Table 1a of the 2015/16 Estimated Operating Grants tables for data on
“Administrative savings”. www.bced.gov.bc.ca/k12funding/funding/15-16/operating-grant-tables.pdf
While the government refers to the $29 million funding cut as “Administrative savings,” the
results of the BCSTA survey on the following page show the combined impact of budget
shortfalls, and this funding cut will erode learning conditions and adversely impact on the
classroom in many ways.

BCTF Education Funding Brief September 2015 17
BC School Trustees Association (BCSTA) documents how the $29 million funding cut and budget shortfalls will impact on schools in September 2015
The BCSTA surveyed districts in spring 2015 about the cost-cutting measures that will be
implemented in 2015–16 to balance the budget. The examples provided in the publication
BCSTA Budget Response Update 9show that the $29 million cut to district budgets on top of
existing budget shortfalls will further erode the quality of public education. The impact of these
cuts will deepen in 2016–17, when school district operating grants will be cut another $25
million. Listed below are the impacts identified by school districts in the BCSTA survey on cost-
cutting measures that will be implemented before September 2015:
Reduction or elimination of student bussing (once considered a core service)
Implementation of monthly student transportation fees
Increased class sizes and the loss of elective classes
Reduced support services for students including fewer Education Assistant hours
Reduced school supply budgets affecting the classroom directly
Reduced support for teacher and school-based innovation projects
Program, classroom and school closures
Expanded introduction of a two-week spring break and fewer school days
Reduced building and grounds maintenance, supplies and summer work
Deferment or cancellation of technology upgrades and implementation
Reduced library time and fewer library services for students
Loss of co-curricular music and arts programs
Reduced funding for students’ extracurricular programs such as sports
Reduced custodial services for schools
Reductions in school and district administration services
Delayed replacement of text books and library books
Higher costs for community groups wanting to use school facilities (Note: This list is excerpted from the document, as worded by the BCSTA)
9 BCSTA Update: Budget Response Update, May 22, 2015, available at:
dsweb.bcsta.org/docushare/dsweb/Get/Document-77442/2015-05-22_bcsta_update.htm

BCTF Education Funding Brief September 2015 18
Appendix 2 What about the Teacher Education Fund—Did it make a difference?
Teaching positions funded by district operating grants
Full-time equivalent (FTE) teaching employment has declined steadily since 2002, after the
Liberal government was elected. There are about 3,000 fewer FTE teachers in BC public schools
in 2014–15 than in 2002–0310
. Teaching positions funded by district operating grants continue to
decrease in the years after the Learning Improvement Fund (2012–13 to 2013–14), and in 2014–
15, when the Teacher Education Fund came into effect.
* Figures are from Teacher Statistics reports, except 2014–15 (Form 1530).
Note 1: Latest Teacher Statistics report shows 29,950.6 FTE teachers in 2014–15, but the Ministry cautions the
2014–15 data is not comparable to previous years.
Note 2: These represent FTE teaching positions funded by district operating grants.
10
From 2012–13 onward, these FTE figures represent teaching positions funded by district operating grants. The
Ministry of Education reporting guidelines request that districts not include teaching positions funded by the
Learning Improvement Fund.
32,768.9
30,869.6
29,691.8
28,000
29,000
30,000
31,000
32,000
33,000
34,000 FTE teachers in BC public schools: 2000-01 to 2014-15*
Bills 27 & 28
Full-day K

BCTF Education Funding Brief September 2015 19
Will the Teacher Education Fund make a difference?
In previous briefs11
to the Select Sanding Committee on Finance and Government Services, the
BC Teachers’ Federation has expressed concern that improvements in teaching support from
additional funding provided by the Learning Improvement Fund (LIF) have been largely offset
by a significant decrease in the district operating grants expenditures on teachers.
Using the Ministry’s Form 1530 data, the following table shows that total FTE teachers funded,
there are 1,095.16 fewer FTE teachers in 2014–15 than in 2011–12 (the year before the LIF was
introduced). These figures represent the decrease in FTE teaching positions funded by district
operating grants. This table also shows BCTF estimates for the maximum number of teaching
positions that could be funded by the Teacher Education Fund (TEF) in 2014–15. BCTF
estimates the $75 million TEF in 2014–15 is enough to fund 807.60 FTE teachers if all of the
funding were spent on teaching positions. These estimates suggest that even after accounting for
the TEF, there are almost 300 fewer FTE teachers in 2014–15 than in 2011–12.
FTE teachers funded by operating grants and by the Teacher Education Fund (estimated)
FTE teachers funded by district operating grants FTE teachers
2011–12 30,786.98
2012–13 30,561.42
2013–14 30,100.95
2014–15 29,691.82
Total change in FTE teachers 2011–12 to 2014–15 -1,095.16
Total estimated FTE teaching positions that could be funded by the $75 M Teacher Education Fund, 2014–15 BCTF estimate: 79% of $75 M, multiplied by 2014–15 average teacher salary ($73,365)
+807.60
Difference: 287.56 fewer FTE teachers (est.) after taking the TEF into account -287.56
Source: Ministry of Education. Form 1530 staffing data; average teacher salary from Table 5, 2014/15 Operating
Grants.
11
For information on “bait and switch” of teaching positions, see the 2013 and 2014 BCTF education funding briefs,
and “Teachers gained and lost—Will the Teacher Education Fund make a difference?”, available at:
www.bctf.ca/IssuesInEducation.aspx?id=10720.

BCTF Education Funding Brief September 2015 20
Change in FTE learning specialist teacher positions: 2001–02 to 2014–15
This table shows the difference in FTE learning specialist teachers between the years 2001–02,
and 2014–15. These figures do not include teaching positions funded by the Teacher Education
Fund.
The following table shows that compared to 2001–02 there are:
almost 1,000 fewer Special Education teachers in 2014–15
344.7 fewer teacher-librarians to support students to develop language, literacy, and research
skills in the 21st century
133 fewer counsellors to support students with emotional, social and mental health issues
223 fewer English Language Learning teachers for students newly arrived to Canada
6 fewer Aboriginal Education teachers at a time when there are new educational initiatives to
raise awareness of Aboriginal culture within BC schools and to provide a more culturally
meaningful education for Aboriginal students.
Change
2001–02 to 2014–15
FTE specialist teachers
2001–02 2007–08 2011–12 2012–13 2013–14 2014–15 # %
Library services
921.8 730.0 635.8 646.6 627.5 577.1 -344.7 -37.4%
Counselling 989.6 915.8 870.1 871.1 858.3 856.6 -133.0 -13.4%
Special education
4,051.5 3,446.5 3,282.3 3,381.3 3,236.8 3,082.7 -968.8 -23.9%
English language learning
1,015.6 788.7 673.7 686.2* 816.8 792.6 -223.0 -22.0%
Aboriginal education
206.9 193.4 196.0 204.7 203.1 200.9 -6.0 -2.9%
Totals 7,185.4 6,074.4 5,657.9 5,789.9† 5,742.5 5,509.9 -1,675.5 -23.3%
BCTF Research table: totals calculated with figures from BC Ministry of Education, Staff by Year and Program
Code (unpublished Form 1530 data, various years).
* No staffing was reported by SD34 for Program 1.30, ELL, for 2012–13—an unexplained anomaly in the data.
† The total for 2012–13 is affected by the asterisked note, above. As well, it appears that, for 2012–13, SD87
reported all teachers under Regular Instruction, and none as learning specialist teachers.

BCTF Education Funding Brief September 2015 21
Plan for the future: Student population will increase and there will be a need for more teachers
BC Stats projects increases in pre-school and school-aged population BC Stats projections indicate the population aged 0–4 years will grow by 21,800 and the
population aged 5–17 years will grow by 28,200, between the years 2015 and 2022. The school-
aged population (5–17 years) in BC is projected to increase steadily each year totalling 738,900
children by 2041. This represents a 21% increase (128,100 more children) in the school-aged
population in BC compared to 2015.
BC Population Projections: 2015–2022
0–4-years of age 5–17 years of age
2015 221,500 610,800
2022 243,300 639,000
Change +21,800 +28,200
% change +9.8% +4.6%
BCTF calculations, with figures from:
BC Stats. (May 2015). British Columbia Population Projections: 2015 to 2041, Table 3: British Columbia
Population by Selected Age Groups, Estimated (1971 to 2014), p.3 and Projected (2015 to 2041) and Table 6:
British Columbia Population by 5-year Age Group, Estimated (1971 to 2014) and Projected (2015 to 2041), p.6.
Access the PDF version of report at
www.bcstats.gov.bc.ca/StatisticsBySubject/Demography/PopulationProjections.aspx.
BC labour market projections say more teachers will be needed WorkBC projects supply and demand for occupations to 2022, making some optimistic
projections for BC school teachers. The report British Columbia 2022 Labour Market Outlook
(2014) projects job openings for BC teachers of 24,900 by 2022, the third highest of high-
demand occupations in British Columbia.
The following table shows the projected number of job openings for elementary and secondary
teachers and educational counsellors in the seven regions of BC to 2022. In five of these regions,
at least three-quarters of the job openings are to replace teachers, mostly for reasons of
retirement.
Total job openings projected to 2022 for secondary and elementary school teachers and educational counsellors
Total projected job openings for elementary and secondary
teachers and educational counsellors to 2022
Region Expansion (Growth)
Replacement (Mostly retiring workers)
Total
Vancouver Island/Coast 830 3,250 4,080 Mainland/Southwest 2,100 12,480 14,580 Thompson-Okanagan 600 2,200 2,800 Kootenay 310 810 1,120 Cariboo 170 960 1,130 North Coast and Nechako 30 450 480 Northeast 250 460 710
Source: WorkBC. (2014). British Columbia 2022 Labour Market Outlook - Work BC projections for supply and
demand for occupations to 2022, www.workbc.ca/WorkBC/media/WorkBC/Documents/Docs/BC-LM-Outlook-2012-
2022.pdf.
BCTF Education Funding Brief September 2015 22
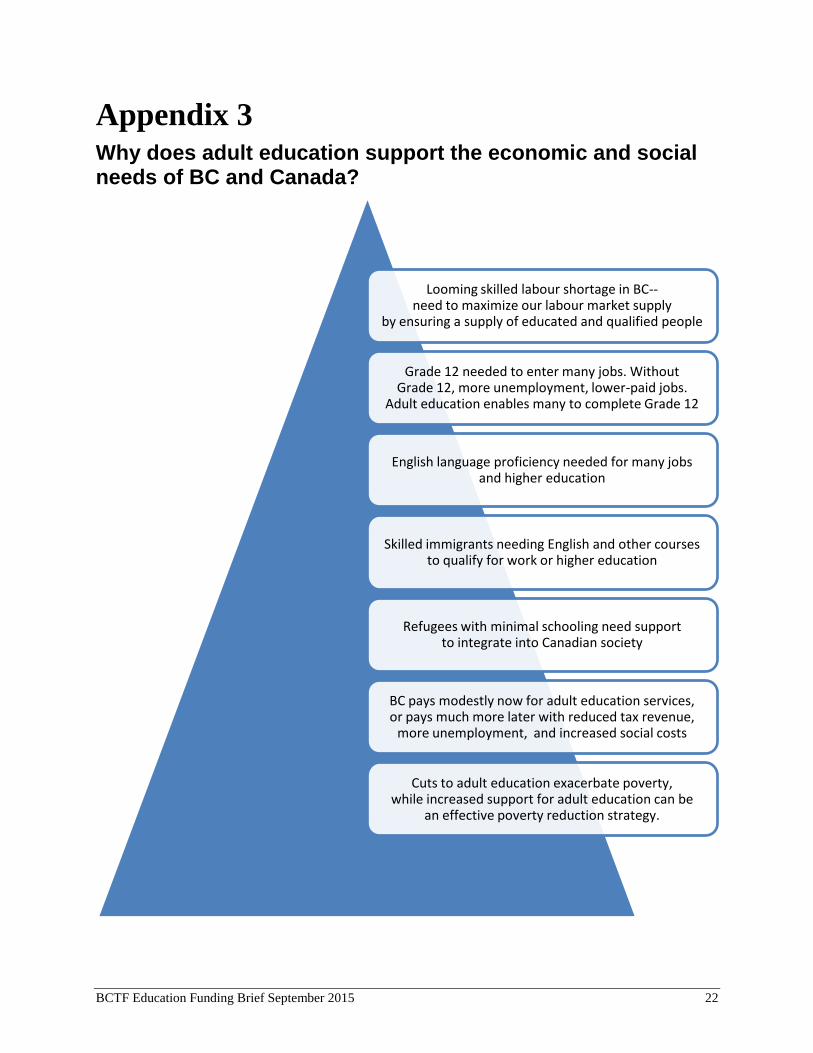
Appendix 3 Why does adult education support the economic and social needs of BC and Canada?
Looming skilled labour shortage in BC-- need to maximize our labour market supply
by ensuring a supply of educated and qualified people
Grade 12 needed to enter many jobs. Without Grade 12, more unemployment, lower-paid jobs.
Adult education enables many to complete Grade 12
English language proficiency needed for many jobs and higher education
Skilled immigrants needing English and other courses to qualify for work or higher education
Refugees with minimal schooling need support to integrate into Canadian society
BC pays modestly now for adult education services, or pays much more later with reduced tax revenue,
more unemployment, and increased social costs
Cuts to adult education exacerbate poverty, while increased support for adult education can be
an effective poverty reduction strategy.

BCTF Education Funding Brief September 2015 23
Appendix 4 Class composition 2014–15 update
Class composition has grown steadily worse since 2006–07
The number of classes with 4 or more students with designated special needs (entitled to an
Individual Education Plan) increased from 9,559 in 2006–07 to 16,156 classes in 2014–15.
There are 6,597 more classes with 4 or more students with designated special needs (entitled
to an IEP) in 2014–15 than in 2006–07.
Class composition worsened since Bill 22 was implemented
Compared to three years ago (2011–12), there are 3,505 more classes with 4 or more students
with designated special needs (entitled to an IEP).
The number of classes with 4 or more IEP students decreased by 7, from 16,163 classes in
2013–14 to 16,156 classes in 2014–15.
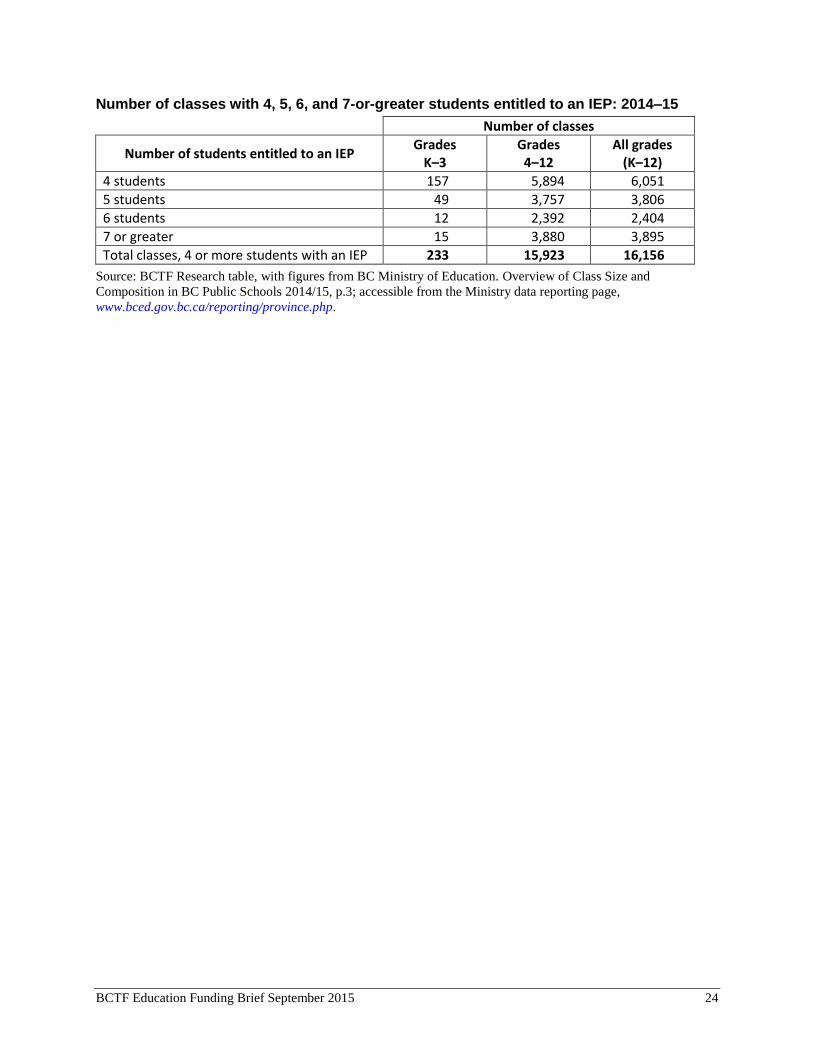
In 2014–15, one in four classes in BC public schools have 4 or more designated students
with special needs (entitled to an IEP).
In 2014–15, there are 6,051 classes with 4 students entitled to an IEP, 3,806 classes with 5
students entitled to an IEP, 2,404 classes with 6 students entitled to an IEP, and 3,895 classes
with 7 or more students entitled to an IEP.
Class composition, 2006–07 to 2014–15 Percentage of classes with 4 or more
students with an IEP
Number of classes with 4 or more students entitled to an IEP Total classes
Year Grades K–3 Grades 4–12 All grades (K–12) Province
2006–07 153 9,406 9,559 68,665 13.9%
2007–08 141 10,172 10,313 68,693 15.0%
2008–09 141 10,844 10,985 68,357 16.1%
2009–10 127 11,832 11,959 67,473 17.7%
2010–11 122 12,118 12,240 64,909 18.9%
2011–12 122 12,529 12,651 64,827 19.5%
2012–13 188 14,697 14,885 67,089 22.2%
2013–14 226 15,937 16,163 68,020 23.8%
2014–15 233 15,923 16,156 66,596 24.3%
BCTF Research table, with figures from BC Ministry of Education (2006–07 to 2014–15 reports). Overview of
Class Size and Composition in BC Public Schools, p. 3; accessible from the Ministry data reporting page,
www.bced.gov.bc.ca/reporting/province.php. The figure for total classes is on p. 2.
Note: The 2006–07 report is not available online. Contact BCTF Research for a PDF version of the report.
BCTF Education Funding Brief September 2015 24
Number of classes with 4, 5, 6, and 7-or-greater students entitled to an IEP: 2014–15
Number of classes
Number of students entitled to an IEP Grades
K–3 Grades
4–12 All grades
(K–12)
4 students 157 5,894 6,051
5 students 49 3,757 3,806
6 students 12 2,392 2,404
7 or greater 15 3,880 3,895
Total classes, 4 or more students with an IEP 233 15,923 16,156
Source: BCTF Research table, with figures from BC Ministry of Education. Overview of Class Size and
Composition in BC Public Schools 2014/15, p.3; accessible from the Ministry data reporting page,
www.bced.gov.bc.ca/reporting/province.php.

BCTF Education Funding Brief September 2015 25
Appendix 5 Independent school funding increasing at a faster rate than public school funding
Over the last decade, funding for independent schools has increased by 61.1%—three times the
percentage increase for public schools (19.7%).
* Public schools funding includes Instruction, Administration, and Learning Improvement Fund.
Source: BCTF calculations and chart, figures from Ministry of Education. (February 17, 2015). Ministry of
Education Budget 2015 Overview, February 2015, pp. 3–4.
Budget 2015 projections over the three-year plan (2015–16, 2016–17, and 2017–18) show K–12
funding increasing by 33.4% for independent schools, and by only 3.3% for public schools.
Source: BCTF calculations and chart with data from:
Public schools funding: Ministry of Education. 2015/16 Operating Grants Manual (March 2015), p.1.
Independent schools funding: 2015–16 figures from Ministry of Education. Ministry of Education Budget 2015
Overview, February 2015, pp. 3–4 (February 17, 2015).
2015-09-17
JI/LK:unifor464/MW:af:tfeu
19.7%
61.1%
0%
10%
20%
30%
40%
50%
60%
70%
Public* Independent
Percentage change in funding for public and independent schools, 2005-06 to 2015-16(est.)
3.3%
33.4%
0%
5%
10%
15%
20%
25%
30%
35%
40%
Public schools funding Independent schools funding
Budget 2015 projections: Percentage increase in funding for public schools and independent schools over three-year plan
(2015-16, 2016-17, and 2017-18)
+$153.7 M
+$93.7 M