education participation in sri lanka – why all are not in school nisha arunatilake institute of...
TRANSCRIPT

Education Participation in Sri Lanka – Why all are not in school
Nisha ArunatilakeInstitute of Policy Studies of Sri
Lanka

Background Formal education in Sri Lanka is provided
through an extensive network of more than 10,000 schools spread across the country
Since the Free education act of 1949 education has been free up to first degree University level
Only 93% of 5-14 year olds are in school 97% - among the richest one fifth 92% among the poorest one fifth

Background contd… Since 1987 Education has been decentralized
But all policies formulated and implemented from the centre
Provincial authorities largely limited to administrative functions
Ambitious development plans, but funding problems impeding implementation
Often recurrent expenditure takes priority over much needed physical and human capital investment related expenditure
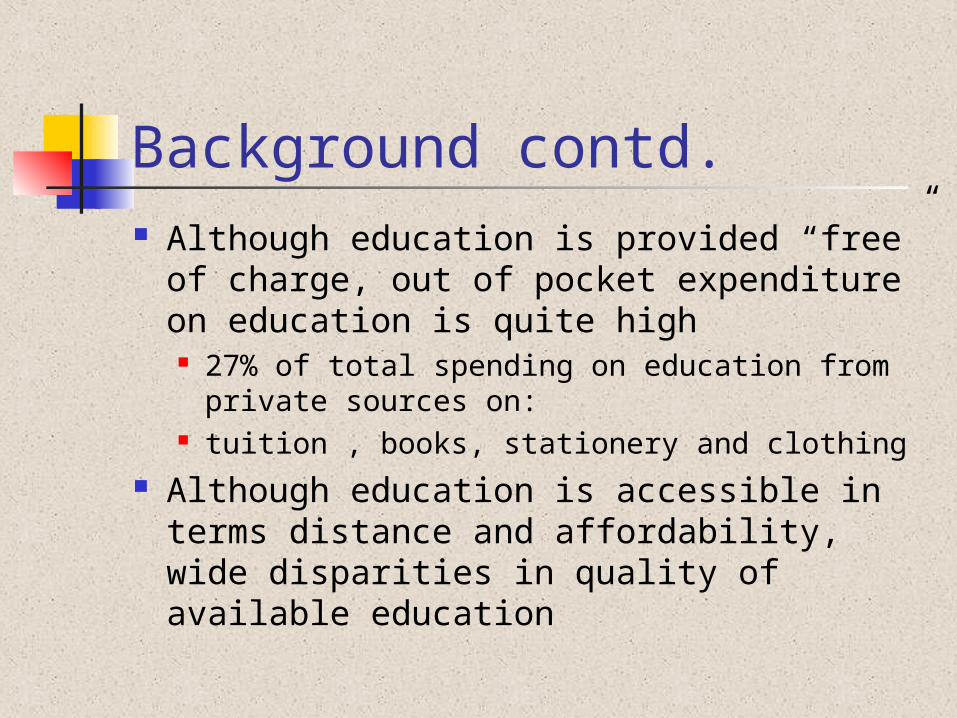
Background contd. Although education is provided “free” of
charge, out of pocket expenditure on education is quite high 27% of total spending on education from
private sources on: tuition , books, stationery and clothing
Although education is accessible in terms distance and affordability, wide disparities in quality of available education

WP NP/EP
NCP UP Urban
Rural Estate
Divided classes (%)
72 96 15 94 95 93 73
Separate Furniture for students (%)
62 28 48 58 53 61 71
Teacher availability (%)
97 82 89 84 96 93 77
Student Teacher ratio
20 31 18 21 24 21 15
Availability of resources in govt. Schools

Children in communities with poor school resources – by expenditure quintile (per cent)
1 (poorest)
2 3 4 5
Poor ed. inputs 66 61 61 56 46
Teacher vacancies 50 44 47 35 31
Poor phy. facilities 79 75 79 70 60Sample size 1519 139
81278 114
5962
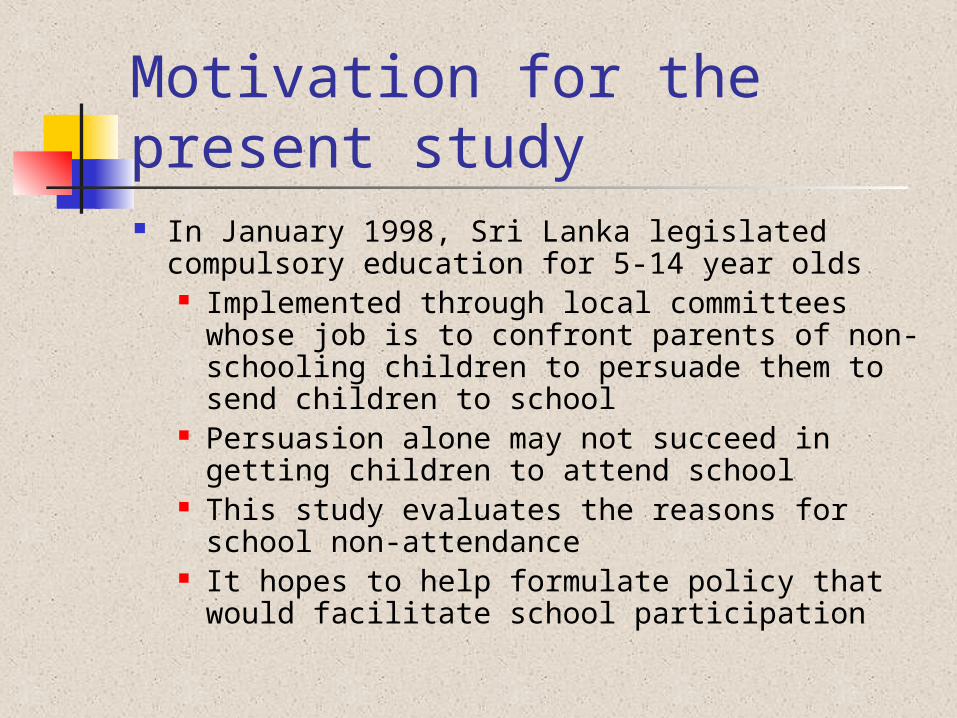
Motivation for the present study In January 1998, Sri Lanka legislated
compulsory education for 5-14 year olds Implemented through local committees
whose job is to confront parents of non-schooling children to persuade them to send children to school
Persuasion alone may not succeed in getting children to attend school
This study evaluates the reasons for school non-attendance
It hopes to help formulate policy that would facilitate school participation

Data Sri Lanka Integrated Survey
1999/2000
7,500 households representing all provinces in 500 urban rural and estate communities
The survey collected information both at the household and the community levels

Sample and Estimation Sample is restricted to children
between 5 to 14 years Dependent variable – school
participation Results estimated using binary
logit
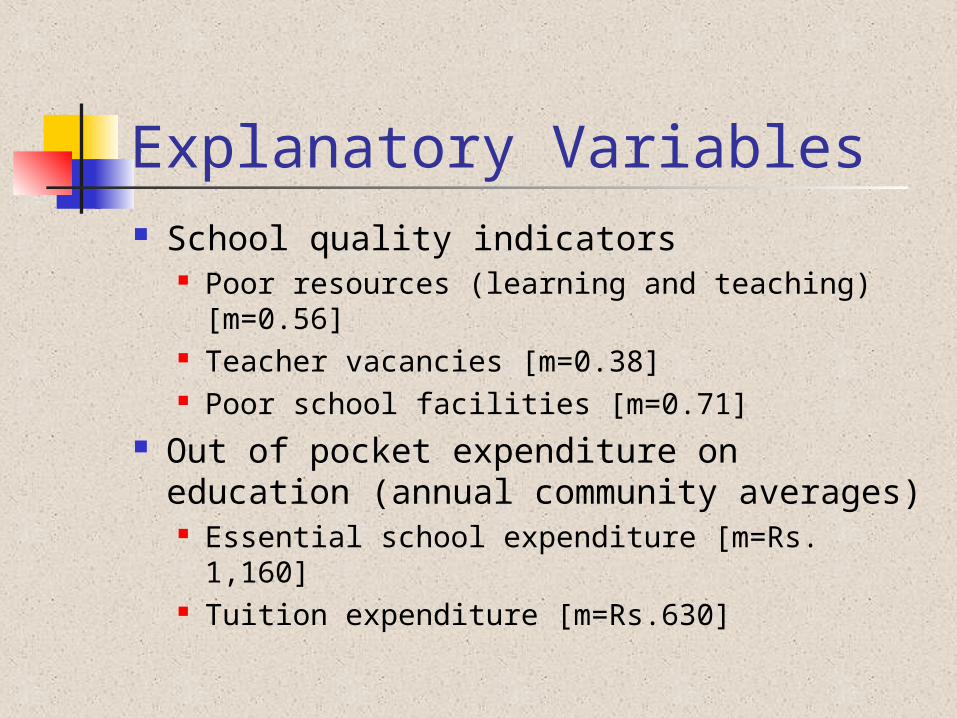
Explanatory Variables School quality indicators
Poor resources (learning and teaching) [m=0.56]
Teacher vacancies [m=0.38] Poor school facilities [m=0.71]
Out of pocket expenditure on education (annual community averages) Essential school expenditure [m=Rs. 1,160] Tuition expenditure [m=Rs.630]
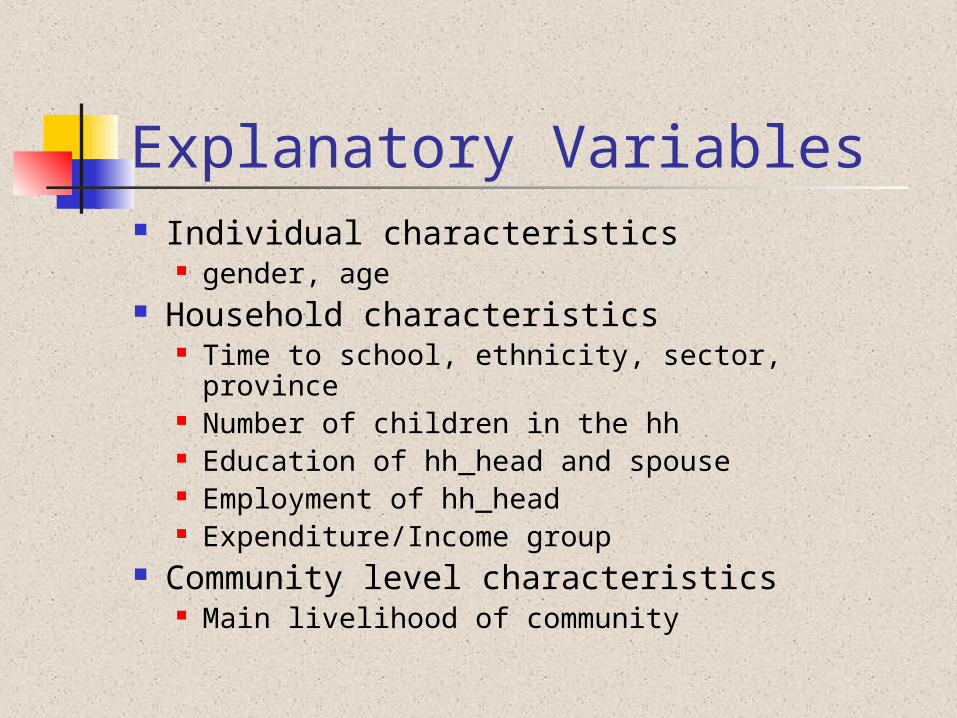
Explanatory Variables Individual characteristics
gender, age Household characteristics
Time to school, ethnicity, sector, province Number of children in the hh Education of hh_head and spouse Employment of hh_head Expenditure/Income group
Community level characteristics Main livelihood of community

Main Findings School Quality Indicators
Teacher vacancies Negatively affected school attendance
In overall, richest, poorest and under_9
Poor Physical facilities in school Unexpectedly, positively influences
school participation of children nine and younger
Possibly due to subjective evaluation of school facilities

Main Findings Direct costs of schooling
Tuition expenditure Negatively influences school participation
In the overall and poorest, 9 or less, 9 plus samples
Essential school expenditure (text books, stationery, etc.)
Negatively influences school participation In the poorest and the 9 plus samples

Main Findings Location and Community Level
Characteristics Community livelihood
Being in a community where main livelihood is agriculture or fishing negatively influences school participation
Overall, poorest and richest samples, and 9 or less (?)

Main Findings Other HH characteristics
Ethnicity influences school participation significantly
Relative to Sinhalese (main ethnic group) children from other ethnic groups less likely to be in schools (explanation – teacher vacancies?/ cultural factors?)
Employment of hh_head HH_head owning a farm, in informal employment or
not working negatively affects schooling HH composition
Children from HHs with young kids (0 to 6) less likely to be in school
Main Findings Access to schools
Did not influence school participation significantly
HH expenditure/income Relative to children in the richest
group children in the poorest group, less likely to attend school
Main Findings Individual level characteristics
Being a male (in the poorer samples) decreased the likelihood of attending school
(unusual for most developing countries/ possibly due to larger opportunity cost of attending school)
Age Children seem to start schooling late (not at
age 5) and drop out as they age – school attendance is highest for children in 9 – 11 age group

Summary Poverty influences schooling negatively School quality affects schooling decision
(teacher vacancies/ tuition expenditure) Opportunity costs of schooling affects
schooling decision Being in an agricultural/ fishing community Employment of hh_head Coming from families with small children

Summary Limited know-how/ motivation of
parents affects schooling Starting school late, cultural factors

Discussion Appointment of local communities to
compel parents to send children to school is not a sustainable solution
Despite government’s attempts to assist school attendance through the provision of free uniforms and text books, high out of pocket expenditure is keeping children away from school

Discussion Children from farming communities and
families owning farms are probably not attending school due to high opportunity costs. School calendars in these areas should take into account the high demand periods for farm labour
More attention should be given to improve quality of schooling

Discussion Lastly, inadequacy of government
funding seems to affect many problems related to school quality. Especial attention should be given to improve funding for the sector – either public or private
Thank you