education seminar: self-service bi, logical data warehouse and data lakes
TRANSCRIPT

Educational Seminar:Self-service BI, Logical Data Warehouse and Data Lakes
December 2016

Speakers
Chuck DeVries
VP, Enterprise Architecture
Vizient
Ravi Shankar
CMO
Denodo
Chris Walters
Sr. Solutions Consultant
Denodo
Charles Yorek
VP, Business Analytics
iOLAP

Agenda1.Customer Use Case: Powering Self-Service BI with Logical
Data Warehouse and Operationalizing Logical Data Lakes
2.Logical Data Lakes/ Warehouse: Architectural Patterns and
Performance Considerations
3.Demo: Building Logical Data Lakes/ Warehouse using Data
Virtualization
4.Best Practices: Big Data Virtualization Deployment and Management
5.Panel: Self-Service BI, Logical Data Warehouse, Data Lakes

Powering Self Service BI with Logical Data Warehouses and Operationalizing Data Lakes
Chuck DeVries
December 2016

AGENDA- Who is Vizient- Self Service BI on distributed data sets- Modern Data Architecture

Vizient Presentation │ Date │ Confidential Information6
Who is Vizient?
• Combination of VHA, University HealthSystem
Consortium, Novation, MedAssets Spend and
Clinical Resource Management and Sg2
• Experts with the purchasing power, insights
and connections that accelerate performance
for members

Vizient Presentation │ Date │ Confidential Information7
Purpose, mission, strategic aspirations
Purpose
To ensure our members
deliver exceptional, cost-
effective care
Mission
To connect members
with the knowledge,
solutions and expertise
that accelerate
performance
Strategic Aspirations
• Become an
indispensable partner
to health care
organizations
• Become a leader
in health care
innovation
• Accelerate our
growth rate

Vizient Presentation │ Date │ Confidential Information8
Vizient members span the care continuum
Vizient serves thousands of health care organizations
across the nation, from independent, community-based
organizations to large, integrated systems including
• Acute care hospitals
• Academic medical centers
• Non-acute community health care providers
• Pediatric facilities
Vizient Presentation │ Date │ Confidential Information9
Member-owned, member-driven
MEMBERSHIP BENEFITS
• Harness powerful insights
• Accelerate performance
• Achieve scale and efficiency
• Make innovative connections
• Be more agile
• Build knowledge
• Gain advocates on important policy issues
We measure our success by our members’ success. We fuel
powerful connections that help members focus on what they
do best: deliver exceptional, cost-effective care.

We deliver brilliant, data-driven resources and
insights — from benchmarking and predictive analytics
to cost-savings — to where they’re needed most.
Empowering brilliant connections
Vizient Presentation │ Date │ Confidential Information11
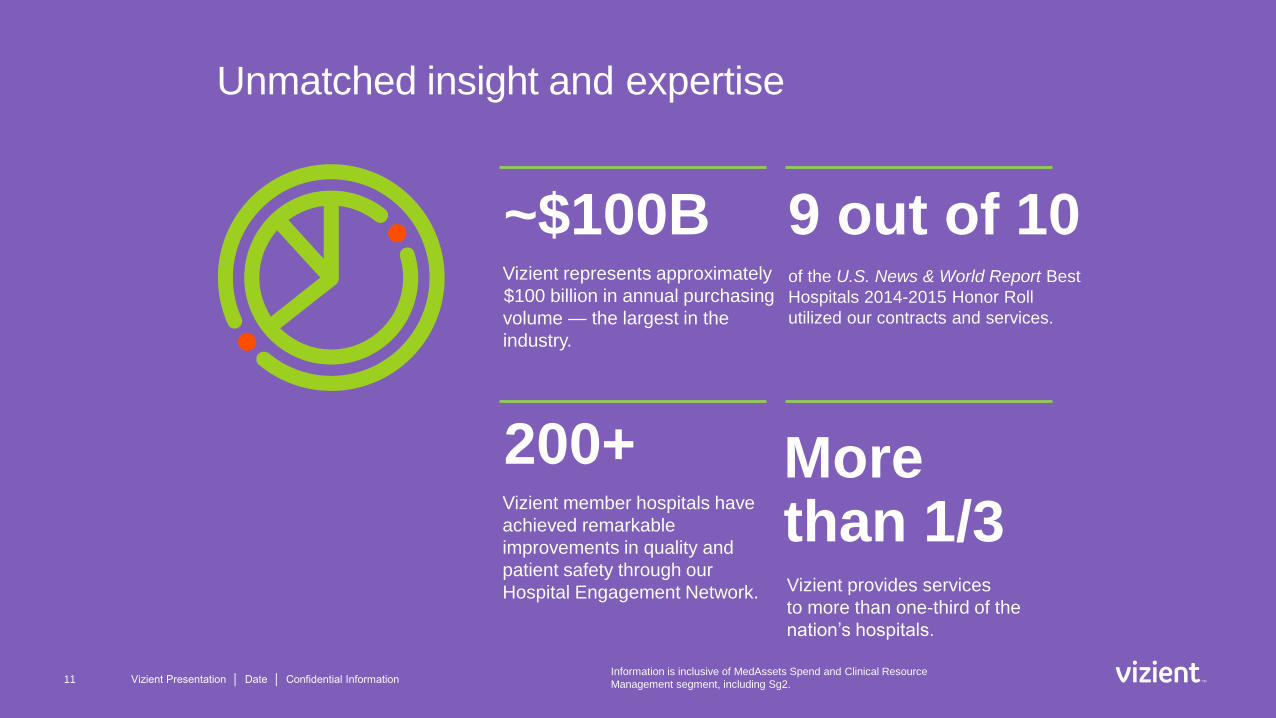
Unmatched insight and expertise
9 out of 10of the U.S. News & World Report Best
Hospitals 2014-2015 Honor Roll
utilized our contracts and services.
~$100BVizient represents approximately
$100 billion in annual purchasing
volume — the largest in the
industry.
200+Vizient member hospitals have
achieved remarkable
improvements in quality and
patient safety through our
Hospital Engagement Network.
More than 1/3Vizient provides services
to more than one-third of the
nation’s hospitals.
Information is inclusive of MedAssets Spend and Clinical Resource
Management segment, including Sg2.

Vizient Presentation │ Date │ Confidential Information12
Examples of powering self service discovery with a Logical Data Warehouse approach
Vizient Presentation │ Date │ Confidential Information13

Financial Data Mart
Primary Use Case: Unify disparate accounting and finance data marts
across various legacy organizations into a logical data warehouse
Secondary Use Cases
• Provide a unified source for key BI initiatives like the GPO Dashboard
• Support reporting needs as legacy systems are migrated or replaced during
integration of Vizient and L-MDAS (dbVision, etc.)
• Provide a final resting place for archived legacy sources like Solomon, Epicor,
etc.
Vizient Presentation │ Date │ Confidential Information14
VHA
MedAssets
UHC

Financial Data Mart
Architectural Approach
• Denodo was selected as the data platform in
order to utilize the following features of the
software:
–Data Virtualization allows sources in various mediums and
locations to be integrated without physically moving the data
–Data Abstraction allows data to be represented consistently within
the datamart while data sources are moved or replaced behind
the scenes
–Data Integration allows for a single seamless view to be created
across a subject area (e.g. “Supplier Sales”) with varied data
transformation rules for each data source within the subject area
(PRS, dbVision) allowing a logical data warehouse to be created
without the need to instantiate a physical on
Vizient Presentation │ Date │ Confidential Information15

GPO Dashboard
Primary Use Case: Provide a consolidated view of supplier sales data
across all customers of legacy Vizient & Med Assets organizations.
Architectural Approach
• Financial Datamart (on Denodo) for data source
• Denodo TDE Exporter Tool for daily data extracts to Tableau:
– Report Data
– Report User Security
• Tableau for report development and distribution
Vizient Presentation │ Date │ Confidential Information16
Over 400 active users across 6
departments
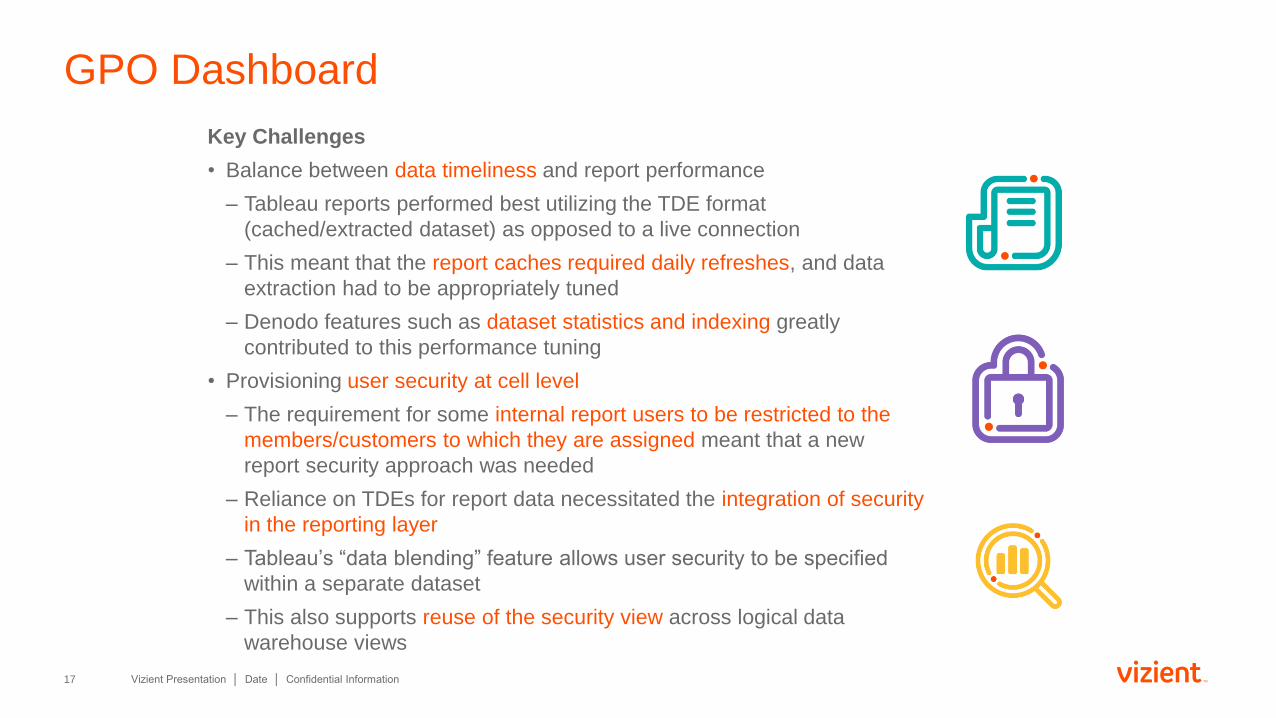
GPO Dashboard
Key Challenges
• Balance between data timeliness and report performance
– Tableau reports performed best utilizing the TDE format
(cached/extracted dataset) as opposed to a live connection
– This meant that the report caches required daily refreshes, and data
extraction had to be appropriately tuned
– Denodo features such as dataset statistics and indexing greatly
contributed to this performance tuning
• Provisioning user security at cell level
– The requirement for some internal report users to be restricted to the
members/customers to which they are assigned meant that a new
report security approach was needed
– Reliance on TDEs for report data necessitated the integration of security
in the reporting layer
– Tableau’s “data blending” feature allows user security to be specified
within a separate dataset
– This also supports reuse of the security view across logical data
warehouse views
Vizient Presentation │ Date │ Confidential Information17

Contract Sales Actualizer Dashboard
Primary Use Case: Integrate Member Spend and Supplier Sales
data from all Vizient organizations to identify opportunities for
increasing contract utilization
Other Use Cases:
• Maintain consistency (Single Source Of Truth) with GPO
dashboard regarding:
– Supplier Sales Data
– Dimension Data
– User Security
Architectural Approach
• Data source utilizes Denodo to reuse overlapping datasets (sales,
dimensions, security) while allowing separate virtualized views to
be created for new datasets (member spend) which can be also be
reused by future projects via a logical data warehouse
• Reporting components match approach used by GPO Dashboard
Vizient Presentation │ Date │ Confidential Information18

Contract Sales Actualizer Dashboard
Key Challenges
• Successful integration of Exadata RDM as a data source for Denodo
– Approach utilizes the strength of Exadata RDBMS for aggregating
large quantities of data quickly
– Denodo to integrate the data with similar legacy SQL Server data
sources to create a comprehensive view of Vizient member spend
• Scalability/Configuration Management
– Advances were made to support parallel development of this
project and continued efforts on GPO dashboard
– Compartmentalization features within Denodo allow for code
changes in each project to be version controlled and assessed for
dependencies
– Process guidelines are being authored to allow for multiple
development efforts on the same datasets
Vizient Presentation │ Date │ Confidential Information19

Modern Data Architecture
Vizient Presentation │ Date │ Confidential Information20

Virtual warehouse
Modern Data Architecture
Vizient Presentation │ Date │ Confidential Information21
Open
Data
Purchase
Data
RDBMS
Rules
RDBMS
ODS
Datawarehouse

Our central focus is helping members
apply data and insights in new ways to
achieve sustainable results. Our
success is ultimately defined by the
success of our members in serving their
patients and communities.
Curt Nonomaque, President and CEO, Vizient
Logical Data Lakes/ Warehouse:Architectural Patterns and Performance Considerations
Ravi Shankar, CMO
December 2016

Agenda1.The Logical Data Warehouse
2.Architectural Patterns
3.Performance Considerations
4.Customer Success Studies

Logical Data Warehouse
Description:
A semantic layer on top of the data warehouse that keeps the business data definition.
Allows the integration of multiple data sources including enterprise systems, the data warehouse, additional processing nodes (analytical appliances, Big Data, …), Web, Cloud and unstructured data.
Publishes data to multiple applications and reporting tools.
27
Logical Data Warehouse
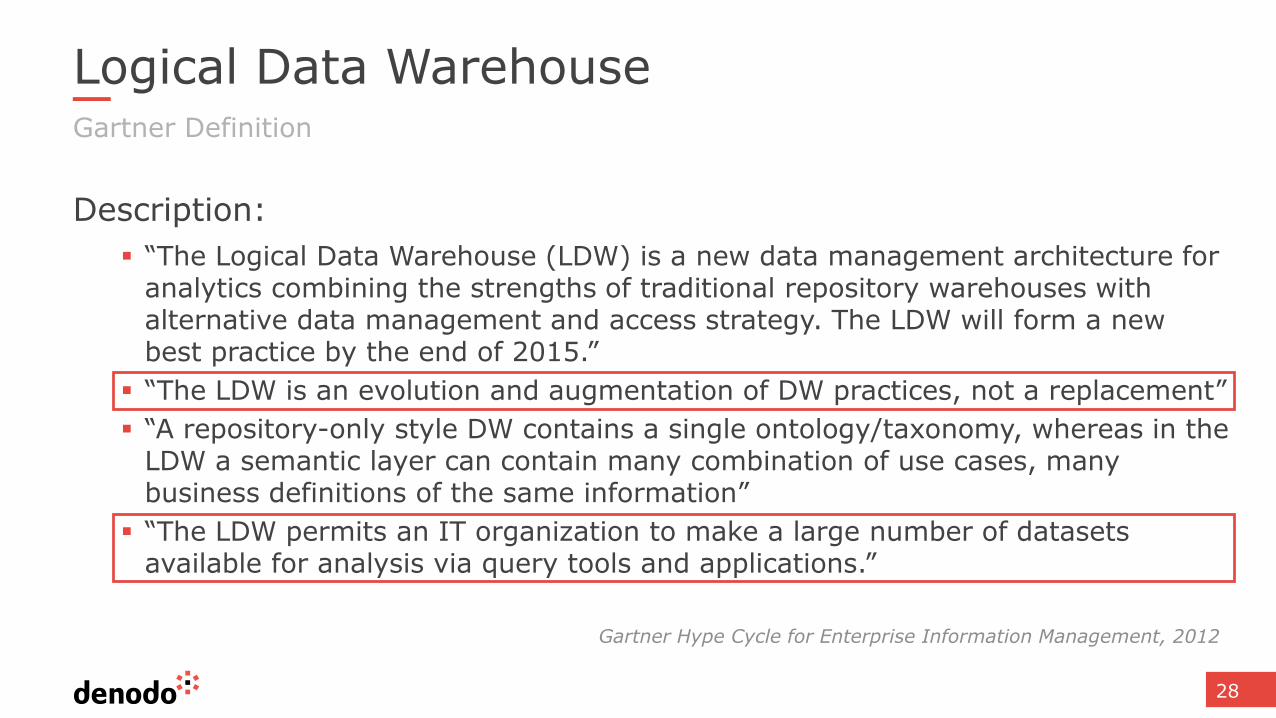
Description:
“The Logical Data Warehouse (LDW) is a new data management architecture for analytics combining the strengths of traditional repository warehouses with alternative data management and access strategy. The LDW will form a new best practice by the end of 2015.”
“The LDW is an evolution and augmentation of DW practices, not a replacement”
“A repository-only style DW contains a single ontology/taxonomy, whereas in the LDW a semantic layer can contain many combination of use cases, many business definitions of the same information”
“The LDW permits an IT organization to make a large number of datasets available for analysis via query tools and applications.”
28
Gartner Definition
Gartner Hype Cycle for Enterprise Information Management, 2012

29
Data Virtualization as the Data Integration Layer
Data Virtualization as Data Integration/Semantic Layer
Data Virtualization
EDW ODS
• Move data integration and semantic layer to
independent Data Virtualization platform
• Purpose built for supporting data access
across multiple heterogeneous data sources
• Separate layer provides semantic models for
underlying data
• Physical to logical mapping
• Enforces common and consistent security
and governance policies
• Gartner’s recommended approach

Logical Data Warehouse
30
EDW Hadoop Cluster
SalesHDFSFiles
Document Collections
NoSQLDatabase
ERP
Database Excel

What about the Logical Data Lake?
A Data Lake will not have a star or snowflake schema, but rather a more
heterogeneous collection of views with raw data from heterogeneous
sources
The virtual layer will act as a common umbrella under which these
different sources are presented to the end user as a single system
However, from the virtualization perspective, a Virtual Data Lake shares
many technical aspects with a LDW and most of these contents also
apply to a Logical Data Lake

Architectural PatternsFor a Logical Data Warehouse

33
Common Patterns for a Logical Data Warehouse
1. The Virtual Data Mart
2. DW + MDM
3. DW + Cloud
4. DW + DW
5. DW historical offloading

34
1. Virtual Data Marts
Business friendly models defined on top of one or multiple systems,
often “flavored” for a particular division
Motivation
Hide complexity of star schemas for business users
Simplify model for a particular vertical
Reuse semantic models and security across multiple reporting engines
Typical queries
Simple projections, filters and aggregations on top of curated “fat tables” that
merge data from facts and many dimensions
Simplified semantic models for business users

35
1. Virtual Data Marts
Time Dimension Fact table(sales)
Product
Retailer Dimension
Sales
EDW Others
Product
Prod. Details

36
2. DW + MDM
Slim dimensions with extended information maintained in an external
MDM system
Motivation
Keep a single copy of golden records in the MDM that can be reused across
systems and managed in a single place
Typical queries
Join a large fact table (DW) with several MDM dimensions, aggregations on
top
Example
Revenue by customer, projecting the address from the MDM

37
2. DW + MDM dimensions
Time Dimension Fact table(sales) Product Dimension
Retailer Dimension
EDW MDM

38
3. DW + Cloud dimensional data
Fresh data from cloud systems (e.g. SFDC) is mixed with the EDW, usually
on the dimensions. DW is sometimes also in the cloud.
Motivation
Take advantage of “fresh” data coming straight from SaaS systems
Avoid local replication of cloud systems
Typical queries
Dimensions are joined with cloud data to filter based on some external attribute
not available (or not current) in the EDW
Example
Report on current revenue on accounts where the potential for an expansion is
higher than 80%

39
3. DW + Cloud dimensional data
Time Dimension Fact table(sales) Product Dimension
Customer Dimension
CRM
SFDC Customer
EDW

40
4. Multiple DW integration
Motivation
Merges and acquisitions
Different DWs by department
Transition to new EDW Deployments (migration to Spark, Redshift, etc.)
Typical queries
Joins across fact tables in different DW with aggregations before or after the JOIN
Example
Get customers with a purchases higher than 100 USD that do not have a fidelity
card (purchases and fidelity card data in different DW)
Use of multiple DW as if it was only one

41
4. Multiple DW integration
Time Dimensi
on
Sales fact
Product Dimension
Region
Finance EDW
City
Marketing EDW
Customer Fidelity factsProduct Dimension
*Real Examples: Nationwide POC, IBM tests
Store
42
5. DW Historical Partitioning
Only the most current data (e.g. last year) is in the EDW. Historical data is offloaded to a Hadoop cluster
Motivations
Reduce storage cost
Transparently use the two datasets as if they were all together
Typical queries
Facts are defined as a partitioned UNION based on date
Queries join the “virtual fact” with dimensions and aggregate on top
Example
Queries on current date only need to go to the DW, but longer timespans need to merge with Hadoop
Horizontal partitioning
43
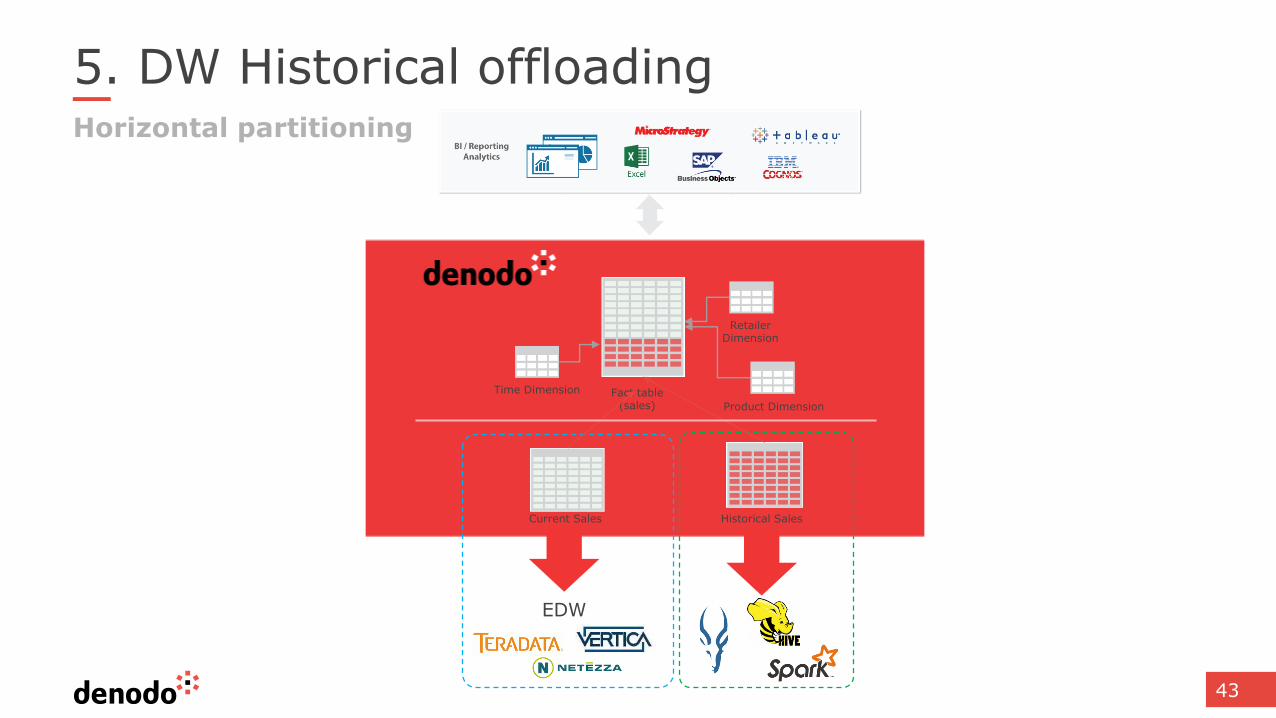
5. DW Historical offloading Horizontal partitioning
Time Dimension Fact table(sales) Product Dimension
Retailer Dimension
Current Sales Historical Sales
EDW

Performance ConsiderationsIn a Logical Data Warehouse

45
It is a common assumption that a virtualized solution will
be much slower than a persisted approach via ETL:
1. There is a large amount of data moved through the
network for each query
2. Network transfer is slow
But is this really true?

46
Denodo has done extensive testing using queries from the standard benchmarking test
TPC-DS* and the following scenario
Compares the performance of a federated approach in Denodo with an MPP system where
all the data has been replicated via ETL
Customer Dim.2 M rows
Sales Facts290 M rows
Items Dim.400 K rows
* TPC-DS is the de-facto industry standard benchmark for measuring the performance of decision support solutions including, but not limited to, Big Data systems.
vs.Sales Facts290 M rows
Items Dim.400 K rows
Customer Dim.2 M rows
Performance ComparisonLogical Data Warehouse vs. Physical Data Warehouse

47
Performance Comparison
Query DescriptionReturned
RowsTime Netezza
Time Denodo (Federated Oracle,
Netezza & SQL Server)
Optimization Technique (automatically selected)
Total sales by customer 1,99 M 20.9 sec. 21.4 sec. Full aggregation push-down
Total sales by customer and year between 2000 and 2004
5,51 M 52.3 sec. 59.0 sec Full aggregation push-down
Total sales by item brand 31,35 K 4.7 sec. 5.0 sec. Partial aggregation push-down
Total sales by item where sale price less than current
list price17,05 K 3.5 sec. 5.2 sec On the fly data movement
Logical Data Warehouse vs. Physical Data Warehouse
48
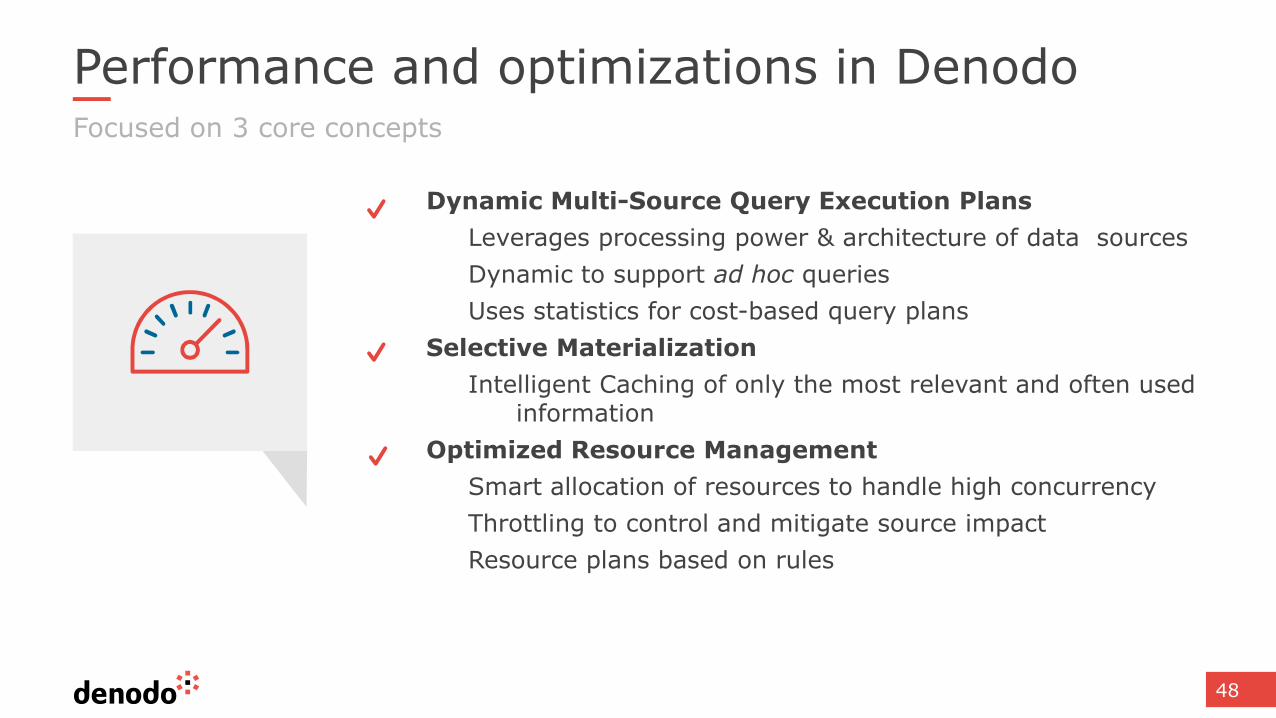
Performance and optimizations in DenodoFocused on 3 core concepts
Dynamic Multi-Source Query Execution Plans
Leverages processing power & architecture of data sources
Dynamic to support ad hoc queries
Uses statistics for cost-based query plans
Selective Materialization
Intelligent Caching of only the most relevant and often used information
Optimized Resource Management
Smart allocation of resources to handle high concurrency
Throttling to control and mitigate source impact
Resource plans based on rules

49
Performance and optimizations in DenodoComparing optimizations in DV vs ETL
Although Data Virtualization is a data integration platform, architecturally speaking it is more similar to a RDBMs
Uses relational logicMetadata is equivalent to that of a databaseEnables ad hoc querying
Key difference between ETL engines and DV:ETL engines are optimized for static bulk movements
Fixed data flowsData virtualization is optimized for queries
Dynamic execution plan per query
Therefore, the performance architecture presented here resembles that of a RDBMS

Success StoriesCustomer Case Studies

Autodesk Overview
• Founded 1982 (NASDAQ: ASDK)
• Annual revenues (FY 2015) $2.5B
Over 8,800 employees
• 3D modeling and animation software
Flagship product is AutoCAD
• Market sectors:
Architecture, Engineering, and Construction
Manufacturing
Media and Entertainment
Recently started 3D Printing offerings
51

Business Drivers for Change
• Software consumption model is changing
Perpetual licenses to subscriptions
User want more flexibility in how they use software
• Autodesk needed to transition to subscription pricing
2016 – some products will be subscription only
• Lifetime revenue higher with subscriptions
Over 3-5 years, subscriptions = more revenues
• Changing a licensing model is disruptive
52

Technology Challenges
• Current ‘traditional’ BI/EDW architecture not designed for data streams from online apps
Weblogs, Clickstreams, Cloud/Desktop apps, etc.
• Existing infrastructure can’t simply ‘go away’
Regulatory reporting (e.g. SEC)
Existing ‘perpetual’ customers
• ‘Subscription’ infrastructure work in parallel
Extend and enhance existing systems
With single access point to all data
• Solution – ‘Logical Data Warehouse’
53

Logical Data Warehouse at Autodesk
54
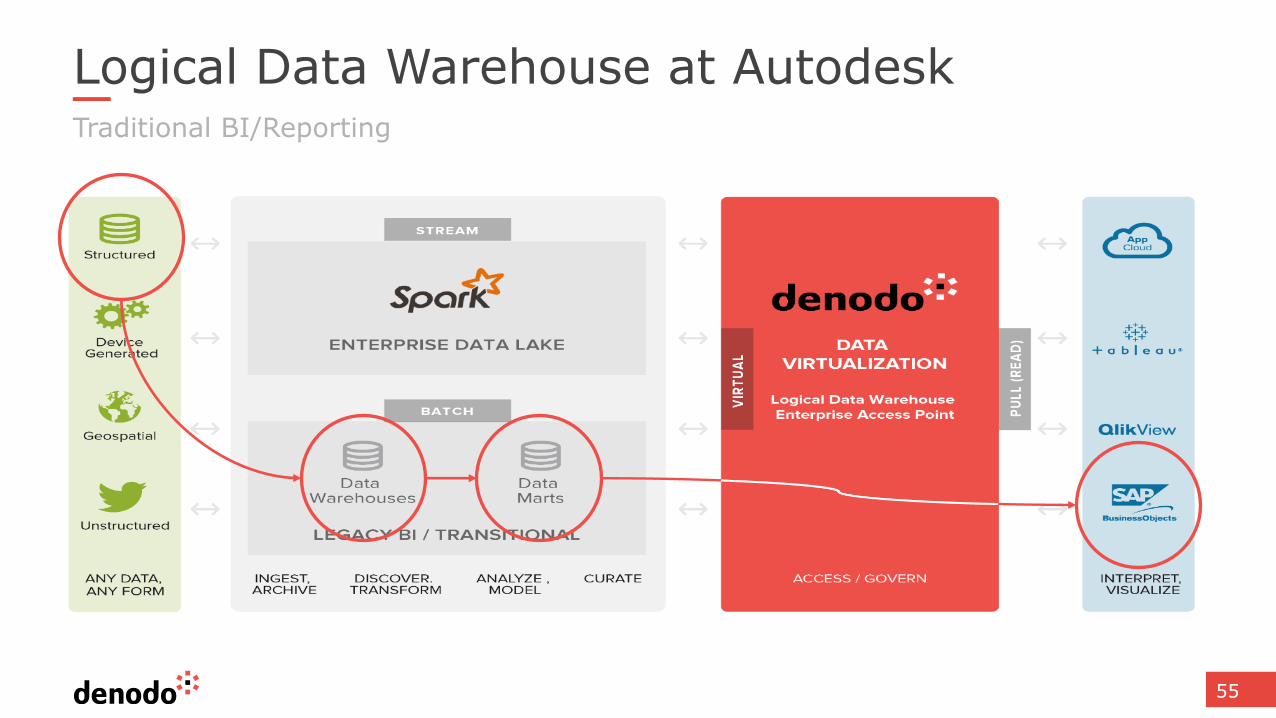
Logical Data Warehouse at AutodeskTraditional BI/Reporting
55

Logical Data Warehouse at Autodesk‘New Data’ Ingestion
56

Logical Data Warehouse at AutodeskReporting on Combined Data
57
58
Problem Solution Results
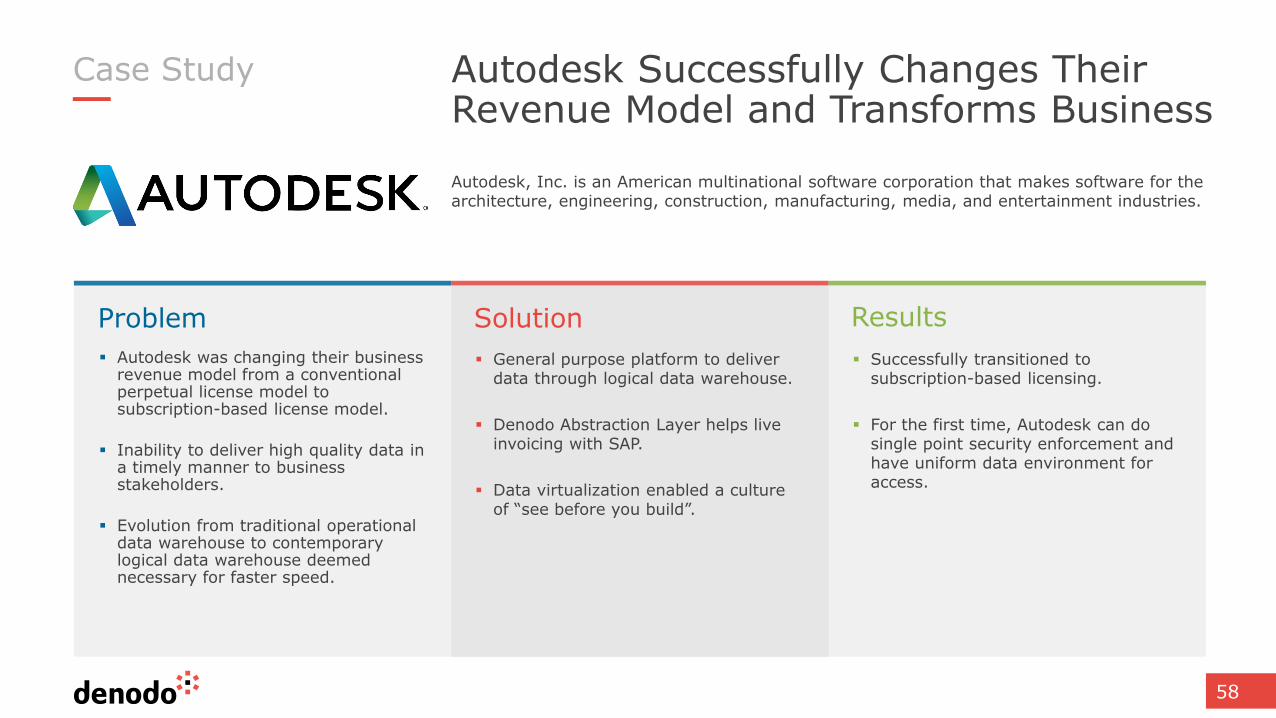
Case Study Autodesk Successfully Changes Their Revenue Model and Transforms Business
Autodesk was changing their business revenue model from a conventional perpetual license model to subscription-based license model.
Inability to deliver high quality data in a timely manner to business stakeholders.
Evolution from traditional operational data warehouse to contemporary logical data warehouse deemed necessary for faster speed.
General purpose platform to deliver data through logical data warehouse.
Denodo Abstraction Layer helps live invoicing with SAP.
Data virtualization enabled a culture of “see before you build”.
Successfully transitioned to subscription-based licensing.
For the first time, Autodesk can do single point security enforcement and have uniform data environment for access.
Autodesk, Inc. is an American multinational software corporation that makes software for the architecture, engineering, construction, manufacturing, media, and entertainment industries.

Demo

BIG DATA VIRTUALIZATION DEPLOYMENT AND
MANAGEMENTBest Practices

IOLAP, INC. - PROPRIETARY AND CONFIDENTIAL 61
IOLAP, INC. - PROPRIETARY AND CONFIDENTIAL 62
“Good work building ETL jobs this year”
- No CEO Ever…

IOLAP, INC. - PROPRIETARY AND CONFIDENTIAL 63
SO WHY DO WE STILL BUILD THEM?

IOLAP, INC. - PROPRIETARY AND CONFIDENTIAL 64
BUSINESS VALUE IS KING

IOLAP, INC. - PROPRIETARY AND CONFIDENTIAL 65
BUSINESS VALUE IS KING

IOLAP, INC. - PROPRIETARY AND CONFIDENTIAL 66
BIGGER SURE ISN’T EASIER
• SKILLS
• EASY IN/HARD OUT
• ALL DATA SOURCES AREN’T EQUAL

IOLAP, INC. - PROPRIETARY AND CONFIDENTIAL 67
VIRTUALIZATION BRIDGES THE SKILLS GAP
IOLAP, INC. - PROPRIETARY AND CONFIDENTIAL 68
VIRTUALIZATION PROVIDES EASE OF USE
How the data goes in… How it gets back out…

IOLAP, INC. - PROPRIETARY AND CONFIDENTIAL 69
SOMEBODY BOUGHT SOMETHING BACK IN THE DAY
• WE HAVE TO DEAL WITH LEGACY
• HOMOGENEITY ISN’T REALISTIC
• ALL DATA SOURCES AREN’T EQUAL

IOLAP, INC. - PROPRIETARY AND CONFIDENTIAL 70
WHAT NOW?
• POC USING DENODOEXPRESS OR AWS
• IOLAP CAN HELP BUILD A ROADMAP

Founded in 2000 16 years Delivering Success
Headquartered in Frisco, Texas National Customer Base
Extended Workforce
U.S. Company with Offshore Capabilities 60 consultants in the U.S. (full-time, salaried)
50 consultants in Europe (Offshore – BIDC)
IOLAP, INC. - PROPRIETARY AND CONFIDENTIAL
IOLAP OVERVIEWFocused solely on big data, data strategy, advanced analytics, and reporting
71
Onsite
Near Shore
Offshore

Speakers
Chuck DeVries
VP, Enterprise Architecture
Vizient
Ravi Shankar
CMO
Denodo
Chris Walters
Sr. Solutions Consultant
Denodo
Charles Yorek
VP, Business Analytics
iOLAP

Next Steps
Attend the webinar “Realizing the Promise of Data Lakes” on December 15Register at: www.denodo.com
Access Denodo on AWSVisit: www.denodo.com/en/denodo-platform/denodo-platform-for-aws
Download Denodo ExpressThe free way to Data Virtualization!Download from: www.denodo.com

Thanks!
www.denodo.com [email protected]
© Copyright Denodo Technologies. All rights reservedUnless otherwise specified, no part of this PDF file may be reproduced or utilized in any for or by any means, electronic or mechanical, including photocopying and microfilm, without prior the written authorization from Denodo Technologies.