educational achievement and ethnicity in compulsory schooling
TRANSCRIPT

Program on Education Policy and Governance Working Papers Series
Educational Achievement and Ethnicity in Compulsory Schooling
Christian Dustmann University College London
Stephen Machin
University College London
Uta Schoenberg University of Rochester
PEPG 08-12
Preliminary draft
Please do not cite without permission
Prepared for the CESifo/PEPG joint conference “Economic Incentives: Do They Work in Education”
Insights and Findings from Behavioral Research
CESifo Conference Center Munich, Germany May 16-17, 2008
1
Educational Achievement and Ethnicity in Compulsory Schooling
By
Christian Dustmann (UCL and CReAM)
Stephen Machin (UCL, CEP LSE, and CEPR)
Uta Schoenberg (University of Rochester and IZA)
April 2008
Preliminary Draft - Comments Welcome
Please do cite without authors’ permission
Abstract
This paper analyzes the evolution of the attainment gap between white British born and ethnic minority pupils throughout compulsory schooling, from the age of 5 to 16. At the start of school, pupils from most ethnic groups substantially lag behind White British pupils, but these gaps decline for all groups throughout primary and secondary school. Language is the single most important factor why most ethnic minority pupils improve relative to White British pupils. Although poverty explains part of the differences in levels, it cannot explain why ethnic minority pupils gain relative to or even overtake White British pupils. All ethnic minority groups initially attend worse performing schools than White British pupils. However, more than 25 percent of the subsequent relative improvement can be attributed to ethnic minority pupils moving up to better schools relative to White British pupils. Finally, our results draw attention to the possibility that the relative improvement of ethnic minority pupils may be related to teacher incentives to concentrate attention on particular pupils, caused by the publication of school league tables at the end of primary and secondary school.
2
1. Introduction
Achievement gaps between groups that are ethnically and visibly different have, if persistent, the
potential to create social disruption, segregation and dissonance. In the United States, the persistence
of the black-white wage gap in the labor market and the black-white achievement gap in primary and
secondary school is a key issue of public policy debate. Starting with the 1966 Coleman report,
numerous papers have been written that illustrate the gap and that try to determine the reasons of its
existence.1 In some European countries, a similar debate has started. Here it is the achievement gap
between ethnic minority descendents from former migration movements and native born Whites that
are a reason for concern. Ethnically diverse migration that is still recognizable in the second and
subsequent generations is a relatively recent phenomenon in Europe, and has been significant in
numbers only since the end of WWII. Nevertheless, in terms of potential for social disruption, it is of
similar importance than the black-white gap in the United States. This is the case in particular for those
European countries that have experienced large-scale immigration of ethnic diverse populations early
in the second half of the last century.2 In this group of countries, Britain stands out, as it is perhaps the
country in Europe with the longest history of immigration at a larger scale (starting in the late 1940’s),
and at the same time with the largest and most diverse population of ethnic minority inhabitants.
In this paper, we use an extraordinarily rich data source to document achievement gaps between
ethnic minority and white British born individuals in England. The six main ethnic minority groups
are: Black Caribbean (the group that perhaps most closely resembles blacks in the United States),
Black Non-Caribbean (of which the vast majority is of African descent), Indian, Pakistani,
Bangladeshi, and Chinese. When comparing the educational achievement of Britain’s adult ethnic
1 See e.g. Donohue and Heckman (1991), Chandra (2000), Neal (2004, 2006) for evidence on racial gaps in the labor market. Recent studies that analyze black-white achievement gaps in primary and secondary school include Fryer and Levitt (2004, 2007) and Hanushek and Rivkin (2006). 2 See for instance the latest unrest in the suburbs of French cities like Paris and Lyon, or the recent riots in Northern cities of the UK, both involving disadvantaged ethnic minority groups.
3
minority population with that of majority white British born, the remarkably strong educational
background of the ethnic minority population stands out: Ethnic minorities (British or foreign born) of
any of the large minority groups out-perform white British born in terms of educational achievements
(see e.g. Dustmann and Fabbri 2005 for a detailed analysis). This seems to be in sharp contrast to what
we observe very early on, just before the start of school: At the age of 5, ethnic minority children
under-perform in early cognitive tests compared to the white British born pupils.
In this paper, we focus on the intermediate period of compulsory schooling, between the age of 6
and 16, that lays foundation for later non-compulsory education choices and economic performance in
the labor market.3 Our analysis is based on administrative data for all pupils in public schools (primary
and secondary) in England. Our outcome variables are English and Mathematics test scores in nation-
wide exams at age 6/7 (so-called Key-Stage 1), age 10/11 (Key Stage 2), age 13/14 (Key Stage 3), and
the school leaving exams at age 15/16 (Key Stage 4). We confirm that at the beginning of primary
school (Key Stage 1), ethnic minority pupils (with the exception of Chinese pupils) lag behind white
British born pupils in both English and Mathematics. Remarkably, with the exception of Black
Caribbean pupils, all ethnic minority pupils gain relative to white British pupils throughout primary
school (i.e. from Key Stage 1 to Key Stage 2). Throughout secondary school, all ethnic minority
pupils, including Black Caribbean pupils, improve relative to or even overtake White British pupils.
Hence, the experience of Black Caribbean pupils in England differs from that of Black pupils in the
United States. Although they are among the worst performing groups in England, we find substantially
smaller attainment gaps than those commonly found in the United States. Further, while the black-wide
achievement gap in the United States widens substantially as pupils grow older, we find no evidence
for this throughout secondary school, and throughout primary school, the widening of the gap is
considerably smaller than in the United States. 3 For instance, Neal and Johnson (1996) find that the inclusion of the AFQT score (a measure of skill that is determined prior to labor market entry) eliminates black-white wage gap for women, and explains much of the gap for men.

4
Our paper is not the first to address this issue for the United Kingdom. The paper closest to ours is
Wilson et al. (2005) who nicely document the evolution of achievement gaps between white British
born and ethnic minority pupils throughout primary and secondary school, using the same data base
(though a different sample and different achievement measures) as us. Their findings are very similar
to ours, and they also have been corroborated in a number of later studies and research reports (see e.g.
DfES, 2005 and Cassen and Kingdon, 2007a, 2007b). We add to these papers by more extensively
exploring different explanations for the divergent evolution of test scores of White British and ethnic
minority pupils throughout primary and secondary school. We focus on three possible explanations:
family background characteristics, school quality, and teacher incentives.
With the exception of Black Caribbean pupils, English is not a mother tongue for a remarkably
high fraction of ethnic minority pupils. For instance, among Indians, the share of native speakers is
only 21%. We find that conditioning on English as a mother tongue substantially reduces attainment
gaps in both English and Mathematics, but slightly more so in English. More interestingly, the impact
of language declines as children become older. Consequently, language contributes to explaining why
ethnic minority pupils improve relative to white British pupils, and also helps to explain why the
relative improvement is smaller for Black Caribbean pupils than other ethnic minority pupils.
Moreover, with the exception of Indian and Chinese pupils, ethnic minority pupils are substantially
more likely to be in poverty, measured as the eligibility for free school lunches. The inclusion of this
variable likewise reduces ethnic minority attainment gaps substantially. However, poverty cannot
explain why ethnic minority pupils make greater progress than white British pupils.
An issue that has received a lot of attention in the United States is school quality. We find strong
evidence that ethnic minority pupils attend very different schools than white British pupils. For
instance, in primary school, the average share of White British classmates for pupils who are
themselves White British is 91.2%, but only 33.6% for Pakistani pupils. While much of the relative
5
improvement of ethnic minority pupils occurs within schools, at least 25% occurs between schools.
This suggests that ethnic minority pupils move up to better schools relative to White British pupils.
A third explanation that we explore—teacher incentives—has received relatively little attention.
The idea here is as follows. At the end of Key Stage 4, the Department for Education and Skills
publishes so-called school league tables, which report the share of pupils who passed at least 5 GCSEs,
including Mathematics and English, with a grade of C or better. These reports are extensively
discussed in the media, such as the Times or BBC news. This provides incentives for teachers to focus
their attention to pupils who are most likely to just pass or just fail the target. If ethnic minority pupils
are more likely to fall in this attention interval, then incentives induced by the publication of school
league tables could contribute to why ethnic minority pupils make greater progress than White British
pupils, in particular between Key Stage 3 and 4. By and large, we find evidence that is consistent with
this idea. In particular, such teacher incentives may contribute to why test score gains of ethnic
minority pupils relative to White British pupils are higher among poor pupils and in poor schools.
Teacher incentives are similar at the end of primary school at Key Stage 2, but here the evidence is
weaker.
The structure of the paper is as follows. The next section provides some background information
on ethnic minority groups in Britain and on the English school system. In Section 3, we describe the
data and the samples we use for our analysis. Section 4 documents the basic facts about achievement
gaps between British born white and ethnic minority pupils through primary and secondary school, and
briefly compares our findings to those of earlier US and UK studies. In section 5, we investigate three
explanations for our findings: different family background characteristics, different school quality, and
teacher incentives. Section 6 concludes.
6
2. Background This section first provides an overview of how ethnic minorities in the UK fare in the labor market.
We focus on England, since our school data only covers pupils in England, but not in Wales, Northern-
Ireland, and Scotland. We then briefly describe the English education system.
2.1 Ethnic Minorities in the Labor Market
According to the 2001 Census ethnic minority groups account for 9.1% of the total English
population, up from 6.2% in 1991. The six main ethnic minority groups are: Black Caribbean, Black
African, Indian, Pakistani, Bangladeshi, and Chinese. These are also the six groups that we will
distinguish in our analysis of school achievement below. Individuals who belong to these groups
arrived nearly exclusively in the period after the Second World War, but their arrivals have been at
different stages, and triggered by different events. While the majority of immigrants from the
Caribbean arrived in the period between 1955 and 1964, the main time of arrival of Black African,
Indian and Pakistani first generation groups was between 1965 and 1974 (Peach, 1996). Bangladeshi
arrivals peaked in the period 1980-1984. Next, we give a brief overview of the historical settlement
patterns of each group and their relative magnitude in the population. More detail can be found in
Dustmann and Theoropoulos (2006).
Black Caribbeans were the first ethnic minority group that arrived in the UK in large numbers.
Caribbean migration to Britain effectively started in 1948 (Peach, 1968); it was triggered by an
increasing demand for (mainly unskilled) labor in British Industry, and famously started with the
arrival of the Windrush in 1948 on British shores, bringing the first former British servicemen from the
Caribbean to Britain. Like subsequent waves of immigration, immigrants were initially considered as
remaining only temporarily in the UK, and returning to their origin country after the excess demand for
workers had ceased. Immigration from the Caribbean peaked in the early 1960s. According to the 2001
7
Census, Black Caribbeans make up 1.14% of the total English population and 12.6% of the ethnic
minority population.
Black Africans predominantly arrived during the 1960s, immediately after African countries
gained independence. Many traveled to the UK for higher education and technical training. The 2001
Census recorded 570,010 Black Africans, 1.16% of the total English population and 12.8% of the
ethnic minority population.
Indians have been in the UK since at least the 18th century. This early “pioneer phase” established
foundations for the subsequent large labor migration of the 1950s and 1960s. According to the 2001
Census, Indians form the largest ethnic minority group in England, numbering 1,027,002 and making
up 23.0% of the minority ethnic population and 2.1% of the total UK population.
Pakistani arrivals peaked in the late 60s to mid 70s. The 1991 Census counted 461,466 Pakistani in
England, or 0.96% of the total English population. By 2001 this number had increased to 707,599,
making up 1.44% of the total English population and 15.6% of the ethnic minority population.
The Bangladeshi community is the youngest of all the ethnic populations. In 1961 there were
around 6,000 Bangladeshi in Great Britain. By 2001, the number of individuals who identified
themselves as Bangladeshis was 275,177, or 0.56% of the total English population and 6.2% of the
ethnic minority population.
The Chinese form the smallest ethnic group identified in the 2001 Census, and large scale
migration of the Chinese to Britain is fairly recent. Students and scholars arrived in Britain mainly in
the 1980s, after mainland China was opened to the western world. Many stayed on after completing
their education. In the 1991 Census the number of the Chinese in England was 144,201, or 0.3% of the
English population. By 2001 this number had increased to 221,125, or 0.45% of the English
population.
Table 1 gives an overview of the main ethnic minority groups based on the Labor Force Survey,
pooled for the years 2003 and 2004, separately for men and women. Results refer to ethnic minorities
8
in England. Here, we summarize Black Africans and Blacks with a background other than Caribbean
or African into one category.4 The first column reports the population share of each ethnic minority
group. These numbers closely match those in the 2001 Census. The next column shows the share born
in the UK. This share is highest for Black Caribbeans, the group that arrived first in the UK, and lowest
for the Bangladeshi and Chinese, the two groups that arrived latest. The table also shows that with the
exception of Black Caribbean men and Bangladeshi women, the average years of education among
ethnic minorities exceeds that of the White British working-age population (Column 3). The difference
is particularly striking for Indian and Chinese men and women, as well as men and women from any
other background. Dustmann and Theoropoulos (2006) show that these differences become even larger
if the sample is restricted to men and women born in the UK. In contrast, employment rates are
substantially higher among White British men and women than among ethnic minorities (Column 4).
Despite the (slightly) higher levels of education, Black, Bangladeshi and Pakistani men as well as men
from other ethnic backgrounds earn considerably lower wages than White British men; for
Bangladeshi men the difference is as large as 40%. Chinese and Indian men earn slightly higher wages
than White British men (Column 5). These numbers may be misleading, as ethnic minorities are more
likely to live in London than White British and wages in London are higher than in the rest of the UK.
In Column 6, we therefore restrict the sample to London residents. Now men and women from all
ethnic groups, including the Indians and Chinese, earn lower wages than the White British. A more
detailed description of the labor market experiences of ethnic minority groups throughout the 80s and
90s can be found in Dustmann and Theoropoulos (2006).
2.2 The Education System in England
We now turn to explaining the key features of the education system in England, which in many
aspects is different from education systems in the United States or Continental Europe and indeed to 4 In this category, about 84% are Black African.
9
the education systems of the other countries in the United Kingdom (it is much more regulated than in
Wales, Scotland and Northern Ireland). One very important feature of the system is the centralized
assessment of pupils’ understanding of the curriculum (see Machin and Vignoles, 2005, for more
details). Testing takes place in 4 key stages, Key Stage 1 from grade 1 to 2 (age 5 to 7), Key Stage 2
from grade 3 to 6 (age 8 to 11), Key Stage 3 from grade 7 to 9 (age 12 to 14), and Key Stage 4 from
grade 10 to 11 (age 15 to 16). Primary schools cover Key Stage 1 and Key Stage 2, while secondary
schools comprise Key Stage 3 and Key Stage 4. The end of Key Stage 4 marks the end of compulsory
schooling. At the end of each key stage, pupils take nation-wide exams that are anonymously marked
by external graders. Throughout Key Stage 1 to Key Stage 3, pupils are assessed in the core disciplines
English, Mathematics, and Science (not in Key Stage 1). Key Stage 4 exams are the school leaving age
exams also known as GCSE exams (General Certificate of Secondary Education). Here, pupils can
take a variety of subjects, ranging from foreign languages to arts and design to information technology.
However, the core subjects English and Mathematics are mandatory for all pupils. In this paper, we
focus on English and Mathematics scores that are tested in each Key Stage.
Most pupils switch schools, making the transition to secondary school, at the end of primary
school.5 About 45% of pupils move schools at the end of Key Stage 1; of those, about three quarters
leave because their school does not offer grades 3 to 6. Less than 5% of pupils attend a different school
in Key Stage 4 than at Key Stage 3 (see Machin, Telhaj and Wilson, 2006 for a detailed descriptive
analysis of school switching in English schools). There is also little to no grade repetition in England.
This means that pupils who entered school in the same year take their key stage exams in the same
year. Hence, our estimates for the evolution of achievement gaps between White British pupils and
ethnic minorities will not be affected by selection, caused by different grade retention rates across
5 The majority of English local education authorities (LEAs) have only primary and secondary schools, but a small minority also have middle schools that pupils attend between primary and secondary school. In the former group pupils make the transition from primary to secondary schools between grades 6 and 7; in the latter the transitions vary across LEAs, with pupils moving from primary to middle school during the later primary grades in the two tier system and from middle to secondary during the early secondary grades.

10
ethnic groups. This may be a problem in commonly used US data sets, such as the Early Childhood
Longitudinal Study (e.g. Hanushek and Rivkin, 2006).
At each key stage, the Department for Education and Skills sets specific achievement targets that
pupils are supposed to meet. For instance, the target at Key Stage 2 is Level 4 in English, Mathematics,
and Science, which in 2003 was met by about 80% of pupils. The target at Key Stage 4 is passing at
least 5 GCSEs with C or better, including English and Mathematics, which in 2003 was met by 55% of
pupils. Each year, the Department of Education and Skills publishes school league tables that report
the share of pupils above the target in each school in Key Stage 2 (primary schools) and Key Stage 4
(secondary schools). These reports are extensively discussed in the media, such as the Times or BBC
news.
A small, but growing literature demonstrates that parents significantly value these dimensions
of school quality. In hedonic house price equations research uncovers a significant link between house
prices and primary school performance (see Black, 1999 for US evidence and Gibbons and Machin,
2003, 2006 for evidence from England). It is evident that the league tables convey important
information to parents which can influence the demand for particular schools. In the English education
system head teachers (school principals) also have incentives to maximize student numbers since
money follows pupils. We return to this below since it does mean that schools that want to attract
more pupils have incentives to improve their league tables performance and we consider whether this
induces aspects of ‘teaching to the test’ for pupils close to government Key Stage 2 and Key Stage 4
performance targets and whether these differ across ethnic groups.
11
3. Data Description
Our empirical analysis is primarily based on the National Pupil Data Base (NPD). We also report
some findings based on the Millennium Cohort Survey (MCS). We describe each data set in turn.
3.1 The National Pupil Data Base (NPD)
The National Pupil Data Base (NPD) covers all pupils in all state primary and secondary schools in
England, and is available from 1996 to 2006. The data are collected by the Department for Education
and Skills, which uses the data to construct the annual school league tables. It is mandatory for schools
to provide accurate data on pupils. Pupils can be followed from year to year and across schools through
a pupil identifier. For each key stage, the NPD contains, among other achievement outcomes, English
and mathematics test scores. To make test scores comparable across years, we standardize them to
have a mean of 50 and a standard deviation of 10. Precise variable definitions can be found in
Appendix A.
This data base can be merged with information from the Pupil Level Annual Schools Census
(PLASC), which is available on an annual basis beginning in 2002 (we currently have data up to
2006). This data base includes a number of pupil-level background characteristics (not in the NPD
data); most importantly, ethnicity, whether or not English is the mother tongue, as well as an indicator
for family poverty. The ethnicity variable distinguishes the main ethnic minorities in England: Black,
Caribbean; Black, other background (of which 84% are Black African); Bangladeshi; Pakistani;
Indian; Chinese; and Other (see also Section 2.1 and Table 1). The latter group is particularly
heterogeneous, ranging from West and East Europe, to the Middle East, to the Far East (other than the
ethnic minorities listed above). This group also includes pupils with mixed background.
The indicator variable for English as a mother tongue measures whether the first language to
which the child was exposed was English. If the child was exposed to more than one language and
12
these include English, English is taken as the mother tongue. In contrast, if a child acquires English
subsequent to early development, then English is not their mother tongue no matter how proficient they
become. Our indicator for family poverty is the eligibility to free school meals. Pupils who receive free
meals are the 15 to 20% poorest pupils.
From this data base, we construct two samples. Sample A includes all pupils who took Key Stage
1 exams in 1998 or 1999, and can be linked to their Key Stage 2 exams four years later. The sample is
further restricted to pupils who have valid test scores in Mathematics and English in each key stage,
and pupils who can be linked to the PLASC data. The final sample includes about 85% of all pupils
who sat Key Stage 1 exams in 1998 or 1999. Sample B consists of all pupils who took Key Stage 2
exams between 1998 and 2001, and can be linked to their Key Stage 3 and 4 exams 3 and 5 years later.
Again, we further restrict the sample to pupils who have valid Mathematics and English test scores in
each key stage, and pupils who can be linked to the PLASC data. Here, the final sample accounts for
about 78% of all pupils who sat Key Stage 2 exams between 1998 and 2001.
One may worry that, due to the fairly large reduction in sample size, our findings are not be
representative for the cohorts as a whole. However, several robustness checks indicate that test score
gaps between the White British and ethnic minorities evolve similarly throughout primary and
secondary school no matter which sample restrictions are used. For instance, attainment gaps are
similar if the sample includes all pupils who take key stage exams in the relevant years.
Table 2 provides an overview of the estimation sample. Notice that due to the administrative nature
of our data, the sample size is substantially larger than comparable studies for the US, such as Fryer
and Levitt (2004). The share of White British pupils in the two samples is about 85%, and thus about
5% lower than in England as a whole (see Table 1). This probably reflects the higher fertility rate of
ethnic minority groups. As for the whole English population, the two largest minorities are the Indians
and Pakistani, followed by Blacks with Caribbean or other heritage.
13
With the exception of Indians and Chinese, the share of pupils who are eligible for free school
meals is substantially higher among ethnic minorities than among White British pupils. In the case of
the Bangladeshi, the difference is more than 40 percentage points. From Table 1, this is also the group
with the lowest employment rate and the lowest wage, while wages of Indian and Chinese men are
similar to those of White British men. For the vast majority of pupils with Bangladeshi, Pakistani,
Indian or Chinese background, English is not their mother tongue. In contrast, less than 5% of Black
Caribbean pupils were not exposed to English in early childhood. As expected, since there is virtually
no grade repetition, the average age at Key Stage 1 and 4 is virtually identical across ethnic groups.
3.2 The Millennium Cohort Study (MCS)
The Millennium Cohort Study (MCS) is a longitudinal survey that follows a random sample of
about 20,000 children who were born in the United Kingdom between September 2000 and August
2001.6 Blacks and Asians are over-sampled. Since the start of the survey, children have been followed
twice, once at age 3 and again at age 5, just before the start of school. We use this data base to compute
achievement gaps between White British pupils and ethnic minorities at the start of school, at age 5. At
age 5, the MCS includes three achievement outcomes, the Picture Similarity Assessment, the Naming
Vocabulary Assessment, and the Pattern Construction Assessment. We describe each test in more
detail in Appendix B. Test scores are standardized to mean 50 and standard deviation 10. Ethnic
groups are defined in the same way as in the NPD. We restrict the sample to children in England. Our
final sample consists of 9012 to 9039 pupils, depending on which achievement outcome is used. We
use sampling weights to make our results representative for the child population as a whole.
6 In Scotland and Northern Ireland, children born between December 2000 and October 2001 form the base population.

14
4. Achievement of Ethnic Minorities through Primary and Secondary School – The Basic Facts
This section documents how test score gaps in English and Mathematics between White British
pupils and pupils from ethnic minorities evolve throughout primary and secondary school. We then
compare our findings with those of earlier studies for the UK and US.
4.1 The Basic Facts
The figures in Table 1 indicate that, with the exception of Black Caribbean men and Bangladeshi
women, the average years of education among ethnic minorities in Britain exceeds that of the White
British working-age population. This advantage is particularly large for Indian and Chinese men and
women, as well as men and women from any other background.
Entry Gaps
How does the achievement of White British children differ from that of children from ethnic
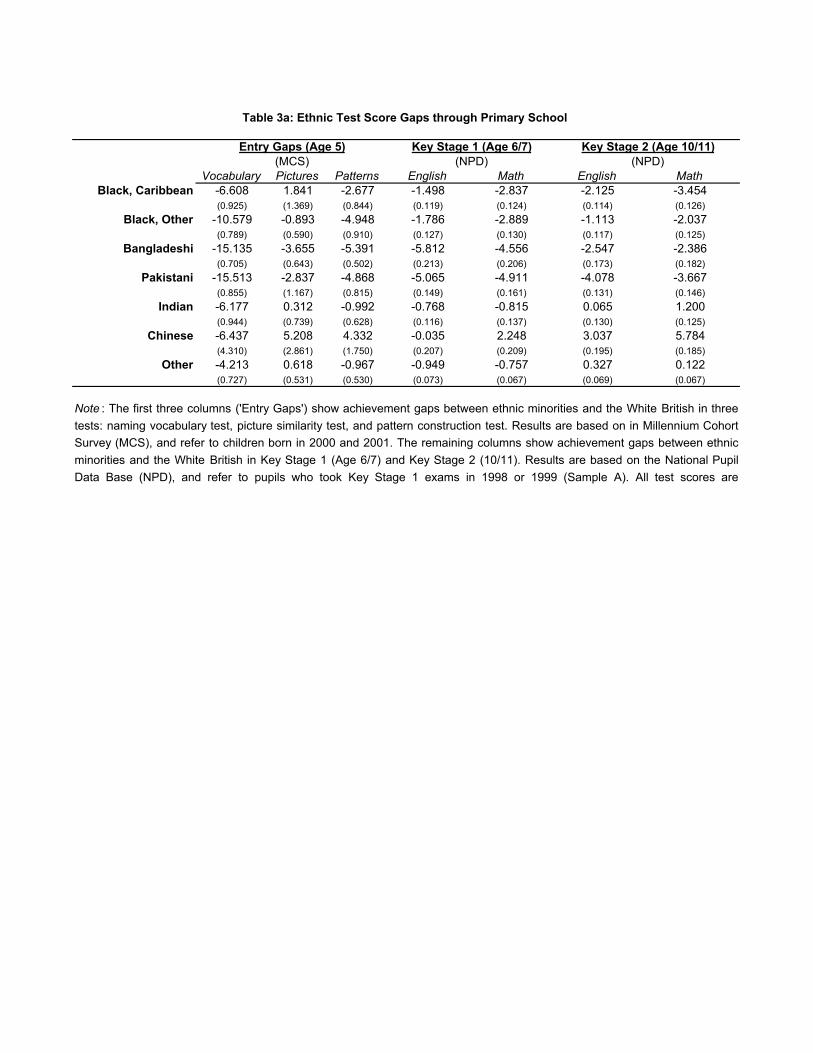
minorities just before the start of school, at the age of 5? The first three columns in Table 3a report
achievement gaps based on a Vocabulary Naming Assessment, a Picture Similarity Assessment, and a
Pattern Construction Assessment, from the MCS. According to all tests, white British pupils
outperform ethnic minority pupils, which is in contrast with the overall educational advantage of ethnic
minorities at working age. According to the Vocabulary Naming Assessment, scores of all ethnic
minority children are at least 50% of a standard deviation (5) lower than those of White British
children; for non-Caribbean blacks, Bangladeshi, and Pakistani children, the gap is larger than 1
standard deviation. Achievement gaps are substantially smaller for the Picture Similarity and Pattern
Construction Assessment. There is again substantial heterogeneity across ethnic groups: While the
achievement gap is at least 30% of a standard deviation for Black Caribbean, other black (Pattern

15
Construction Assessment), Pakistani and Bangladeshi children (Pattern Construction and Picture
Similarity Assessment), it is insignificant or even positive for Indians, Chinese and other ethnic
minority children—although these groups considerably lack behind in the Vocabulary Naming
Assessment.
These findings provide a first indication that achievement gaps between White British and ethnic
minority children may be partly due to English language ability, as one would expect it to matter more
in the Vocabulary Naming Assessment than in the other two Assessments. Moreover, the two ethnic
groups with the lowest share of children for whom English is the mother tongue, Bangladeshi and
Pakistani, experience the lowest scores.
Primary School
How do achievement gaps evolve through primary school? The remaining columns in Table 3a
report English and mathematics test score gaps at the end of 2nd grade at the age of 6/7 (Key Stage 1)
and at the end of 6th grade at the age of 10/11 (Key Stage 2). Results are based on Sample A.
Unfortunately, it is difficult to compare these gaps with the entry gaps at age 5, for two reasons. First,
they refer to a different cohort of children, born 8 to 9 years earlier than the children in the MCS.
Second, the achievement outcomes are not directly comparable. However, a certain pattern is visible:
ethnic groups that performed poorly in the Pattern Construction Test at age 5 (i.e. Black Caribbean,
Black other, Bangladeshi, and Pakistani) tend to perform poorly, while groups that performed well at
age 5 (i.e. Indian, Chinese and other background) tend to perform better in the Key Stage 1 English
and mathematics exams.
Do achievement gaps between White British and ethnic minority pupils widen or narrow
throughout primary school? Table 3a shows that most ethnic minority groups catch up, or in the case of
Chinese and Indian pupils, even overtake White British pupils, in both English and mathematics. The
catch-up (or over-taking) is most striking for Bangladeshi and Chinese pupils, for whom the gain

16
exceeds 20% of a standard deviation. The only group for which we do not observe a narrowing of the
achievement gap is Black Caribbean pupils. For this group, both the English and mathematics test
score gap widened by about 6% of a standard deviation over a 4 year period.
Secondary School
Does the catch-up (or, in the case of Black Caribbean pupils, the fall back) of the achievement gap
continue through secondary school? Table 3b reports English and mathematics test score gaps at the
end of primary school at the age of 10/11 (Key Stage 2), at the end of 9th grade at the age of 13/14
(Key Stage 3) and at the end of compulsory schooling at the age of 15/16 (Key Stage 4). Results are
based on Sample B. It is important to stress that this refer to a different cohort of children than those in
Table 3a, born 1 to 5 years earlier. Results for Key Stage 2 largely mirror those in Table 3a, although
all ethnic minorities perform somewhat worse relative to White British pupils than in the older than in
the younger cohorts. The widening of the achievement gap between White British and Black
Caribbean pupils appears to have stopped, as the gap at the end of primary school at Key Stage 2 and
at the beginning of secondary school at Key Stage 3 is roughly the same. All other groups continue to
catch up or, in the case of Chinese pupils, pull away from White British pupils between Key Stage 3
and 4, at a roughly similar rate as between Key Stage 1 and 2. Perhaps the most striking finding in
Table 3b is the large gain between Key Stage 3 and 4 of all ethnic groups, including Black Caribbean
pupils (at least in English). For most ethnic groups, the gain exceeds that in earlier key stages, in
particular if one takes into account that the gain occurred within two years only. At the end of
compulsory schooling, Indian and Chinese pupils outperform White British pupils by more than 30%
of a standard deviation in both English and mathematics. Recall from Table 1 these are also the two
ethnic groups with the highest educational attainment. All other ethnic minorities perform worse on
average than White British pupils, where Black Caribbean pupils lack behind most.
17
Comparison with UK Studies
How do these findings compare with existing findings for the UK? The most comprehensive study
is by Wilson et al. (2005) who use the same data source, but somewhat different samples and
achievement outcomes, as us to document ethnic achievement gaps through primary and secondary
school. Not unsurprisingly, their findings are similar to ours; in particular, they stress that much of the
improvement of ethnic minorities relative to White British pupils in secondary school happens from
Key Stage 3 to Key Stage 4. Our results also confirm earlier findings by the Department of Education
and Skills (e.g. DfES, 2005). For instance, this report emphasizes that, with the exception of Black
Caribbean pupils, ethnic minority pupils improve relative to White British pupils, especially between
Key Stage 1 and 2 and Key Stage 3 and 4. However, this report only looks at measures of value added
between to successive key stages, and does not analyze the dynamics of the achievement gap through
primary and secondary school. Similarly, recent research by Cassen and Kingdon (2007a, 2007b)
notes that the Chinese and Indians are the most successful ethnic groups, while the Caribbean are the
least successful.
Comparison with US Studies
It is also interesting to compare our findings with those for the United States. Starting with the
Coleman Report in 1966, a large literature on black-white achievement gaps has evolved (e.g. Fryer
and Levitt 2004, 2007; Hanushek 2006; Neal 2005). The ethnic group in the UK that probably
resembles blacks in the US most closely is children from a Black Caribbean background, in the sense
that these children were mostly born in the UK and English is their mother tongue. Based on the Early
Childhood Longitudinal Study, Fryer and Levitt (2004, 2007) report that at the start of kindergarten the
raw attainment gap in reading (mathematics) between black and white children is 25% (36%) of a
standard deviation. By the end of third grade, the gap has substantially widened by about 10% of a
standard deviation each year. Using administrative data from the Texas School Project, Hanushek and
18
Rivkin (2006) report a raw attainment gap of 59% of a standard deviation in third grade, and 70% in 8th
grade.7 Although (at the end of compulsory schooling) Black Caribbean children are the worst
performing group in England, we find substantially smaller attainment gaps. Maybe more importantly,
we find no evidence that Black Caribbean pupils lose ground relative to White British pupils
throughout secondary school. Throughout primary school, the widening of the achievement gap is also
smaller than in the US.
In line with our findings, Fryer and Levitt (2004, 2007) also report that Hispanic children whose
mother tongue often is not English improve relative to White children during the early years of primary
school. As Chinese children in England, Asian children in the US outperform white children at each
grade.
5. The Evolution of Achievement Gaps through Primary and Secondary School – Explanations
We now explore three possible explanations for the divergent evolution of test scores of White
British and ethnic minority pupils throughout primary and secondary school: different family
background characteristics, different school quality, and teacher incentives.
Before we discuss each explanation, we would like to rule out a fourth explanation: teacher bias.
Since all key stage exams are centralized and anonymously marked by external graders, it is unlikely
that achievement gaps as well as the progress of ethnic minority pupils relative to White British pupils
is due to teachers being biased against ethnic minorities.
7 These results refer to the ‘intact’ cohort that follows the same pupils through each grade.

19
5.1 The Role of Family Background Characteristics
We first analyze how ethnic attainment gaps are affected by family background characteristics.
Notice that if the influence of these characteristics changes through the course of primary and
secondary school, they do not only help explaining differences in the level of attainment, but also why
some ethnic groups (e.g. Indian pupils) improve more relative to White British pupils than others (e.g.
Black Caribbean pupils). We focus on two characteristics, poverty, measured by the proxy variable
measuring whether the child is eligible for free meals8, and English language ability, measured as
whether English is the mother tongue. We acknowledge that both variables may be correlated with
other (to us) unobserved family characteristics, such as parental education or parental aspiration that
may affect pupil achievement. We are not able to isolate these factors from poverty and language. It is
also important to stress that the impact of poverty and language ability on test scores should be
interpreted as an association only, and not as a causal relationship.
Language
Our findings based on the Millennium Cohort Study in Section 4.1, in particular the finding that
ethnic achievement gaps based on the Naming Vocabulary Assessment are substantially larger than
those for the Picture Similarity and Pattern Construction Assessment, provided a first indication that
English language ability may play an important role in explaining ethnic achievement gaps. We
explore this further in Table 4a (Primary School, Sample A) and 4b (Secondary School, Sample B),
where we report achievement gaps conditional on an indicator whether English is the child’s mother
tongue. For comparison, the tables also show the raw attainment gaps from Table 3a and 3b.
At each key stage, and for both English and Mathematics, conditional attainment gaps are
considerably smaller than raw attainment gaps, in particular for ethnic groups with a large share of
8 Hobbs and Vignoles (2007) provide an extensive discussion whether free meal status provides a valid proxy for socio-economic status.

20
non-native speakers, such as the Bangladeshi and Pakistani (Table 2). At each key stage, English as a
mother tongue has a stronger impact on English than on Mathematics test scores. For instance, at Key
Stage 1, English as a mother tongue improves English test scores by about 30% of a standard
deviation, compared to about 20% of a standard deviation in mathematics.
Most importantly, the importance of English language ability declines as children become older;
at Key Stage 4, the coefficient on English as a mother tongue is only 0.576 for English, and even
negative for Mathematics. Consequently, language contributes to why, with the exception of Black
Caribbean pupils, ethnic minority pupils improve relative to White British pupils. We analyze this in
Panel C and D where we report the share of the change in test score gaps between Key Stage 1 and 2
(Table 4a) as well as between Key Stage 2 and 4 (Table 4b) that can be attributed to language.
Between Key Stage 1 and 2, language alone is fully able to explain the greater progress of Pakistani
and Indian pupils relative to White British pupils in English. For the other ethnic minority groups
(except Black Caribbean), at least 23% (Other) and up to 71% (Black, Other) of the relative
improvement in English can be accounted for by English language ability. Shares tend to be somewhat
smaller in mathematics. English as a mother tongue remains powerful at predicting the greater progress
of ethnic minorities through secondary school, between Key Stage 2 and Key Stage 4, in both English
and Mathematics. Finally, language helps to explain why Black Caribbean pupils, for most of whom
English is the mother tongue, improve less than any other ethnic group. For instance, the numbers in
Table 3b imply that 72% of the greater progress of Indian relative to Black Caribbean pupils in English
between Key Stage 2 and 4 is due to language.
Poverty
Next, we explore how poverty status, measured as free school meal eligibility, affects attainment
gaps between White British pupils and ethnic minority groups. Results can again be found in Table 4a
(primary school, Sample A) and Table 4b (secondary school, Sample B). The inclusion of free meal

21
eligibility substantially reduces the attainment gaps for the four poorest groups, Black Caribbean and
Other, Pakistani, and Bangladeshi, at all key stages and in both Mathematics and English. For instance,
at Key Stage 1 the raw gap in English between Bangladeshi (Black Caribbean) and White British
pupils is -5.81 (-1.498), compared to -3.60 (-0.476) conditional on free meal eligibility. By the end of
compulsory schooling at Key Stage 4, Non-Caribbean Blacks, Pakistani, and Bangladeshi pupils have
completely caught up or even overtaken White British pupils, conditional on free meal eligibility.
Black Caribbean pupils, in contrast, continue to perform worse than White British pupils at Key Stage
4 even conditional on poverty status.
Also notice that the negative impact of free meal eligibility increases somewhat in absolute
magnitude as children become older. For instance, at Key Stage 2, free meal eligibility reduces English
test scores by 52% of a standard deviation, compared to 67% of a standard deviation at Key Stage 4.9
Consequently, poverty cannot explain why most ethnic minority children catch up with or even
overtake White British pupils throughout primary and secondary school (see also Panel C in Table 4a
and Panel D in Table 4b). This makes the progress of poor ethnic minority groups, such as Bangladeshi
and Pakistani, relative to White British pupils all the more remarkable.
For completeness, Table 4a and 4b also report findings that condition on both English as a mother
tongue and poverty status, and the results mirror the previous ones. Also notice that both background
characteristics reduce the heterogeneity across ethnic groups, in particular at Key Stage 1. Here, the
difference in the raw achievement gap between the lowest (Bangladeshi) and best (Chinese)
performing English minority group in English is 5.777, compared to 3.369 for the conditional
attainment gaps.
The analysis so far assumed that the impact of free meal status and is the same across all ethnic
groups. However, it turns out that the association between free meal status and achievement is stronger
9 These findings have to be interpreted with some caution, as in Sample A free meal eligibility refers to refers to eligibility at Key Stage 2, and in Sample B it refers to eligibility at Key Stage 4.

22
for White British pupils than for ethnic minority groups (see also Kingdon and Cassen 2007). The
association is smallest for Bangladeshi pupils who have the highest poverty rates (see Table 2). When
we evaluate the importance of poverty on ethnic achievement gaps using the coefficient for ethnic
minorities as opposed to the (in absolute terms larger) average coefficient, poverty contributes less to
explaining ethnic achievement gaps, but our overall conclusions are unchanged.
5.2 The Role of Schools
Do ethnic minority pupils attend worse schools than White British pupils? How does school quality
affect the progress of ethnic minorities relative to White British pupils? Next, we shed new light on
these questions by analyzing whether the worsening of Black Caribbean pupils during primary school
and the progress of all other minority groups through primary and secondary school predominantly
occurs within or between schools.
Before we present results, we provide evidence that ethnic minority pupils attend very different
schools than White British pupils in Table 5. The table reports information on the schoolmates of each
ethnic group at through primary and secondary school, and we compute this information excluding the
own pupil. The first column shows the share of White British pupils White British and ethnic minority
pupils go to school with (which is sometimes referred to as the exposure index of segregation).10
Segregation is considerable: Whereas at Key Stage 1 91% of the school mates of White British pupils
are themselves White British, the corresponding share is less than 45% for Black, Bangladeshi, Indian,
and Pakistani pupils. A further analysis (not reported) shows that segregation at the school level is
considerably larger than at the neighborhood (local authority) level, indicating that school level
segregation is not adequately explained by residential segregation. Most ethnic groups, in particular
Pakistani pupils, become slightly more exposed to White British pupils in secondary school, at Key
10 Johnston et al. (2006) analyze changes in ethnic segregation at the school level over time, and find that an increase in segregation in some cities. This is due to the increase in the relative size of the ethnic minority population.

23
Stage 3.11 Table 5 also highlights that schoolmates of ethnic minority pupils, including those of Indian
and Chinese pupils, are substantially poorer than those of White British pupils at all key stages.
Finally, Table 5 shows that at each key stage classmates of ethnic minority pupils perform worse in
English and Mathematics (we report the average) than those of White British pupils. Interestingly, the
differences decline through primary and secondary school. Indian and Chinese pupils start out with
worse peers than White British pupils in Key Stage 1, but have better peers by Key Stage 3. Overall,
Table 5 suggests that all ethnic minority groups initially attend worse schools than White British
pupils, which makes their relative improvement even more remarkable.
Table 6a (primary school, Sample A) and 6b (secondary school, Sample B) examines the role of
schools more closely. In Panel A, we compare raw attainment gaps with those that condition on school
fixed effects and are thus exploit variation within schools only. For Black (Caribbean and Non-
Caribbean), Pakistani, and Bangladeshi pupils, attainment gaps relative to White British pupils
decrease substantially when school fixed effects are included, through all key stages and in both
English and mathematics. In some cases, e.g. Bangladeshi students at Key Stage 4, the coefficient even
flips sign. In contrast, for Chinese pupils in secondary schools (but not in primary schools) the
inclusion of fixed school effects reduces their advantage relative to White British pupils. This
demonstrates the importance of schools in explaining ethnic achievement gaps.
However, as Hanushek and Rivkin (2006) point out, this exercise may be misleading if there is
substantial ethnic segregation at schools, as the following extreme example illustrates. Suppose that
only 5% of black pupils attend school where White British pupils are present. When school fixed
effects are included in the regression, it is these 5% that identify the relative achievement gap. If these
pupils perform much worse than their White British classmates, then the fixed effect estimator
attributes most of the achievement gap to within-school factors, although it is predominantly due to
11 In the table, results for Key Stage 1 and 2 refer to a different cohort than results for Key Stage 3 and 4. The same results hold if we follow the first cohort from Key Stage 1 to Key Stage 3, or the second cohort from Key Stage 2 to Key Stage 4.
24
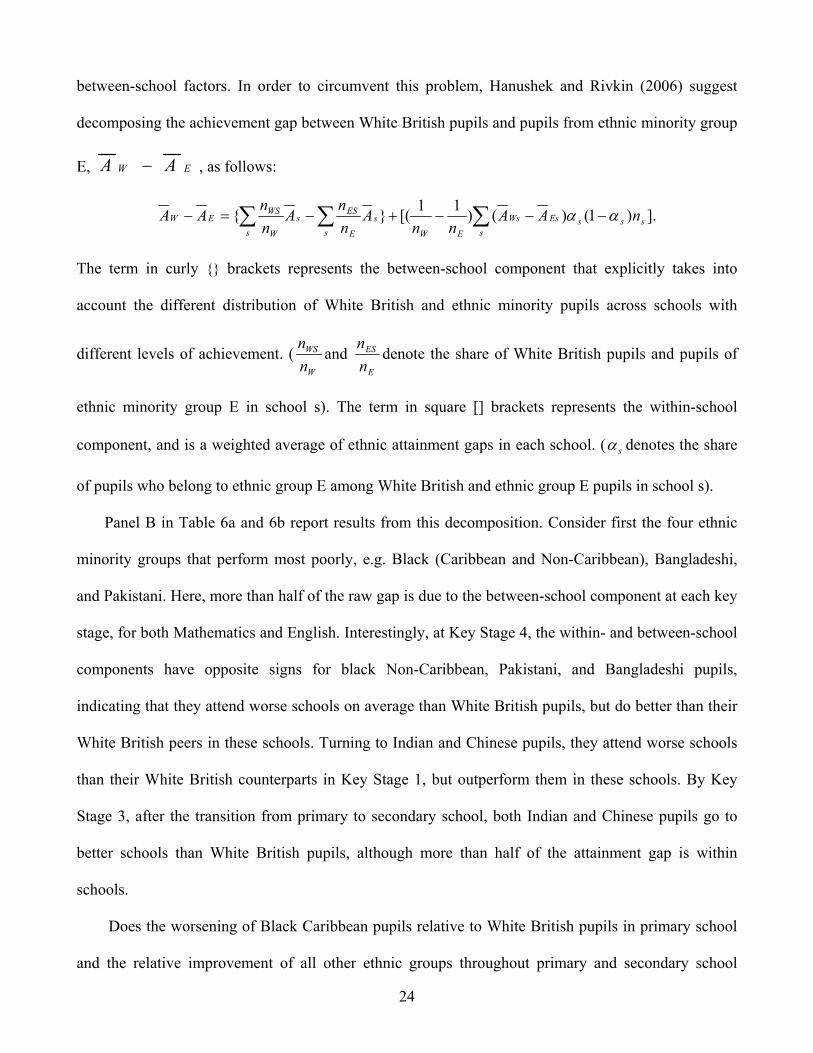
between-school factors. In order to circumvent this problem, Hanushek and Rivkin (2006) suggest
decomposing the achievement gap between White British pupils and pupils from ethnic minority group
E, EW AA − , as follows:
].)1()()11[(}{ ssss
EsWs
EW
ss E
ESs
s W
WSEW nAA
nnA
nn
Ann
AA αα −−−+−=− ∑∑∑
The term in curly {} brackets represents the between-school component that explicitly takes into
account the different distribution of White British and ethnic minority pupils across schools with
different levels of achievement. (W
WS
nn
and E
ES
nn
denote the share of White British pupils and pupils of
ethnic minority group E in school s). The term in square [] brackets represents the within-school
component, and is a weighted average of ethnic attainment gaps in each school. ( sα denotes the share
of pupils who belong to ethnic group E among White British and ethnic group E pupils in school s).
Panel B in Table 6a and 6b report results from this decomposition. Consider first the four ethnic
minority groups that perform most poorly, e.g. Black (Caribbean and Non-Caribbean), Bangladeshi,
and Pakistani. Here, more than half of the raw gap is due to the between-school component at each key
stage, for both Mathematics and English. Interestingly, at Key Stage 4, the within- and between-school
components have opposite signs for black Non-Caribbean, Pakistani, and Bangladeshi pupils,
indicating that they attend worse schools on average than White British pupils, but do better than their
White British peers in these schools. Turning to Indian and Chinese pupils, they attend worse schools
than their White British counterparts in Key Stage 1, but outperform them in these schools. By Key
Stage 3, after the transition from primary to secondary school, both Indian and Chinese pupils go to
better schools than White British pupils, although more than half of the attainment gap is within
schools.
Does the worsening of Black Caribbean pupils relative to White British pupils in primary school
and the relative improvement of all other ethnic groups throughout primary and secondary school
25
predominantly occur within or between schools? In Panel C in Table 6a and 6b, we report the share of
the change in the relative attainment gaps between two key stages that happens within schools. For
Black Caribbean pupils, all of the worsening in English and most (75%) of the worsening in
mathematics between Key Stage 1 and 2 occurs within schools. What about the other ethnic minority
groups who improve relative to White British pupils throughout primary and secondary school? Panel
C in Table 6a and 6b shows that a substantial part happens within schools. For most ethnic groups, the
within-school share is higher in Mathematics than in English, and is higher from Key Stage 3 to 4
(when less than 5% of pupils switch school) than from Key Stage 1 to 2 (when about 40% pf pupils
switch school) or Key Stage 2 to 3 (when all pupils switch school). Yet, for most ethnic groups at least
25% of the relative improvement can be attributed to between-school factors. This means that ethnic
minority pupils move up to better schools relative to White British pupils or, in the absence of pupil
mobility, schools with a higher share of ethnic minority pupils make more progress than schools with
predominantly White-British pupils.
We have repeated the analysis conditional on indicator variables for English as a mother tongue
and poverty that we found to be important in explaining relative attainment gaps in the previous
section. Our overall conclusions are similar. The main difference is that the between-school component
becomes smaller for most ethnic groups, suggesting that pupils sort into schools based on poverty and
language.
5.3 Teacher Incentives: Teaching to the Test
This section focuses on the larger than average gains of ethnic minority pupils relative to White
British pupils from Key Stage 3 to Key Stage 4. We explore an explanation that has received relatively
little attention in education research in England: teacher incentives. The idea is as follows. Each year,
the Department of Economics and Skills publishes school league tables, which report the share of
pupils who passed at least 5 GCSEs, including Mathematics and English, with a grade of C or better.
26
These reports are extensively discussed in the media, such as the Times or BBC news. On average,
about 55% of pupils meet the target (see also Table 7). There is considerable variation across schools:
Whereas in the top schools, every pupil meets the target, there are also low-performing schools in
which no pupil achieves the target.12
School league tables provide (probably implicit) incentives for teachers to focus their attention on
pupils who are most likely to end up close to the target. Pupils who are likely to fail anyway may
receive less attention, and the same may be true for pupils who are likely to pass anyway. Figure 1
shows that teachers should concentrate on pupils in the middle range of the test score distribution. In
the figure, we group pupils into 10 equally sized groups based on their Key Stage 3 English test score.
The figure plots the probability that pupils in each group end up just failing or just passing the Key
Stage 4 target, which we define as passing 4, 5, or 6 GCSEs with a grade of C or better. The
probability of ending up close to the target about 30% for pupils in the middle of the English test score
distribution, but only about 5% for the 10% best and worst pupils. If ethnic minority pupils are more
likely to be in danger of just failing the target, or show more promise at just passing the target than
White British pupils, then ethnic minority pupils may receive more attention from teachers on average
than White British pupils—which may contribute to why ethnic minority pupils experience the largest
relative gains from Key Stage 3 to 4.
Neal and Whitmore-Schanzenbach (2007) analyze such teacher incentives within the No Child
Left Behind Act in the US and, based on Chicago Public School data, find strong empirical support.13
Next, we provide some evidence that is generally consistent with this idea.
If ethnic minority pupils gain more relative to White British pupils from Key Stage 3 to Key Stage
4 because they receive more attention from their teachers, we would expect to see more ethnic
minority pupils close to the target. Table 7 finds some mild support for this. The probability that a
12 See e.g. http://www.timesonline.co.uk/tol/life_and_style/education/a_level_gcse_results for the years 2006 and 2007. 13 See also Lazear (2006) for a theoretical analysis.

27
White British pupil just met or just failed the target, which we again define as passing 4, 5, or 6 GCSEs
with grade C or better, is about 20%. Black (Caribbean and Non-Caribbean), Pakistani and
Bangladeshi pupils are up to 3 percentage points more likely to end up close to the target. However,
Chinese pupils also experience stronger gains from Key Stage 3 to Key Stage 4 than White British
pupils, but they are 6% less likely to end up close to the target.
If teachers pay more attention to pupils who may just fail or just meet the target, we would also
expect test score gains between Key Stage 3 and Key Stage 4 to be higher for groups of pupils teachers
focus on. We explore this in Table 8. Panel A first shows that ethnic minority pupils who are eligible
for free school meals tend to experience greater gains in English than ethnic minority pupils who are
not, whereas the opposite is true for White British pupils. Panel B also shows the probability that
eligible and non-eligible ethnic minority and White British pupils barely miss or barely hit the Key
Stage 4 target. By and large, groups that experience larger gains are also somewhat more likely to end
up close to the target. The correlation between the two is 0.477 and the hypothesis that it is 0 can be
ruled out at a 5% level.
In Panel B, we repeat the exercise for rich and poor schools, defined as the schools with the 20%
lowest and highest share of pupils eligible for free meals. Clearly, test score gains of ethnic minority
pupils are concentrated in poor schools (for which school league tables may matter more), whereas
White British pupils experience larger gains in rich schools. Again, groups that see greater gains tend
to be more likely to end up close to the target; the correlation between the two is 0.324 and the
hypothesis that it is 0 can again be rejected at a 5% level.
A potential concern with this approach of looking at the actual probability of getting Key Stage 4
grades close to the target is that pupils are getting these grades after ‘teaching to the test’ has occurred.
Ideally, one would like to identify those pupils who receive more attention from teachers before they
take Key Stage 4 exams. To this end, we predict for each pupil the probability that she barely misses or
hits the target based on her Key Stage 3 English test score, which is taken before teaching to the test

28
occurs. We do this in the same way as in Figure 1. The idea here is that this is how teachers may
decide which pupils to focus on. The last column in Table 8 reports the correlation between the gain in
English test scores between Key Stage 3 and 4 and the predicted (as opposed to actual) probability of
being around the target. Correlations are very similar to those based on the actual probabilities, and we
are able to rule out the hypotheses that the correlations are zero at a 5% level.
These findings are consistent with the idea that teacher incentives caused by the annual publication
of school league tables contribute to explaining why test score gains of ethnic minority pupils relative
to White British pupils are higher among poor pupils and in poor schools.
Similar incentives exist for teachers at the end of primary school, at Key Stage 2. Here, the school
league tables mostly report the share of pupils who reach level 4, separately for English, Mathematics,
and Science. On average, substantially more pupils, about 80%, meet this target than the Key Stage 4
target. We again find that ethnic minority pupils are somewhat more likely to just fail or just pass the
target than White British pupils. However, the correlation between test score gains and the probability
of ending up around the target by ethnicity and free meal status, or ethnicity and school types, is
weaker and not statistically significant from zero.
5.4 Differences between Boys and Girls (to come)
6. Conclusion
This paper documents the evolution of the achievement gap in Mathematics and English between
ethnic minority and white British born pupils throughout compulsory schooling, from age 6 to 16. Our
main analysis is based on administrative data covering all pupils in England within the public
schooling system. Perhaps most remarkable finding of our analysis is that in England, no group of
ethnic minority pupils looses ground relative to white British born pupils. While some groups (like
Black Caribbean and Bangladeshi pupils) have a large achievement gaps initially, and remain on
average slightly underperforming, all groups gain considerably compared to the White British born.

29
This is in contrast to the US, where the achievement gap between the white and black pupils rises
substantially during the period of compulsory schooling (see e.g. Fryer and Levitt 2004, 2007 and
Hanushek and Rivkin 2006).
We find that language spoken at home is an important reason for the low achievement of ethnic
minority pupils at the beginning of primary school. Importantly, the impact of language on
achievement declines as children grow older. Consequently, language helps to explain why ethnic
minority pupils make greater progress than white British pupils, and why Black Caribbean pupils make
smaller progress than any other ethnic group. Moreover, with the exception of Indian and Chinese
pupils, ethnic minority pupils are substantially more likely to be in poverty, measured as the eligibility
for free school lunches. The inclusion of this variable likewise reduces ethnic minority attainment gaps
substantially. However, poverty cannot explain why ethnic minority pupils make greater progress than
white British pupils.
Moreover, ethnic minority pupils attend very different schools than white British pupils in terms
of the average share of white British classmates, the average share of poor classmates that are eligible
for free school lunches, and the average achievement of classmates. Interestingly, we find evidence
that ethnic minority pupils move up to better schools relative to white British pupils. While much of
the relative improvement of ethnic minority pupils occurs within schools, at least 25% occurs between
schools.
We also provide suggestive evidence that is consistent with the idea that teacher incentives caused
by the annual publication of school league tables contribute to explaining the remarkable relative
progress of ethnic minority pupils from Key Stage 3 (age 13/14) to Key Stage 4 (age 15/16). In
particular, such teacher incentives may contribute to why test score gains of ethnic minority pupils
relative to White British pupils are higher among poor pupils and in poor schools. Teacher incentives
are similar at the end of primary school at Key Stage 2, but here the evidence is weaker.

30
Unlike a lot of the more descriptive work in this area, we have attempted to try to understand
why ethnic differences in the level and progression of pupil achievement during the compulsory school
years emerge. A ‘naïve’ conclusion one may reach from our analysis is that schools and teacher
behaviour matter for explaining ethnic differences in pupil achievement and (probably more
importantly) their evolution through the school careers of children. Of course, future research needs to
try and unpack how and why this occurs. For instance, is it due to peer effects? Or due to teacher
practices and policies? We intend to dig deeper in our future research to try and shed some light on
these important, highly policy relevant questions.
References
- Black, S. (1999), “Do Better Schools Matter? Parental Valuation of Elementary Education”,
Quarterly Journal of Economics, 114, 578-599.
- Cassen, R. and G. Kingdon (2007a): “Tackling Low Educational Achievement”, Joseph Rowntree
Foundation, York, UK.
- Cassen, R. and G. Kingdon (2007b): “Understanding low achievement in English schools”, CASE
Discussion Paper 118.
- Coleman, J.S., E.Q. Campbell, C.J. Hobson, J. McPartland, A.M. Mood, F.D. Weinfeld, R.L. York
(1966): “Equality of Educational Opportunity”, Washington D.C., US Government Printing Office.
- Department for Education and Skills (DfES) (2005): “Ethnicity and Education: The Evidence on
Minority Ethnic Pupils”, DfES Research Topic Paper RTP01-05.
- Dustmann, C. and N. Theodoropoulos (2006): “Ethnic Minority Immigrants and their Children in
Britain”, CReAM Discussion Paper 10/06.
- Fryer Jr., R. G. and S.D. Levitt (2004): “Understanding the Black-White Test Score Gap in the First
Two Years of School”, Review of Economics and Statistics, 86, 447-464.

31
- Fryer Jr., R. G. and S.D. Levitt (2007): “The Black-White Test Score Gap through Third Grade”,
American Law and Economic Review, 8, 249-281.
- Gibbons, S. and S. Machin (2003): “Valuing English Primary Schools”, Journal of Urban
Economics, 53, 197-219.
- Gibbons, S. and S. Machin (2006), “Paying for Primary Schools: Admissions Constraints, School
Popularity or Congestion”, The Economic Journal, 116, C77-C92.
- Hanushek, E.A. and S.G.Rivkin (2006): “School Quality and the Black-White Achievement Gap”,
NBER Working Paper 12651.
- Hobbs, G. and A. Vignoles (2007): “Is Free School Meal Status a Valid Proxy for Socio-Economic
Status (in Schools Research)?” CEE Discussion Paper 7/84.
- Johnston, R., Burgess, S., Harris, R. and D. Wilson (2006): “’Sleep-Walking Towards Segregation?’
The Changing Ethnic Composition of English Schools, 1997-2003”, CMPO Working Paper 6/155.
- Lazear, E.P. (2006): “Speeding, Terrorism, and Teaching to the Test”, Quarterly Journal of
Economics, 121, 1029-1061.
- Machin, S. and A. Vignoles (2005): “What’s the Good of Education?” Princeton University Press.
- Machin, S., Telhaj, S. and J. Wilson (2006): ‘The Mobility of English School Children’, Fiscal
Studies, 27, 253-280.
- Neal, D.A. and W.R. Johnson (1996): “The Role of Pre-Market Factors in Black-White Differences”,
Journal of Political Economy, 104, 869-895.
- Neal, D.A. and D. Whitmore Schanzenbach (2007): “Left Behind by Design: Proficiency Counts and
Test-Based Accountability”, University of Chicago, mimeo.
- Peach, C. (1968): “West Indian Migration to Britain: A Social Geography”, Oxford University Press,
Oxford.
- Peach, C. (1996): “Black-Caribbeans: class, gender and geography”, in ‘Ethnicity in the
32
1991 Census: the ethnic minority populations of Great Britain’, Volume Two, Edited
by C. Peach, London HMSO.
- Wilson, D., Burgess, S. and A. Briggs (2005): “The Dynamics of School Attainment of England’s
Ethnic Minorities”, CMPO Working Paper No. 5/130.
Appendix A: National Pupil Data Base
We define variables as follows.
Test scores: The mathematics test score in Key Stage 1 is based on the National Curriculum level
awarded for the mathematics test. Following the Department of Education and Skills, we assign a
value of 3 if the pupil is working toward level 1, and 9, 13, 15, 17, 21, and 27 if level is 1, 2C, 2B, 2A,
3, 4 or 4+ was awarded. The English test score in Key Stage 1 is an average of the National
Curriculum level awarded for the reading and writing test. We use the same rule as above to convert
the level into a point score. The mathematics and English test score in Key Stage 2 and 3 is the total
number of points in the National Curriculum English and Mathematics tests. The mathematics and
English test score in Key Stage 4 is based on the highest grade achieved in mathematics and English,
where we assign values 7, 12, 20, 30, 40, 50, 60, 70, and 75 to levels U, G to A, and A*. Our findings
are robust to alternative assignment rules.
Ethnicity: In PLASC, ethnicity codes differ for the year 2002, 2003, and 2004 to 2006. For Sample A,
each pupil should in principle be observed in PLASC each year. Here, the ethnicity variable refers to
year 2004. If the ethnicity variable is missing for this year, we use the value for the year 2005 or 2006.
A similar definition is not possible for Sample B, as the first cohort, i.e. pupils who sat Key Stage 2
exams in 1998, is observed in PLASC only in 2003, the year they sit their Key Stage 4 exams. Here,
the ethnicity variable refers to Key Stage 4 for each cohort. ‘Black, Other’ comprises the categories
33
‘African’ and ‘Any other black background’. We also summarize categories ‘Any Other Asian
Background’, ‘Any Other Ethnic Group’, ‘Any Other White Background’, and pupils with mixed
background into the category ‘Other’.
Free Meal Status: Eligibility for free school lunches depends on receipt (by parent or pupil) of Income
Support, Income Based Jobseeker’s Allowance or support under Part 6 of Immigration and Asylum
Act 1999. Since this information comes from the PLASC data for the years 2002 to 2006, it is
impossible to link this measure to each Key Stage. In Sample A, free school meal eligibility refers to
Key Stage 2. In Sample B, it refers to Key Stage 4.
Appendix B: Millennium Cohort Survey
In the Vocabulary Test, the interviewer shows the child a picture and asks the child what the thing
on the picture is called. For example, the picture shows an igloo. Only ‘igloo’ is coded as the correct
answer. If the child answers ‘snow house’, ‘Eskimo house’ or ‘ice house’, the answer is marked as
incorrect.
In the Picture Similarity Assessment, the interviewer points to a row of pictures, shows the child
another picture and asks which picture this one goes with. For instance, a picture of a book goes with a
picture of a girl who is reading a book.
In the Pattern Construction Assessment, each child is given an easel, six black and yellow foam
squares, and 9 black and yellow plastic cubes. The interviewer builds a pattern seen on a picture. The
child is asked to construct the same pattern. The interviewer notes whether or not the child was able to
construct the pattern, and whether the child was able to do so within the time limit.

Share born in U.K. Education Employment Rate Wage Wage, London White British 90.45 94.43 17.38 80.16 11.60 15.60
Black, Caribbean 1.08 62.31 17.22 68.76 10.32 11.20Black, Other 1.06 17.25 20.39 64.47 9.26 9.59Bangladeshi 0.56 20.68 17.61 59.55 6.73 6.75
Pakistani 1.38 37.03 18.43 62.31 8.54 10.59Indian 2.26 37.74 19.52 75.29 11.72 12.29
Chinese 0.47 23.59 20.10 61.99 11.87 12.16Other 2.74 30.61 19.38 64.85 10.46 11.32
Share born in U.K. Education Employment Rate Wage Wage, London White British 90.51 93.82 17.37 67.57 8.93 12.34
Black, Caribbean 1.15 59.53 17.50 64.70 9.37 10.15Black, Other 1.25 15.85 19.16 50.92 8.74 9.14Bangladeshi 1.93 24.62 16.94 21.83 8.93 9.24
Pakistani 1.36 40.94 17.43 24.37 8.59 8.58Indian 0.59 34.57 18.74 58.72 9.08 9.96
Chinese 0.37 17.29 19.78 51.52 9.96 10.88Other 2.85 30.97 18.88 52.75 9.43 10.47
Note : Results refer to the Labour Force Survey for the years 2003 and 2004. 'Education' reports averageage at which individuals left full time education, excluding those currently in education. 'Employment rate'reports the ratio of employed workers and total working age (16-65) population. 'Wage' is the gross hourlywage. The last column restricts the sample to those living in London.
Panel A: Men
Table 1: Ethnic Minorities in the Labor Market
Panel B: Women

N Share Free Meal Status Mother Tongue Age in KS1White British 912,931 85.77% 14.07% 100.00% 6.46
Black, Caribbean 12,773 1.20% 31.70% 95.40% 6.47Black, Other 14,357 1.35% 38.72% 60.14% 6.46Bangladeshi 8,558 0.80% 52.16% 5.28% 6.47
Pakistani 23,120 2.17% 35.81% 12.71% 6.47Indian 21,194 1.99% 12.16% 21.23% 6.46
Chinese 2,738 0.26% 14.46% 29.51% 6.46Other 51,600 4.85% 26.16% 75.07% 6.46
N Share Free Meal Status Mother Tongue Age in KS4White British 1,617,595 83.41% 9.20% 100.00% 15.45
Black, Caribbean 26,018 1.34% 25.32% 95.12% 15.46Black, Other 25,784 1.33% 33.33% 54.95% 15.45Bangladeshi 16,231 0.84% 58.95% 3.44% 15.47
Pakistani 40,520 2.09% 37.14% 8.99% 15.46Indian 46,559 2.40% 11.63% 17.41% 15.46
Chinese 6,208 0.32% 12.81% 25.60% 15.46Other 87,740 4.52% 19.47% 70.61% 15.45
Panel A: Primary School (Sample A)
Panel B: Secondary School (Sample B)
Table 2: Ethnic Minorities in Primary and Secondary Schools
Note : The table share the number of observations (N), the share of pupils, the share of pupils eligible for freeschool meals, the share of pupils for whom English is a secondary language (ESL), as well as the average ageof pupils at Key Stage 1 and Key Stage 2 exams in each ethnic category. Panel A refers to pupils who took KeyStage 1 exams in 1998 or 1999. Panel B refers to pupils who took Key Stage 2 exams between 1998 and 2001.
Vocabulary Pictures Patterns English Math English MathBlack, Caribbean -6.608 1.841 -2.677 -1.498 -2.837 -2.125 -3.454
(0.925) (1.369) (0.844) (0.119) (0.124) (0.114) (0.126)Black, Other -10.579 -0.893 -4.948 -1.786 -2.889 -1.113 -2.037
(0.789) (0.590) (0.910) (0.127) (0.130) (0.117) (0.125)Bangladeshi -15.135 -3.655 -5.391 -5.812 -4.556 -2.547 -2.386
(0.705) (0.643) (0.502) (0.213) (0.206) (0.173) (0.182)Pakistani -15.513 -2.837 -4.868 -5.065 -4.911 -4.078 -3.667
(0.855) (1.167) (0.815) (0.149) (0.161) (0.131) (0.146)Indian -6.177 0.312 -0.992 -0.768 -0.815 0.065 1.200
(0.944) (0.739) (0.628) (0.116) (0.137) (0.130) (0.125)Chinese -6.437 5.208 4.332 -0.035 2.248 3.037 5.784
(4.310) (2.861) (1.750) (0.207) (0.209) (0.195) (0.185)Other -4.213 0.618 -0.967 -0.949 -0.757 0.327 0.122
(0.727) (0.531) (0.530) (0.073) (0.067) (0.069) (0.067)
Note : The first three columns ('Entry Gaps') show achievement gaps between ethnic minorities and the White British in threetests: naming vocabulary test, picture similarity test, and pattern construction test. Results are based on in Millennium CohortSurvey (MCS), and refer to children born in 2000 and 2001. The remaining columns show achievement gaps between ethnicminorities and the White British in Key Stage 1 (Age 6/7) and Key Stage 2 (10/11). Results are based on the National PupilData Base (NPD), and refer to pupils who took Key Stage 1 exams in 1998 or 1999 (Sample A). All test scores are
Entry Gaps (Age 5) Key Stage 1 (Age 6/7) Key Stage 2 (Age 10/11)
Table 3a: Ethnic Test Score Gaps through Primary School
(MCS) (NPD) (NPD)

English Math English Math English MathBlack, Caribbean -3.338 -4.462 -3.539 -4.150 -2.564 -4.033
(0.100) (0.106) (0.176) (0.171) (0.188) (0.169)Black, Other -3.094 -3.665 -2.187 -3.328 -0.462 -1.480
(0.111) (0.116) (0.196) (0.181) (0.197) (0.203)Bangladeshi -3.921 -3.553 -2.913 -3.046 -0.823 -0.840
(0.184) (0.205) (0.274) (0.329) (0.267) (0.248)Pakistani -4.158 -4.692 -3.336 -2.804 -1.604 -1.599
(0.124) (0.146) (0.189) (0.199) (0.183) (0.197)Indian -0.923 0.093 0.954 0.162 2.400 3.747
(0.103) (0.115) (0.198) (0.225) (0.180) (0.213)Chinese 1.544 4.691 4.083 4.432 4.859 8.116
(0.147) (0.144) (0.250) (0.269) (0.191) (0.186)Other -0.131 -0.153 0.644 -0.199 1.149 0.791
(0.068) (0.064) (0.136) (0.128) (0.132) (0.139)
Table 3b: Ethnic Test Score Gaps through Secondary School
Key Stage 2 Key Stage 3 Key Stage 4
Note : The table show achievement gaps between ethnic minorities through secondary school, at Key Stage 2,Key Stage 3, and Key Stage 4. Results refer to pupils who took Key Stage 2 exams between 1998 and 2001(Sample B). All test scores are standardized with mean 0 and standard deviation 10. Standard errors inparentheses allow for clustering at the school level.
(Age 10/11) (Age 13/14) (Age 15/16)

no controls language poverty both no controls language poverty bothBlack, Caribbean -1.498 -1.355 -0.476 -0.364 -2.837 -2.743 -2.029 -1.959
(0.119) (0.119) (0.114) (0.114) (0.124) (0.123) (0.123) (0.122)Black, Other -1.786 -0.547 -0.356 0.657 -2.889 -2.071 -1.759 -1.118
(0.127) (0.122) (0.117) (0.115) (0.130) (0.127) (0.125) (0.123)Bangladeshi -5.812 -2.867 -3.603 -1.188 -4.556 -2.612 -2.810 -1.283
(0.213) (0.224) (0.218) (0.228) (0.206) (0.214) (0.218) (0.224)Pakistani -5.065 -2.351 -3.804 -1.573 -4.911 -3.120 -3.914 -2.504
(0.149) (0.160) (0.151) (0.159) (0.161) (0.168) (0.164) (0.170)Indian -0.768 1.682 -0.878 1.143 -0.815 0.802 -0.902 0.376
(0.116) (0.125) (0.109) (0.118) (0.137) (0.140) (0.134) (0.137)Chinese -0.035 2.157 -0.012 1.796 2.248 3.695 2.266 3.409
(0.207) (0.212) (0.202) (0.207) (0.209) (0.216) (0.207) (0.214)Other -0.949 -0.174 -0.247 -0.388 -0.757 -0.245 -0.202 0.200
(0.073) (0.065) (0.065) (0.060) (0.067) (0.064) (0.063) (0.061)language 3.109** 2.565** 2.052** 1.621**
poverty -5.799 -5.761 -4.583 -4.559
no controls language poverty both no controls language poverty bothBlack, Caribbean -2.125 -2.038 -1.062 -1.004 -3.454 -3.404 -2.512 -2.487
(0.114) (0.113) (0.108) (0.108) (0.126) (0.125) (0.122) (0.122)Black, Other -1.113 -0.356 0.375 0.901 -2.037 -1.605 -0.720 -0.491
(0.117) (0.114) (0.109) (0.108) (0.125) (0.123) (0.119) (0.118)Bangladeshi -2.547 -0.749 -0.248 1.004 -2.386 -1.361 -0.351 0.194
(0.173) (0.184) (0.180) (0.190) (0.182) (0.190) (0.187) (0.194)Pakistani -4.078 -2.421 -2.766 -1.609 -3.667 -2.722 -2.506 -2.002
(0.131) (0.143) (0.126) (0.138) (0.146) (0.154) (0.145) (0.152)Indian 0.065 1.560 -0.050 0.998 1.200 2.052 1.098 1.554
(0.130) (0.134) (0.123) (0.126) (0.125) (0.134) (0.118) (0.128)Chinese 3.037 4.375 3.061 3.998 5.784 6.547 5.805 6.213
(0.195) (0.199) (0.194) (0.198) (0.185) (0.191) (0.183) (0.190)Other 0.327 0.801 1.058 1.387 0.122 0.391 0.768 0.911
(0.069) (0.066) (0.062) (0.060) (0.067) (0.066) (0.062) (0.062)language 1.890** 1.330** 1.082** 0.579**
poverty -6.034 -6.014 -5.340 -5.331
lagnuage poverty both lagnuage poverty bothBlack, Caribbean -8.87% 6.61% -1.93% -7.23% 21.63% 14.30%
Black, Other 71.71% -8.61% 63.85% 45.35% -21.88% 26.44%Bangladeshi 35.13% -2.74% 32.87% 42.32% -13.28% 31.96%
Pakistani 107.08% -5.18% 103.62% 68.04% -13.22% 59.66%Indian 114.58% 0.54% 117.42% 37.93% 0.71% 41.51%
Chinese 27.79% -0.03% 28.30% 19.33% -0.09% 20.70%Other 23.66% -2.23% -39.09% 27.53% -10.43% 18.97%
English MathPanel B: Key Stage 2 (Age 10/11)
Note : Panel A (Key Stage 1) and Panel B (Key Stage 2) report how achievement gaps between ethnic minoritiesand the White British change if one controls for English as a mother tongue and free meal status (poverty). Eachpanel aslo reports the effect of language and poverty on achievement; here ** and * notes that the effect isstatistically significant at a 1 and 5% level, repsectively.Panel C reports the share of the widening (BlackCaribbeans) or narrowing (all other ethnic groups) of the achievement gap between Key Stage 1 and 2 that can beattributed to language and free meal status. Results refer to pupils who took Key Stage 1 exams in 1998 or 1999(Sample A). Test scores are standardized with mean 50 and standard deviation 10. Standard errors in parenthesesallow for clustering at the school level.
Table 4a: Ethnic Test Score Gaps through Primary School: The Role of Family Background Characteristics
Panel A: Key Stage 1 (Age 6/7)English Math
English MathPanel C: Share Explained by Family Background Characteristics, KS1 --> KS2

no controls lagnuage poverty both no controls lagnuage poverty bothBlack, Caribbean -3.338 -3.193 -2.498 -2.392 -4.462 -4.373 -3.713 -3.656
(0.100) (0.099) (0.095) (0.095) (0.106) (0.105) (0.104) (0.103)Black, Other -3.094 -1.756 -1.836 -0.782 -3.665 -2.849 -2.544 -1.977
(0.111) (0.103) (0.101) (0.097) (0.116) (0.111) (0.109) (0.107)Bangladeshi -3.921 -1.053 -1.330 0.930 -3.553 -1.803 -1.243 -0.026
(0.184) (0.190) (0.189) (0.194) (0.205) (0.208) (0.215) (0.217)Pakistani -4.819 -2.116 -3.364 -1.222 -4.692 -3.042 -3.394 -2.242
(0.124) (0.131) (0.119) (0.127) (0.146) (0.149) (0.143) (0.146)Indian -0.923 1.530 -0.797 1.161 0.093 1.590 0.206 1.260
(0.103) (0.107) (0.098) (0.102) (0.115) (0.118) (0.110) (0.113)Chinese 1.544 3.754 1.732 3.495 4.691 6.039 4.858 5.807
(0.147) (0.152) (0.142) (0.148) (0.144) (0.149) (0.139) (0.145)Other -0.131 0.742 0.405 1.096 -0.153 0.380 0.325 0.697
(0.068) (0.060) (0.060) (0.055) (0.064) (0.060) (0.059) (0.057)English as a mother tongue 2.970** 2.373** 1.812** 1.277**
poverty -5.207 -5.146 -4.642 -4.610
no controls lagnuage poverty both no controls lagnuage poverty bothBlack, Caribbean -3.539 -3.453 -2.600 -2.551 -4.150 -4.092 -3.641 -3.604
(0.176) (0.174) (0.158) (0.156) (0.171) (0.169) (0.163) (0.162)Black, Other -2.187 -1.389 -0.779 -0.291 -3.328 -2.795 -2.565 -2.201
(0.196) (0.182) (0.173) (0.166) (0.181) (0.167) (0.170) (0.160)Bangladeshi -2.913 -1.202 -0.014 1.033 -3.046 -1.902 -1.474 -0.693
(0.274) (0.284) (0.249) (0.260) (0.329) (0.324) (0.307) (0.305)Pakistani -3.336 -1.724 -1.708 -0.716 -2.804 -1.726 -1.921 -1.181
(0.189) (0.212) (0.171) (0.194) (0.199) (0.207) (0.190) (0.199)Indian 0.954 2.417 1.095 2.002 0.162 1.140 0.238 0.915
(0.198) (0.207) (0.186) (0.196) (0.225) (0.219) (0.218) (0.213)Chinese 4.083 5.401 4.293 5.109 4.432 5.313 4.546 5.155
(0.250) (0.248) (0.233) (0.235) (0.269) (0.265) (0.260) (0.257)Other 0.644 1.164 1.243 1.563 -0.199 0.149 0.126 0.365
(0.136) (0.127) (0.122) (0.117) (0.128) (0.117) (0.121) (0.113)language 1.772** -0.064 1.185** 0.820**
poverty -5.826 -5.798 -3.159 -3.138
no controls lagnuage poverty both no controls lagnuage poverty bothBlack, Caribbean -2.564 -2.536 -1.482 -1.492 -4.033 -4.039 -2.970 -3.010
(0.188) (0.187) (0.172) (0.171) (0.169) (0.169) (0.156) (0.155)Black, Other -0.462 -0.202 1.159 1.069 -1.480 -1.533 0.113 -0.281
(0.197) (0.188) (0.178) (0.172) (0.203) (0.204) (0.185) (0.188)Bangladeshi -0.823 -0.267 2.516 2.321 -0.840 -0.954 2.441 1.596
(0.267) (0.270) (0.247) (0.247) (0.248) (0.258) (0.225) (0.234)Pakistani -1.604 -1.080 0.271 0.086 -1.599 -1.707 0.243 -0.557
(0.183) (0.202) (0.162) (0.183) (0.197) (0.216) (0.175) (0.197)Indian 2.400 2.876 2.563 2.394 3.747 3.650 3.907 3.175
(0.180) (0.192) (0.164) (0.179) (0.213) (0.222) (0.198) (0.209)Chinese 4.859 5.287 5.101 4.949 8.116 8.029 8.354 7.695
(0.191) (0.203) (0.174) (0.189) (0.186) (0.201) (0.171) (0.188)Other 1.149 1.318 1.839 1.779 0.791 0.756 1.469 1.211
(0.132) (0.129) (0.117) (0.116) (0.139) (0.138) (0.127) (0.126)language 0.576** -0.204 -0.118 -0.887
poverty -6.710 -6.716 -6.593 -6.616
lagnuage poverty both lagnuage poverty bothBlack, Caribbean 15.10% -31.33% -16.46% 21.97% -73.41% -50.87%
Black, Other 40.97% -13.80% 29.69% 39.78% -21.56% 22.41%Bangladeshi 74.63% -24.15% 55.11% 68.69% -35.78% 40.19%
Pakistani 67.79% -13.07% 59.31% 56.81% -17.63% 45.54%Indian 59.50% -1.10% 62.89% 43.63% -1.30% 47.57%
Chinese 53.75% -1.64% 56.14% 41.93% -2.06% 44.88%Other 54.99% -12.09% 46.56% 60.14% -21.28% 45.52%
Panel D: Share Explained by Family Background Characteristics, KS2 --> KS4English Math
Note : Panel A (Key Stage 2), Panel B (Key Stage 3), and Panel C (Key Stage 4) report how achievement gaps between ethnic minorities andthe White British change if one controls for English as a mother tongue and free meal status (poverty). Each panel aslo reports the effect oflanguage and poverty on achievement; here ** and * notes that the effect is statistically significant at a 1 and 5% level, repsectively. Panel Dreports the share of the widening or narrowing of the achievement gap between Key Stage 2 and 4 that can be attributed to language and freemeal status. Results refer to pupils who took Key Stage 2 exams between 1998 and 2001 (Sample B). Test scores are standardized with mean50 and standard deviation 10. Standard errors in parentheses allow for clustering at the school level.
Table 4b: Ethnic Test Score Gaps through Secondary School:
English Math
The Role of Family Background Characteristics
Panel A: Key Stage 2 (Age 10/11)
Panel C: Key Stage 4 (Age 15/16)English Math
Panel B: Key Stage 3 (Age 13/14)English Math

Share Share Mean Share Share MeanWhite British Free Meal Test Score White British Free Meal Test Score
White British 91.17 14.40 50.23 91.22 14.38 50.13Black, Caribbean 44.53 30.35 48.46 43.56 31.29 48.96
Black, Other 42.20 32.99 48.15 42.38 33.49 49.05Bangladeshi 31.74 43.55 46.29 31.85 44.29 47.77
Pakistani 33.55 33.14 46.79 33.43 33.27 47.22Indian 43.98 21.00 48.80 44.08 20.67 49.46
Chinese 73.04 20.78 49.62 73.65 20.34 50.22Other 65.29 21.79 49.39 65.20 21.83 49.93
Share Share Mean Share Share MeanWhite British Free Meal Test Score White British Free Meal Test Score
White British 89.61 9.85 50.09 89.64 9.85 50.01Black, Caribbean 45.09 24.56 48.22 44.97 24.71 48.85
Black, Other 44.45 24.66 48.60 44.59 24.69 49.37Bangladeshi 34.05 41.99 47.09 34.21 42.02 48.31
Pakistani 44.04 28.13 47.88 44.06 28.15 48.46Indian 46.27 16.83 50.11 46.23 16.83 50.48
Chinese 71.82 13.66 51.72 71.81 13.71 51.70Other 62.83 15.76 50.23 62.86 15.76 50.59
Note: The table shows the share of White British pupils the White British and ethnic minorities go to schoolwith, the share of pupils who are eligible for free meals as well as the average English test score of peersthroughout primary (Panel A) and secondary (Panel B) school. Results in Panel A refer to pupils who took KeyStage 1 exams in 1998 or 1999 (Sample A). Results in Panel B refer to pupils who took key stage 2 examsbetween 1998 and 2001 (Sample B).
Key Stage 3 Key Stage 4
Table 5: Ethnic Minorities and 'School Quality and Composition'
Key Stage 1Panel A: Primary School (Sample A)
Key Stage 2
Panel B: Secondary School (Sample B)

Key Stage 1 Key Stage 2 Key Stage 1 Key Stage 2 Black, Caribbean OLS -1.498 -2.125 -2.837 -3.454
School FE 0.173 -1.075 -2.197 -2.274(0.094) (0.090) (0.093) (0.092)
Black, Other OLS -1.786 -1.113 -2.889 -2.037School FE 0.204 -0.181 -2.216 -1.002
(0.095) (0.087) (0.093) (0.089)Bangladeshi OLS -5.812 -2.547 -4.556 -2.386
School FE -3.118 -0.621 -3.926 -0.987(0.139) (0.123) (0.137) (0.130)
Pakistani OLS -5.065 -4.078 -4.911 -3.667School FE -2.726 -1.879 -3.844 -1.849
(0.088) (0.082) (0.088) (0.086)Indian OLS -0.768 0.065 -0.815 1.200
School FE 0.511 0.751 -0.415 1.721(0.077) (0.074) (0.080) (0.078)
Chinese OLS -0.035 3.037 2.248 5.784School FE 0.504 2.887 2.315 5.730
(0.182) (0.176) (0.183) (0.166)Other OLS -0.949 0.327 -0.757 0.122
School FE -0.200 0.447 -0.589 0.331(0.048) (0.046) (0.048) (0.047)
Key Stage 1 Key Stage 2 Key Stage 1 Key Stage 2 Black, Caribbean within 0.101 -0.813 -1.142 -1.599
between -1.599 -1.312 -1.695 -1.855Black, Other within 0.119 -0.115 -1.531 -0.611
between -1.905 -0.998 -1.358 -1.426Bangladeshi within -1.526 -0.280 -1.986 -0.468
between -4.286 -2.268 -2.570 -1.918Pakistani within -1.293 -0.863 -1.843 -0.841
between -3.772 -3.215 -3.068 -2.826Indian within 0.286 0.469 -0.287 1.085
between -1.053 -0.404 -0.527 0.115Chinese within 0.531 2.813 2.229 5.553
between -0.566 0.224 0.019 0.231Other within -0.051 0.417 -0.405 0.317
between -0.897 -0.090 -0.352 -0.196
Black, CaribbeanBlack, OtherBangladeshi
PakistaniIndian
ChineseOther
Note : Panel A compares OLS with fixed school (within) estimates of the ethnic test score gap. Paneldecomposes the test score gap (estimated by OLS) into a within and between school component,following Hanushek et al. (2007). Panel C reports the share of the widening or narrowing test score gapbetween key stage 1 and 2 that occurs within schools. Results refer to pupils who took Key Stage 1exams in 1998 or 1999 (Sample A).
145.75%-34.73%38.17%43.57%22.01%
36.73%
68.11%94.01%
107.98%
82.24%
Table 6a: Ethnic Test Score Gaps through Primary School:The Role of Schools
Panel B: OLS versus Fixed School Effect EstimatesEnglish Math
Panel B: Within/Between School DecompositionEnglish
Panel C: Share that Happens Within Schools, KS1 --> KS2English
Math
74.29%
69.94%80.54%
Math74.06%
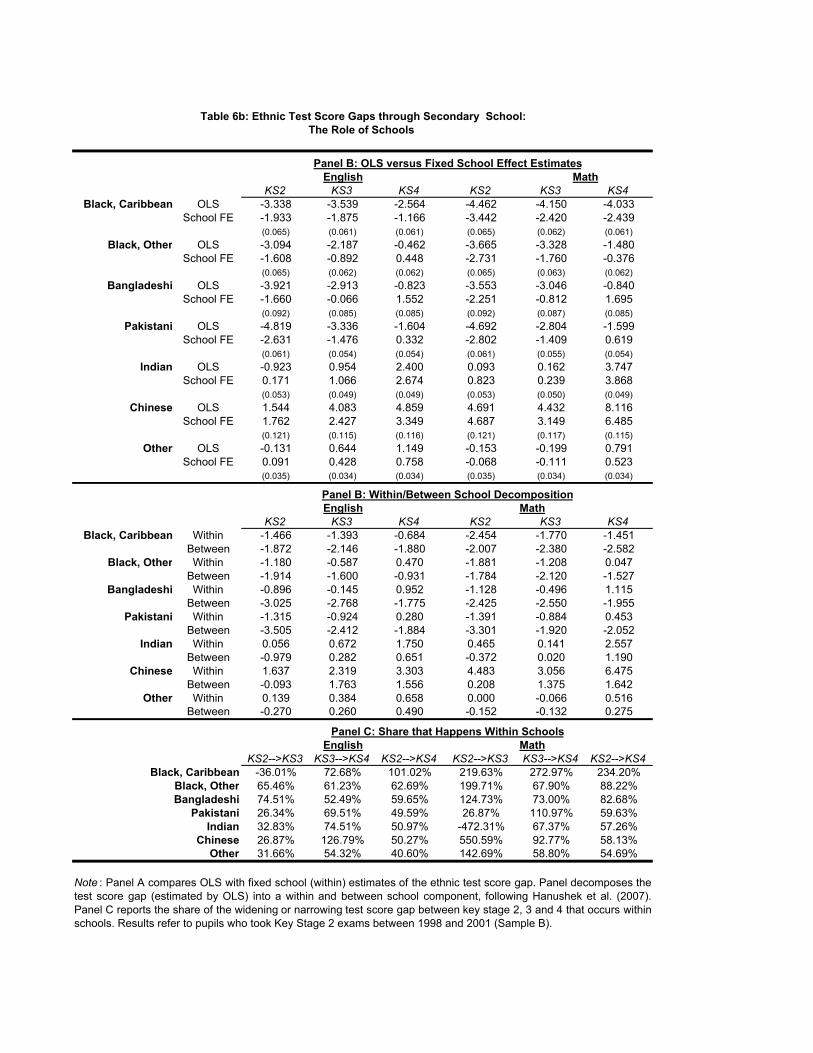
KS2 KS3 KS4 KS2 KS3 KS4Black, Caribbean OLS -3.338 -3.539 -2.564 -4.462 -4.150 -4.033
School FE -1.933 -1.875 -1.166 -3.442 -2.420 -2.439(0.065) (0.061) (0.061) (0.065) (0.062) (0.061)
Black, Other OLS -3.094 -2.187 -0.462 -3.665 -3.328 -1.480School FE -1.608 -0.892 0.448 -2.731 -1.760 -0.376
(0.065) (0.062) (0.062) (0.065) (0.063) (0.062)Bangladeshi OLS -3.921 -2.913 -0.823 -3.553 -3.046 -0.840
School FE -1.660 -0.066 1.552 -2.251 -0.812 1.695(0.092) (0.085) (0.085) (0.092) (0.087) (0.085)
Pakistani OLS -4.819 -3.336 -1.604 -4.692 -2.804 -1.599School FE -2.631 -1.476 0.332 -2.802 -1.409 0.619
(0.061) (0.054) (0.054) (0.061) (0.055) (0.054)Indian OLS -0.923 0.954 2.400 0.093 0.162 3.747
School FE 0.171 1.066 2.674 0.823 0.239 3.868(0.053) (0.049) (0.049) (0.053) (0.050) (0.049)
Chinese OLS 1.544 4.083 4.859 4.691 4.432 8.116School FE 1.762 2.427 3.349 4.687 3.149 6.485
(0.121) (0.115) (0.116) (0.121) (0.117) (0.115)Other OLS -0.131 0.644 1.149 -0.153 -0.199 0.791
School FE 0.091 0.428 0.758 -0.068 -0.111 0.523(0.035) (0.034) (0.034) (0.035) (0.034) (0.034)
MathKS2 KS3 KS4 KS2 KS3 KS4
Black, Caribbean Within -1.466 -1.393 -0.684 -2.454 -1.770 -1.451Between -1.872 -2.146 -1.880 -2.007 -2.380 -2.582
Black, Other Within -1.180 -0.587 0.470 -1.881 -1.208 0.047Between -1.914 -1.600 -0.931 -1.784 -2.120 -1.527
Bangladeshi Within -0.896 -0.145 0.952 -1.128 -0.496 1.115Between -3.025 -2.768 -1.775 -2.425 -2.550 -1.955
Pakistani Within -1.315 -0.924 0.280 -1.391 -0.884 0.453Between -3.505 -2.412 -1.884 -3.301 -1.920 -2.052
Indian Within 0.056 0.672 1.750 0.465 0.141 2.557Between -0.979 0.282 0.651 -0.372 0.020 1.190
Chinese Within 1.637 2.319 3.303 4.483 3.056 6.475Between -0.093 1.763 1.556 0.208 1.375 1.642
Other Within 0.139 0.384 0.658 0.000 -0.066 0.516Between -0.270 0.260 0.490 -0.152 -0.132 0.275
MathKS2-->KS3 KS3-->KS4 KS2-->KS4 KS2-->KS3 KS3-->KS4 KS2-->KS4
Black, Caribbean -36.01% 72.68% 101.02% 219.63% 272.97% 234.20%Black, Other 65.46% 61.23% 62.69% 199.71% 67.90% 88.22%Bangladeshi 74.51% 52.49% 59.65% 124.73% 73.00% 82.68%
Pakistani 26.34% 69.51% 49.59% 26.87% 110.97% 59.63%Indian 32.83% 74.51% 50.97% -472.31% 67.37% 57.26%
Chinese 26.87% 126.79% 50.27% 550.59% 92.77% 58.13%Other 31.66% 54.32% 40.60% 142.69% 58.80% 54.69%
Note : Panel A compares OLS with fixed school (within) estimates of the ethnic test score gap. Panel decomposes thetest score gap (estimated by OLS) into a within and between school component, following Hanushek et al. (2007).Panel C reports the share of the widening or narrowing test score gap between key stage 2, 3 and 4 that occurs withinschools. Results refer to pupils who took Key Stage 2 exams between 1998 and 2001 (Sample B).
Table 6b: Ethnic Test Score Gaps through Secondary School:The Role of Schools
Panel B: OLS versus Fixed School Effect EstimatesMathEnglish
English
English
Panel B: Within/Between School Decomposition
Panel C: Share that Happens Within Schools
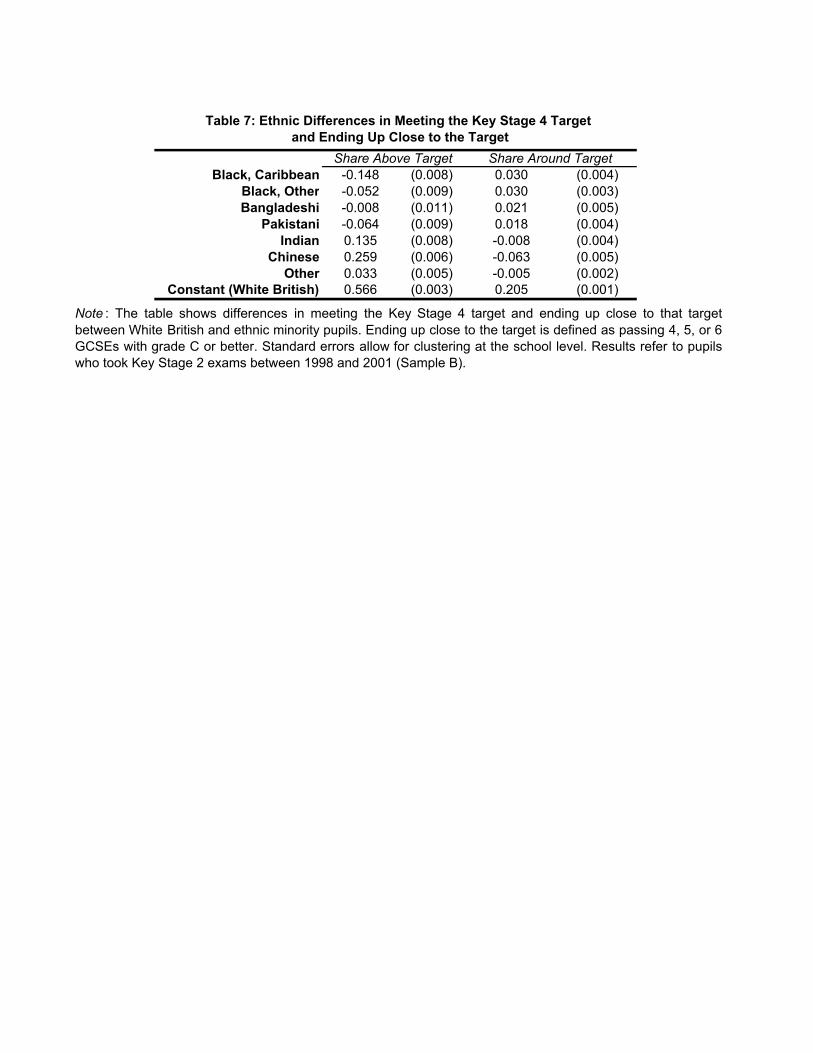
Black, Caribbean -0.148 (0.008) 0.030 (0.004)Black, Other -0.052 (0.009) 0.030 (0.003)Bangladeshi -0.008 (0.011) 0.021 (0.005)
Pakistani -0.064 (0.009) 0.018 (0.004)Indian 0.135 (0.008) -0.008 (0.004)
Chinese 0.259 (0.006) -0.063 (0.005)Other 0.033 (0.005) -0.005 (0.002)
Constant (White British) 0.566 (0.003) 0.205 (0.001)
Note : The table shows differences in meeting the Key Stage 4 target and ending up close to that targetbetween White British and ethnic minority pupils. Ending up close to the target is defined as passing 4, 5, or 6GCSEs with grade C or better. Standard errors allow for clustering at the school level. Results refer to pupilswho took Key Stage 2 exams between 1998 and 2001 (Sample B).
Table 7: Ethnic Differences in Meeting the Key Stage 4 Target
Share Around Target and Ending Up Close to the Target
Share Above Target
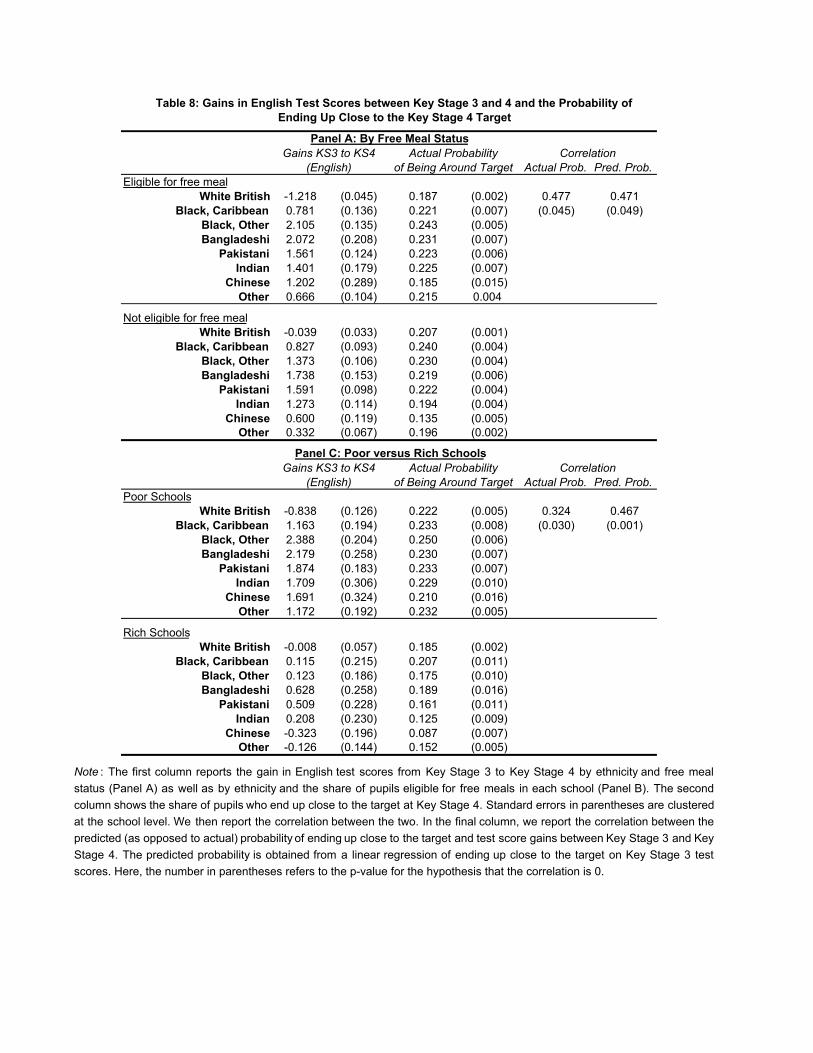
Actual Prob. Pred. Prob.Eligible for free meal
White British -1.218 (0.045) 0.187 (0.002) 0.477 0.471Black, Caribbean 0.781 (0.136) 0.221 (0.007) (0.045) (0.049)
Black, Other 2.105 (0.135) 0.243 (0.005)Bangladeshi 2.072 (0.208) 0.231 (0.007)
Pakistani 1.561 (0.124) 0.223 (0.006)Indian 1.401 (0.179) 0.225 (0.007)
Chinese 1.202 (0.289) 0.185 (0.015)Other 0.666 (0.104) 0.215 0.004
Not eligible for free mealWhite British -0.039 (0.033) 0.207 (0.001)
Black, Caribbean 0.827 (0.093) 0.240 (0.004)Black, Other 1.373 (0.106) 0.230 (0.004)Bangladeshi 1.738 (0.153) 0.219 (0.006)
Pakistani 1.591 (0.098) 0.222 (0.004)Indian 1.273 (0.114) 0.194 (0.004)
Chinese 0.600 (0.119) 0.135 (0.005)Other 0.332 (0.067) 0.196 (0.002)
Actual Prob. Pred. Prob.Poor Schools
White British -0.838 (0.126) 0.222 (0.005) 0.324 0.467Black, Caribbean 1.163 (0.194) 0.233 (0.008) (0.030) (0.001)
Black, Other 2.388 (0.204) 0.250 (0.006)Bangladeshi 2.179 (0.258) 0.230 (0.007)
Pakistani 1.874 (0.183) 0.233 (0.007)Indian 1.709 (0.306) 0.229 (0.010)
Chinese 1.691 (0.324) 0.210 (0.016)Other 1.172 (0.192) 0.232 (0.005)
Rich SchoolsWhite British -0.008 (0.057) 0.185 (0.002)
Black, Caribbean 0.115 (0.215) 0.207 (0.011)Black, Other 0.123 (0.186) 0.175 (0.010)Bangladeshi 0.628 (0.258) 0.189 (0.016)
Pakistani 0.509 (0.228) 0.161 (0.011)Indian 0.208 (0.230) 0.125 (0.009)
Chinese -0.323 (0.196) 0.087 (0.007)Other -0.126 (0.144) 0.152 (0.005)
Gains KS3 to KS4 Actual Probability
Correlation
Table 8: Gains in English Test Scores between Key Stage 3 and 4 and the Probability of Ending Up Close to the Key Stage 4 Target
CorrelationPanel C: Poor versus Rich Schools
Panel A: By Free Meal Status
(English) of Being Around Target
Gains KS3 to KS4 Actual Probability(English) of Being Around Target
Note : The first column reports the gain in English test scores from Key Stage 3 to Key Stage 4 by ethnicity and free mealstatus (Panel A) as well as by ethnicity and the share of pupils eligible for free meals in each school (Panel B). The secondcolumn shows the share of pupils who end up close to the target at Key Stage 4. Standard errors in parentheses are clusteredat the school level. We then report the correlation between the two. In the final column, we report the correlation between thepredicted (as opposed to actual) probability of ending up close to the target and test score gains between Key Stage 3 and KeyStage 4. The predicted probability is obtained from a linear regression of ending up close to the target on Key Stage 3 testscores. Here, the number in parentheses refers to the p-value for the hypothesis that the correlation is 0.

Figure 1: English Test Score at Key Stage 3 and Predicted Probability of Just Passing or Failing the Target
Note : The figure coefficients from a linear regression that regresses an indicator variable for whether a pupil just passed or just failed the targetin Key Stage 4 on the decile of their English test score distribution in Key Stage 3. Just failing or just passing the target is defined as passingbetween 4 and 6 GCSEs, including English and Mathematics, with grade C or better.
0.0
5.1
.15
.2.2
5.3
.35
Pre
dict
ed P
roba
bilit
y of
Bei
ng A
roun
d Ta
rget
0 20 40 60 80 100Percentile