educational policy and its impact on teacher preparation and evaluation in the united states and...
TRANSCRIPT

Educational Policy and its Impact on Teacher Preparation and Evaluation
in the United States and Puerto Rico
Summer Seminar College of Education
UPR –Rio Pierdas
June 15, 2016
Peter M. Vigil, PhD Associate Professor, Teacher Education Metropolitan State University of Denver [email protected]

Objetivos de la Sesión � Los participantes desarrollarán una
comprensión de la “Every Student Succeeds Act“ (ESSA)
� Los participantes serán capaces de identificar diferencias importantes en las políticas prescritas de ESSA en comparación con el anterior “No Child Left Behind"
� Los participantes desarrollarán un entendimiento sobre el impacto potencial de ESSA en la preparación y la evaluación de los maestros en los EE.UU. y Puerto Rico

Presentation Objectives:
• Par$cipants will develop a comprehensive understanding of the “Every Student Succeeds Act” (ESSA)
• Par$cipants will be able to iden$fy important differences in the prescribed policies of ESSA in comparison to the previous “No-‐Child Le8 Behind Act”
• Par$cipants will develop an understanding on the poten$al impact of ESSA on teacher prepara$on and teacher evalua$on in both the U. S. and Puerto Rico

“Every Student Succeeds Act” (ESSA)
� Firmado como ley Federal el 10 de Diciembre, 2015 � Reautorización of the “Elementary and Secondary
Education Act de 1965, replaces the No Child Left Behind Act
� Policy: Standards, Assessments, and Accountability � La plena aplicación de ESSA en el año escolar
2017-2018 � La elaboración de normas y el proceso de orientación
requiere la participación de las partes interesadas, con el desarrollo de un plan estatal para la implementación de políticas y programas

The “Elementary and Secondary Education Act” (ESEA) de 1965: un péndulo oscilante
� ESSA es la versión más reciente de la ESEA firmado originalmente por Presidente L. B. Johnson en 1965
� “War on Poverty” – Movimeinto de derechos civiles � Title I, Title III, Title IV � 1970’s - strict federal rules and regulations guaranteed that funds would
be allocated solely to students in need – specifically students eligible for services based on socioeconomic status and academic achievement
� 1980’s - During the Reagan Administra$on, Congress passed the Educa$on Consolida$on and Improvement Act (ECIA) in 1981 to reduce federal regula$ons of Title I.
� 1990’s -‐ 1994 Improving America’s Schools Act (IASA) –added math and language arts standards for accountability
� 2000’s -‐ NCLB required increased accountability from schools both from the teachers and from the students
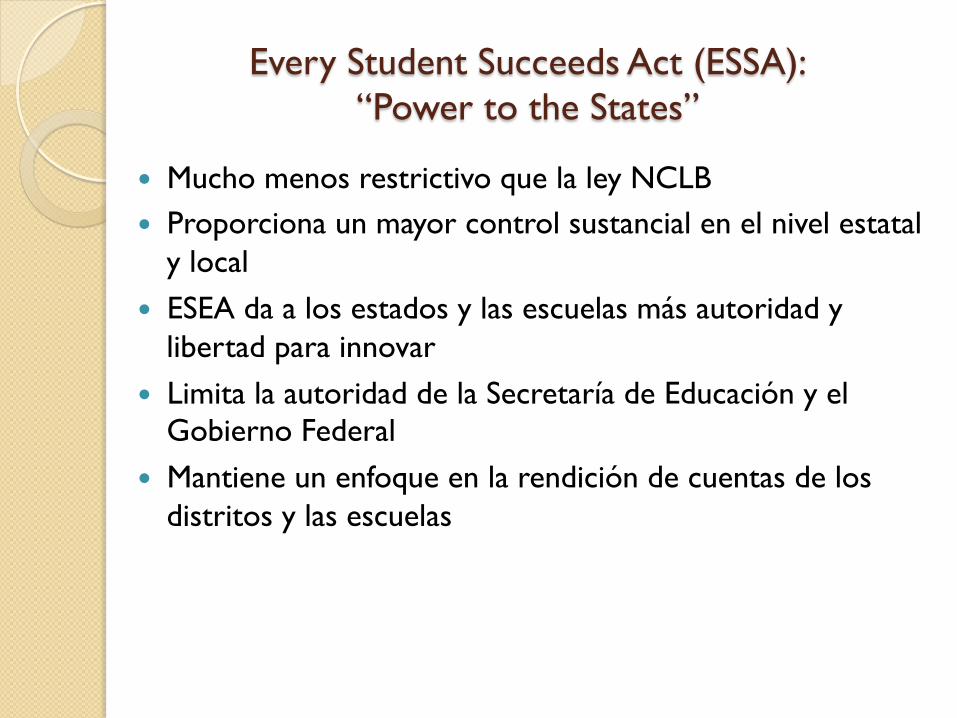
Every Student Succeeds Act (ESSA): “Power to the States”
� Mucho menos restrictivo que la ley NCLB � Proporciona un mayor control sustancial en el nivel estatal
y local � ESEA da a los estados y las escuelas más autoridad y
libertad para innovar � Limita la autoridad de la Secretaría de Educación y el
Gobierno Federal � Mantiene un enfoque en la rendición de cuentas de los
distritos y las escuelas

Every Student Succeeds Act (ESSA): Standards
� Requiere rigurosos estándares estatales en matemáticas, lectura / lenguaje y la ciencia
� Normas alternativas para los estudiantes con
discapacidades cognitivas significativas
� Standards for English-language proficiency
� Estados no están obligados a utilizar los “Common Core” standards

Every Student Succeeds Act (ESSA): Evaluacion (Assessment)
� Las evaluaciones necesitan alinear con las normas (standards) del Estado
� Matemáticas y lengua y artes Inglés en los grados 3-8 y una vez en la escuela secundaria (Elementary, Middle, High-school)
� La ciencia cada vez en la escuela primaria, secundaria y preparatoria
� Los estados pueden administrar evaluaciones como prueba única o como un conjunto de pruebas provisionales que se pueden enrollar en un único resultado anual para cada estudiante

Every Student Succeeds Act (ESSA): State Accountability
� Achievement on State Tests (overall & disaggregated) � Growth on State Tests (overall & disaggregated) � Graduation Rates (overall & disaggregated) � English Language Proficiency of ELLs � Other School Quality or Student Success Indicator: ◦ Student Engagement; school climate; community engagement;
student access to advanced (AP classes)
� 95% Participation Rate: ◦ States will determine opt-out policies for state tests

Every Student Succeeds Act (ESSA): School Accountability
� State is required to identify “Comprehensive Support Schools” once every three (3) years ◦ Lowest performing 5% of Title I Schools ◦ High schools with graduation rate below 67%
� States notify districts of any comprehensive support schools
� In partnership with stakeholders, districts must develop and implement a comprehensive support and improvement plan for each school
� If a school does not meet the State’s exit criteria, it must implement more rigorous interventions, determined by the State

Every Student Succeeds Act (ESSA): English Language Learners
� Los Estados deben elaborar normas (standards) para los estudiantes ELL que reflejan las habilidades de lenguaje y prácticas los ELLs deben participar con éxito en los estándares académicos
� Los Estados deben administrar e informar sobre el rendimiento escolar anuales basados en estándares evaluaciones de dominio del idioma Inglés para los ELLs
� Los Estados deben elaborar “exit-criteria” para los estudiantes ELL
� Los estudiantes clasificados anteriormente como ELL deben ser incluidos en la presentación de informes y la rendición de cuentas, por un período de 4 años después de que hayan sido reclasificados.

Every Student Succeeds Act (ESSA): English Language Learners
� Se ofrecen dos opciones para evaluar, informar, e incluir en la rendición de cuentas los ELLs recién llegados:
1. Los Estados pueden excluir los ELLs recientemente llegaron de una administración de la evaluación de lectura / artes del lenguaje y evaluar e incorporar estos resultados de las pruebas de ELLs después de que hayan sido inscritos en una escuela de EE.UU. durante un año, como fue el caso en virtud de la ley NCLB
2. La segunda opción requiere que los estados ponen a prueba los ELLs recién llegados y informe de resultados para los dos primeros años, pero permite a los Estados excluir los resultados de estos estudiantes desde el sistema de responsabilidad del estado en el primer año, incluir una medida de estudiante el crecimiento en el segundo año, e incluir el dominio en las evaluaciones académicas a partir de tercer año del estudiante en una escuela de EE.UU.

Every Student Succeeds Act (ESSA): Quality Instruction and Teacher Evaluation
� ESSA eliminates “highly qualified teacher” requirement from No Child Left Behind: States must report data on whether low-‐income and minority students are being served at dispropor$onate rates by “ineffec<ve, out-‐of-‐field, or inexperienced teacher”
� ESSA da a los estados la capacidad para definir la definición de los siguientes:: ◦ “Teacher Effectiveness”: Student scores are NOT required to be
factored into teacher evaluation ◦ Teacher Preparacion Performance standards. Content exams, etc.
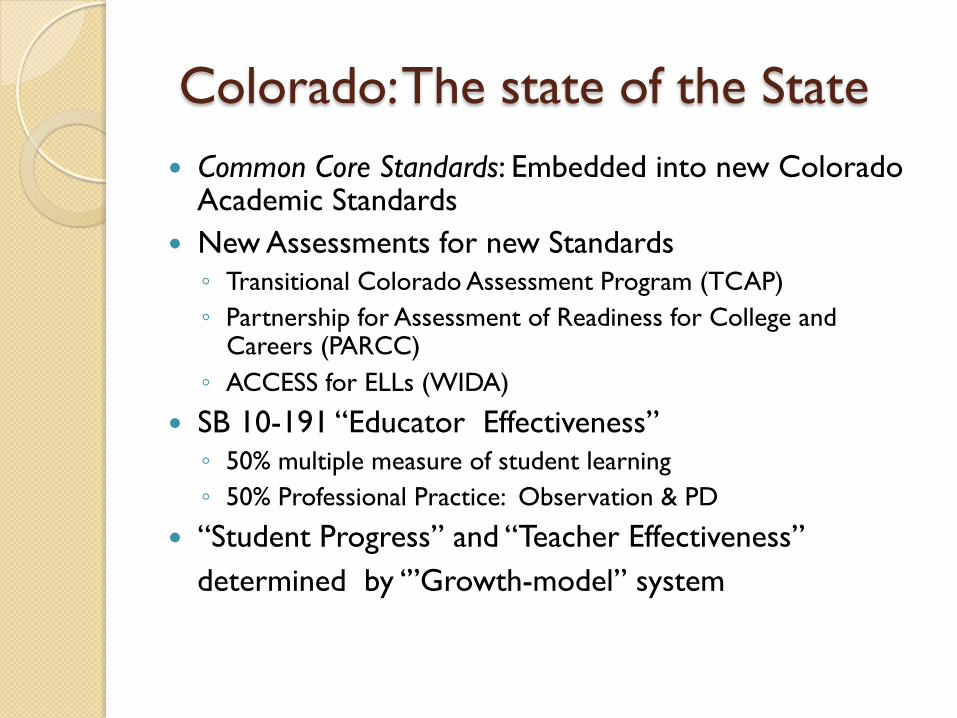
Colorado: The state of the State � Common Core Standards: Embedded into new Colorado
Academic Standards � New Assessments for new Standards ◦ Transitional Colorado Assessment Program (TCAP) ◦ Partnership for Assessment of Readiness for College and
Careers (PARCC) ◦ ACCESS for ELLs (WIDA)
� SB 10-191 “Educator Effectiveness” ◦ 50% multiple measure of student learning ◦ 50% Professional Practice: Observation & PD
� “Student Progress” and “Teacher Effectiveness” determined by ‘”Growth-model” system

Teacher Evaluation: Puerto Rico � Departamento de Educaion de Puerto Rico � http://www.de.gobierno.pr/

Value-added Models (VAM) � Many states and school districts have adopted Value-
Added Models (VAMs) as part of educational accountability systems
� The goal of these models is to estimate effects of
individual teachers or schools on student achievement while accounting for differences in student background.
� VAMs are increasingly promoted or mandated as a
component in high-stakes decisions such as determining compensation, evaluating and ranking teachers, hiring or dismissing teachers, awarding tenure, and closing schools.

Value-added Models (VAM) � El objetivo de estos modelos es estimar los
efectos de los maestros o escuelas individuales en el rendimiento estudiantil mientras cuenta las diferencias en la formación del estudiante
� VAM (“Growth Model”) son promovidos como un componente obligatorio en las decisiones de altas apuestas, tales como la determinación de la compensación, la evaluación y la clasificación de los profesores, contratación o despido de los maestros, la concesión de la tenencia, y el cierre de las escuelas cada vez

VAM Statistical Methods � Value-added models typically use a form of regression model
predicting student scores or growth on standardized tests from background variables (including prior test scores), with terms in the model for the teachers who have taught the student.
� The model coefficients for the teachers are used to calculate their VAM scores.
� In related models known as “growth models” a regression model is fit to predict students’ current test scores from previous test scores.
� A percentile is calculated for each student from the model, relating his or her growth to the growth of other students with similar previous test scores.
� The median or average of the percentiles of a teacher’s students is then used to calculate the teacher’s VAM score.
(ASA, 2014)
VAM Promises
� VAM results are often regarded as more objective or authoritative than other types of information because they:
� Are based on student outcomes, � Use complex quantitative statistical
models � Rely on standardized test scores and
common procedures for all teachers or schools.

VAM Problems Methodological � Statistical Error Rate: there is a statistical error rate of 35 percent
when using one year’s worth of test data to measure a teacher’s effectiveness, and an error rate of 25 percent when using data from three years, researchers (Schochet, P. Z. & Chiang, H. S. 2010)
� Year-to-year Instability: value-added rankings of teachers fluctuate wildly from year to year (ASA 2014)
� Non-Random Student Assignments � “The assumptions required to obtain commonly estimated models and derive
econometric tests of those assumptions are easily rejected.” (Sass, et.al.2013, 2014 )

VAM Problems Logical � VAMs typically measure correlation, not causation: Effects – positive or
negative – attributed to a teacher may actually be caused by other factors that are not captured in the model (ASA 2014)
� The use of VAMs assumes “that student learning is measured by a given test, is influenced by the teacher alone, and is independent from the growth of classmates and other aspects of the classroom context.
(Darling, Hammond, L. 2012)
� Most VAM studies find that teachers account for about 1% to 14% of the variability in test scores, and that the majority of opportunities for quality improvement are found in the system-level conditions.
(ASA 2014)
� Fifty to 80 percent of any improvement or decline in a student’s standardized test scores can be attributed to one-time, randomly occurring factors (Kane & Staiger, 2002)
� Model assumes/ attributes growth to individual teacher (homeroom/content)

Schoolview Data & Accountability Colorado Department of Education
� http://www.cde.state.co.us/schoolview/coloradogrowthmodel
� https://edx.cde.state.co.us/SchoolView/DataCenter/reports.jspx?_afrWindowMode=0&_afrLoop=235627037710306&_adf.ctrl-state=zn8fh9jdq_4

Colorado Growth Model Ratings 2014: Reading
School Rating
% at/ above Proficient
Growth
Percentile
“White”
“Economically Disadvantaged”
“ELL”
Students
w/ Disabilities
1 99 61 80 % 3 % 4 % 4 %
2 97 58 83 % 10 % 9 % 4%
3 95 79 78 % 10 % 10 % 3 %
4 92 51 83 % 8 % 4 % 7 %
5 92 64 78 % 8 % 8 % 8 %
6 90 79 74 % 6 % 5 % 6 %
7 89 66 68 % 30 % 15 % 8 %
8 89 65 85 % 13 % 4 % 7 %
9 88 55 70 % 16 % 5 % 7 %
10 88 56 56 % 30 % 5 % 3 %

Colorado Growth Model Ratings 2014: Reading
School Rating
% at/ above Proficient
Growth
Percentile
“White”
“Economically
Disadvantaged”
ELL
“Students
w/ Disabilities”
100 48 70 2 % 97 % 77 % 15 %
101 35 36 1 % 96 % 48 % 9 %
102 34 51 5 % 98 % 41 % 12 %
103 34 39 4 % 95 % 48 % 10 %
104 32 47 12 % 83 % 39 % 8 %
105 30 36 3 % 97 % 36 % 20 %
106 29 35 3 % 98 % 59 % 12 %
107 28 47 3 % 97 % 67 % 10 %
108 25 41 4 % 95 % 48 % 12 %
109 25 42 1 % 95 % 60 % 8 %

Colorado Growth Model Ratings 2014 : Math
School Rating
% at/ above Proficient
Growth
Percentile
“White”
“Economically Disadvantaged”
“ELL”
Students
w/ Disabilities
1 96 82 78 % 10 % 10 % 3 %
2 95 71 83 % 10 % 9 % 4 %
3 93 61 83 % 8 % 4 % 7 %
4 92 53 78 % 8 % 8 % 8 %
5 91 57 85 % 13 % 4 % 7 %
6 90 76 74 % 6 % 5 % 6 %
7 89 63 70 % 16 % 5 % 7 %
8 87 59 70 % 15 % 9 % 8 %
9 87 52 68 % 30 % 15 % 8 %
10 86 53 56 % 30 % 5 % 3 %

Colorado Growth Model Ratings 2014: Math
School Rating
% at/ above Proficient
Growth
Percentile
“White”
“Economically
Disadvantaged”
ELL
Students
w/ Disabilities
100 41 48 4 % 95 % 64 % 9 %
101 38 40 22 % 78 % 17 % 14 %
102 37 45 3 % 97 % 87 % 10 %
103 37 43 4 % 95 % 48 % 10 %
104 34 36 3 % 97 % 36 % 20 %
105 33 40 12 % 83 % 39 % 8 %
106 33 47 12 % 83 % 39 % 8 %
107 32 41 2 % 97 % 77 % 15 %
108 31 39 2 % 98 % 59 % 12 %
109 24 34 4 % 95 % 48 % 12 %

Tentative Timeline to implement ESEA (Colorado)
� Enero- Abril (2016): Interpretacion de ley � Mayo-Junio (2016): “Listening Tour” � Julio – Sept. (2016): Escribiendo el Plan � Sept. (2016) - Enero (2017): Modifcar el plan � Feb. – Abril (2017): Aprobar el plan � Implementar ESSA 2017-2018 año escolar � We are working hard in Colorado to prepare for
2017-2018 implementation of ESSA � ESSA addresses the authorization/ requirements NOT
the appropriations (e.g. funding levels) for various educational programs

References � American Statistical Association (2014). ASA statement on using value-added models for
educational assessment. Retrieved from: https://www.amstat.org/policy/pdfs/ASA_VAM_Statement.pdf
� Au, W. (2011). Neither fair nor accurate: Research-based reasons why high-stakes tests should not be used to evaluateachers. Rethinking Schools.
� Darling-Hammond, L., Amrein-Beardsley, A., Haertel, E., & Rothstein, J. (2012). Evaluating teacher evaluation. Phi Delta Kappan, 93(6), 8-15. Retrieved from: http://www.kappanmagazine.org/content/93/6/8.full.pdf+html
� Kane, J.T., & Staiger , D.O. (2002. Volatility in School Test Scores: Implications for Test-Based Accountability Systems. Brookings Papers on Education Policy. Retrieved from:
http://www.dartmouth.edu/~dstaiger/Papers/KaneStaiger_brookings2002.pdf
� Sass, Tim R.; Semykina, Anastasia; Harris, Douglas N. (2014). Value-added models and the measure of teacher productivity Economics of Education Review,. Vol. 38, p9-23.
� Schochet, P. Z. & Chiang, H. S. (2010). Error rates in measuring teacher and school performance based on student test score gains. Washington DC: U.S. Department of Education. Retrieved from: http://ies.ed.gov/ncee/pubs/20104004/
� Colorado Department of Education; http://www.cde.state.co.us/

Recursos
� Read the Every Student Succeeds Act https://www.cde.state.co.us/fedprograms/essapdf � US Department of Education http://www.ed.gov/ESSA � Transitioning to the “Every Student Succeeds Act”
Frequently asked questions: http://www2.ed.gov/policy/elsec/leg/essa/faq/essatransitionfaqs050316.pdf