educational policy - southern methodist...
TRANSCRIPT

http://epx.sagepub.com/Educational Policy
http://epx.sagepub.com/content/23/2/385The online version of this article can be found at:
DOI: 10.1177/0895904808320679
2009 23: 385Educational PolicyMichael McLendon, Donald E. Heller and Stephanie Lee
StudyConceptual and Analytic Perspectives on Conducting Across-State High School to College Transition Policy in the American States :
Published by:
http://www.sagepublications.com
On behalf of:
Politics of Education Association
can be found at:Educational PolicyAdditional services and information for
http://epx.sagepub.com/cgi/alertsEmail Alerts:
http://epx.sagepub.com/subscriptionsSubscriptions:
http://www.sagepub.com/journalsReprints.navReprints:
http://www.sagepub.com/journalsPermissions.navPermissions:
http://epx.sagepub.com/content/23/2/385.refs.htmlCitations:
What is This?
- Feb 2, 2009Version of Record >>
at SMU on June 10, 2013epx.sagepub.comDownloaded from

High School to CollegeTransition Policy in theAmerican StatesConceptual and Analytic Perspectiveson Conducting Across-State StudyMichael McLendonVanderbilt UniversityDonald E. HellerPennsylvania State UniversityStephanie LeeVanderbilt University
Researchers have paid scant attention to the opportunities and the barriersassociated with across-state study of college-transition policies, although theAmerican states comprise a social system especially well suited for compar-ative analysis. What sorts of questions should researchers ask about college-transition policies and programs? How might these questions be framedconceptually? What data are and are not generally available to researchers?This article examines these questions. Because relatively little comparative-state research on college-transition policies exists, the emphasis is ondescribing the contemporary policy landscape, identifying broad questionswith which to anchor future study, and discussing potential data sources andanalytic approaches. The authors argue that researchers should begin askingmore empirically oriented questions about both the determinants and theeffects of college-transition policies in the states. They contend that bothavenues of inquiry pose distinct data and analytic challenges.
Keywords: educational policy; P-16 policy; college transition; politics ofpolicy; educational finance
As the United States continues its third full decade of comprehensiveK-12 school reform, pressures have mounted for significant policy,
organizational, and curriculum reform within American higher education aswell. In the context of higher education, the past 20 years have witnessed sev-eral distinct reform thrusts: the so-called “voluntary assessment” movement
Educational PolicyVolume 23 Number 2March 2009 385-418© 2009 Corwin Press
10.1177/0895904808320679http://epx.sagepub.com
hosted athttp://online.sagepub.com
385
at SMU on June 10, 2013epx.sagepub.comDownloaded from

of the mid-1980s gave way to harder edged “performance-accountability”campaigns in many states during the 1990s, which in some instances haveevolved into efforts aimed toward measuring what college students knowand can do (Burke, 2002). Although, as compared with the K-12 domain,these developments in higher education admittedly are less sweeping intheir substantive scope and rhetorical reach, they represent nonetheless aconsiderable deepening of state involvement into the core organizationalpatterns and processes, teaching and learning activities, and testing andassessment practices of American public higher education.
Traditionally, reform—and talk of reform—has proceeded within each ofAmerica’s two separate educational sectors (i.e., the primary and secondaryand the higher education sectors), but rarely at the boundary connecting them.Indeed, only recently have policymakers and education researchers begun tofocus systematically on reforming the gaping disjuncture between the policiesand practices of state K-12 and higher education systems.1 Critics contendthat the absence historically of coordinated policy and planning between thenation’s educational sectors has diminished educational opportunity for manystudents, hindered the academic preparedness of most students, producedachievement gaps, and resulted in systemic organizational inefficiencies andfinancial waste (Kirst & Bracco, 2004; Kirst & Venezia, 2001; Kirst, Venezia,& Antonio, 2004; Swail & Perna, 2002).
In light of these criticisms, many states during the past decade have ini-tiated blue ribbon panels, commissioned reports, and enacted legislationintended to promote P-16 reform, or the more effective aligning of policiesand practices linking primary, secondary, and postsecondary education sec-tors. Many prominent national policy organizations, such as the EducationCommission of the States, the National Conference of State Legislatures,and the National Center for Public Policy and Higher Education, also havedevoted attention to the lack of integration between the lower and highereducational systems of the nation, and recommended solutions for amelio-rating the dysfunctions that allegedly result from the divide. A variety ofuniversity-based initiatives have produced reports documenting the P-16problems and reform experiences of particular states and outlining propos-als for more effective integration of the sectors.
Stanford University’s Bridge Project is especially notable in this regard(Kirst & Venezia, 2001). The Bridge Project produced a series of recom-mendations for more effective intersector coordination based on case stud-ies of six states. The Stanford team’s research is notable for its use of aconceptual framework with which to guide their investigation, for the com-prehensiveness with which contributors to the project examined each of the
386 Educational Policy
at SMU on June 10, 2013epx.sagepub.comDownloaded from

several states studied, and for its effort to synthesize insights from the casestudies for the purpose of developing generalized understanding of P-16problems and prospective remedies. By contrast, many other works in thisarea are atheoretical, rely primarily on description or prescription, and lackrigorous comparisons between and among states that might permit analyststo draw valid conclusions about the effectiveness of current policy design.In effect, whereas P-16 researchers often extol the advantages of multistateresearch designs and rigorous across-state comparisons, relatively few stud-ies have achieved that end.
More broadly, researchers have paid scant attention to the opportunitiesand the barriers to conducting empirically oriented, across-state study of col-lege-transition policies in the American states. The states comprise a socialsystem especially well suited for comparative analysis: They are 50 units ofanalysis with broadly similar structures, populations, and cultures, but withsignificant variation across social, political, and institutional characteristics,thus permitting the testing of theories about public-policy design and imple-mentation. The existence of such a natural laboratory for policy experimen-tation provides researchers with a particularly advantageous arena in whichto test propositions about the determinants and effects of college-transitionpolicies. Yet substantial barriers also exist: Studies of this kind can imposeheavy data-collection burdens. Many of the requisite data for across-stateanalysis of high school to college transition policies are fugitive, and fewmultistate databases relative to college-transition questions exist.
Given the opportunities and the barriers this natural laboratory affords,what sorts of questions should researchers who wish to study college-transition issues across the states be asking about these policies and programs?How might these questions be framed conceptually? What data are and are notgenerally available to researchers? What are some promising data sources forthose wishing to conduct research on college-transition policies?
Our article examines these questions, ones pertaining to the design ofcomparative-state study on college-transition policy. Because so littlecomparative-state research of a systematic nature in this area exists, ouremphasis is on describing the contemporary college-transition policy land-scape, identifying broad questions with which to anchor future research,and discussing data sources and analytic approaches. We argue that much ofthe work being conducted today remains descriptive, and that researchers shouldbegin asking more empirically oriented questions about the determinantsand the effects of college-transition policies in the states. We contend thatboth avenues of inquiry—determinants and effects research—pose distinct dataand analytic challenges. One contribution of this paper is our identification of
McLendon et al. / High School to College Transition Policy 387
at SMU on June 10, 2013epx.sagepub.comDownloaded from

conceptually relevant indicators and data sources that education researchershave used too little in studying policy determinants or effects.
Our paper seeks another purpose, too: that of enlarging the scope of dis-cussion that surrounds college-transition to include a more robust range ofpolicy issues than is typically considered. Much of the work on high schoolto college transition focuses on academic-related transition issues; forexample, access to college-prep courses, college counseling, the aligning ofstandards, and placement into remedial coursework in college. We expandthat traditional focus to include policies that are intended to make collegemore affordable for students and their families and those designed toincrease coordination and accountability between education sectors—areasthat have received inadequate attention in the college-transition literature.
The Contemporary Landscape ofCollege Transition Policies
Broadly speaking, the college-transition policy landscape includes avariety of state policies aimed at promoting a smoother organizationalinterface between the secondary and postsecondary-education sectors andthe more effective transitioning of students between the sectors. In this sec-tion we describe three specific kinds of college-transition policies withwhich state governments have been actively experimenting during the past20 years: (a) college affordability and student financing policies; (b) acad-emic preparation, standards, and admissions; and (c) P-16 coordinating andaccountability mechanisms. We won’t provide an exhaustive review ofthese policies; rather, we seek to provide a useful context for our subsequentdiscussion of the challenges and opportunities confronting researchers whowish to study the antecedents and the effects of college-transition policiesacross multiple state settings.
College Affordability and Student Financing Policies
The increasing cost of a college education and the lack of coordinatedinformation about how families can plan financially for their children’s col-lege education have deeply concerned elected officials and the public formore than 20 years. Since 1974, public tuition in both the public and pri-vate sectors of higher education has risen at an annual rate twice that ofgeneral inflation (Ehrenberg, 2006; Grapevine, 2007; Heller, 2001).Families at all income levels have been affected by these sharp increases incollege costs, and public concerns about college affordability remain high
388 Educational Policy
at SMU on June 10, 2013epx.sagepub.comDownloaded from

(Ikenberry & Hartle, 1998; Selingo, 2003). A 1998 poll conducted by theAmerican Council on Education, for example, found that 65% of allAmericans were worried about paying for college, a figure exceeding theproportion concerned about the quality of K-12 education (Ikenberry &Hartle, 1998). By 2002, this number had risen to 69% in another surveyconducted for the National Center for Public Policy and Higher Education(Immerwahr, 2002). Although the financial burden posed by soaring tuitionincreases has fallen disproportionately on families from lower incomebackgrounds, it is the concerns of middle-class Americans that providedmuch of the impetus for a variety of new postsecondary financing programsin the states (Mumper, 2003). The criticism often leveled in the 1980s and1990s was that states had not done enough either to provide information tostudents and their families about the need to plan financially for college, orto create incentives that encouraged families to save for college well beforetheir children reached traditional college-going age. In response, statesbegan experimenting with new student-financing policies that provideincentives for families to save for their children’s college education and thatseek to educate families about the need to prepare financially for college.
The earliest such policies to be adopted, state prepaid tuition programs,are college-savings mechanisms that permit investors to place a lump sumin a state contract that guarantees the money will be sufficient for an equiv-alent of tuition at a set period in time (Baird, 2006a, 2006b). In other words,the contract promises a return on investment comparable to the tuition infla-tion rate. Prepaid tuition programs are viewed as especially safe invest-ments because returns for investors are not tied to the performance of thestock market. Rather, this particular program allows a child’s family to“lock in” tuition at current rates, providing a hedge against future tuitionincreases. There are two main types of prepaid plans. Prepaid unit plans sellunits that represent a fixed percentage of tuition. By contrast, contract planssell contracts, where the parent agrees to purchase a specified number ofyears of tuition. The purchase price depends on the age of the child, withcontract plans usually offering lower prices for younger children. Prepaidtuition programs are often exempt from state taxes, and they are no longersubject to federal tax under provisions of the Economic Growth and TaxRelief Reconciliation Act of 2001. Michigan and Florida established thenation’s first prepaid programs in 1988. Table 1, which lists the states thathave adopted prepaid programs, the names of the respective programs, andthe year in which those programs became operational, indicates that at least22 states have established prepaid tuition programs. One limitation of pre-paid tuition programs is that their use is restricted generally to participatingpublic institutions located within the state that is offering the program: If
McLendon et al. / High School to College Transition Policy 389
at SMU on June 10, 2013epx.sagepub.comDownloaded from

the child attends a nonparticipating school or one that is out-of-state, or thechild decides to not go to college at all, the family typically can recover onlythe original contribution. Prepaid tuition programs may have a negativeimpact on a student’s eligibility for federal financial aid, as the value of thestudent’s balance is considered an asset under federal financial aid rules.
College-savings plans, commonly referred to as “529 plans” after thesection of the IRS code that defines their tax-advantaged status, is a secondform of financing strategy adopted by states in the 1990s as a vehicle forencouraging families to save for college (Baird, 2006a, 2006b; Olivas,2003). The chief differences between a 529 plan and a standard mutual fundinvestment are the tax advantages available under the former: In most statesthat offer college savings programs, annual contributions to the programsare tax deferred. Significantly, the Economic Growth and Tax Relief
390 Educational Policy
Table 1Prepaid Tuition Programs
Operational State Name Date
Alabama Prepaid Affordable College Tuition (PACT) 1990Colorado Colorado Prepaid Tuition Fund 1997Florida Florida Prepaid College Program 1988Illinois College Illinois! 1998 Kentucky Kentucky Affordable Prepaid Tuition Plan (KAPT) 2001Maryland Maryland Prepaid College Trust 1998Massachusetts U.Plan 1995Michigan Michigan Education Trust 1988Mississippi Prepaid Affordable College Tuition 1997Nevada Nevada Prepaid Tuition Program 1998New Jersey New Jersey Prepaid Higher Education Expense Program 2002New Mexico The Education Plan of New Mexico 2000Pennsylvania Tuition Account Program (TAP) 1993South Carolina South Carolina Tuition Prepayment Program 1998Tennessee Tennessee’s Baccalaureate Education System Trust 1997
(BEST) Prepaid Tuition PlanTexas Texas Guaranteed Tuition Plan 1996Virginia Virginia Prepaid Education Program (VPEP) 1996Washington Guaranteed Education Tuition 1998West Virginia West Virginia Prepaid College Plan 1998
Sources: Adapted from TIAA-CREF, “Comparison of Prepaid Tuition Plans,” March 2002;National Association of State Treasurers, “State College Savings Plans’ Overview,” April2002; College Savings Plan Network, collegesavings.org; savingforcollege.com; sheeo.org;finaid.org; state websites.
at SMU on June 10, 2013epx.sagepub.comDownloaded from
Reconciliation Act of 2001 granted federal tax exemption on earnings fromstate plans, when such earnings are used to pay for qualified higher educa-tion expenses, that is, tuition, room and board, books and fees, and otherexpenses that students must pay to attend college. Typically, the investmentaccounts are professionally managed by mutual-fund companies, whichinvest the funds in the expectation that the return will meet or exceedrapidly rising college costs. Although the potential for returns and tax ben-efits vary from state to state, overall the college savings program representsa rather conservative investment approach. Table 2 indicates that all 50states have established college-savings programs, with two-thirds of theprograms having been created since 1999.
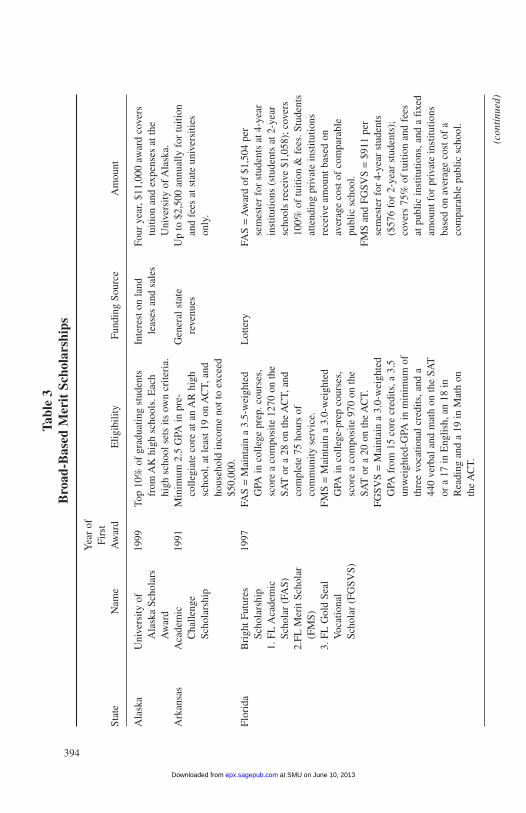
A third financing innovation of recent years is the broad-based, meritscholarship program.2 Whereas prepaid tuition programs and college sav-ings programs provide incentives for students and their families to preparefinancially for college, the broad-based, merit scholarship program pro-vides incentives for students to prepare academically for college. Meritscholarship programs have proven enormously popular with state-electedofficials and with the public, but they also have generated controversy.Historically, publicly funded college scholarships in the United Stateshave been awarded based on student financial need, and with the explicitgoal of increasing access to college. However, since the 1990s, followingGeorgia’s establishment of the nation’s first merit aid program, the HOPEScholarship, the awarding of financial aid on the basis of demonstratedneed has eroded. Between 1981 and 2003, state funding for need-basedgrants for undergraduates increased 7.7% annually (in current dollars).During the same period, funding for merit programs increased at an annualrate of 14.1% (Heller, 2006). Fifteen states have created broad-based meritscholarship programs (Heller, 2004). Table 3, which identifies the scholar-ships and their eligibility requirements, funding source, and award amounts,reveals the diversity of approaches states have taken in designing theirmerit-award programs.
Proponents of merit scholarship programs claim the programs encourageand reward hard work and academic achievement by high school students.Proponents also claim that the programs, particularly those located in theSouth, have helped states retain many of their brightest high school gradu-ates, thereby remaining competitive in the undergraduate admissionsmarket.3 On the other hand, critics of the programs point out that underrep-resented minority students and students in poorer high schools qualify formerit scholarships at lower rates. Thus, critics assert, the scholarships arebeing awarded disproportionately to the very students who are most likely
McLendon et al. / High School to College Transition Policy 391
at SMU on June 10, 2013epx.sagepub.comDownloaded from

392 Educational Policy
Table 2College Savings Plans
State Name Operational Date
Alabama Alabama Higher Education 529 Fund 2002Alaska University of Alaska College Savings Plan 1991
T. Rowe Price College Savings Plan 2001John Hancock Freedom 529 2001
Arizona Arizona Family College Savings Program 1999Pacific Funds 529 College Savings 2003Waddell & Reed InvestEd Plan 2001
Arkansas Arkansas GIFT College Investing Plan 1999California Golden State ScholarShare College Savings Trust 1999Colorado Scholars Choice College Savings Program 1999Connecticut Connecticut Higher Education Trust 1998Delaware Delaware College Investment Plan 1998Florida Florida College Investment Plan 2002Georgia Georgia Higher Education Savings Plan 2002Hawaii Hawaii College Savings Program Tuition Edge 2002Idaho IDeal Idaho College Savings Plan 2001Illinois Bright State College Savings Plan 2000Indiana College Choice 529 Investment Plan 1997Iowa College Savings Iowa 1998Kansas Learning Quest Education Savings Program 2000
Schwab 529 College Savings Plan 2003Kentucky Kentucky Education Savings Plan Trust (KESPT) 1990Louisiana Louisiana Student Tuition Assistance and Revenue 1997
Trust Program (START)Maine NextGen College Investing Plan 1999Maryland Maryland College Investment Plan 2001Massachusetts U. Fund College Investing Plan 1999Michigan Michigan Education Savings Program 2000Minnesota Minnesota College Savings Plan 2001Mississippi Mississippi Affordable College Savings (MACS) 2001Missouri Missouri Saving for Tuition Program (MO$T) 1999Montana Montana Family Education Savings Program 1998
Pacific Funds 529 College Savings Plan 2002Nebraska College Savings Plan of Nebraska 2001
AIM College Savings Plan 2001State Farm College Savings Plan 2002TD Waterhouse 529 College Savings Plan 2002
Nevada America’s College Savings Plan 2001New Hampshire UNIQUE College Investing Plan 1998New Jersey New Jersey Better Educational Savings Trust (NJBEST) 1998
(continued)
at SMU on June 10, 2013epx.sagepub.comDownloaded from

to attend college even without the financial assistance. Some critics, there-fore, have characterized merit scholarship programs as a form of publicwelfare for the wealthy, claiming that it makes little sense to give financialaid to individuals who otherwise would attend college without that assis-tance. One such critic observed, “The regressive nature of lotteries, whencombined with the income-stratified nature of college participation in thenation, leads to a situation described by the Business/Higher EducationPartnership of Florida as a ‘popular wealth transfer from low- and middle-income people to the well-to-do’” (Heller, 2001).
McLendon et al. / High School to College Transition Policy 393
Table 2 (continued)
State Name Operational Date
New Mexico The Education Plan of New Mexico 2000CollegeSense 2001Scholar’s Edge 2001
New York New York’s College Savings Program 1998North Carolina North Carolina’s National College Savings Program 1998North Dakota College SAVE 2001Ohio CollegeAdvantage Savings Program 1989Oklahoma Oklahoma College Savings Plan 2000Oregon Oregon College Savings Plan 2001Pennsylvania TAP 529 Investment Plan 2002Rhode Island CollegeBoundfund 1998South Carolina FUTUREScholar 529 College Savings Plan 2002South Dakota CollegeAccess 529 Plan 2002
Legg Mason Core4College 529 Plan 2003Tennessee Tennessee’s BEST Savings Plan 2000Texas Tomorrow’s College Investment Plan 2002Utah Utah Educational Savings Plan Trust (UESP) 1996Vermont Vermont Higher Education Savings Plan 1999Virginia Virginia Education Savings Trust (VEST) 1999
CollegeAmerica 2002Washington Guaranteed Education Tuition 1998West Virginia Smart 529 College Savings 2002
Cornerstone SMART 529 2003Leaders SMART 529 2003
Wisconsin EdVest Wisconsin College Savings Program 1997Tomorrow’s Scholar 2001
Wyoming Wyoming College Achievement Plan 2000
Sources: Adapted from TIAA-CREF, “529 Savings Plans,” March 2002; National Association ofState Treasurers, “State College Savings Plans’ Overview,” April 2002; College Savings PlanNetwork, www.collegesavings.org; savingforcollege.com; sheeo.org; finaid.org; state websites.
(text continues on p. 389)
at SMU on June 10, 2013epx.sagepub.comDownloaded from
Ala
ska
Ark
ansa
s
Flor
ida
Uni
vers
ity o
fA
lask
a Sc
hola
rsA
war
dA
cade
mic
Cha
lleng
eSc
hola
rshi
p
Bri
ght F
utur
esSc
hola
rshi
p1.
FL
Aca
dem
icSc
hola
r (F
AS)
2.FL
Mer
it Sc
hola
r(F
MS)
3. F
L G
old
Seal
Voc
atio
nal
Scho
lar
(FG
SVS)
1999
1991
1997
Top
10%
of
grad
uatin
g st
uden
tsfr
om A
K h
igh
scho
ols.
Eac
hhi
gh s
choo
l set
s its
ow
n cr
iteri
a.M
inim
um 2
.5 G
PA in
pre
-co
llegi
ate
core
at a
n A
R h
igh
scho
ol,a
t lea
st 1
9 on
AC
T,an
dho
useh
old
inco
me
not t
o ex
ceed
$50,
000.
FAS
= M
aint
ain
a 3.
5-w
eigh
ted
GPA
in c
olle
ge p
rep.
cou
rses
,sc
ore
a co
mpo
site
127
0 on
the
SAT
or
a 28
on
the
AC
T,an
dco
mpl
ete
75 h
ours
of
com
mun
ity s
ervi
ce.
FMS
= M
aint
ain
a 3.
0-w
eigh
ted
GPA
in c
olle
ge-p
rep
cour
ses,
scor
e a
com
posi
te 9
70 o
n th
eSA
T o
r a
20 o
n th
e A
CT.
FGSV
S =
Mai
ntai
n a
3.0-
wei
ghte
dG
PA f
rom
15
core
cre
dits
,a 3
.5un
wei
ghte
d-G
PA in
min
imum
of
thre
e vo
catio
nal c
redi
ts,a
nd a
440
verb
al a
nd m
ath
on th
e SA
Tor
a 1
7 in
Eng
lish,
an 1
8 in
Rea
ding
and
a 1
9 in
Mat
h on
the
AC
T.
Inte
rest
on
land
leas
es a
nd s
ales
Gen
eral
sta
tere
venu
es
Lot
tery
Four
yea
r,$1
1,00
0 aw
ard
cove
rstu
ition
and
exp
ense
s at
the
Uni
vers
ity o
f Ala
ska.
Up
to $
2,50
0 an
nual
ly f
or tu
ition
and
fees
at s
tate
uni
vers
ities
only
.
FAS
= A
war
d of
$1,
504
per
sem
este
r fo
r st
uden
ts a
t 4-y
ear
inst
itutio
ns (
stud
ents
at 2
-yea
rsc
hool
s re
ceiv
e $1
,058
); c
over
s10
0% o
f tu
ition
& f
ees.
Stu
dent
sat
tend
ing
priv
ate
inst
itutio
nsre
ceiv
e am
ount
bas
ed o
nav
erag
e co
st o
f co
mpa
rabl
epu
blic
sch
ool.
FMS
and
FGSV
S =
$91
1 pe
rse
mes
ter
for
4-ye
ar s
tude
nts
($57
6 fo
r 2-
year
stu
dent
s);
cove
rs 7
5% o
f tu
ition
and
fee
sat
pub
lic in
stitu
tions
,and
a f
ixed
amou
nt f
or p
riva
te in
stitu
tions
base
d on
ave
rage
cos
t of
aco
mpa
rabl
e pu
blic
sch
ool.
Tabl
e 3
Bro
ad-B
ased
Mer
it S
chol
arsh
ips
Yea
r of
Fi
rst
Stat
eN
ame
Aw
ard
Elig
ibili
tyFu
ndin
g So
urce
Am
ount
(con
tinu
ed)
394
at SMU on June 10, 2013epx.sagepub.comDownloaded from

Geo
rgia
Ken
tuck
y
Lou
isia
na
HO
PE S
chol
arsh
ip
Ken
tuck
yE
duca
tiona
lE
xcel
lenc
eSc
hola
rshi
p
Tui
tion
Opp
ortu
nity
Prog
ram
for
Stud
ents
1. T
OPS
Tec
h2.
TO
PS O
ppor
tuni
ty3.
TO
PSPe
rfor
man
ce4.
TO
PS H
onor
s
1993
1999
1998
Mai
ntai
n a
3.0
GPA
in a
col
lege
prep
arat
ory
prog
ram
or
a 3.
2G
PA in
a te
chni
cal/c
aree
rpr
ogra
m.
Mus
t hav
e a
min
imum
2.5
GPA
whi
le ta
king
22
units
of
high
-sc
hool
gra
duat
ion
requ
irem
ents
to b
e el
igib
le f
or th
e ba
se a
war
d.
GPA
in c
ore
curr
icul
um:
Tech
= 2
.5O
ppor
tuni
ty =
2.5
Perf
orm
ance
= 3
.5H
onor
s =
3.5
AC
T s
core
s:Te
ch =
19
Opp
ortu
nity
= 2
0Pe
rfor
man
ce =
23
Hon
ors
= 2
7
Lot
tery
Lot
tery
Gen
eral
sta
tere
venu
es
Cov
ers
full
tuiti
on,m
anda
tory
fee
san
d a
$150
boo
k al
low
ance
per
sem
este
r at
pub
lic in
stitu
tions
.St
uden
ts a
t app
rove
d pr
ivat
ein
stitu
tions
rec
eive
$3,
000
per
sem
este
r. St
uden
ts w
ho e
arn
a 2.
5 G
PA in
high
sch
ool a
re e
ligib
le f
or b
ase
awar
d am
ount
of
$125
a y
ear
for
educ
atio
n ex
pens
es a
t acc
redi
ted
publ
ic o
r pr
ivat
e in
stitu
tion
inK
Y. S
tude
nts
who
mai
ntai
nhi
gher
GPA
rec
eive
mor
efu
ndin
g (a
4.0
GPA
= $
500)
.St
uden
ts w
ho s
core
a 1
5 or
mor
e on
the
AC
T a
re e
ligib
le f
orbo
nus
fund
ing,
rang
ing
up to
$500
for
a s
core
of
28 o
r hi
gher
. C
over
s co
st o
f tu
ition
.Pe
rfor
man
ce a
war
d of
fers
an
addi
tiona
l $40
0 ca
sh s
tipen
d pe
rse
mes
ter,
whi
le th
e H
onor
saw
ard
prov
ides
an
extr
a $8
00.
Can
onl
y be
use
d at
acc
redi
ted
LA
inst
itutio
ns.
Tabl
e 3
(con
tinu
ed)
Yea
r of
Fi
rst
Stat
eN
ame
Aw
ard
Elig
ibili
tyFu
ndin
g So
urce
Am
ount
(con
tinu
ed)
395
at SMU on June 10, 2013epx.sagepub.comDownloaded from

Mas
sach
uset
ts
Mic
higa
n
Mis
siss
ippi
Mis
sour
i
John
and
Abi
gail
Ada
ms
Scho
lars
hip
Prog
ram
Mic
higa
n M
erit
Aw
ard
Em
inen
t Sch
olar
sFu
nd
Hig
her
Edu
catio
nA
cade
mic
Scho
lars
hip
Prog
ram
2005
2000
1996
1997
Scor
e at
leve
l of
adva
nced
on
one
test
(E
nglis
h or
mat
h) a
ndad
vanc
ed o
r pr
ofic
ient
on
the
othe
r te
st o
f th
e M
assa
chus
etts
Com
preh
ensi
ve A
sses
smen
tSy
stem
,and
sco
re in
the
top
25%
in th
e sc
hool
dis
tric
t.Su
cces
sful
com
plet
ion
of th
eM
ichi
gan
Edu
catio
nal
Ass
essm
ent P
rogr
am (
ME
AP)
Hig
h Sc
hool
Tes
ts (
HST
) in
read
ing,
wri
ting,
mat
h an
dsc
ienc
e. S
tude
nts
who
sco
re a
tL
evel
1 o
r L
evel
2 r
ecei
ve f
ull
awar
d. S
tude
nts
who
sco
re in
75th
per
cent
ile o
n SA
T o
r AC
Tar
e al
so e
ligib
le.
Mai
ntai
n a
3.5
GPA
in h
igh
scho
ol a
nd s
core
a 2
9 or
hig
her
on th
e A
CT
or
a 12
80 o
r hi
gher
on th
e SA
T.C
ompo
site
sco
re o
n th
e A
CT
or
SAT
in th
e to
p th
ree
perc
entil
e.
Tui
tion
wai
ver
Nat
iona
l tob
acco
settl
emen
t
Gen
eral
sta
tere
venu
es
Gen
eral
sta
tere
venu
es
Tui
tion
only
(no
t fee
s) a
t any
publ
ic u
nive
rsity
in th
e st
ate
for
up to
4 y
ears
.
A o
ne-t
ime,
lum
p su
m o
f $2
,500
cove
ring
tuiti
on e
xpen
ses
isav
aila
ble
for
use
at a
ppro
ved
MI
inst
itutio
ns. A
n aw
ard
of$1
,000
is o
ffer
ed in
cer
tain
inst
ance
s fo
r st
uden
ts a
ttend
ing
appr
oved
out
-of-
stat
e co
llege
s.
Aw
ard
of $
2,50
0 pe
r ye
ar c
over
sal
l edu
catio
n-re
late
d co
sts
at M
Ssc
hool
s on
ly.
Ann
ual a
war
d of
$2,
000
isdi
stri
bute
d ea
ch s
emes
ter
in$1
,000
incr
emen
ts.
Tabl
e 3
(con
tinu
ed)
Yea
r of
Fi
rst
Stat
eN
ame
Aw
ard
Elig
ibili
tyFu
ndin
g So
urce
Am
ount
(con
tinu
ed)
396
at SMU on June 10, 2013epx.sagepub.comDownloaded from

Nev
ada
New
Mex
ico
Sout
h C
arol
ina
Tenn
esse
e
Was
hing
ton
Mill
enni
umSc
hola
rshi
p
Lot
tery
Suc
cess
Scho
lars
hip
LIF
E S
chol
arsh
ip
Tenn
esse
e E
duca
tion
Lot
tery
Sch
olar
ship
Prog
ram
Prom
ise
Scho
lars
hip
2000
1997
1998
2004
1999
Com
plet
e hi
gh s
choo
l with
a 3
.0G
PA a
nd p
ass
all a
reas
of
the
Nev
ada
Hig
h Sc
hool
Pro
fici
ency
Exa
m.
Ava
ilabl
e to
gra
duat
es o
f a
NM
hig
hsc
hool
. Stu
dent
s ar
e no
t elig
ible
for
awar
d un
til c
ompl
etio
n of
firs
tse
mes
ter
of c
olle
ge.
Mus
t gra
duat
e fr
om S
C h
igh
scho
ol w
ith a
min
imum
3.0
GPA
. Stu
dent
s al
so m
ust s
core
at le
ast 1
100
on S
AT
or
24 o
nth
e A
CT.
Min
imum
21
AC
T/9
80 S
AT
or
3.0
GPA
Mus
t be
in th
e to
p 15
% o
f the
ir W
Ahi
gh s
choo
l gra
duat
ing
clas
s an
dha
ve fa
mily
inco
me
of n
o m
ore
than
135
% o
f sta
te's
med
ian
the
year
they
gra
duat
ed. S
tude
nts
who
scor
e a
1200
or h
ighe
r on
first
atte
mpt
at t
he S
AT
are
als
o el
igib
le.
Nat
iona
l tob
acco
settl
emen
t
Lot
tery
Gen
eral
sta
tere
venu
es
Lot
tery
Gen
eral
sta
tere
venu
es
Stud
ents
rec
eive
$80
per
-cre
dit
hour
at a
uni
vers
ity a
nd$4
0 pe
r-cr
edit
hour
at a
com
mun
ity c
olle
ge.
Pays
up
to 1
00%
of
tuiti
on o
nly
atN
M p
ublic
col
lege
s or
univ
ersi
ties.
Stud
ents
who
atte
nd 4
-yea
r co
llege
or u
nive
rsity
rec
eive
$3,
000
per
acad
emic
yea
r. St
uden
tsat
tend
ing
2-ye
ar c
olle
ges
rece
ive
the
cost
of
tuiti
on a
nd f
ees
for
30 c
redi
t hou
rs p
er y
ear.
$4,0
00 a
t tw
o-ye
ar in
stitu
tions
,$2
,000
at t
wo-
year
inst
itutio
ns.
A m
axim
um a
mou
nt o
f $1
,641
per
term
cov
ers
any
educ
atio
n-re
late
d ex
pens
e at
all
accr
edite
dW
A in
stitu
tions
of
high
erle
arni
ng. D
ue to
fun
ding
avai
labi
lity,
the
curr
ent p
rora
ted
amou
nt is
$1,
542.
Tabl
e 3
(con
tinu
ed)
Yea
r of
Fi
rst
Stat
eN
ame
Aw
ard
Elig
ibili
tyFu
ndin
g So
urce
Am
ount
Sour
ces:
Ada
pted
fro
m H
elle
r (2
002,
2004
),K
rueg
er (
2001
),an
d Fa
rrel
l (20
04).
Not
e:SA
T =
Scho
last
ic A
ptitu
de T
est;
AC
T =
Am
eric
an C
olle
ge T
est.
397
at SMU on June 10, 2013epx.sagepub.comDownloaded from

Academic Preparation, Standards, and Admissions
A second area of college-transition policy attracting substantial attentionis that of academic preparation, standards, and admissions. Because thereexists no plan in the United States to “relate the content and experience ofthe last two years in high school to the first two years of college” (Kirst,2000), there is little alignment between the academic preparation, stan-dards, and admissions policies and practices of the K-12 and the highereducation sectors.
Education researchers and various national policy organizations allegethat these incongruities have diminished student access, impaired studentperformance and achievement, and increased costs as a result of duplica-tion, waste, and inefficiency (Education Commission of the States, 2001;Kirst, 1997, 1999, 2000; Kirst & Venezia, 2001; National Center for PublicPolicy and Higher Education, 2000). For example, many colleges requirestudents to take subject-specific placement exams to assess their readinessfor college-level work and to enroll them in the proper classes. Colleges anduniversities have developed many different types of placement tests, whichoften are specific to a given university or department and, thus, establishedwithout consideration given to secondary school standards. Consequently,college and university placement assessments often emphasize differentcontent, employ different formats, and take different amounts of time tocomplete (Kirst & Bracco, 2004). Different university systems within thesame state may use different placement tests, lending even greater confu-sion for high school officials, students, and their families. Additionally,high school teachers, counselors, and administrators are not always famil-iar with particular college and university admissions policies and placementexams; thus, students often are not aware of the assessments for which theyshould prepare (Kirst et al., 2004). Often there is little feedback from thepostsecondary system to the K-12 system about how well students performon college and university placement tests, so parents are unaware of howtheir children perform on placement tests and commonly lack informationabout their children’s test strengths and weaknesses. Because the academicpreparation of high school students and the curricular expectations of col-leges often do not mesh, large numbers of students are consigned to colle-giate remedial courses (Kirst & Bracco, 2004).
These information asymmetries are particularly problematical for poorand minority students. Adelman (1999) found that course-taking patterns inhigh school are the strongest indicator of academic preparedness anddegree completion. Students in honors and advanced classes are more
398 Educational Policy
at SMU on June 10, 2013epx.sagepub.comDownloaded from

prepared for college-level material. Economically disadvantaged andminority students, however, are underrepresented in high school honorscourses and, therefore, possess far less information about college prepara-tion, college admissions, and college placement. On average, families ofunderrepresented students are more likely to be “out of the loop” of the col-lege admissions process than their White counterparts.
Because academic standards vary not only by state but also by institution,preparing for college can prove to be more challenging than one anticipated.The inconsistencies in placement testing seem daunting enough, yet thereexist other gaps in the college-transition process. For instance, neither theScholastic Aptitude Test (SAT) nor the American College Test (ACT) arealigned with many of the K-12 education standards-reforms recentlyadopted in the states (Kirst et al., 2004). As a result, placement tests andnational tests are not always well aligned with what high school studentshave learned or with what higher education institutions are expecting. Studieshave shown that in many cases students, parents, and even teachers were justunaware of the requirements for college admission (Kirst et al., 2004). Inaddition, current college admissions policies create disincentives for highschool students to continue rigorous course-taking patterns during theirsenior year, leading to what Kirst (2000) has termed “the senior slump.”
In recognition of these and numerous other problems, states haveembarked upon a variety of approaches to reduce incongruity and mis-alignment between the sectors. Often these initiatives stem directly fromcomprehensive K-12 education reform initiatives. Several of the moreprominent programs include the following.
Oregon’s “Proficiency-Based Admission Standards System” (PASS). Inresponse to a governor’s executive order calling for meetings between rep-resentatives of Oregon’s K-12 and higher education systems, the OregonUniversity System developed the PASS in 1993. PASS was designed for thepurpose of aligning admissions criteria and decisions at Oregon’s sevenpublic universities and 17 community colleges with the state’s new K-12school improvement plan. This plan moved away from a grade-exclusivesystem to one where students demonstrated competency and proficiency inEnglish, social sciences, math, science, performing arts, and second lan-guages. PASS additionally was designed to provide high school counselors,students, and families with more accurate information about college place-ment and, in turn, to provide college admissions officers with more detailedinformation about students’ abilities and level of preparedness (OregonUniversity System, 2000).
McLendon et al. / High School to College Transition Policy 399
at SMU on June 10, 2013epx.sagepub.comDownloaded from

Washington’s “Running Start” and “College in the High School”programs. In 1990, the Washington state legislature created, as part of theParent and Student Choice Act, the campus-based Running Start program,which provided 11th and 12th grade students with an option of attending cer-tain institutions of higher education while simultaneously earning high schooland college credit. The College in the High School program, a program withanalogues now in numerous other states, was designed to provide college-levelcourses in high school locations to qualified 11th and 12th grade students.
Numerous initiatives involving collaboration between colleges and uni-versities and the K-12 sector to identify at-risk students and to intervenethrough academic enrichment opportunities. These initiatives haveincluded Georgia’s Postsecondary Readiness and Enrichment Program,Minnesota’s Get Ready! program, and Oklahoma’s Higher Learning AccessProgram. All of these programs share a concern for, and are aimed at, mar-shalling the resources of both K-12 and higher education systems in aneffort to identify students at risk for academic failure and intervene pro-grammatically in their academic preparedness.
P-16 Coordinating and Accountability Mechanisms
Kirst and Venezia (2001) have concluded that recommendations for theimprovement of high school to college transition for America’s studentswould be easier to implement “if there is an overall organizational base forK-16 policy making and oversight” (p. 95). Indeed, a number of states havelooked to various structural mechanisms for facilitating policy implemen-tation across educational sectors. A number of the new college-transitionpolicies of recent years, especially those in the area of academic prepara-tion, have been driven by state P-16 councils, which, together with gover-nance reforms in higher education, represent a distinctly structuralapproach to intersector alignment.
Although their precise functions vary, P-16 councils often have beengiven broad mandates to design and, occasionally, implement comprehen-sive system-integration strategies aimed toward improving student transi-tions from primary and secondary through postsecondary systems. Between1992 and 2006, 30 states adopted some form of statewide P-16 council(Education Commission of the States, 2006; National Association ofSystem Heads, 2001; Rainwater, 2000). These councils have been formedthrough three primary methods: voluntary collaborations among leaders of
400 Educational Policy
at SMU on June 10, 2013epx.sagepub.comDownloaded from

state education agencies, executive orders of the governor, and legislativemandates. Some councils are ad hoc and voluntary in nature: Maryland’sK-16 Partnership for Teaching and Learning, created in 1995, represents analliance of the Maryland State Department of Education, the MarylandCommission on Higher Education, and the University System of Maryland.The Maryland P-16 Partnership was formed by the heads of the state’s threeeducational organizations: the state university chancellor, state schoolssuperintendent, and higher education secretary (Bowler, 2001). Other coun-cils, such as those in Oregon and Georgia, were established by governorsand enjoyed strong political backing (Education Commission of the States,2003). Importantly, governors have often been instrumental in bringingtogether members of the K-12 and higher education state agencies, legisla-tive committees, and the business community (Kettlewell, Kaste, & Jones,2000), even in the formation of voluntary P-16 councils.
Reforms in higher education governance arrangements provide anothermechanism by which state governments have sought to achieve structuralintegration of the K-12 and higher education sectors. Discussions abouthigher education’s prospective involvement in improving high school tocollege transition often fail to account for one crucial feature of the highereducation universe: In many states, the policy levers available to state gov-ernments to influence higher education’s collaboration with the K-12 sec-tor are limited because of the relatively decentralized nature of campusgovernance. Although the nature and extent of state-level oversight ofhigher education varies both across states and within them, historicallymost states have accorded their public colleges and universities a substan-tial degree of operational autonomy. What is more, many of the recent ini-tiatives to reform state governance of higher education have moveddecision authority closer to the local campus level in an effort to reducecosts, encourage innovation, promote accountability, and lessen state“bureaucratic intervention” in the affairs of campuses (McLendon, 2003).In some states, public universities even enjoy constitutional protections thatsubstantially restrict the scope of state authority in campus affairs. Forexample, in Michigan, where the concept and practice of “constitutionalautonomy” for the state’s 4-year public universities is enshrined in the con-stitution and is buttressed by more than a century of state Supreme Courtdecisions, there is virtually no area of institutional functioning (academic,financial, or personnel) over which the legislature or executive-branchagencies can exert direct control. Consequently, closer collaborationbetween the higher education and K-12 sectors in a state such as Michiganmust arise voluntarily and on the terms set by campuses.
McLendon et al. / High School to College Transition Policy 401
at SMU on June 10, 2013epx.sagepub.comDownloaded from

Nonetheless, some states do exercise strong policy-setting vis-à-vispublic higher education (McGuinness, 1997), and several have demon-strated an increasing willingness to reform their governance systems forhigher education so as to smooth transitions for students throughout theeducational pipeline. Florida’s historic governance reform legislation of2000 perhaps best exemplifies this effort. In its sweeping overhaul, Floridareplaced the nation’s oldest consolidated governing board for higher edu-cation, the statewide Board of Regents, with local boards at each of thestate’s 11 universities and created a new so-called “K-20 superboard” toserve as a linchpin for policy planning across K-12 and higher education(Herbert, 2001; Trombly, 2001). The new K-20 board was charged with thedevelopment of statewide education accountability goals and the conveningof discussions on improved coordination between the educational sectors.Proponents of the governance change, particularly Governor Jeb Bush andleaders in the Republican controlled legislature, claimed the new structurewould (a) improve institutional decision making by devolving authoritycloser to the campus level , (b) enhance educational accountability by low-ering barriers between the K-12 and higher education sectors, and, as aresult, (c) improve student performance throughout Florida education.
Conducting Across-State Study on the Determinantsand Effects of College-Transition Policies
As noted, much of the current literature on college-transition policies inthe states is primarily descriptive or exploratory in nature. This work typi-cally focuses on describing contemporary problems, identifying deficits inexisting policies, assessing the implications of structural misalignmentswithin states, and recommending policy solutions. However, as researchersmove beyond mere description of college-transition policies to draw moresystematic and rigorous comparisons across states, they are likely to turnwith greater regularity to questions about the determinants and the effectsof those policies. In the remainder of this article, we organize our discus-sion around each of these two important types of questions—determinantsquestions and effects questions—and the barriers to conducting comparative-state study that are associated with each.
Analyzing the Determinants of College-Transition Policies
One type of question around which future research should accumulateinvolves the determinants of state adoption of college-transition policies,
402 Educational Policy
at SMU on June 10, 2013epx.sagepub.comDownloaded from

that is, the factors and conditions internal and external to states that influ-ence patterns of policy adoption in the area of high school to college tran-sition. Researchers might ask, for example, What accounts for variation inthe college-affordability and student-financing policy postures of thestates? Why have some states selected the vehicles of prepaid-tuition andcollege-savings programs as a means for promoting college affordability,while other states have chosen to emphasize merit-based approaches? Whataccounts for some states’ policy choices and policy designs in developingnew K-16 standards, admissions, and placement policies? Why did somestates emerge as early leaders in the creation of P-16 councils and otherstructural approaches to bridging the K-12 and higher education sectors,while other states remained “laggards?”
Questions such as these direct the attention of researchers to the sociode-mographic, economic, political, and interstate diffusion factors that accountfor college-transition policies in the states. The significance of this line ofinquiry is that it may lead to an accumulated base of social-scientific under-standing about how state context influences the policy behavior of stategovernments and, more important for purposes of our discussion, how vari-ation in contextual conditions across states influences patterns of govern-mental behavior in the domain of college-transition policy.
The determinants question is rooted in a rich vein of scholarship on pol-icy innovation and diffusion4 in the American states (Berry & Berry, 1999;Gray, 1994; Walker, 1969). Policy innovation and diffusion researchincludes a family of theoretical perspectives that, during the four decadesof their development, have proven useful in explaining why state govern-ments adopt the policies they do. Researchers on K-12 education have pur-sued analysis along these lines in studying the determinants of charterschool legislation and systemic school reform (Mintrom, 1997; Mintrom &Vergari, 1998; Wong & Shen, 2002). Higher education specialists onlyrecently have begun to focus empirically on intra- and interstate explana-tions for postsecondary policy adoption (e.g., McLendon & Hearn, 2007;McLendon, Hearn, & Deaton, 2006; McLendon, Heller, & Young, 2005).
There are at least three principal explanations found in the literature onstate policy innovation and diffusion that researchers might leverage in con-ducting across-state study of the determinants of high school to college-transition policies. Internal determinants models assert that the primaryfactors leading a state to adopt a new policy or program are those social,economic, and political characteristics internal to the state. Much evidencefrom the policy innovation literature supports the contention that certainsocioeconomic conditions of the states and their citizenries influence
McLendon et al. / High School to College Transition Policy 403
at SMU on June 10, 2013epx.sagepub.comDownloaded from

patterns of policy adoption. For example, numerous studies have found thatlarger, wealthier, and more economically developed states tend to innovateearlier and at higher rates than do smaller, poorer, and less developed ones(Dawson & Robinson, 1963; Plotnick & Winters, 1985; Walker, 1969).Several different politico-structural characteristics of states also have beenfound to influence the policy behaviors of state governments. Studies haveshown, for instance, that states with higher levels of legislative professional-ism are more likely to innovate (Hays, 1996; Sigelman & Smith, 1980;Walker, 1969). Evidence also exists that states with higher levels of interpartycompetition may be more likely to adopt certain new policies, one explanationfor which being that politicians in states with closely contested elections adoptnew policies in an effort to strengthen or expand their electoral base (Mintrom,1997; Walker, 1969). Another political explanation of policy innovation holdsthat politicians adopt new policies at times within their election cycle that aremost politically advantageous (Berry & Berry, 1990; Mintrom, 1997; Mooney& Lee, 1995). Empirical support for this hypothesis has been found in the caseof popular state lotteries, which tend to be adopted in statewide electionsyears, and unpopular tax initiatives, which tend to be adopted in the yearimmediately following a statewide election (Berry & Berry, 1990, 1999).
A second broad approach to explaining the adoption of new policiesfocuses on the interstate migration of policy ideas, also known as policydiffusion. Although scholars have developed several distinct conceptualiza-tions of interstate policy migration (regional-interaction and national-inter-action models predominating), all such approaches draw on one or more ofthree rationales as to why states might borrow ideas from their neighbors.First, states are said to engage in processes of social learning in an attemptto simplify the range of alternatives from which decision makers choose.Learning from one’s neighbors what has and has not worked well elsewherecan provide shortcuts in dealing with the complexities of public decisionmaking (Mooney & Lee, 1995). Second, states are said to compete with oneanother to achieve a comparative advantage or to avoid being disadvantagedrelative to their peers. This focus on interstate competition is perhaps themost frequently cited rationale for the across-state migration of policyideas. For instance, Berry and Berry (1990), in their landmark diffusionstudy, contend that states adopt lotteries in an effort to reduce the incentivefor citizens to cross state boundaries to play in another state’s game and,consequently, the out-of-state transfer of wealth. Berry and Berry (1990)also conceptualized a third rationale for the diffusing of policies acrossstates: Elected officials have a strong incentive to respond to public demandfor popular programs adopted by other states. Here, Berry and Berry define
404 Educational Policy
at SMU on June 10, 2013epx.sagepub.comDownloaded from

competition in terms of the underlying electoral, rather than fiscal, pres-sures that confront state officials when neighboring or peer states adopt newpolicies. This third rationale appears particularly attractive in the context ofunderstanding the spread of merit scholarship programs and college savingsplans, which enjoyed strong support from middle-class voters.
Scholarship on state policy innovation and diffusion has surged duringthe past 20 years because of the development of newer longitudinal analytictechniques. Using various time-series analytic tools, particularly eventhistory analysis, scholars have begun combining both internal-determinantsexplanations and diffusion explanations into a single “unified” model(Berry & Berry, 1999; Gray, 1994), thus comprising the third—and nowstandard—approach to explaining understanding the origins of new policiesin the American states. Researchers have found compelling empirical evi-dence in support of the unified model: Both the internal characteristics ofstates and the emulative influences between and among them (diffusion)appear capable of predicting the probability of a state adopting certain newpolicies in a given year (Berry & Berry, 1990, 1999; McLendon et al., 2006;Mintrom, 1997; Mooney & Lee, 1995).
The literature on state policy innovation and diffusion affords researchersa valuable framework within which to investigate why state governmentsadopt new college-transition policies at the times at which they do. Using theenactment dates of college-transition policies as dependent variables, forexample, one could analyze the probability of a state adopting certain poli-cies initially, or reforming those policies subsequently—approaches forwhich event history analysis would be ideal. Ideally, the variables containedin such an analysis might include indicators of state sociodemographic sys-tems (e.g., measures of state wealth, economic health, ethnicity, and educa-tional attainment and achievement patterns), political attributes (e.g.,partisan control of government, ideology, legislative professionalism), andeducational governance structures (e.g., the degree of centralization or pro-fessionalization of state oversight agencies).
This research avenue, while appealing, also carries with it daunting dataimplications. All three of the innovation models previously discussedwould impose substantial data demands upon the researcher. The move-ment toward longitudinal analysis in comparative-state policy researchrequires data sets that are capable of capturing both the spatial (acrossstates) and temporal (over time) features of policy adoption phenomena. Incontrast with cross-sectional designs, where the state (50 of them, at most)is the unit of analysis, techniques such as event history analysis or pooled,cross-sectional time-series analysis have as their unit of analysis the state-year
McLendon et al. / High School to College Transition Policy 405
at SMU on June 10, 2013epx.sagepub.comDownloaded from

(50 states × the number of years studied). Thus, the researcher would needto develop a data set that, for each state, includes annual indicators of thefactors believed to influence policy adoption. The time sensitivity of certainpolitical variables compounds these data burdens. Some state features, suchas political ideology, political culture, and the institutional powers of gov-ernors, are unlikely to change dramatically over the short term. Index mea-sures of these attributes, therefore, are only periodically revised for use byresearchers. On the other hand, characteristics such as partisan control ofgovernment institutions can be quite sensitive to near-term change. Ofcourse, many indicators of state economic conditions and of educationalgovernance arrangements also may be subject to near-term fluctuations.Both of these circumstances, the need for annual indicators in longitudinalresearch and the time-sensitivity of certain variable-indicators of concep-tual relevance, often require researchers to develop data sets of substantialsize, depending on the number of states where comparisons of the focalphenomenon are to be made and the number of years and the kinds ofindependent-variable data to be included in the analysis.5
As a consequence, many of the data elements previously named for usein across-state study of college-transition policies—particularly ones per-taining to the political features of the states—remain rarely exploited byeducation researchers. When researchers do utilize them, often it is in cross-sectional analysis, where data collection burdens are comparatively light.What is more, K-12 and higher education researchers tend not to incorporateinto their respective study designs data common to the other field.
In an initial step aimed toward remedying this underutilization of exist-ing data, we have listed in Table 4 elements that are and are not generallyavailable to researchers, along with their respective sources. All of theseelements could be incorporated into cross-sectional, longitudinal databases,thus permitting researchers to analyze more systematically the determi-nants of state college-transition policies.
Analyzing the Effects of College-Transition Policies
Examining the genesis and formulation of any public policy is only onepart of understanding the impact of that policy on individuals or institu-tions. Equally important is an understanding of the effects of the policy,either intended or unintended, once it has been adopted. In this section wedescribe some of the questions researchers might choose to raise whenexamining high school to college transition policies in the states, along withsome of the challenges related to answering those questions.
406 Educational Policy
at SMU on June 10, 2013epx.sagepub.comDownloaded from

McLendon et al. / High School to College Transition Policy 407
Table 4Data Relevant for Analyzing the Determinants of
High School to College Transition Policy
Data Typical Source(s)
Data elements generally availableDemographic and economic: State U.S. Census Bureaua; Postsecondary
population Education Opportunity http://www.postsecondary.orga
Gross state product Bureau of Economic Analysis, U.S.Department of Commerce (USDC),http://www.bea.gova
Personal and corporate income Bureau of Economic Analysis, USDCa
Economic development U.S. Census Bureaua; Bureau ofEconomic Analysis, USDCa
Educational enrollment and attainment U.S. Census Bureaua; State Departmentsof Education (SDOE); State HigherEducation Boards (SHEBs)
Education appropriation and state “Grapevine,” http://www.coe.ilstubudget data .edu/grapevinea; Digest of Education
Statistics, National Center forEducation Statistics, http://nces.ed.gov/programs/digest/d03_tf.aspa; U.S.Census Bureau, http://www.census.gov/govs/www/school02.htmla;National Association of State BudgetOfficers, http://www.nasbo.org/publications.phpa; National Center forEducation Statistics, IntegratedPostsecondary Education Data System(IPEDS), http://nces.ed.gov/ipeds/ a;SHEBs
State governance arrangements Education Commission of the States(K-12 governance structures),http://mb2.ecs.org/reports/Report.aspx?id=162 (higher educationgovernance structures), http://www.ecs.org/ecsmain.asp?page=/html/publications/databases.htm; SDOE;SHEBs
Regional Higher Education Consortia Midwestern Higher Education Compact(MHEC), http://www.mhec.org/;New England Board of HigherEducation (NEBHE), http://www.nebhe.org/; Southern Regional
(continued)
at SMU on June 10, 2013epx.sagepub.comDownloaded from

408 Educational Policy
Table 4 (continued)
Data Typical Source(s)
Education Board (SREB), http://www.sreb.org/; Western Interstate Commissionfor Higher Education (WICHE),http://www.wiche.edu/
Political: Measures of state partisan balance Klarner data at the State Policy and(legislature and governor) Politics Archive (SPPQ), http://www
.unl.edu/SPPQ/journal_datasets/klarner.htmla; Book of the States,Council on State Governments(2004 and various years) a
Interparty competition Bibby and Holbrook (1999, 2003);Holbrook and Van Dunk (1993)
State legislative characteristics Squire, 1993, 2000; Council of State(e.g., committee structure, member Governments, Book of the Statescompensation, staffing, session length (2004 and various years); Berry,and professionalism) Berkman, and Scheiderman, 2000,
http://webapp.icpsr.umich.edu/cocoon/ICPSR-STUDY/01227.xmla
Political ideology Berry, Ringquist, Fording, & Hanson(2004) and Inter-University Consortiumfor Political and Social Research,http://webapp.icpsr.umich.edu/cocoon/ICPSR-STUDY/ 01208.xmla
Gubernatorial powers Beyle (1999, 2003), http://www.unc.edu/~beyle/ gubnewpwr.html
State political culture Elazar (1994); Erikson, Wright, andMcIver (1993)
Data elements generally not available
College-transition policy/program dates of enactment and operation
Public opinion data specific to K-12 education and higher education
Interest group characteristics of the state K-12 and higher education domains
Longitudinal data on state campaign contributions and political action committee activity, particularly that of universities and colleges
Composition of legislatures and committeesby race and gender
Longitudinal biographical data on legislatorsModes and patterns of interstate
communication among policymakers—elected, appointed, and professional
Political sponsorship (legislative,gubernatorial, other) of policy/program
a. Availability of annual indicators.
at SMU on June 10, 2013epx.sagepub.comDownloaded from

An important consideration in research on state policy effects is anexamination of the intent or goals of the policy. Often this can be assessedthrough examination of the enabling legislation, the legislative record(committee and floor debates and records), implementing regulations, oragency documents. Interviews with key individuals in the policy develop-ment cycle—legislators, legislative staff, gubernatorial legislative liaisons,lobbyists, and executive branch agency and commission staff—can alsolead to valuable insights. For example, a recent review of state merit schol-arship programs identified three primary goals of these programs: “to pro-mote college access and attainment . . . to encourage and/or reward studentswho work hard academically . . . and to stanch the ‘brain drain’ of the bestand brightest students and encourage them to attend college in the state”(Heller, 2002, p. 4).
Understanding policy intent is not necessarily a straightforward process;often policies will have multiple goals, including some that may be at oddswith others. The familiar “stages-heuristic” (Palumbo, 1998) of the publicpolicy process characterizes policy formation as a five-stage cycle: (a)problem identification, (b) agenda setting, (c) policy adoption, (d) policyimplementation, and (e) evaluation. At any one of the first three stages, for-mal policy goals may change, become clarified, or become more ambigu-ous; the original intent of a piece of legislation may be entirely altered bythe time the policy is put into place. Of course, policy “feedback” loopsmay also alter subsequent policy goals as perceptions about policy orprogram performance and its effects shape future policy design.
Once the goals of a policy have been discerned, the process of measur-ing and analyzing the effects can be undertaken. Table 5 outlines somequestions relevant to the transition policies described in this paper. Policychanges, when compared among the states, often present a “natural exper-iment” that researchers can exploit to measure how these changes (in con-junction with other covariates) affect some of the outcomes noted here. Inaddition, a policy change enacted in one state can similarly be used as a nat-ural experiment if requisite data on the impact of the change are availablefor points in time before and after the change.
Although many good data sources are available for conducting studiesof this type, the challenges in doing so are numerous. As noted in Table 6,many of the data that a researcher would want to use to answer the relevantquestions are available from disparate sources and require the researcher tocarefully match and merge the time period, definitions, and measurementscales of each data element. For studies that require the collection and join-ing of data from 50 states, this can be an extremely labor-intensive andtime-consuming task.
McLendon et al. / High School to College Transition Policy 409
at SMU on June 10, 2013epx.sagepub.comDownloaded from

410 Educational Policy
Table 5Questions Related to Studying Comparatively the Effects
of College-Transition Policies
Policy Domain Questions for Analysis
Affordability and student finance Has the policy increased the propensity for collegesaving?
Has the policy increased college attendance?Has the policy increased retention?Has the policy increased degree attainment?To what extent has the policy reduced or exacerbated
college attendance, retention, and attainmentacross socioeconomic and ethic/racial groups?
How has the policy affected the way that studentsand their families finance the cost of college?
How has the policy shifted the “cost sharing”among the state, the student, and her/his family?
How have these impacts differed for students fromdifferent socioeconomic and ethnic/racial groups?
To what extent has the policy influenced thebehavior of colleges and universities with respectto their admissions and financial aid policies?
Academic preparation, standards, What has been the impact of the policy onand admissions students’ preparation for college?
How has the policy influenced student collegechoice?
Has the policy increased the rate at which studentsenroll in college immediately or shortly afterhigh school graduation?
How have these impacts differed for students fromdifferent socioeconomic and ethnic/racial groups?
Coordination and accountability To what extent has the policy influenced intersectorcoordination between K-12 schools and highereducation institutions?
To what extent have changes in state governanceand accountability mechanisms increased studentaccess, achievement, and performance?
What have been the (seen and uneseen) costs ofincreased, mandated coordination between K-12and higher education?
How has increased, mandated coordination affectedinstitutional personnel decisions, academicprogramming and quality, and long-rangeplanning?
What have been the unintended policy consequences,both at the macro-policy level and at theinstitution level, of structural integration betweenthe K-12 and postsecondary education sectors?
at SMU on June 10, 2013epx.sagepub.comDownloaded from

McLendon et al. / High School to College Transition Policy 411
Table 6Data Relevant for Analyzing the Effects of
College-Transition Policies
Data Typical Source(s)
Data elements generally available
K-12 enrollments by race, gender, NCES Common Core of Data (CCD), http://ncessocioeconomic status (free/reduced .ed.gov/ccd/; State Departments of Educationlunch) (SDOE)
K-12 state test scores (often by race SDOEand gender)
K-12 National Assessment of U.S. Department of Education (USDOE), http://Educational Progress scores nces.ed.gov/ nationsreportcard/
K-12 funding and finance data DOE; CCDIncome and poverty data, by district U.S. Census BureauHigh school graduation and dropout rates DOEPopulation data Census Bureau (census years and intercensile
estimates)Higher education enrollment by race, State higher education boards (HEB); NCES
gender Integrated Postsecondary Education DataSystem (IPEDS), http://nces.ed.gov/programs/digest/d02/lt3.asp#c3a_1
Higher education price/tuition data Postsecondary Opportunity, http://www.postsecondary.org/; College Board, http://www.collegeboard.com/highered/ res/hel/hel.html; IPEDS
Higher education funding and finance “Grapevine,” http://www.coe.ilstu.edu/data grapevine; HEB; IPEDS
Student need-based and merit-based National Association of State Student Grantfinancial aid and Aid Programs (NASSGAP), http://www
.nassgap.org/researchsurveys/ default.htm Higher education degree production IPEDS
by discipline
Data elements generally not availablea
K-12 course taking patternsK-12 test scores by income Participation in college-prep programsHigh school grade point averagesHigher education enrollment by incomeHigher education student outcomesHigher education persistence dataFinancial aid dataSAT/ACT scores
Note: SAT = Scholastic Aptitude Test; ACT = American College Test.a. Some of these measures are available as statewide averages or distributions, but generallyare unavailable at the unit-record level or even the district or institution level.
at SMU on June 10, 2013epx.sagepub.comDownloaded from

Another problem often encountered in conducting cross-state educa-tional studies, and of relevance to future study of college-transition policies,is the lag time between when the data are collected by the governmentagency and when they are released for public use. In some cases, years maypass between collection and dissemination, thus posing a serious challengeto the timely analysis of state-level policy effects.
Many national surveys, often conducted for the National Center forEducation Statistics (NCES), provide good measures of many of the dataelements indicated in Table 6, but they too are limited. These surveys aregenerally conducted only a single time, or if they are conducted multipletimes, it is often at fixed intervals that do not necessarily correspond withthe needs of researchers examining state policy changes. For example, theNCES National Educational Longitudinal Study of 1988 (NELS) has beena valuable resource for educational researchers. It surveyed a nationallyrepresentative sample of students who were in the eighth grade in 1988, andresurveyed them in 1990, 1992, 1994, and 2000. Although NELS containsvaluable data about students during their transition from high school to col-lege, those students are now more than 15 years removed from high schoolgraduation. Thus, it is of limited value in trying to assess the implementa-tion of policies since these students graduated from high school in 1992.
Another limitation of the NCES surveys is that their sample sizes are gen-erally not large enough to use for state-level analysis. Although many utilizenationally representative samples (including oversampling of minority andother targeted populations), the samples are not large enough for conductingreliable estimates for other than the largest states. This too is a limitation ofthe Current Population Survey, conducted for the Census Bureau, whichcontains valuable socioeconomic data on families and households, includingeducational enrollment and attainment data, but has sample sizes that are toosmall to conduct many state-level studies of educational policy.
A final challenge to conducting cross-state studies on transition policy isthe statistical methods required. The analytic tools that are typically usedby most educational researchers (and for which they are trained in graduateeducation programs)—such as analysis of variance, correlation analysis, orordinary least squares regression—are often inappropriate for analysis oflarge scale datasets that either contain time-series data or use complex sur-vey sampling designs. For example, to examine the impact of policychanges across a number of states over some period of time (or a group ofindividuals over time) may require an analysis that violates one of the keyassumptions of ordinary least squares regression—that the observations arestatistically independent of one another (Kleinbaum, Kupper, & Muller,
412 Educational Policy
at SMU on June 10, 2013epx.sagepub.comDownloaded from

1988). Analyses of this type combine cross-sectional data (i.e., observationson some number of individuals, school districts, or states) with time-seriesdata (i.e., measures of the same unit in different time periods) and requirestatistical techniques that take into account this unique data structure.Recent studies by Heller (1999), Kane (1994), and McLendon et al. (2005)have utilized cross-sectional, time-series data to address questions relatedto high school-to-college transition policy.
Of course, comparative case studies of effects-related phenomena afforddistinct research advantages, but they too impose weighty data demands.For example, comparative case studies of the implementation of college-transition policies may provide important insights into questions of policydesign, policy creep, and policy sustainability (Mazamanian & Sabatier,1983; Mumper, 2003; Sabatier, 1986) and, moreover, may serve as a cor-rective to the “black box” tendency that sometimes attends positivistresearch. Yet implementation research of this kind is likely to require exten-sive interview and archival data drawn both across states and over time (ide-ally, spanning a decade or more in time). As noted in the previousdiscussion of policy antecedents, the collection of these data poses quiteserious logistical and financial challenges to the lone researcher.
Conclusion
The arena of high school to college transition policy represents one ofthe most active and dynamic areas of contemporary policy adoption andreform in the American states. Yet researchers have paid relatively scantempirical attention to studying the determinants or effects of those policiesacross multiple state settings. In this article, we have raised a series of top-ical, conceptual, and analytical issues that we believe researchers need toaddress more systematically in developing a research agenda on comparative-state study of college-transition policies. Given the critical data limitationsand challenges noted earlier, an important initial step would be the devel-opment of pooled data capacity, such as the creation of a web-accessiblearchive of available data sources relevant to the study of high school to col-lege transition policies. Such an archive might include data on: (a) policyand program characteristics (e.g., adoption dates, enabling legislation,description of key program provisions or features), (b) state contextual fea-tures (e.g., demographic, economic, and political characteristics of thestates and their citizenries), and (c) student achievement and performance,especially data from those states that have begun testing large numbers of
McLendon et al. / High School to College Transition Policy 413
at SMU on June 10, 2013epx.sagepub.comDownloaded from
students as part of an effort to take stock of institutional performance (e.g.,Tennessee, Missouri, Wisconsin, Georgia).
Research capacity in the area of college-transition policy could also bedeepened by linking emerging research questions with the established intel-lectual interests of scholars. In particular, the politics of education literatureoffers a potentially useful framework with which to organize futureresearch. The significance of college-transition policies lies beyond ques-tions of policy design and evaluation: The policies touch on fundamentally“political” questions about the allocation of values and of scarce societalresources, the role of government in the lives of its citizens, and the uses towhich government policy should be put (e.g., who should pay, who shouldbenefit, and to what end for the individual and society). As such, college-transition policies intersect the core intellectual interests of researchers whospecialize in the study of education and higher education politics, intereststhat include, for example, elections and voting behavior, interest mobiliza-tion, and political ideology. Linking research on college-transition policyphenomena now under way in the American states with the politics of edu-cation literature may facilitate the development of a research agenda thathelps to move study of college-transition issues beyond the largely descrip-tive and prescriptive focus that now predominates.
Notes
1. As recently as 2001, for example, a study conducted by the Institute for EducationalLeadership concluded that such efforts appeared still to be “in the early stages of consciousness-raising” (Usdan & Podmostko, 2001).
2. The term broad-based differentiates this kind of scholarship from other scholarships thatare available only to students who intend to study in a particular field (e.g., nursing, or is onlyavailable to a small number of students in a state).
3. Indeed, the desire to stanch “brain-drain,” or the migration of academic talent from onestate to the next, has been cited as a chief rationale for many states’ adoption of the programs(Heller, 2002).
4. In this paper, we follow the conventional practice of political scientists in defining inno-vation as a policy or program that is new to the jurisdiction (state) adopting it. Thus, innova-tion is differentiated from invention, or the process by which original policy ideas areconceived (Berry & Berry, 1999; Walker, 1969).
5. Although different by nature, these data demands are likely to be no less substantial bydegree for researchers who are interested in conducting comparative-state field research oncollege-transition policy. Although qualitative research in general may afford greater flexibil-ity in study design, the researcher still must consider a potentially wide range of dynamicinfluences on the policy behavior of state governments. Large numbers of interviews with pol-icy officials and extensive archival data collection across multiple states are likely to be nec-essary in such studies. Thus, large-scale, comparative case studies of several or more statesoften are quite labor intensive and, sometimes, cost prohibitive.
414 Educational Policy
at SMU on June 10, 2013epx.sagepub.comDownloaded from

References
Adelman, C. (1999). Answers in the tool box: Academic intensity, attendance patterns andbachelor’s degree attainment. Washington, DC: U.S. Department of Education, Office ofEducational Research and Improvement.
Baird, K. (2006a). Do prepaid tuition plans affect state support for higher education? Journalof Education Finance, 31(3), 255-275.
Baird, K. (2006b). The political economy of college prepaid tuition plans. The Review ofHigher Education, 29(2), 141-166.
Berry, F. S., & Berry, W. D. (1990). State lottery adoptions as policy innovations: An eventhistory analysis. American Political Science Review 84(2), 395-416.
Berry, F. S., & Berry, W. D. (1999). Innovation and diffusion models in policy research. InP. Sabatier (Ed.), Theories of the policy process. Boulder, CO: Westview Press.
Berry, W. D., Ringquist, E. J., Fording, R. C., & Hanson, R. L. (1998). Measuring citizen andgovernment ideology in the American states, 1960-93. American Journal of PoliticalScience, 42, 327-348.
Beyle, T. (1999). The governors. In V. Gray, R. L. Hanson, & H. Jacob (Eds.), Politics in theAmerican states (7th ed.). Washington, DC: CQ Press.
Bibby, J. F., & Holbrook, T. M. (1999). Parties and elections. In V. Gray, R. L. Hanson, &H. Jacob (Eds.), Politics in the American states (7th ed.). Washington, DC: CQ Press.
Bowler, M. (2001). Maryland’s K-16 partnership. In G. I. Maeroff, P. M. Callan, & M. D.Usdan (Eds.), The learning connection: New partnerships between schools and colleges(pp. 63-70). New York: Teachers College Press.
Burke, J. C. (2002). Funding public colleges and universities for performance. Albany, NY:Nelson Rockefeller Institute Press.
Dawson, R. E., & Robinson, J. A. (1963). Inter-party competition, economic variables, andwelfare policies in the American states. Journal of Politics, 25(2), 265-289.
Education Commission of the States. (2001). What is P-16 education? A primer for legisla-tors. Denver, CO: Author.
Education Commission of the States. (2003). StateNotes: Models of postsecondary educationcoordination and governance in the states. Denver, CO: Author.
Education Commission of the States. (2006). StateNotes: P-16 collaboration in the states.Denver, CO: Author.
Ehrenberg, R. (2006). The perfect storm and the privatization of public higher education.Change, 38(1), 46-50.
Erikson, R. S., Wright, G. C., & McIver, J. P. (1993). Statehouse democracy: Public opinionand policy in the American states. Cambridge, UK: Cambridge University Press.
Farrell, P. (2004). Who are the students receiving merit scholarships? In D. E. Heller &P. Marin (Eds.), State merit scholarship programs and racial inequality (pp. 49-75).Cambridge, MA: The Civil Rights Project at Harvard University.
Grapevine. (2007). State rankings on annual changes in state appropriations. Retrieved fromhttp://www.coe.ilstu.edu/grapevine/table3.html
Gray, V. (1994). Competition, emulation, and policy innovation. In L. Dodd & C. Jillson(Eds.), New perspectives on American politics. Washington, DC: CQ Press.
Hays, S. P. (1996). Influences on re-invention during the diffusion of innovations. PoliticalResearch Quarterly, 49(3), 631-650.
Heller, D. E. (1999). The effects of tuition and student financial aid on public college enroll-ment. The Review of Higher Education, 23(1), 65-89.
McLendon et al. / High School to College Transition Policy 415
at SMU on June 10, 2013epx.sagepub.comDownloaded from

Heller, D. E. (2001). The states and public higher education policy: Affordability, access, andaccountability. Baltimore, MD: Johns Hopkins University Press.
Heller, D. E. (2002). State merit scholarship programs. In D. E. Heller & P. Marin (Eds.),Whom should we help? The negative social consequences of merit scholarships (pp. 15-23).Cambridge, MA: The Civil Rights Project at Harvard University.
Heller, D. E. (2004). State merit scholarship programs: An overview. In D. E. Heller &P. Marin (Eds.), State merit scholarship programs and racial inequality (pp. 13-22).Cambridge, MA: The Civil Rights Project at Harvard University.
Heller, D. E. (2006, March). Merit aid and college access. Paper prepared for the Symposiumon the Consequences of Merit-Based Student Aid, Wisconsin Center for the Advancementof Postsecondary Education, University of Wisconsin, Madison.
Heller, D. E., & Rasmussen, C. (2001, November). Do merit scholarships promote collegeaccess? Evidence from two states. Paper presented at the annual meeting of the Associationfor the Study of Higher Education, Richmond, VA.
Herbert, A. W. (2001). Statewide education governance reform: The Florida experiment. ECSGovernance Notes. Denver, CO: Education Commission of the States.
Holbrook, T. M., & Van Dunk, E. (1993). Electoral competition in the American states.American Political Science Review, 87, 955-962.
Ikenberry, S., & Hartle, T. (1998). Too little knowledge is a dangerous thing: What the publicthinks and knows about paying for college. Washington, DC: American Council onEducation.
Immerwahr, J. (2002). The affordability of higher education: A review of recent surveyresearch. San Jose, CA: National Center for Public Policy and Higher Education.
Kane, T. J. (1994). Lessons from the largest school voucher program ever: Two decades ofexperience with Pell Grants. Monograph, Kennedy School of Government.
Kettlewell, J. S., Kaste, J. A., & Jones, S. A. (2000). The Georgia story of P-16 partnerships.Educational Policy, 14(1), 77-92.
Kirst, M. W. (1997). Exam confusion: Admissions and placement tests lack standardization.National Crosstalk, 5(4).
Kirst, M. W. (1999). A Babel of standards: Students face a confusing array of tests and assess-ments. National Crosstalk, 7(4).
Kirst, M. W. (2000). The senior slump: Making the most of high school preparation. NationalCrosstalk, 8(4).
Kirst, M. W., & Bracco, K. R. (2004). Bridging the great divide: How the K-12 and postsec-ondary split hurts students, and what can be done about it. In M. W. Kirst & A. Venezia(Eds.), From high school to college: Improving opportunities for success in postsecondaryeducation. San Francisco: Jossey-Bass.
Kirst, M. W., & Venezia, A. (2001, September). Bridging the great divide between secondaryschools and postsecondary education. Phi Delta Kappan, 92-97.
Kirst, M. W., Venezia, A., & Antonio, A. L. (Eds.). (2004). From high school to college: Improvingopportunities for success in postsecondary education. San Francisco: Jossey-Bass.
Kleinbaum, D. G., Kupper, L. L., & Muller, K. E. (1988). Applied regression analysis andother multivariate methods (2nd ed.). Boston: PWS-KENT.
Krueger, C. (2001). ECS state notes: Financial aid: Merit scholarships. Denver, CO: EducationCommission of the States.
Mazamanian, D., & Sabatier, P. (1983). Implementation and public policy. Glenview, IL: ScottForesman.
McGuinness, A. C. (1997). State postsecondary education structures handbook. Denver, CO:National Center for Higher Education Management Systems.
416 Educational Policy
at SMU on June 10, 2013epx.sagepub.comDownloaded from

McLendon, M. K. (2003). State governance reform of higher education: Patterns, trends, andtheories of the public policy process. In J. Smart (Ed.), Higher education: Handbook oftheory and research (Vol. 18, pp. 57-144). London: Kluwer.
McLendon, M. K., & Hearn, J. C. (2007). Incorporating political indicators into comparative-state research on postsecondary policy: Opportunities and limitations of space and time. InK. Shaw & D. E. Heller (Eds.), The challenges of comparative state-level higher educa-tion policy research. Sterling, VA: Stylus.
McLendon, M. K., Hearn, J. C., & Deaton, R. (2006). Called to account: Analyzing the ori-gins and spread of state performance-accountability policies for higher education.Educational Evaluation and Policy Analysis, 28(1), 1-24.
McLendon, M. K., Heller, D., & Young, S. (2005). State postsecondary policy innovation:Politics, competition, and interstate migration of policy ideas. Journal of HigherEducation, 76(4), 363-400.
Mintrom, M. (1997). Policy entrepreneurs and the diffusion of innovation. American Journalof Political Science, 41(3), 738-770.
Mintrom, M., & Vergari, S. (1998). Policy networks and innovation diffusion: The case of stateeducation reforms. The Journal of Politics, 60(1), 126-148.
Mooney, C. Z., & Lee, M. H. (1995). Legislating morality in the American states. AmericanJournal of Political Science, 39(3), 599-627.
Mumper, M. (2003). Does policy design matter? Comparing universal and targeted approachesto encouraging college student participation. Educational Policy, 17(1), 38-59.
National Association of Systems Heads. (2001). State K-16 councils. Retrieved fromhttp://www.nashonline.org/
National Center for Public Policy and Higher Education. (2000). Measuring up, 2000. SanJose, CA: Author.
Olivas, M. A. (2003). State college savings and prepaid tuition plans: A reappraisal and review.Journal of Law & Education, 32(4), 475-515.
Oregon University System. (2000, April). An introduction to the Proficiency-BasedAdmissions Standards System (PASS). Author.
Palumbo, D. J. (1988). Public policy in America: Government in action. San Diego, CA:Harcourt Brace Jovanovich.
Plotnick, R. D., & Winters, R. F. (1985). A politicoeconomic theory of income redistribution.American Political Science Review, 79(2), 458-473.
Rainwater, T. (2000, August). ECS state notes: P-16 collaboration in the states. Denver, CO:Education Commission of the States.
Sabatier, P. A. (1986). Top-down and bottom-up models of policy implementation. Journal ofPublic Policy, 6, 21-48.
Selingo, J. (2003, May 2). What Americans think about higher education. Chronicle of HigherEducation.
Sigelman, L., & Smith, R. E. (1980). Consumer legislation in the American states: An attemptat explanation. Social Science Quarterly, 61(1), 58-69.
Squire, P. (1993). Professionalization and public opinion of state legislatures. Journal ofPolitics, 55(2), 479-491.
Squire, P. (2000). Uncontested seats in state legislative elections. Legislative StudiesQuarterly, 25(1), 131-146.
Swail, W. S., & Perna, L. W. (2002). Pre-college outreach programs: A national perspective.In W. G. Tierney & L. S. Hagedorn (Eds.), Increasing access to college: Extending possi-bilities for all students. Albany: State University of New York Press.
McLendon et al. / High School to College Transition Policy 417
at SMU on June 10, 2013epx.sagepub.comDownloaded from
Trombly, W. (2001). Florida’s new “K-20” model. Crosstalk, 9(2), 14-16.Usdan, M. D., & Podmostko, M. (2001). The legislative status of K-12 and higher education
relationships. Washington, DC: Institute for Educational Leadership.Walker, J. L. (1969). The diffusion of innovations among the American states. American
Political Science Review, 63(3), 880-899.Wong, K. K., & Shen, F. X. (2002). Politics of state-led reform in education: Market compe-
tition and electoral dynamics. Educational Policy, 16(1), 161-192.
Michael McLendon is an associate professor of public policy and higher education and direc-tor of the Program in Higher Education Leadership and Policy at Peabody College, VanderbiltUniversity. His research and teaching focus on state politics, governance, and finance of post-secondary education.
Donald E. Heller is professor of education, senior scientist, and director of the Center for theStudy of Higher Education at Pennsylvania State University. His research focuses on highereducation economics, public policy, access, and choice.
Stephanie Lee is a doctoral candidate in the Program in Higher Education Leadership andPolicy at Peabody College, Vanderbilt University. Her research interests include issues ofaccess and equity in higher education.
418 Educational Policy
at SMU on June 10, 2013epx.sagepub.comDownloaded from