ee 446/646 photovoltaic devices iii - university of …eebag/photovoltaic devices iii.pdfee 446/646...
TRANSCRIPT

EE 446/646 Photovoltaic Devices III
Y. Baghzouz
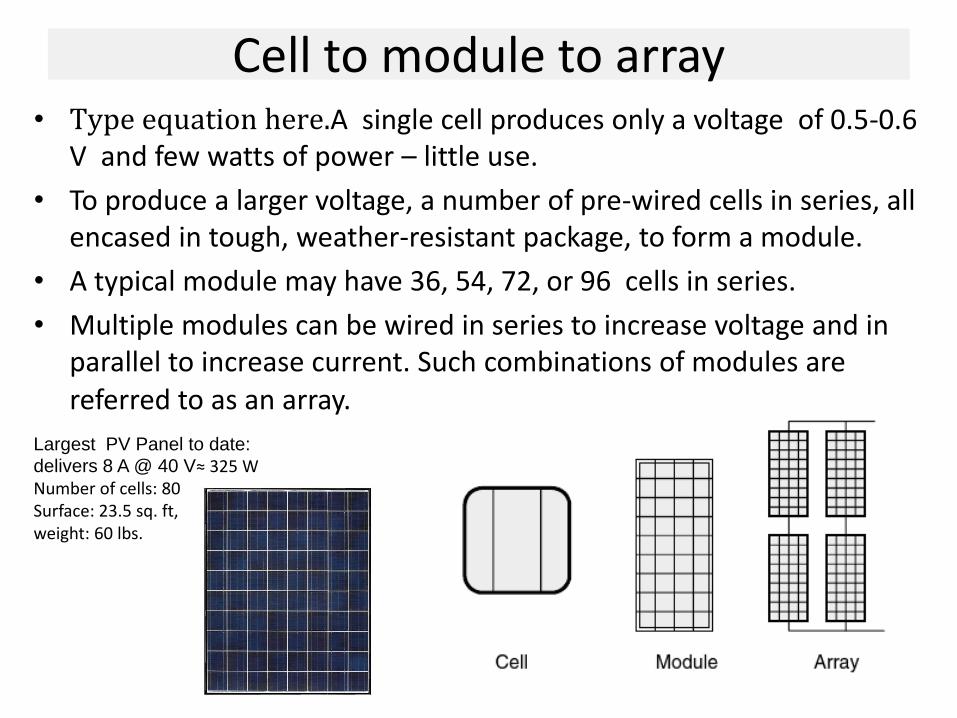
Cell to module to array • Type equation here.A single cell produces only a voltage of 0.5-0.6
V and few watts of power – little use.
• To produce a larger voltage, a number of pre-wired cells in series, all encased in tough, weather-resistant package, to form a module.
• A typical module may have 36, 54, 72, or 96 cells in series.
• Multiple modules can be wired in series to increase voltage and in parallel to increase current. Such combinations of modules are referred to as an array.
Largest PV Panel to date: delivers 8 A @ 40 V≈ 325 W Number of cells: 80 Surface: 23.5 sq. ft, weight: 60 lbs.
Cells connected in series
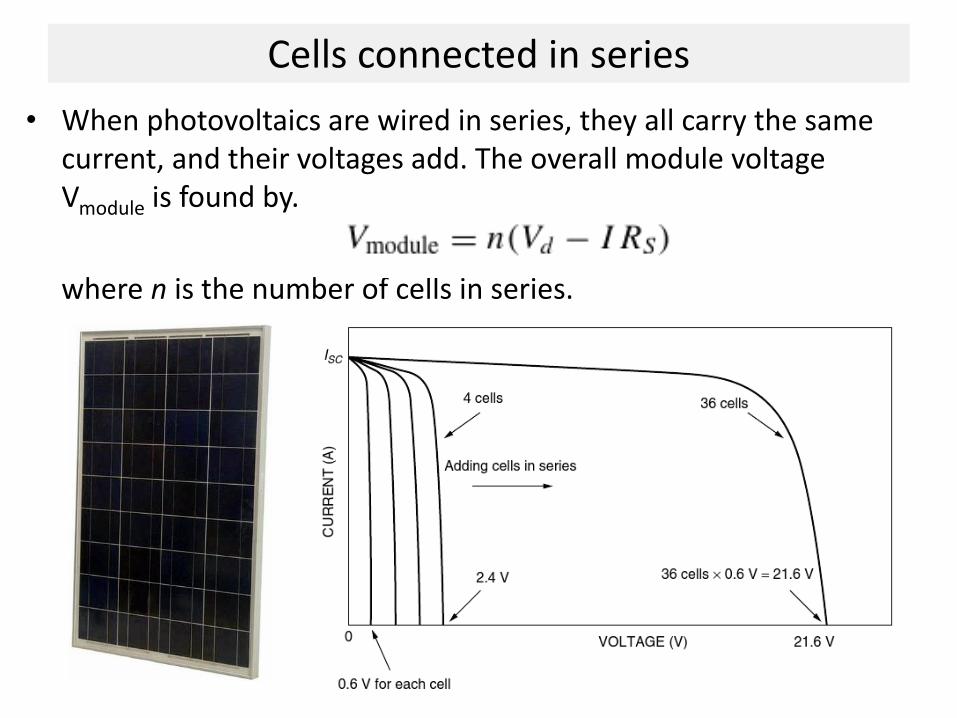
• When photovoltaics are wired in series, they all carry the same current, and their voltages add. The overall module voltage Vmodule is found by.
where n is the number of cells in series.
Example
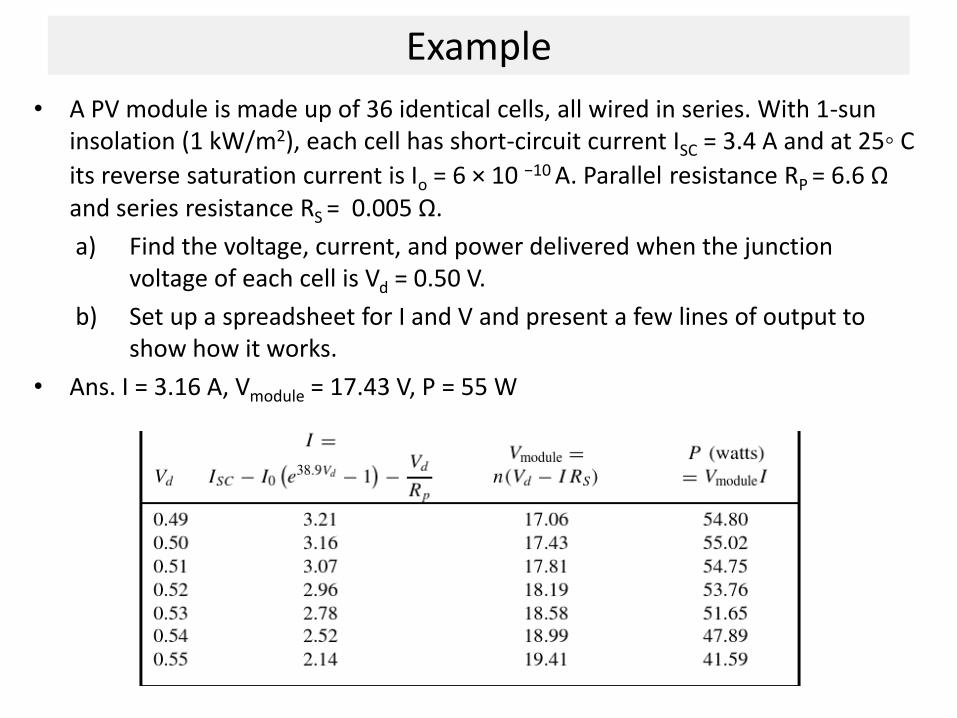
• A PV module is made up of 36 identical cells, all wired in series. With 1-sun insolation (1 kW/m2), each cell has short-circuit current ISC = 3.4 A and at 25 C
its reverse saturation current is Io = 6 × 10 −10 A. Parallel resistance RP = 6.6 Ω and series resistance RS = 0.005 Ω.
a) Find the voltage, current, and power delivered when the junction voltage of each cell is Vd = 0.50 V.
b) Set up a spreadsheet for I and V and present a few lines of output to show how it works.
• Ans. I = 3.16 A, Vmodule = 17.43 V, P = 55 W

Series connected modules
• For modules in series, the I –V curves are simply added along the voltage axis. That is, at any given current (which flows through each of the modules), the total voltage is just the sum of the individual module voltages.
• The figure below shows the I –V curve for 3 modules in series.
Parallel connected modules
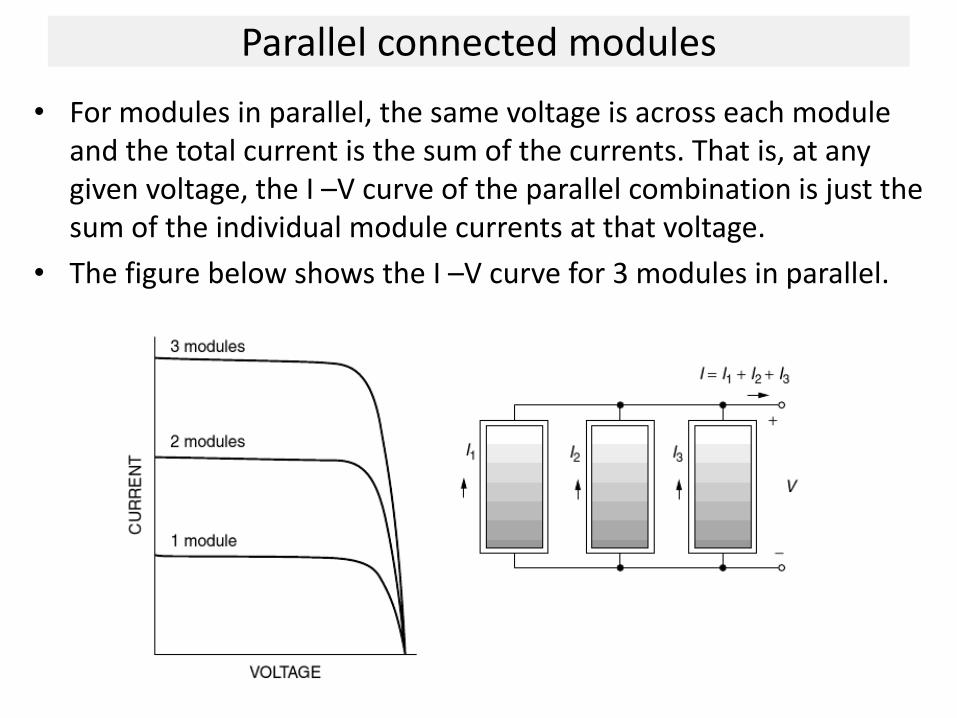
• For modules in parallel, the same voltage is across each module and the total current is the sum of the currents. That is, at any given voltage, the I –V curve of the parallel combination is just the sum of the individual module currents at that voltage.
• The figure below shows the I –V curve for 3 modules in parallel.
Series-parallel connected modules
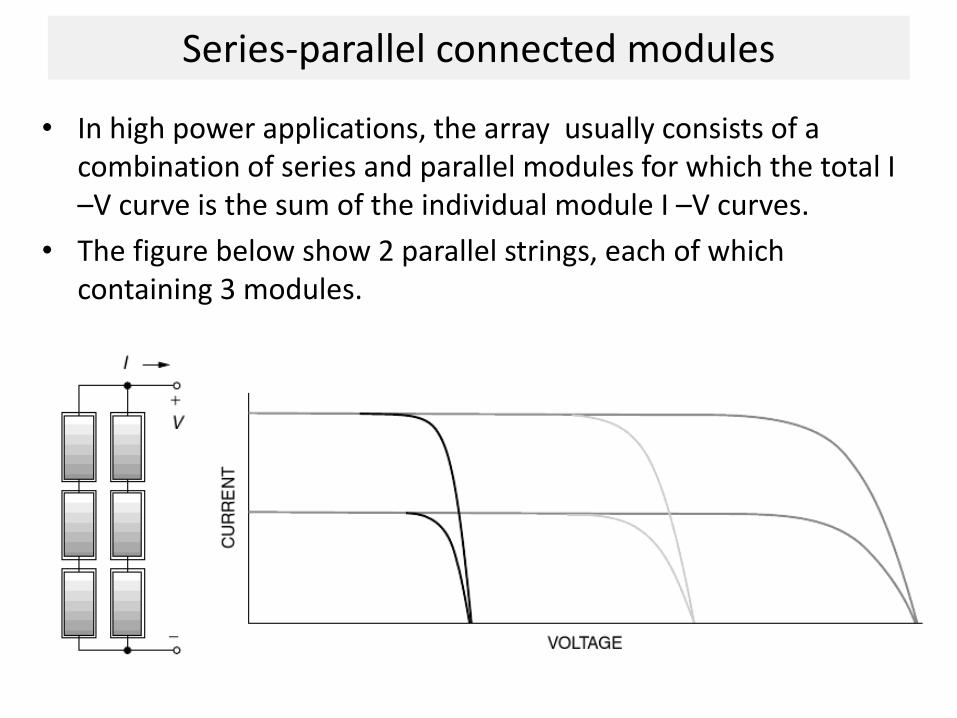
• In high power applications, the array usually consists of a combination of series and parallel modules for which the total I –V curve is the sum of the individual module I –V curves.
• The figure below show 2 parallel strings, each of which containing 3 modules.
I-V and P-V Curves
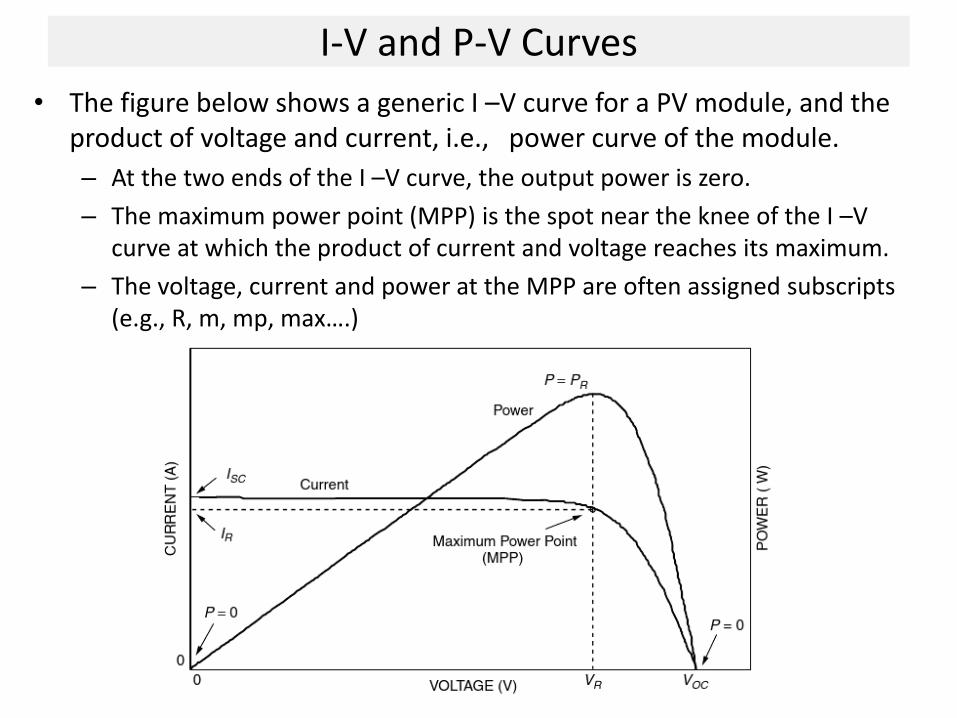
• The figure below shows a generic I –V curve for a PV module, and the product of voltage and current, i.e., power curve of the module.
– At the two ends of the I –V curve, the output power is zero.
– The maximum power point (MPP) is the spot near the knee of the I –V curve at which the product of current and voltage reaches its maximum.
– The voltage, current and power at the MPP are often assigned subscripts (e.g., R, m, mp, max….)
Fill Factor (FF)
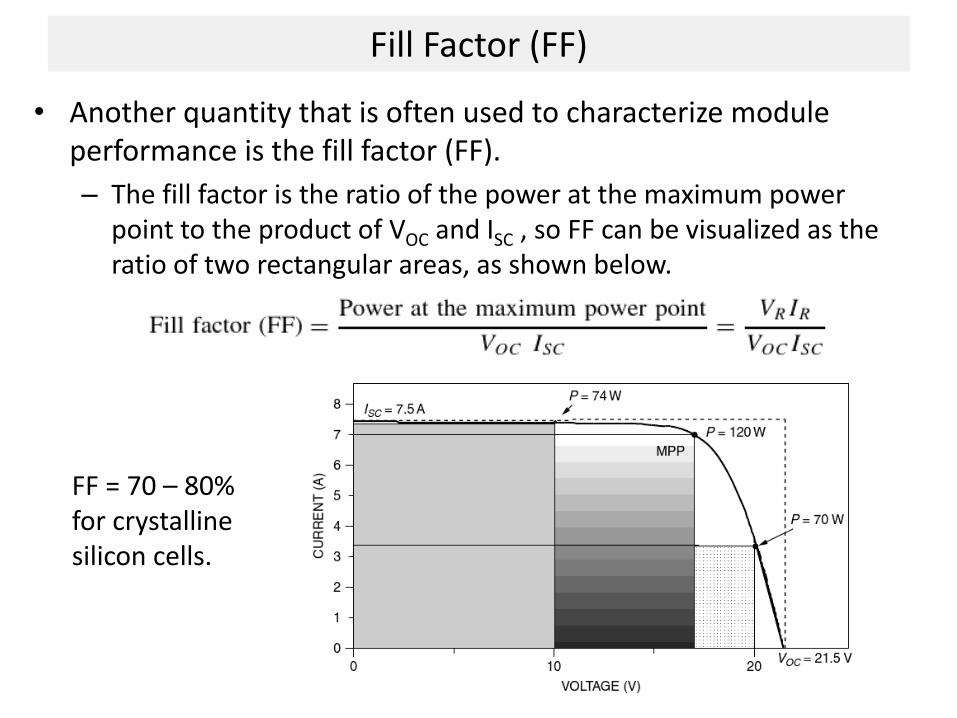
• Another quantity that is often used to characterize module performance is the fill factor (FF).
– The fill factor is the ratio of the power at the maximum power point to the product of VOC and ISC , so FF can be visualized as the ratio of two rectangular areas, as shown below.
FF = 70 – 80% for crystalline silicon cells.
Standard Test Condition (STC)
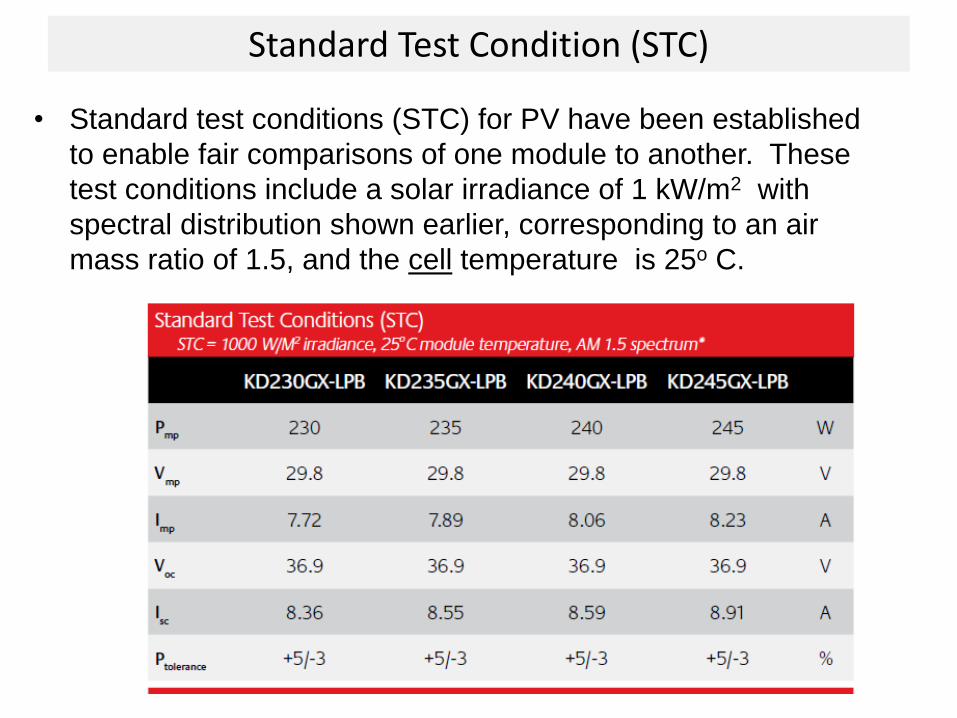
• Standard test conditions (STC) for PV have been established
to enable fair comparisons of one module to another. These
test conditions include a solar irradiance of 1 kW/m2 with
spectral distribution shown earlier, corresponding to an air
mass ratio of 1.5, and the cell temperature is 25o C.

Impact of irradiance
• Manufacturers often provide I –V curves that show how the
curves shift as insolation and cell temperature changes. – Notice as insolation drops, short-circuit current drops in direct
proportion.
– Decreasing insolation also reduces the open circuit voltage , but it
does so following a logarithmic relationship that results in relatively
modest changes.

Impact of temperature
• As the cell temperature increases, the open-circuit voltage
decreases substantially while the short-circuit current increases
only slightly → Photovoltaics perform better on cold than hot days. – For crystalline silicon cells, VOC drops by about 0.37% for each
degree Celsius increase in temperature, and ISC increases by
approximately 0.05%, resulting in a decrease in maximum power
available by about 0.5%/ C

Nominal Operating Cell Temperature (NOCT)
• The Nominal Operating Cell Temperature (NOCT) is defined as
the temperature reached by open circuited cells in a module
under the following conditions: solar irradiance = 800 W/m2 , air
temp. = 20°C ,wind speed = 1 m/s, mounting = open back side.

Power rating under NOCT (PVUSA)
• Approximate formula for calculating cell temperature:
where S is the solar irradiance (in kW).
• PV panels sold in the USA are required to post the panel rating under NOTC.
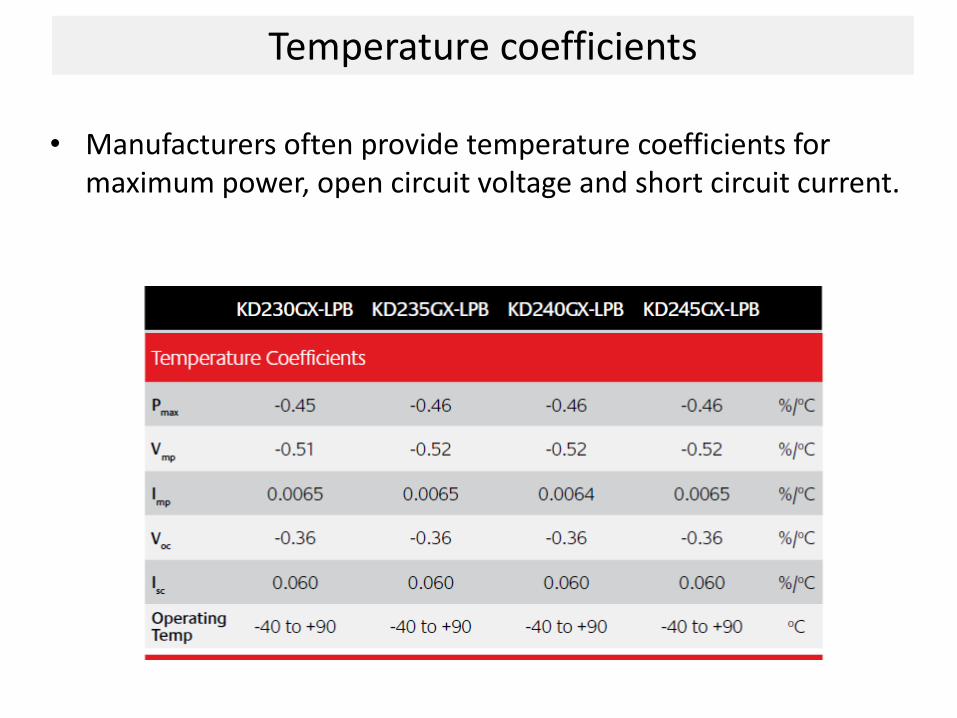
Temperature coefficients
• Manufacturers often provide temperature coefficients for maximum power, open circuit voltage and short circuit current.

Examples
• Estimate cell temperature, open-circuit voltage, and maximum power output for the KD230GX-LPB module under conditions of 1-sun insolation and ambient temperature 30oC. The module has a NOCT of 47oC.
Ans. Cell temperature = 64oC, maximum power = 189.6 W, open circuit voltage = 31.7 V.
Ans. a) T = 62.5oC, P = 81.25 W
b) T = 15.6oC, P = 52.35 W
c) T = 55oC, P = 68 W
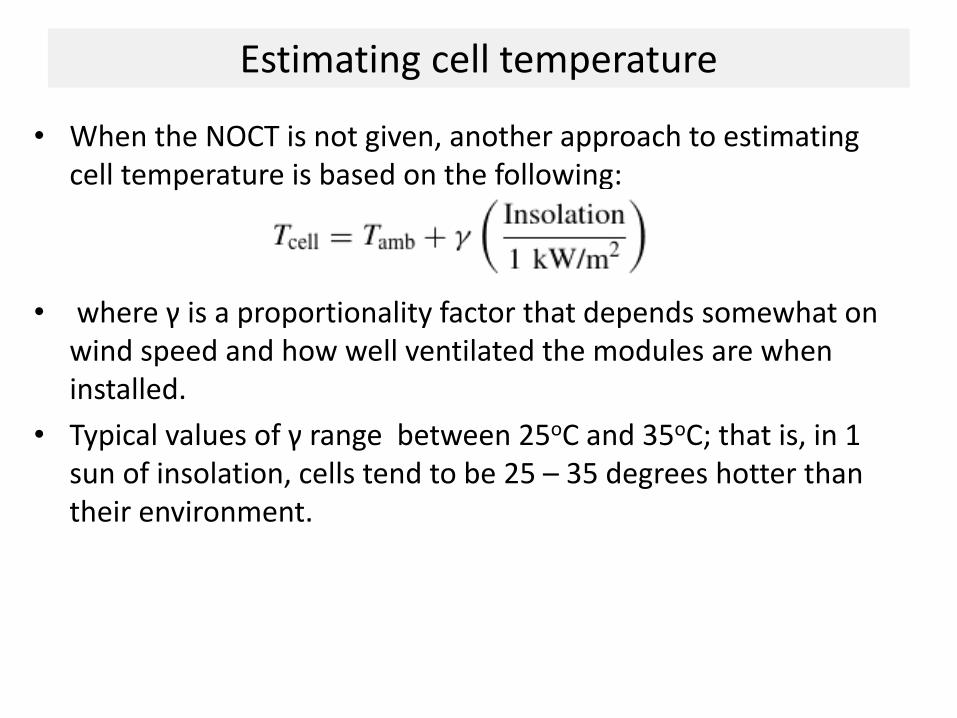
Estimating cell temperature
• When the NOCT is not given, another approach to estimating cell temperature is based on the following:
• where γ is a proportionality factor that depends somewhat on wind speed and how well ventilated the modules are when installed.
• Typical values of γ range between 25oC and 35oC; that is, in 1 sun of insolation, cells tend to be 25 – 35 degrees hotter than their environment.

Shading impacts
• The output of a PV module can be reduced dramatically when even when a small portion of it is shaded. – For example, when one solar cell is shaded while the remainder in the
module are not, some of the power being generated by the “sunny" solar cells can be dissipated by the “shaded” cell rather than powering the load.
– This in turn can lead to highly localized power dissipation and the resultant local heat may cause irreversible damage to the module.
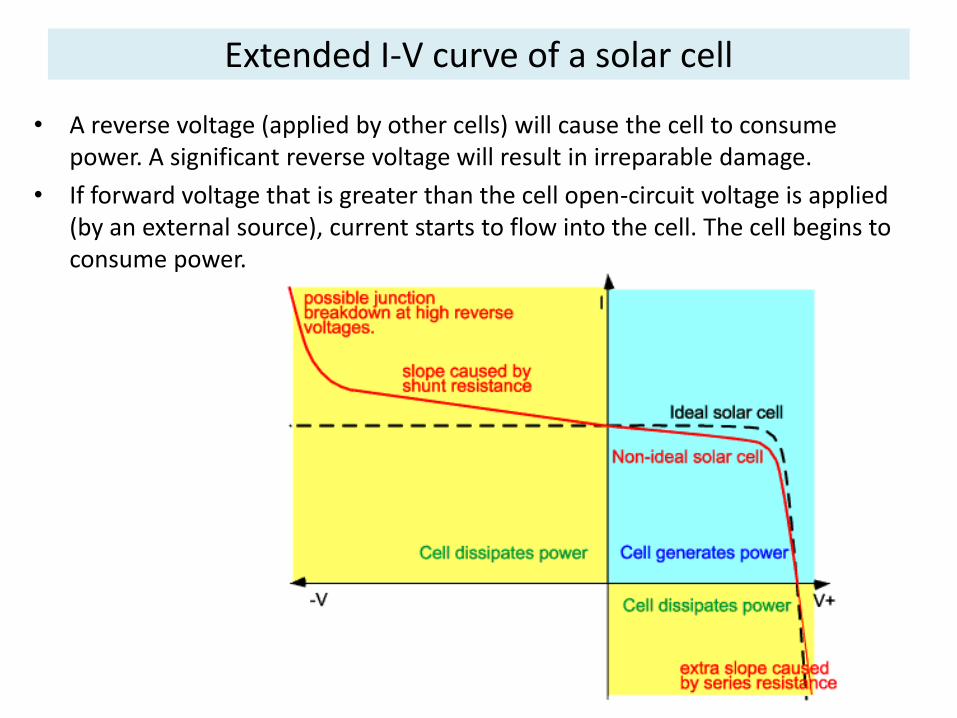
Extended I-V curve of a solar cell
• A reverse voltage (applied by other cells) will cause the cell to consume power. A significant reverse voltage will result in irreparable damage.
• If forward voltage that is greater than the cell open-circuit voltage is applied (by an external source), current starts to flow into the cell. The cell begins to consume power.
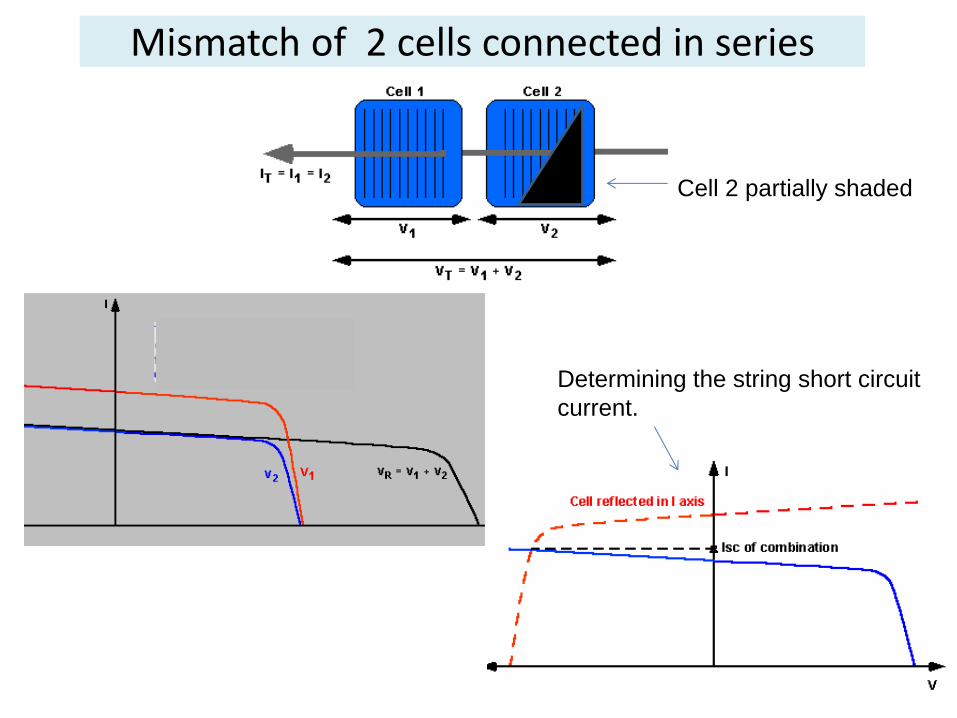
Mismatch of 2 cells connected in series
Cell 2 partially shaded
Determining the string short circuit
current.

Mismatch of 10 cells connected in series

Mismatch of n cells connected in series
• Consider a module with n cells connected in series, with all the cells in the sun.
• One cell is shown separated from the others. The module is operating at voltage V and current I.
• Voltage generated by (n-1) cells:
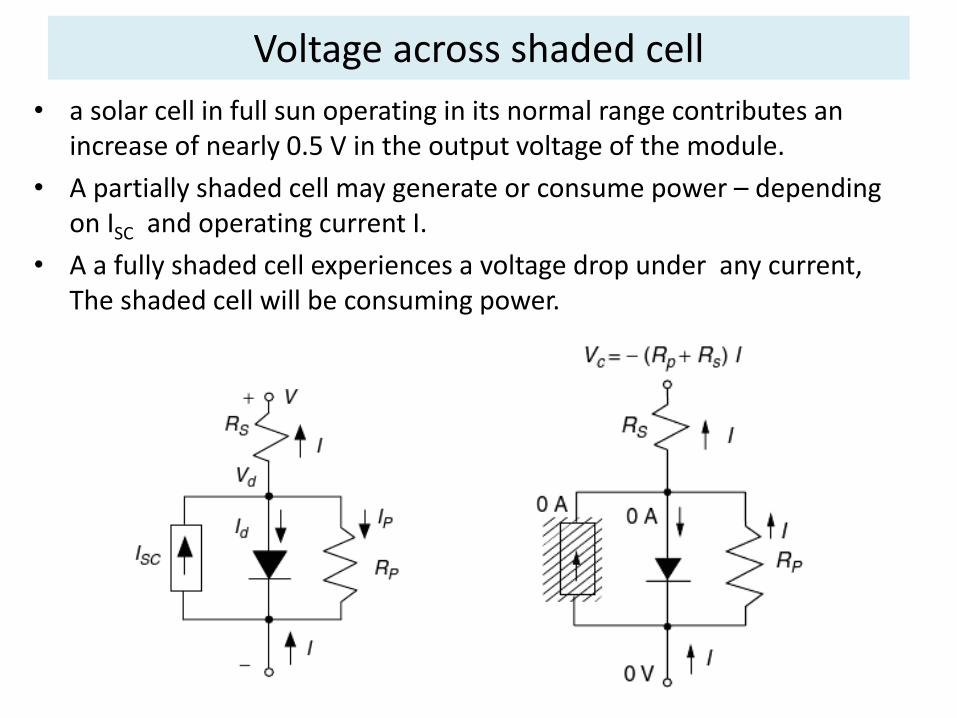
Voltage across shaded cell
• a solar cell in full sun operating in its normal range contributes an increase of nearly 0.5 V in the output voltage of the module.
• A partially shaded cell may generate or consume power – depending on ISC and operating current I.
• A a fully shaded cell experiences a voltage drop under any current, The shaded cell will be consuming power.
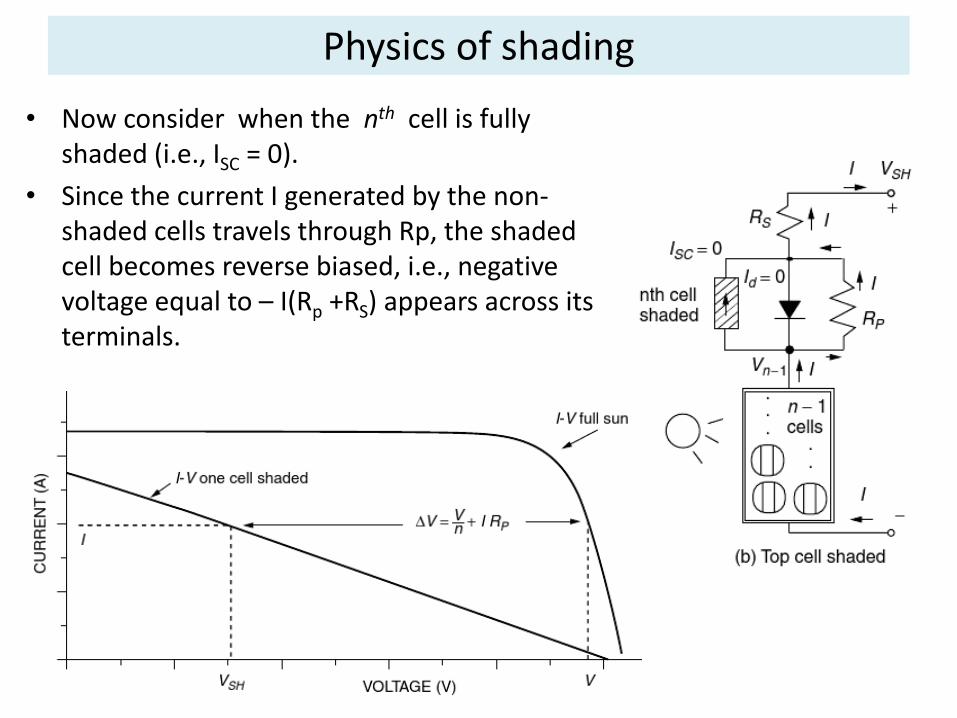
Physics of shading
• Now consider when the nth cell is fully shaded (i.e., ISC = 0).
• Since the current I generated by the non-shaded cells travels through Rp, the shaded cell becomes reverse biased, i.e., negative voltage equal to – I(Rp +RS) appears across its terminals.

Physics of shading
• The voltage of the module with one shaded cell:
• The drop in voltage caused by the shaded cell:
• See the new huge impact on the previous slide.

Shading example
• The 36-cell PV module described … has a parallel resistance per cell of RP = 6.6 Ω, ans series resistance RS = 0.005 Ω. Under full sun, and under some load, the current I = 2.14 A the output voltage V = 19.41 V. If one cell is fully shaded and this current somehow stays the same, then – What would be the new module output voltage and power?
– What would be the voltage drop across the shaded cell?
– How much power would be dissipated in the shaded cell?
• Ans: • (a) voltage drop = 14.66 V, new voltage = 4.75 V (compared to 19.41 V),
new power = 10.1 W (compared to 41.5 W),
• (b) voltage drop across shaded cell = 14.14 V,
• (c) power dissipated in the shaded cell = 30.2 W – this will likely cause permanent damage to the cell due to excessive heat!

Another Shading Example
19.5 V
3.9 A
1.5 A
12 V
Power delivered to battery: 18 W
Power consumed by shaded cell: 11.25 W
Note: This is not a good problem since on one hand, Rp is
assumed to be infinite, and on the other hand Rp = 5 Ω!

PV shading
• The figure below shows I-V curves (of module in the previous example) under full-sun conditions, with one cell 50% shaded, one cell completely shaded, and two cells completely shaded.
• The dashed vertical line (at 13 V) is a typical operating voltage for a module charging a 12-V battery. Note the large reduction in charging current caused by shading!

Bypass diodes
• External bypass diodes are purposely added by the PV manufacturer can help preserve the performance of PV modules.
– In a sunny cell, there is a voltage rise across the cell so the bypass diode is reverse biased— i.e., it acts as if it is not there.
– Under shade, however, the negative voltage will forward bias (i.e., turn on) the bypass diode, thus diverting the current flow.
– When conducting, the bypass diode drops about 0.6 V, thus placing a cap on the negative voltage across the cell.
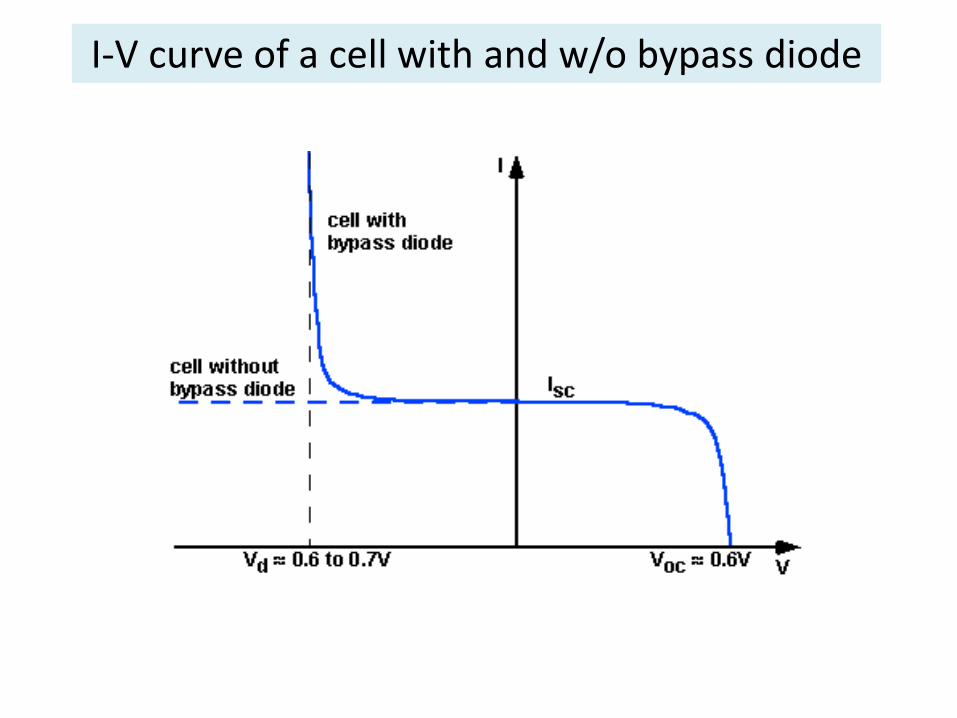
I-V curve of a cell with and w/o bypass diode
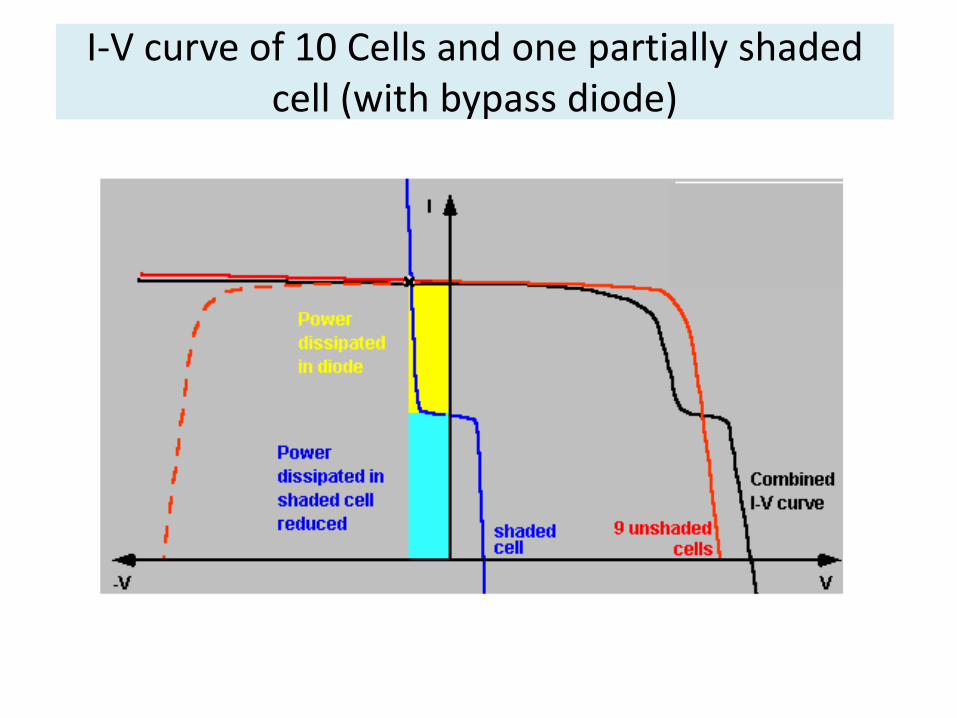
I-V curve of 10 Cells and one partially shaded cell (with bypass diode)

Bypass diode placement (real world)
• In practice, placing one bypass diode across each solar cell is too expensive and not easy to install. Instead, bypass diodes are conveniently placed across a group (or a string) of cells in the back of the panel. A typical number of cells in a string is 16 to 18.
Hidden
bypass
diodes
Visible
bypass
diodes
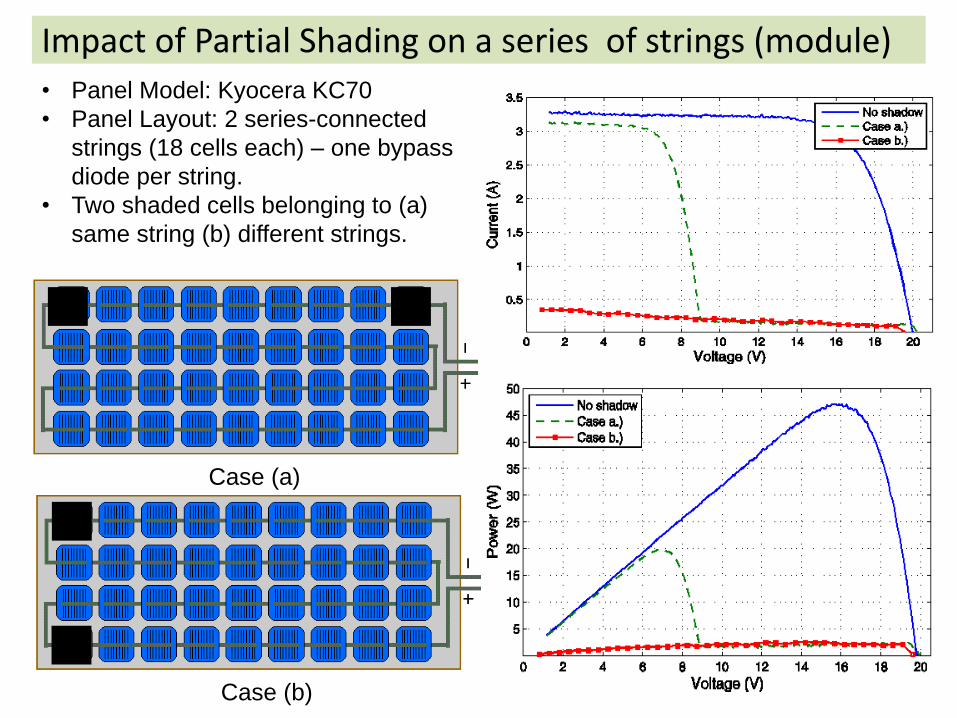
Impact of Partial Shading on a series of strings (module) • Panel Model: Kyocera KC70
• Panel Layout: 2 series-connected
strings (18 cells each) – one bypass
diode per string.
• Two shaded cells belonging to (a)
same string (b) different strings.
Case (a)
Case (b)
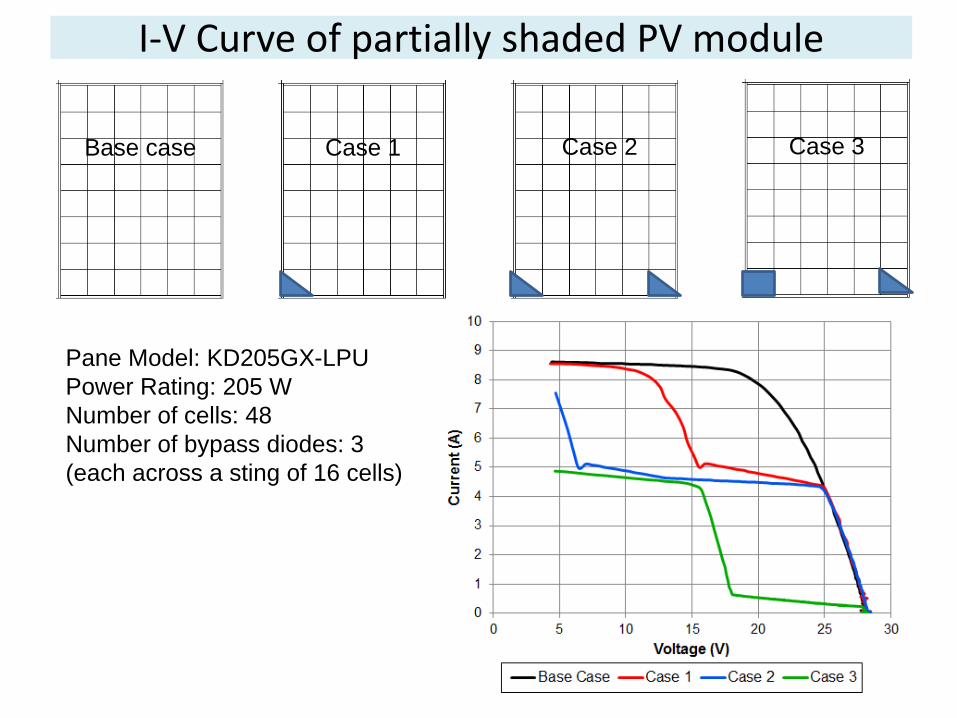
I-V Curve of partially shaded PV module
Base case Case 1 Case 2 Case 3
Pane Model: KD205GX-LPU
Power Rating: 205 W
Number of cells: 48
Number of bypass diodes: 3
(each across a sting of 16 cells)

Bypass diode effectiveness in PV array
• Cell characteristic: Isc = 4 A, Voc = 0.5 V • Sting Characteristic: Isc = 4 A, Voc = 8 V • Array Characteristic: Isc = 4 A, Voc = 48 V • Partially shaded string: receiving 25% of sunlight.
Array I-V curve with shade
and w/o bypass diode
Array I-V curve with
Shade and bypass diode
Array I-V curve
Without shade
I-V curve of shaded string
I-V curve of non-shaded string

Example
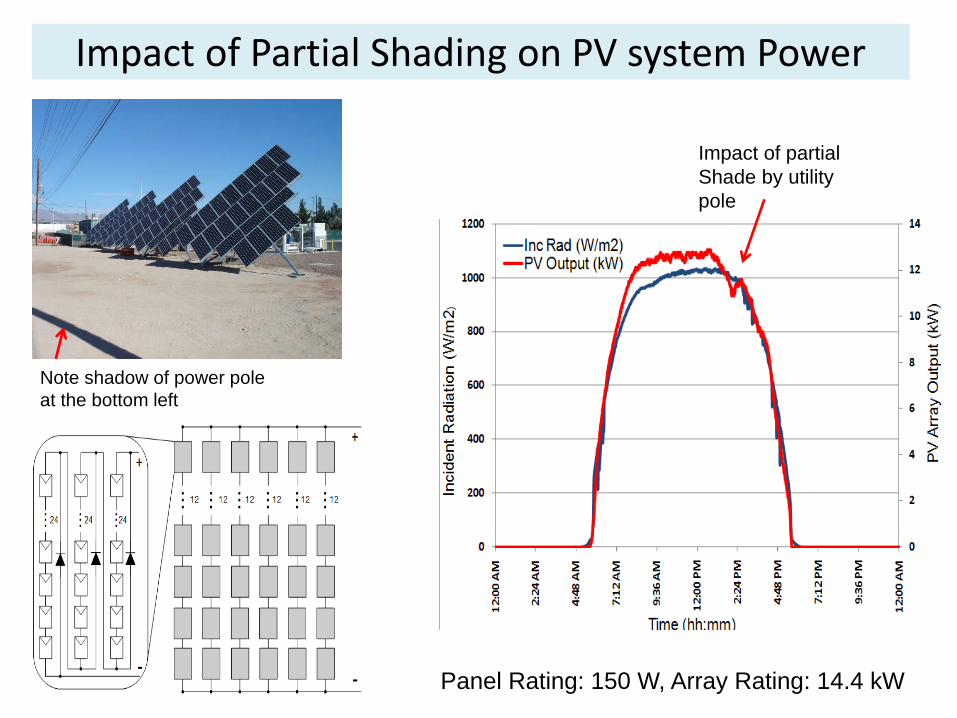
Impact of Partial Shading on PV system Power
Note shadow of power pole
at the bottom left
Impact of partial
Shade by utility
pole
Panel Rating: 150 W, Array Rating: 14.4 kW

Externally installed bypass diodes
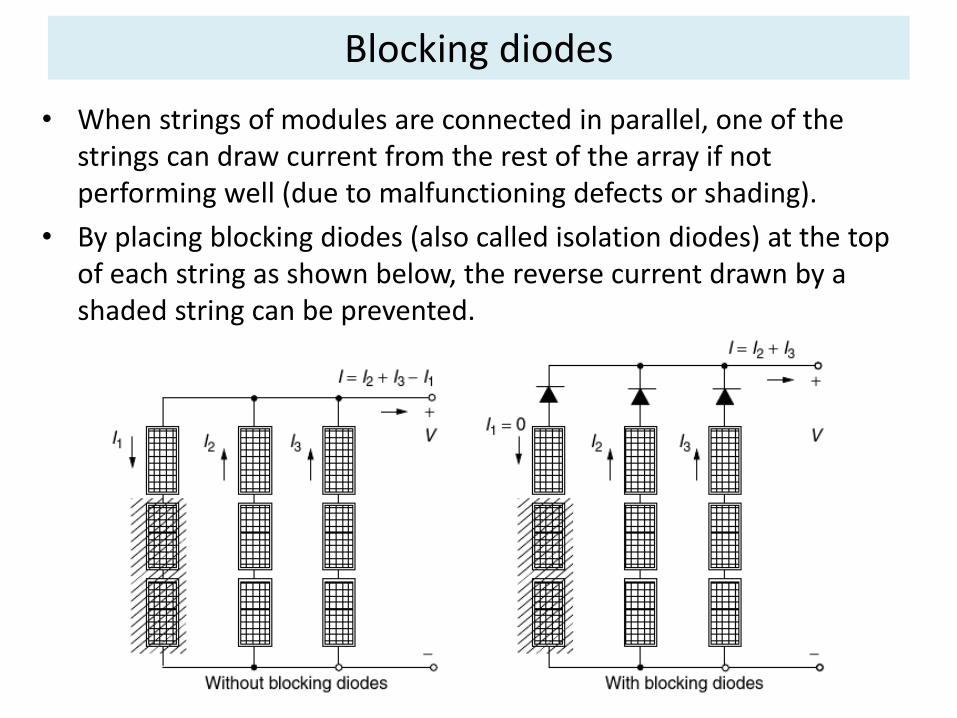
Blocking diodes
• When strings of modules are connected in parallel, one of the strings can draw current from the rest of the array if not performing well (due to malfunctioning defects or shading).
• By placing blocking diodes (also called isolation diodes) at the top of each string as shown below, the reverse current drawn by a shaded string can be prevented.