ee6404 measurements&instrumentation a … sem 4/ee6404... · ee6404...
TRANSCRIPT
EE6404 MEASUREMENTS&INSTRUMENTATION
SCE 1 Department of EEE
A Course Material on
Measurements and Instrumentation
By
Mr.N.Kannapiran
ASSISTANT PROFESSOR
DEPARTMENT OF ELECTRONICS AND COMMUNICATION ENGINEERING
SASURIE COLLEGE OF ENGINEERING
VIJAYAMANGALAM – 638 056

EE6404 MEASUREMENTS&INSTRUMENTATION
SCE 2 Department of EEE
QUALITY CERTIFICATE
This is to certify that the e-course material
Subject Code : EE 6404
Subject : Measurements and Instrumentation
Class : II Year EEE
being prepared by me and it meets the knowledge requirement of the university curriculum.
Signature of the Author
N.Kannapiran
ASSISTANT PROFESSOR
This is to certify that the course material being prepared by Mr.N.Kannapiran is of adequate
quality. He has referred more than five books among them minimum one is from abroad author.
Signature of HD
S.SRIRAM
ASSISTANT PROFESSOR
EE6404 MEASUREMENTS&INSTRUMENTATION
SCE 3 Department of EEE
S.NO CONTENTS PAGE NO
UNIT I INTRODUCTION
1.1 Functional elements of an instrument
1.2 Static and dynamic characteristics
1.3 Errors in measurement
1.4 Statistical evaluation of measurement data
1.5 Standards and calibration
UNIT II ELECTRICAL AND ELECTRONICS INSTRUMENTS
2.1 Principle and types of analog and digital voltmeters
2.2 Ammeters & Multimeters
2.3 Single and three phase wattmeters and energy meters
2.4 Instrument transformers
2.5 Magnetic measurements
2.6 Determination of B-H curve and measurements of
iron loss
UNIT III COMPARISON METHODS OF MEASUREMENTS
3.1 D.C & A.C potentiometers
3.2 D.C & A.C bridges
3.3 Transformer ratio bridges & Self-balancing bridges
3.4 Interference & screening
3.5 Electrostatic and electromagnetic interference
3.6 Grounding techniques
3.7 Multiple earth and earth loops
UNIT IV STORAGE AND DISPLAY DEVICES
4.1 Recorders
4.2 Magnetic disk and tape
4.3 Digital plotters and printers
4.4 CRT display
4.5 digital CRO
EE6404 MEASUREMENTS&INSTRUMENTATION
SCE 4 Department of EEE
4.6 Data Loggers
4.7 LED
4.8 LCD & dot matrix display
UNIT V TRANSDUCERS AND DATA ACQUISITION SYSTEMS
5.1 Classification of transducers
5.2 Selection of transducers
5.3 Resistive transducers
5.4 Capacitive transducers
5.5 Inductive transducers
5.6 Digital transducers
5.7 Piezoelectric transducers
5.8 Hall effect transducers
5.9 Elements of data acquisition system
5.10 A/D converters
5.11 D/A converters
5.12 Smart sensors
5.13 Optical transducers
A Question Bank
B University Questions
EE6404 MEASUREMENTS&INSTRUMENTATION
SCE 5 Department of EEE
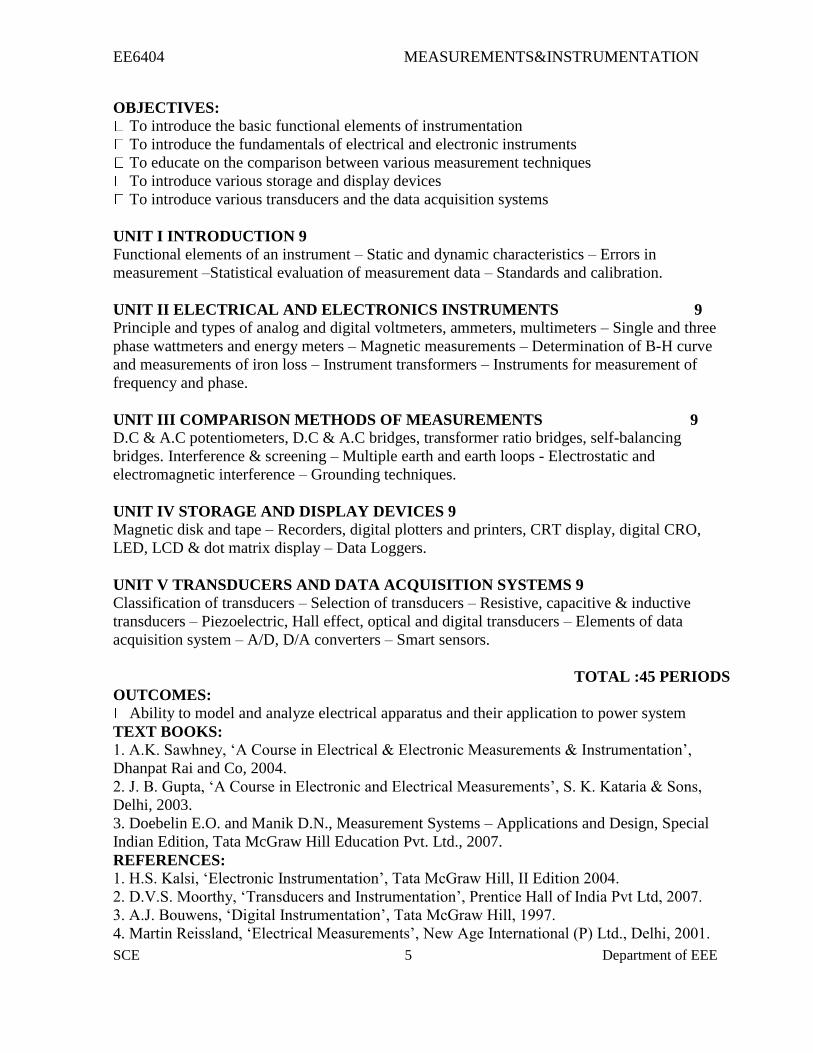
OBJECTIVES:
To introduce the basic functional elements of instrumentation
To introduce the fundamentals of electrical and electronic instruments
To educate on the comparison between various measurement techniques
To introduce various storage and display devices
To introduce various transducers and the data acquisition systems
UNIT I INTRODUCTION 9
Functional elements of an instrument – Static and dynamic characteristics – Errors in
measurement –Statistical evaluation of measurement data – Standards and calibration.
UNIT II ELECTRICAL AND ELECTRONICS INSTRUMENTS 9
Principle and types of analog and digital voltmeters, ammeters, multimeters – Single and three
phase wattmeters and energy meters – Magnetic measurements – Determination of B-H curve
and measurements of iron loss – Instrument transformers – Instruments for measurement of
frequency and phase.
UNIT III COMPARISON METHODS OF MEASUREMENTS 9
D.C & A.C potentiometers, D.C & A.C bridges, transformer ratio bridges, self-balancing
bridges. Interference & screening – Multiple earth and earth loops - Electrostatic and
electromagnetic interference – Grounding techniques.
UNIT IV STORAGE AND DISPLAY DEVICES 9
Magnetic disk and tape – Recorders, digital plotters and printers, CRT display, digital CRO,
LED, LCD & dot matrix display – Data Loggers.
UNIT V TRANSDUCERS AND DATA ACQUISITION SYSTEMS 9
Classification of transducers – Selection of transducers – Resistive, capacitive & inductive
transducers – Piezoelectric, Hall effect, optical and digital transducers – Elements of data
acquisition system – A/D, D/A converters – Smart sensors.
TOTAL :45 PERIODS
OUTCOMES:
Ability to model and analyze electrical apparatus and their application to power system
TEXT BOOKS:
1. A.K. Sawhney, ‘A Course in Electrical & Electronic Measurements & Instrumentation’,
Dhanpat Rai and Co, 2004.
2. J. B. Gupta, ‘A Course in Electronic and Electrical Measurements’, S. K. Kataria & Sons,
Delhi, 2003.
3. Doebelin E.O. and Manik D.N., Measurement Systems – Applications and Design, Special
Indian Edition, Tata McGraw Hill Education Pvt. Ltd., 2007.
REFERENCES:
1. H.S. Kalsi, ‘Electronic Instrumentation’, Tata McGraw Hill, II Edition 2004.
2. D.V.S. Moorthy, ‘Transducers and Instrumentation’, Prentice Hall of India Pvt Ltd, 2007.
3. A.J. Bouwens, ‘Digital Instrumentation’, Tata McGraw Hill, 1997.
4. Martin Reissland, ‘Electrical Measurements’, New Age International (P) Ltd., Delhi, 2001.
EE6404 MEASUREMENTS&INSTRUMENTATION
SCE 6 Department of EEE
UNIT I INTRODUCTION
MEASUREMENTS:
The measurement of a given quantity is essentially an act or the result of comparison
between the quantity (whose magnitude is unknown) & a predefined standard. Since two
quantities are compared, the result is expressed in numerical values.
BASIC REQUIREMENTS OF MEASUREMENT:
i) The standard used for comparison purposes must be accurately defined &
should be commonly accepted
ii) The apparatus used & the method adopted must be provable.
MEASURING INSTRUMENT:
It may be defi ned as a device for determining the value or magnitude of a quantity or
variable.
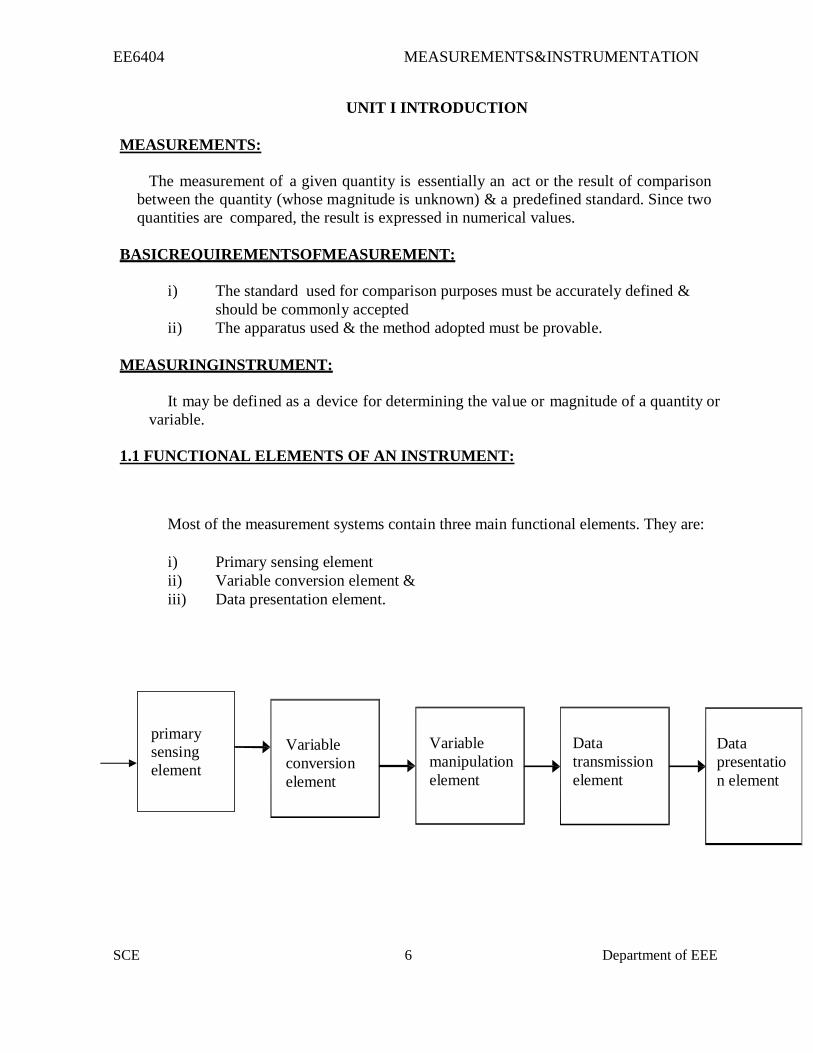
1.1 FUNCTIONAL ELEMENTS OF AN INSTRUMENT:
Most of the measurement systems contain three main functional elements. They are:
i) Primary sensing element
ii) Variable conversion element &
iii) Data presentation element.
primary
sensing
element
Variable
conversion
element
Variable
manipulation
element
Data
transmission
element
Data
presentatio
n element
EE6404 MEASUREMENTS&INSTRUMENTATION
SCE 7 Department of EEE
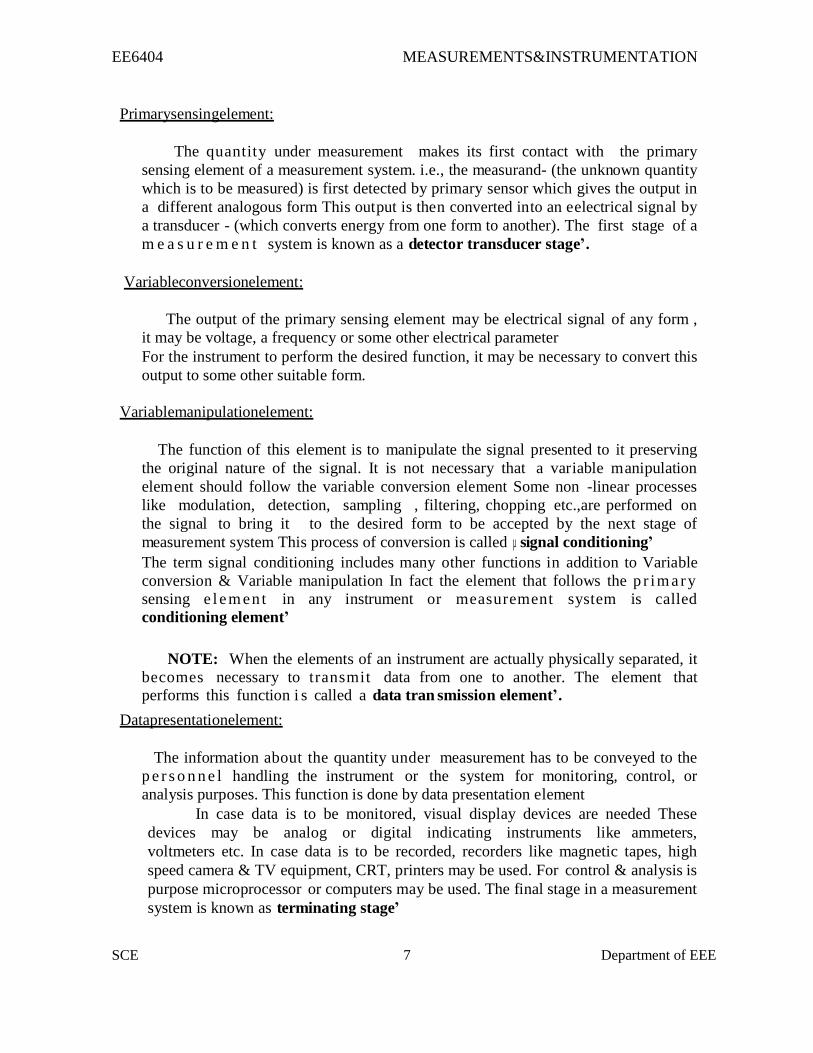
Primary sensing element:
The quantity under measurement makes its first contact with the primary
sensing element of a measurement system. i.e., the measurand- (the unknown quantity
which is to be measured) is first detected by primary sensor which gives the output in
a different analogous form This output is then converted into an e electrical signal by
a transducer - (which converts energy from one form to another). The first stage of a
m e a s u r e m e n t system is known as a detector transducer stage’.
Variable conversion element:
The output of the primary sensing element may be electrical signal of any form ,
it may be voltage, a frequency or some other electrical parameter
For the instrument to perform the desired function, it may be necessary to convert this
output to some other suitable form.
Variable manipulation element:
The function of this element is to manipulate the signal presented to it preserving
the original nature of the signal. It is not necessary that a variable manipulation
element should follow the variable conversion element Some non -linear processes
like modulation, detection, sampling , filtering, chopping etc.,are performed on
the signal to bring it to the desired form to be accepted by the next stage of
measurement system This process of conversion is called µ signal conditioning’
The term signal conditioning includes many other functions in addition to Variable
conversion & Variable manipulation In fact the element that follows the p r im a r y
sensing e l em en t in any instrument or measurement system is called
conditioning element’
NOTE: When the elements of an instrument are actually physically separated, it
becomes necessary to transmit data from one to another. The element that performs this function i s called a data tran smission element’.
Data presentation element:
The information about the quantity under measurement has to be conveyed to the
p e r s o n n e l handling the instrument or the system for monitoring, control, or
analysis purposes. This function is done by data presentation element
In case data is to be monitored, visual display devices are needed These
devices may be analog or digital indicating instruments like ammeters,
voltmeters etc. In case data is to be recorded, recorders like magnetic tapes, high
speed camera & TV equipment, CRT, printers may be used. For control & analysis is
purpose microprocessor or computers may be used. The final stage in a measurement
system is known as terminating stage’
EE6404 MEASUREMENTS&INSTRUMENTATION
SCE 8 Department of EEE
1.2 STATIC & DYNAMIC CHARACTERISTICS
The performance characteristics of an instrument are mainly divided into two
categories:
i) Static characteristics
ii) Dynamic characteristics Static characteristics:
The set of criteria defined for the instruments, which are used to measure the
quantities which are slowly varying with time or mostly constant, i.e., do not vary with time, is called ‘static characteristics’.
The various static characteristics are:
i) Accuracy
ii) Precision
iii) Sensitivity iv) Linearity
v) Reproducibility
vi) Repeatability
vii) Resolution
viii) Threshold
ix) Drift
x) Stability
xi) Tolerance xii) Range or span
EE6404 MEASUREMENTS&INSTRUMENTATION
SCE 9 Department of EEE
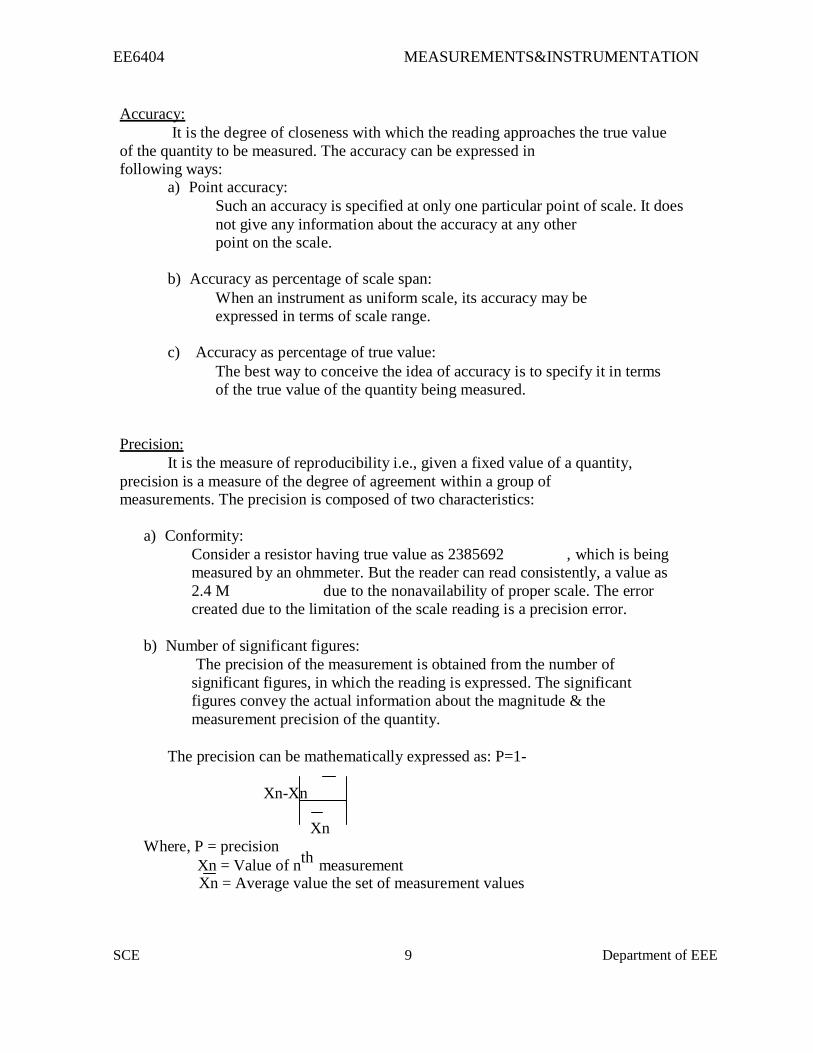
Accuracy:
It is the degree of closeness with which the reading approaches the true value
of the quantity to be measured. The accuracy can be expressed in
following ways: a) Point accuracy:
Such an accuracy is specified at only one particular point of scale. It does
not give any information about the accuracy at any other
point on the scale.
b) Accuracy as percentage of scale span:
When an instrument as uniform scale, its accuracy may be
expressed in terms of scale range.
c) Accuracy as percentage of true value:
The best way to conceive the idea of accuracy is to specify it in terms
of the true value of the quantity being measured. Precision:
It is the measure of reproducibility i.e., given a fixed value of a quantity,
precision is a measure of the degree of agreement within a group of measurements. The precision is composed of two characteristics:
a) Conformity:
Consider a resistor having true value as 2385692 , which is being
measured by an ohmmeter. But the reader can read consistently, a value as
2.4 M due to the nonavailability of proper scale. The error
created due to the limitation of the scale reading is a precision error.
b) Number of significant figures:
The precision of the measurement is obtained from the number of
significant figures, in which the reading is expressed. The significant
figures convey the actual information about the magnitude & the
measurement precision of the quantity.
The precision can be mathematically expressed as: P=1-
Xn-Xn
Xn Where, P = precision
Xn = Value of nth
measurement
Xn = Average value the set of measurement values
EE6404 MEASUREMENTS&INSTRUMENTATION
SCE 10 Department of
EEE
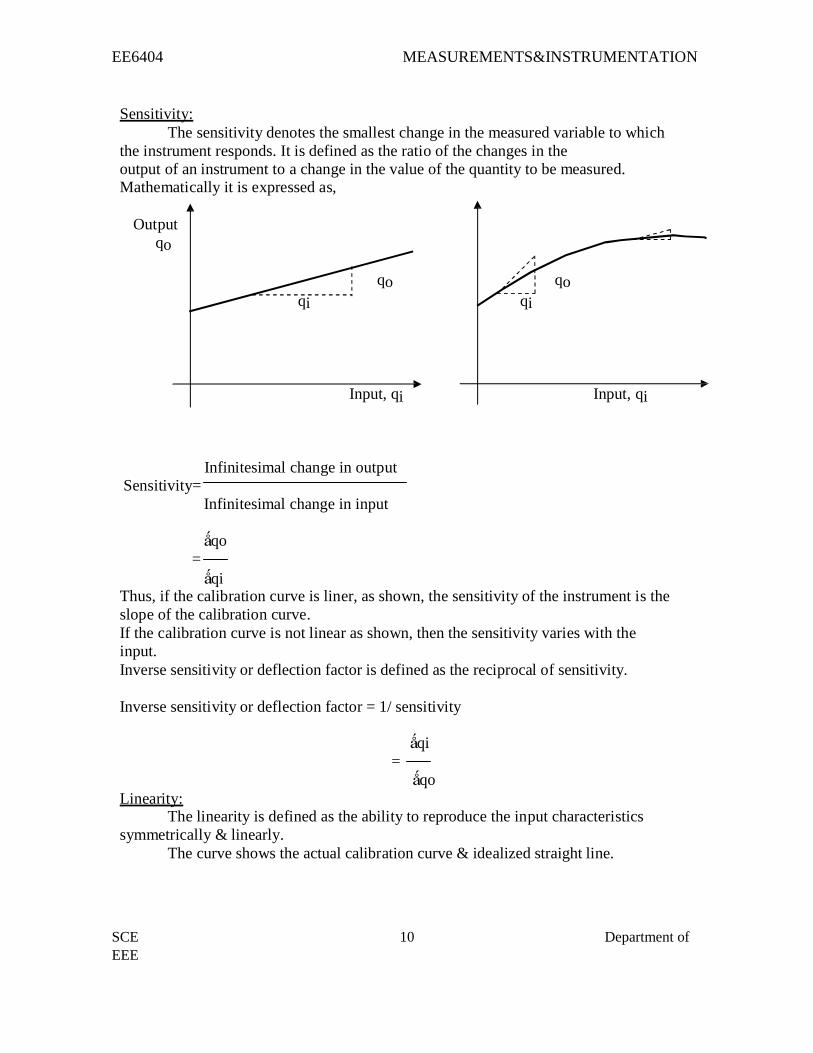
Sensitivity:
The sensitivity denotes the smallest change in the measured variable to which
the instrument responds. It is defined as the ratio of the changes in the
output of an instrument to a change in the value of the quantity to be measured. Mathematically it is expressed as,
Output
qo
qo qo
qi qi
Input, qi Input, qi
Sensitivity=
=
Infinitesimal change in output
Infinitesimal change in input
ǻqo
ǻqi
Thus, if the calibration curve is liner, as shown, the sensitivity of the instrument is the
slope of the calibration curve.
If the calibration curve is not linear as shown, then the sensitivity varies with the
input.
Inverse sensitivity or deflection factor is defined as the reciprocal of sensitivity.
Inverse sensitivity or deflection factor = 1/ sensitivity
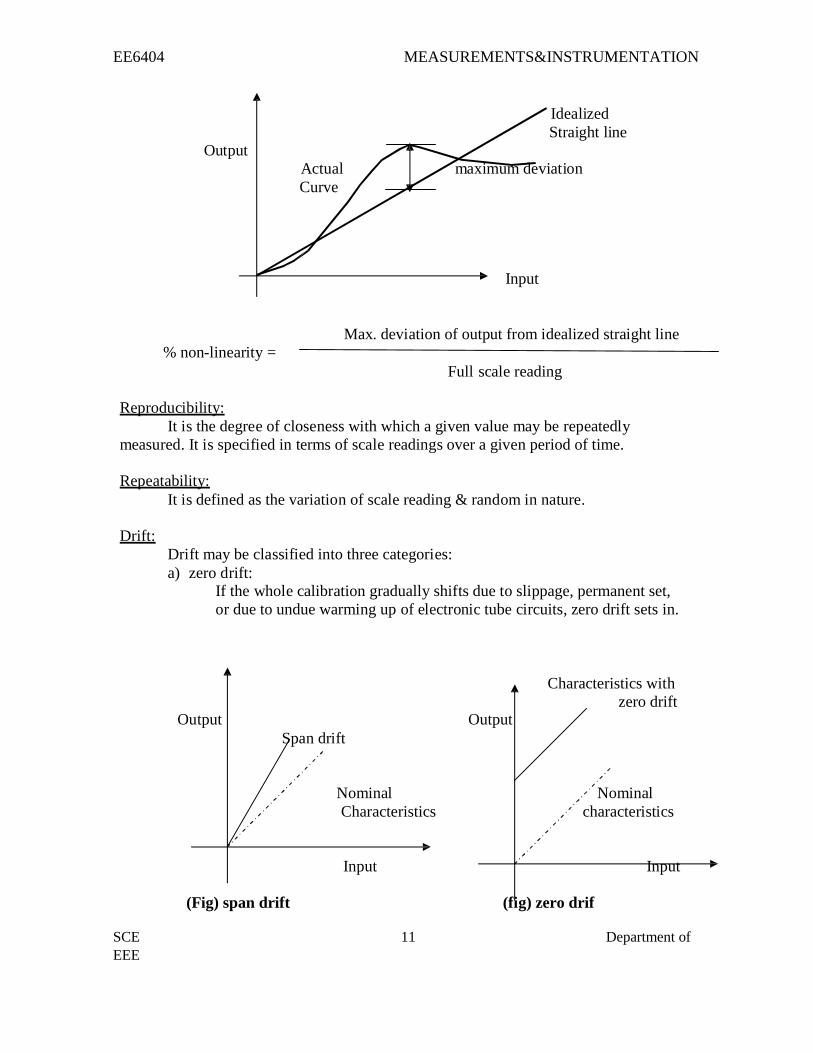
Linearity:
ǻqi
=
ǻqo
The linearity is defined as the ability to reproduce the input characteristics
symmetrically & linearly.
The curve shows the actual calibration curve & idealized straight line.
EE6404 MEASUREMENTS&INSTRUMENTATION
SCE 11 Department of
EEE
Output
% non-linearity =
Idealized
Straight line
Actual maximum deviation
Curve
Input
Max. deviation of output from idealized straight line
Full scale reading
Reproducibility:
It is the degree of closeness with which a given value may be repeatedly
measured. It is specified in terms of scale readings over a given period of time.
Repeatability:
It is defined as the variation of scale reading & random in nature.
Drift: Drift may be classified into three categories:
a) zero drift: If the whole calibration gradually shifts due to slippage, permanent set,
or due to undue warming up of electronic tube circuits, zero drift sets in.
Output Output
Span drift
Characteristics with
zero drift
Nominal Nominal
Characteristics characteristics
Input Input
(Fig) span drift (fig) zero drif
EE6404 MEASUREMENTS&INSTRUMENTATION
SCE 12 Department of EEE
b) span drift or sensitivity drift
If there is proportional change in the indication all along the upward scale, the
drifts is called span drift or sensitivity drift.
c) Zonal drift:
In case the drift occurs only a portion of span of an instrument, it is called zonal
drift.
Resolution:
If the input is slowly increased from some arbitrary input value, it will again be found that
output does not change at all until a certain increment is exceeded. This increment is called resolution.
Threshold:
If the instrument input is increased very gradually from zero there will be some minimum
value below which no output change can be detected. This
minimum value defines the threshold of the instrument.
Stability:
It is the ability of an instrument to retain its performance throughout is specified operating
life.
Tolerance:
The maximum allowable error in the measurement is specified in terms of some value which is
called tolerance.
Range or span:
The minimum & maximum values of a quantity for which an instrument is designed to
measure is called its range or span. Dynamic characteristics:
The set of criteria defined for the instruments, which are changes rapidly with time, is called
‘dynamic characteristics’.
The various static characteristics are:
i) Speed of response ii) Measuring
lag
iii) Fidelity iv) Dynamic error
Speed of response:
It is defined as the rapidity with which a measurement system responds to changes in the
measured quantity.
EE6404 MEASUREMENTS&INSTRUMENTATION
SCE 13 Department of EEE
Measuring lag:
It is the retardation or delay in the response of a measurement system to changes in the
measured quantity. The measuring lags are of two types:
a) Retardation type:
In this case the response of the measurement system begins immediately after the
change in measured quantity has occurred.
b) Time delay lag:
In this case the response of the measurement system begins after a dead time after the
application of the input.
Fidelity:
It is defined as the degree to which a measurement system indicates changes in the
measurand quantity without dynamic error.
Dynamic error:
It is the difference between the true value of the quantity changing with time & the value
indicated by the measurement system if no static error is assumed. It is also called measurement
error.
1.3 ERRORS IN MEASUREMENT
The types of errors are follows
i) Gross errors
ii) Systematic errors
iii) Random errors
Gross Errors:
The gross errors mainly occur due to carelessness or lack of experience of a human
begin
These errors also occur due to incorrect adjustments of instruments
These errors cannot be treated mathematically
These errors are also called¶ personal errors’.
Ways to minimize gross errors:
The complete elimination of g r o s s errors is not possible but one c a n minimize them by
the following ways:
Taking great care while taking the reading, recording the read ing &
calculating the result
Without depending on only one reading, at least three or more readings must be taken *
preferably by different persons.
EE6404 MEASUREMENTS&INSTRUMENTATION
SCE 14 Department of EEE
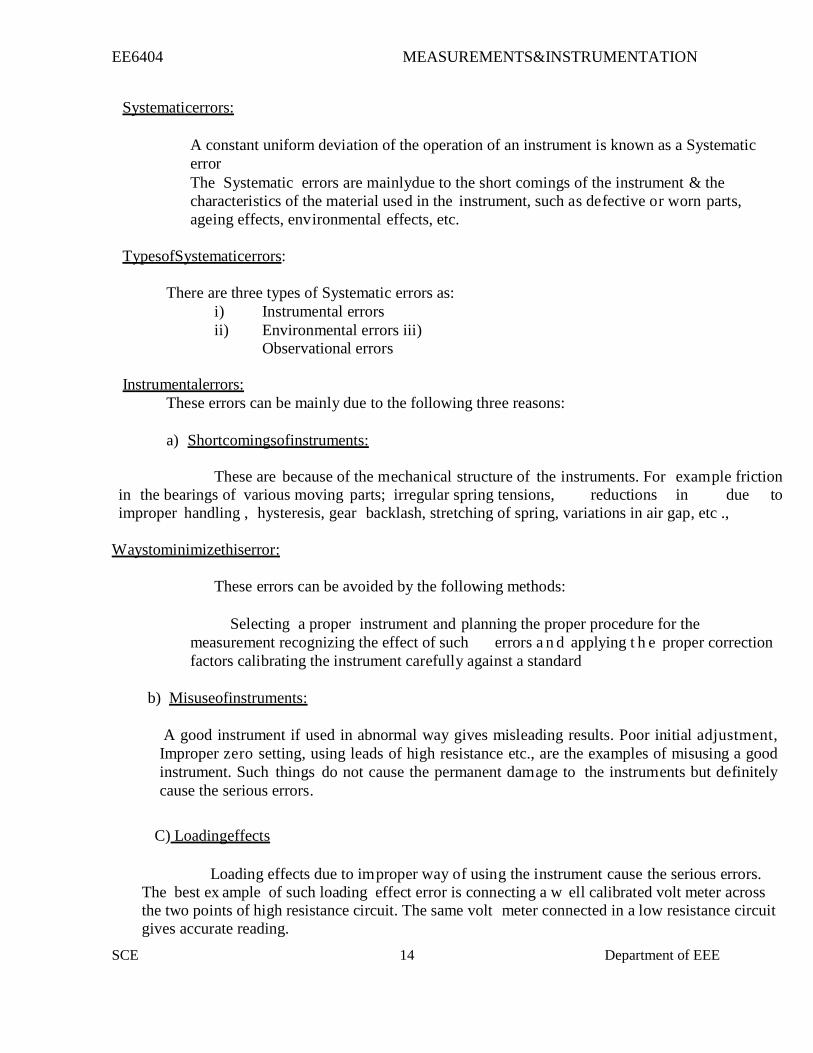
Systematic errors:
A constant uniform deviation of the operation of an instrument is known as a Systematic
error
The Systematic errors are mainlydue to the short comings of the instrument & the
characteristics of the material use d in the instrument, such a s defective or worn parts,
ageing effects, env ironmental effects, etc.
Types of Systematic errors:
There are three types of Systematic errors as:
i) Instrumental errors
ii) Environmental errors iii)
Observational errors
Instrumental errors:
These errors can be mainly due to the following three reasons:
a) Short comings of instruments:
These are because of the mechanical structure of the instruments. For example friction
in the bearings of various moving parts; irregular spring tensions, reductions in due to
improper handling , hysteresis, gear backlash, stretching of spring, variations in air gap, etc .,
Ways to minimize this error:
These errors can be avoided by the following methods:
Selecting a proper instrument and planning the proper procedure for the
measurement recognizing the effect of such errors a n d applying t h e proper correction
factors calibrating the instrument carefully against a standard
b) Misuse of instruments:
A good instrument if used in abnormal way gives misleading results. Poor initial adjustment,
Improper zero setting, using leads of high resistance etc., are the examples of misusing a good
instrument. Such things do not cause the permanent damage to the instruments but definitely
cause the serious errors.
C) Loading effects
Loading effects due to im proper way of using the instrument cause the serious errors.
The best ex ample of such loading effect error is connecting a w ell calibrated volt meter across
the two points of high resistance circuit. The same volt meter connected in a low resistance circuit
gives accurate reading.
EE6404 MEASUREMENTS&INSTRUMENTATION
SCE 15 Department of EEE
Ways to minimize this error:
Thus the err ors due to the loading effect can be avoided by using an instrument
intelligently and correctly.
Environmental errors:
These errors are due to the conditions external to the measuring instrument. The various
factors resulting these environmental errors are temperature changes, pressure changes, thermal
emf, ageing of equipment and frequency sensitivity of an instrument.
Ways to minimize this error:
The various methods which can be used to reduce these errors are:
i) Using the proper correction factors and using the information supplied by the
manufacturer of the instrument
ii) Using the arrangement which will keep the surrounding conditions
Constant
iii) Reducing the effect of dust ,humidity on the components by hermetically sealing the
components in the instruments
iv) The effects of external f i e l d s can be minimized by using the magnetic or electro static shields or screens
v) Using the equipment which is immune to such environmental effects.
Observational errors:
These are the errors introduced by the observer.
These are many sources of observational errors such as parallax error while reading a
meter, wrong scale selection, etc.
Ways to minimize this error
To eliminate such errors one should use the instruments with mirrors, knife edged
pointers, etc.,
The systematic errors can be subdivided as static and dynamic errors. The static errors are
caused by the limitations of the measuring device while the dynamic errors are caused by t h e
instrument not responding fast enough to follow the changes in the variable to be measured.
Random errors:
Some errors still result, though the systematic and instrumental errors are reduced or
atleast accounted for.The causes of such errors are unknown and hence the errors are called
random errors.
EE6404 MEASUREMENTS&INSTRUMENTATION
SCE 16 Department of EEE
Ways to minimize this error
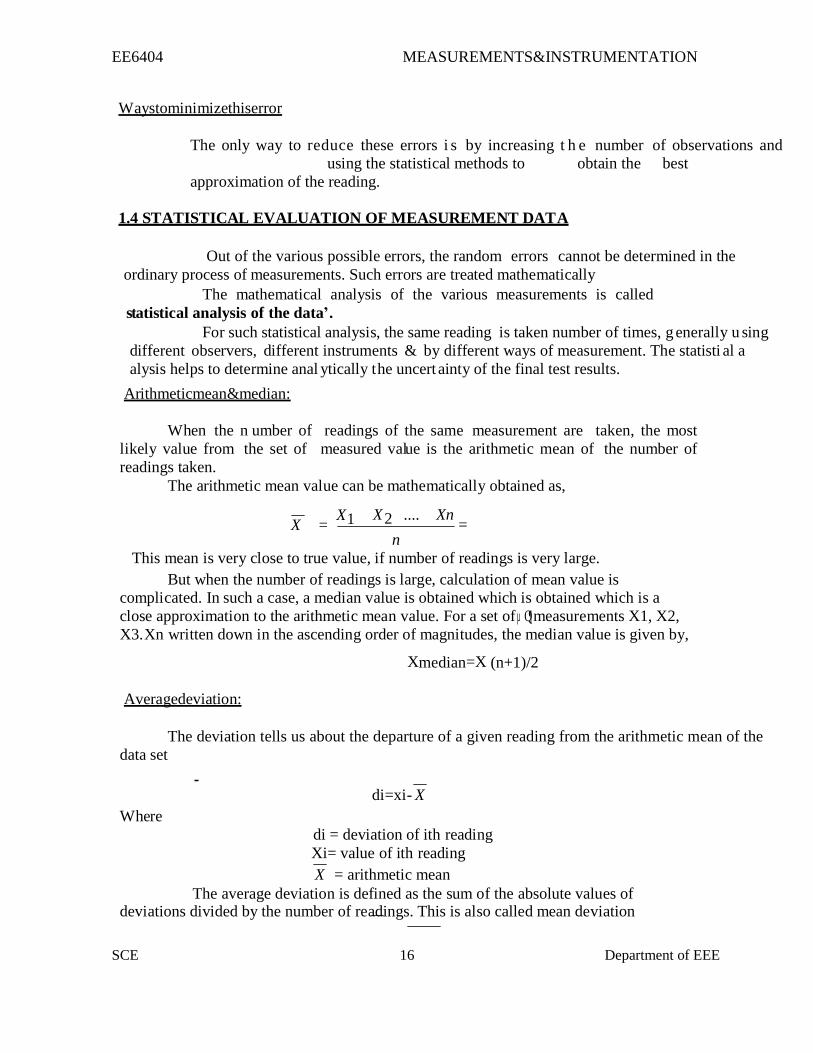
The only way to reduce these errors i s by increasing t h e number of observations and
using the statistical methods to obtain the best
approximation of the reading.
1.4 STATISTICAL EVALUATION OF MEASUREMENT DATA
Out of the various possible errors, the random errors cannot be determined in the
ordinary process of measurements. Such errors are treated mathematically
The mathematical analysis of the various measurements is called
statistical analysis of the data’.
For such statistical analysis, the same reading is taken number of times, g enerally u sing
different observers, different instruments & by different ways of measurement. The statisti al a
alysis helps to determine anal ytically t he uncert ainty of the final test results.
Arithmetic mean & median:
When the n umber of readings of the same measurement are taken, the most
likely value from the set of measured value is the arithmetic mean of the number of
readings taken.
The arithmetic mean value can be mathematically obtained as,
X = X1
X 2 ....
n
Xn
=
This mean is very close to true value, if number of readings is very large.
But when the number of readings is large, calculation of mean value is
complicated. In such a case, a median value is obtained which is obtained which is a
close approximation to the arithmetic mean value. For a set of µ Q¶ measurements X1, X2,
X3.Xn written down in the ascending order of magnitudes, the median value is given by,
Xmedian=X (n+1)/2
Average deviation:
The deviation tells us about the departure of a given reading from the arithmetic mean of the
data set Where
di=xi- X
di = deviation of ith reading
Xi= value of ith reading
X = arithmetic mean
The average deviation is defined as the sum of the absolute values of
deviations divided by the number of readings. This is also called mean deviation

EE6404 MEASUREMENTS&INSTRUMENTATION
SCE 17 Department of EEE
1.5 STANDARD & CALIBRATION
CALIBRATION
Calibration is the process of making an adjustment or marking a scale so that the
readings of an instrument agree with the accepted & the certified standard.
In other words, it is the procedure for determining the correct values of measurand by
comparison with the measured or standard ones.
The calibration offers a guarantee to the device or instrument that it is operating with
required accuracy, under stipulated environmental conditions.
The calibration procedure involves the steps like visual inspection for various defects,
installation according to the specifications, zero adjustment etc.,
The calibration is the procedure for determining the correct values of measurand by
comparison with standard ones. The standard of device with which comparison is made is called a
standard instrument. The instrument which is unknown & is to be calibrated is called test
instrument. Thus in calibration, test instrument is compared with standard instrument.
Types of calibration methodologies:
There are two methodologies for obtaining the comparison between test instrument &
standard instrument. These methodologies are
i) Direct comparisons
ii) Indirect comparisons
Direct comparisons:
In a direct comparison, a source or generator applies a known input to the meter under test.
The ratio of what meter is indicating & the known generator values gives the meter¶ s error.
In such case the meter is the test instrument while the generator is the standard instrument.
The deviation of meter from the standard value is compared with the allowable
performance limit.
With the help of direct comparison a generator or source also can be calibrated.
EE6404 MEASUREMENTS&INSTRUMENTATION
SCE 18 Department of
EEE
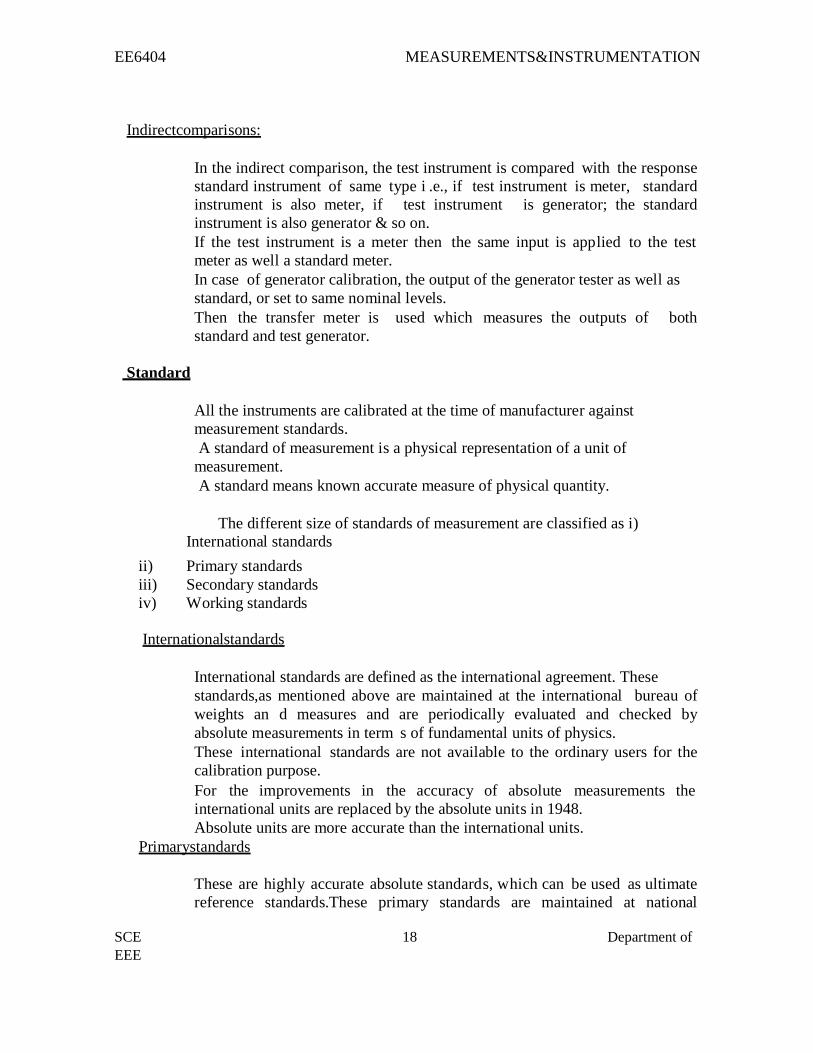
Indirect comparisons:
In the indirect comparison, the test instrument is compared with the response
standard instrument of same type i .e., if test instrument is meter, standard
instrument is also meter, if test instrument is generator; the standard
instrument is also generator & so on.
If the test instrument is a meter then the same input is applied to the test
meter as well a standard meter.
In case of generator calibration, the output of the generator tester as well as
standard, or set to same nominal levels.
Then the transfer meter is used which measures the outputs of both
standard and test generator.
Standard
All the instruments are calibrated at the time of manufacturer against
measurement standards.
A standard of measurement is a physical representation of a unit of
measurement.
A standard means known accurate measure of physical quantity.
The different size of standards of measurement are classified as i)
International standards
ii) Primary standards
iii) Secondary standards
iv) Working standards
International standards
International standards are defined as the international agreement. These
standards,as mentioned above are maintained at the international bureau of
weights an d measures and are periodically evaluated and checked by
absolute measurements in term s of fundamental units of physics.
These international standards are not available to the ordinary users for the
calibration purpose.
For the improvements in the accuracy of absolute measurements the
international units are replaced by the absolute units in 1948.
Absolute units are more accurate than the international units.
Primary standards
These are highly accurate absolute standards, w hich can be used as ultimate
reference standards.These primary standards are maintained at national
EE6404 MEASUREMENTS&INSTRUMENTATION
SCE 19 Department of
EEE
standard laboratories in different countries.
These standards representing fundamental units as well as some electrical
and mechanical derived units are calibrated independently by absolute
measurements at each of the national laboratories.
These are not available for use, outside the national laboratories.
The main function of the primary standards is the calibration and
verification of secondary standards.
Secondary standards
As mentioned above, the primary standards are not ava ilable for use outside
the national laboratories.
The various industries need some reference standards. So, to protect highly
a c c u r a t e p r i m a r y s t a n d a r d s t h e secondary s t a n d a r d s are
maintained, which are designed and constructed from the absolute standards.
These are used by the measurement and calibration laboratories in
industries and are maintained by the particular industry to which they
belong. Each industry has its own standards.
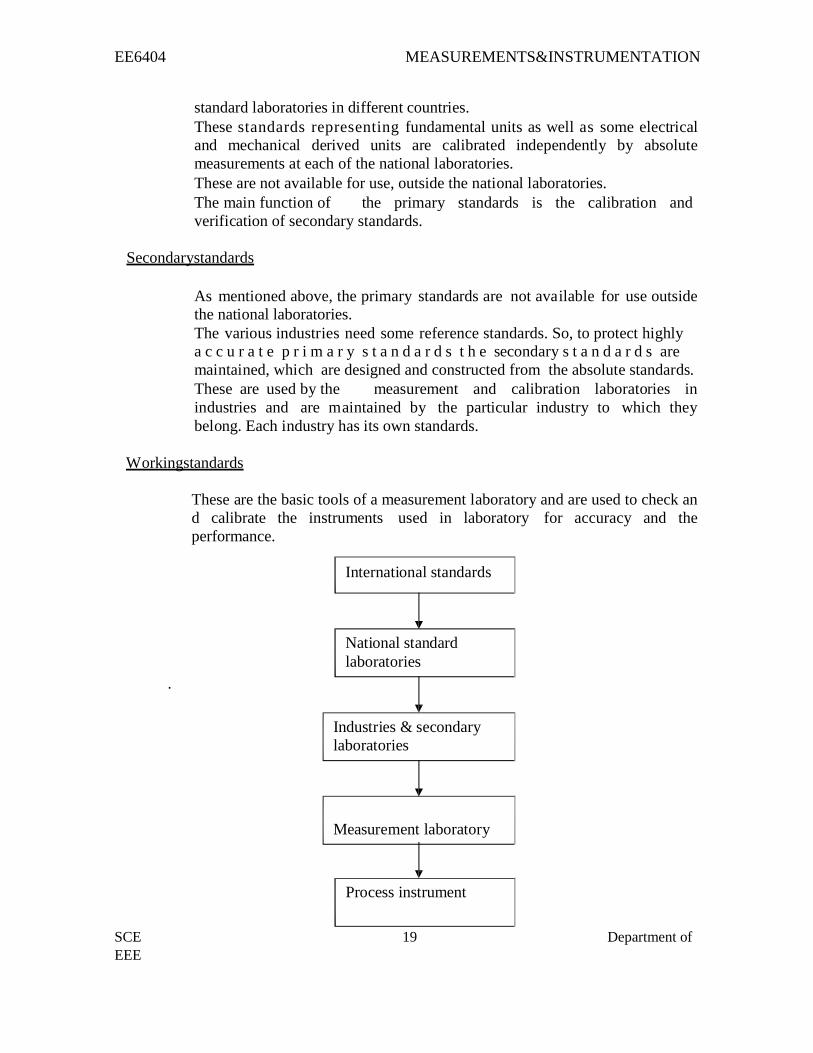
Working standards
These are the basic tools of a measurement laboratory and are used to check an
d calibrate the instruments used in laboratory for accuracy and the
performance.
International standards
National standard
laboratories
.
Industries & secondary
laboratories
Measurement laboratory
Process instrument
EE6404 MEASUREMENTS&INSTRUMENTATION
SCE 20 Dept.of EEE
UNIT II ELECTRICAL AND ELECTRONICS INSTRUMENTS
2.1 Principle And Types Of Analog And Digital Voltmeters
Ø Basically an electrical indicating instrument is divided into two types. They are i)
Analog instruments ii) Digital Instruments.
Ø Analog instruments are nothing but its output is the deflection of pointer, which is proportional to its input.
Ø Digital Instruments are its output is in decimal form.
Ø Analog ammeters and voltmeters are classed together as there are no fundamental
differences in their operating principles.
Ø The action of all ammeters and voltmeters, with the exception of electrostatic
type of instruments, depends upon a deflecting torque produced by an electric current.
Ø In an ammeter this torque is produced by a current to be measured or by a definite fraction of it.
Ø In a voltmeter this torque is produced by a current which is proportional to the voltage to be measured.
Ø Thus all analog voltmeters and ammeters are essentially current measuring devices.
The essential requirements of a measuring instrument are
(i) That its introduction into the circuit, where measurements are to be made,
does not alter the circuit conditions ;
(ii) The power consumed by them for their operation is small.
1.2Ammeters & Multimeters
Ammeters are connected in series
In the circuit whose current is to be measured. The power loss in an ammeter is I2Ra
where I is the current to be measured and R is the resistance of ammeter. Therefore, ammeters
should have a low electrical resistance so that they cause a small voltage drop and consequently
absorb small power.
Voltmeters are connected in parallel with the circuit whose voltage is to be measured.
The power loss in voltmeters is V where V is the voltage U) be measured and R is the
resistance of voltmeter. The voltmeters should have a high electrical resistance, in order
that the current drawn by them is small and consequently the power consumed is small.
Types of instruments
The main types of instruments used as an ammeters and voltmeters are
(i) Permanent magnet moving coil (PMMC)
(ii) Moving iron
(iii) Electro-dynamometer
(iv) Hot wire (iv) Thermocouple
(vi) Induction (vii) Electrostatic
EE6404 MEASUREMENTS&INSTRUMENTATION
SCE 21 Dept.of EEE
(viii) Rectifier.
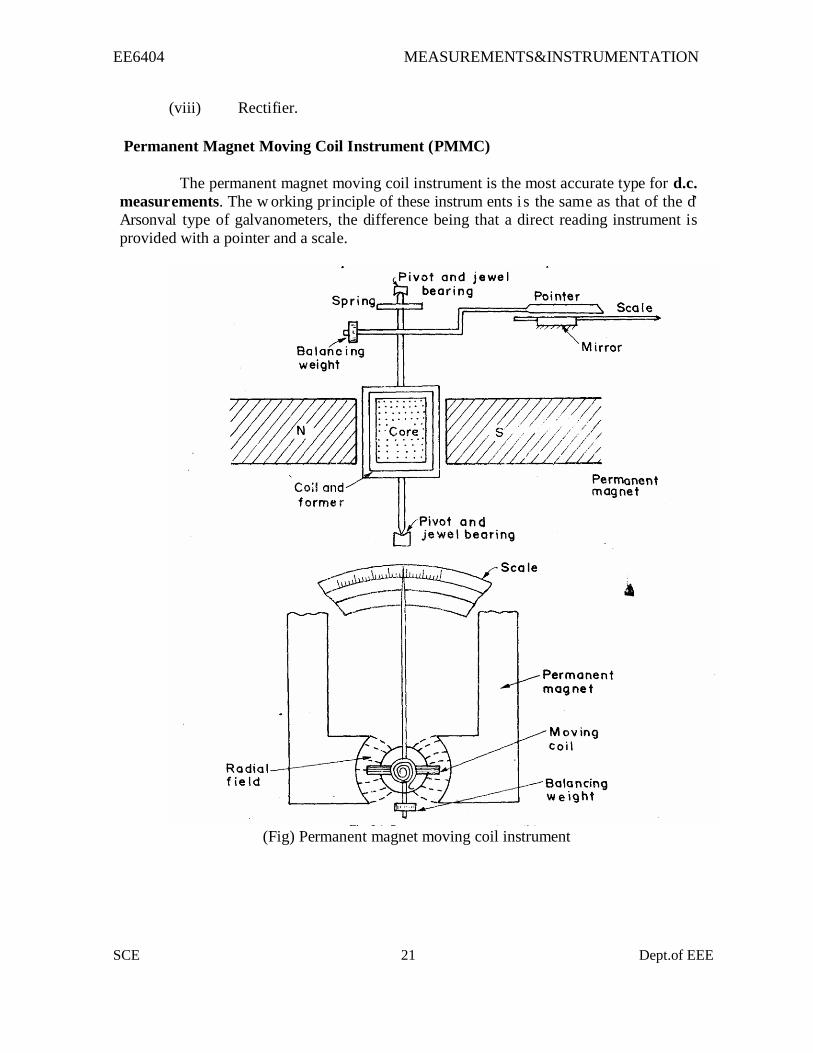
Permanent Magnet Moving Coil Instrument (PMMC)
The permanent magnet moving coil instrument is the most accurate type for d.c.
measur ements. The w orking pr inciple of these instrum ents i s the same as that of the d’
Arsonval type of galvanometers, the difference being that a direct reading instrument is
provided with a pointer and a scale.
(Fig) Permanent magnet moving coil instrument
EE6404 MEASUREMENTS&INSTRUMENTATION
SCE 22 Dept.of EEE
Construction of PMMC Instruments
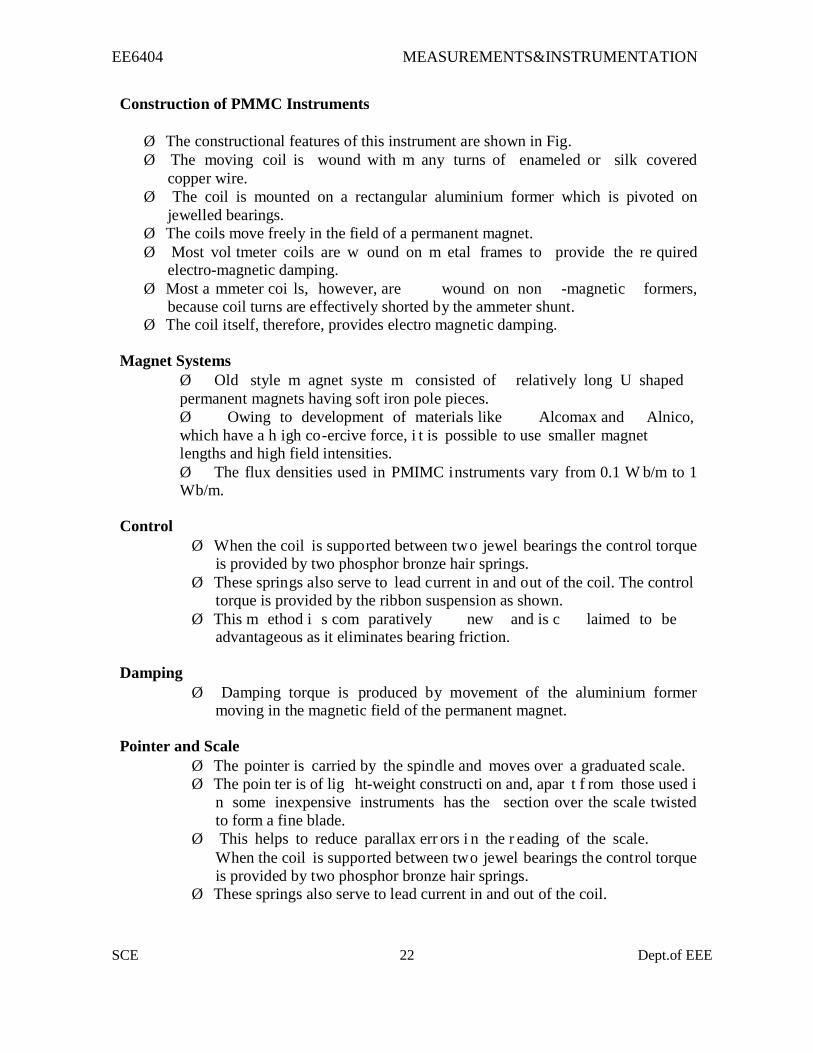
Ø The constructional features of this instrument are shown in Fig.
Ø The moving coil is wound with m any turns of enameled or silk covered
copper wire.
Ø The coil is mounted on a rectangular aluminium former which is pivoted on
jewelled bearings.
Ø The coils move freely in the field of a permanent magnet.
Ø Most vol tmeter coils are w ound on m etal frames to provide the re quired electro-magnetic damping.
Ø Most a mmeter coi ls, however, are wound on non -magnetic formers, because coil turns are effectively shorted by the ammeter shunt.
Ø The coil itself, therefore, provides electro magnetic damping. Magnet Systems
Ø Old style m agnet syste m consisted of relatively long U shaped
permanent magnets having soft iron pole pieces.
Ø Owing to development of materials like Alcomax and Alnico,
which have a h igh co -ercive force, i t is possible to use smaller magnet lengths and high field intensities.
Ø The flux densities used in PMIMC i nstruments vary from 0.1 W b/m to 1 Wb/m.
Control Ø When the coil is suppo rted between tw o jewel bearings th e cont rol torque
is provided by two phosphor bronze hair springs.
Ø These sprin gs also serve to lead c urrent in and o ut of the coil. The control torque is provided by the ribbon suspension as shown.
Ø This m ethod i s com paratively new and is c laimed to be advantageous as it eliminates bearing friction.
Damping Ø Damping torque is produced by movement of the aluminium former
moving in the magnetic field of the permanent magnet.
Pointer and Scale
Ø The pointer is carried by the spin dle and moves over a graduate d scale.
Ø The poin ter is of lig ht-weight constructi on and, apar t f rom those used i
n some inexpensive instruments has the section over the scale twisted
to form a fine blade.
Ø This helps to reduce parallax err ors i n the r eading of the scale.
When the coil is suppo rted between tw o jewel bearings th e cont rol torque
is provided by two phosphor bronze hair springs. Ø These springs also serve to lead current in and out of the coil.
EE6404 MEASUREMENTS&INSTRUMENTATION
SCE 23 Dept.of EEE
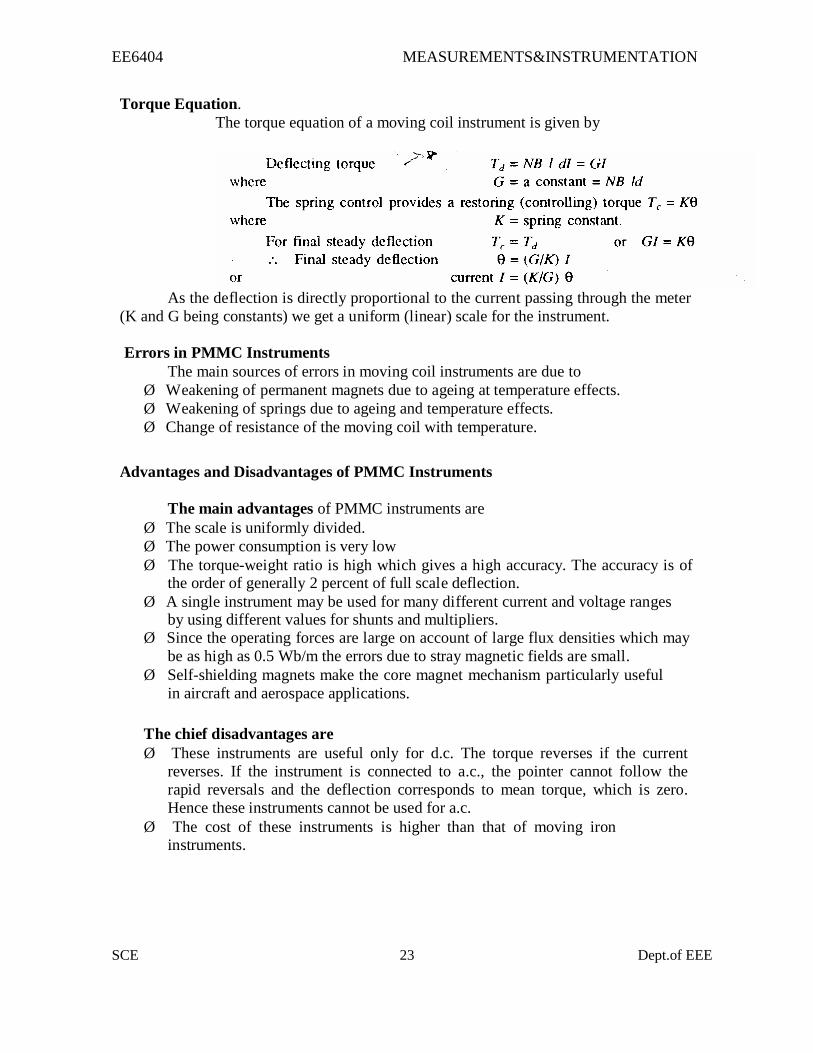
Torque Equation.
The torque equation of a moving coil instrument is given by
As the deflection is directly proportional to the current passing through the meter
(K and G being constants) we get a uniform (linear) scale for the instrument.
Errors in PMMC Instruments
The main sources of errors in moving coil instruments are due to
Ø Weakening of permanent magnets due to ageing at temperature effects.
Ø Weakening of springs due to ageing and temperature effects.
Ø Change of resistance of the moving coil with temperature. Advantages and Disadvantages of PMMC Instruments
The main advantages of PMMC instruments are
Ø The scale is uniformly divided.
Ø The power consumption is very low
Ø The torque-weight ratio is high which gives a high accuracy. The accuracy is of the order of generally 2 percent of full scale deflection.
Ø A single instrument may be used for many different current and voltage ranges by using different values for shunts and multipliers.
Ø Since the operating forces are large on account of large flux densities which may
be as high as 0.5 Wb/m the errors due to stray magnetic fields are small.
Ø Self-shielding magnets make the core magnet mechanism particularly useful
in aircraft and aerospace applications.
The chief disadvantages are
Ø These instruments are useful only for d.c. The torque reverses if the current
reverses. If the instrument is connected to a.c., the pointer cannot follow the
rapid reversals and the deflection corresponds to mean torque, which is zero.
Hence these instruments cannot be used for a.c.
Ø The cost of these instruments is higher than that of moving iron instruments.
EE6404 MEASUREMENTS&INSTRUMENTATION
SCE 24 Dept.of EEE
Moving Iron Instruments
Classification of Moving Iron Instruments
Moving iron instruments are of two types
(i) Attraction type.
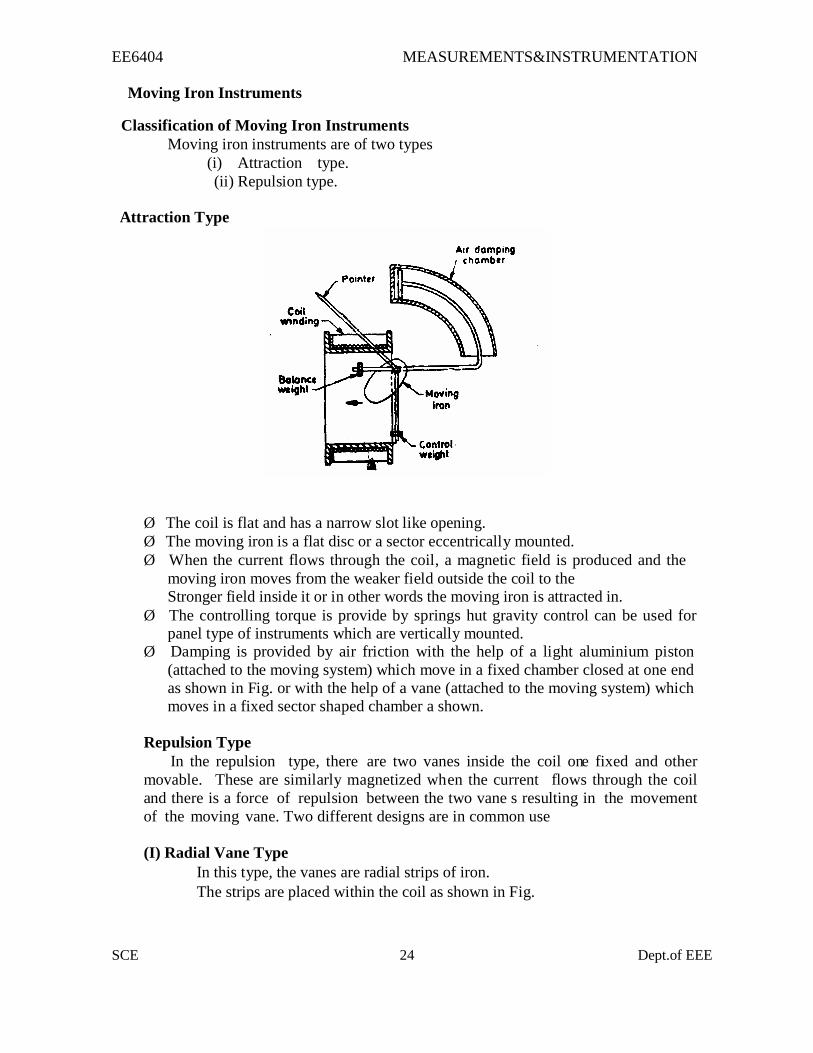
(ii) Repulsion type. Attraction Type
Ø The coil is flat and has a narrow slot like opening.
Ø The moving iron is a flat disc or a sector eccentrically mounted.
Ø When the current flows through the coil, a magnetic field is produced and the
moving iron moves from the weaker field outside the coil to the Stronger field inside it or in other words the moving iron is attracted in.
Ø The controlling torque is provide by springs hut gravity control can be used for panel type of instruments which are vertically mounted.
Ø Damping is provided by air friction with the help of a light aluminium piston
(attached to the moving system) which move in a fixed chamber closed at one end
as shown in Fig. or with the help of a vane (attached to the moving system) which
moves in a fixed sector shaped chamber a shown.
Repulsion Type
In the repulsion type, there are two vanes inside the coil one fixed and other
movable. These are similarly magnetized when the current flows through the coil
and there is a force of repulsion between the two vane s resulting in the movement
of the moving vane. Two different designs are in common use
(I) Radial Vane Type
In this type, the vanes are radial strips of iron.
The strips are placed within the coil as shown in Fig.

EE6404 MEASUREMENTS&INSTRUMENTATION
SCE 25 Dept.of EEE
The fixed vane is attached to the coil and the movable one to the
spindle of the instrument.
(a) Radial vane type. (b) Co-axial vane type
(ii) Co-axial Vane Type
Ø In this type of instrument, the fixed and moving vanes are sections of co
axial cylinders as shown in Fig.
Ø The controlling torque is provided by springs. Gravity control can also he
used in vertically mounted instruments.
Ø The damping torque is produced by air friction as in attraction type
instruments.
Ø The operating magnetic field in moving iron instruments is very weak and
therefore eddy current damping is not used in them as introduction of a permanent magnet required for eddy current damping would
destroy the operating magnetic field.
Ø It is clear that whatever may be the direction of the current in the coil of the
instrument, the iron vanes are so magnetized that there is always a force of
attraction in the attraction type and repulsion in the repulsion type of
instruments.
Ø Thus moving iron instruments are unpolarised instruments i.e., they are
independent of the direction in which the current passes. Ø Therefore, these instruments can be used on both ac. and d.c.
EE6404 MEASUREMENTS&INSTRUMENTATION
SCE 26 Dept.of EEE
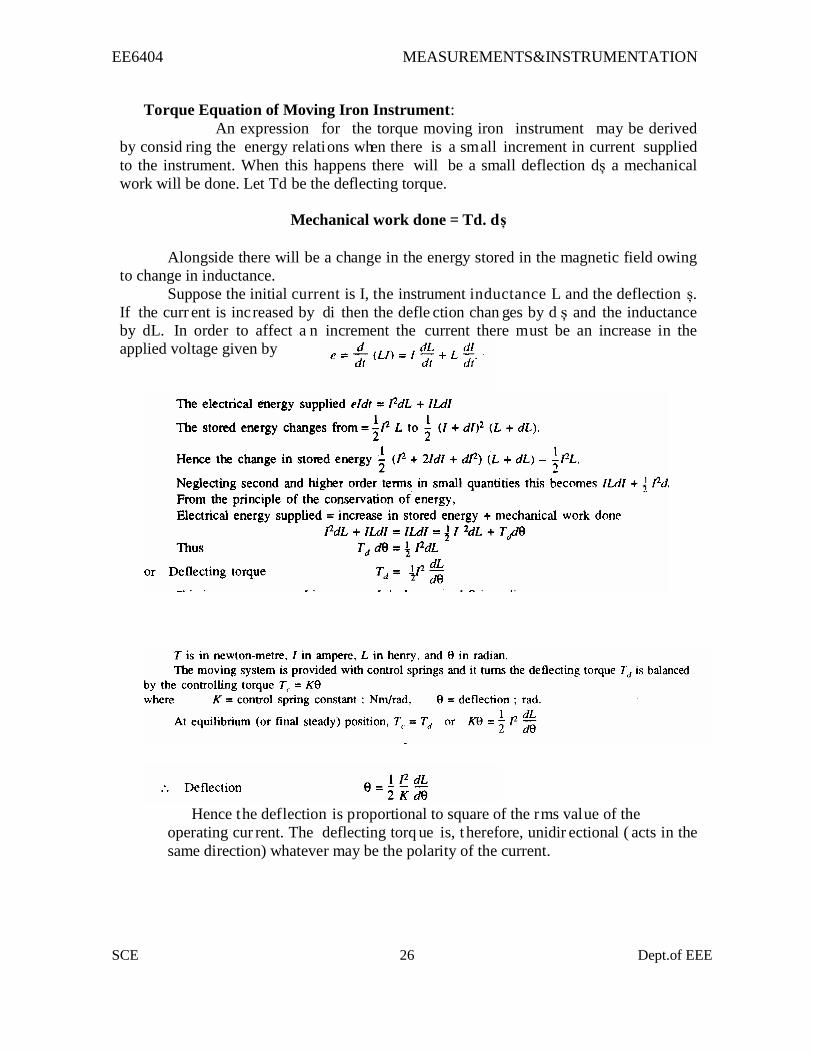
Torque Equation of Moving Iron Instrument:
An expression for the torque moving iron instrument may be derived
by consid ring the energy relati ons when there is a sm all increment in current supplied
to the instrument. When this happens there will be a small deflection dș a mechanical
work will be done. Let Td be the deflecting torque.
Mechanical work done = Td. d ș
Alongside there will be a change in the energy stored in the magnetic field owing
to change in inductance.
Suppose the initial current is I, the instrument inductance L and the deflection ș.
If the curr ent is inc reased by di then the defle ction chan ges by d ș and the inductance
by dL. In order to affect a n increment the current there must be an increase in the
applied voltage given by
Hence t he def lection is p roportional to square of the r ms val ue of the
operating cur rent. The deflecting torq ue is, t herefore, unidir ectional ( acts in the
same direction) whatever may be the polarity of the current.
EE6404 MEASUREMENTS&INSTRUMENTATION
SCE 27 Dept.of EEE
Comparison between Attraction and Repulsion Types of Instruments
In general it may be said that attraction-type instruments possess the
same advantages, and are subject to the limitations, described for the
repulsion type.
An attraction type instrument will usually have a lower inductance than
the corresponding repulsion type instrument, and voltmeters will
therefore be accurate over a wider range of frequency and there is a
greater possibility of using shunts with ammeters.
On the other hand, repulsion instruments are more suitable for
economical production in manufacture, and a nearly uniform scale is
more easily obtained; they are, therefore, much more common than the
attraction type.
Errors in Moving Iron Instruments
There are two types of errors which occur in moving iron instruments — errors
which occur with both a.c. and d.c. and the other which occur only with ac. only.
Errors with both D.C. and A.C
i) Hysteresis Error
ii) Temperature error
iii) Stray magnetic field
Errors with only A.C
Frequency errors
Advantages & Disadvantages
1) Universal use
(2) Less Friction Errors (3) Cheapness
(4) Robustness
(5) Accuracy
(6) Scale (7) Errors
(8) Waveform errors.
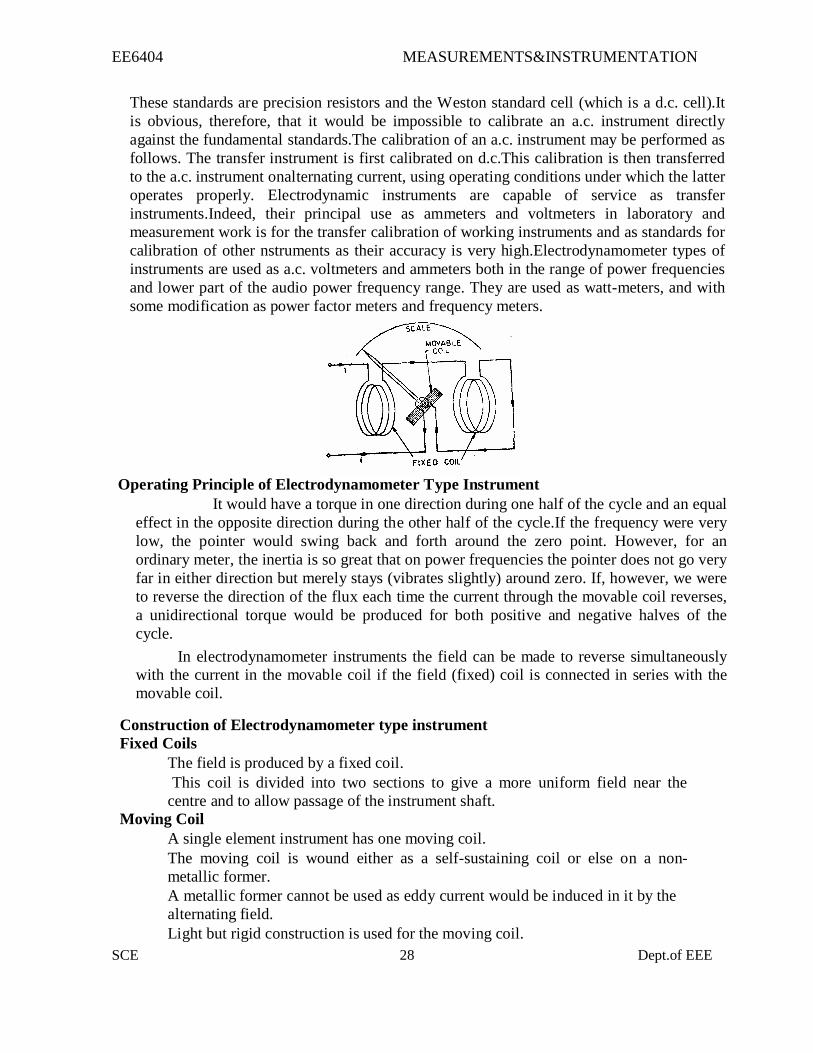
Electrodynamometer (Eelectrodynamic) Type Instruments
The necessity for the a.c. calibration of moving iron instruments as well as other
types of instruments which cannot be correctly calibrated requires the use of a transfer
type of instrument. A transfer instrument is one that may be calibrated with a d.c.
source and then used without modification to measure a.c. This requires the transfer
type instrument to have same accuracy for both d.c. and a.c., which the
electrodynamometer instruments have.
EE6404 MEASUREMENTS&INSTRUMENTATION
SCE 28 Dept.of EEE
These standards are precision resistors and the Weston standard cell (which is a d.c. cell).It
is obvious, therefore, that it would be impossible to calibrate an a.c. instrument directly
against the fundamental standards.The calibration of an a.c. instrument may be performed as
follows. The transfer instrument is first calibrated on d.c.This calibration is then transferred
to the a.c. instrument onalternating current, using operating conditions under which the latter
operates properly. Electrodynamic instruments are capable of service as transfer
instruments.Indeed, their principal use as ammeters and voltmeters in laboratory and
measurement work is for the transfer calibration of working instruments and as standards for
calibration of other nstruments as their accuracy is very high.Electrodynamometer types of
instruments are used as a.c. voltmeters and ammeters both in the range of power frequencies
and lower part of the audio power frequency range. They are used as watt-meters, and with
some modification as power factor meters and frequency meters. Operating Principle of Electrodynamometer Type Instrument
It would have a torque in one direction during one half of the cycle and an equal
effect in the opposite direction during the other half of the cycle.If the frequency were very
low, the pointer would swing back and forth around the zero point. However, for an
ordinary meter, the inertia is so great that on power frequencies the pointer does not go very
far in either direction but merely stays (vibrates slightly) around zero. If, however, we were
to reverse the direction of the flux each time the current through the movable coil reverses,
a unidirectional torque would be produced for both positive and negative halves of the
cycle.
In electrodynamometer instruments the field can be made to reverse simultaneously
with the current in the movable coil if the field (fixed) coil is connected in series with the
movable coil. Construction of Electrodynamometer type instrument
Fixed Coils
The field is produced by a fixed coil.
This coil is divided into two sections to give a more uniform field near the
centre and to allow passage of the instrument shaft.
Moving Coil
A single element instrument has one moving coil.
The moving coil is wound either as a self-sustaining coil or else on a non-
metallic former.
A metallic former cannot be used as eddy current would be induced in it by the
alternating field.
Light but rigid construction is used for the moving coil.
EE6404 MEASUREMENTS&INSTRUMENTATION
SCE 29 Dept.of EEE
It should be noted that both fixed and moving coils are air cored.
Control
The controlling torque is provided by two control springs.
These springs act as leads to the moving coil.
Moving System
The moving coil is mounted on an aluminum spindle.
The moving system also carries the counter weights and truss type
pointer.
Sometimes a suspension may be used in case a high sensitivity is
desired.
Damping
Air friction damping is employed for these instruments and is provided by a pair
of aluminum vanes, attached to the spindle at the bottom.
These vanes move in sector shaped chambers.
Eddy current damping cannot be used in these instruments as the operating
field is very weak (on account of the fact that the coils are air cored) and any
introduction of a permanent magnet required for eddy current damping would
distort the operating magnetic field of the instrument. Shielding
The field produced by the fixed coils is somewhat weaker than in other types
of instruments
It is nearly 0.005 to 0.006 Wb/m
In d.c. measurements even the earth magnetic field may affect the
readings.
Thus it is necessary to shield an electrodynamometer type instrument from
the effect of stray magnetic fields.
Air cored electrodynamometer type instruments are protected against external
magnetic fields by enclosing them in a casing of high permeability alloy.
This shunts external magnetic fields around the instrument mechanism and
minimizes their effects on the indication.
Cases and Scales
Laboratory standard instruments are usually contained in highly polished
wooden cases.
These cases are so constructed as to remain dimensionally stable over long
periods of time.
The glass is coated with some conducting material to completely remove the
electrostatic effects.
The case is supported by adjustable leveling screws.
A spirit level is also provided to ensure proper leveling.
The scales are hand drawn, using machine sub-dividing equipment. Diagonal lines
for fine sub-division are usually drawn for main markings on the scale.
Most of the high-precision instruments have a 300 mr scale with 100, 120 or 150
divisions.
Torque Equation
EE6404 MEASUREMENTS&INSTRUMENTATION
SCE 30 Dept.of EEE
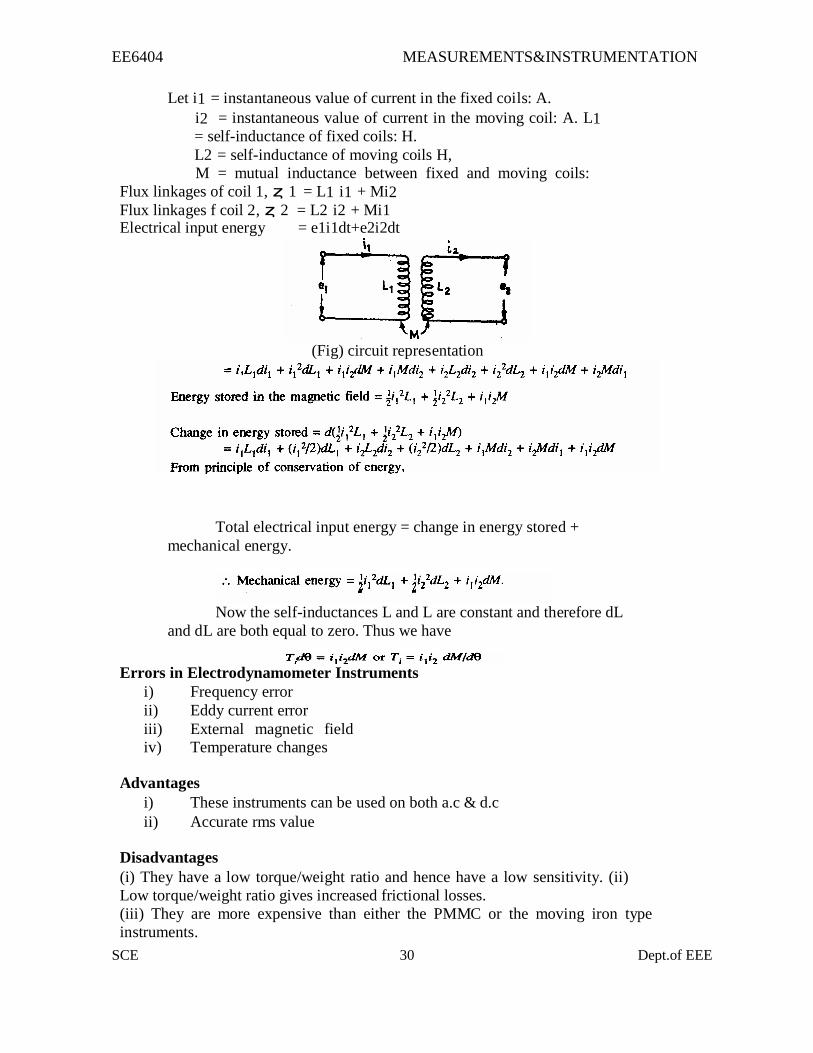
Let i1 = instantaneous value of current in the fixed coils: A.
i2 = instantaneous value of current in the moving coil: A. L1 = self-inductance of fixed coils: H. L2 = self-inductance of moving coils H,
M = mutual inductance between fixed and moving coils:
Flux linkages of coil 1, ȥ 1 = L1 i1 + Mi2 Flux linkages f coil 2, ȥ 2 = L2 i2 + Mi1
Electrical input energy = e1i1dt+e2i2dt
(Fig) circuit representation
Total electrical input energy = change in energy stored +
mechanical energy.
Now the self-inductances L and L are constant and therefore dL
and dL are both equal to zero. Thus we have Errors in Electrodynamometer Instruments
i) Frequency error
ii) Eddy current error
iii) External magnetic field
iv) Temperature changes
Advantages
i) These instruments can be used on both a.c & d.c
ii) Accurate rms value Disadvantages
(i) They have a low torque/weight ratio and hence have a low sensitivity. (ii)
Low torque/weight ratio gives increased frictional losses.
(iii) They are more expensive than either the PMMC or the moving iron type
instruments.
EE6404 MEASUREMENTS&INSTRUMENTATION
SCE 31 Dept.of EEE
(iv) These instruments are sensitive to overloads and mechanical impacts.
Therefore, they must be handled with great care.
(v) The operating current of these instruments is large owing to the fact that they have
weak magnetic field. The flux density is about 0.006 Wb/m as against 0.1 to
0.5 Wb/m in PMCC instruments
(vi) They have a non-uniform scale.
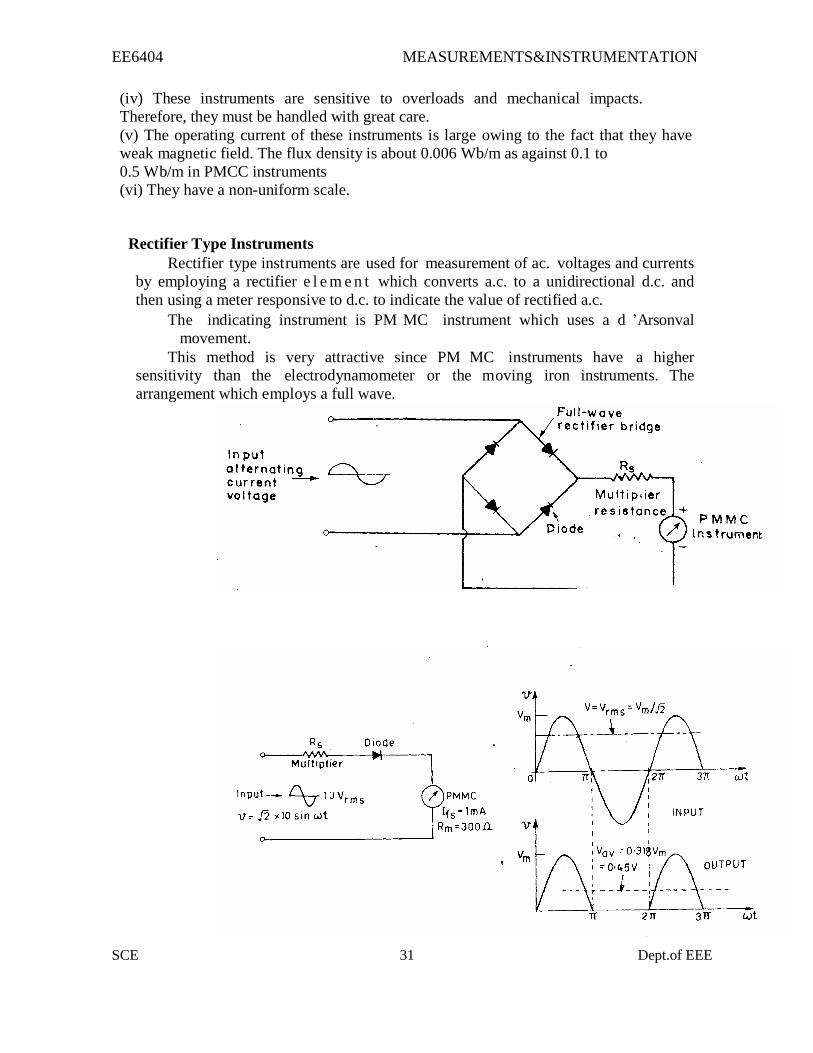
Rectifier Type Instruments
Rectifier type inst ruments are used for measurement of ac. voltages and currents
by employing a rectifier e l e m e n t which converts a.c. to a unidirectional d.c. and
then using a meter responsive to d.c. to indicate the value of rectified a.c.
The indicating instrument is PM MC instrument which uses a d ’Arsonval
movement.
This method is very attractive since PM MC instruments have a higher
sensitivity than the electrodynamometer or the moving iron instruments. The
arrangement which employs a full wave.
EE6404 MEASUREMENTS&INSTRUMENTATION
SCE 32 Dept.of EEE
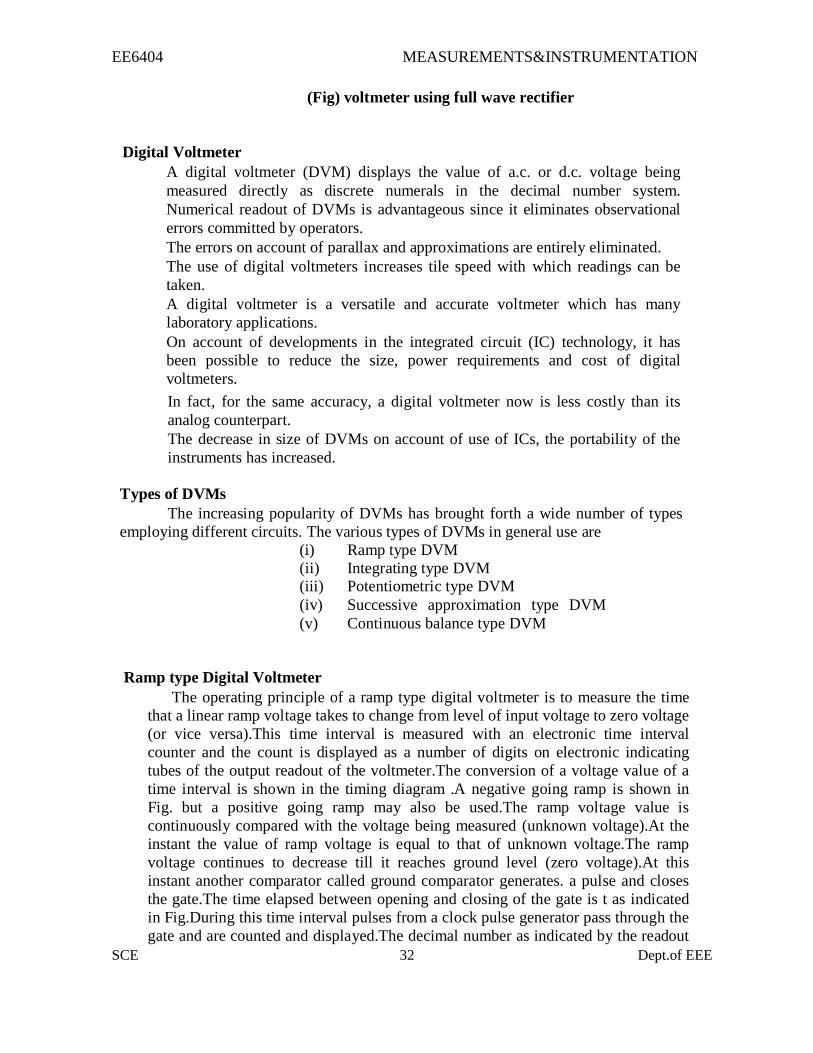
(Fig) voltmeter using full wave rectifier Digital Voltmeter
A digital voltmeter (DVM) displays the value of a.c. or d.c. voltage being
measured directly as discrete numerals in the decimal number system.
Numerical readout of DVMs is advantageous since it eliminates observational
errors committed by operators.
The errors on account of parallax and approximations are entirely eliminated.
The use of digital voltmeters increases tile speed with which readings can be
taken.
A digital voltmeter is a versatile and accurate voltmeter which has many
laboratory applications.
On account of developments in the integrated circuit (IC) technology, it has
been possible to reduce the size, power requirements and cost of digital
voltmeters.
In fact, for the same accuracy, a digital voltmeter now is less costly than its
analog counterpart.
The decrease in size of DVMs on account of use of ICs, the portability of the
instruments has increased.
Types of DVMs
The increasing popularity of DVMs has brought forth a wide number of types
employing different circuits. The various types of DVMs in general use are
(i) Ramp type DVM
(ii) Integrating type DVM (iii) Potentiometric type DVM
(iv) Successive approximation type DVM
(v) Continuous balance type DVM Ramp type Digital Voltmeter
The operating principle of a ramp type digital voltmeter is to measure the time
that a linear ramp voltage takes to change from level of input voltage to zero voltage
(or vice versa).This time interval is measured with an electronic time interval
counter and the count is displayed as a number of digits on electronic indicating
tubes of the output readout of the voltmeter.The conversion of a voltage value of a
time interval is shown in the timing diagram .A negative going ramp is shown in
Fig. but a positive going ramp may also be used.The ramp voltage value is
continuously compared with the voltage being measured (unknown voltage).At the
instant the value of ramp voltage is equal to that of unknown voltage.The ramp
voltage continues to decrease till it reaches ground level (zero voltage).At this
instant another comparator called ground comparator generates. a pulse and closes
the gate.The time elapsed between opening and closing of the gate is t as indicated
in Fig.During this time interval pulses from a clock pulse generator pass through the
gate and are counted and displayed.The decimal number as indicated by the readout

EE6404 MEASUREMENTS&INSTRUMENTATION
SCE 33 Dept.of EEE
is a measure of the value of input voltage.The sample rate multivibrator determines
the rate at which the measurement cycles are initiated.The sample rate circuit
provides an initiating pulse for the ramp generator to start its next ramp voltage.
At the same time it sends a pulse to the counters which set all of them to 0.
This momentarily removes the digital display of the readout. Integrating Type Digital Voltmeter
The voltmeter measures the true average value of the input voltage over a fixed
measuring period.In contrast the ramp type DVM samples the voltage at the end of
the measuring period.This voltmeter employs an integration technique which uses a
voltage to frequency conversion.The voltage to frequency (VIF) converter functions
as a feedback control system which governs the rate of pulse generation in proportion
to the magnitude of input voltage.
Actually when we employ the voltage to frequency conversion techniques, a train of
pulses, whose frequency depends upon the voltage being measured, is
generated.
Then the number of pulses appearing in a definite interval of time is counted.
Since the frequency of these pulses is a function of unknown voltage, the number of
pulses counted in that period of time is an indication of the input (unknown) voltage.
The heart of this technique is the operational amplifier acting as an Integrator.
Output voltage of integrator E = -Ei / RC*t
Thus if a constant input voltage E is applied, an output voltage E is produced which rises
at a uniform rate and has a polarity opposite to that input voltage.
In other words, it is clear from the above relationship that for a constant input voltage
the integrator produces a ramp output voltage of opposite polarity.
EE6404 MEASUREMENTS&INSTRUMENTATION
SCE 34 Dept.of EEE
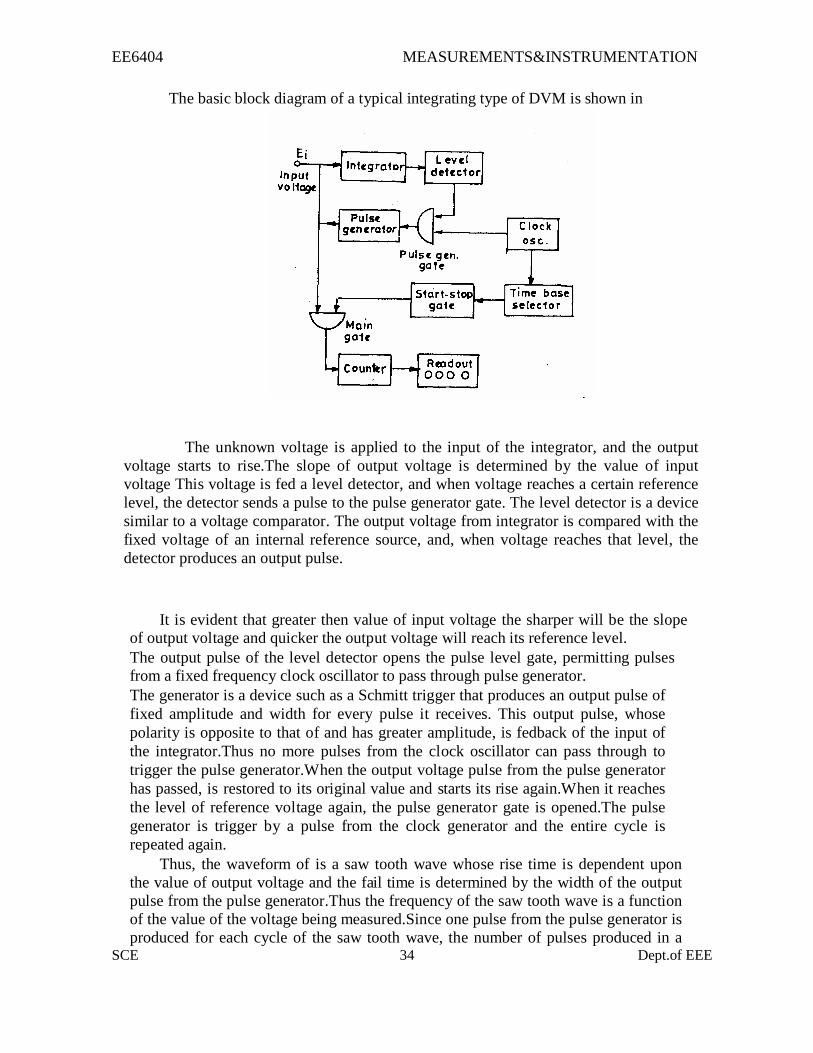
The basic block diagram of a typical integrating type of DVM is shown in
The unknown voltage is applied to the input of the integrator, and the output
voltage starts to rise.The slope of output voltage is determined by the value of input
voltage This voltage is fed a level detector, and when voltage reaches a certain reference
level, the detector sends a pulse to the pulse generator gate. The level detector is a device
similar to a voltage comparator. The output voltage from integrator is compared with the
fixed voltage of an internal reference source, and, when voltage reaches that level, the
detector produces an output pulse.
It is evident that greater then value of input voltage the sharper will be the slope
of output voltage and quicker the output voltage will reach its reference level.
The output pulse of the level detector opens the pulse level gate, permitting pulses
from a fixed frequency clock oscillator to pass through pulse generator.
The generator is a device such as a Schmitt trigger that produces an output pulse of
fixed amplitude and width for every pulse it receives. This output pulse, whose
polarity is opposite to that of and has greater amplitude, is fedback of the input of
the integrator.Thus no more pulses from the clock oscillator can pass through to
trigger the pulse generator.When the output voltage pulse from the pulse generator
has passed, is restored to its original value and starts its rise again.When it reaches
the level of reference voltage again, the pulse generator gate is opened.The pulse
generator is trigger by a pulse from the clock generator and the entire cycle is
repeated again.
Thus, the waveform of is a saw tooth wave whose rise time is dependent upon
the value of output voltage and the fail time is determined by the width of the output
pulse from the pulse generator.Thus the frequency of the saw tooth wave is a function
of the value of the voltage being measured.Since one pulse from the pulse generator is
produced for each cycle of the saw tooth wave, the number of pulses produced in a

EE6404 MEASUREMENTS&INSTRUMENTATION
SCE 35 Dept.of EEE
given time interval and hence the frequency of saw tooth wave is an indication of the
voltage being measured.
Potentiometric Type Digital Voltmeter
A potentiometric type of DVM employs voltage comparison technique. In this DVM
the unknown voltage is compared with reference voltage whose value is fixed by the
setting of the calibrated potentiometer.
The potentiometer setting is changed to obtain balance (i.e. null conditions).
When null conditions are obtained the value of the unknown voltage, is indicated by
the dial setting of the potentiometer.
In potentiometric type DVMs, the balance is not obtained manually but is arrived at
automatically.
Thus, this DVM is in fact a self- balancing potentiometer.
The potentiometric DVM is provided with a readout which displays the voltage
being measured.
(Fig.) Basic block diagram of a potentiometric DVM.
The block diagram of basic circuit of a potentiometric DVM is shown. The
unknown voltage is filtered and attenuated to suitable level. This input voltage is applied
to a comparator (also known as error detector).This error detector may be chopper.The
reference voltage is obtained from a fixed voltage source. This voltage is applied to a
potentiometer.The value of the feedback voltage depends up the position of the sliding
contact.The feedback voltage is also applied to the comparator.The unknown voltage and
the feedback voltages are compared in the comparator.The output voltage of the
comparator is the difference of the above two voltages.The difference of voltage is called
the error signal.The error signal is amplified and is fed to a potentiometer djustment
device which moves the sliding contact of the potentiometer.This magnitude by which the
sliding contact moves depends upon the magnitude of the error signal.
The direction of movement of slider depends upon whether the feedback voltage
is larger or the input voltage is larger.The sliding contact moves to such a place where
the feedback voltage equals the unknown voltage.In that case, there will not be any
error voltage and hence there will be no input to the device adjusting the position of the
sliding cont act and therefore it (sliding contact) will come to rest.The position of the
potentiometer adjustment device at this point is indicated in numerical form on the
digital readout device associated with it.
EE6404 MEASUREMENTS&INSTRUMENTATION
SCE 36 Dept.of EEE
Single Phase Induction Type Meters
The construction and principle of operation of Single Phase Energy Meters is
explained below
Construction of Induction Type Energy Meters
There are four main parts of the operating mechanism
(i) Driving system
(ii) Moving system
(iii) Braking system
(iv) Registering system
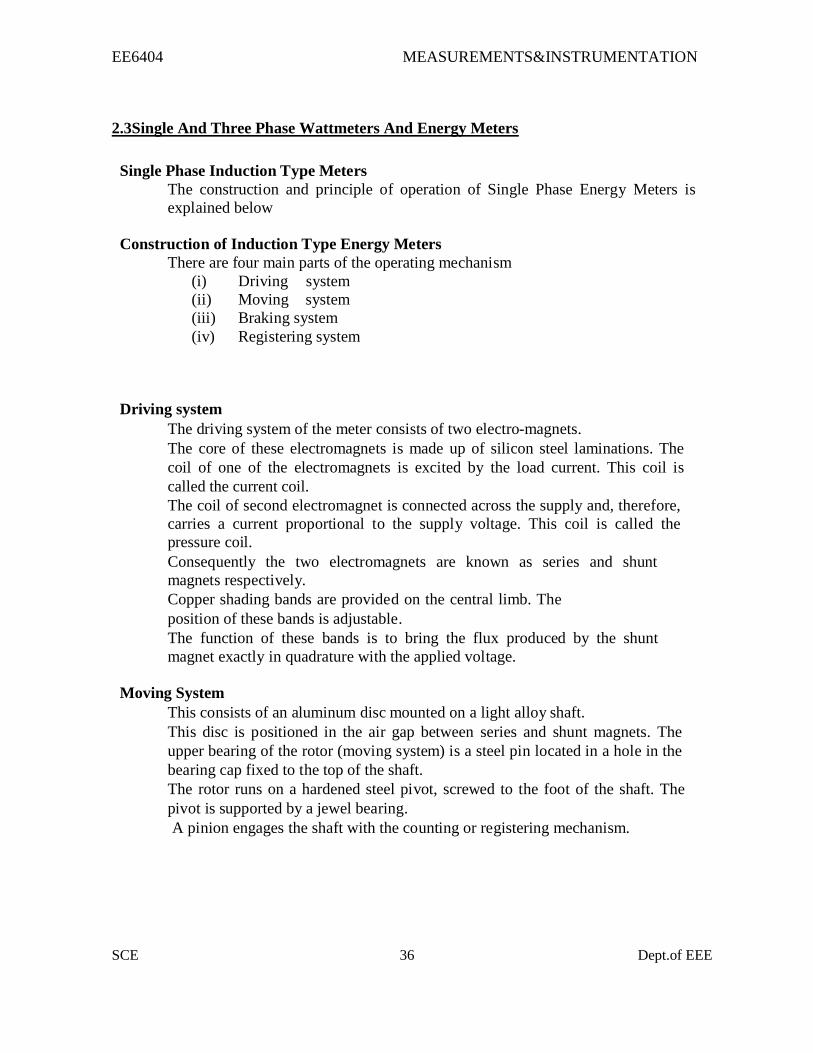
Driving system
The driving system of the meter consists of two electro-magnets.
The core of these electromagnets is made up of silicon steel laminations. The
coil of one of the electromagnets is excited by the load current. This coil is
called the current coil.
The coil of second electromagnet is connected across the supply and, therefore,
carries a current proportional to the supply voltage. This coil is called the
pressure coil.
Consequently the two electromagnets are known as series and shunt
magnets respectively.
Copper shading bands are provided on the central limb. The
position of these bands is adjustable.
The function of these bands is to bring the flux produced by the shunt
magnet exactly in quadrature with the applied voltage.
Moving System
This consists of an aluminum disc mounted on a light alloy shaft.
This disc is positioned in the air gap between series and shunt magnets. The
upper bearing of the rotor (moving system) is a steel pin located in a hole in the
bearing cap fixed to the top of the shaft.
The rotor runs on a hardened steel pivot, screwed to the foot of the shaft. The
pivot is supported by a jewel bearing.
A pinion engages the shaft with the counting or registering mechanism.
2.3Single And Three Phase Wattmeters And Energy Meters
EE6404 MEASUREMENTS&INSTRUMENTATION
SCE 37 Dept.of EEE
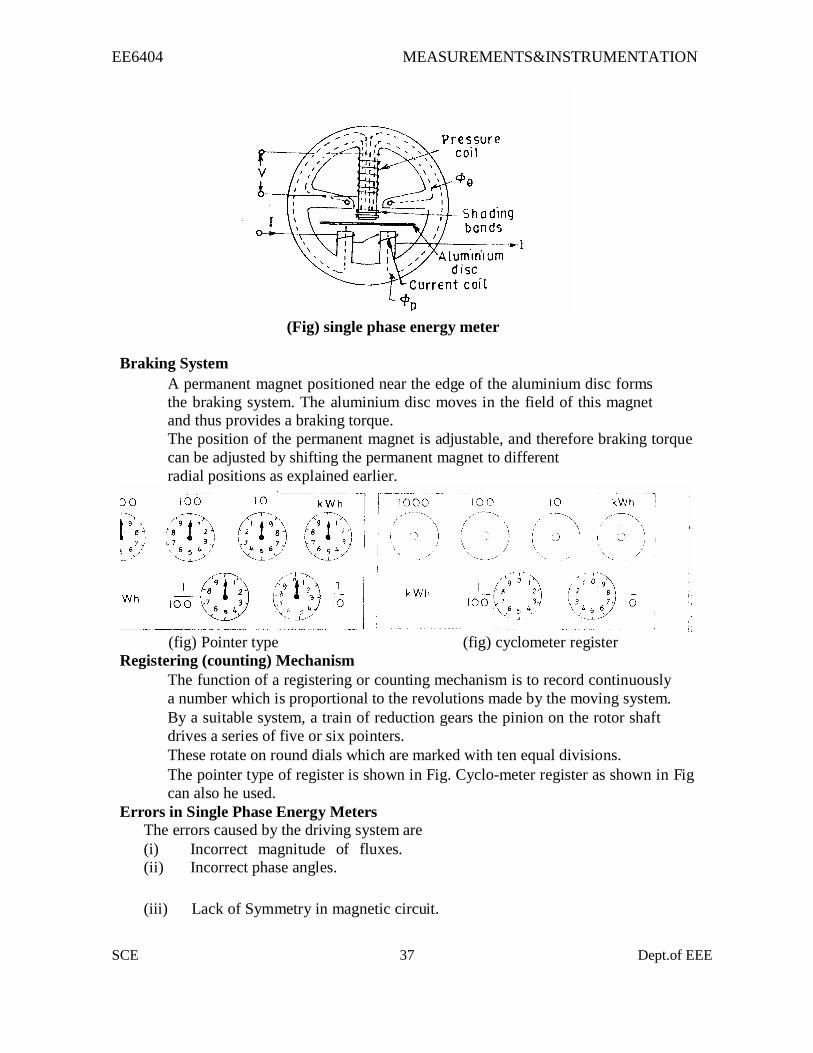
(Fig) single phase energy meter
Braking System
A permanent magnet positioned near the edge of the aluminium disc forms
the braking system. The aluminium disc moves in the field of this magnet
and thus provides a braking torque.
The position of the permanent magnet is adjustable, and therefore braking torque
can be adjusted by shifting the permanent magnet to different
radial positions as explained earlier.
(fig) Pointer type (fig) cyclometer register
Registering (counting) Mechanism
The function of a registering or counting mechanism is to record continuously
a number which is proportional to the revolutions made by the moving system.
By a suitable system, a train of reduction gears the pinion on the rotor shaft
drives a series of five or six pointers.
These rotate on round dials which are marked with ten equal divisions.
The pointer type of register is shown in Fig. Cyclo-meter register as shown in Fig
can also he used.
Errors in Single Phase Energy Meters The errors caused by the driving system are
(i) Incorrect magnitude of fluxes.
(ii) Incorrect phase angles.
(iii) Lack of Symmetry in magnetic circuit.

EE6404 MEASUREMENTS&INSTRUMENTATION
SCE 38 Dept.of EEE
The errors caused by the braking system are
i) changes in strength of brake magnet
ii) changes in disc resistance
iii) abnormal friction
iv) self braking effect
Three Phase General Supply with Controlled Load
L1 – 30A Load Control (Hot Water)
L2 – Maximum 2A Load Control (Storage Heating)
2.5mm² with 7 strands for conductors to control customer contactor
Load carrying conductors not less than 4mm² or greater than 35mm²
All metering neutrals to be black colour 4mm² or 6 mm² with minimum 7 stranded
conductors.
Not less than 18 strand for 25 & 35mm² conductors
Refer to SIR’s for metering obligations
Comply with Electrical Safety (Installations) Regulations 2009 and AS/NZS 3000
Customer needs to provide 2A circuit breaker as a Main Switch and their load
control contactor
Within customer’s switchboard
Meter panel fuse not required for an overhead supply.
Off Peak controlled load only includes single phase hot water & single or multi-
phase storage heating
Wiring diagram applicable for Solar
EE6404 MEASUREMENTS&INSTRUMENTATION
SCE 39 Dept.of EEE
Metering diagram is applicable for 2 or 3 phase load.
For 2 phase loads – Red and Blue phase is preferred.
WATTMETER
Electrodynamometer Wattmeters
These instruments are similar in design and construction to
electrodynamometer type ammeters and voltmeters.
The two coils are connected in different circuits for measurement of
power.
The fixed coils or “ field coils” arc connected in series with the load and so carry
the current in the circuit.
The fixed coils, therefore, form the current coil or simply C.C. of the
wattmeter.
The moving coil is connected across the voltage and, therefore, carries a current
proportional to the voltage.
A high non-inductive resistance is connected in series with the moving coil to
limit the current to a small value.
Since the moving coil carries a current proportional to the voltage, it is called
the ‘ ‘ pressure coil’ ’ or “ voltage coil” or simply called P.C. of the wattmeter.
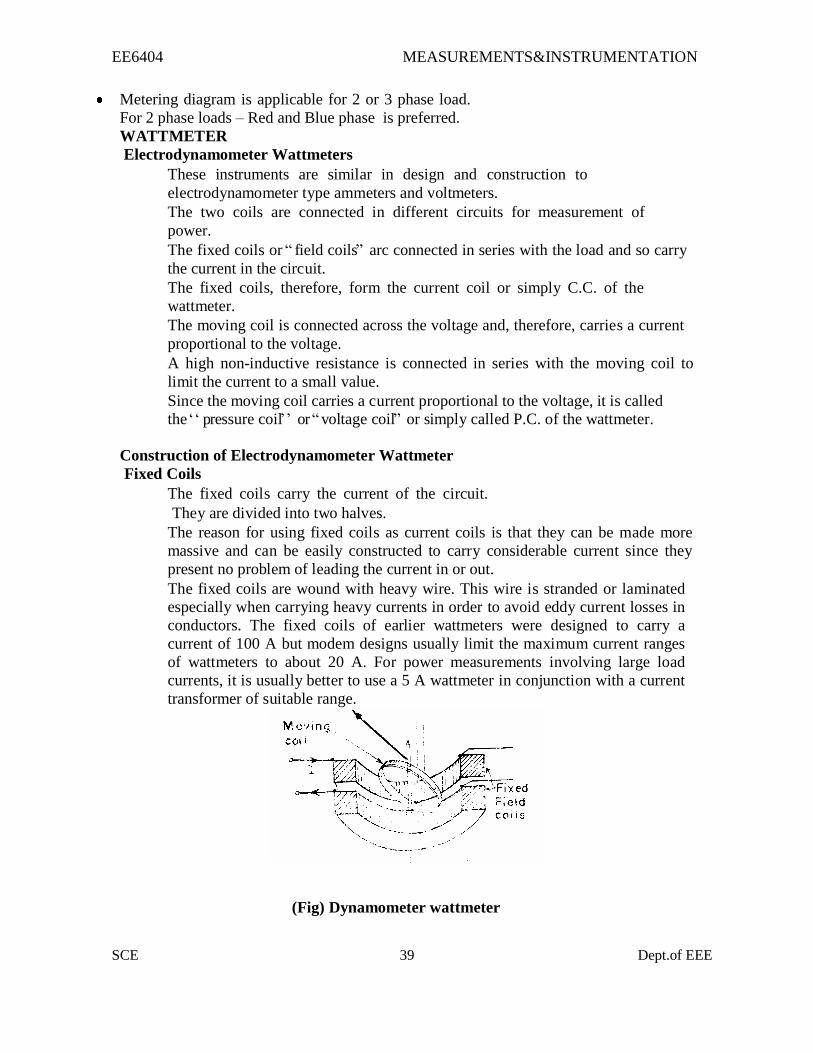
Construction of Electrodynamometer Wattmeter
Fixed Coils
The fixed coils carry the current of the circuit.
They are divided into two halves.
The reason for using fixed coils as current coils is that they can be made more
massive and can be easily constructed to carry considerable current since they
present no problem of leading the current in or out.
The fixed coils are wound with heavy wire. This wire is stranded or laminated
especially when carrying heavy currents in order to avoid eddy current losses in
conductors. The fixed coils of earlier wattmeters were designed to carry a
current of 100 A but modem designs usually limit the maximum current ranges
of wattmeters to about 20 A. For power measurements involving large load
currents, it is usually better to use a 5 A wattmeter in conjunction with a current
transformer of suitable range.
(Fig) Dynamometer wattmeter
Control
Spring control is used for the instrument.

EE6404 MEASUREMENTS&INSTRUMENTATION
SCE 40 Dept.of EEE
Damping
Air friction damping is used.
The moving system carries a light aluminium vane which moves in a sector shaped box.
Electromagnetic or eddy current damping is not used as introduction of a permanent magnet
(for damping purposes) will greatly distort the weak operating magnetic field.
Scales and Pointers
They are equipped with mirror type scales and knife edge pointers to remove reading errors due
to parallax.
Theory of Electrodynamometer Watt-meters
(Fig) circuit of electrodynamometer
It is clear from above that there is a component of power which varies as twice the frequency of current and voltage (mark the term containing 2 Ȧt). Average deflecting torque
Controlling torque exerted by springs Tc= Kș
Where, K = spring constant; ș= final steady deflection. Errors in electrodynamometer
i) Errors due to inductance effects ii) Stray magnetic field errors
iii) Eddy current errors
iv) Temperature error
EE6404 MEASUREMENTS&INSTRUMENTATION
SCE 41 Dept.of EEE
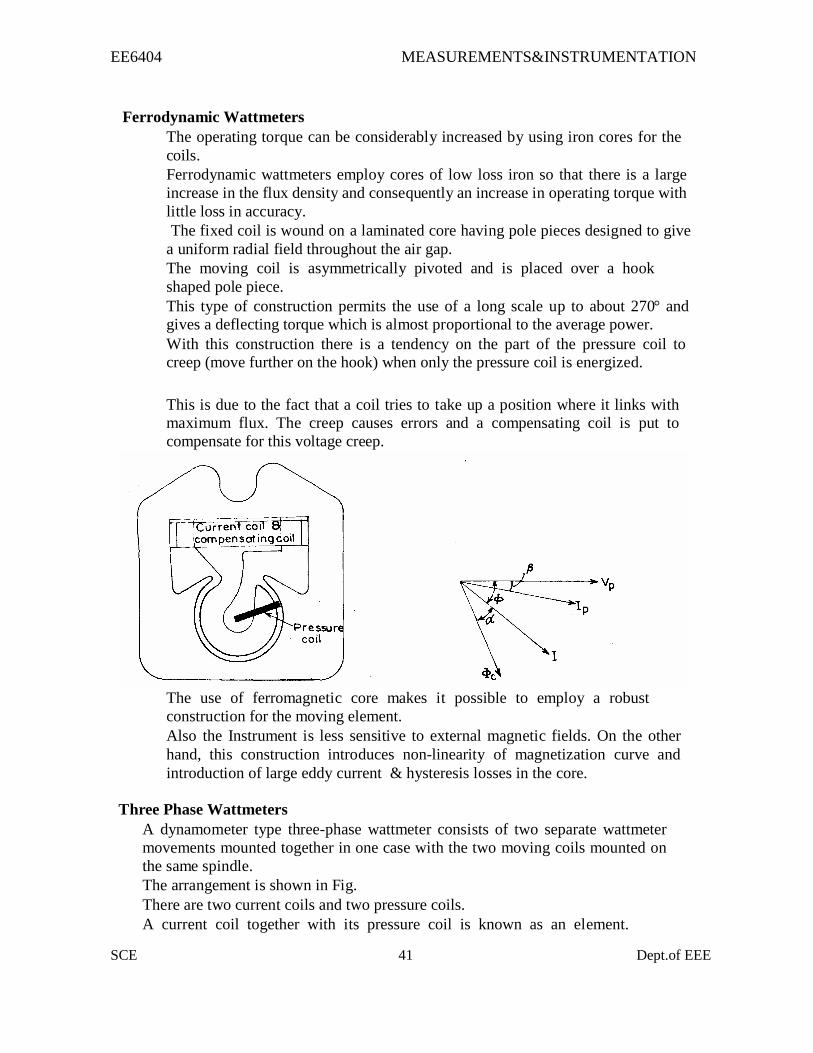
Ferrodynamic Wattmeters
The operating torque can be considerably increased by using iron cores for the
coils.
Ferrodynamic wattmeters employ cores of low loss iron so that there is a large
increase in the flux density and consequently an increase in operating torque with
little loss in accuracy.
The fixed coil is wound on a laminated core having pole pieces designed to give
a uniform radial field throughout the air gap.
The moving coil is asymmetrically pivoted and is placed over a hook
shaped pole piece.
This type of construction permits the use of a long scale up to about 270° and
gives a deflecting torque which is almost proportional to the average power.
With this construction there is a tendency on the part of the pressure coil to
creep (move further on the hook) when only the pressure coil is energized.
This is due to the fact that a coil tries to take up a position where it links with
maximum flux. The creep causes errors and a compensating coil is put to
compensate for this voltage creep.
The use of ferromagnetic core makes it possible to employ a robust
construction for the moving element.
Also the Instrument is less sensitive to external magnetic fields. On the other
hand, this construction introduces non-linearity of magnetization curve and
introduction of large eddy current & hysteresis losses in the core.
Three Phase Wattmeters
A dynamometer type three-phase wattmeter consists of two separate wattmeter
movements mounted together in one case with the two moving coils mounted on
the same spindle.
The arrangement is shown in Fig.
There are two current coils and two pressure coils.
A current coil together with its pressure coil is known as an element.
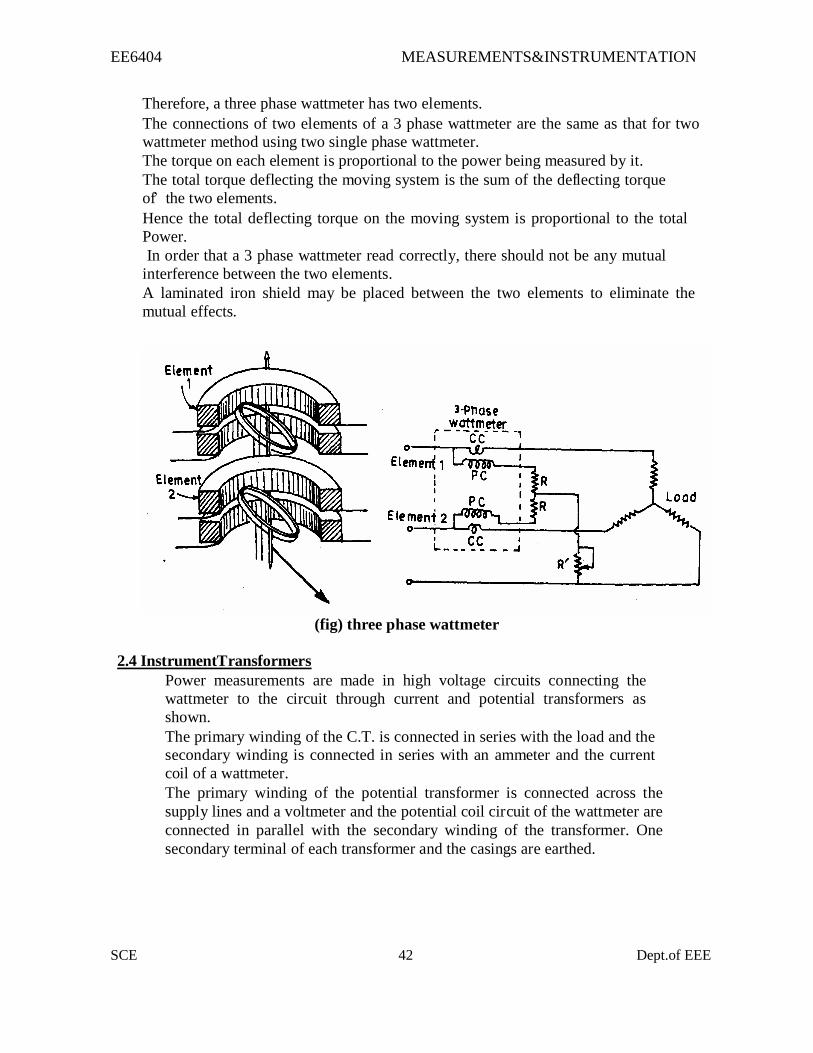
EE6404 MEASUREMENTS&INSTRUMENTATION
SCE 42 Dept.of EEE
Therefore, a three phase wattmeter has two elements.
The connections of two elements of a 3 phase wattmeter are the same as that for two
wattmeter method using two single phase wattmeter.
The torque on each element is proportional to the power being measured by it.
The total torque deflecting the moving system is the sum of the deflecting torque
of’ the two elements.
Hence the total deflecting torque on the moving system is proportional to the total
Power.
In order that a 3 phase wattmeter read correctly, there should not be any mutual
interference between the two elements.
A laminated iron shield may be placed between the two elements to eliminate the
mutual effects.
(fig) three phase wattmeter
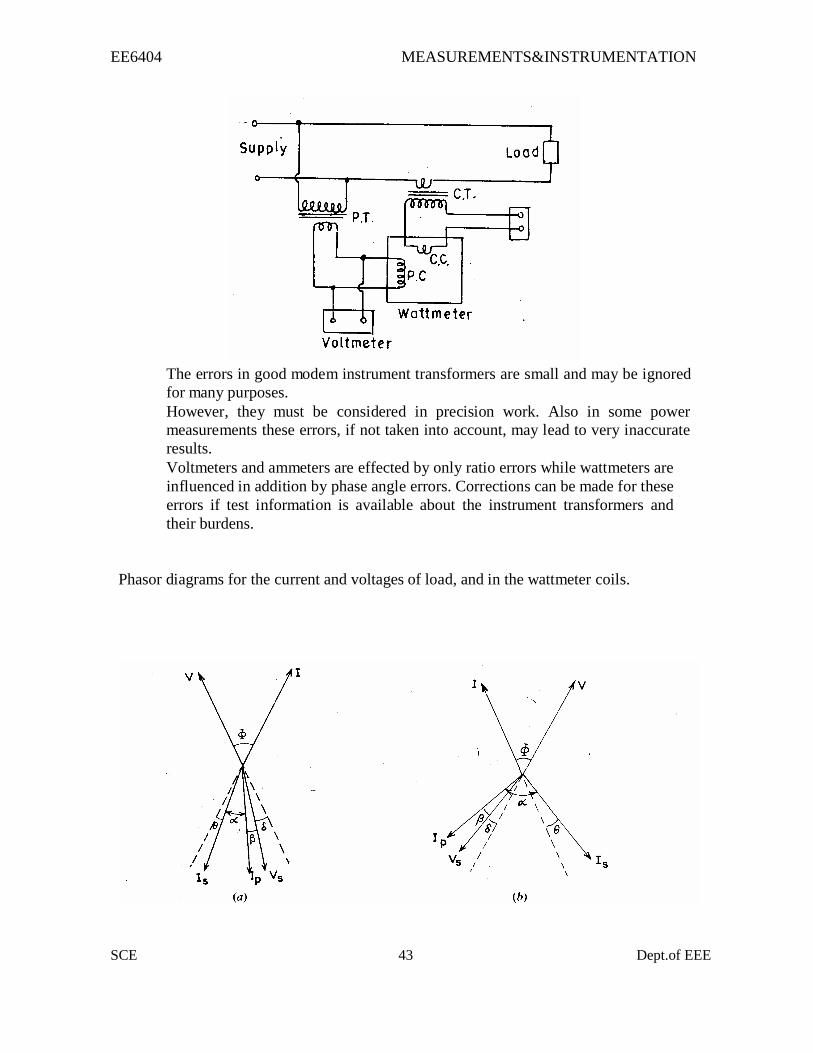
2.4 Instrument Transformers
Power measurements are made in high voltage circuits connecting the
wattmeter to the circuit through current and potential transformers as
shown.
The primary winding of the C.T. is connected in series with the load and the
secondary winding is connected in series with an ammeter and the current
coil of a wattmeter.
The primary winding of the potential transformer is connected across the
supply lines and a voltmeter and the potential coil circuit of the wattmeter are
connected in parallel with the secondary winding of the transformer. One
secondary terminal of each transformer and the casings are earthed.
EE6404 MEASUREMENTS&INSTRUMENTATION
SCE 43 Dept.of EEE
The errors in good modem instrument transformers are small and may be ignored
for many purposes.
However, they must be considered in precision work. Also in some power
measurements these errors, if not taken into account, may lead to very inaccurate
results.
Voltmeters and ammeters are effected by only ratio errors while wattmeters are
influenced in addition by phase angle errors. Corrections can be made for these
errors if test information is available about the instrument transformers and
their burdens. Phasor diagrams for the current and voltages of load, and in the wattmeter coils.
EE6404 MEASUREMENTS&INSTRUMENTATION
SCE 44 Dept.of EEE
2.5 MAGNETIC MEASUREMENTS
The operating characteristics of electrical machines, apparatus and instruments
are greatly influenced by the properties of Ferro-magnetic materials used for their
construction. Therefore, magnetic measurements and a thorough knowledge of
characteristics of magnetic materials are of utmost importance in designing and
manufacturing electrical equipment.
The principal requirements in magnetic measurements are
(i) The measurement of magnetic field strength in air.
(ii) The determination of B-H curve and hysteresis loop for soft Ferro-magnetic
materials.
(iii) The determination of eddy current and hysteresis losses of soft Ferro- magnetic materials subjected to alternating magnetic fields.
(iv) The testing of permanent magnets.
Magnetic measurements have some inherent inaccuracies due to which the measured
values depart considerably from the true values. The inaccuracies are due to the following
reasons
(i) The conditions in the magnetic specimen under test are different from those
assumed in calculations;
(ii) The magnetic materials are not homogeneous
(iv)There is no uniformity between different batches of test specimens even if such
batches are of the same composition.
Types of Tests
Many methods of testing magnetic materials have been devised wherein attempts have
been made to eliminate the inaccuracies. However, attention will be confined to a few
basic methods of ‘ Testing Ferro-magnetic materials. They are:
(i) Ballistic Tests: These tests are generally employed for the determination of B- H curves and hysteresis loops of Ferro-magnetic materials.
(ii) A. C. Testing. These tests may be carried at power, audio or radio frequencies.
They give information about eddy current and hysteresis losses in magnetic materials. (iii) Steady State Tests. These are performed to obtain the steady value of flux
density existing in the air gap of a magnetic circuit.
Ballistic Tests: These tests are used for determination of flux density in a specimen,
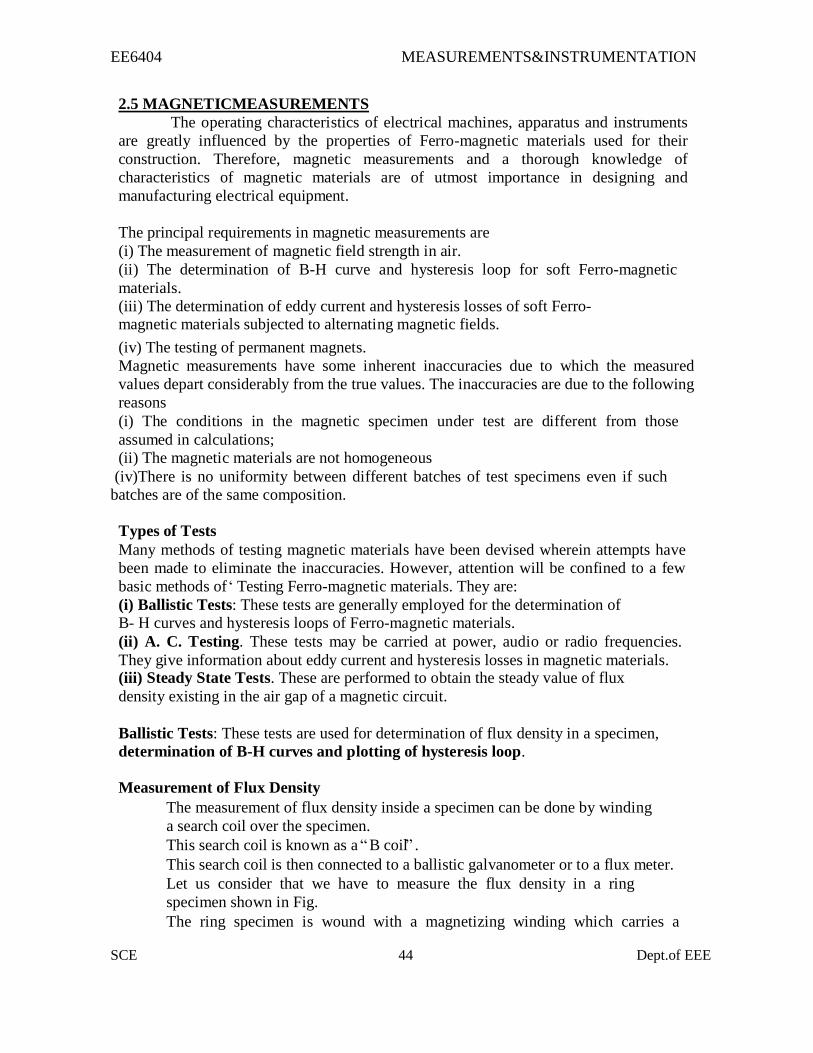
determination of B-H curves and plotting of hysteresis loop. Measurement of Flux Density
The measurement of flux density inside a specimen can be done by winding
a search coil over the specimen.
This search coil is known as a “ B coil” .
This search coil is then connected to a ballistic galvanometer or to a flux meter.
Let us consider that we have to measure the flux density in a ring
specimen shown in Fig.
The ring specimen is wound with a magnetizing winding which carries a
EE6404 MEASUREMENTS&INSTRUMENTATION
SCE 45 Dept.of EEE
current I.
A search coil of convenient number of turns is wound on the specimen and
connected through a resistance and calibrating coil, to a ballistic galvanometer
as shown.
The current through the magnetizing coil is reversed and therefore the flux
linkages of the search coil change inducing an emf in it.
Thus emf sends a current through the ballistic galvanometer causing it to deflect.
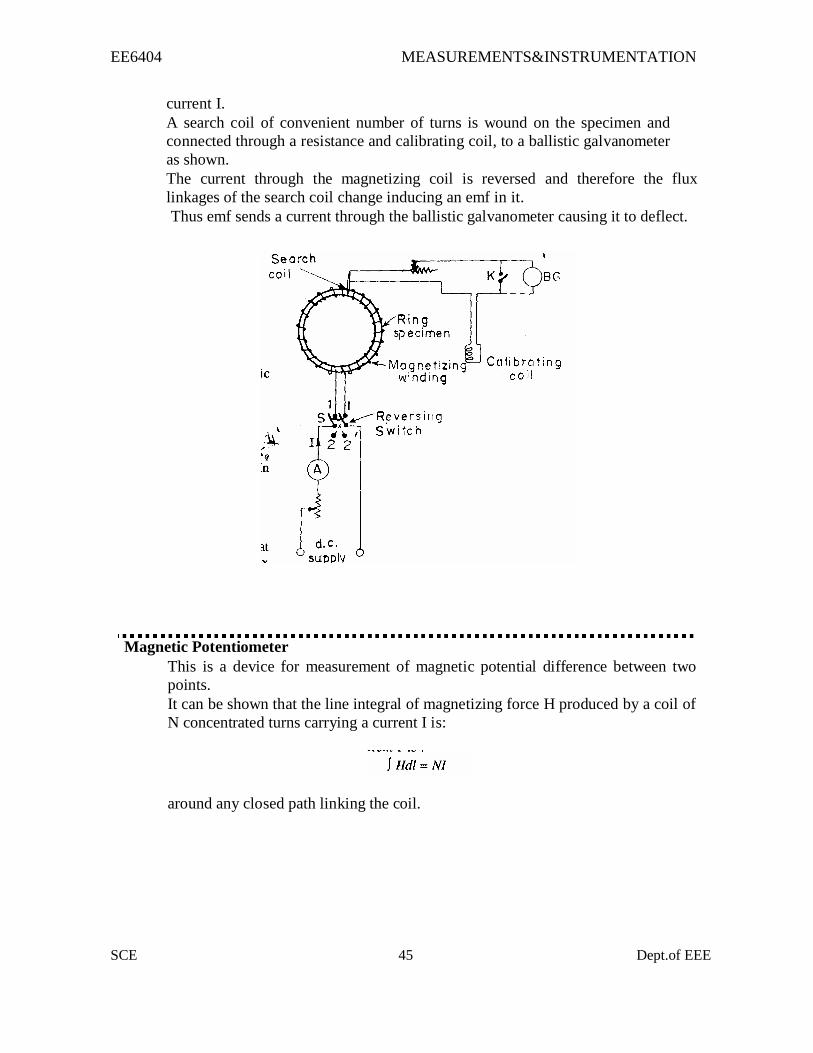
Magnetic Potentiometer
This is a device for measurement of magnetic potential difference between two
points.
It can be shown that the line integral of magnetizing force H produced by a coil of
N concentrated turns carrying a current I is:
around any closed path linking the coil.
EE6404 MEASUREMENTS&INSTRUMENTATION
SCE 46 Dept.of EEE
(Fig) Magnetic potentiometer
This is the circuital law of the magnetic field and forms the basis of
magnetic potentiometer.
A magnetic potentiometer may be used to determine the mmf around a closed
path, or the magnetic potential difference between two points in a magnetic
circuit.
A magnetic potentiometer consists of a one metre long flat and uniform coil
made of two or four layers of thin wire wound unidirectional on a strip of
flexible non-magnetic material.
The coil ends are brought out at the middle of the strip as shown in Fig. and
connected to a ballistic galvanometer.
The magnetic potential difference between points A and B of the field is
measured by placing the ends of the strip at these points and observing the throw
of the ballistic galvanometer when the flux through the specimen is changed.
EE6404 MEASUREMENTS&INSTRUMENTATION
SCE 47 Dept.of EEE
2.6 Determination of B-H curve
Method of reversals
A ring shaped specimen whose dimensions are known is used for the
purpose
After demagnetizing the test is started by setting the magnetising current to its
lowest test vlane.
With galvanometer key K closed, the iron specimen is brought into a
‘ reproducible cyclic magnetic state’ by throwing the reversing switch S
backward and forward about twenty times.
Key K is now opened and the value of flux corresponding to this value of H is
measured by reversing the switch S and noting the throw of galvanometer.
The value of flux density corresponding to this H can be calculated by
dividing the flux by the area of the specimen.
The above procedure is repeated for various values of H up to the
maximum testing point.
The B-H curve may be plotted from the measured values of B
corresponding to the various values of H.
Step by step method
The circuit for this test is shown in Fig.
The magnetizing winding is supplied through a potential divider having a large
number of tapping.
The tappings are arranged so that the magnetizing force H may be
increased, in a number of suitable steps, up to the desired maximum value.
The specimen before being tested is demagnetized.
The tapping switch S is set on tapping I and the switch S is closed.
The throw of the galvanometer corresponding to this increase in
flux density in the specimen, form zero to some value B, is
observed.
Step by step method
After reaching the point of maximum H i.e... when switch S is at tapping
10, the magnetizing current is next reduced, in steps to zero by
moving switch 2 down through the tapping points 9, 8, 7 3, 2,
1.
After reduction of magnetizing force to zero, negative values of
H are obtained by reversing the supply to potential divider and
then moving the switch S up again in order 1, 2, 3 7, 8. 9, 1O.

EE6404 MEASUREMENTS&INSTRUMENTATION
SCE 48 Dept.of EEE
(Fig) Determination of B-H curve step by step method
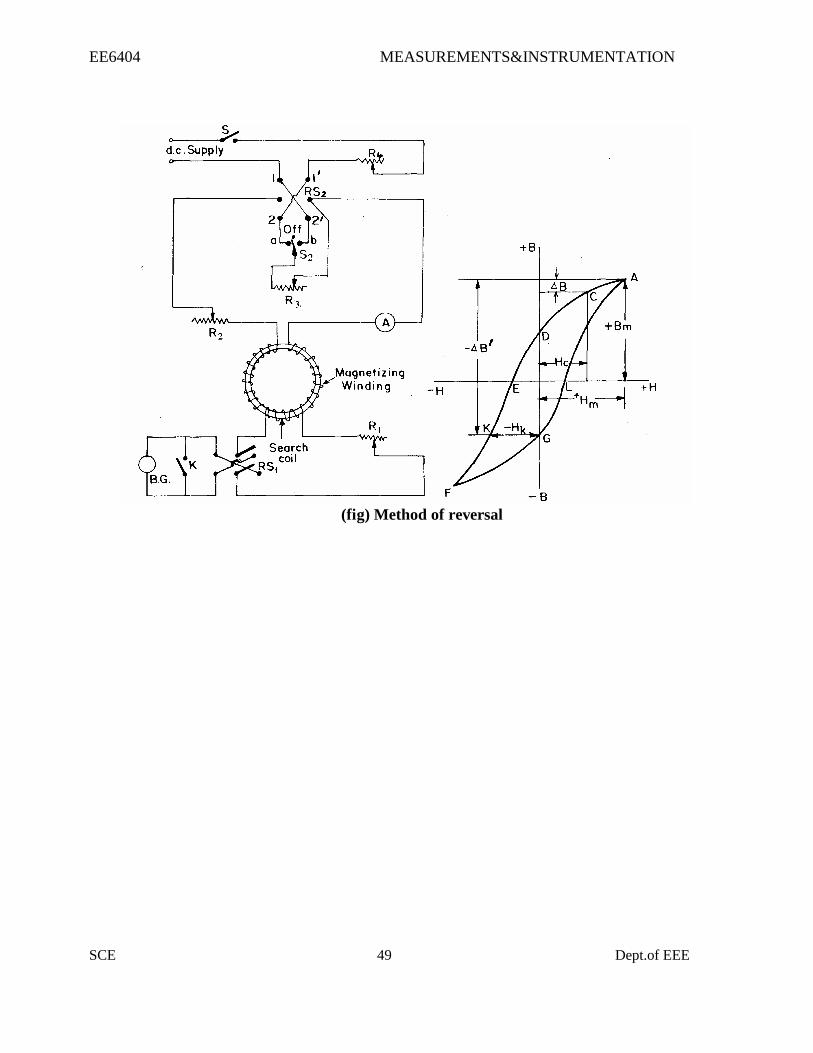
Determination of Hysteresis Loop
Method of reversals
This test is done by means of a number of steps, but the change in flux density
measured at each step is the change from the maximum value + Bm down to
some lower value.
But before the next step is commenced the iron specimen is passed through
the remainder of the cycle of magnetization back to the flux density + Bm.
Thus the cyclic state of magnetization is preserved.
The connections for the method of reversals are shown in Fig.
EE6404 MEASUREMENTS&INSTRUMENTATION
SCE 49 Dept.of EEE
(fig) Method of reversal

EE6404 MEASUREMENTS&INSTRUMENTATION
SCE 50 Dept.of EEE
UNIT III COMPARISON METHODS OF MEASUREMENTS
D.C & A.C Potentiometers
An instrument that precisely measures an electromotive force (emf) or a voltage by opposing to
it a known potential drop established by passing a definite current through a resistor of known
characteristics. (A three-terminal resistive voltage divider is sometimes also called a
potentiometer.) There are two ways of accomplishing this balance: (1) the current I may be held
at a fixed value and the resistance R across which the IR drop is opposed to the unknown may be
varied; (2) current may be varied across a fixed resistance to achieve the needed IR drop.
The essential features of a general-purpose constant-current instrument are shown in the
illustration. The value of the current is first fixed to match an IR drop to the emf of a reference
standard cell. With the standard-cell dial set to read the emf of the reference cell, and the
galvanometer (balance detector) in position G1, the resistance of the supply branch of the
circuit is adjusted until the IR drop in 10 steps of the coarse dial plus the set portion of the
standard-cell dial balances the known reference emf, indicated by a null reading of the
galvanometer. This adjustment permits the potentiometer to be read directly in volts. Then, with
the galvanometer in position G2, the coarse, intermediate, and slide-wire dials are adjusted
until the galvanometer again reads null. If the potentiometer current has not changed, the emf
of the unknown can be read directly from the dial settings. There is usually a switching
arrangement so that the galvanometer can be quickly shifted between positions 1 and 2 to check
that the current has not drifted from its set value.
Circuit diagram of a general-purpose constant-current potentiometer, showing essential features
Potentiometer techniques may also be used for current measurement, the unknown current being
sent through a known resistance and the IR drop opposed by balancing it at the voltage terminals
of the potentiometer. Here, of course, internal heating and consequent resistance change of the
current-carrying resistor (shunt) may be a critical factor in measurement accuracy; and the shunt
EE6404 MEASUREMENTS&INSTRUMENTATION
SCE 51 Dept.of EEE
design may require attention to dissipation of heat resulting from its I2R power consumption.
Potentiometer t e c h n i q u e s h a v e been extended to alternating-voltage
measurements, but generally at a reduced accuracy level (usually 0.1% or so). Current is set on
an ammeter which must have the same response on ac as on dc, where it may be calibrated with
a potentiometer and shunt combination. Balance in opposing an unknown voltage is achieved in
one of two ways: (1) a slide-wire and phase-adjustable supply; (2) separate in-phase and
quadrature adjustments on slide wires supplied from sources that have a 90° phase difference.
Such potentiometers have limited use in magnetic testing.
An instrument that precisely measures an electromotive force (emf) or a voltage by opposing to
it a known potential drop established by passing a definite current through a resistor of known
characteristics. (A three-terminal resistive voltage divider is sometimes also called a
potentiometer.) There are two ways of accomplishing this balance: (1) the current I may be held
at a fixed value and the resistance R across which the IR drop is opposed to the unknown may be
varied; (2) current may be varied across a fixed resistance to achieve the needed IR drop.
The essential features of a general-purpose constant-current instrument are shown in the
illustration. The value of the current is first fixed to match an IR drop to the emf of a reference
standard cell. With the standard-cell dial set to read the emf of the reference cell, and the
galvanometer (balance detector) in position G1, the resistance of the supply branch of the
circuit is adjusted until the IR drop in 10 steps of the coarse dial plus the set portion of the
standard-cell dial balances the known reference emf, indicated by a null reading of the
galvanometer. This adjustment permits the potentiometer to be read directly in volts. Then, with
the galvanometer in position G2, the coarse, intermediate, and slide-wire dials are adjusted
until the galvanometer again reads null. If the potentiometer current has not changed, the emf
of the unknown can be read directly from the dial settings. There is usually a switching
arrangement so that the galvanometer can be quickly shifted between positions 1 and 2 to check
that the current has not drifted from its set value.
Potentiometer techniques may also be used for current measurement, the unknown current being
sent through a known resistance and the IR drop opposed by balancing it at the voltage terminals
of the potentiometer. Here, of course, internal heating and consequent resistance change of the
current-carrying resistor (shunt) may be a critical factor in measurement accuracy
Potentiometer techniques have been extended to alternating-voltage measurements, but generally
at a reduced accuracy level (usually 0.1% or so). Current is set on an ammeter which must have
the same response on ac as on dc, where it may be calibrated with a potentiometer and shunt
combination. Balance in opposing an unknown voltage is achieved in one of two ways: (1) a
slide-wire and phase-adjustable supply; (2) separate in-phase and quadrature adjustments on
slide wires supplied from sources that have a 90° phase difference. Such potentiometers have
EE6404 MEASUREMENTS&INSTRUMENTATION
SCE 52 Dept.of EEE
limited use in magnetic testing
(1) An electrical measuring device used in determining the electromotive force (emf) or voltage
by means of the compensation method. When used with calibrated standard resistors, a
potentiometer can be employed to measure current, power, and other electrical quantites; when
used with the appropriate measuring transducer, it can be used to gauge various non-electrical
quantities, such as temperature, pressure, and the composition of gases.
distinction is made between DC and AC potentiometers. In DC potentiometers, the voltage
being measured is compared to the emf of a standard cell. Since at the instant of compensation
the current in the circuit of the voltage being measured equals zero, measurements can be made
without reductions in this voltage. For this type of potentiometer, accuracy can exceed 0.01
percent. DC potentiometers are categorized as either high-resistance, with a slide-wire resistance
ranging from The higher resistance class can measure up to 2 volts (V) and is used in testing
highly accurate apparatus. The low-resistance class is used in measuring voltage up to 100 mV.
To measure higher voltages, up to 600 V, and to test voltmeters, voltage dividers are connected
to potentiometers. Here the voltage drop across one of the resistances of the voltage divider is
compensated; this constitutes a known fraction of the total voltage being measured.
In AC potentiometers, the unknown voltage is compared with the voltage drop produced by a
current of the same frequency across a known resistance. The voltage being measured is then
adjusted both for amplitude and phase. The accuracy of AC potentiometers is of the order of 0.2
percent. In electronic automatic DC and AC potentiometers, the measurements of voltage are
carried out automatically. In this case, the compensation of the unknown voltage is achieved
with the aid of a servomechanism that moves the slide along the resistor, or rheostat. The
servomechanism is actuated by the imbalance of the two voltages, that is, by the
difference between the compensating voltage and the voltage that is being compensated. In
electronic automatic potentiometers, the results of measurements are read on dial indicators,
traced on recorder charts or received as numerical data. The last method makes it possible to
input the data directly into a computer. In addition to measurement, electronic automatic
potentiometers are also capable of regulating various parameters of industrial processes. In this
case, the slide of the rheostat is set in a position that predetermines, for instance, the
temperature of the object to be regulated. The voltage imbalance of the potentiometer drives the
servomechanism, which then increases or decreases the electric heating or regulates the fuel
supply.
A voltage divider with a uniform variation of resistance, a device that allows some fraction of a
given voltage to be applied to an electric circuit. In the simplest case, the device consists of a
conductor of high resistance equipped with a sliding contact. Such dividers are used in electrical
engineering, radio engineering, and measurement technology. They can also be utilized in analog
computers and in automation systems, where, for example, they function as sensors for linear or
angular displacement
3.2 D.C & A.C Bridges Bridge circuits are used very commonly as a variable conversion element in measurement
systems and produce an output in the form of a voltage level that changes as the measured
physical quantity changes. They provide an accurate method of measuring resistance,
EE6404 MEASUREMENTS&INSTRUMENTATION
SCE 53 Dept.of EEE
inductance and capacitance values, and enable the detection of very small changes in these
quantities about a nominal value. They are of immense importance in measurement system
technology because so many transducers measuring physical quantities have an output that is
expressed as a change in resistance, inductance or capacitance. The displacement-measuring
strain gauge, which has a varying resistance output, is but one example of this class of
transducers. Normally, excitation of the bridge is by a d.c. voltage for resistance measurement
and by an a.c. voltage for inductance or capacitance measurement. Both null and deflection
types of bridge exist, and, in a like manner to instruments in general, null types are mainly
employed for calibration purposes and deflection types are used within closed-loop automatic
control schemes.
Null-type, d.c. bridge (Wheatstone bridge)
A null-type bridge with d.c. excitation, commonly known as a
Wheatstone bridge, has the form shown in Figure 7.1. The four arms of the bridge consist of
the unknown resistance Ru, two equal value resistors R2 and R3 and a variable resistor Rv
(usually a decade resistance box). A d.c. voltage Vi is applied across the points AC and the
resistance Rv is varied until the voltage measured across points BD is zero. This null point
is usually measured with a high sensitivity galvanometer.
To analyses the Whetstone bridge, define the current flowing in each arm
to be I1 . . . I4 as shown in Figure 7.1. Normally, if a high impedance voltage-measuring
instrument is used, the current Im drawn by the measuring instrument will be very small and
can be approximated to zero. If this assumption is made, then, for Im D 0:
I1 =I3 and I2 =I4
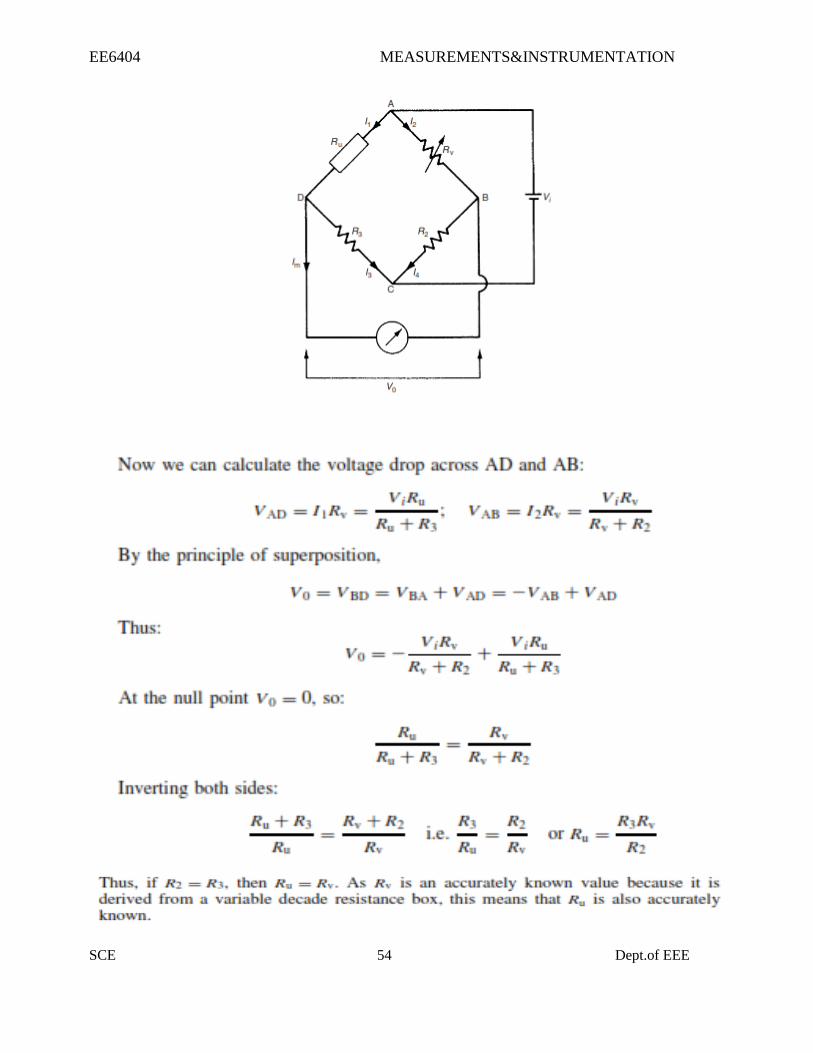
EE6404 MEASUREMENTS&INSTRUMENTATION
SCE 54 Dept.of EEE

EE6404 MEASUREMENTS&INSTRUMENTATION
SCE 55 Dept.of EEE
Deflection-type d.c. bridge A deflection-type bridge with d.c. excitation is shown in Figure 7.2. This differs from the Wheatstone bridge mainly in that the variable resistance Rv is replaced by a fixed
resistance R1 of the same value as the nominal value of the unknown resistance Ru . As the
resistance Ru changes, so the output voltage V0 varies, and this relationship between V0 and
Ru must be calculated. This relationship is simplified if we again assume that a high impedance voltage
measuring instrument is used and the current drawn by it, Im , can be approximated to zero. (The case when this assumption does not hold is covered later in this section.) The analysis is then exactly the same as for the preceding example of the Wheatstone bridge, except that Rv is replaced by R1. Thus, from equation (7.1), we have:
V0=
Vi * (
Ru /
Ru +
R3)- (
R1 /
R1+
R2)
When Ru is at its nominal value, i.e. for Ru D R1, it is clear that V0 D 0 (since R2 D
R3). For other values of Ru, V0 has negative and positive values that vary in a non-
linear way with Ru.
A.C bridges
Bridges with a.c. excitation are used to measure unknown impedances. As
for d.c. bridges, both null and deflection types exist, with null types being generally reserved
for calibration duties.
Null-type impedance bridge
A typical null-type impedance bridge is shown in Figure 7.7. The null point can
be conveniently detected by monitoring the output with a pair of headphones connected via
an operational amplifier across the points BD. This is a much cheaper method of null
detection than the application of an expensive galvanometer that is required for a d.c.
Wheatstone bridge.
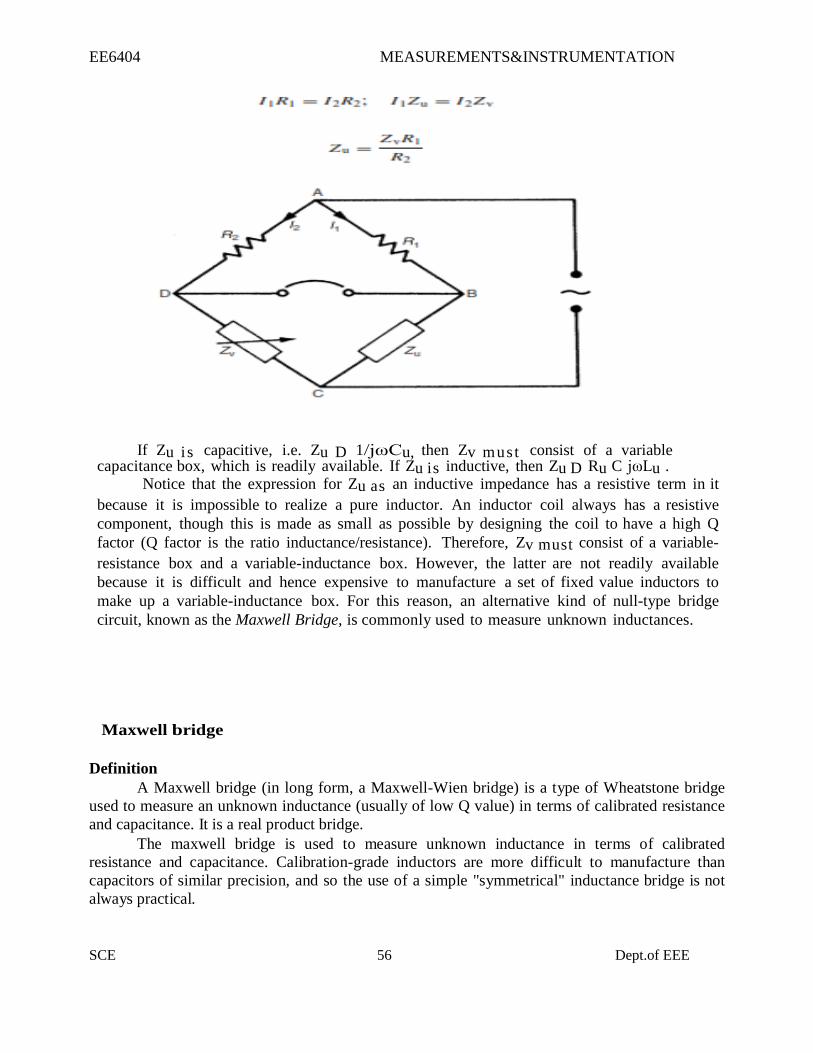
EE6404 MEASUREMENTS&INSTRUMENTATION
SCE 56 Dept.of EEE
If Zu i s capacitive, i.e. Zu D 1/jωCu, then Zv must consist of a variable capacitance box, which is readily available. If Zu is inductive, then Zu D Ru C jωLu .
Notice that the expression for Zu as an inductive impedance has a resistive term in it
because it is impossible to realize a pure inductor. An inductor coil always has a resistive
component, though this is made as small as possible by designing the coil to have a high Q
factor (Q factor is the ratio inductance/resistance). Therefore, Zv must consist of a variable-
resistance box and a variable-inductance box. However, the latter are not readily available
because it is difficult and hence expensive to manufacture a set of fixed value inductors to
make up a variable-inductance box. For this reason, an alternative kind of null-type bridge
circuit, known as the Maxwell Bridge, is commonly used to measure unknown inductances.
Maxwell bridge
Definition
A Maxwell bridge (in long form, a Maxwell-Wien bridge) is a type of Wheatstone bridge
used to measure an unknown inductance (usually of low Q value) in terms of calibrated resistance
and capacitance. It is a real product bridge.
The maxwell bridge is used to measure unknown inductance in terms of calibrated
resistance and capacitance. Calibration-grade inductors are more difficult to manufacture than
capacitors of similar precision, and so the use of a simple "symmetrical" inductance bridge is not
always practical.
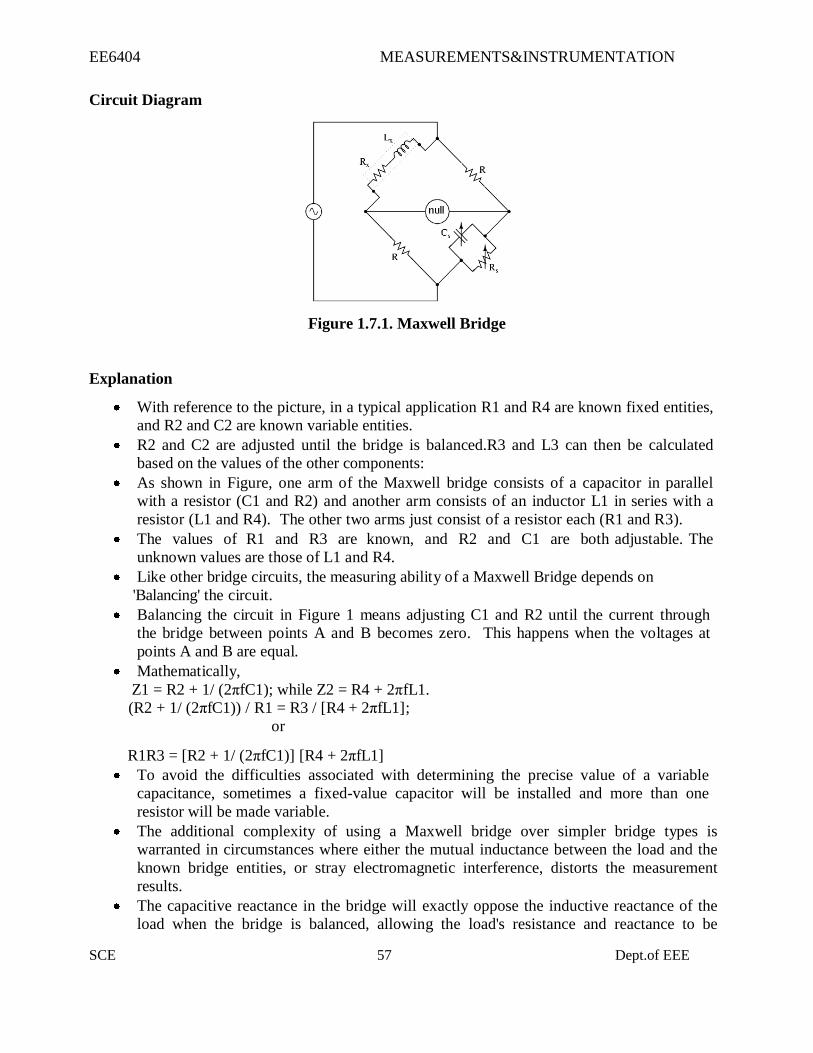
EE6404 MEASUREMENTS&INSTRUMENTATION
SCE 57 Dept.of EEE
Circuit Diagram
Figure 1.7.1. Maxwell Bridge
Explanation
With reference to the picture, in a typical application R1 and R4 are known fixed entities,
and R2 and C2 are known variable entities.
R2 and C2 are adjusted until the bridge is balanced.R3 and L3 can then be calculated
based on the values of the other components:
As shown in Figure, one arm of the Maxwell bridge consists of a capacitor in parallel
with a resistor (C1 and R2) and another arm consists of an inductor L1 in series with a
resistor (L1 and R4). The other two arms just consist of a resistor each (R1 and R3).
The values of R1 and R3 are known, and R2 and C1 are both adjustable. The
unknown values are those of L1 and R4.
Like other bridge circuits, the measuring ability of a Maxwell Bridge depends on
'Balancing' the circuit.
Balancing the circuit in Figure 1 means adjusting C1 and R2 until the current through
the bridge between points A and B becomes zero. This happens when the voltages at
points A and B are equal.
Mathematically,
Z1 = R2 + 1/ (2πfC1); while Z2 = R4 + 2πfL1.
(R2 + 1/ (2πfC1)) / R1 = R3 / [R4 + 2πfL1];
or
R1R3 = [R2 + 1/ (2πfC1)] [R4 + 2πfL1]
To avoid the difficulties associated with determining the precise value of a variable
capacitance, sometimes a fixed-value capacitor will be installed and more than one
resistor will be made variable.
The additional complexity of using a Maxwell bridge over simpler bridge types is
warranted in circumstances where either the mutual inductance between the load and the
known bridge entities, or stray electromagnetic interference, distorts the measurement
results.
The capacitive reactance in the bridge will exactly oppose the inductive reactance of the
load when the bridge is balanced, allowing the load's resistance and reactance to be
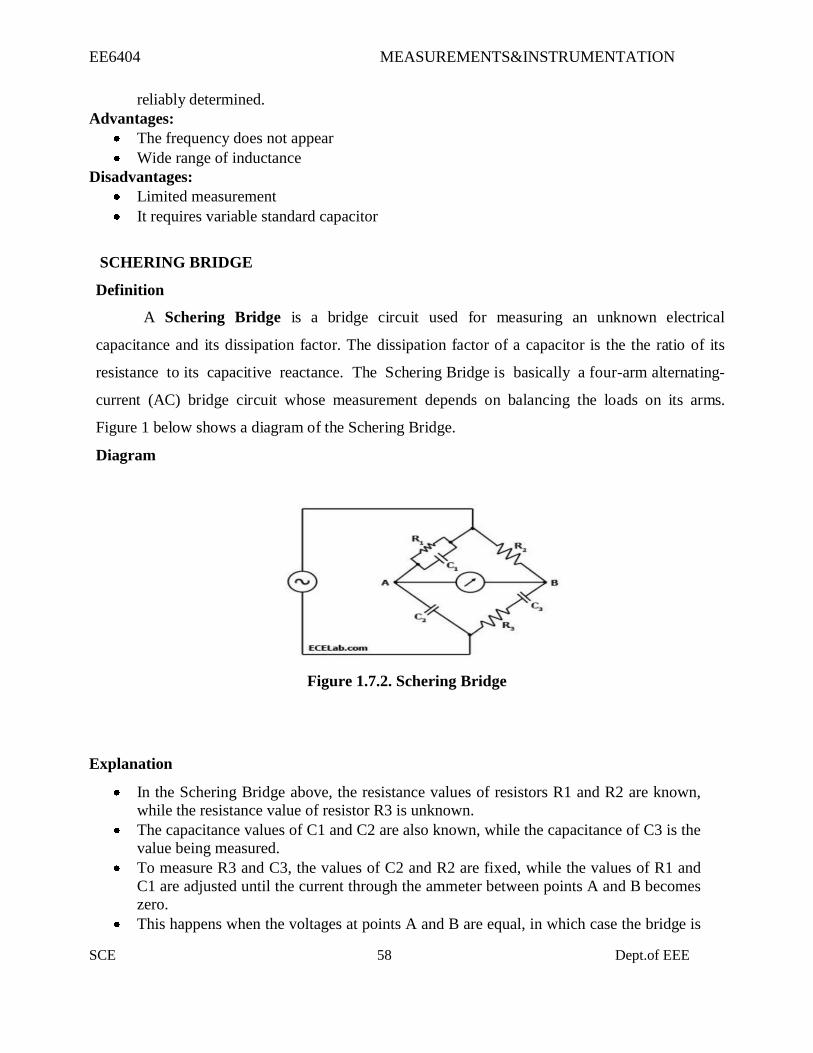
EE6404 MEASUREMENTS&INSTRUMENTATION
SCE 58 Dept.of EEE
reliably determined.
Advantages:
The frequency does not appear
Wide range of inductance
Disadvantages:
Limited measurement
It requires variable standard capacitor
SCHERING BRIDGE
Definition
A Schering Bridge is a bridge circuit used for measuring an unknown electrical
capacitance and its dissipation factor. The dissipation factor of a capacitor is the the ratio of its
resistance to its capacitive reactance. The Schering Bridge is basically a four-arm alternating-
current (AC) bridge circuit whose measurement depends on balancing the loads on its arms.
Figure 1 below shows a diagram of the Schering Bridge.
Diagram
Figure 1.7.2. Schering Bridge
Explanation
In the Schering Bridge above, the resistance values of resistors R1 and R2 are known,
while the resistance value of resistor R3 is unknown.
The capacitance values of C1 and C2 are also known, while the capacitance of C3 is the
value being measured.
To measure R3 and C3, the values of C2 and R2 are fixed, while the values of R1 and
C1 are adjusted until the current through the ammeter between points A and B becomes
zero.
This happens when the voltages at points A and B are equal, in which case the bridge is
EE6404 MEASUREMENTS&INSTRUMENTATION
SCE 59 Dept.of EEE
said to be 'balanced'.
When the bridge is balanced, Z1/C2 = R2/Z3, where Z1 is the impedance of R1 in
parallel with C1 and Z3 is the impedance of R3 in series with C3.
In an AC circuit that has a capacitor, the capacitor contributes a capacitive reactance to
the impedance.
Z1 = R1/[2πfC1((1/2πfC1) + R1)] = R1/(1 + 2πfC1R1)
while Z3 =1/2πfC3 + R3. 2πfC2R1/ (1+2πfC1R1) = R2/(1/2πfC3 + R3); or
2πfC2 (1/2πfC3 + R3) = (R2/R1) (1+2πfC1R1); or
C2/C3 + 2πfC2R3 = R2/R1 + 2πfC1R2.
When the bridge is balanced, the negative and positive reactive components are equal and
cancel out, so
2πfC2R3 = 2πfC1R2 or
R3 = C1R2 / C2.
Similarly, when the bridge is balanced, the purely resistive components are equal,
so C2/C3 = R2/R1 or C3 = R1C2 / R2.
Note that the balancing of a Schering Bridge is independent of
frequency.
Advantages:
Balance equation is independent of frequency
Used for measuring the insulating properties of electrical cables and equipment’s
HAY BRIDGE
Definition
A Hay Bridge is an AC bridge circuit used for measuring an unknown inductance by balancing
the loads of its four arms, one of which contains the unknown inductance. One of the arms of a
Hay Bridge has a capacitor of known characteristics, which is the principal component used for
determining the unknown inductance value. Figure 1 below shows a diagram of the Hay Bridge.
Explanation
As shown in Figure 1, one arm of the Hay bridge consists of a capacitor in series with a
resistor (C1 and R2) and another arm consists of an inductor L1 in series with a resistor
(L1 and R4).
The other two arms simply contain a resistor each (R1 and R3). The values of R1and
R3 are known, and R2 and C1 are both adjustable.
The unknown values are those of L1 and R4.
Like other bridge circuits, the measuring ability of a Hay Bridge depends on 'balancing' the
circuit.
Balancing the circuit in Figure 1 means adjusting R2 and C1 until the current through the
ammeter between points A and B becomes zero. This happens when the voltages at points
A and B are equal.

EE6404 MEASUREMENTS&INSTRUMENTATION
SCE 60 Dept.of EEE
Diagram
Figure 1.7.3. Hay Bridge
When the Hay Bridge is balanced, it follows that Z1/R1 = R3/Z2 wherein Z1 is the
impedance of the arm containing C1 and R2 while Z2 is the impedance of the arm
containing L1 and R4.
Thus, Z1 = R2 + 1/(2πfC) while Z2 = R4 + 2πfL1.
[R2 + 1/(2πfC1)] / R1 = R3 / [R4 + 2πfL1]; or
[R4 + 2πfL1] = R3R1 / [R2 + 1/(2πfC1)]; or
R3R1 = R2R4 + 2πfL1R2 + R4/2πfC1 + L1/C1.
When the bridge is balanced, the reactive components are equal, so
2πfL1R2 = R4/2πfC1, or R4 = (2πf) 2L1R2C1.
Substituting R4, one comes up with the following equation:
R3R1 = (R2+1/2πfC1) ((2πf) 2L1R2C1) + 2πfL1R2 + L1/C1; or
L1 = R3R1C1 / (2πf) 2R22C12 + 4πfC1R2 + 1);
L1 = R3R1C1 / [1 + (2πfR2C1)2]
After dropping the reactive components of the equation since the bridge is
Thus, the equations for L1 and R4 for the Hay Bridge in Figure 1 when it is balanced
are:
L1 = R3R1C1 / [1 + (2πfR2C1)2]; and
R4 = (2πfC1)2R2R3R1 / [1 + (2πfR2C1)2]
Advantages:
Simple expression
Disadvantages:
It is not suited for measurement of coil

EE6404 MEASUREMENTS&INSTRUMENTATION
SCE 61 Dept.of EEE
WIEN BRIDGE:
Definition
A Wien bridge oscillator is a type of electronic oscillator that generates sine waves. It can
generate a large range of frequencies. The circuit is based on an electrical network originally
developed by Max Wien in 1891. Wien did not have a means of developing electronic gain so a
workable oscillator could not be realized. The modern circuit is derived from William Hewlett's
1939 Stanford University master's degree thesis. Hewlett, along with David Packard co-founded
Hewlett-Packard. Their first product was the HP 200A, a precision sine wave oscillator based on
the Wien bridge. The 200A was one of the first instruments to produce such low distortion.
Diagram
Figure 1.7.4 Wein bridge
Amplitude stabilization:
The key to Hewlett's low distortion oscillator is effective amplitude stabilization.
The amplitude of electronic oscillators tends to increase until clipping or other gain
limitation is reached. This leads to high harmonic distortion, which is often
undesirable.
Hewlett used an incandescent bulb as a positive temperature coefficient (PTC)
thermistor in the oscillator feedback path to limit the gain.
The resistance of light bulbs and similar heating elements increases as their
temperature increases.

EE6404 MEASUREMENTS&INSTRUMENTATION
SCE 62 Dept.of EEE
If the oscillation frequency is significantly higher than the thermal time constant of the
heating element, the radiated power is proportional to the oscillator power.
Since heating elements are close to black body radiators, they follow the Stefan-
Boltzmann law.
The radiated power is proportional to T4, so resistance increases at a greater rate than
amplitude.
If the gain is inversely proportional to the oscillation amplitude, the oscillator gain
stage reaches a steady state and operates as a near ideal class A amplifier, achieving
very low distortion at the frequency of interest.
At lower frequencies the time period of the oscillator approaches the thermal time
constant of the thermistor element and the output distortion starts to rise significantly.
Light bulbs have their disadvantages when used as gain control elements in Wien
bridge oscillators, most notably a very high sensitivity to vibration due to the bulb's
micro phonic nature amplitude modulating the oscillator output, and a limitation in
high frequency response due to the inductive nature of the coiled filament.
Modern Distortion as low as 0.0008% (-100 dB) can be achieved with only modest
improvements to Hewlett's original circuit.
Wien bridge oscillators that use thermistors also exhibit "amplitude bounce" when the
oscillator frequency is changed. This is due to the low damping factor and long time
constant of the crude control loop, and disturbances cause the output amplitude to
exhibit a decaying sinusoidal response.
This can be used as a rough figure of merit, as the greater the amplitude bounce after a
disturbance, the lower the output distortion under steady state conditions.
Analysis:
Figure 1.7.4 Input analysis
Input admittance analysis
If a voltage source is applied directly to the input of an ideal amplifier with feedback,
the input current will be:

EE6404 MEASUREMENTS&INSTRUMENTATION
SCE 63 Dept.of EEE
Where vin is the input voltage, vout is the output voltage, and Zf is the feedback
impedance. If the voltage gain of the amplifier is defined as:
And the input admittance is defined as:
Input admittance can be rewritten as:
If Av is greater than 1, the input admittance is a negative resistance in parallel with an
inductance.
If a resistor is placed in parallel with the amplifier input, it will cancel some of the
negative resistance. If the net resistance is negative, amplitude will grow until
clipping occurs.
If a resistance is added in parallel with exactly the value of R, the net resistance will
be infinite and the circuit can sustain stable oscillation at any amplitude allowed by
the amplifier.
Advantages:
Frequency sensitive
Supply voltage is purely sinusoidal
3.3 Transformer Ratio Bridges & Self-Balancing Bridges
TRNSFORMER RATIO BRIDGES
INTRODUCTION
The product to which this manual refers should be installed, commissioned, operated and
maintained under the supervision of a competent Electrical Engineer in accordance with
relevant statutory requirements and good engineering practice, including Codes of Practice
where applicable, and properly used within the terms of the specification.
The instructions in this manual should familiarize qualified personal with the proper procedures
to keep all new unit(s) in proper operating condition. These instructions for installation,
operation and maintenance of Package Compact Substation should be read carefully and used as
a guide during installation and initial operation.
These instructions do not propose to cover all details or variations in equipment, nor to provide
for every contingency to be met in connection with installation, operation, or maintenance.
Should further information be desired, or particular problems arise which are not covered, please
contact the nearest ABB office.
We would in particular stress the importance of care in:
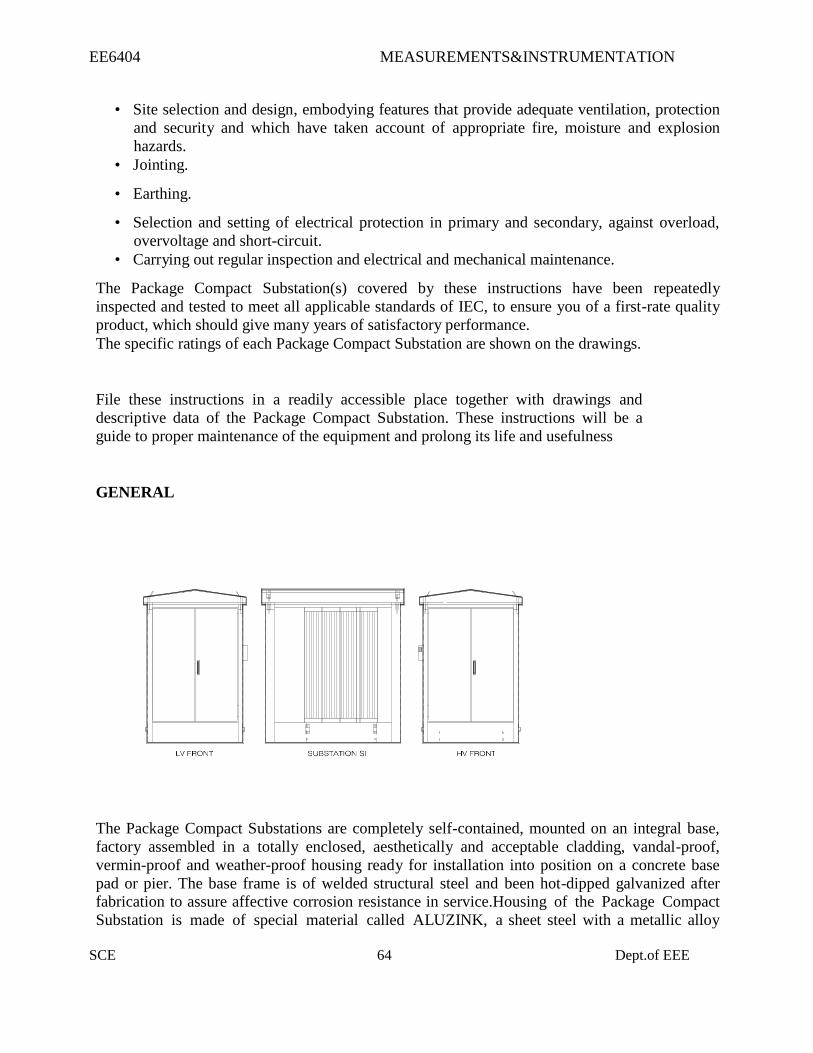
EE6404 MEASUREMENTS&INSTRUMENTATION
SCE 64 Dept.of EEE
• Site selection and design, embodying features that provide adequate ventilation, protection
and security and which have taken account of appropriate fire, moisture and explosion
hazards.
• Jointing.
• Earthing.
• Selection and setting of electrical protection in primary and secondary, against overload,
overvoltage and short-circuit.
• Carrying out regular inspection and electrical and mechanical maintenance.
The Package Compact Substation(s) covered by these instructions have been repeatedly
inspected and tested to meet all applicable standards of IEC, to ensure you of a first-rate quality
product, which should give many years of satisfactory performance.
The specific ratings of each Package Compact Substation are shown on the drawings.
File these instructions in a readily accessible place together with drawings and
descriptive data of the Package Compact Substation. These instructions will be a
guide to proper maintenance of the equipment and prolong its life and usefulness
GENERAL
The Package Compact Substations are completely self-contained, mounted on an integral base,
factory assembled in a totally enclosed, aesthetically and acceptable cladding, vandal-proof,
vermin-proof and weather-proof housing ready for installation into position on a concrete base
pad or pier. The base frame is of welded structural steel and been hot-dipped galvanized after
fabrication to assure affective corrosion resistance in service.Housing of the Package Compact
Substation is made of special material called ALUZINK, a sheet steel with a metallic alloy
EE6404 MEASUREMENTS&INSTRUMENTATION
SCE 65 Dept.of EEE
coating. The alloy consists of 55% aluminum and 43.4% zinc. This provides optimum corrosion
protection.The housing has three compartments, separated with ALUZINK sheet. The
transformer compartment is completely separated from the medium voltage and low voltage
compartments.
RECEIVING / INSPECTION / STORAGE
The Package Compact Substation is shipped from the factory ready for installation on site. It has
been submitted to all normal routine tests before being shipped, and it is not required to do any
voltage testing before putting it into service, provided the substation has not sustained any
damage during transportation.
Immediately upon receipt of the Package Compact Substation, examine them to determine if any
damage or loss was sustained during transit. If abuse or rough handling is evident, file a damage
claim with carrier and promptly notify the nearest ABB office. ABB ELECTRICAL
INDUSTRIES CO. LTD. is not responsible for damage of goods after delivery to the carrier;
however, we will lend assistance if notified of claims.
PERSONNEL SAFETY
The first and most important requirements are the protection against contact with live parts
during normal service as well as maintenance or modifications.
This is the reason why all live parts have been metal enclosed, so that when the parts are live and
the Package Compact Substation doors are open, no one can be able to touch them.
Also, it is safe in case any short-circuiting or sparking occurs at the busbars.
VENTILATION
Transformer compartment has been provided with sand trap louvers, to prevent ingress of sand
and that proper air circulation should take place.
EARTHING
Proper earthing busbar has been provided.
HANDLING
Lifting lugs has been provided on top of four corners of the housing for lifting the DPS by crane
and chains as a single unit, otherwise this can be done by a forklift of sufficient capacity, but the
lifting fork must be positioned under the transformer portion.
INSTALLATIONS
A clean, flat surface capable of supporting the Package Compact Substation unit weight is the
only requirement for a foundation. It is, however, important that adequate accessibility,
ventilation and ease of inspection of the unit must be provided.
In all installation work, the safety regulations for electrical installations have to be observed.
EE6404 MEASUREMENTS&INSTRUMENTATION
SCE 66 Dept.of EEE
Each Package Compact Substation must be permanently grounded or earthed by connecting an
affective recognised ground or earth as prescribed by the latest applicable edition of IEC or
ANSI requirements.The Package Compact Substation is designed to operate with a solidly
grounded neutral system. The neutral connection should be solidly and permanently grounded.
Tap connections
All units have taps located in the High Voltage winding. The tap arrangement is shown on the
nameplate of the transformer. These taps are provided to furnish rated output voltage when the
input voltage differs from the rated voltage.
To change tap connections, do the following steps:
1. De-energized the unit, short-circuit both the high and low voltage connections and ground
both sides.
2. Unlock the tap changer handle, and then move the taps changer handle to the desired tap,
then locked the tap changer handle.
3. Remove safety shorts and ground connections from the high voltage and low voltage
buses.
After ensuring that no tools or hardware was left in the enclosure, and the enclosures are closed
properly, you may then re-energize the Package Compact Substation. Make sure that the tap
connections are proper for the required voltage as listed on the nameplate. The transformer is
normally shipped with the tap changer for the rated voltage.
Cable connections
When making outside cable connections, conductors suitable for at least 85°C should be used.
All connections should be made without placing undue stress on the terminals. Conductors
should be securely fastened in place and adequately supported with allowances for expansion
and contraction.
FINAL INSPECTION PRIOR TO ENERGIZATION
After the Package Compact Substation has been found to be in good condition and the protective
equipment is operational, the substation may be connected to the network. However, it is
recommended that the transformer to be left to settle for 1 or 2 days after installation so those air
bubbles in the oil have time to dissolve before connecting the voltage.
Before energizing the unit, a complete electrical inspection should be made. The following
checklist should be used as a minimum requirement.
Electrical Inspection
All external connections have been made properly (phasing of connections to terminals,
etc.).
All connections are tight and secure.
All accessory circuits are operational. Check the transformer protective equipment and test

EE6404 MEASUREMENTS&INSTRUMENTATION
SCE 67 Dept.of EEE
the function of their electrical circuits:
Thermometers (alarms, tripping)
Pressure relay (tripping)
Oil level indicator
Ensure that all fuses are inserted and in the correct position
All tap connections are properly positioned.
The neutral and ground connections have been properly made.
Mechanical Inspection
All shipping members have been removed.
There is no obstructions in or near the openings for ventilation.
No tools or other articles are left inside the enclosures.
All protective covers are in place or closed and bolted tight.
MAINTENANCE AND PERIODIC INSPECTION
In order to assure a long lifetime and correct and reliable operation of equipment delivered for
this facility it is of utmost importance to perform maintenance regularly.
Following general rules should always be considered before starting maintenance activity.
1. Authority from responsible engineer shall always be obtained before starting any
maintenance.
2. Follow safety procedure established in carrying out the work.
Realize that no set of safety or maintenance instructions will ever be written that can adequately
cover all accident possibilities.
Therefore "SAFETY" as dictated by actual current conditions, always takes precedence over
any previously prepared safety or maintenance instructions. Assume nothing. Take the
precautions that you personally deem necessary in addition to those included in standard
practice.
• Be familiar with the drawings and previous test records before starting activity.
• Scrutinize maintenance instructions given for the equipment to be maintained.
Maintenance information is given in the Operation and Maintenance Manual for each type of
equipment.
The main dangers of such process are:
• Inaccessible lubrication points (greased for life) cannot be lubricated and may seize up.
• Areas not lubricated may be subject to corrosion.
• The high-pressure spray may damage equipment.
• Especially protective coatings may be removed.
Bolt Tightness
All connections should be tight and secure. Bolts and nuts on busbar and terminal lugs should be
EE6404 MEASUREMENTS&INSTRUMENTATION
SCE 68 Dept.of EEE
torqued and marked properly.
Inspection and Testing
The need for preventive maintenance will vary on operating conditions. Where heavy dust
conditions exist, an accumulation of dust on the equipment may effect the operation of unit
substation and its protective apparatus.
When normal maintenance inspection and cleaning of bus connections, relays, lug connections,
and other part of the distribution system is being made, it is advisable to operate and check
circuit breakeror switch-disconnector operation.
Routine Field Testing
Routine field testing of the electrical equipment is intended to enable maintenance personal to
determine, without laboratory conditions or complicated equipment, that a particular electrical
equipment is able to perform its basic circuit functions.
The following constitutes a guide to tests that might be performed during routine maintenance.
1. Insulation Resistance Test Extreme atmospheres and conditions may reduce the dielectric withstandability of any
insulating material. An instrument commonly known as "megger" is used to perform this
test.
The voltage recommended for this test should be at least 50 percent greater than the
circuit rating; however, a minimum of 500 volts is permissible. Tests should be made
between phases of opposite polarity as well as from current carrying parts of the circuit
protective device to ground. Also, a test should be made between the line-and-load
terminals with the circuit protective device in the "OFF" position.
Resistance values below one megaohm are considered unsafe and should be investigated
for possible contamination on the surfaces.
NOTE: For individual circuit protective device's resistance readings, load and line
conductors should be disconnected. If not disconnected, the test measurements
will also include the characteristics of the attached circuits.
A temperature and humidity reading are recommended and recorded during the
testing period.
Insulation resistivity is markedly effected by temperature and humidity conditions. Based
condition of one (1) megaohm per kV assumes a 20°C wet bulb reading. The following
table shall be used to adjust readings to the 20°C constant.
2. Connection Test Connections to the circuit protective device should be inspected to determine that a
proper electrical joint is present. If overheating in these connections is evident by
discoloration or signs of arcing, the connections should be removed and the connecting
surfaces clean before re-connections. It is essential that electrical connections be made
properly to prevent and reduce overheating.
3. Mechanical Operation
EE6404 MEASUREMENTS&INSTRUMENTATION
SCE 69 Dept.of EEE
During routine tests, mechanical operation of the circuit protective devices or disconnects
should be checked by turning it "ON" and "OFF" at least three times.
3.5 INTERFERENCE AND SCREENING
Interference is one of the most serious as well as most common problems in audio electronics. We
encounter interference when it produces effects like noise, hiss, hum or cross-talk. If a radio
engineer faces such problems, good theoretical knowledge as well as experience is required to
overcome them.
However, it should be considered, that interference is always present. All technical remedies only
aim at reducing the effect of interference to such a degree, that it is neither audible nor disturbing.
This is mainly achieved by different ways of screening. This paper will explain the technical
background of interference and provides some common rules and hints which may help you to
reduce the problems.
TYPES OF INTERFERENCE.
Theoretically, the effects and mechanism of a single interference can well be calculated. But in
practice, the complex coupling systems between pieces of equipment prevent precise prediction
of interference. The following picture shows the different types of interference coupling.The
different types of interference between the components of an electric system. If we consider all
possible coupling paths in the diagram above we will find 10 different paths. This means a variety
of 1024 different combinations. It should be noted, that not only the number of paths, but also
their intensity is important.
SYMMETRICAL AND ASYMMETRICAL INTERFERENCE. Having a closer look at the interference of cable, we find that hf-interference currents cause
measurable levels on signal (audio) lines and on supply lines. A ground-free interference source
would produce signals on a cable which spread along the line. These voltages and currents can be
called symmetrical interference. In practice this rarely occurs.
Through interference, asymmetrical signals are produced in respect to the ground. The
asymmetrical interference current flows along the two wires of the symmetrical line to the sink
and via the ground back to the source. These interference signals are cancelled at the symmetrical
input.
GALVANIC COUPLING OF INTERFERENCE.
Galvanic coupling of interference occurs if the source and the sink of interference are coupled by
a conductive path.As can be seen from the equivalent circuit diagram, the source impedance of
the interference consists of the resistance RC and the inductance LC of the conductor, which are
common to the two parts of the circuit. From these elements the interference source voltage can
be calculated.
CAPACITIVE COUPLING OF INTERFERENCE.
The capacitive coupling of interference occurs due to any capacitance between the source and
sink of interference.
EE6404 MEASUREMENTS&INSTRUMENTATION
SCE 70 Dept.of EEE
Principle of capacitive coupling of interference.
The current in the interference sink can be calculated as
The interference voltage in the sink is proportional to its impedance. Systems of high impedance
are therefore more sensitive to interference than those of low impedance. The coupled
interference current depends on the rate of change of the interference and on the coupling
capacitance CC.
INDUCTIVE COUPLING OF INTERFERENCE.
Inductive coupling of interference occurs if the interference sink is in the magnetic
field of the interference source (e.g. coils, cables, etc.)
Principle of the inductive coupling of interference.
The interference voltage induced by inductive coupling is
- increasing the distance between conductors
- mounting conductors close to conductive surfaces
- using short conductors
- avoiding parallel conductors
- screening
- using twisted cable Note that by the same means the capacitive as well as the inductive coupling of
interference will be reduced.
3.5 Electrostatic And Electromagnetic Interference
INTERFERENCE BY RADIATION. Interference by electromagnetic radiation becomes important at cable lengths greater than 1/7 of
the wavelength of the signals. At frequencies beyond 30Mhz, most of the interference occurs by
e.m. radiation
Principle of the coupling by e.m. Interference.
INTERFERENCE BY ELECTROSTATIC CHARGE. Charged persons and objects can store electrical charges of up to several micro- Coulombs, which
means voltages of some 10kV in respect to ground. Dry air, artificial fabrics and friction favour
these conditions.When touching grounded equipment, an instantaneous discharge produces arcing
with short, high current pulses and associated strong changes of the e.m. field.
REDUCTION OF INTERFERENCE
There are a number of methods to prevent interference. But all of them only reduce
the interference and never fully prevent it. This means there will never be a system which is 100%
safe from interference. Because the efforts and the cost will rise with the degree of reduction of
interference, a compromise has to be found between the effort and the result.
The requirement for the reduction of interference will depend on:
- The strength of the interference source
- The sensitivity of the interference sink
- The problems caused by interference

EE6404 MEASUREMENTS&INSTRUMENTATION
SCE 71 Dept.of EEE
- The costs of the equipment
We will discuss ways of preventing interference, their effect, and the main aspects for the
optimum efficiency of each method.
3.6 GROUNDING (OR EARTHING).
This is one of the simplest but most efficient methods to reduce interference.
Grounding can be used for three different purposes:
1. Protection Ground
Provides protection for the operators from dangerous voltages. Widely used on
mains-operated equipment.
2. Function Ground
The ground is used as a conductive path for signals.
Example: in asymmetrical cables screen, which is one conductor for the signal, is
connected to the ground.
3. Screening Ground
Used to provide a neutral electrical path for the interference, to prevent that the
interfering voltages or currents from entering the circuit. In this chapter we will
only consider the third aspect. Grounding of equipment is often required for the
cases 1 or 2 anyhow, so that the screening ground is available "free
of charge". Sometimes the grounding potential, provided by the mains connection, is very
"polluted". This means that the ground potential itself already carries an interfering signal. This is
especially likely if there are big power consumers in the neighbourhood or even in the same
building. Using such a ground might do more harm than good.
The quality of the ground line can be tested by measuring it with a storage scope
against some other ground connection, e.g. a metal water pipe or some metal parts
of the construction.
Never use the Neutral (N) of the mains as ground.
It might contain strong interference, Because it carries the load current of all electrical
consumers.The grounding can be done by single-point grounding or by multi-point grounding.
Each method has advantages which depend on the frequency range of the signal frequencies. All
parts to be grounded are connected to one central point. This resultsin no "ground loops"
being produced. This means the groundingconductors do not form any closed conductive path in
which magneticinterference could induce currents. Furthermore, conductive linesbetween the
equipment are avoided, which could produce galvanic coupling of interference.Central
grounding requires consistent arrangement of the groundingcircuit
and requires insulation of the individual parts of the circuit. This is sometimes very difficult to
achieve.A system using the single-point grounding.
MULTI-POINT GROUNDING:
In multi-point grounding all parts are connected to ground at as many points as possible. This
EE6404 MEASUREMENTS&INSTRUMENTATION
SCE 72 Dept.of EEE
requires that the ground potential itself is as widely spread as possible. In practice, all
conductive parts of the chassis, the cases, the shielding, the room and the installation are
included in the network.
SCREENING.
When considering the effect of electrical and magnetic fields, we have to distinguish
between low and high frequencies. At high frequencies the skin effect plays an
important roll for the screening. The penetration describes the depth from the surface
of the conductor, where the current density has decayed to 37% compared to the
surface of the conductor.
SCREENING OF CABLES.
When signal lines run close to interference sources or when the signal circuit is very
sensitive to interference, screening of signal lines will give an improvement. There
are different ways of connecting the cable screen:
Three different ways of connecting the cable screen.Cable screen not connected. This
screen will not prevent any interference, because the charge on the screen, produced by
interference, will remain and will effect the central signal line. Also, the current induced
by interference in the linewill flow through the sink, effecting the signal.Cable screen
grounded on one side only.This screen will only prevent interference at low
frequency signals. Forelectromagnetic interference, where the wavelength is short
comparedto the length of the cable, the screening efficiency is poor.Cable screen
grounded on either sidet is effective for all kinds of interference. Any current induced in
thescreen by magnetic interference will flow to ground. The inner of thecable is not
affected. Only the voltage drop on the screen will affect thesignal in the screen. type of
grounding is
- Ensure proper and careful connection of the screens.
- Use suitable plugs in connection with the cable screen.
3.7 MULTIPLE EARTH AND EARTH LOOPS
SIMPLE TWO SYNODIC PERIOD CYCLER (CASE 1)
The simple two Earth-Mars synodic period cycler. In the circular coplanar model it has a
period P=l.348 years, a radius of aphelion R~ = l .15 A U and the V, at Earth is 5.6 M s . For
the "Up" transfer, the Earth-Mars transfer is Type I or I1 and the Mars-Earth leg is Type VI.
The trajectory departs the Earth with the V, inward of the Earth's velocity vector taking it
through a perihelion of about 0.93 AU, crossing the Earth's orbit ahead of the Earth and
outward to Mars' orbit. As seen from Figure 1 the transfer to Mars is about 225 degrees and
takes a little over nine months. The trajectory continues onward making three complete orbits
about the Sun without coming near either the Earth or Mars again until passing through its
original starting point on the Earth's orbit for the third time, somewhat behind the Earth and
EE6404 MEASUREMENTS&INSTRUMENTATION
SCE 73 Dept.of EEE
finally encountering the Earth 2/7 of a revolution about the Sun (102.9 deg.) from the starting
point. The cycler has made 3 2/7 complete orbits about the Sun while Earth has made 4 2/7.
The Earth flyby must now rotate the incoming V, vector, which is outward, to the
symmetrically inward orientation to begin the next cycle. Unfortunately, the rotation angle
required is approximately 135 degrees and with a V, of 5.65 km/s the Earth can only rotate
the V, vector about 82 degrees. Now in the actual Solar System, the orbit of Mars is elliptical
with a semi-major axis of 1.524 AU, a perihelion of 1.381 AU and an aphelion of 1.666 AU.
Thus the simple Case 1 cycler does not quite reach Mars' average distance from the Sun. It is
thus clear that a real world version of the Case 1 cycler would require AV to make up for the
inability of the Earth to rotate the V, vector, as well as for the fact that over the course of
seven cycles, of two synodic periods each, the Case 1 cycler will not make it to Mars' orbit
more than one half of the time. The real value of Case 1 is as a basis for variations that can
address these deficiencies.
TWO SYNODIC PERIOD CYCLER WITH "BACKFLIP" (CASE 2)
Modifylng Case 1 by introducing another Earth flyby, approximately six months and 180
degrees after the first, changes the situation somewhat. This six month, 180 degree
transfer, or "backflip" trajectory, was first introduced for lunar trajectories by U p h ~ f f . ~
The "Up" trajectory for this version leaves the Earth with a Type I or I1 short transfer to Mars
and a Type V transfer back to Earth. This transfer to the first Earth encounter makes
2 11/14 revolutions about the Sun in 3 11/14 years. The Earth flyby then puts the vehicle onto
a heliocentric orbit with a period of one year which re-encounters the Earth approximately six
months and 180 degrees later, completing the 3 217 revolutions in 4 2/7 years. This second
Earth flyby then sends the vehicle on to the next Mars encounter, continuing the cycle. Figure
2 shows this cycler trajectory. Note that the first Earth encounter is in the lower portion of the
plot. The backflip trajectory is not shown since its difference from the Earth's orbit is
primarily in the z-direction. The second Earth flyby
and departure point for the second cycle is indicated slightly left of straight up on the Earth's
orbit. In the circular co-planar model the Earth-Mars-Earth trajectory has a period P=l.325
years, a radius of aphelion R~ z l . 4A5 U and the V, at Earth is 4.15 MSF.or Case 2, the
transfer does not reach Mars' orbit in the circular co-planar model, but in the real world does
reach Mars when Mars is near its perihelion.
The lower V, for Case 2 enables the Earth to rotate the V, vector as much as about 102
degrees, thus easily enabling the first Earth flyby to rotate the incoming V, to the required
near polar orientation required for the backflip trajectory outgoing V, as well as the second
earth flyby to rotate the near polar incoming V, to the outgoing V, required
for the transfer to the next Mars, Thus, although Case 2 has many desirable characteristics,
it cannot be used for an entire seven cycles. If fact it will reach Mars for at most two of the
seven cycles without propulsive AVto augment the gravity assists.
TWO SYNODIC PERIOD CYCLER WITH "BACKFLIP" PLUS 1-YEAR LOOP
(CASE 3)
Modifying Case 2 to introduce a third Earth flyby in addition to the "backflip" adds additional
flexibility. This is accomplished by adding a one year Earth-Earth loop either before or after
the backflip. The order of the one year loop and the "backflip" can be chosen to best

EE6404 MEASUREMENTS&INSTRUMENTATION
SCE 74 Dept.of EEE
advantage in the real world. The TJp" trajectory for this version leaves the Earth with a Type
I short transfer to Mars and a Type I11 or IV transfer back to Earth. This transfer to the first
Earth encounter makes 1 11/14 revolutions about the Sun in 2
11/14 years. The Earth flyby the puts the vehicle onto a heliocentric orbit with a period of one
year which re-encounters the Earth approximately six months and 180 degrees later and then
re-encounters the Earth one year later, or vice versa. The final Earth flyby then sends the
vehicle on to the next Mars encounter. Figure 3 shows this cycler trajectory. Again as in Case
2, the backflip trajectory is not seen. The one year Earth-Earth loop is also not shown. In the
circular co-planar model the Earth-Mars-Earth trajectory has a period P=l.484 years, a radius
of aphelion R~=l .65A U and the V, at Earth is 5.4 km/s.
In this case the transfer reaches an aphelion approximately equal to Mars' aphelion and
will thus always cross Mars orbit in the real world. Analysis of Case 3 with the actual
ephemerides of Earth and Mars is considered in more detail below.
1-YEAR LOOP (CASE 3)
TWO SYNODIC PERIOD CYCLER WITH ONE OR TWO 1-YEAR LOOPS Modifying Case 1 to introduce one or two one year Earth-Earth loops or even a two year
Earth-Earth loop without a backflip is also possible, it leads however, to much higher
V,'s less desirable characteristics that any of Cases 1,2 or 3, or the Aldrin Cycler for that
matter.
DETAILED ANALYSIS OF CASE 3
A detailed analysis of Case 3 was performed using the actual ephemerides of the
Earth and Mars. The trajectories were modeled as Sun-centered point-to-point conics
connecting the Earth and Mars flybys. The flybys were modeled as instantaneous V m
rotations. This ― V m -matching‖ model gives excellent insight into both the heliocentric
and planetocentric trajectories and sufficient accuracy for developing long term trajectory
scenarios that can be closely reproduced with fully numerically integrated trajectory models.
The Table shows data for a full cycle of seven two-synodic period cyclers (30 years). This
should approximately repeat since the Earth and Mars are very nearly at the same inertial
positions every 15 years.The choice of one year loop or backflip and whether the backflip is
―north‖ or ―south‖ needs to be made in each case to make best use of the arrival and
departure V,‘s to minimize the required bending by the Earth and potential required AV.
The Mars flybys (given to the nearest 1000 km) are all at reasonably high altitudes. Whereas
in the circular co-planar analysis the Mars flybys are arbitrarily high, in the real world the
Mars gravity assist must control the inclination of the heliocentric orbit as well as adjust the
energy slightly to properly phase for the next encounter. The Mars V,‘s vary between about
3 km/s and 8 km/s which compares to the value of 5.3 km/s in the circular coplanar case.
The Earth V,‘s vary between about 4 km/s and 7.5 km/s which compares to 5.4 km/s.
EE6404 MEASUREMENTS&INSTRUMENTATION
SCE 75 Dept.of EEE
UNIT IV STORAGE AND DISPLAY DEVICES
4.1 Recorders
A recorder is a measuring instrument which records time varying quantity, even after the quantity or
variable to be measured has stopped. The electrical quantities such as voltage & current are measured directly.
The non- electrical quantities are recorded using indirect methods. The non- electrical quantities are first
converted to their equivalent voltages or currents, using various transducers.
Electronic recorders may be classified as:
1. Analog recorders
2. Digital recorders
Analog recorders dealing with analog systems can be classified as
1. Graphic recorders
2. Oscillographic recorders
3. Magnetic Tape recorders
Digital recorders dealing with digital output can be classified as
1. Incremental digital recorders
2. Synchronous digital recorders
4.2 Magnetic Disk And Tape
Magnetic Tape Recorder
Ø The magnetic tape recorders are used for high frequency signal recording.
Ø In these recorders, the data is recorded in a way that it can be reproduced in electrical form any
time.
Ø Also main advantage of these recorders is that the recorded data can be replayed for almost
infinite times.
Ø Because of good higher frequency response, these are used in
Instrumentation systems extensively.
Basic Components of Tape Recorder
Following are the basic components of magnetic tape recorder
1. Recording Head
2. Magnetic Tape
3. Reproducing Head
4. Tape Transport Mechanism
5. Conditioning Devices
Recording Head
Ø The construction of the magnetic recording head is very much similar to the construction of a
Transformer having a toroidal core with coil.
EE6404 MEASUREMENTS&INSTRUMENTATION
SCE 76 Dept.of EEE
Ø There is a uniform fine air gap of 5µ m to 15µ m between the head and the magnetic tape.
(Fig) Magnetic tape recording head
Ø When the current used for recording is passed through coil wound around magnetic core, it
produces magnetic flux.
Ø The magnetic tape is having iron oxide particles.
Ø When th e tape is passing the head, the flux pr oduced due to recording current gets linked with
iron oxide part ices on th e magnetic tape and these particles get magnetized.
Ø This magnetization particle remain as it is, e vent Hough the magnetic tape leaves the gap.
Ø The act ual record ing ta kes place at the tra iling edg e of the air gap.
Ø Any signal is recorded in the form of the patterns.
Ø These magnetic patterns are dispersed anyw here along the length of mag netictape in accordance
with the variation in recording current with respect to time.
Magnetic Tape
Ø The magnetic tape is made of thin sheet of tough and dimensionally stable plastic ribbon.
Ø One side of this plastic ribbon is coated by powdered iron oxide particles (Fe2O3) thick.
Ø The magnetic tape is wound around a reel.
Ø This tape is transferred from one reel to another.
Ø When the tape passes across air gap magnetic pattern is created in accordance with variation of
recording current.
Ø To reproduce this pattern, the same tape with some recorded pattern is passed across another
magnetic head in which voltage is induced.
Ø This voltage induced is in accordance with the magnetic pattern.
Reproducing Head
Ø The use of the reproducing head is to get the recorded data played back.
Ø The working of the reproducing head is exactly opposite to that of the recording
head.
Ø The reproducing head detects the magnetic pattern recorded on the tape.
Ø The head converts the magnetic pattern back to the original electrical signal.
Ø In appearance, both recording and reproducing heads are very much similar.
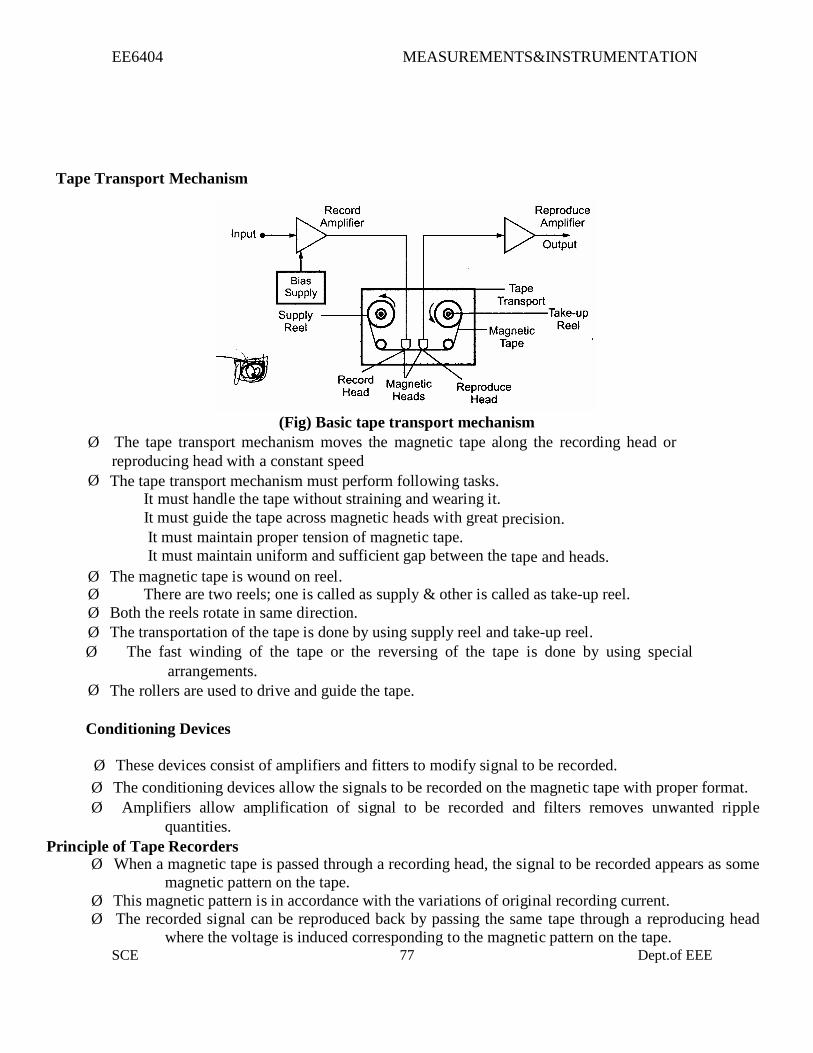
EE6404 MEASUREMENTS&INSTRUMENTATION
SCE 77 Dept.of EEE
Tape Transport Mechanism
(Fig) Basic tape transport mechanism
Ø The tape transport mechanism moves the magnetic tape along the recording head or
reproducing head with a constant speed
Ø The tape transport mechanism must perform following tasks.
It must handle the tape without straining and wearing it.
It must guide the tape across magnetic heads with great precision.
It must maintain proper tension of magnetic tape.
It must maintain uniform and sufficient gap between the tape and heads.
Ø The magnetic tape is wound on reel.
Ø There are two reels; one is called as supply & other is called as take-up reel.
Ø Both the reels rotate in same direction.
Ø The transportation of the tape is done by using supply reel and take-up reel.
Ø The fast winding of the tape or the reversing of the tape is done by using special
arrangements.
Ø The rollers are used to drive and guide the tape.
Conditioning Devices
Ø These devices consist of amplifiers and fitters to modify signal to be recorded.
Ø The conditioning devices allow the signals to be recorded on the magnetic tape with proper format.
Ø Amplifiers allow amplification of signal to be recorded and filters removes unwanted ripple
quantities.
Principle of Tape Recorders Ø When a magnetic tape is passed through a recording head, the signal to be recorded appears as some
magnetic pattern on the tape.
Ø This magnetic pattern is in accordance with the variations of original recording current.
Ø The recorded signal can be reproduced back by passing the same tape through a reproducing head
where the voltage is induced corresponding to the magnetic pattern on the tape.
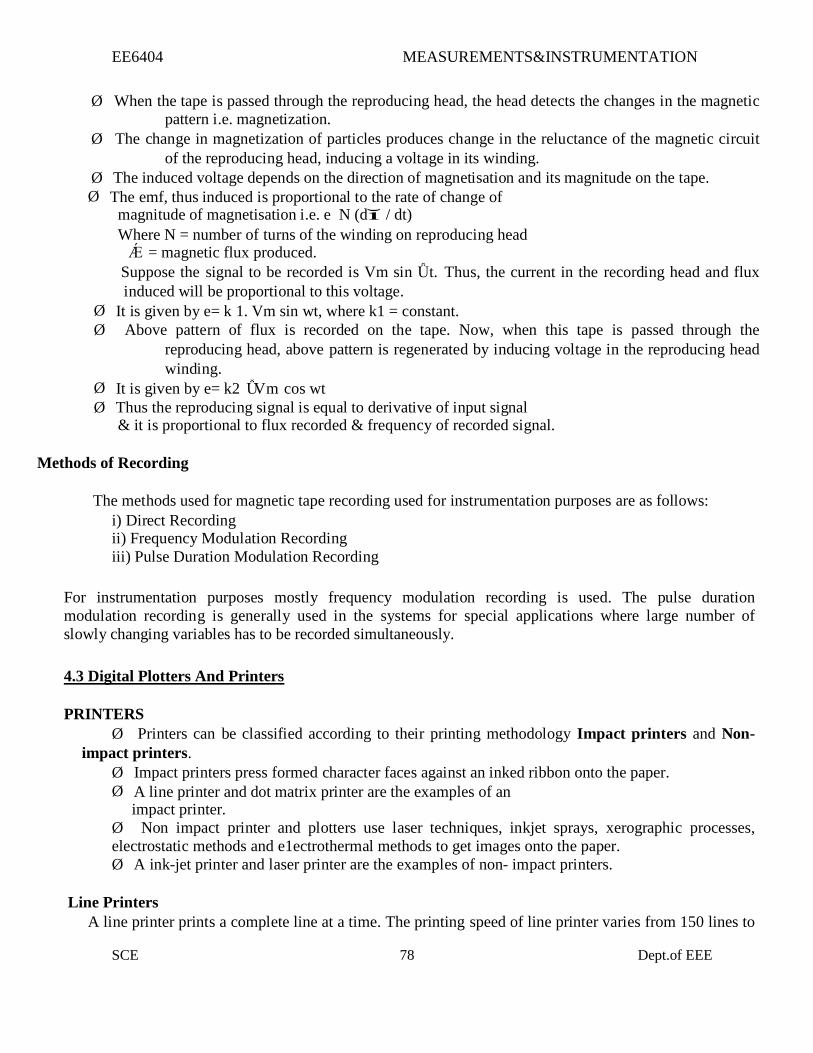
EE6404 MEASUREMENTS&INSTRUMENTATION
SCE 78 Dept.of EEE
Ø When the tape is passed through the reproducing head, the head detects the changes in the magnetic
pattern i.e. magnetization.
Ø The change in magnetization of particles produces change in the reluctance of the magnetic circuit
of the reproducing head, inducing a voltage in its winding.
Ø The induced voltage depends on the direction of magnetisation and its magnitude on the tape.
Ø The emf, thus induced is proportional to the rate of change of
magnitude of magnetisation i.e. e N (dĭ / dt)
Where N = number of turns of the winding on reproducing head
Ǽ = magnetic flux produced.
Suppose the signal to be recorded is Vm sin Ǚt. Thus, the current in the recording head and flux
induced will be proportional to this voltage.
Ø It is given by e= k 1. Vm sin wt, where k1 = constant.
Ø Above pattern of flux is recorded on the tape. Now, when this tape is passed through the
reproducing head, above pattern is regenerated by inducing voltage in the reproducing head
winding.
Ø It is given by e= k2 ǙVm cos wt
Ø Thus the reproducing signal is equal to derivative of input signal
& it is proportional to flux recorded & frequency of recorded signal.
Methods of Recording
The methods used for magnetic tape recording used for instrumentation purposes are as follows:
i) Direct Recording
ii) Frequency Modulation Recording
iii) Pulse Duration Modulation Recording
For instrumentation purposes mostly frequency modulation recording is used. The pulse duration
modulation recording is generally used in the systems for special applications where large number of
slowly changing variables has to be recorded simultaneously.
4.3 Digital Plotters And Printers
PRINTERS
Ø Printers can be classified according to their printing methodology Impact printers and Non-
impact printers.
Ø Impact printers press formed character faces against an inked ribbon onto the paper.
Ø A line printer and dot matrix printer are the examples of an
impact printer.
Ø Non impact printer and plotters use laser techniques, inkjet sprays, xerographic processes,
electrostatic methods and e1ectrothermal methods to get images onto the paper.
Ø A ink-jet printer and laser printer are the examples of non- impact printers.
Line Printers
A line printer prints a complete line at a time. The printing speed of line printer varies from 150 lines to
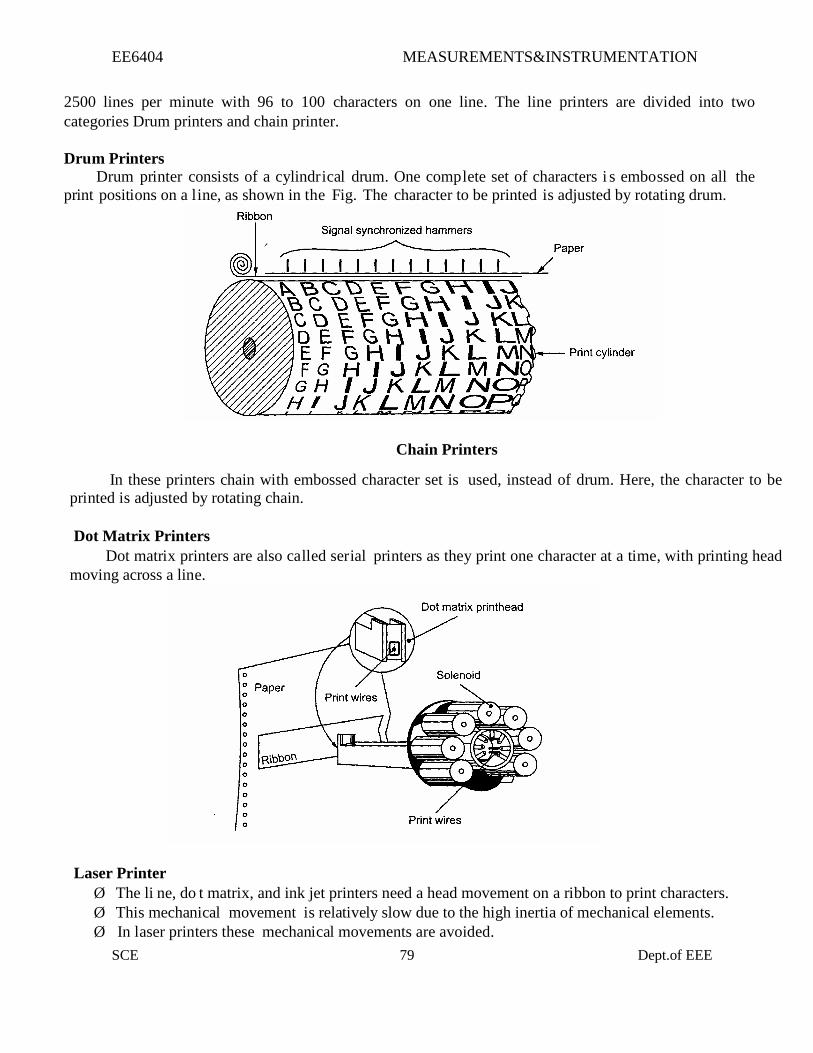
EE6404 MEASUREMENTS&INSTRUMENTATION
SCE 79 Dept.of EEE
2500 lines per minute with 96 to 100 characters on one line. The line printers are divided into two
categories Drum printers and chain printer.
Drum Printers Drum printer consists of a cylindr ical drum. One complete set of characters i s embossed on all the
print positions on a l ine, as shown in the Fig. The character to be printed is adjusted by rotating drum.
Chain Printers
In these printers chain with embossed character set is used, instead of drum. Here, the character to be
printed is adjusted by rotating chain.
Dot Matrix Printers
Dot matrix printers are also ca lled ser ial printers as they print one character at a time, with printing head
moving across a line. Laser Printer
Ø The li ne, do t matrix, and ink jet printers need a head movement on a ribbon to print characters.
Ø This mechanical movement is relatively slow due to the high inertia of mechanical elements.
Ø In laser printers these mechanical movements are avoided.
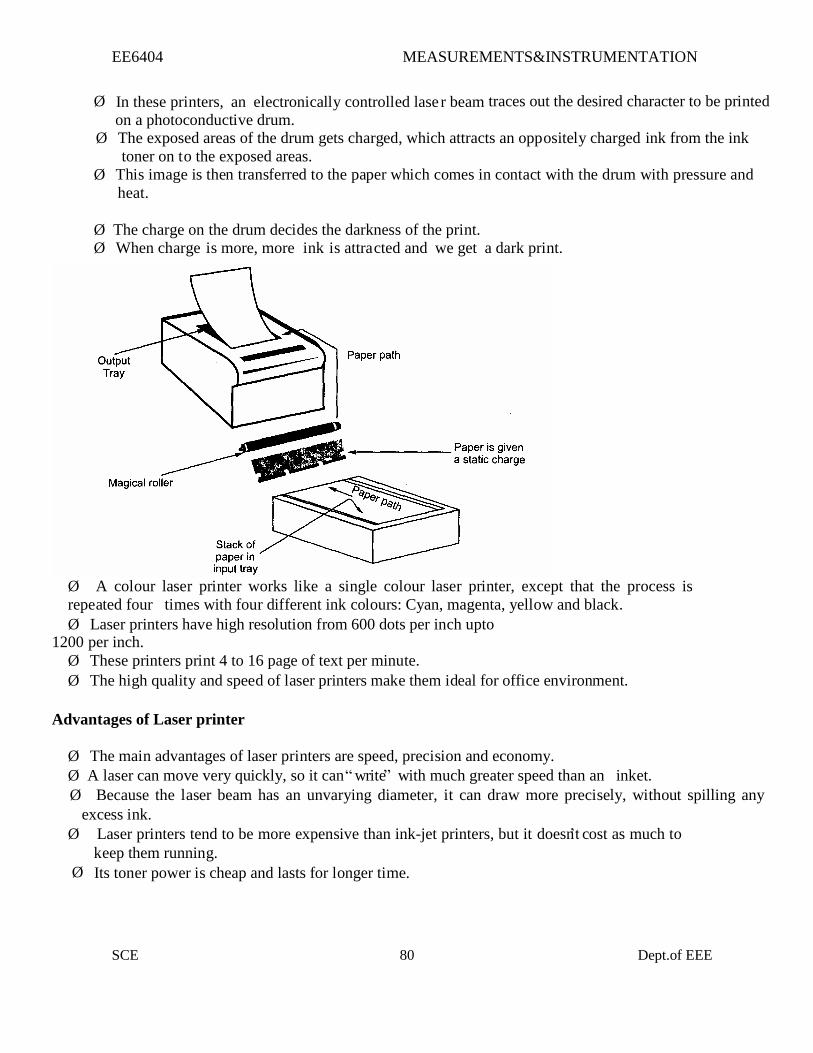
EE6404 MEASUREMENTS&INSTRUMENTATION
SCE 80 Dept.of EEE
Ø In these printers, an electronically controlled lase r beam traces out the desired character to be printed
on a photoconductive drum. Ø The exposed areas of the drum gets charged, which attracts an oppositely charged ink from the ink
toner on to the exposed areas.
Ø This image is then transferred to the paper which comes in contact with the drum with pressure and
heat.
Ø The charge on the drum decides the darkness of the print.
Ø When ch arge is more, more ink is attracted and we get a dark print.
Ø A colour laser printer works like a single colour laser printer, except that the process is
repeated four times with four different ink colours: Cyan, magenta, yellow and black.
Ø Laser printers have high resolution from 600 dots per inch upto
1200 per inch.
Ø These printers print 4 to 16 page of text per minute.
Ø The high quality and speed of laser printers make them ideal for office environment.
Advantages of Laser printer
Ø The main advantages of laser printers are speed, precision and economy.
Ø A laser can move very quickly, so it can “ write” with much greater speed than an inket.
Ø Because the laser beam has an unvarying diameter, it can draw more precisely, without spilling any
excess ink.
Ø Laser printers tend to be more expensive than ink-jet printers, but it doesn’t cost as much to
keep them running.
Ø Its toner power is cheap and lasts for longer time.
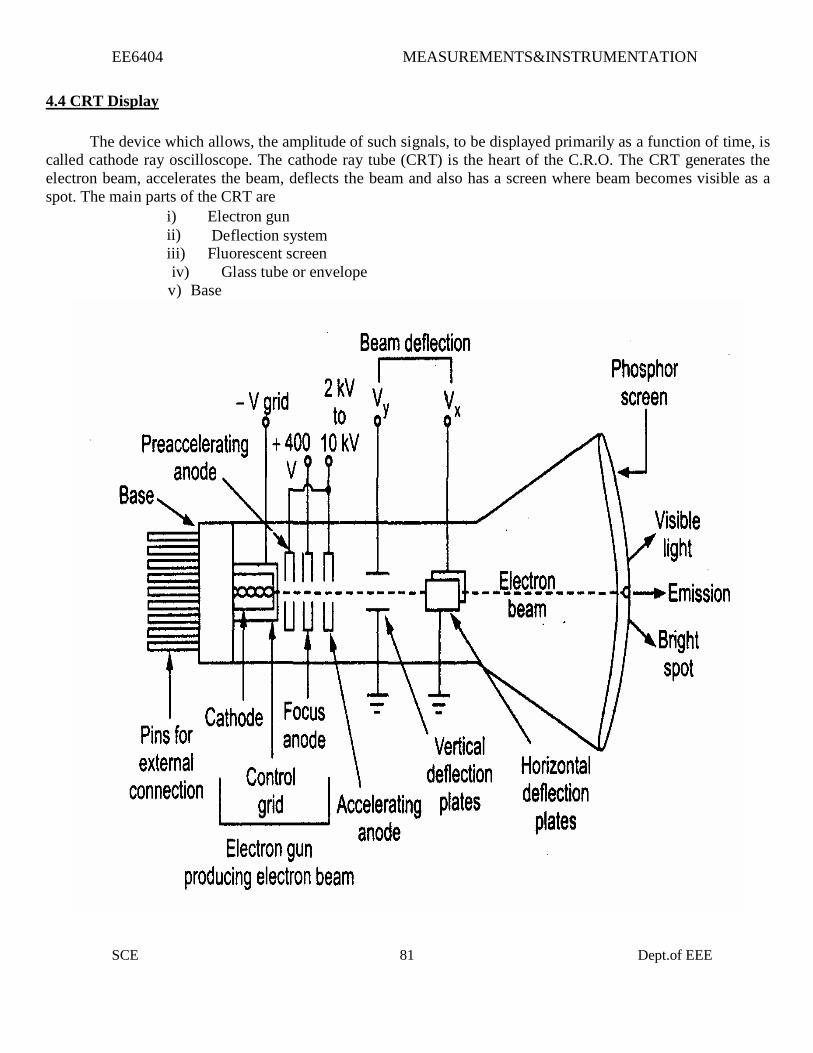
EE6404 MEASUREMENTS&INSTRUMENTATION
SCE 81 Dept.of EEE
4.4 CRT Display
The device which allows, the amplitude of such signals, to be displayed primarily as a function of time, is
called cathode ray oscilloscope. The cathode ray tube (CRT) is the heart of the C.R.O. The CRT generates the
electron beam, accelerates the beam, deflects the beam and also has a screen where beam becomes visible as a
spot. The main parts of the CRT are
i) Electron gun
ii) Deflection system
iii) Fluorescent screen
iv) Glass tube or envelope
v) Base
EE6404 MEASUREMENTS&INSTRUMENTATION
SCE 82 Dept.of EEE
Electron gun
(fi) Cathode Ray Tube
Ø The electron gun section of the cathode ray tube provides a sharply focused, electron beam directed
towards the fluorescent-coated screen.
Ø This section starts from thermally heated cathode, emitting the electrons.
Ø The control grid is given negative potential with respect to cathode.
Ø This grid controls the number of electrons in t beam, going to the screen.
Ø The momentum of the electrons (their number x their speed) determines the intensity, or brightness, of
the light emitted from the fluorescent screen due to the electron bombardment.
Ø The light emitted is usually of the green colour.
Deflection System
Ø When the electron beam is accelerated it passes through the deflection system, with which beam can be
positioned anywhere on the screen.
Fluorescent Screen
Ø The light produced by the screen does not disappear immediately when bombardment by
electrons ceases, i.e., when the signal becomes zero.
Ø The time period for which the trace remains on the screen after the signal becomes zero
is known as “persistence or fluorescence” .
Ø The persistence may be as short as a few microsecond, or as long as tens of seconds or
even minutes.
Ø Medium persistence traces are mostly used for general purpose applications.
Ø Long persistence traces are used in the study of transients.
Ø Long persistence helps in the study of transients since the trace is still seen on the screen
after the transient has disappeared.
Glass Tube
Ø All the components of a CRT are enclosed in an evacuated glass tube called envelope.
Ø This allows the emitted electrons to move about freely from one end of the tube to the
other end.
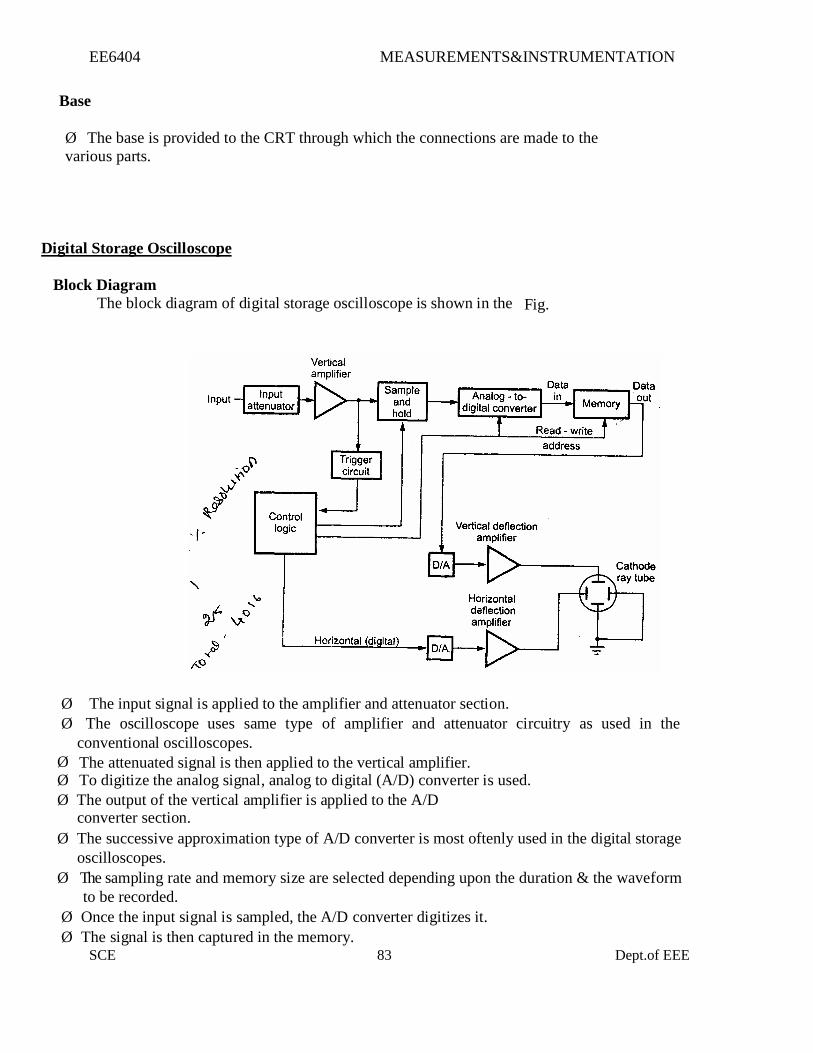
EE6404 MEASUREMENTS&INSTRUMENTATION
SCE 83 Dept.of EEE
Base
Ø The base is provided to the CRT through which the connections are made to the
various parts.
Digital Storage Oscilloscope
Block Diagram
The block diagram of digital storage oscilloscope is shown in the Fig.
Ø The input signal is applied to the amplifier and attenuator section.
Ø The oscilloscope uses same type of amplifier and attenuator circuitry as used in the
conventional oscilloscopes.
Ø The attenuated signal is then applied to the vertical amplifier.
Ø To digitize the analog signal, analog to digital (A/D) converter is used.
Ø The output of the vertical amplifier is applied to the A/D
converter section.
Ø The successive approximation type of A/D converter is most oftenly used in the digital storage
oscilloscopes.
Ø The sampling rate and memory size are selected depending upon the duration & the waveform
to be recorded.
Ø Once the input signal is sampled, the A/D converter digitizes it.
Ø The signal is then captured in the memory.
EE6404 MEASUREMENTS&INSTRUMENTATION
SCE 84 Dept.of EEE
Ø Once it is stored in the memory, many manipulations are possible as memory can be
readout without being erased.
Ø The digital storage oscilloscope has three modes:
1. Roll mode
2. Store mode
3. Hold or save mode.
Advantages
i) It is easier to operate and has more capability. ii) The storage time is
infinite.
iii) The display flexibility is available. The number of traces that can be stored and recalled
depends on the size of the memory.
iv) The cursor measurement is possible.
v) The characters can be displayed on screen along with the waveform which can indicate
waveform information such as minimum, maximum, frequency, amplitude etc.
vi) The X-Y plots, B-H curve, P-V diagrams can be displayed.
vii) The pretrigger viewing feature allows to display the waveform before trigger pulse.
viii) Keeping the records is possible by transmitting the data to computer system where the further
processing is possible
ix) Signal processing is possible which includes translating the raw data into finished information
e.g. computing parameters of a captured signal like r.m.s. value, energy stored etc.
4.6 DATA LOGGER
Definition Data logger is an electronic device that records data over time or in relation to location either with a
built in instrument or sensor.
Components
Ø Pulse inputs
Counts circuit closing
Ø Control ports
Digital in and out
Most commonly used to turn things on and off
Can be programmed as a digital input
Ø Excitation outputs
Though they can be deployed while connected to a host PC over an Ethernet or
serial port a data logger is more typically deployed as standalone devices. The term data logger (also
sometimes referred to as a data recorder) is commonly used to describe a self-contained, standalone
data acquisition system or device. These products are comprised of a number of analog and digital
inputs that are monitored, and the results or conditions of these inputs is then stored on some type of
local memory (e.g. SD Card, Hard Drive).
EE6404 MEASUREMENTS&INSTRUMENTATION
SCE 85 Dept.of EEE
Examples
Examples of where these devices are used abound. A few of these examples are shown below:
Ø monitoring temperature, pressure, strain and other physical phenomena in aircraft flight tests (even
including logging info from Arinc 429 or other serial communications buses)
Ø Monitoring temperature, pressure, strain and other physical phenomena in automotive and in-vehicle
tests including monitoring traffic and data transmitted on the vehicles CAN bus.
Ø Environmental monitoring for quality control in food processing, food storage, pharmaceutical
manufacturing, and even monitoring the environment during various stages of contract assembly or
semiconductor fabrication
Ø Monitoring stress and strain in large mechanical structures such as bridges, steel framed buildings,
towers, launch pads etc.
Ø Monitoring environmental parameters in temperature and environmental chambers and test facilities.
Ø A data logger is a self-contained unit that does not require a host to operate.
Ø It can be installed in almost any location, and left to operate unattended.
Ø This data can be immediately analyzed for trends, or stored for historical archive purposes.
Ø Data loggers can also monitor for alarm conditions, while recording a minimum number of samples,
for economy.
Ø If the recording is of a steady-state nature, without rapid changes, the user may go through rolls of
paper, without seeing a single change in the input.
Ø A data logger can record at very long intervals, saving paper, and can note when an alarm condition
is occurring. When this happens, the event will be recorded and any outputs will be activated,
even if the event occurs in between sample times.
Ø A record of all significant conditions and events is generated using a minimum of recording
hardcopy
Ø The differences between various data loggers are based on the way that data is recorded and stored.
Ø The basic difference between the two data logger types is that one type allows the data to be stored
in a memory, to be retrieved at a later time, while the other type automatically records the data
on paper, for immediate viewing and analysis.
Ø Many data loggers combine these two functions, usually unequally, with the emphasis on either the
ability to transfer the data or to provide a printout of it
Advantages
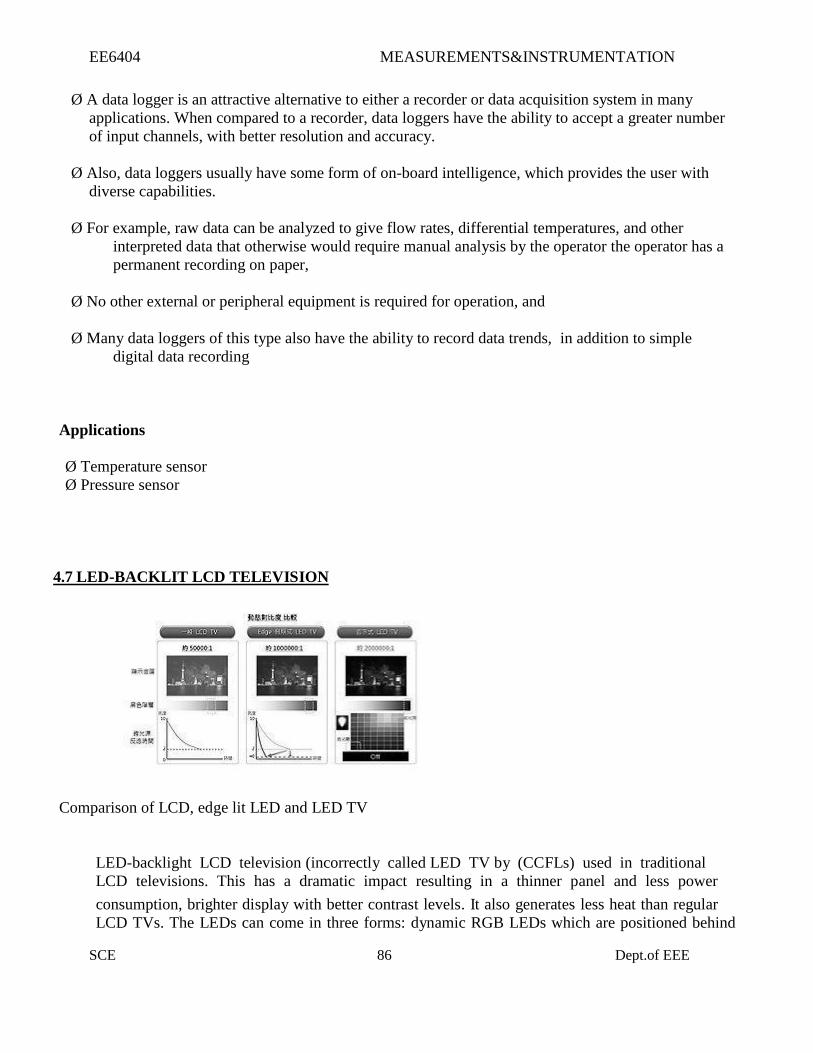
EE6404 MEASUREMENTS&INSTRUMENTATION
SCE 86 Dept.of EEE
Ø A data logger is an attractive alternative to either a recorder or data acquisition system in many
applications. When compared to a recorder, data loggers have the ability to accept a greater number
of input channels, with better resolution and accuracy.
Ø Also, data loggers usually have some form of on-board intelligence, which provides the user with
diverse capabilities.
Ø For example, raw data can be analyzed to give flow rates, differential temperatures, and other
interpreted data that otherwise would require manual analysis by the operator the operator has a
permanent recording on paper,
Ø No other external or peripheral equipment is required for operation, and
Ø Many data loggers of this type also have the ability to record data trends, in addition to simple
digital data recording
Applications
Ø Temperature sensor
Ø Pressure sensor
4.7 LED-BACKLIT LCD TELEVISION
Comparison of LCD, edge lit LED and LED TV
LED-backlight LCD television (incorrectly called LED TV by (CCFLs) used in traditional
LCD televisions. This has a dramatic impact resulting in a thinner panel and less power
consumption, brighter display with better contrast levels. It also generates less heat than regular
LCD TVs. The LEDs can come in three forms: dynamic RGB LEDs which are positioned behind

EE6404 MEASUREMENTS&INSTRUMENTATION
SCE 87 Dept.of EEE
the panel, white Edge-LEDs positioned around the rim of the screen which use a special diffusion
panel to spread the light evenly behind the screen (the most common) and full-array which are
arranged behind the screen but they are incapable of dimming or brightening individually
LED backlighting techniques
RGB dynamic LEDs
This method of backlighting allows dimming to occur in locally specific areas of darkness on the
screen. This can show truer blacks, whites and PRs[clarification needed]
at much higher dynamic
contrast ratios, at the cost of less detail in small bright objects on a dark background, such as star
fields
Edge-LEDs
This method of backlighting allows for LED-backlit TVs to become extremely thin. The light is
diffused across the screen by a special panel which produces a uniform color range across the
screen.
Full Array LEDs
Sharp, and now other brands, also have LED backlighting technology that aligns the LEDs on
back of the TV like the RGB Dynamic LED backlight, but it lacks the local dimming of other
sets.[6]
The main benefit of its LED backlight is simply reduced energy consumption and may not
improve quality over non-LED LCD TVs.[7]
Differences between LED-backlit and CCFL-backlit LCD displays
An LED backlight offers several general benefits over regular CCFL backlight TVs, typically
higher brightness. Compared to regular CCFL backlighting, there may also be benefits to color
gamut. However advancements in CCFL technology mean wide color gamuts and lower power
consumption are also possible. The principal barrier to wide use of LED backlighting on LCD
televisions is cost.
The variations of LED backlighting do offer different benefits. The first commercial LED backlit
LCD TV was the Sony Qualia 005 (introduced in 2004). This featured RGB LED arrays to offer
a color gamut around twice that of a conventional CCFL LCD television (the combined light
output from red, green and blue LEDs produces a more pure white light than is possible with a
single white light LED). RGB LED technology continues to be used on selected
Sony BRAVIA LCD models, with the addition of 'local dimming' which enables excellent on-
screen contrast through selectively turning off the LEDs behind dark parts of a picture frame.
Edge LED lighting was also first introduced by Sony (September 2008) on the 40 inch BRAVIA
KLV-40ZX1M (referred to as the ZX1 in Europe). The principal benefit of Edge-LED lighting
for LCD televisions is the ability to build thinner housings (the BRAVIA KLV-40ZX1M is as
thin as 9.9mm). Samsung has also introduced a range of Edge-LED lit LCD televisions with
extremely thin housings.
LED-backlit LCD TVs are considered a more sustainable choice, with a longer life and better
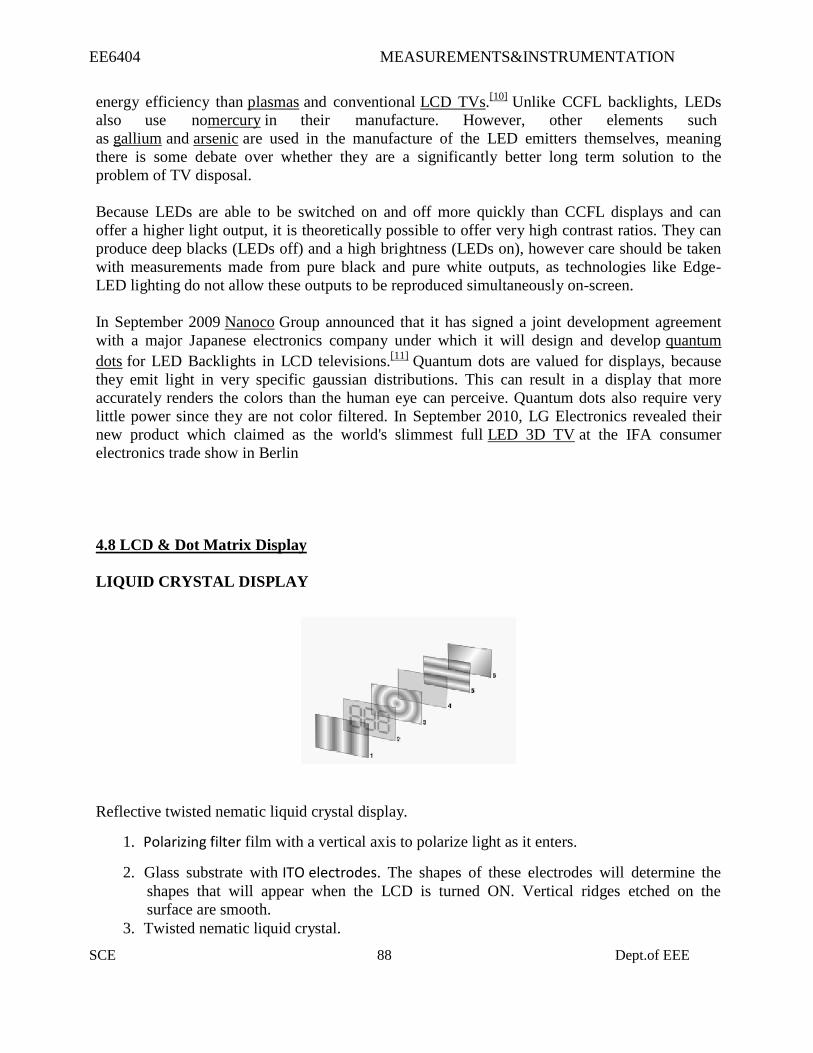
EE6404 MEASUREMENTS&INSTRUMENTATION
SCE 88 Dept.of EEE
energy efficiency than plasmas and conventional LCD TVs.[10]
Unlike CCFL backlights, LEDs
also use nomercury in their manufacture. However, other elements such
as gallium and arsenic are used in the manufacture of the LED emitters themselves, meaning
there is some debate over whether they are a significantly better long term solution to the
problem of TV disposal.
Because LEDs are able to be switched on and off more quickly than CCFL displays and can
offer a higher light output, it is theoretically possible to offer very high contrast ratios. They can
produce deep blacks (LEDs off) and a high brightness (LEDs on), however care should be taken
with measurements made from pure black and pure white outputs, as technologies like Edge-
LED lighting do not allow these outputs to be reproduced simultaneously on-screen.
In September 2009 Nanoco Group announced that it has signed a joint development agreement
with a major Japanese electronics company under which it will design and develop quantum
dots for LED Backlights in LCD televisions.[11]
Quantum dots are valued for displays, because
they emit light in very specific gaussian distributions. This can result in a display that more
accurately renders the colors than the human eye can perceive. Quantum dots also require very
little power since they are not color filtered. In September 2010, LG Electronics revealed their
new product which claimed as the world's slimmest full LED 3D TV at the IFA consumer
electronics trade show in Berlin
4.8 LCD & Dot Matrix Display
LIQUID CRYSTAL DISPLAY
Reflective twisted nematic liquid crystal display.
1. Polarizing filter film with a vertical axis to polarize light as it enters.
2. Glass substrate with ITO electrodes. The shapes of these electrodes will determine the
shapes that will appear when the LCD is turned ON. Vertical ridges etched on the
surface are smooth.
3. Twisted nematic liquid crystal.

EE6404 MEASUREMENTS&INSTRUMENTATION
SCE 89 Dept.of EEE
4. Glass substrate with common electrode film (ITO) with horizontal ridges to line up with
the horizontal filter.
5. Polarizing filter film with a horizontal axis to block/pass light.
6. Reflective surface to send light back to viewer. (In a backlit LCD, this layer is replaced
with a light source.)
A liquid crystal display (LCD) is a thin, flat electronic visual display that uses the light
modulating properties of liquid crystals (LCs). LCs do not emit light directly.
They are used in a wide range of applications including: computer monitors, television,
instrument panels, aircraft cockpit displays, signage, etc. They are common in consumer devices
such as video players, gaming devices, clocks, watches, calculators, and telephones. LCDs have
displaced cathode ray tube (CRT) displays in most applications. They are usually more compact,
lightweight, portable, less expensive, more reliable, and easier on the eyes.They are available in
a wider range of screen sizes than CRT and plasma displays, and since they do not use
phosphors, they cannot suffer image burn-in. LCDs are more energy efficient and offer safer
disposal than CRTs.
Overview
LCD alarm clock
Each pixel of an LCD typically consists of a layer of molecules aligned between
two transparent electrodes, and two polarizing filters, the axes of transmission of which are (in
most of the cases) perpendicular to each other. With no actual liquid crystal between the
polarizing filters, light passing through the first filter would be blocked by the second (crossed)
polarizer. In most of the cases the liquid crystal has double refraction.
The surface of the electrodes that are in contact with the liquid crystal material are treated so as
to align the liquid crystal molecules in a particular direction. This treatment typically consists of
a thin polymer layer that is unidirectionally rubbed using, for example, a cloth. The direction of
the liquid crystal alignment is then defined by the direction of rubbing. Electrodes are made of a
transparent conductor called Indium Tin Oxide (ITO).
Before applying an electric field, the orientation of the liquid crystal molecules is determined by
the alignment at the surfaces of electrodes. In a twisted nematic device (still the most common
liquid crystal device), the surface alignment directions at the two electrodes are perpendicular to
each other, and so the molecules arrange themselves in a helical structure, or twist. This reduces
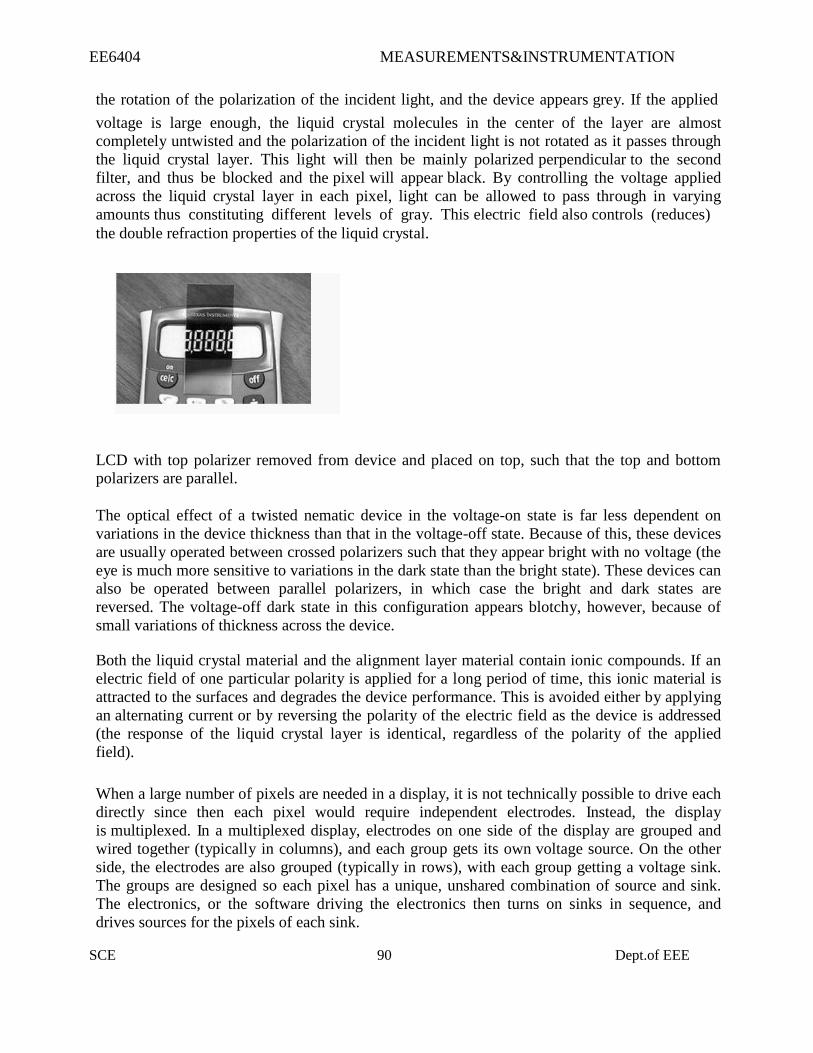
EE6404 MEASUREMENTS&INSTRUMENTATION
SCE 90 Dept.of EEE
the rotation of the polarization of the incident light, and the device appears grey. If the applied
voltage is large enough, the liquid crystal molecules in the center of the layer are almost
completely untwisted and the polarization of the incident light is not rotated as it passes through
the liquid crystal layer. This light will then be mainly polarized perpendicular to the second
filter, and thus be blocked and the pixel will appear black. By controlling the voltage applied
across the liquid crystal layer in each pixel, light can be allowed to pass through in varying
amounts thus constituting different levels of gray. This electric field also controls (reduces)
the double refraction properties of the liquid crystal.
LCD with top polarizer removed from device and placed on top, such that the top and bottom
polarizers are parallel.
The optical effect of a twisted nematic device in the voltage-on state is far less dependent on
variations in the device thickness than that in the voltage-off state. Because of this, these devices
are usually operated between crossed polarizers such that they appear bright with no voltage (the
eye is much more sensitive to variations in the dark state than the bright state). These devices can
also be operated between parallel polarizers, in which case the bright and dark states are
reversed. The voltage-off dark state in this configuration appears blotchy, however, because of
small variations of thickness across the device.
Both the liquid crystal material and the alignment layer material contain ionic compounds. If an
electric field of one particular polarity is applied for a long period of time, this ionic material is
attracted to the surfaces and degrades the device performance. This is avoided either by applying
an alternating current or by reversing the polarity of the electric field as the device is addressed
(the response of the liquid crystal layer is identical, regardless of the polarity of the applied
field).
When a large number of pixels are needed in a display, it is not technically possible to drive each
directly since then each pixel would require independent electrodes. Instead, the display
is multiplexed. In a multiplexed display, electrodes on one side of the display are grouped and
wired together (typically in columns), and each group gets its own voltage source. On the other
side, the electrodes are also grouped (typically in rows), with each group getting a voltage sink.
The groups are designed so each pixel has a unique, unshared combination of source and sink.
The electronics, or the software driving the electronics then turns on sinks in sequence, and
drives sources for the pixels of each sink.
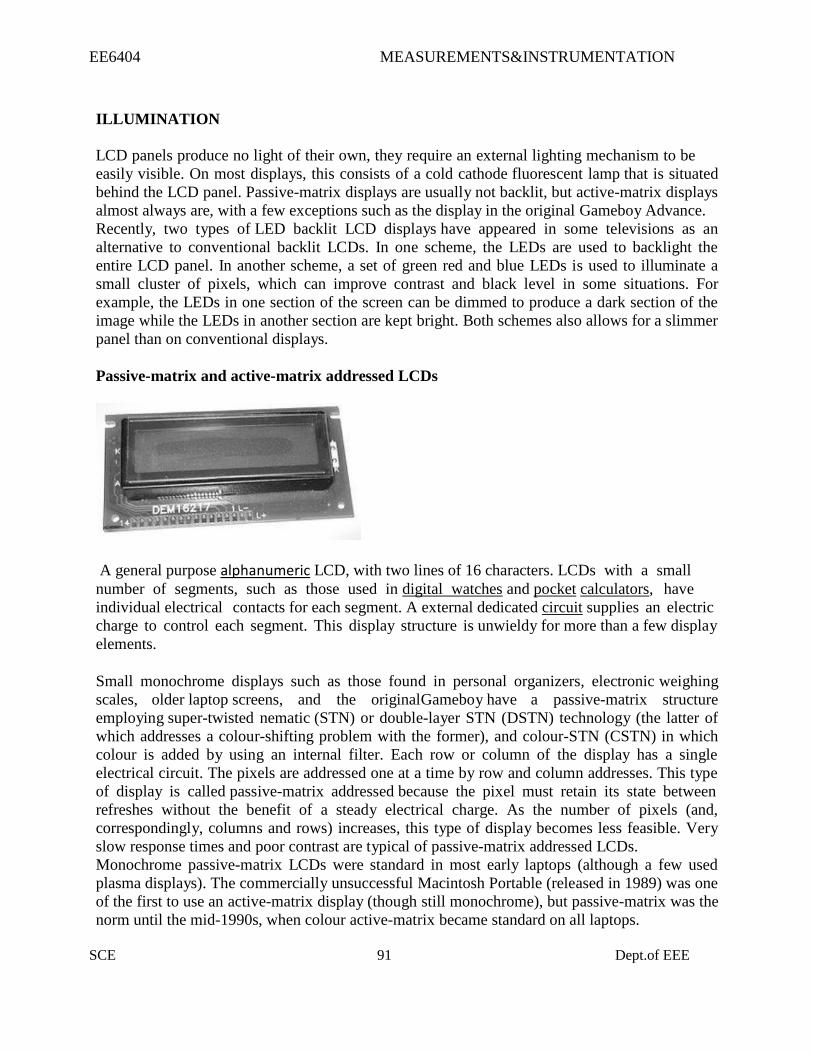
EE6404 MEASUREMENTS&INSTRUMENTATION
SCE 91 Dept.of EEE
ILLUMINATION
LCD panels produce no light of their own, they require an external lighting mechanism to be
easily visible. On most displays, this consists of a cold cathode fluorescent lamp that is situated
behind the LCD panel. Passive-matrix displays are usually not backlit, but active-matrix displays
almost always are, with a few exceptions such as the display in the original Gameboy Advance.
Recently, two types of LED backlit LCD displays have appeared in some televisions as an
alternative to conventional backlit LCDs. In one scheme, the LEDs are used to backlight the
entire LCD panel. In another scheme, a set of green red and blue LEDs is used to illuminate a
small cluster of pixels, which can improve contrast and black level in some situations. For
example, the LEDs in one section of the screen can be dimmed to produce a dark section of the
image while the LEDs in another section are kept bright. Both schemes also allows for a slimmer
panel than on conventional displays.
Passive-matrix and active-matrix addressed LCDs
A general purpose alphanumeric LCD, with two lines of 16 characters. LCDs with a small
number of segments, such as those used in digital watches and pocket calculators, have
individual electrical contacts for each segment. A external dedicated circuit supplies an electric
charge to control each segment. This display structure is unwieldy for more than a few display
elements.
Small monochrome displays such as those found in personal organizers, electronic weighing
scales, older laptop screens, and the originalGameboy have a passive-matrix structure
employing super-twisted nematic (STN) or double-layer STN (DSTN) technology (the latter of
which addresses a colour-shifting problem with the former), and colour-STN (CSTN) in which
colour is added by using an internal filter. Each row or column of the display has a single
electrical circuit. The pixels are addressed one at a time by row and column addresses. This type
of display is called passive-matrix addressed because the pixel must retain its state between
refreshes without the benefit of a steady electrical charge. As the number of pixels (and,
correspondingly, columns and rows) increases, this type of display becomes less feasible. Very
slow response times and poor contrast are typical of passive-matrix addressed LCDs.
Monochrome passive-matrix LCDs were standard in most early laptops (although a few used
plasma displays). The commercially unsuccessful Macintosh Portable (released in 1989) was one
of the first to use an active-matrix display (though still monochrome), but passive-matrix was the
norm until the mid-1990s, when colour active-matrix became standard on all laptops.

EE6404 MEASUREMENTS&INSTRUMENTATION
SCE 92 Dept.of EEE
High-resolution colour displays such as modern LCD computer monitors and televisions use
an active matrix structure. A matrix of thin-film transistors (TFTs) is added to the polarizing and
colour filters. Each pixel has its own dedicated transistor, allowing each column line to access
one pixel. When a row line is activated, all of the column lines are connected to a row of pixels
and the correct voltage is driven onto all of the column lines. The row line is then deactivated
and the next row line is activated. All of the row lines are activated in sequence during
a refresh operation. Active-matrix addressed displays look "brighter" and "sharper" than passive-
matrix addressed displays of the same size, and generally have quicker response times,
producing much better images.
ACTIVE MATRIX TECHNOLOGIES
A Casio 1.8 in colour TFT liquid crystal display which equips the SonyCyber-shot DSC-P93A
Twisted nematic (TN)
Twisted nematic displays contain liquid crystal elements which twist and untwist at varying
degrees to allow light to pass through. When no voltage is applied to a TN liquid crystal cell, the
light is polarized to pass through the cell. In proportion to the voltage applied, the LC cells twist
up to 90 degrees changing the polarization and blocking the light's path. By properly adjusting
the level of the voltage almost any grey level or transmission can be achieved.
In-plane switching (IPS)
In-plane switching is an LCD technology which aligns the liquid crystal cells in a horizontal
direction. In this method, the electrical field is applied through each end of the crystal, but this
requires two transistors for each pixel instead of the single transistor needed for a standard thin-
film transistor (TFT) display. Before LGEnhanced IPS was introduced in 2009, the additional
transistors resulted in blocking more transmission area, thus requiring a brighter backlight, which
consumed more power, and made this type of display less desirable for notebook computers.
This newer, lower power technology can be found in the AppleiMac, iPad, and iPhone 4, as well
as the Hewlett-Packard EliteBook 8740w. Currently Panasonic is using an enhanced version
eIPS for their large size LCD-TV products.Advanced fringe field switching (AFFS)
Known as fringe field switching (FFS) until 2003, advanced fringe field switching is a
technology similar to IPS or S-IPS offering superior performance and colour gamut with high

EE6404 MEASUREMENTS&INSTRUMENTATION
SCE 93 Dept.of EEE
luminosity. AFFS is developed by HYDIS TECHNOLOGIES CO.,LTD, Korea (formally
Hyundai Electronics, LCD Task Force). AFFS-applied notebook applications minimize colour
In 2004, HYDIS TECHNOLOGIES CO.,LTD licenses AFFS patent to Japan's Hitachi Displays.
Hitachi is using AFFS to manufacture high end panels in their product line. In 2006, HYDIS also
licenses AFFS to Sanyo Epson Imaging Devices Corporation.
HYDIS introduced AFFS+ which improved outdoor readability in 2007.
Vertical alignment (VA)
Vertical alignment displays are a form of LCDs in which the liquid crystal material naturally
exists in a vertical state removing the need for extra transistors (as in IPS). When no voltage is
applied, the liquid crystal cell remains perpendicular to the substrate creating a black display.
When voltage is applied, the liquid crystal cells shift to a horizontal position, parallel to the
substrate, allowing light to pass through and create a white display. VA liquid crystal displays
provide some of the same advantages as IPS panels, particularly an improved viewing angle and
improved black level
Blue Phase mode
Blue phase LCDs do not require a liquid crystal top layer. Blue phase LCDs are relatively new to
the market, and very expensive because of the low volume of production. They provide a higher
refresh rate than normal LCDs, but normal LCDs are still cheaper to make and actually provide
better colours and a sharper image
Military use of LCD monitors
LCD monitors have been adopted by the United States of America military instead
of CRT displays because they are smaller, lighter and more efficient, although monochrome
plasma displays are also used, notably for their M1 Abrams tanks. For use with night vision
imaging systems a US military LCD monitor must be compliant with MIL-L-3009 (formerly
MIL-L-85762A). These LCD monitors go through extensive certification so that they pass the
standards for the military. These include MIL-STD-901D - High Shock (Sea Vessels), MIL-
STD-167B - Vibration (Sea Vessels), MIL-STD-810F – Field Environmental Conditions
(Ground Vehicles and Systems),MIL-STD-461E/F –EMI/RFI(Electromagnetic nterference/Radio
Frequency Interference), MIL-STD-740B – Airborne/Structureborne Noise, and TEMPEST -
Telecommunications Electronics Material Protected from Emanating Spurious Transmissions
Quality control
Some LCD panels have defective transistors, causing permanently lit or unlit pixels which are
commonly referred to as stuck pixels or dead pixels respectively. Unlike integrated circuits (ICs),
LCD panels with a few defective transistors are usually still usable. It is claimed that it is
economically prohibitive to discard a panel with just a few defective pixels because LCD panels
are much larger than ICs, but this has never been proven. Manufacturers' policies for the
EE6404 MEASUREMENTS&INSTRUMENTATION
SCE 94 Dept.of EEE
acceptable number of defective pixels vary greatly. At one point, Samsung held a zero-tolerance
policy for LCD monitors sold in Korea. Currently, though, Samsung adheres to the less
restrictive ISO 13406-2 standard. Other companies have been known to tolerate as many as 11
dead pixels in their policies. Dead pixel policies are often hotly debated between manufacturers
and customers. To regulate the acceptability of defects and to protect the end user, ISO released
the ISO 13406-2 standard. However, not every LCD manufacturer conforms to the ISO standard
and the ISO standard is quite often interpreted in different ways. LCD panels are more likely to
have defects than most ICs due to their larger size. For example, a 300 mm SVGA LCD has 8
defects and a 150 mm wafer has only 3 defects. However, 134 of the 137 dies on the wafer will
be acceptable, whereas rejection of the LCD panel would be a 0% yield. Due to competition
between manufacturers quality control has been improved. An SVGA LCD panel with 4 defective
pixels is usually considered defective and customers can request an exchange for a new one.
Some manufacturers, notably in South Korea where some of the largest LCD panel
manufacturers, such as LG, are located, now have "zero defective pixel guarantee", which is an
extra screening process which can then determine "A" and "B" grade panels. Many manufacturers
would replace a product even with one defective pixel. Even where such guarantees do not
exist, the location of defective pixels is important. A display with only a few defective pixels may
be unacceptable if the defective pixels are near each other. Manufacturers may also relax their
replacement criteria when defective pixels are in the center of the viewing area. LCD panels also
have defects known as clouding (or less commonly mura), which describes the uneven patches of
changes in luminance. It is most visible in dark or black areas of displayed scenes
ZERO-POWER (BISTABLE) DISPLAYS
The zenithal bistable device (ZBD), developed by QinetiQ (formerly DERA), can retain an
image without power. The crystals may exist in one of two stable orientations ("Black" and
"White") and power is only required to change the image. ZBD Displays is a spin-off company
from QinetiQ who manufacture both grayscale and colour ZBD devices. A French company,
Nemoptic, has developed the BiNem zero-power, paper-like LCD technology which has
been mass-produced in partnership with Seiko since 2007.
This technology is intended for use in applications such as Electronic Shelf Labels, E-books, E-
documents, E-newspapers, E-dictionaries, Industrial sensors, Ultra-Mobile PCs, etc.
Kent Displays has also developed a "no power" display that uses Polymer Stabilized Cholesteric
Liquid Crystals (ChLCD). A major drawback of ChLCD screens are their slow refresh rate,
especially at low temperatures. Kent has recently demonstrated the use of a ChLCD to cover
the entire surface of a mobile phone, allowing it to change colours, and keep that colour even
when power is cut off. In 2004 researchers at the University of Oxford demonstrated two
new types of zero-power bistable LCDs based on Zenithal bistable techniques. Several bistable
technologies, like the 360° BTN and the bistable cholesteric, depend mainly on the bulk
properties of the liquid crystal (LC) and use standard strong anchoring, with alignment films and
LC mixtures similar to the traditional monostable materials. Other bistable technologies
(i.e. Binem Technology) are based mainly on the surface properties and need specific weak
anchoring materials. distortion while maintaining its superior wide viewing angle for a
professional display. Colour shift and deviation caused by light leakage is corrected by
optimizing the white gamut which also enhances white/grey reproduction.
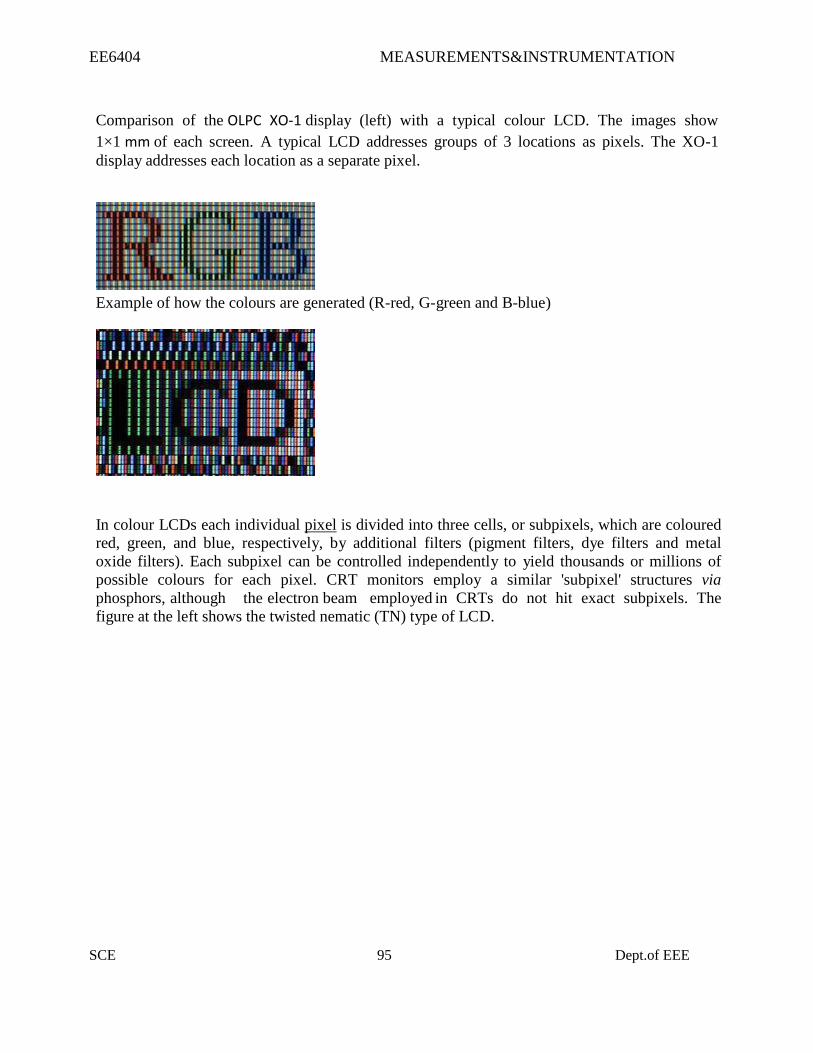
EE6404 MEASUREMENTS&INSTRUMENTATION
SCE 95 Dept.of EEE
Comparison of the OLPC XO-1 display (left) with a typical colour LCD. The images show
1×1 mm of each screen. A typical LCD addresses groups of 3 locations as pixels. The XO-1
display addresses each location as a separate pixel.
Example of how the colours are generated (R-red, G-green and B-blue)
In colour LCDs each individual pixel is divided into three cells, or subpixels, which are coloured
red, green, and blue, respectively, by additional filters (pigment filters, dye filters and metal
oxide filters). Each subpixel can be controlled independently to yield thousands or millions of
possible colours for each pixel. CRT monitors employ a similar 'subpixel' structures via
phosphors, although the electron beam employed in CRTs do not hit exact subpixels. The
figure at the left shows the twisted nematic (TN) type of LCD.
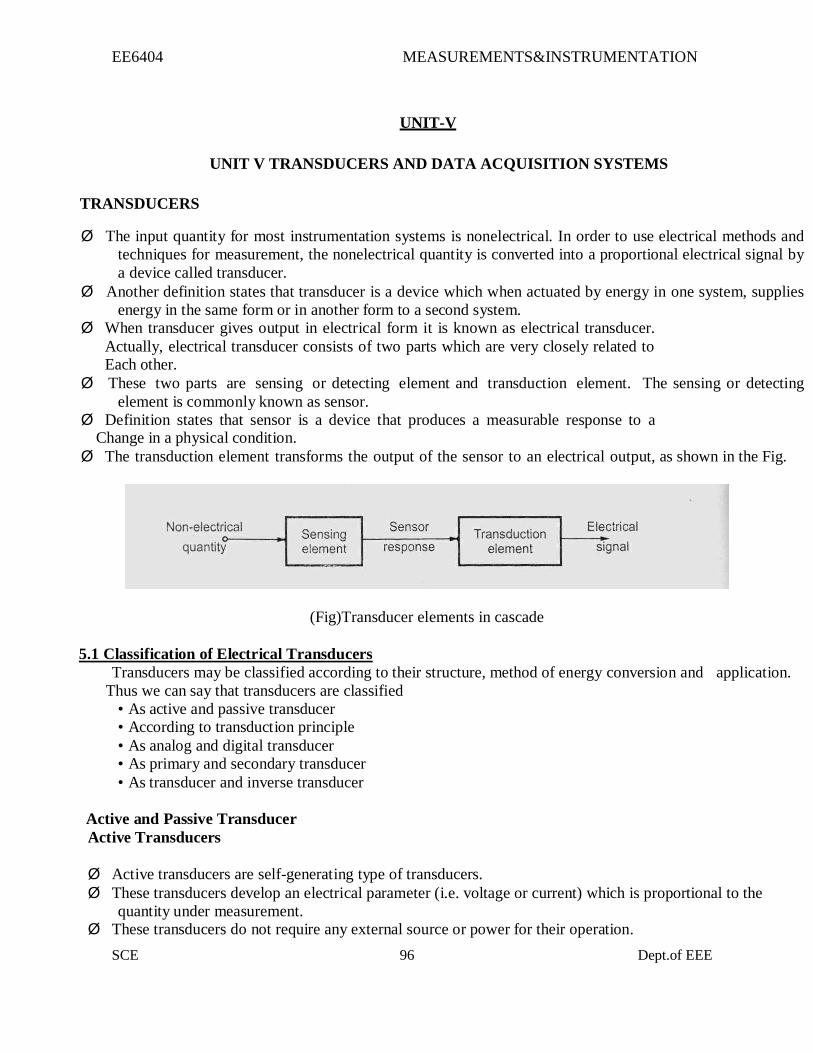
EE6404 MEASUREMENTS&INSTRUMENTATION
SCE 96 Dept.of EEE
UNIT-V
UNIT V TRANSDUCERS AND DATA ACQUISITION SYSTEMS
TRANSDUCERS
Ø The input quantity for most instrumentation systems is nonelectrical. In order to use electrical methods and
techniques for measurement, the nonelectrical quantity is converted into a proportional electrical signal by
a device called transducer.
Ø Another definition states that transducer is a device which when actuated by energy in one system, supplies
energy in the same form or in another form to a second system. Ø When transducer gives output in electrical form it is known as electrical transducer.
Actually, electrical transducer consists of two parts which are very closely related to Each other.
Ø These two parts are sensing or detecting element and transduction element. The sensing or detecting
element is commonly known as sensor.
Ø Definition states that sensor is a device that produces a measurable response to a Change in a physical condition.
Ø The transduction element transforms the output of the sensor to an electrical output, as shown in the Fig.
(Fig)Transducer elements in cascade
5.1 Classification of Electrical Transducers
Transducers may be classified according to their structure, method of energy conversion and application.
Thus we can say that transducers are classified
• As active and passive transducer • According to transduction principle
• As analog and digital transducer • As primary and secondary transducer
• As transducer and inverse transducer
Active and Passive Transducer
Active Transducers
Ø Active transducers are self-generating type of transducers.
Ø These transducers develop an electrical parameter (i.e. voltage or current) which is proportional to the
quantity under measurement. Ø These transducers do not require any external source or power for their operation.
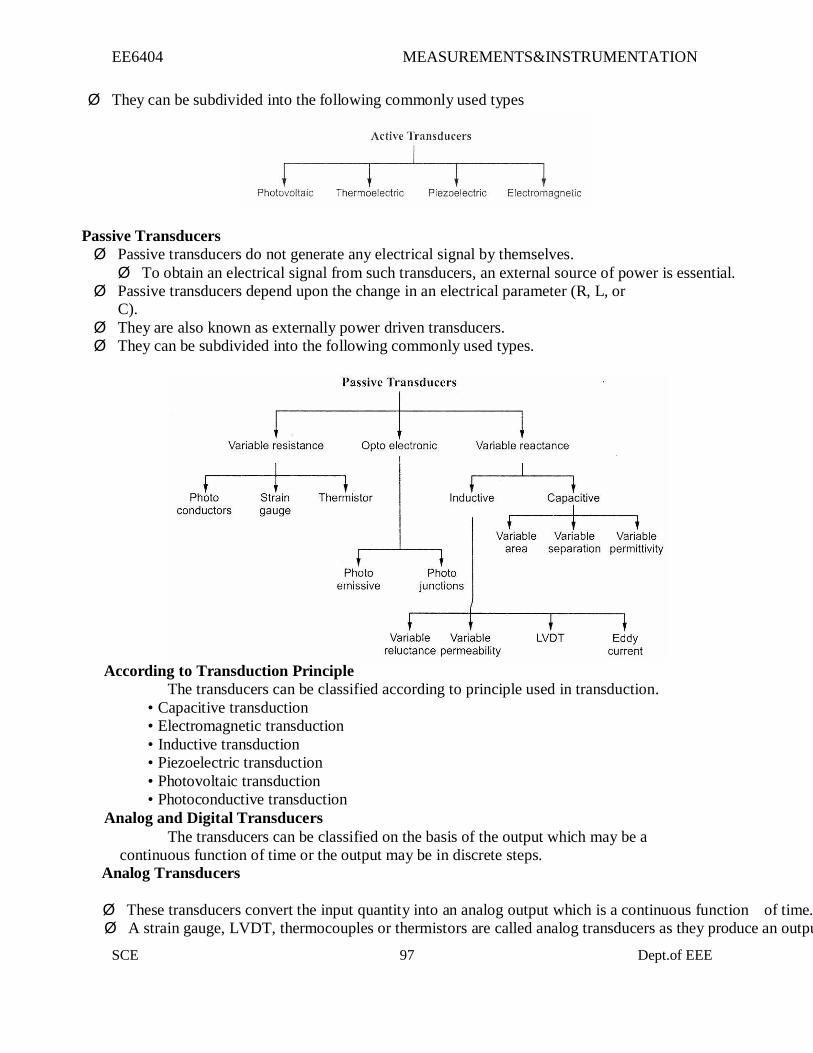
EE6404 MEASUREMENTS&INSTRUMENTATION
SCE 97 Dept.of EEE
Ø They can be subdivided into the following commonly used types
Passive Transducers
Ø Passive transducers do not generate any electrical signal by themselves.
Ø To obtain an electrical signal from such transducers, an external source of power is essential.
Ø Passive transducers depend upon the change in an electrical parameter (R, L, or C).
Ø They are also known as externally power driven transducers.
Ø They can be subdivided into the following commonly used types.
According to Transduction Principle
The transducers can be classified according to principle used in transduction.
• Capacitive transduction
• Electromagnetic transduction
• Inductive transduction
• Piezoelectric transduction
• Photovoltaic transduction
• Photoconductive transduction
Analog and Digital Transducers
The transducers can be classified on the basis of the output which may be a
continuous function of time or the output may be in discrete steps. Analog Transducers
Ø These transducers convert the input quantity into an analog output which is a continuous function of time.
Ø A strain gauge, LVDT, thermocouples or thermistors are called analog transducers as they produce an output
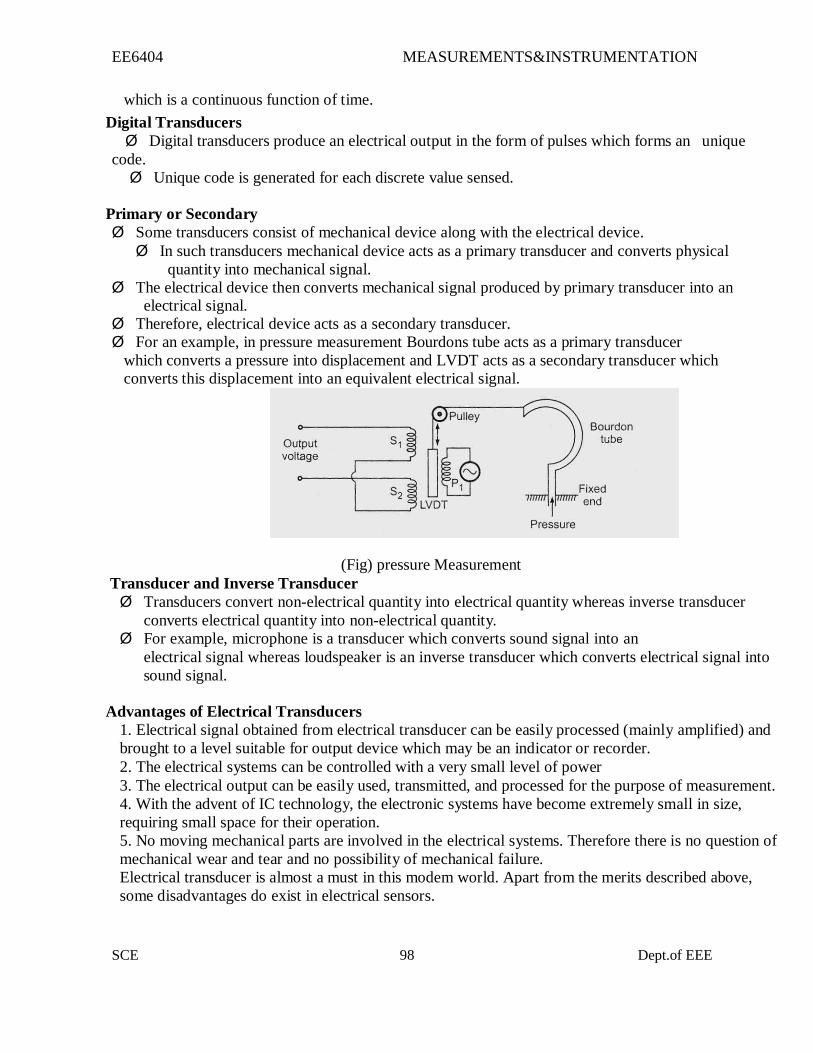
EE6404 MEASUREMENTS&INSTRUMENTATION
SCE 98 Dept.of EEE
which is a continuous function of time.
Digital Transducers
Ø Digital transducers produce an electrical output in the form of pulses which forms an unique
code.
Ø Unique code is generated for each discrete value sensed.
Primary or Secondary
Ø Some transducers consist of mechanical device along with the electrical device.
Ø In such transducers mechanical device acts as a primary transducer and converts physical
quantity into mechanical signal.
Ø The electrical device then converts mechanical signal produced by primary transducer into an electrical signal.
Ø Therefore, electrical device acts as a secondary transducer.
Ø For an example, in pressure measurement Bourdons tube acts as a primary transducer
which converts a pressure into displacement and LVDT acts as a secondary transducer which
converts this displacement into an equivalent electrical signal.
(Fig) pressure Measurement
Transducer and Inverse Transducer
Ø Transducers convert non-electrical quantity into electrical quantity whereas inverse transducer
converts electrical quantity into non-electrical quantity.
Ø For example, microphone is a transducer which converts sound signal into an
electrical signal whereas loudspeaker is an inverse transducer which converts electrical signal into
sound signal.
Advantages of Electrical Transducers
1. Electrical signal obtained from electrical transducer can be easily processed (mainly amplified) and
brought to a level suitable for output device which may be an indicator or recorder.
2. The electrical systems can be controlled with a very small level of power
3. The electrical output can be easily used, transmitted, and processed for the purpose of measurement.
4. With the advent of IC technology, the electronic systems have become extremely small in size,
requiring small space for their operation.
5. No moving mechanical parts are involved in the electrical systems. Therefore there is no question of
mechanical wear and tear and no possibility of mechanical failure.
Electrical transducer is almost a must in this modem world. Apart from the merits described above,
some disadvantages do exist in electrical sensors.
EE6404 MEASUREMENTS&INSTRUMENTATION
SCE 99 Dept.of EEE
Disadvantages of Electrical Transducers
Ø The electrical transducer is sometimes less reliable than mechanical type because of the ageing
and drift of the active components.
Ø Also, the sensing elements and the associated signal processing circuitry are comparatively
expensive.
Ø With the use of better materials, improved technology and circuitry, the range of accuracy and
stability have been increased for electrical transducers.
Ø Using negative feedback technique, the accuracy of measurement and the stability of the system are improved, but all at the expense of increased circuit complexity, more space, and obviously,
more cost. Characteristics of Transducer
1. Accuracy: It is defined as the closeness with which the reading approaches an accepted standard
value or ideal value or true value, of the variable being measured.
2. Ruggedness: The transducer should be mechanically rugged to withstand overloads. It should
have overload protection.
3. Linearity: The output of the transducer should be linearly proportional to the input quantity under
measurement. It should have linear input - output characteristic. -
4. Repeatability: The output of the transducer must be exactly the same, under same environmental
conditions, when the same quantity is applied at the input repeatedly.
5. High output: The transducer should give reasonably high output signal so that it can be easily
processed and measured. The output must be much larger than noise. Now-a-days, digital output
is preferred in many applications;
6. High Stability and Reliability: The output of the transducer should be highly stable and
reliable so that there will be minimum error in measurement. The output must remain
unaffected by environmental conditions such as change in temperature, pressure, etc.
7. Sensitivity: The sensitivity of the electrical transducer is defined as the electrical output
obtained per unit change in the physical parameter of the input quantity. For example, for a
transducer used for temperature measurement, sensitivity will be expressed in mV/’ C. A high
sensitivity is always desirable for a given transducer.
8. Dynamic Range: For a transducer, the operating range should be wide, so that it can be used
over a wide range of measurement conditions.
9. Size: The transducer should have smallest possible size and shape with minimal weight and
volume. This will make the measurement system very compact.
10. Speed of Response: It is the rapidity with which the transducer responds to changes in the
measured quantity. The speed of response of the transducer should be as high as practicable.
5.2 Transducer Selection Factors
1. Nature of measurement
2. Loading effect 3. Environmental considerations
4. Measuring system 5. Cost & Availability

100
EE6404 MEASUREMENTS&INSTRUMENTATION
SCE Dept.of EEE
5.3 Resistance Transducers
Temperature Sensors
Temperature is one of the fundamental parameters indicating the physical condition of
matter, i.e. expressing its degree of hotness or coldness. Whenever a body is heat’ various effects
are observed. They include
• Change in the physical or chemical state, (freezing, melting, boiling etc.)
• Change in physical dimensions, • Changes in electrical properties, mainly the change in resistance,
• Generation of an emf at the junction of two dissimilar metals. One of these effects can be employed for temperature measurement purposes. Electrical
methods are the most convenient and accurate methods of temperature measurement. These
methods are based on change in resistance with temperature and generation of thermal e.m.f.
The change in resistance with temperature may be positive or negative. According to that
there are two types
• Resistance Thermometers —Positive temperature coefficient • Thermistors —Negative temperature coefficient
Construction of Resistance Thermometers
Ø The wire resistance thermometer usually consists of a coil wound on a mica or
ceramic former, as shown in the Fig.
Ø The coil is wound in bifilar form so as to make it no inductive. Such coils are
available in different sizes and with different resistance values ranging from 10 ohms to
25,000 ohms.
(Fig) Resistance Thermometer
Advantages of Resistance Thermometers
1. The measurement is accurate.
2. Indicators, recorders can be directly operated.
3. The temperature sensor can be easily installed and replaced.
4. Measurement of differential temperature is possible.
5. Resistance thermometers can work over a wide range of temperature from
-20’ C to + 650° C.
6. They are suitable for remote indication.
7. They are smaller in size
8. They have stability over long periods of time.
Limitations of Resistance Thermometers
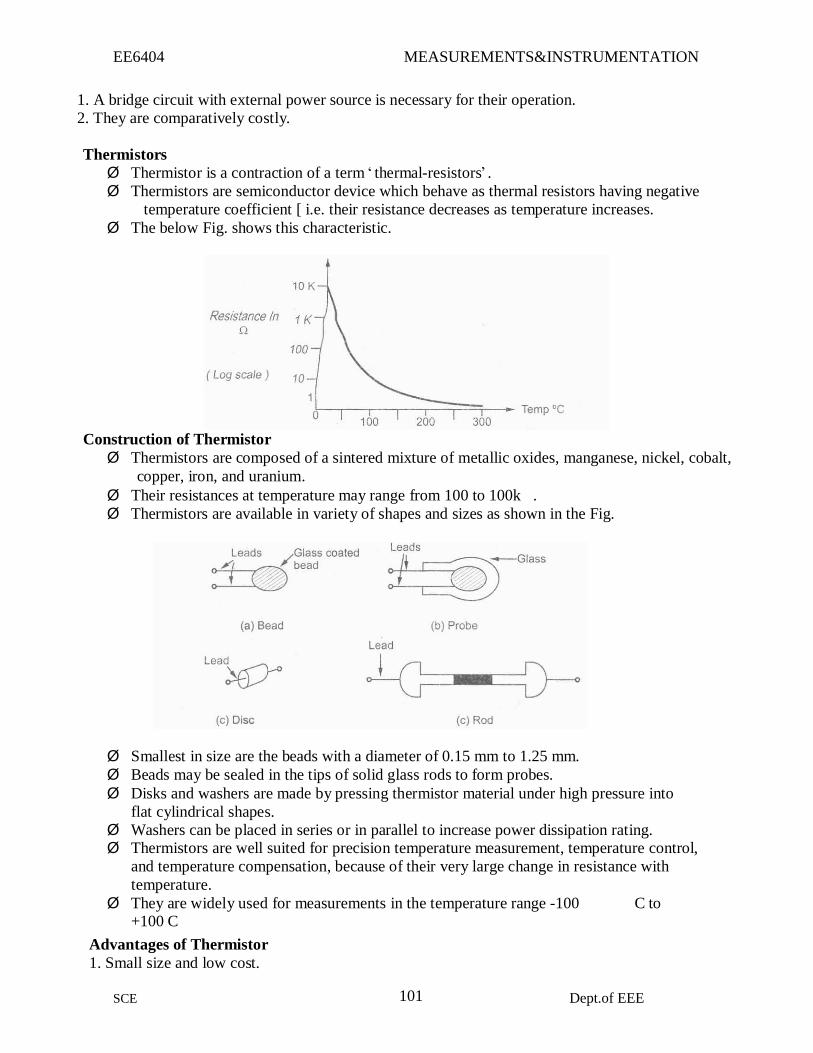
101
EE6404 MEASUREMENTS&INSTRUMENTATION
SCE Dept.of EEE
1. A bridge circuit with external power source is necessary for their operation.
2. They are comparatively costly.
Thermistors
Ø Thermistor is a contraction of a term ‘ thermal-resistors’ .
Ø Thermistors are semiconductor device which behave as thermal resistors having negative
temperature coefficient [ i.e. their resistance decreases as temperature increases.
Ø The below Fig. shows this characteristic.
Construction of Thermistor
Ø Thermistors are composed of a sintered mixture of metallic oxides, manganese, nickel, cobalt,
copper, iron, and uranium.
Ø Their resistances at temperature may range from 100 to 100k .
Ø Thermistors are available in variety of shapes and sizes as shown in the Fig.
Ø Smallest in size are the beads with a diameter of 0.15 mm to 1.25 mm.
Ø Beads may be sealed in the tips of solid glass rods to form probes.
Ø Disks and washers are made by pressing thermistor material under high pressure into
flat cylindrical shapes.
Ø Washers can be placed in series or in parallel to increase power dissipation rating. Ø Thermistors are well suited for precision temperature measurement, temperature control,
and temperature compensation, because of their very large change in resistance with
temperature.
Ø They are widely used for measurements in the temperature range -100 C to +100 C
Advantages of Thermistor
1. Small size and low cost.
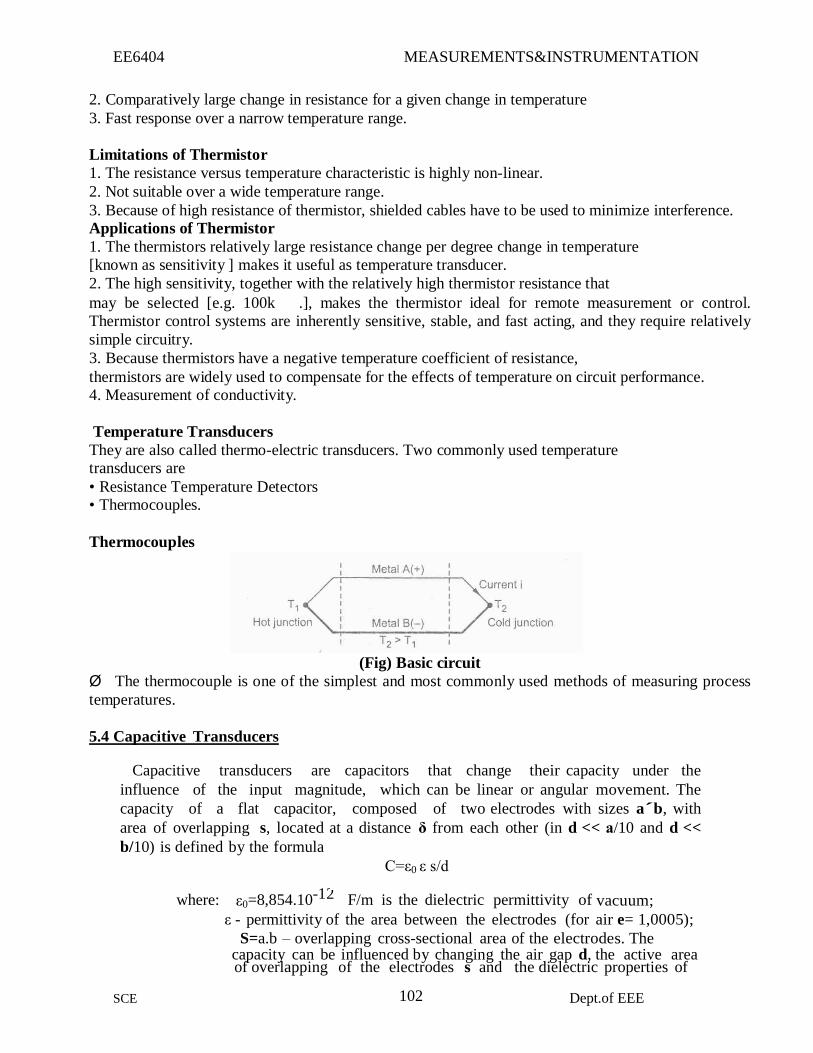
102
EE6404 MEASUREMENTS&INSTRUMENTATION
SCE Dept.of EEE
2. Comparatively large change in resistance for a given change in temperature
3. Fast response over a narrow temperature range.
Limitations of Thermistor
1. The resistance versus temperature characteristic is highly non-linear.
2. Not suitable over a wide temperature range.
3. Because of high resistance of thermistor, shielded cables have to be used to minimize interference. Applications of Thermistor
1. The thermistors relatively large resistance change per degree change in temperature
[known as sensitivity ] makes it useful as temperature transducer.
2. The high sensitivity, together with the relatively high thermistor resistance that
may be selected [e.g. 100k .], makes the thermistor ideal for remote measurement or control.
Thermistor control systems are inherently sensitive, stable, and fast acting, and they require relatively
simple circuitry.
3. Because thermistors have a negative temperature coefficient of resistance,
thermistors are widely used to compensate for the effects of temperature on circuit performance. 4. Measurement of conductivity.
Temperature Transducers
They are also called thermo-electric transducers. Two commonly used temperature transducers are
• Resistance Temperature Detectors • Thermocouples.
Thermocouples
(Fig) Basic circuit
Ø The thermocouple is one of the simplest and most commonly used methods of measuring process
temperatures.
5.4 Capacitive Transducers
Capacitive transducers are capacitors that change their capacity under the
influence of the input magnitude, which can be linear or angular movement. The
capacity of a flat capacitor, composed of two electrodes with sizes a´b, with
area of overlapping s, located at a distance δ from each other (in d << а/10 and d <<
b/10) is defined by the formula
C=ε0 ε s/d
where: ε0=8,854.10-12 F/m is the dielectric permittivity of vacuum;
ε - permittivity of the area between the electrodes (for air e= 1,0005);
S=a.b – overlapping cross-sectional area of the electrodes. The capacity can be influenced by changing the air gap d, the active area of overlapping of the electrodes s and the dielectric properties of

103
EE6404 MEASUREMENTS&INSTRUMENTATION
SCE Dept.of EEE
the environment
Single capacitive transducers
Differential capacitive transducers
Application of capacitive transducers
Capacitive sensors have found wide application in automated systems that
require precise determination of the placement of theobjects, processes in
microelectronics, assembly of precise equipment associated with spindles for
high speed drilling machines, ultrasonic welding machines and in equipment for
vibration measurement. They can be used not only to measure displacements (large
and small), but also the level of fluids, fuel bulk materials, humidity environment,
concentration of substances and others Capacitive sensors are often used for
non-contact measurement of the thickness of various materials, such as silicon
wafers, brake discs and plates of hard discs. Among the possibilities of the
capacitive sensors is the measurement of density, thickness and location of
dielectrics.
5.5 Inductive Transducers
An LVDT, or Linear Variable Differential Transformer, is a transducer that
converts a linear displacement or position from a mechanical reference (or zero) into a
proportional electrical signal containing phase (for direction) and amplitude information
(for distance). The LVDT operation does not require electrical contact between the
moving part (probe or core rod assembly) and the transformer, but rather relies on
electromagnetic coupling; this and the fact that they operate without any built-in electronic
circuitry are the primary reasons why LVDTs have been widely used in applications where
long life and high reliability under severe environments are a required, such
Military/Aerospace applications.
The LVDT consists of a primary coil (of magnet wire) wound over the whole
length of a non-ferromagnetic bore liner (or spool tube) or a cylindrical coil form. Two
secondary coils are wound on top of the primary coil for “long stroke” LVDTs (i.e. for
actuator main RAM) or each side of the primary coil for “Short stroke” LVDTs (i.e. for
electro-hydraulic servo-valve or EHSV). The two secondary windings are typically
connected in “opposite series” (or wound in opposite rotational directions). A
ferromagnetic core, which length is a fraction of the bore liner length, magnetically
couples the primary to the secondary winding turns that are located above the length of
the core.
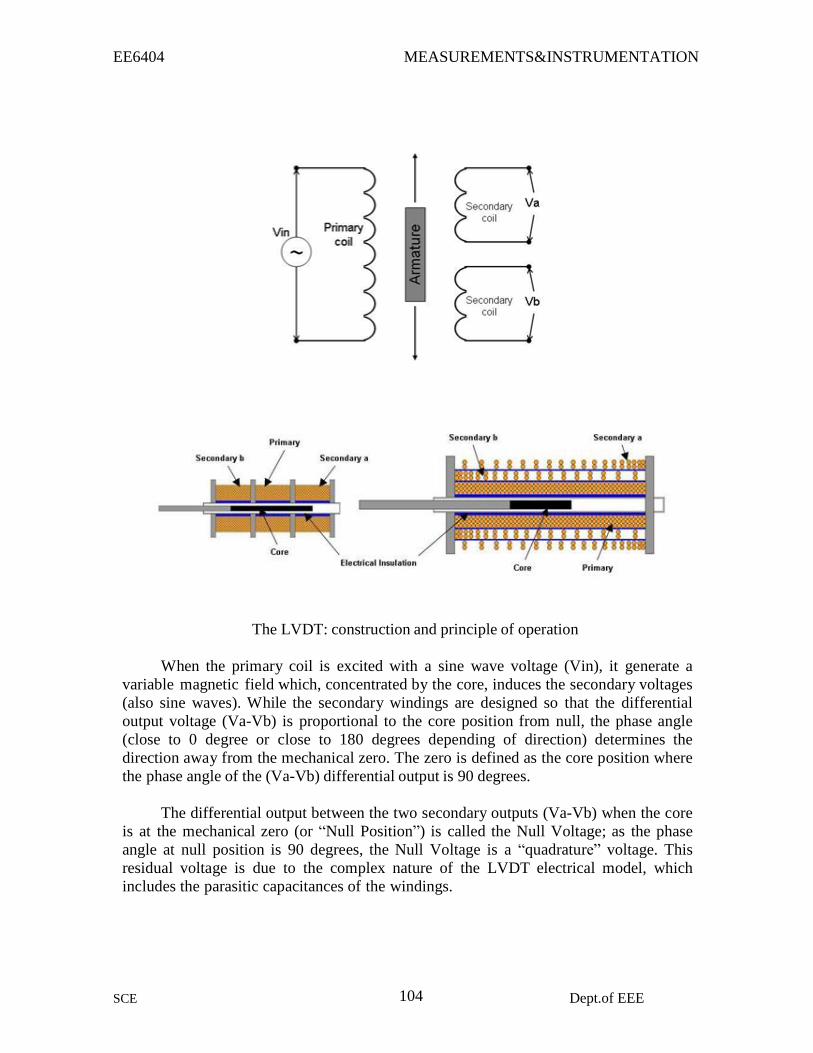
104
EE6404 MEASUREMENTS&INSTRUMENTATION
SCE Dept.of EEE
The LVDT: construction and principle of operation
When the primary coil is excited with a sine wave voltage (Vin), it generate a
variable magnetic field which, concentrated by the core, induces the secondary voltages
(also sine waves). While the secondary windings are designed so that the differential
output voltage (Va-Vb) is proportional to the core position from null, the phase angle
(close to 0 degree or close to 180 degrees depending of direction) determines the
direction away from the mechanical zero. The zero is defined as the core position where
the phase angle of the (Va-Vb) differential output is 90 degrees.
The differential output between the two secondary outputs (Va-Vb) when the core
is at the mechanical zero (or “Null Position”) is called the Null Voltage; as the phase
angle at null position is 90 degrees, the Null Voltage is a “quadrature” voltage. This
residual voltage is due to the complex nature of the LVDT electrical model, which
includes the parasitic capacitances of the windings.
105
EE6404 MEASUREMENTS&INSTRUMENTATION
SCE Dept.of EEE
5.6 Digital Transducers
A transducer measures physical quantities and transmits the information as coded digital signals rather than as continuously varying currents or voltages. Any transducer that presents information as discrete samples and that does not introduce a quantization error when the reading is represented in the digital form may be classified as a digital transducer. Most transducers used in digital systems are primarily analogue in nature and incorporate some form of conversion to provide the digital output. Many special techniques have been developed to avoid the necessity to use a conventional analogue- to-digital conversion technique to produce the digital signal. This article describes some of the direct methods which are in current use of producing digital outputs from transducers.
Some of the techniques used in transducers which are particularly adaptable for use in digital systems are introduced. The uses of encoder discs for absolute and incremental position measurement and to provide measurement of angul ar speed are outlined. The application of linear gratings for measurement of translational displacement is compared with the use of Moire fringe techniques used for similar purposes. Synchro devices are briefly explained and the various techniques used to produce a digital output from synchro resolvers are described. Brief descriptions of devices which develop a digital output from the natural frequency of vibration of some part of the transducer are presented. Digital techniques including vortex flowmeters and instruments using laser beams are also briefly dealt with. Some of them are as follows: 1. Shaft Encoders 2. Digital Resolvers 3. Digital Tachometers 4. Hall Effect Sensors 5. Limit Switches
Shaft Encoders:
An encoder is a device that provides a coded reading of a measurement. A Shaft
encoders can be one of the encoder that provide digital output measurements of angular
position and velocity. This shaft encoders are excessively applicable in robotics,
machine tools, mirror positioning systems, rotating machinery controls (fluid and
electric), etc. Shaft encoders are basically of two types-Absolute and Incremental
encoders.
An "absolute" encoder maintains position information when power is removed from
the system. The position of the encoder is available immediately on applying power.
The relationship between the encoder value and the physical position of the controlled
machinery is set at assembly; the system does not need to return to a calibration point to
maintain position accuracy. An "incremental" encoder accurately records changes in
position, but does not power up with a fixed relation between encoder state and
physical position. Devices controlled by incremental encoders may have to "go home"
to a fixed reference point to initialize the position measurement. A multi-turn
absolute rotary encoder includes additional code wheels and gears. A high-resolution
wheel measures the fractional rotation, and lower-resolution geared code wheels record
the number of whole revolutions of the shaft.
An absolute encoder has multiple code rings with various binary weightings
which provide a data word representing the absolute position of the encoder within one
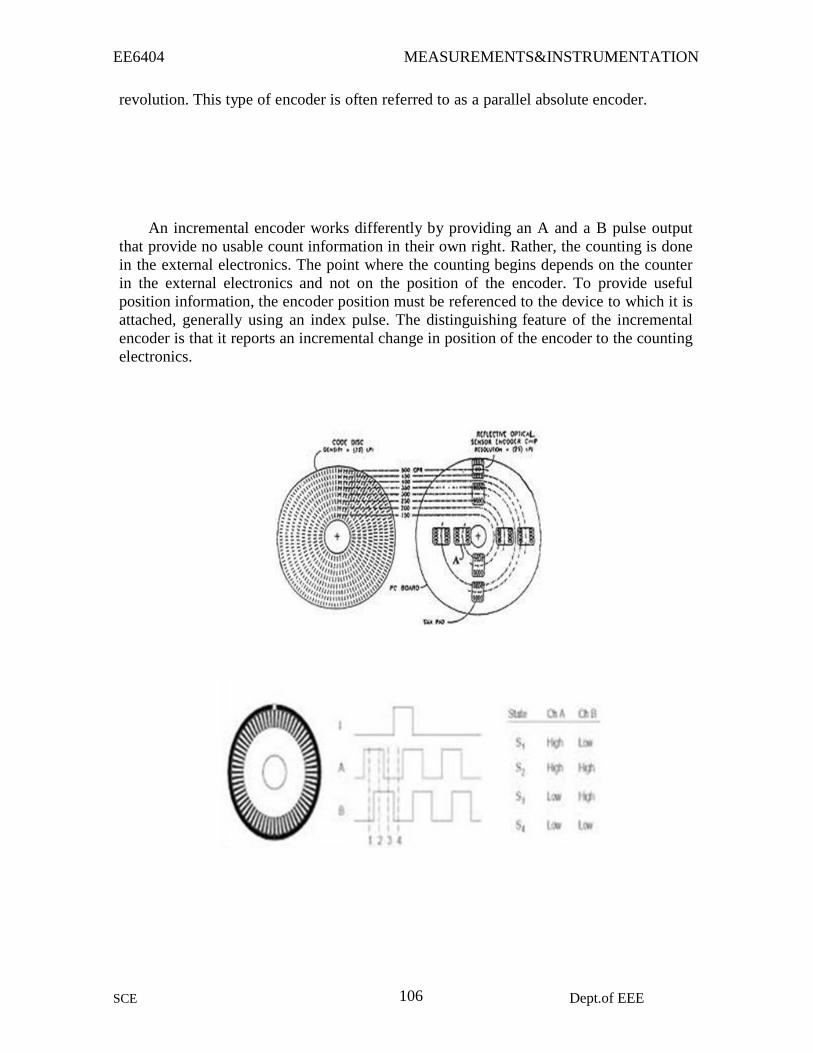
106
EE6404 MEASUREMENTS&INSTRUMENTATION
SCE Dept.of EEE
revolution. This type of encoder is often referred to as a parallel absolute encoder.
An incremental encoder works differently by providing an A and a B pulse output
that provide no usable count information in their own right. Rather, the counting is done
in the external electronics. The point where the counting begins depends on the counter
in the external electronics and not on the position of the encoder. To provide useful
position information, the encoder position must be referenced to the device to which it is
attached, generally using an index pulse. The distinguishing feature of the incremental
encoder is that it reports an incremental change in position of the encoder to the counting
electronics.
107
EE6404 MEASUREMENTS&INSTRUMENTATION
SCE Dept.of EEE
5.7 Piezoelectric Transducers
Piezoelectric transducers produce an output voltage when a force is applied to them.
They are frequently used as ultrasonic receivers and also as displacement transducers,
particularly as part of devices measuring acceleration, force and pressure. In ultra- sonic
receivers, the sinusoidal amplitude variations in the ultrasound wave received are
translated into sinusoidal changes in the amplitude of the force applied to the
piezoelectric transducer. In a similar way, the translational movement in a displacement
transducer is caused by mechanical means to apply a force to the piezoelectric transducer.
Piezoelectric transducers are made from piezoelectric materials. These have an asymmetrical
lattice of molecules that distorts when a mechanical force is applied to it. This distortion
causes a reorientation of electric charges within the material, resulting in a relative
displacement of positive and negative charges. The charge displacement induces surface
charges on the material of opposite polarity between the two sides. By implanting
electrodes into the surface of the material, these surface charges can be measured as an output
voltage. For a rectangular block of material, the induced voltage is given by:
Where F is the applied force in g, A is the area of the material in mm, d is the thickness of the
material and k is the piezoelectric constant. The polarity of the induced voltage depends on
whether the material is compressed or stretched.
Where F is the applied force in g, A is the area of the material in mm, d is the thickness of the
material and k is the piezoelectric constant. The polarity of the induced voltage depends on
whether the material is compressed or stretched.
Materials exhibiting piezoelectric behaviour include natural ones such as quartz, synthetic
ones such as lithiumsulphate andferroelectric ceramics such as barium titanate. The piezoelectric
constant varies widely between different materials. Typical values of k are 2.3 for quartz and 140
for barium titanate. Applying equation (13.1) for a force of 1 g applied to a crystal of area 100
mm2 and thickness 1 mm gives an output of 23 µV for quartz and 1.4 mV for barium titanate.
The piezoelectric principle is invertible, and therefore distortion in a piezoelectric material
can be caused by applying a voltage to it. This is commonly used in ultrasonic transmitters, where
the application of a sinusoidal voltage at a frequency in the ultra- sound range causes a
sinusoidal variation in the thickness of the material and results in a sound wave being emitted
at the chosen frequency. This is considered further in the section below on ultrasonic

108
EE6404 MEASUREMENTS&INSTRUMENTATION
SCE Dept.of EEE
transducers.
5.8 Hall-effect transducers
Basically, a Hall-effect sensor is a device that is used to measure the magnitude of a magnetic
field. It consists of a conductor carrying a current that is aligned orthogonally with the magnetic
field, as shown in Figure 13.4. This produces a transverse voltage difference across the device
that is directly proportional to the magnetic field strength. For an excitation current I and
magnetic field strength B, the output voltage is given by V D KIB, where K is known as the
Hall constant
The conductor in Hall-effect sensors is usually made from a semiconductor material as
opposed to a metal, because a larger voltage output is produced for a magnetic field of a given
size. In one common use of the device as a proximity sensor, the magnetic field is provided
by a permanent magnet that is built into the device. The magnitude of this field changes
when the device becomes close to any ferrous metal object or boundary. The Hall Effect is
also commonly used in keyboard pushbuttons, in which a magnet is attached underneath the
button. When the button is depressed, the magnet moves past a Hall-effect sensor. The
induced voltage is then converted by a trigger circuit into a digital output. Such pushbutton
switches can operate at high frequencies without contact bounce.
5.9 DATA ACQUISITION SYSTEMS
Definition
109
EE6404 MEASUREMENTS&INSTRUMENTATION
SCE Dept.of EEE
Data acquisition is the process of real world physical conditions and conversion of
the resulting samples into digital numeric values that can be manipulated by a computer. Data
acquisition and data acquisition systems (abbreviated with the acronym DAS) typically involves
the conversion of analog waveforms into digital values for processing.
The components of data acquisition systems include:
i) Sensors that convert physical parameters to electrical signals.
ii) Signal conditioning circuitry to convert sensor signals into a form that can be converted to
digital values.
iii) Analog-to-digital converters, which convert conditioned sensor signals to digital values.
Diagram
Fundamental elements of data acquisition system
Explanation
Data acquisition is the process of extracting, transforming, and transporting data
from the source systems and external data sources to the data processing system to be displayed,
analyzed, and stored.
A data acquisition system (DAQ) typically consist of transducers for asserting and
measuring electrical signals, signal conditioning logic to perform amplification, isolation, and
filtering, and other hardware for receiving analog signals and providing them to a processing
system, such as a personal computer.
Data acquisition systems are used to perform a variety of functions, including
laboratory research, process monitoring and control, data logging, analytical chemistry, tests and
analysis of physical phenomena, and control of mechanical or electrical machinery.
Data recorders are used in a wide variety of applications for imprinting various
types of forms, and documents.
Data collection systems or data loggers generally include memory chips or strip
charts for electronic recording, probes or sensors which measure product environmental
parameters and are connected to the data logger.
Hand-held portable data collection systems permit in field data collection for up-to-
date information processing.
Source
Data acquisition begins with the physical phenomenon or physical property
to be measured.
Examples of this include temperature, light intensity, gas pressure, fluid
flow, and force. Regardless of the type of physical property to be measured, the physical state
that is to be measured must first be transformed into a unified form that can be sampled by a
data acquisition system.
The task of performing such transformations falls on devices called
sensors.
A sensor, which is a type of transducer, is a device that converts a physical
property into a corresponding electrical signal (e.g., a voltage or current) or, in many cases, into
110
EE6404 MEASUREMENTS&INSTRUMENTATION
SCE Dept.of EEE
a corresponding electrical characteristic (e.g., resistance or capacitance) that can easily be
converted to electrical signal.
The ability of a data acquisition system to measure differing properties
depends on having sensors that are suited to detect the various properties to be measured. There
are specific sensors for many different applications.
DAQ systems also employ various signal conditioning techniques to
adequately modify various different electrical signals into voltage that can then be digitized
using an Analog-to-digital converter (ADC).
Signals
Signals may be digital (also called logic signals sometimes) or analog depending on
the transducer used. Signal conditioning may be necessary if the signal from the transducer is
not suitable for the DAQ hardware being used.
The signal may need to be amplified, filtered or demodulated.
Various other examples of signal conditioning might be bridge completion,
providing current or voltage excitation to the sensor, isolation, and linearization. For
transmission purposes, single ended analog signals, which are more susceptible to noise can
be converted to differential signals. Once digitized, the signal can be encoded to reduce and
correct transmission errors.
DAQ hardware
DAQ hardware is what usually interfaces between the signal and a PC. It could be
in the form of modules that can be connected to the computer's ports (parallel, serial, USB,
etc.) or cards connected to slots (S-100 bus, Apple Bus, ISA, MCA, PCI, PCI-E, etc.) in the
mother board.
Usually the space on the back of a PCI card is too small for all the connections
needed, so an external breakout box is required. The cable between this box and the PC can be
expensive due to the many wires, and the required shielding
DAQ cards often contain multiple components (multiplexer, ADC, DAC, TTL-IO,
high speed timers, RAM). These are accessible via a bus by a microcontroller, which can run
small programs.
A controller is more flexible than a hard wired logic, yet cheaper than a CPU so
that it is alright to block it with simple polling loops.
The fixed connection with the PC allows for comfortable compilation and
debugging. Using an external housing a modular design with slots in a bus can grow with the
needs of the user.
Not all DAQ hardware has to run permanently connected to a PC, for example
intelligent stand-alone loggers and oscilloscopes, which can be operated from a PC, yet they
can operate completely independent of the PC.
DAQ software
DAQ software is needed in order for the DAQ hardware to work with a PC. The
device driver performs low-level register writes and reads on the hardware, while exposing a
standard API for developing user applications.
A standard API such as COMEDI allows the same user applications to run on
different operating systems, e.g. a user application that runs on Windows will
also run on Linux and BSD.
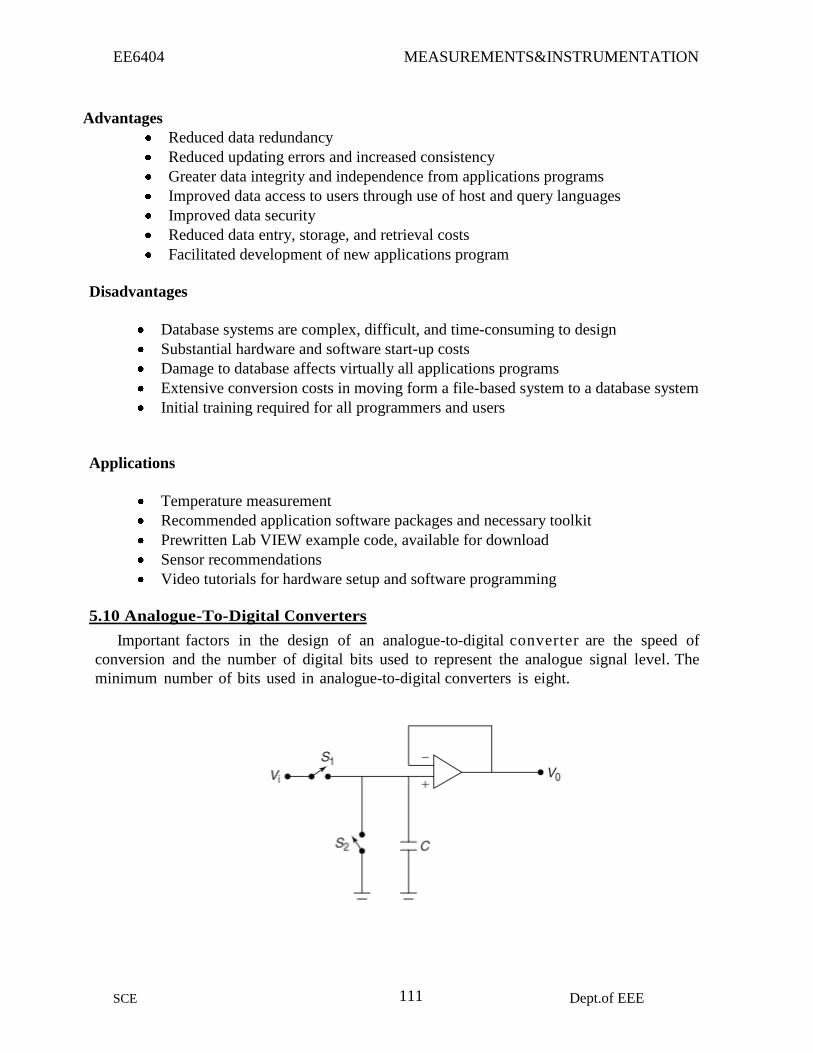
111
EE6404 MEASUREMENTS&INSTRUMENTATION
SCE Dept.of EEE
Advantages
Reduced data redundancy
Reduced updating errors and increased consistency
Greater data integrity and independence from applications programs
Improved data access to users through use of host and query languages
Improved data security
Reduced data entry, storage, and retrieval costs
Facilitated development of new applications program
Disadvantages
Database systems are complex, difficult, and time-consuming to design
Substantial hardware and software start-up costs
Damage to database affects virtually all applications programs
Extensive conversion costs in moving form a file-based system to a database system
Initial training required for all programmers and users
Applications
Temperature measurement
Recommended application software packages and necessary toolkit
Prewritten Lab VIEW example code, available for download
Sensor recommendations
Video tutorials for hardware setup and software programming
5.10 Analogue-To-Digital Converters
Important factors in the design of an analogue-to-digital converter are the speed of
conversion and the number of digital bits used to represent the analogue signal level. The
minimum number of bits used in analogue-to-digital converters is eight.

112
EE6404 MEASUREMENTS&INSTRUMENTATION
SCE Dept.of EEE
Operational amplifier connected as ’sample and hold’ circuit
The use of eight bits means that the analogue signal can be represented to a resolution
of 1 part in 256 if the input signal is carefully scaled to make full use of the converter
range. However, it is more common to use either 10 bit or 12 bit analogue-to-digital
converters, which give resolutions respectively of 1 part in 1024 and 1 part in 4096. Several
types of analogue-to-digital converter exist. These differ in the technique used to effect
signal conversion, in operational speed, and in cost.
The simplest type of analogue-to-digital converter is the counter analogue-to-
digital converter, as shown in Figure 5.23. This, like most types of analogue-to-digital
converter, does not convert continuously, but in a stop-start mode triggered by special signals
on the computer’s control bus. At the start of each conversion cycle, the counter is set to zero.
The digital counter value is converted to an analogue signal by a digital- to-analogue
converter (a discussion of digital-to-analogue converters follows in the next section), and a
comparator then compares this analogue counter value with the unknown analogue signal. The
output of the comparator forms one of the inputs to an AND logic gate. The other input to the
AND gate is a sequence of clock pulses. The comparator acts as a switch that can turn on
and off the passage of pulses from the clock through the AND gate. The output of the
AND gate is connected to the input of the digital counter. Following reset of the counter at
the start of the conversion cycle, clock pulses are applied continuously to the counter
through the AND gate, and the analogue signal at the output of the digital-to-analogue
converter gradually increases in magnitude. At some point in time, this analogue signal
becomes equal in magnitude to the unknown signal at the input to the comparator. The output
of the comparator changes state in consequence, closing the AND gate and stopping further
increments of the counter. At this point, the value held in the counter is a digital
representation of the level of the unknown analogue signal.
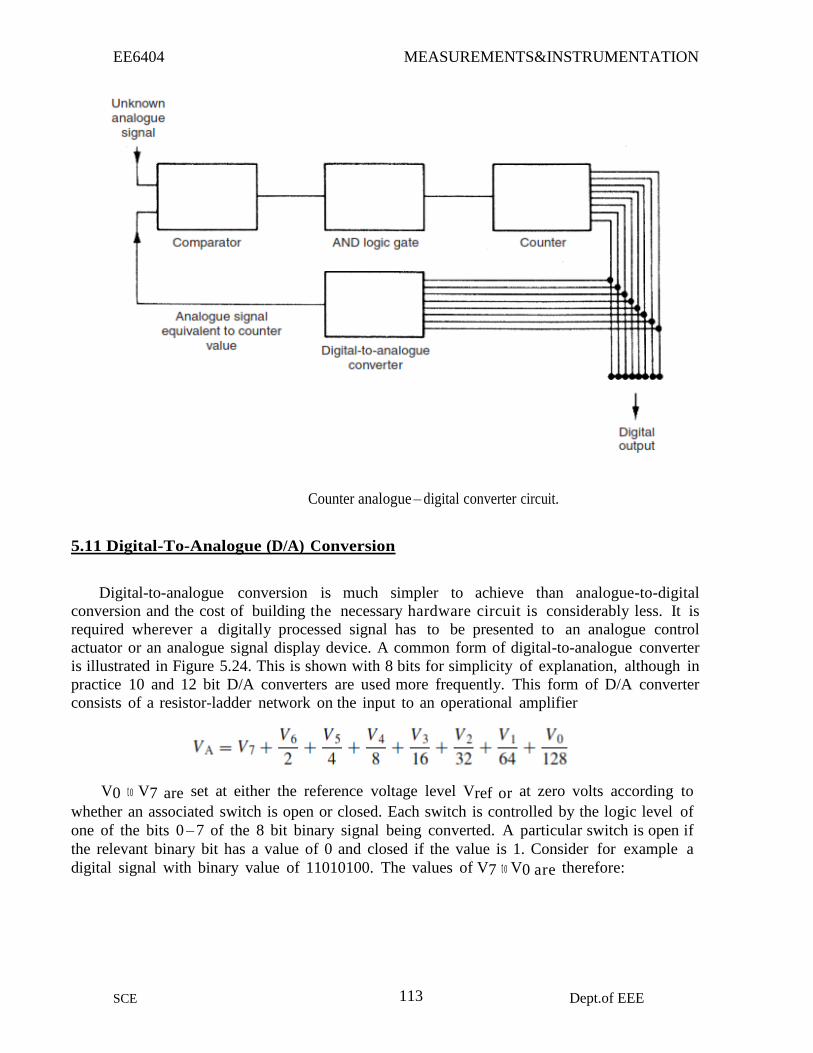
113
EE6404 MEASUREMENTS&INSTRUMENTATION
SCE Dept.of EEE
Counter analogue – digital converter circuit.
5.11 Digital-To-Analogue (D/A) Conversion
Digital-to-analogue conversion is much simpler to achieve than analogue-to-digital
conversion and the cost of building the necessary hardware circuit is considerably less. It is
required wherever a digitally processed signal has to be presented to an analogue control
actuator or an analogue signal display device. A common form of digital-to-analogue converter
is illustrated in Figure 5.24. This is shown with 8 bits for simplicity of explanation, although in
practice 10 and 12 bit D/A converters are used more frequently. This form of D/A converter
consists of a resistor-ladder network on the input to an operational amplifier
V0 t o V7 are set at either the reference voltage level Vref or at zero volts according to
whether an associated switch is open or closed. Each switch is controlled by the logic level of
one of the bits 0 – 7 of the 8 bit binary signal being converted. A particular switch is open if
the relevant binary bit has a value of 0 and closed if the value is 1. Consider for example a
digital signal with binary value of 11010100. The values of V7 t o V0 are therefore:
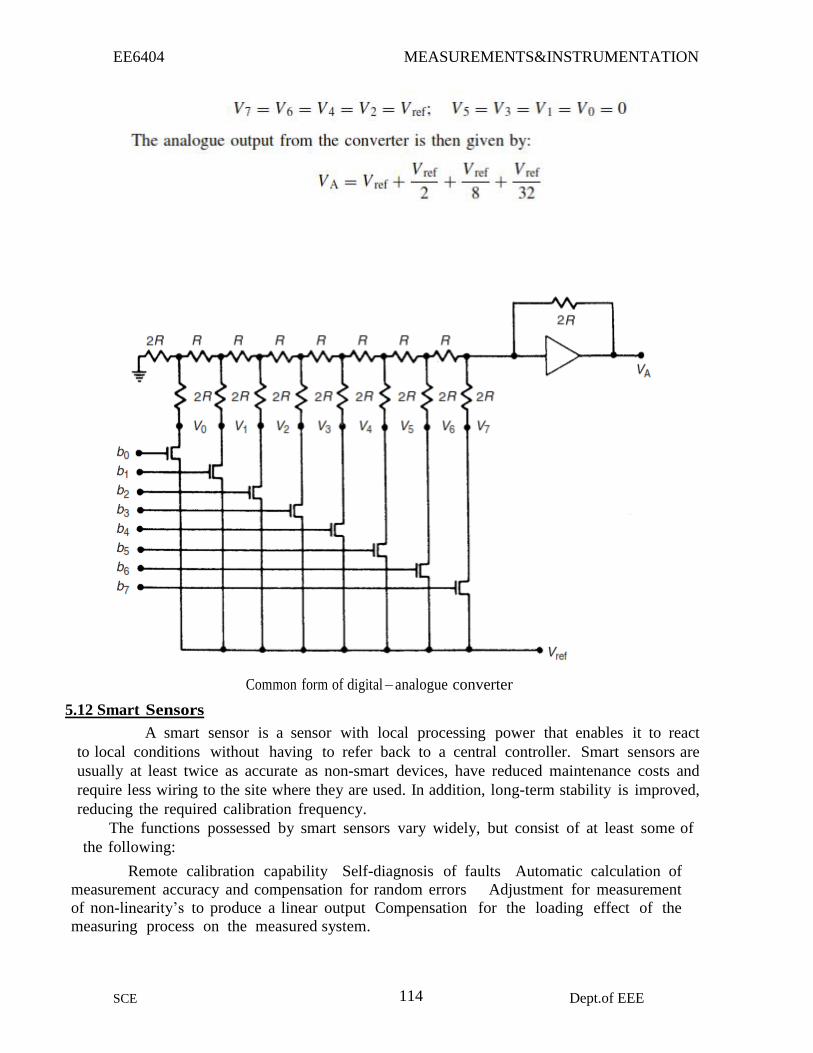
114
EE6404 MEASUREMENTS&INSTRUMENTATION
SCE Dept.of EEE
Common form of digital – analogue converter
5.12 Smart Sensors
A smart sensor is a sensor with local processing power that enables it to react
to local conditions without having to refer back to a central controller. Smart sensors are
usually at least twice as accurate as non-smart devices, have reduced maintenance costs and
require less wiring to the site where they are used. In addition, long-term stability is improved,
reducing the required calibration frequency.
The functions possessed by smart sensors vary widely, but consist of at least some of
the following:
Remote calibration capability Self-diagnosis of faults Automatic calculation of
measurement accuracy and compensation for random errors Adjustment for measurement
of non-linearity’s to produce a linear output Compensation for the loading effect of the
measuring process on the measured system.

115
EE6404 MEASUREMENTS&INSTRUMENTATION
SCE Dept.of EEE
Calibration capability
Self-calibration is very simple in some cases. Sensors with an electrical output can
use a known reference voltage level to carry out self-calibration. Also, load-cell types of sensor,
which are used in weighing systems, can adjust the output reading to zero when there is no
applied mass. In the case of other sensors, two methods of self-calibration are possible, use
of a look-up table and an interpolation technique. Unfortunately, a look-up table requires a
large memory capacity to store correction points. Also, a large amount of data has to be
gathered from the sensor during calibration. In consequence, the interpolation calibration
technique is preferable. This uses an interpolation method to calculate the correction required
to any particular measurement and only requires a small matrix of calibration points (van der
Horn, 1996).
Self-diagnosis of faults
Smart sensors perform self-diagnosis by monitoring internal signals for evidence
of faults. Whilst it is difficult to achieve a sensor that can carry out self-diagnosis of all
possible faults that might arise, it is often possible to make simple checks that detect
many of the more common faults. One example of self-diagnosis in a sensor is measuring the
sheath capacitance and resistance in insulated thermocouples to detect breakdown of the
insulation. Usually, a specific code is generated to indicate each type of possible fault (e.g. a
failing of insulation in a device).
One difficulty that often arises in self-diagnosis is in differentiating between normal
measurement deviations and sensor faults. Some smart sensors overcome this by storing
multiple measured values around a set-point, calculating minimum and maximum expected
values for the measured quantity.
Uncertainty techniques can be applied to measure the impact of a sensor fault on measurement
quality. This makes it possible in certain circumstances to continue to use a sensor after it
has developed a fault. A scheme for generating a validity index has been proposed that
indicates the validity and quality of a measurement from a sensor (Henry, 1995).
Automatic calculation of measurement accuracy and compensation for
random errors Many smart sensors can calculate measurement accuracy on-line by computing the
Mean over a number of measurements and analyzing all factors affecting accuracy. This
averaging process also serves to greatly reduce the magnitude of random measurement errors.
Adjustment for measurement non-linearities
In the case of sensors that have a non-linear relationship between the measured
quantity and the sensor output, digital processing can convert the output to a linear
form, providing that the nature of the non-linearity is known so that an equation describing
it can be programmed into the sensor.
5.13 Optical Transducer
Transducer cavity:
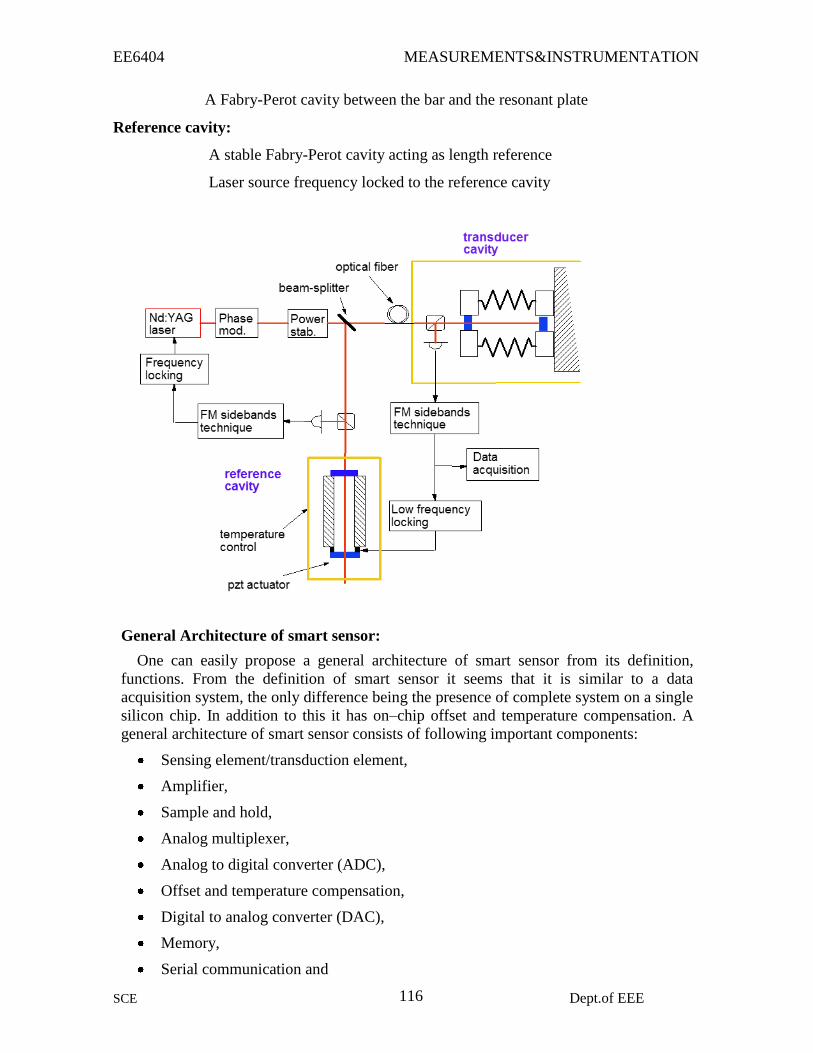
116
EE6404 MEASUREMENTS&INSTRUMENTATION
SCE Dept.of EEE
A Fabry-Perot cavity between the bar and the resonant plate
Reference cavity:
A stable Fabry-Perot cavity acting as length reference
Laser source frequency locked to the reference cavity
General Architecture of smart sensor:
One can easily propose a general architecture of smart sensor from its definition,
functions. From the definition of smart sensor it seems that it is similar to a data
acquisition system, the only difference being the presence of complete system on a single
silicon chip. In addition to this it has on–chip offset and temperature compensation. A
general architecture of smart sensor consists of following important components:
Sensing element/transduction element,
Amplifier,
Sample and hold,
Analog multiplexer,
Analog to digital converter (ADC),
Offset and temperature compensation,
Digital to analog converter (DAC),
Memory,
Serial communication and
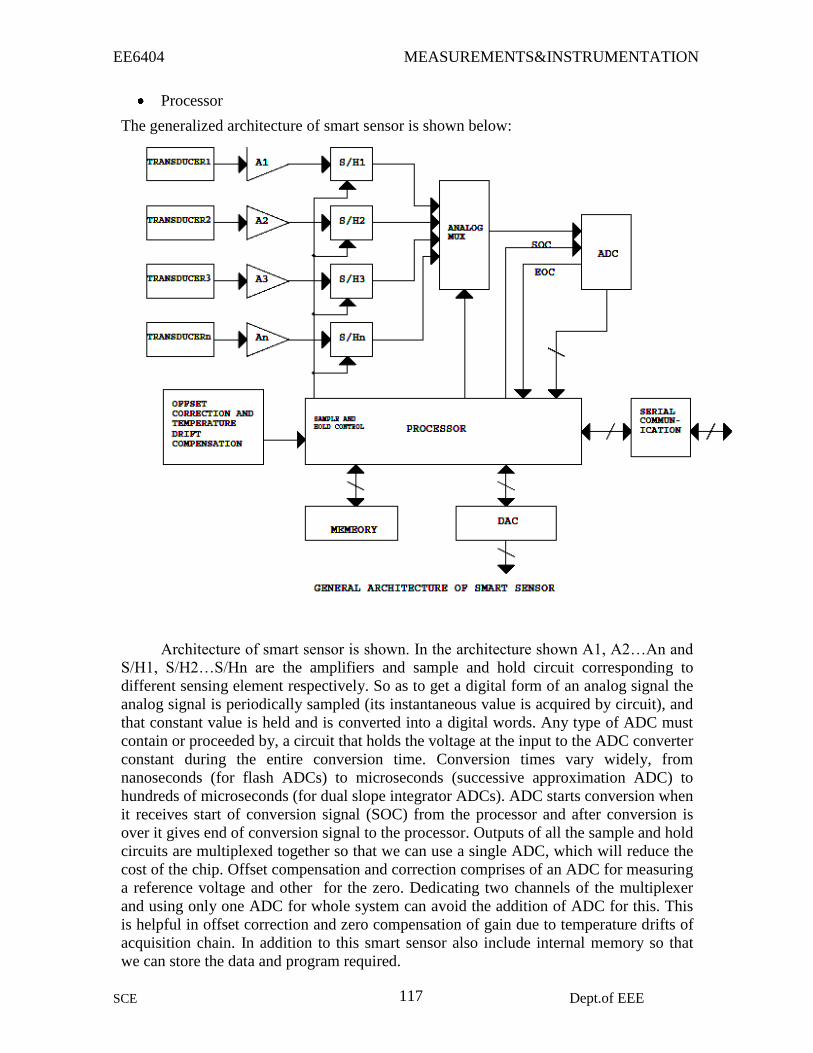
117
EE6404 MEASUREMENTS&INSTRUMENTATION
SCE Dept.of EEE
Processor
The generalized architecture of smart sensor is shown below:
Architecture of smart sensor is shown. In the architecture shown A1, A2…An and
S/H1, S/H2…S/Hn are the amplifiers and sample and hold circuit corresponding to
different sensing element respectively. So as to get a digital form of an analog signal the
analog signal is periodically sampled (its instantaneous value is acquired by circuit), and
that constant value is held and is converted into a digital words. Any type of ADC must
contain or proceeded by, a circuit that holds the voltage at the input to the ADC converter
constant during the entire conversion time. Conversion times vary widely, from
nanoseconds (for flash ADCs) to microseconds (successive approximation ADC) to
hundreds of microseconds (for dual slope integrator ADCs). ADC starts conversion when
it receives start of conversion signal (SOC) from the processor and after conversion is
over it gives end of conversion signal to the processor. Outputs of all the sample and hold
circuits are multiplexed together so that we can use a single ADC, which will reduce the
cost of the chip. Offset compensation and correction comprises of an ADC for measuring
a reference voltage and other for the zero. Dedicating two channels of the multiplexer
and using only one ADC for whole system can avoid the addition of ADC for this. This
is helpful in offset correction and zero compensation of gain due to temperature drifts of
acquisition chain. In addition to this smart sensor also include internal memory so that
we can store the data and program required.
118
EE6404 MEASUREMENTS&INSTRUMENTATION
SCE Dept.of EEE
Two mark Question &
Answer
UNIT I -
INTRODUCTION 1. What is meant by
measurement? Measurement means an act or the result of comparison between the
quantity and a predefined
standard.
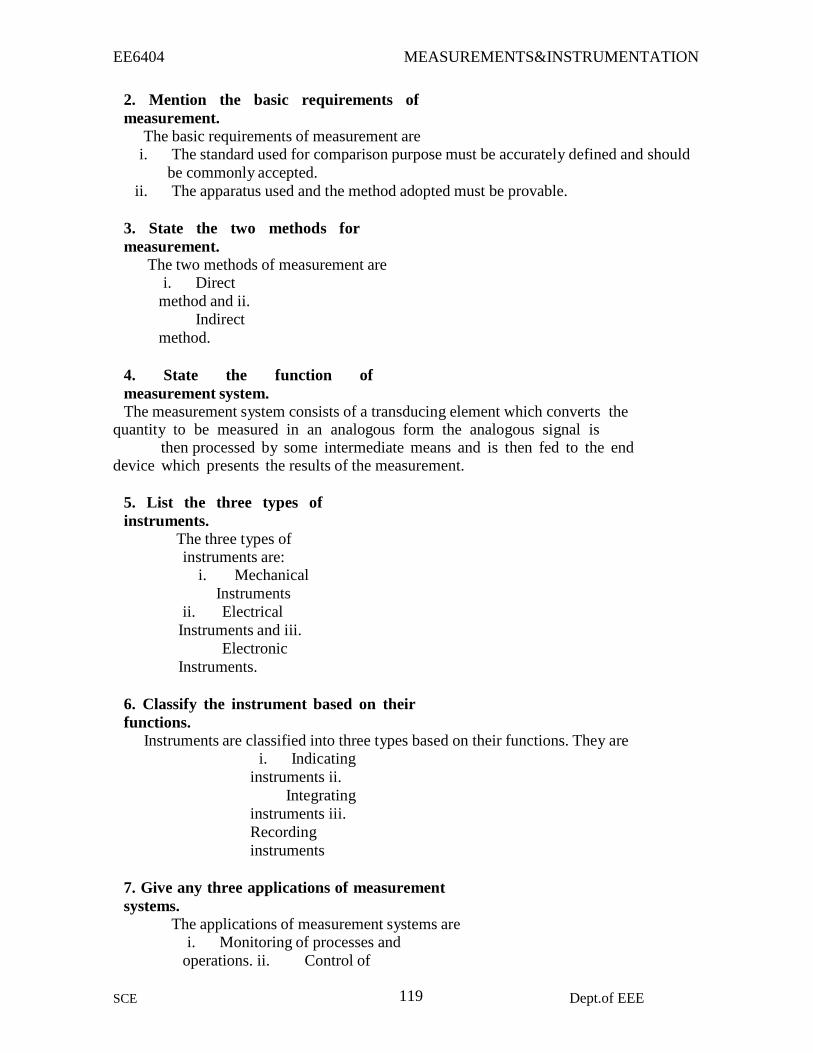
119
EE6404 MEASUREMENTS&INSTRUMENTATION
SCE Dept.of EEE
2. Mention the basic requirements of
measurement. The basic requirements of measurement are
i. The standard used for comparison purpose must be accurately defined and should
be commonly accepted.
ii. The apparatus used and the method adopted must be provable.
3. State the two methods for
measurement. The two methods of measurement are
i. Direct
method and ii.
Indirect
method.
4. State the function of
measurement system. The measurement system consists of a transducing element which converts the
quantity to be measured in an analogous form the analogous signal is then processed by some intermediate means and is then fed to the end device which presents the results of the measurement.
5. List the three types of
instruments. The three types of instruments are:
i. Mechanical
Instruments
ii. Electrical
Instruments and iii.
Electronic
Instruments.
6. Classify the instrument based on their
functions. Instruments are classified into three types based on their functions. They are
i. Indicating
instruments ii.
Integrating
instruments iii.
Recording
instruments
7. Give any three applications of measurement
systems. The applications of measurement systems are
i. Monitoring of processes and
operations. ii. Control of
120
EE6404 MEASUREMENTS&INSTRUMENTATION
SCE Dept.of EEE
processes and operations.
iii. Experimental engineering
analysis.
8. Why calibration of instrument is important? The calibration of all instruments is important since it affords the opportunity to check the instrument against a known standard and subsequently to errors in accuracy.
9. List the calibration procedure. Calibration procedure involves a comparison of the particular instrument with either.
A primary standard
A secondary standard with a higher accuracy than the
instrument to be calibrated or An instrument of known
accuracy.
10. Define: Calibration
Calibration is defined as the process by which comparing the instrument with a standard
to correct the accuracy.
11. Mention the functions performed by the measurement system.
The functions performed by the measurement
system are i. Indicating function
ii. Recording
function iii.
Controlling
function
12. List the functional elements of the measurement systems.
The three main functional elements of the measurement systems are: i. Primary sensing
element
ii. Variable conversion
element iii. Data
presentation element
13. Write the characteristics of the measurement system.
Characteristics of measurement system is divided into two categories: i. Static characteristics
ii. Dynamic characteristics
14. Write the main static characteristics?
The main static characteristics are: i.
A
ccuracy
121
EE6404 MEASUREMENTS&INSTRUMENTATION
SCE Dept.of EEE
ii.
S
ensitivi
ty
iii.
Reprod
ucibility iv.
Drift
v.
Static
error vi.
Dea
d zone
vii.
Res
olution
viii.
Precision
ix.
Rep
eatability
x.
Stab
ility
15. Define static error Static error is defined as the difference between the true value and the
measured value of the
quantity. Static error
= At – Am
where Am =measured value of quantity At =true value of quantity.
16. Define resolution
Resolution is defined as the smallest increment of quantity being measured which can be
detected with certainty being measured which can be detected with
certainty by an instrument.
17. Define threshold
Threshold is defined as the minimum value of the input at which the output starts
changing/increasing from zero.
18. Define linearity
The linearity is defined as the ability to reproduce the input characteristics
symmetrically and linearly.
122
EE6404 MEASUREMENTS&INSTRUMENTATION
SCE Dept.of EEE
19. Define reproducibility
Reproducibility is defined as the degree of closeness with
which a given value may be repeatedly measured. It is specified in
terms of scale readings over a given period of time.
20. Define drift
Drift is defined as slow variation of reading from a fixed value.
2211.. DDeeffiinnee ssppeeeedd rreessppoonnssee
Speed response is defined as the rapidity with which a measurement system
responds to changes in measured quantity. It is one of the dynamic characteristics
of a measurement system.
22. DDeeffiinnee ffiiddeelliittyy
Fidelity is defined as the degree to which a measurement system indicates
changes in the measured quantity without any dynamic error.
23. Define dynamic error
Dynamic error is defined as the difference between the true value of the
quantity changing with time and the value indicated by the measurement system
if no static error is assumed. It is also called measurement error. It is one the
dynamic characteristics.
24.Define retardation delay
Retardation delay is defined as the retardation delay in the response of a
measurement system to changes in the measured quantity.
25. Define time delay
Time delay is defined as the response of the measurement system begins
after a dead zone after the application of the input.
UNIT – II - ELECTRICAL AND ELECTRONIC INSTRUMENTS
1. Name the types of instruments used for making voltmeter and ammeter.
The types of instruments used for making voltmeter and
ammeter are i. PMMC type
ii. Moving
iron type iii.
Dynamometer
123
EE6404 MEASUREMENTS&INSTRUMENTATION
SCE Dept.of EEE
type iv. Hot
wire type
v.
Electros
tatic type vi.
Inductio
n type.
2. State the advantages of PMMC instruments.
The advantages of PMMC instruments are: i. Uniform scale
ii. No
hysterisis loss
iii. Very
accurate
iv. High efficiency
3. State the disadvantages of PMMC instruments.
The disadvantages of PMMC instruments are i. Cannot be used for ac measurements
ii. Some errors are caused by temperature variations
4. State the applications of PMMC instruments.
The applications of PMMC instruments are i. Measurement of D.C voltage
and current ii. Used in D.C
galvanometer.
5. How the range of instrument can be extended in PMMC instruments?
The range of PMMC instrument can be extended by i. connecting a shunt
resistor ii. connecting
a series resistor.
6. State the advantages of dynamometer type instruments.
The advantages of dynamometer type instruments are
i. They Can be used for both D.C and A.C
measurements ii. Free from hysterisis and
eddy current errors.
7. State the advantages of moving iron type instruments. The advantages of moving iron type instruments are:
i. Less expensive
ii. Can be used for both DC
and AC
iii. Reasonably accurate.
8. State the advantages of Hot wire type instruments.

124
EE6404 MEASUREMENTS&INSTRUMENTATION
SCE Dept.of EEE
The advantages of Hot wire type instruments are: i. They can be used for both dc and ac
ii. They are unaffected by stray magnetic fields
iii. Readings are independent of frequency and waveform.
9. What are the constructional parts of dynamometer type wattmeter?
The constructional parts of dynamometer type wattmeter are: i. Fixed coil
ii. Moving Coil
iii. Current
limiting resister iv.
Helical spring
v. Spindle attached
with pointer vi. Graduated
scale
10. State the disadvantages of dynamometer type wattmeter.
The disadvantages of dynamometer type wattmeter are: i. Readings may be affected by stray
magnetic fields. ii. At low power factor it
causes error.
11. Name the errors caused in dynamometer type wattmeter.
The errors caused in dynamometer type wattmeter are: i. Error due to pressure coil
inductance ii. Error due to
pressure coil capacitance iii.
Error due to methods of connection
iv. Error due to stray
magnetic fields v. Error
due to eddy current.
12. Name the methods used for power measurement in three phase circuits.
The methods used for power measurement in three phase circuits are: i. Single
wattmeter method ii.
Two wattmeter
method
iii. Three wattmeter
method.
13. What are the special features to be incorporated for LPF wattmeter?
The special features to be incorporate for LPF wattemeter are: i. Pressure coil circuit
ii. Compensation for Pressure coil current
iii. Compensation for Pressure coil inductance.
14. Name the methods used in wattmeter calibration.
125
EE6404 MEASUREMENTS&INSTRUMENTATION
SCE Dept.of EEE
The methods used in wattmeter calibration are: i. Comparing with standard
wattmeter. ii. Using voltmeter
ammeter method.
iii. Using Potentiometer.
15. Name the constructional parts of induction type energy meter. The constructional parts of induction type energymeter are:
i. Current coil with
series magnet ii.
Voltage coil with shunt
magnet iii. Al disc
iv. Braking magnet
v. Registering
mechanism.
16. How voltage coil is connected in induction type energy meter?
Voltage coil is connected in parallel to supply and load in induction type energy meter.
17. How current coil is connected in induction type energy meter?
Current coil is connected in series to the load in induction type energy meter.
18. Why aluminium disc is used in induction type energy meter?
Aluminium disc is used in induction type energy meter
because it is a nonmagnetic metal.
19. What is the purpose of registering mechanism?
The purpose of registering mechanism is to record the energy proportional to the rotations.
20. Define creeping.
Creeping is defined as slow but continuous rotation of disc when pressure coil is energized and current coil is not
energized.
21. State the reason why holes are provided in aluminium disc.
Holes are provided on both sides of aluminium disc to avoid creeping.
UNIT III - COMPARSION METHODS OF
MEASUREMENT
1. What is the basic principle used in potentiometer?
Basic principle used in potentiometer is that the unknown emf is measured by comparing it with a standard

126
EE6404 MEASUREMENTS&INSTRUMENTATION
SCE Dept.of EEE
known emf.
2. Name the materials used in potentiometer.
The materials used in potentiometer are i.
Germa
n silver ii.
Mang
anin wire
3. State the applications of potentiometer.
The applications of potentiometers are i. measurement of
unknown emf ii. ammeter
calibration
iii. Voltmeter
calibration iv.
wattmeter
calibration
4. State the advantages of crompton potentiometer.
The advantages of crompton potentiometer are: i. More
accuracy ii.
Easy
to adjust
5. What are the practical difficulties in A.C potentiometers?
The practical difficulties in A.C potentiometers are:
i. More complicated
ii. Accuracy is seriously affected
iii. Difficulty is experienced in standardization.
6. Classify AC potentiometers.
AC potentiometers are classified as i. Polar
potentiometer
ii. Coordinate potentiometer.
7. How the phase angle is measured in polar type potentiometers?
The phase angle is measured in polar type potentiometers from the position of phase
shifter.
8. List any two AC potentiometers.
The two AC potentiometers are i. Drysdale Tinsley
potentiometer ii. Gall
127
EE6404 MEASUREMENTS&INSTRUMENTATION
SCE Dept.of EEE
Tinsley potentiometer.
9. State the advantages of AC potentiometers.
The advantages of ac potentiometers are
i. They can be used for measurement of both magnitude and phase angle
ii. They can be used for measurement of inductance of the coil.
iii. They are used in measurement of errors in current transformers.
10. State the applications of AC potentiometers.
The applications of AC potentiometers are i. Measurements of self
inductance. ii. Ammeter
calibration
iii. Voltmeter
calibration iv.
Wattmeter
calibration.
11. State the advantages of instrument transformers.
The advantages of instrument transformers are i. Used for extension
of range ii. Power loss is
minimum
iii. High voltage and currents can be measured.
12. State the disadvantage of instrument transformers.
The disadvantage of instrument transformers is that they cannot be used for DC measurements.
13. What are the constructional parts of current transformer?
The constructional parts of current transformer are i. Primary winding
ii. Secondary
winding iii.
Magnetic
core.
14. Name the errors caused in current transformer. The errors caused in current transformer are
i. Ratio error
ii. Phase angle error
15. Define ratio error
Ratio error is defined as the ratio of energy component current and secondary current.
16. How the phase angle error is created?
The phase angle is created mainly due to magnetizing component of excitation current.

128
EE6404 MEASUREMENTS&INSTRUMENTATION
SCE Dept.of EEE
17. State the use of potential transformer.
The use of potential transformer are i. They are used for measurement of high voltage
ii. They are used for energizing relays and protective circuits.
18. How the current transformer and potential transformer are connected in a
circuits? In a current transfrmer is connected in series and potential transformer is connected in
parallel
19. What is the range of medium resistance? The range of resistance is about 1 ohm to 100 kilo ohms.
20. Name the methods used for low resistance measurement.
The methods used for low resistance measurement are 1. Ammeter – voltmeter method
2. Potentiometer method
3. Kelvin double bridge method
4. Ohm meter method.
21. What are the types of DC potentiometers?
The types of DC potentiometers are i. Crompton’s
Potentiometer ii.
Duo-Range
Potentiometer iii.
Vernier Potentiometer
iv. Brook’s Deflectional
Potentiometer
22. What is a bridge circuit?
A bridge circuit consists of a network of four impedance arms forming a closed circuit. A source of current is applied to two
opposite junctions. The current detector is connected to other two
junctions.
23. What are the types of bridges? The types of bridges are:
i. DC bridge ii.
AC bridge
24. What are the types of DC bridges? The types of DC bridges are
i. Wheatstone bridge
ii. Kelvin Double bridge

129
EE6404 MEASUREMENTS&INSTRUMENTATION
SCE Dept.of EEE
25. What are the types of AC bridges?
The types of AC bridges are i. Capacitance comparison bridge
ii. Inductance comparison bridge iii.
Schering bridge
iv. Maxwell’s Inductance and capacitance bridge
v. Hay’s bridge
vi. Anderson bridge
vii. Wien bridge
26. Classify the cables according to their sheathing. According to their sheathing cables are classified as
i. Armoured cables
ii. Unarmoured cables.
27. State the advantages of price’s guard wire method. The advantage of price’s guard method is leakage current does not flow through the meter and therefore it gives accurate reading.
28. How the earth resistance is measured?
Earth resistance can be measured by using earth megger.
29. Which type of detector is used in ACbridges?
The detectors used in AC bridges are i. Vibration galvanometers
ii. Tunable amplifier
iii. Head phones
30. Name the sources of errors in AC bridge measurements.
The sources of errors in AC bridges are i. Errors due to stray
magnetic fields ii. Leakage
errors
iii. Eddy
current errors
iv. Residual
errors
v. Frequency and waveform errors.
31. State the advantages of wein bridge.
The advantage of wien bridge is the balance equation is independent of frequency and
therefore is more accurate.
32. State the disadvantage of wein bridge.
The disadvantage of wien bridge is a standard variable capacitor. Variable capacitor is
more costly.

130
EE6404 MEASUREMENTS&INSTRUMENTATION
SCE Dept.of EEE
33. State the disadvantages of Hay’s bridge.
The disadvantages of Hay’s bridge is the balance equation is dependent of frequency and
therefore any changes in frequency will affect the measurement.
34. State the use of Wein bridge.
Wien bridge is used for the measurement of unknown capacitance and frequency.
35. Define: Q-factor of the coil
Q-factor of the coil is defined as the ratio of power stored in the coil to the power dissipated in the coil.
36. Name the faults that occurs in cables.
Faults that occur in cables are
i. Break down of cable insulation
ii. Short circuit fault
iii. Open conductor fault.
37. Name the loop test methods used in location of fault.
Loop test methods used in location
of fault is i. Murray loop
test
ii. Varley
loop test.
UNIT-V STORAGE AND DISPLAY DEVICES
1. List the components of a magnetic tape recorder.
The components of a magnetic tape recorder are :
i. Recording head ii. Magnetic head
iii. Reproducing head
iv. Tape transport mechanism
v. Conditioning devices.
2. What are the advantages of magnetic tape recorders?
The advantages of magnetic tape recorders are : i. They have a wide frequency range from D.C. to
several MHz. ii. They have low distortion,
iii. They have a wide dynamic range which exceeds 50dB. This permits the linear
recording from full scale signal level to approximately 0.3% of full scale.
131
EE6404 MEASUREMENTS&INSTRUMENTATION
SCE Dept.of EEE
iv. The magnitude of the electrical input signal is stored in magnetic memory and
this signal can be reproduced whenever desired. The reproduced signal can
be analyzed by automatic data reduction methods.
3. Mention the different methods of magnetic tape recording.
The different methods of magnetic tape recording are :
i. Direct recording
ii. Frequency modulation (FM) recording
and
iii. Pulse duration modulation (PM)
recording
4. Mention is the purpose of erase head. The purpose of erase head is to erase the content of magnetic tae. It consists of a signal
of high frequency and level sweeps the magnetic tape thereby completely wiping out
the information contained there. This renders the magnetic tape to be used fresh for
another signal.
5. List the advantages of direct recording.
The advantages of direct recording are: i. This recording process has a wide frequency response ranging
from 50
Hz to about 2 MHz for a tape speed of 3.05 m/s. It
provides the greatest bahdwidtn obtainable from a given
recorder.
ii. It requires only simple, modulately priced electronic circuitry.
iii. It is used to record signals where information is
contained in the relation between frequency and amplitude,
such as spectrum analysis of noise.
iv. It can be used for recording voice and in multiplexing a
number of channels of information into one channel of tape
recording.
6. Mention the disadvantages of direct recording.
The disadvantages of direct recording are: i. Direct recording is used only when maximum bandwidth is
required and when variations in amplitude are acceptable.
ii. Direct recording can be used for instrumentation purposes
but it is mainly used for recording of speech and music.
7. What is drop out ?
In direct recording, some portions of the tape may not be perfectly recorded owing to dirt
or poor manufacture and this is called drop out.
8. Mention the two factors in frequency modulation recording.
The two factors in frequency modulation recording are: i. Percentage

132
EE6404 MEASUREMENTS&INSTRUMENTATION
SCE Dept.of EEE
deviation and ii.
Deviation ratio.
9. Define: percentage deviation Percentage deviation is defined as the carrier deviation to centre frequency.
i.e. Percentage deviation or modulation index, m
=(∆f/fc) x 100, where ∆f = carrier deviation
from centre frequency
fc = centre or carrier frequency
10. Define: Deviation ratio
Deviation ratio is defined as the ratio of carrier deviation from centre frequency to signal or modulating
frequency.
Deviation ratio, ♪ = (∆f/fm)
where, fm = data signal
11. Give few advantages of frequency modulation recording. The advantages of frequency modulation recording are :
i. It is useful when the D.C. component of the input signal is to be
preserved or when the amplitude variations of the direct recording
process cannot be tolerated.
ii. This system has wide frequency range can record from D.C.
voltages to several kHz.
iii. It is free from dropout effect.
iv. It is independent of amplitude variations and accurately
reproduces the waveform of the input signal.
v. It is used extensively for recording the voltages from the force,
pressure and acceleration transducers.
vi. It is extremely used for multiplexing in instrumentation systems.
12. List few disadvantages of frequency modulation recording. The disadvantages of frequency modulation recording are :
i. The circuitry of an FM recording system is more complicated than
that of a direct recording system. This complexity of circuitry is an
account of separate modulation systems.
ii. It has a limited high frequency of about
80 kHz. iii. It requires a high tape speed.
iv. It requires a high quality of tape transport and speed control and
therefore expensive than the direct recording system.
13. Enumerate the merits and demerits of pulse width modulation recording.
The merits of pulse width modulation recording are : It has the ability to simultaneously record information from a large number of
channels.
It has a high accuracy due to the fact that it can be self-calibrated.
133
EE6404 MEASUREMENTS&INSTRUMENTATION
SCE Dept.of EEE
It has a high 3/N ratio.
The demerits of pulse width modulation recording are :
It has the limited frequency response
It has a highly complex electronic circuitry and therefore, the reliability of such
systems are low.
It is used only for special applications such as flight recorders, where a large
number of slowly changing variables are involved.
14. What is the operation of a serial printer ?
The operating of serial printer is to produces a single character at a time, usually moving
from left to right across a page. It prints 200 characters per second.
15. Mention the purpose of line printers.
The line printers are used to print line by line instead of characters. It prints
4000 lines per minute.
16. Give the operation of page printer. The purpose page printer prints a line at time mode, but can be stopped and restarted
only on the page basis. The top Speed is 45,000 lines per minute.
17. List the classification of printer. Printers are classified into three brad categories. They are
i. Impact and non-impact
printers.
ii. Fully formed character and dot matrix
character printer
iii. Character at a time and a line at time.
19. What is impact and non-impact printers ? Impact printers form characters on a paper by striking the paper with a print head and squeezing an inked ribbeia between the print head and paper. Non-impact printers form characters without engaging the print mechanism with
the print surface i.e. by heating sensitised paper or by spraying ink from a jet.
20. Write short notes on printer character set.
Mini and micro computers use ASCII codes for the printers. They are specified using the
48 character set, the 64 character set, the 96 character set or the 128 character set. The
entire 128 character ASCII set contains 32 characters normally used for communication
and control.
21. What is daisy wheel printer? Daisy wheel printer is a fully formed character printer, designed for computer usage and
has characters mounted on the periphery of a spinning print head similar to a daisy
flow. They are capable of bidirectional printing.
22. Give short notes on dot-matrix printers. In dot-matrix printers, the characters are formed by printing a group of dots to form a

134
EE6404 MEASUREMENTS&INSTRUMENTATION
SCE Dept.of EEE
letter, number or other symbol. It can print any combination of dots with all
availble print position in the matrix.
23. List the important features of CRTs. The important features of CRTs are :
i. Size
ii. Phophor
iii. Operating voltages
iv. Deflection voltages
v. Viewing screen
24. What is meant by deflection sensitivity in cathode ray tube ?
The deflection sensitivity of the cathode ray tube is usually stated as the D.C. voltage
required for each cm of deflection of the spot on the screen,
25. List the requirements of a sweep generator.
The requirements of a sweep generator are : i. The sweep must be linear.
ii. The spot must move in one direction only, i.e. from left to right only,
else the signal will be traced backwards during the return sweep.
This means that the sweep voltage must drop suddenly after
reaching its maximum value. These requirements call for a sweep
voltage having a linear sawtooth waveform.
26. What is meant by recurrent sweep in cathode
ray tube ? When the sawtooth, being an A.C. voltage alternates rapidly, the display occurs
respectively, so that a lasting image is seen by the eye. This repeated operation is
known as recurrent sweep.
27. What is intensity modulation
in CRT? In some applications, an A.C. signal is applied to the control electrode of the CRT. This
causes the intensity of the beam to vary in step with signal alterations. As a result, the
trace is brightened during the positive half cycle and diminished or darkened during
negative half cycle. This process is called intensity modulation or z-axis modulation. It
produces bright segments or dots on the trace in response to positive peak or dim
segments or holes in response to negative peaks.
28. Mention the methods that are used for generating the two electron beams
within the CRT.
The methods that are used for generating the two electron beams within the
CRT are the double gun tube and split beam method.
29. Mention the two storage techniques used in
oscilloscope CRTs.
135
EE6404 MEASUREMENTS&INSTRUMENTATION
SCE Dept.of EEE
The two storage techniques used in oscilloscope CRTs are mesh storage and
phosphor storage.
30. CRO has become an universal tool in all kinds of electrical and electronic
investigation.
Why ? CRO has become an universal tool in all kinds of electrical and electronic investigations
because in CRO, the vertical input voltage is the voltage under investigation and it
moves the luminous spot up and down in accordance with the instantaneous value of the
voltage. When the input voltage repeats itself at a fast rate, the trace (display) on the
screen, appears stationary on the screen.
31. Name the components of
a CRO. The Components of CRO are:
i. cathode ray tube (CRT) along with electron gun ssembly
ii. deflection plate assembly
iii. fluorescent screen
iv. glass envelope and
v. base.
vi.
32. What is an electon gun ?
An electon gun is the source of focussed and accelerated electron beam is the electron
gun. The electron gun which emits electrons and forms them into a beam consists of a
heater, a cathode, a grid a pre-accelerating anode, a focussing anode and an accelerating
anode.
33. Name the basic circuitry
of CRO. The basic circuitry of CRO are named as :
i.Vertical (Y) deflection system
ii. Horizontal (X) deflection system
iii. Synchronization iv.
Blanking circuit
iv. Intensity (z-axis) modulation
v. Positioning controls
vi. Focus control
vii. Intensity control
vii. Calibration control
viii. Astigmatism.
34. Write notes on dual trace cathode ray
136
EE6404 MEASUREMENTS&INSTRUMENTATION
SCE Dept.of EEE
oscilloscopes. In a dual trace CRQ, there are two separate vertical input channels A and B and these use
separate attenuator and preamplifier stages. Hence the amplitude of each input as
viewed on the oscilloscope can be individually controlled, after preamplification, the
two channels meet at an electronic switch and this has the ability to pass one channel at
a time into the vertical amplifier via the delay line.
35. State the purpose of a lissajous pattern
in CRO. The lissajous pattern is used for determining the frequency. The particular pattern results
when sine waves are applied simultaneously to both pairs of the
deflection plates.
36. What is a LED ?
The LED is basically a semiconductor PN junction diode capable of emitting electromagnetic radiation under forward conductions.
37. List the different materials used in manufacturing LED’s
The different materials used in manufacturing LEDs are i. Gallium Arsenide (GaAs) - red
ii. Gallium Arsenide Phosphide (GaAsP) - red or yellow
iii. Gallium Phosphide (GaP) - red or green.
38. How are LCDs
created ? LCDs are created by sandwitching a thin (10 to 12um) layer of a liquid-crystal fluid between two glass plates. A transparent, electrically conductive film or backplane is put on the rear glass sheet. Transparent sections of conductive film in the shape of the deviced character are coated on the front glass plate. When a voltage is applied between a segment and the backplane, an electric field is created in the region under the segment. This electric field change the transmission of light through the region under the segment film.
39. List the characteristics
of LCD. The characteristics of LCD are :
i. They are light scattering.
ii. They can operate in a reflective or transmissive configuration.
iii. They do not actively generate light and depend for their operation on ambient
or back lighting.
40. Name the two commonly available types of LCDs.
The two commonly available types of LCDs are :
i. Dynamic scattering and ii. Field effect type
41.State the purpose of dot matrix displays.
137
EE6404 MEASUREMENTS&INSTRUMENTATION
SCE Dept.of EEE
Excellent alphanumeric characters can be displayed by using dot matrix LEDs with an LED at each dot location.
42. Write the two writing patterns of dot matrix displays.
The two wirting patterns of dot matrix displays are : i. Common anode or common cathode connection (uneconomical).
ii. X-Y array connection (economical and can be extended
vertically or horizontally using a minimum number of
wires).
UNIT-V
TRANSDUCERS
1. Define: Transducer
A transducer is defined as a device that receives energy from one system and transmits it to another, often is a different form.
2. Write the parameters of electrical transducer.
The parameters of electrical transducer are: i. Linearity
ii.Sensitivity
iii.Dynamic range
ivRepeatability
v.Physical size
3. List the advantages of electrical transducers.
The advantages of electrical transducers are: i. Electrical amplification and attenuation can be easily done.
ii. Mass-interia effects are minimized.
iii. Effects of friction are minimized.
iv. Using very small power level.
iv. Electrical output can be easily used, transmitted and processed for the
purpose of measurement.
v. The output can be indicated and recorded remotely at a distance from the
sensing medium.
4. Define: Viscosity
Viscosity is defined as the property which determine the magnitudes of the resistance of the fluid to a shearing force.
5. Give the types of potentiometer.
The types of potentiometer are: i. Translatory
ii. Rotational
iii. Helipot
138
EE6404 MEASUREMENTS&INSTRUMENTATION
SCE Dept.of EEE
6. Give the limitations of thermistor.
Limitations of thermistor are: i. Non-linearity in resistance Vs temperature characteristics. ii.
Unsuitable for wide temperature range.
iii. Very low excitation current to avoid self-heating.
iv. Need of shielded power lines, filters etc., due to high resistance.
7. In what principles,inductive transducer works?
i. Variation of self-inductance. ii. Variation of mutual-inductance.
8. Write a short notes on LVDT. LVDT(Linear Variable Differential Transformer) converts the mechanical
energy into differential electrical energy. It has single primary winding, and two
secondary windings wound on a hollow cylindrical former. An movable soft
iron core slides within the hollow former and therefore affects the magnetic coupling
between the primary and the two secondaries.
9. List the advantages of LVDT.
The advantages of LVDT are: i. High range of displacement
measurement.
ii. Friction and electrical isolation.
iii. Immunity from external effects.
iv. High input and high sensitivity.
v. Ruggedness
vi. Low hysteresis and low power
consumption.
10. List the limitations of LVDT.
The limitations of LVDT are: i. Large displacements are required for appreciable
differential output.
ii. They are sensitive to stray magnetic fields.
iii. Dynamic response is limited.
iv. Temperature also affects the transducer.
11. List the two physical parameters in strain gauge.
The two physical parameters in strain gauge are: i. The change in gauge resistance. ii. The change is length.
12. List out the features of piezo-electric accelerometer.
The features of piezo-electric accelerometer are: i. Instrument is quite small in size and has a
low weight. ii. The natural frequency is very
high.
iii. Useful for high input frequencies and the response is poor at low
frequencies.
139
EE6404 MEASUREMENTS&INSTRUMENTATION
SCE Dept.of EEE
iv. The crystal is a source with a high output impedance and in order to
avoid loading effect, a voltage monitoring source of a high input
impedance should be used.
13. Define: Inductive Transducer
Inductive transducer is defined as a device that converts physical motion into a change in inductance. It may be either of active or passive type.
14. Give the principle of capacitive transducers.
Capacitive transducer principle is a linear change in capacitance with changes in the
physical position of the moving element may be used to provide an electrical
indication of the elements position.
C=KA/d
Where K= dielectric constant.
A= total area of capacitor surfaces.
d = distance between two capacitive surfaces.
15. What is meant by digital transducers? Digital transducers are also called as encoders. They are normally in the form of linear or
rotary displacement transducers. Hence they require analog to digital converter to
realize the digital data.
16. Classify digital transducers.
Digital transducers are classified into, i. Tachometer transducers ii. Incremental transducers iii. Absolute
transducers