eeehee i heee
TRANSCRIPT

AD-AA92 743 ANALYTIC SCIENCES COR P READI NG MA FIG 17/7OMEGA SIGNAL COVERAGE PREDICTI ON DIAGRAMS FOR 10.2 KHZ. VOLUME --ETC(U)OCT a _3R R UPTA S F DONNELLY, P M CREA MER DTOSMO
UNCLASSIFIED TASC-TM 377 2-VOL-3 NL
EEEhEEI hLm hEEE
1 32 IIIj2
1.8
II,.
L111125 -11114 111 -.6
MICROCOPY RESOLUTION TEST CHART
NAbONAL BUREAU OF SIANDARDS 1963A

OMEGA §IGNAL PVRG
VOLUMElM. C.PMPOSITE DIAGRAMS.
(/9 /Radha R/Gupta* '- Stephen F./Donn.Ily
/Paul M./CreumnerSuzanne/Sayer/
THE ANALYTIC SCIENCES CORPORATIONOne Jacob Way
Reading, Massachusetts 01867/7#qj V&92Q)TA SC-7_'?
Octebupiw 89
IIFINAL, EPinT s
Document Is available to the U.S. public through the ELECTENatioral Technical Information Service, DEC 10 1980
Springfield, Virginia 22161 0Prepared for D
0 U.S. DEPARTMENT OF TRANSPORTATION'3 UNITED STATES COAST GUARD
;::j.Omega Navigation System Operations DetailWashington, D.C. 20593
J, '80 08 ()(2

NOTICE
This document is disseminated under thesponsorship of the Department of Transportation inthe interest of information exchange. The UnitedStates Government assumes no liability for its con-tents or use thereof. I

Technichl Report Diiewimattioa Palo
A. I l ie . ~..~ m fIa m se giii. go. er ti e
Cv-GA SIGNAL CCVERAGE PREDICTION DIAGP.AVSOcoe 985'OR 10.2 k~{z semn
I. Avnr% R.R. Gupta, S.F. Donnelly,?.M. Cream-er, and S. Sayer TR-3077-129. Poriom.ftg Ofegmeaten Ne. ame Aigitels 10. Wont Unit No.. (TftAIS)
-HE ANALYTIC SCI6ENCES CORPORA.T10N1.One Jacob Way G'm .
Reading, Massachusetts 0186713 vI.in *,
1. hea..isag 4.Acy Now* and AufegssFnlRpr
U.S. Department of Transportation Final197 e Ot. 1980U..Cast GuardSet 199-O.
Omega NavigatIcn System Operations D)etail .iW9 ~CWa s.- .g =c n , D .C . 205931
Individual Omega station and composite (Omega NavigationSystem) 10.2 kliz signal coverage prediction diagrams have beendeveloped for eight times. The diagrams show the global accessi-bilicy of "usable" 10.2 kliz signals at eight fixed diurnal/seasonaltimes for two usable signal access criteria. Criterion I requires:
s i 7n 0-noise ratio (SNR) 5' -20 dB (i-n a 100 Hz noise bandwidth) >,1(._o t>2O centicycles (cec7, where a~b is the modal interference-
indu dhase deviation in the signal phase relative to thereference signal phase. Criterion HI differs from Criterion Iin that the SNVR(5)-30 dB. Volume I presents the diagram develop-ment met-hodology-and contains individual station nighttime
*jmodal interference diagrams. Each modal interference d iagram* fidentifies regions throughout the world where as < 20 cec for
nighttime propagation conditions.fo
Volume 11 presents 64 individual Omega station diagramns(Mercator projection): eight selected coverage times freach
* of eight stations. Each diagram displays the SNR and ao contoursfor a designated signal access criterion and coverage time.
OMEGA Document is available to the U.S.Very Low Frequency Propagation public thr~iuqh the NationalOmega Signal Coverage Diagram TeclImical information ServiceIOmega Modal Interferen~ce Diagram Sprin3!Ield, Virginia 22161
01 C.AS s IFIVED I UNCLAS SIFIE
Pam. OCT F 1700.7 8-72) omoi,. m..dpg s~.I~

Z*.ASSIP PICA ST3 0 %1 AG8 4 ^WA 111#41~1
16. .A3STrACT (Continued)
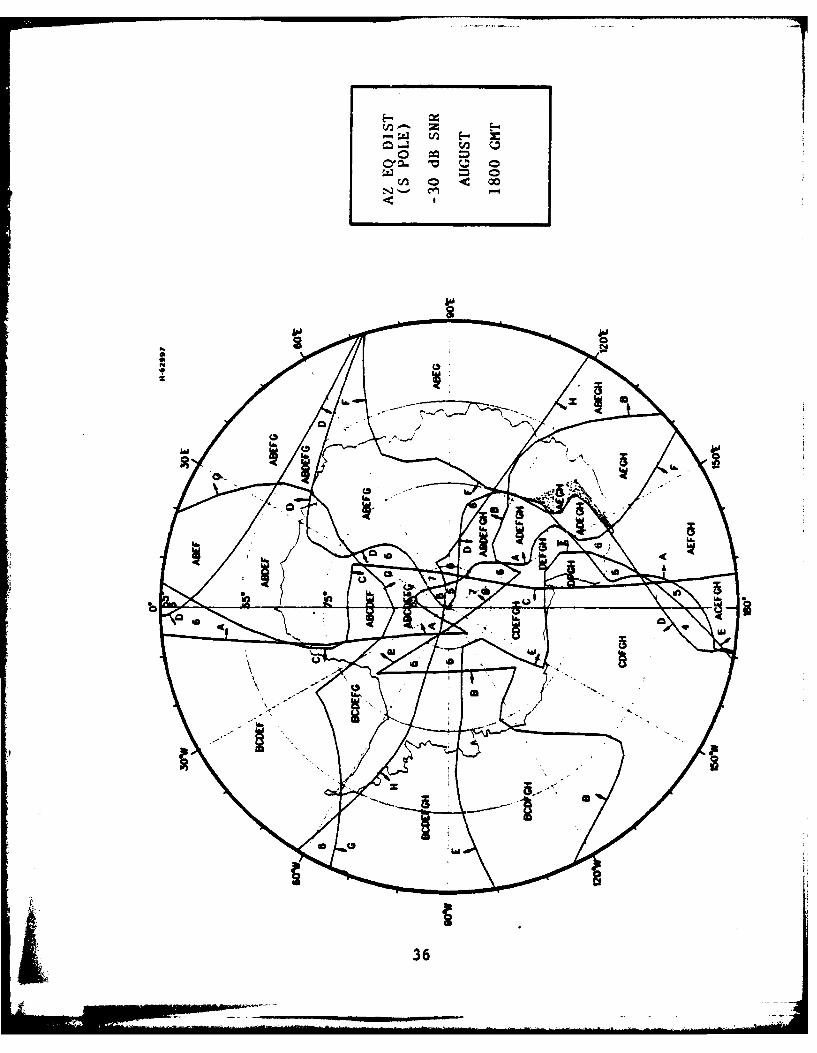
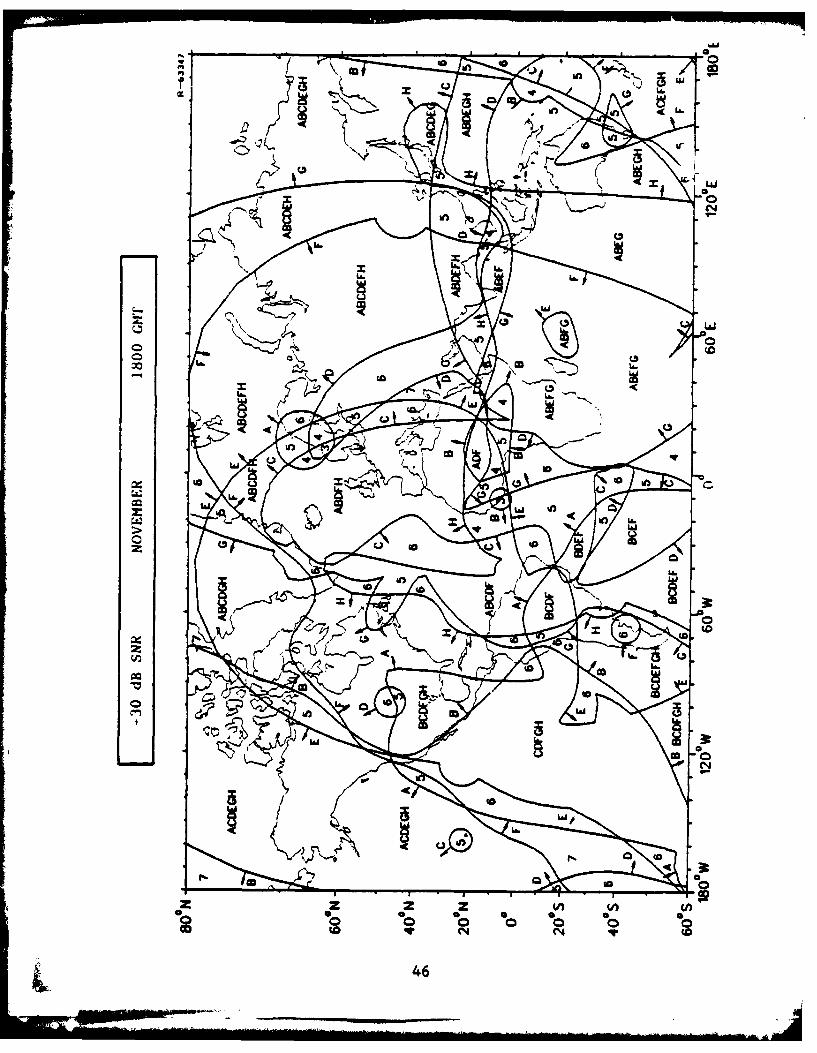
--- Volume '11 contains 48 composite coverage diagramswhich embody the eight coverage times, two signal access cri-teria, and three different projections (North and South polecentered Azimuthal Equal Distance, and Mercator). Each diagramdisplays the global accessibility of usable signals from thesystem for a designated signal access criterion and coveragetime. _
Volume IV tabulates the bearing angles of great circlesto each Omega station. These angles are computed at latitude/longitude grid points having a uniform spacing of four degrees.
Acces: ! Fo r
NTIS GRA&IDTIC TABUnannouncedJustifcation D
_____DTIC
Distribut ion/ E LECTEAvailability Codes_ DEC 10 1980
I 0
LTNCLAS S IF lED
PREFACE
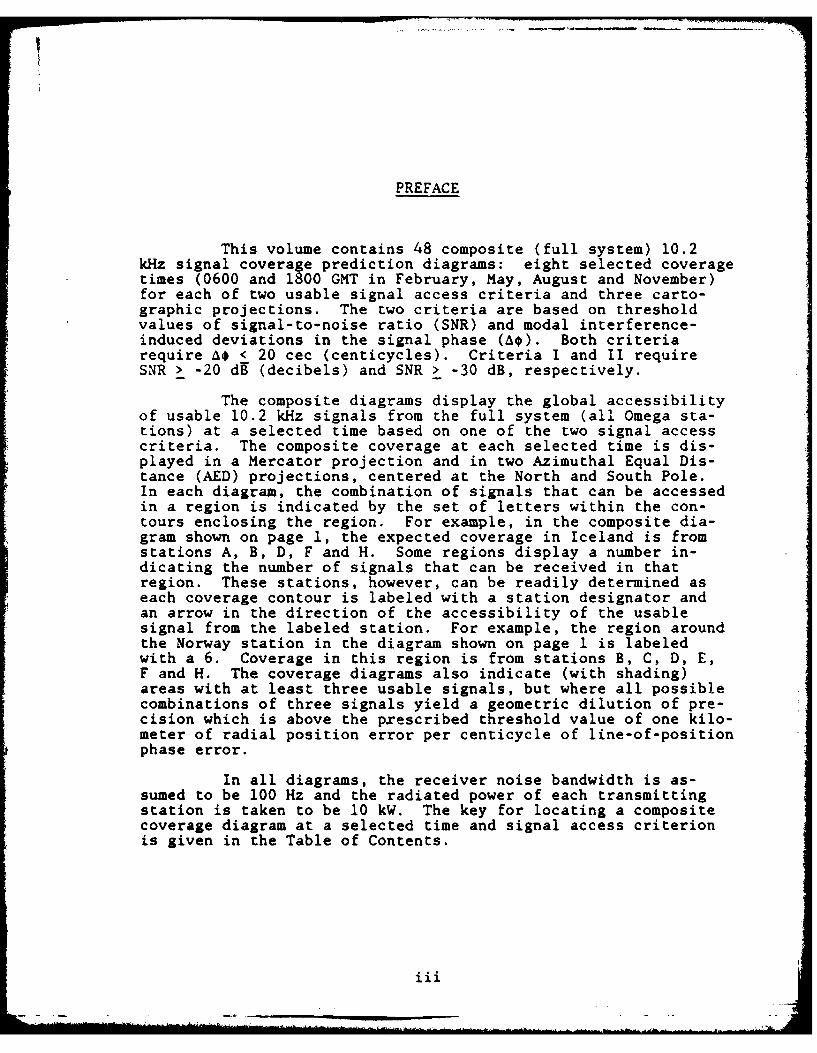
This volume contains 48 composite (full system) 10.2kHz signal coverage prediction diagrams: eight selected coveragetimes (0600 and 1800 GMT in February, May, August and November)for each of two usable signal access criteria and three carto-graphic projections. The two criteria are based on thresholdvalues of signal-to-noise ratio (SNR) and modal interference-induced deviations in the signal phase (Ao). Both criteriarequire ao < 20 cec (centicycles). Criteria I and II requireSNR > -20 dB (decibels) and SNR > -30 dB, respectively.
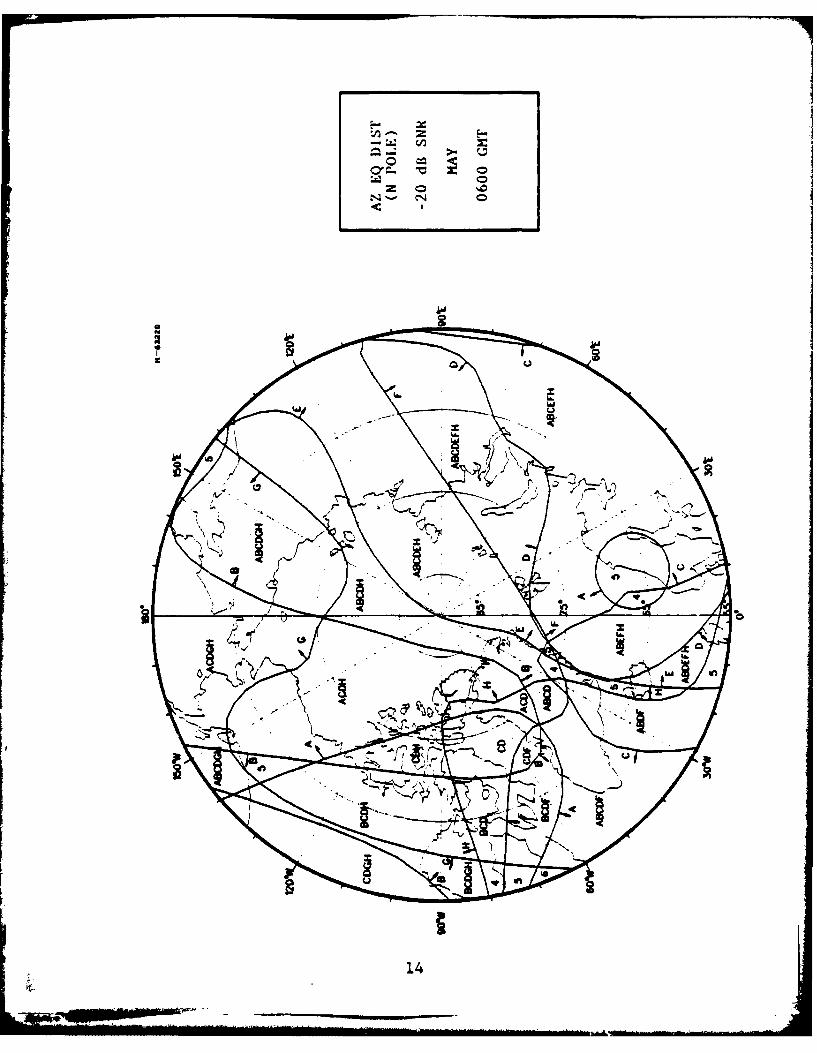
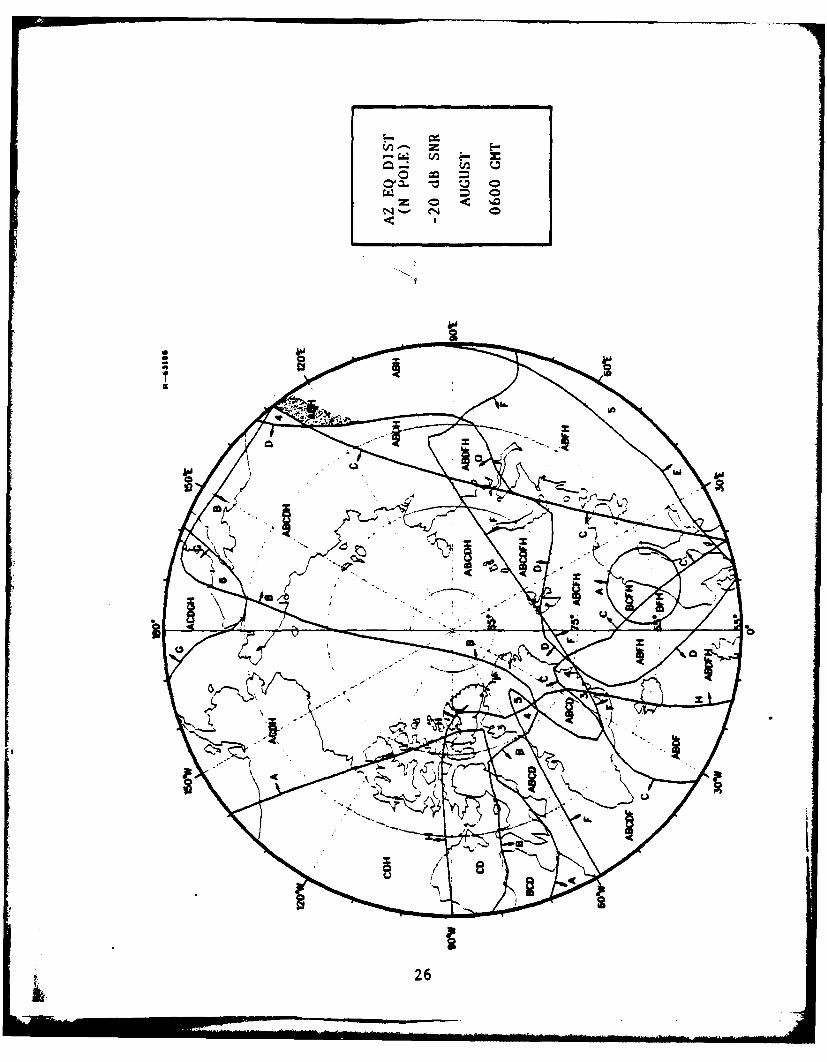
The composite diagrams display the global accessibilityof usable 10.2 kHz signals from the full system (all Omega sta-tions) at a selected time based on one of the two signal accesscriteria. The composite coverage at each selected time is dis-played in a Mercator projection and in two Azimuthal Equal Dis-tance (AED) projections, centered at the North and South Pole.In each diagram, the combination of signals that can be accessedin a region is indicated by the set of letters within the con-tours enclosing the region. For example, in the composite dia-gram shown on page 1, the expected coverage in Iceland is fromstations A, B, D, F and H. Some regions display a number in-dicating the number of signals that can be received in thatregion. These stations, however, can be readily determined aseach coverage contour is labeled with a station designator andan arrow in the direction of the accessibility of the usablesignal from the labeled station. For example, the region aroundthe Norway station in the diagram shown on page 1 is labeledwith a 6. Coverage in this region is from stations B, C, D, E,F and H. The coverage diagrams also indicate (with shading)areas with at least three usable signals, but where all possiblecombinations of three signals yield a geometric dilution of pre-cision which is above the prescribed threshold value of one kilo-meter of radial position error per centicycle of line-of-positionphase error.
In all diagrams, the receiver noise bandwidth is as-sumed to be 100 Hz and the radiated power of each transmittingstation is taken to be 10 kW. The key for locating a compositecoverage diagram at a selected time and signal access criterionis given in the Table of Contents.
iii

j ; , j i I
l lt!i 11! I1|Liti .Js z
1 ''
ai III 1 11 01 4 9 4 12 fI II .. . 1 l
i !I,, l "iij' ill# il. l - ., ; 0
06 ,S0
illit
• I a I s 0
SL iv 1
112; , j ' I i
i111 I11111tt
,o l iii, I. L I't. .
4' 0

TABLE OF CONTENTS
Page
Composite 10.2 kHz Signal Coverage Prediction Diagrams 1-48
Coverage Time SignalAccess
Month GMT Criterion Projection Page No.
February 0600 1 Mercator 1AED (N Pole) 2AED (S Pole) 3
II Mercator 4AED (N Pole) 5AED (S Pole) 6
1800 I Mercator 7AED (N Pole) 8AED (S Pole) 9
II Mercator 10AED (N Pole) 11AED (S Pole) 12
May 0600 1 Mercator 13AED (N Pole) 14AED (S Pole) 15
II Mercator 16AED (N Pole) 17AED (S Pole) 18
1800 I Mercator 19AED (N Pole) 20AED (S Pole) 21
II Mercator 22AED (N Pole) 23AED (S Pole) 24
August 0600 I Mercator 25AED (N Pole) 26AED (S Pole) 27
II Mercator 28AED (N Pole) 29AED (S Pole) 30
v

TABLE OF CONTENTS (Continued
Coverage Time SignalAccess
Month GMT Criterion Projection Pase No.
August 1800 1 Mercator 31(Cont.) AED (N Pole) 32
AED (S Pole) 33II Mercator 34
AED (N Pole) 35AED (S Pole) 36
November 0600 1 Mercator 37AED (N Pole) 38AED (S Pole) 39
II Mercator 40AED (N Pole) 41AED (S Pole) 42
1800 1 Mercator 43AED (N Pole) 44AED (S Pole) 45
II Mercator 46AED (N Pole) 47AED (S Pole) 48
vi

0-
1IA

<0 ~
0~. *~ ~ C~ 0
~ 0 L~ ~ON- CN ca.. 0
0
g
AV
I.
I,
7/
2

go 0w 0 Z
C14 W i. 0
IVI
3n

Laij
La
00
'LA.
04
* 0 0 00 0 0co 0% 0 0 0
4
- - - - -- -- - - -

~I2-' Z
~~L&
o.- j~~A0
Z o r~La.
Ma ~

LLJ~ i *a:
to44 ~
LUMS 0b
MINA%. ~,N'ul ~ '

-IF 0
-41 A..
0 0 0 -
z z z z*0 o
7

00 0
z a w
C~'I ~Ali
0,t
Uu
gI

cc 0
UJ 0 U
46C
win
In

LAS
afll
04
in
U20
coi
10 C10

Z >. ~--~ ~ ~
o~. *v ~ 0~ 0
2 0 WN-' ~
00
U
C
P
a
11

z ,p.E
10 10
ID V~~ 0
Lb, CN'-in
SI
£L
12

xa
66')
'I.,
og
LI,
co N (
o 0 0 0 0 0o0
13
00
IWO
14

CA 0Ni 0 '.
6L- LL.
in

100
40
I00
04
u-4
000
16

W V0H
z CD
CD
ca7

~A-~ Z-:~j ~
>- ~.,
C ~C-a- ~ z oC
~ 0N'- ~ 0
0
18

ca
26
0A
Z Z I Z U) U)3n
* S 0 S 0 5 0
191______________________________cc

CCz o 00
N' CN -
ImI00
__ m
qcIOCI
WI
20
"Ohm"

-~ca
Jos-
go too
21

Lij
U.
IAo
L00x
0 L&
"' 0 "x~ La.
q22

20 00
een
23

UA
24

Ni
zO
4c4
to 'oVj
z z zLi
e4 0
10 0 0 0 0N 0
25
va- 9
'77
26~

F-: u -ton
~ C 4
27

.0
hiLai
LCdd
C,,D
.IA
Z zU* 0 0 B
o 0 0 0 061U. L,1
28

W 0)
29

z I
2b
300

4K4
cj4c
on00
000 0 0 0 0cc4 NN It4
31.

I.. JIM,~
(.4
4: C
32

o go
o.~ *v In
33

UAU
C.,3
'n 34
ow vin

40 t<
44
35
ioo
aa
az
36

catc
Q0U
04
CD~
400
37L9

>0Z0 0
N~- CN z 0
lb
.;v. 7)
ow=
38

o CN
L6V1J
39

00 bl
01
A 40

W Z Z
N~ Z 0
41

c-% z W
cn~: Z 0
0 b
420

in LU
oo
0
zo 4c CA ~ )C
9443
I ______________________>_____

2 ~
-~ ~ La~ ~
o ~~ w o~ 0
2 0 0 ~N'- ~N 2 -
BV'IB
2
C
A _ _44

0 40
CzD
44
IIn- Lai
r'N1*j
5in
0I
0I
0i
2t
21
0I
zIo S 5 9 S S fa
o d 0Ia00.
co 46

-~ fJ, ~
0 ~o~- *v '~ 0~ 0
20 0 ~N- C~ 2
09
47

F-
CV)~ F
4n~
UL
48