effect and process evaluations of an early childhood...
TRANSCRIPT

EFFECT AND PROCESS EVALUATIONS OF AN
EARLY CHILDHOOD OBESITY PREVENTION
INTERVENTION
by
Véronique Thébaud
MSc Nutrition & Public Health, French SR Dietitian
A thesis submitted in fulfilment of the requirements for the degree of
Doctor of Philosophy
Institute of Health and Biomedical Innovation (IHBI)
School of Exercise and Nutrition Sciences
Faculty of Health
Queensland University of Technology
2015


i
Keywords
Child obesity, Prevention, Comprehensive evaluation framework, Effect, Process,
Programme Effectiveness, Generalisability, Applicabilty, Reach, Adoption,
Implementation, Evidence-based Medicine, Methodology, External and internal
validity, Randomised Controlled Trial (RCT), Research translation, Decision
making.

ii

iii
Abstract
The number of obesity prevention interventions targeting children and using
Randomised Controlled Trial (RCT) designs has rapidly grown since the early 2000s,
in response to increasing prevalence of overweight children worldwide. In spite of
these efforts, the evidence base for effective prevention programmes is often still
limited by insufficient reporting of the process of implementing these trials, and of
the extent to which specific interventions are transferable to other contexts. As in
other public health prevention domains, it is increasingly recognised that
comprehensive evaluation of prevention programmes, including both effect and
process dimensions, can assist in identifying interventions that can be effectively
transferred in real-world settings.
The objective of this PhD research was to develop and apply an evaluation
framework based on pre-existing effect and process data collected as part of the
NOURISH RCT, an obesity prevention research programme starting early in infancy.
The research, consisting of a secondary evaluation of the RCT, focuses on selected
outcomes of the trial relating to first-time mother feeding choices, and is based on (i)
an Intention-To-Treat analyses (i.e. effect evaluation), (ii) a detailed description of
the programme implementation (i.e. process evaluation), and (iii) a quantitative
analysis of the impact of the implementation process on outcomes of interest.
Results from this summative evaluation indicate that NOURISH was efficacious on
three variables out of eight of the maternal feeding choices considered for the
purpose of this thesis. The process evaluation shows that, while the intervention was
well delivered, attendance was partial. A selection bias at recruitment and at follow-
up also occurred. Compared to the target population, participants that remained
involved in the trial were on average older, more educated, more likely to be married,
less subject to financial difficulties, and exhibited healthier lifestyles (i.e. not
smoking) and existing positive feeding choices (i.e. breastfeeding). The quantitative
analysis of the impact of the implementation process on outcomes of interest showed
that the dose received may have influenced some of the feeding choices upon which
the intervention focused, in particular those where a positive intervention effect was

iv
identified. The analysis also shows that maternal characteristics may have had an
influence on most of these selected feeding choices.
The research identifies potential reasons for mother participation issues, that should
be considered in a new cycle of the NOURISH programme. In particular, results
point to the importance of revising the needs assessment, exploring alternative
formats for intervention delivery, and developing a detailed logic model of the
revised programme that could drive its implementation and serve as a basis for its
comprehensive evaluation, ultimately assisting in translating the programme into the
target population.

v
Table of Contents
Keywords ............................................................................................................................. i
Abstract ............................................................................................................................. iii
Table of Contents ............................................................................................................... v
Index of Figures .............................................................................................................. viii
Index of Tables .................................................................................................................. ix
Index of Appendices ......................................................................................................... xi
List of Abbreviations ....................................................................................................... xii
Glossary ........................................................................................................................... xiii
Statement of Original Authorship ................................................................................. xvi
Acknowledgements ........................................................................................................ xvii
Chapter 1 Introduction............................................................................................. 1
Chapter 2 Foundations of evaluation in health promotion and application in childhood obesity prevention .................................................................. 7
2.1 Introduction .............................................................................................................. 7
2.2 The foundation of evaluation in Health Promotion: the construction of a programme theory ................................................................................................... 8
2.2.1 General principles to develop health promotion programmes ....................................... 10
2.2.2 A distinction between “effect” and “process” theories.................................................. 15
2.3 Evaluation of health promotion programmes, based on programme theories .................................................................................................................... 23
2.3.1 Addressing the effectiveness of an intervention: RCT design, the gold standard .......... 24
2.3.2 Addressing the reproducibility of the intervention......................................................... 30 2.3.3 Choosing evaluation objectives and methods: a dilemma for programme evaluators in health promotion ........................................................................................................ 32
2.4 Evaluation of childhood obesity prevention: a review of programme theories .................................................................................................................... 37
2.4.1 The causal theory or mapping the determinants ............................................................. 37 2.4.2 Programme theories of child obesity prevention: towards identifying solutions ........... 51
2.5 The need for broadened evaluation framework of early childhood obesity prevention programmes ........................................................................................ 55
2.6 Application to the evaluation of the NOURISH RCT ......................................... 57
Chapter 3 Revisiting the evaluation framework of the NOURISH RCT ............. 59
3.1 Introduction ............................................................................................................ 59
3.2 Methods ................................................................................................................... 60

vi
3.3 Reconstructing the NOURISH programme theory ............................................. 64
3.3.1 Mapping the determinants of early childhood obesity, needs assessment and goal setting ...................................................................................................................... 64
3.3.2 Planning for action: definition of effect and process objectives and their measurement ................................................................................................................... 66
3.4 NOURISH Implementation and data. .................................................................. 82
3.4.1 Participant enrolment ...................................................................................................... 82 3.4.2 Randomisation ................................................................................................................ 85 3.4.3 Intervention delivery ....................................................................................................... 85 3.4.4 Follow-up ........................................................................................................................ 87 3.4.5 Data management ........................................................................................................... 88
3.5 Discussion, secondary evaluation framework and PhD research questions ...... 88
3.6 Conclusion ............................................................................................................... 96
Chapter 4 Effect evaluation ................................................................................... 97
4.1 Introduction ............................................................................................................ 97
4.2 Methods ................................................................................................................... 97 4.2.1 Summary of the data collection process ......................................................................... 97 4.2.2 Data selection .................................................................................................................. 98 4.2.3 Data management and analyses .................................................................................... 105
4.3 Results .................................................................................................................... 107 4.3.1 Participant characteristics at baseline ........................................................................... 107 4.3.2 Attrition comparison between control and intervention groups .................................... 110
4.3.3 Measuring the effects of NOURISH on selected maternal feeding choices, six months after intervention completion ..................................................................... 111
4.4 Discussion .............................................................................................................. 113
4.5 Conclusion ............................................................................................................. 117
Chapter 5 Process evaluation ............................................................................... 119
5.1 Introduction .......................................................................................................... 119
5.2 Methods ................................................................................................................. 120 5.2.1 Data collection and management .................................................................................. 121 5.2.2 Reach: Who were the participants involved in the NOURISH research programme? .................................................................................................................. 123
5.2.3 Adoption: How well was the NOURISH intervention adopted by participants? .......... 128
5.2.4 Implementation: compared to the plan, how well was the NOURISH Research Programme implemented? ............................................................................................ 130
5.3 Results .................................................................................................................... 135 5.3.1 Reach performance ....................................................................................................... 135 5.3.2 Adoption ....................................................................................................................... 156 5.3.3 Implementation ............................................................................................................. 162
5.4 Discussion .............................................................................................................. 171 5.4.1 Ability to implement each process component as planned ........................................... 173
5.4.2 Ability to similarly implement the research programme in two cities and at two different periods ............................................................................................................ 183
5.4.3 Ability to implement the trial with regards to specific recruitment, engagement and retention strategies ................................................................................................. 185

vii
5.5 Conclusion ............................................................................................................. 190
Chapter 6 Exploring process influences on maternal feeding choices .............. 193
6.1 Introduction .......................................................................................................... 193
6.2 Methods ................................................................................................................. 194
6.3 Results ................................................................................................................... 199 6.3.1 Process factors influencing reported use of “pressure to eat” ...................................... 199
6.3.2 Process factors influencing reported use of exposure to “healthy foods” .................... 200
6.3.3 Process factors influencing reported use of exposure to “unhealthy foods” ................ 200
6.3.4 Process factors influencing reported “maternal modelling opportunities” ................... 203
6.3.5 Process factors influencing reported use of child sitting down when having a meal (logistic regression) ..................................................................................................... 203
6.3.6 Process factors influencing child watching television at meal time ............................. 204
6.3.7 Results summary of exploratory analyses .................................................................... 204
6.4 Discussion and conclusion ................................................................................... 207
Chapter 7 Conclusion and recommendations ..................................................... 217
7.1 Introduction .......................................................................................................... 217
7.2 Results summary .................................................................................................. 218
7.3 Implications for programme implementation ................................................... 224
7.4 Strengths and limitations of this research .......................................................... 227
7.5 Recommendations ................................................................................................ 232
7.6 Final conclusion .................................................................................................... 236
Bibliography ................................................................................................................... 239
Appendices ..................................................................................................................... 263
viii
Index of Figures
Figure 1: The health promotion programme development cycle .......................................................... 14 Figure 2: Components addressed by the Process theory ...................................................................... 22 Figure 3: The different categories of evaluation in the programme development cycle ....................... 35 Figure 4: “Key factors that influence the reciprocal relationships between parent feeding practices
and infant feeding behaviour.” Figure title and figure reproduced from Daniels et al.,2009, BMC Public Health, 9(1), 387, p. 3. .................................................................................... 65
Figure 5: The NOURISH effect theory modified from Issel, L. M. (2009). Health program planning and evaluation: A practical, systematic approach for community health (2nd ed.): Jones & Bartlett Learning, p. 181. Permission reference: 197910110-0912. .................................... 68
Figure 6: Transcription of assumptions made by NOURISH chief investigators for reach performance objectives .............................................................................................................................. 78
Figure 7: NOURISH CONSORT Flow Chart and Process Evaluation (own production, with assistance from Wilson J. & Meedeniya J.) ......................................................................... 83
Figure 8: Thesis conceptual evaluation framework .............................................................................. 93 Figure 9: Data collection timeline of the NOURISH research programme .......................................... 98 Figure 10: Recruit-1 data collection return (%), per cohort and city, among approached mothers
(n=2870) ............................................................................................................................ 138
Figure 11: Recruit-1 reach performance scores (%) per cohort and city, among approached mothers (n=2870) ............................................................................................................................ 138
Figure 12: Successful recontact rates (%) at Recruit-2 per cohort and city among «Recruit-1 consenters to a later contact» (n=2169) ............................................................................ 141
Figure 13: Recruit-2 reach performance scores (%) per cohort and city among recontacted eligible mothers (n=1583) .............................................................................................................. 142
Figure 14: Characteristics at Recruit-2 of mothers that could not be contacted, non-consenters and consenters to full enrolment ............................................................................................... 144
Figure 15: Reasons for declining participation at Recruit-2: comparison between cities (n=809 provided at least one reason) ............................................................................................. 145
Figure 16: Reasons for declining participation at Recruit-2: comparison between cohorts (n=809 provided at least one reason) ............................................................................................. 145
Figure 17: Reasons for declining participation at Recruit-2: comparison between university and non-university educated mothers (n=804* provided at least one reason) ................................ 146
Figure 18: Module-1 reach performance scores (%) per cohort and city (n=352) ............................ 147 Figure 19: Reasons for no Module-1 attendance, provided by 39 mothers ........................................ 148 Figure 20: Module-2 reach performance scores (%) per cohort and city (n=352) ............................ 149 Figure 21: Reasons for no Module-2 attendance, provided by 61 mothers ........................................ 150 Figure 22 a-e: Comparisons of the NOURISH population characteristics at each stage of the trial
with reference populations ................................................................................................. 153 Figure 23: Attendance rates (%) across sessions for modules 1 and 2 (aggregated across cohorts and
cities) .................................................................................................................................. 157
Figure 24: Reasons given verbally to facilitators when missing group information sessions ............ 160 Figure 25: Difficulties to attend, confidentially reported in the parent feedback questionnaire (Q8) 161
Figure 26: What 161 mothers disliked most about NOURISH (Q11) ................................................. 162 Figure 27: Intervention delivery difficulties or challenges, reported by facilitators for 35 information
groups ................................................................................................................................ 169

ix
Index of Tables
Table 1: Sources of information used for the reconstruction of the NOURISH programme and its implementation ....................................................................................................................... 63
Table 2: Selected covariates to describe enrolled participants............................................................ 99 Table 3: Selected data to evaluate effects of key messages of the NOURISH intervention on maternal
feeding choices for a child of two years ............................................................................... 103 Table 4: Baseline characteristics of 698 first-time mothers enrolled in the NOURISH trial ............. 108 Table 5: Baseline characteristics of 698 babies enrolled in the NOURISH trial ............................... 109 Table 6: Baseline characteristics of “completers” versus “non-completers” of Assessment T3
Questionnaire (n=698)......................................................................................................... 111 Table 7: Comparison between control and intervention groups on selected maternal outcomes when
the child was 24 months old ................................................................................................. 112 Table 8: Sources of data to inform the process evaluation: key components and sub-components ... 122
Table 9: Definitions of reach performance scores at the end of each stagea of the NOURISH research programme ........................................................................................................................... 125
Table 10: Reach performance scores at Recruit-1, across cohorts .................................................... 137 Table 11: Reach performance scores at Recruit-2, across cohorts .................................................... 141 Table 12: Reach process of the NOURISH research programme compared with two Australian RCTs
with similar objectives.......................................................................................................... 151
Table 13: Dose received by participants per module, city and cohort ............................................... 156 Table 14: Participant satisfaction of group information across modules .......................................... 157 Table 15: Participant perception of usefulness of group information across modules ...................... 158 Table 16: Participant perception of usefulness of group information with respect to knowledge
development across modules ................................................................................................ 159 Table 17: Participant perception of usefulness of group information with respect to behavioural
change across modules ........................................................................................................ 159 Table 18: Reach performance at intervention delivery across cohorts and cities ............................. 163 Table 19: Dose delivered performance across modules, cohorts and cities ...................................... 165 Table 20: Dose received performance across modules, cohorts and cities ........................................ 165 Table 21: Consistency and subcomponent performance scores per group (n=293 rated sessions) .. 166
Table 22: Consistency scores across modules, cohorts and cities (n=293 rated sessions) ............... 166 Table 23: Integrity and subcomponent performance scores (n=293 rated sessions) ......................... 167 Table 24: Integrity performance scores across modules, cohorts and cities (n=293 rated sessions) 168
Table 25: Fidelity performance scores across modules, cohorts and cities (n=293 rated sessions) . 168
Table 26: Implementation composite scores (%) across modules, cohorts and cities ....................... 170 Table 27: Description of independent variables entered in the eight regression models................... 197 Table 28: Directions of associations between process predictors and maternal feeding choices that
indicate positive feeding choices .......................................................................................... 199 Table 29: Process factors influencing reported use of pressurea as a feeding choice in the intervention
group (n=202) ...................................................................................................................... 200
Table 30: Process factors influencing exposure to a diversity of non-core foods and covert control of “unhealthy foods” in the intervention group ....................................................................... 202
Table 31: Process factors influencing “maternal modelling opportunities”a in the intervention group (n=203) ................................................................................................................................ 203
Table 32: Process factors influencing child watching TV at meal timea in the intervention group (n=204) (logistic regression) ............................................................................................... 205
Table 33: Summary of significant results of analytical modelling within the intervention group ...... 206 Table 34: Data file management to address reach process component ............................................. 284 Table 35: Data file management to address adoption process component ........................................ 286 Table 36: Q11 open-ended question coding ....................................................................................... 287

x
Table 37: Data file management to address Implementation process component .............................. 289 Table 38: Coding of facilitator and co-facilitator comments on difficulties and challenges .............. 291 Table 39: Data selection to explore reach at Recruit-1, first stage of the enrolment phase of the
NOURISH research programme ........................................................................................... 305 Table 40: Data selection to explore reach at Recruit-2, second stage of the enrolment phase of the
NOURISH research programme ........................................................................................... 306 Table 41: Data selection to explore reach at each stage of the NOURISH intervention delivery ...... 307
Table 42: Data selection to explore participant adoption of the NOURISH intervention .................. 308 Table 43: Data selection to explore implementation of the NOURISH intervention .......................... 309 Table 44: Maternal social factors across each stage of the NOURISH research programme ........... 311
Table 45: Breastfeeding and solids introduction variables across each stage of the NOURISH research programme ............................................................................................................. 312
Table 46: Other maternal factors across each stage of the NOURISH research programme ............ 313
Table 47: Child factors across each stage of the NOURISH research programme ............................ 314 Table 48: Participant Satisfaction score per module, city and cohort ................................................ 315 Table 49: Participant Usefulness perception score per module, city and cohort ............................... 315 Table 50: Factors influencing the exposure to a diversity of vegetables and fruit (n=204) ............... 316 Table 51: Results of logistic regression of child sitting when having a meala (n=204) and variables
associated with the process ................................................................................................... 317

xi
Index of Appendices
Appendix 1: Recruit-1 form for consenters to a later contact ............................................................ 264 Appendix 2: Recruit-1 form for non-consenters to a later contact ..................................................... 266 Appendix 3: Recruit-2 non-consent questionnaire or non-consent to full enrolment ......................... 268 Appendix 4: Extracts of Assessment T1 questionnaire = baseline data collection for full enrolment of
consenters at Recruit-2 ................................................................................................... 269 Appendix 5: Extracts of T3 Assessment questionnaire ....................................................................... 273 Appendix 6: Attendance log ............................................................................................................... 276
Appendix 7: Group session rating for Module-1 or session monitoring book ................................... 277 Appendix 8: Parent feedback survey .................................................................................................. 280
Appendix 9: Planned message content to cover at specific session ................................................... 283 Appendix 10: Management of process data files ................................................................................ 284 Appendix 11: Participant open-ended responses to Question 11 of the Parent Feedback Questionnaire............................................................................................................................................................ 292 Appendix 12: Data selection for analyses of each process component .............................................. 305 Appendix 13: Detailed results of characteristics of mothers and babies across each stage of the
NOURISH research programme .................................................................................... 310 Appendix 14: Adoption analyses ........................................................................................................ 315
Appendix 15: Results of non-significant regression models ............................................................... 316

xii
List of Abbreviations
BMI: Body Mass Index
ITT: Intention-To-Treat
NHMRC: National Health & Medical Research Council
RCT: Randomised Controlled Trial
SEP: Socio Economic Position
SES: Socio Economic Status
TAFE: Technical and Further Education. Australian institution that provides
vocational education

xiii
Glossary
Dose (in the NOURISH RCT): number of group information sessions either
delivered (dose delivered) or received (dose received).
Effect: intervention impact or intervention outcome. In an RCT, both measure the
difference of outcomes between the control and the intervention groups. However, a
distinction is made with respect to the period of time over which the outcome is
measured.
Efficacy: maximum effect under ideal conditions of an intervention (Issel, 2009).
Evaluation:
– Formative: evaluation that is conducted at programme development. It includes
pilot studies as well as information collected alongside the development of the
programme. This evaluation precedes the implementation of a final version of the
programme.
– Summative: evaluation that addresses both (i.e. the sum of) the implementation
process of a programme and its effectiveness. This evaluation follows the
implementation of a programme.
– Comprehensive: summative evaluation that addresses all the necessary process
components to reproduce the programme such as reach, adoption,
implementation, and maintenance that includes cost analyses.
Feeding choices: maternal choices with respect to (i) food exposure, (ii) eating
modelling opportunities, and (iii) social interactions around feeding that include the
commonly used feeding practices.
Infant : 0–24 month old child as defined by the National Library of Medicine.
Intervention impact: intermediate or short-term measure of the effect of the
intervention. A focus of this PhD is the impact of the NOURISH research
programme on selected maternal outcome variables.
Intervention outcome: final or long-term measure of the effect of an intervention.

xiv
Intervention : set of activities, within a programme, that aims to directly and
positively modify one health determinant. E.g. NOURISH intervention consists of
the delivery of group information sessions to the intervention group.
Multi-component programme: programme with multiple interventions.
Conversely, the NOURISH research programme is a single-component programme
as only one type of intervention has been developed.
Objective: activity that needs to be achieved in order to complete a goal.
Outcome: measure of interest. In this PhD, there is a focus on maternal feeding
choices (i.e. maternal outcome) measured either in the intervention or in the control
group. Differences in maternal outcomes between groups correspond to an
intervention impact of the NOURISH research programme (i.e. short-term effect).
Performance index: measure of achievement of an activity (X) as compared to its
related performance objective = performance score of activity X / performance
objective for activity X.
Performance objective: activity(ies) that need(s) to be performed in order to
achieve an objective.
Performance score: measure of achievement of an activity.
Programme: set of all activities associated with the design and implementation of
one or several health interventions. E.g. NOURISH research programme.
Programme Goal: final achievement of a programme.
Theory: “set of statements or hypotheses about what will happen and, therefore,
contains statements about the relationship among the variables” (Issel, 2009, p.
177). Thus, is not only used to describe behaviour (i.e. explanatory theory) but also
to describe the development of programmes or interventions (i.e. theory of actions)
(Glanz et al., 2008). In this thesis, the programme theory details the programme plan
and provides expected causal relationships between programme input, output and
outcomes. It is also called “logic model”.
Type I error : conclusion of a statistical difference when there is not a statistical
difference. This error is due to chance.

xv
Type II error : conclusion of the absence of statistical difference when there is a
statistical difference that could not be observed because of small sample sizes.
Type III error : misinterpretation that the reason for the effectiveness or
ineffectiveness of an intervention is related to its implementation where it has not
been implemented.
Validity : External: addresses the relevance of a research question based on its
applicability and generalisability. Internal: addresses the certainty of study
conclusions based on the extent to which they are free from bias.

xvi

xvii
Statement of Original Authorship
This PhD research was carried out at the Institute of Health and Biomedical
Innovation (IHBI), at the Faculty of Health, Queensland University of Technology
(QUT) between 2010 and 2014, with the financial support of an Australian
Postgraduate Award (APA) and of a Grant in Aid scholarship.
The research presented in this thesis utilises data and background information which
were produced as part of the NOURISH programme over the period 2004 to 2011.
The chief investigators were Professors L. Daniels, J. Nicholson, D. Battistutta, A.
Farrell, G. Cleghorn, G. Davidson and Associate Professors A. Magarey and J.
Bayer. The NOURISH RCT was funded between 2008-2010 by the Australian
National Health and Medical Research Council (NH&MRC). Additional funding for
the programme was provided by: the Children’s Research Foundation, HJ Heinz
postdoctoral fellowship (Dr Kimberley Mallan), Meat & Livestock Australia (MLA),
Department of Health South Australia, Food Standards Australia New Zealand
(FSANZ), Queensland University of Technology and a NHMRC Career
Development Award (Professor Jan Nicholson).
Development and implementation of the NOURISH programme, including pilot
work, funding applications, recruitment, intervention development and delivery,
outcome assessment tools (questionnaires), data collection and entry were
undertaken by the NOURISH investigators and/or study staff led by Professor L.
Daniels. Associate Professor Anthea Magarey led the implementation of the RCT in
Adelaide. Professor Jan Nicholson developed the process evaluation data collection
framework and tools. At the beginning of the candidature, intervention delivery, data
collection and data entry were still underway. The candidate made a contribution to
double entry of Time-2 and Time-3 assessments data and took the role of external
evaluator to develop the analytical framework for and undertake analysis of the
process evaluation data. As such, this thesis represents a secondary analysis of the
NOURISH RCT.
The work contained in this thesis has not been previously submitted to meet
requirements for an award at this or any other higher education institution. To the

xviii
best of my knowledge and belief, the thesis contains no material previously
published or written by another person except where due reference is made.
Date: 31th January 2015
QUT Verified Signature

xix
Acknowledgements
Although it is said that a PhD is a lonely intellectual journey, I would like to thank a
number of people without whom this research would not have been completed
successfully.
I would like to thank my supervisory team for their support at various stages of this
PhD: Professor Lynne Daniels, Principal Investigator of the NOURISH programme,
for accepting the role of the main supervisor of this research and for providing me
access to the NOURISH dataset, as well as for giving me an understanding of the
programme that has been essential in the development of the thesis – this has been a
life-changing experience; Professor Anthea Magarey, for her positive feedback on an
early version of my confirmation document; Professor Diana Battistutta, who despite
health problems, provided prompt and constructive feedback on my confirmation
document which led me to strengthen my conceptual evaluation framework;
Professor Jan Nicholson, for coordinating supervisory feedback on my confirmation
document; Doctor Kimberley Mallan, for agreeing to replace Diana in October 2011
and for providing me with prompt and constructive feedback since; and Professor
Mary Lou Fleming, for agreeing to replace Jan in July 2012 and for providing me
with a different perspective on my research and constructive feedback.
I am grateful to QUT for its support in obtaining the scholarships, as well as
providing me access to IHBI facilities, and administrative and research assistance.
Special thanks to the former and current directors of Research Training at the Faculty
of Health, Professor Michele Clark and Professor Neil King, for believing in my
ability to successfully take up this challenge, and for providing me with constant
support throughout this difficult journey. Many thanks to Mayuko Bock, Jessica
Harriden, Emma Kirkland, Nikki Kilkeary from Research Services for their
professionalism and kindness. Thanks to Doctor Dimitrios Vagenas and Doctor Julio
Hernandez Sanchez for their statistical advice at meetings of the Research Method
Group (RMG), which provided me with confidence in the robustness of my statistical
analyses.

xx
I am grateful to members of the NOURISH study staff for their assistance in
accessing the information and data on which this research is based, including Jacinda
Wilson, Jo Meedeniya, Clare Glover in Brisbane, and Chelsea Mauch, and Rebecca
Perry in Adelaide. I particularly wish to thank Jacinda for guiding me through the
database files and Jo for helping me gain in-depth understanding of the process of the
intervention delivery.
I am grateful to professional editor Wendy Smith who provided copyediting and
proofreading services, according to the guidelines laid out in the university-endorsed
guidelines and the Australian Standards for editing research thesis.
A special mention must also go to those who have been informally involved in this
journey but have played a key role by helping me on this journey. I am deeply
grateful to my husband Olivier Thébaud and my mother-in-law Annie Thébaud-
Mony, both senior and internationally recognised researchers in their respective
fields, for listening to me, reading my drafts, providing me with advice and being
models of perseverance and research integrity. They have both given me the strength
to carry on my research, through their continuous encouragement and support. I also
wish to thank Doctor Seema Mihrshahi who supported me when I was losing
confidence in the importance of my research. I am also grateful to my numerous PhD
mates for their support over the past years, especially to Doctor Wei Hong Liu and Jo
Meedeniya who showed empathy and constant support during this journey and have
become life-long friends.
Finally, I would also like to thank my siblings, in-laws and friends, in France and
Australia, for their understanding regarding me temporarily neglecting them. Your
tolerance allowed me to take up this challenge. I look forward to celebrating this
important achievement in my life with all of you.
I wish to specifically dedicate this work to my mother Isabelle Ménard, who taught
me perseverance and values that I applied throughout this journey. I also dedicate
this work to my father Jacques Pouliquen who taught me the importance of
maintaining a balanced life style between work, sleep, eating, and entertainment, to
keep going.
Above all, I would like to thank my three children, Maël, Marie and Anne, for all the
sacrifices you have made over the past three years. In spite of that, you have shown

xxi
constant support, encouragement, patience and love. This journey has also been a life
experience for you. The last word is for you, Olivier, without whom this PhD would
not have even started nor finished. Thank you for taking this dual position of mentor
and husband with endless love and encouragement.

xxii

1
Chapter 1 Introduction
Over the last four decades, the prevalence of overweight and obesity in adults and
children has increased worldwide, heralding what has been described as an “obesity
epidemic” (Swinburn et al., 2011; Wang & Lobstein, 2006; WHO, 1997). The World
Health Organization (WHO) (2012) has recently estimated that, globally, more than
40 million under-five-year-old children (hereafter called “under-five” children) are
already affected by overweight or obesity (WHO, 2012). The 2007 Australian
National Children’s Nutrition and Physical Activity Survey estimated that 15.7% of
2–3 year old children were overweight or obese (Cameron et al., 2012), and overall,
22% and 24% of 2–16 year old boys and girls respectively were overweight or obese
(Department of Health and Ageing, 2008)1. This ranks the prevalence in Australia of
overweight or obesity as comparable to the average prevalence for boys (22.9%) and
above average prevalence for girls (21.4%) in OECD2 countries, but behind that of
countries such as the United States (where data indicates there are more than one in
three obese 5- 17 year old children) (Sassi & Devaux, 2012).
Overweight and obesity are accumulation of excess body fat to an extent that health
may be increasingly adversely affected, where obesity is a severe condition of
overweight, hence a condition with increased risk of co-morbidities (WHO, 1997). If
not otherwise specified, overweight terminology used in this PhD will include
obesity. In practice, cut-offs of Body Mass Index (BMI, defined as the ratio of
individual weight (in kg) to squared individual height (in m) of a person) allow
classification of individuals according to their weight status.
In children, short term health consequences of high BMI are: greater risk of
remaining overweight in childhood3, developing illness in childhood, orthopaedic
1 Department of Health and Ageing (2008) provides figures for boys and girls separately. Cameron et
al’s (2012) secondary analysis of the survey also provides overall prevalence per age group. The
prevalence increased for older children. 2 Organisation for Economic Co-Operation and Development.
3 For instance Dattilo et al. (2012) reported that compared to their normal weight counterparts,
overweight preschool children have a fivefold increased risk of remaining overweight at age 12.

2
abnormalities4 and increased risk factors for cardiovascular diseases, endocrine and
pulmonary diseases5 (Lobstein, Baur, & Uauy, 2004). In addition, high BMI may
also have psychosocial consequences resulting from impacts on physical appearance
of children (Bell et al., 2011; Wang, 2008; Wijga et al., 2010)6. In the long term,
overweight children are at least twice as likely to become overweight adults (Singh,
Mulder, Twisk, Van Mechelen, & Chinapaw, 2008). Longer periods of excess weight
in childhood increase the risk of tracking in adulthood (Dattilo et al., 2012) as well as
the risk of chronic diseases in adulthood (Gill et al., 2010; Reilly & Kelly, 2011).
Nevertheless, the extent to which childhood obesity impacts on adult morbidity and
mortality rates, independently of adult weight, is unclear (Doak, Visscher, Renders,
& Seidell, 2006; Park, Falconer, Viner, & Kinra, 2012).
Altogether obesity generates high economic, societal and environmental costs which
have been estimated in monetary units7, quality-adjusted life-years lost, years of life
lost, environmental costs and lost education completion opportunity (Glickman,
Parker, Sim, Cook, & Miller, 2012; Schwimmer et al., 2003).
The direct cause of obesity is a chronic positive energy imbalance. While genetics
and biological factors play a role in maintaining an energy balance, behavioural and
environmental determinants related to diet, physical activity and sleep, are also
involved (Butland & Britain, 2007; Dattilo et al., 2012; Lobstein et al., 2004; Spruijt-
Metz, 2011; Story, Kaphingst, Robinson-O’Brien, & Glanz, 2008). Because it is
generally acknowledged that changing established eating and exercise behaviours is
difficult, primary prevention of obesity as opposed to its management is the preferred
public health strategy (Lobstein et al., 2004). In addition, as it is also acknowledged
that behaviours start to establish early in life, it has been increasingly acknowledged
4 Bell et al. (2011) showed in a randomly selected case–control study that compared to their
matched normal-weight peers, nine-year-old obese Australian children were four times more likely
to report musculoskeletal issues. 5 Wijga et al. (2010) showed that eight-year-old Dutch obese children were five times more likely to
report bronchitis. 6 For instance Bell et al. (2011) reported that obese children were eight times more likely to be
bullied than their normal-weight peers. Schwimmer et al. (2003) found that the Quality of Life score,
which encompasses physical, emotional, social and school functioning, for 5–18 year old American
obese children was 5.5 times lower than their healthy-weight peers. 7 For instance, the 2005 health care costs related to adult obesity were reported to be 21 billion
Australian dollars in a rapid assessment of the obesity issue in Australia (Gill et al., 2010).

3
that a life-course approach to obesity prevention should be taken, beginning during
the infancy years or even during pregnancy (Butland & Britain, 2007; Dattilo et al.,
2012; Hector et al., 2012; Savage, Fisher, & Birch, 2007; Waters, Swinburn, Seidell,
& Uauy, 2011).
Since the early 2000s, the number of obesity prevention interventions targeting
children has grown rapidly. Cochrane systematic reviews between 2005 (Summerbell
et al., 2005) and 2011 (Waters et al., 2011), reveal that 36 new controlled trials had
been implemented and 20 were under implementation. Since 1990, Waters et al.
(2011) reported that 75 controlled trials had been implemented. In parallel to the
growing number of obesity prevention interventions, the number of systematic
reviews had also increased substantially, assessing the evidence base available to
guide implementation of interventions in the wider population. In their review of
systematic reviews on child and adolescent obesity prevention, Wolfenden et al.
(2010) found that 26 systematic reviews had been published between 1997 and 2008,
of which 18 were published from 2006 onwards. In spite of this increasing effort, the
American Institute of Medicine (IOM) and the National Health and Medical
Research Council (NHMRC) in Australia stated in 2010 that the evidence base was
limited (Gill et al., 2010; Kumanyika, Parker, & Sim, 2010). The last Cochrane
systematic review published in 2011 arrived at a similar conclusion because of
limited reporting of theories underpinning interventions, as well of intervention
implementation and intervention generalisability (Waters, de Silva-Sanigorski et al.,
2011). In contrast such reports would provide “practice-relevant-information” for
guiding further efforts on prevention (Wolfenden et al., 2010), hence help transfer
and apply interventions to other populations and settings. Similarly, in their review
of controlled trials in child obesity prevention, Klesges et al. (2008) reported only 19
studies that had “the potential for translation and dissemination”. In addition, no
study reported full information addressing reproducibility of interventions in other
contexts than those for which they were developed. However, this information is
essential to determine whether a programme works or does not work, the
circumstances of effectiveness or non effectiveness (including the audience, the
implementation) and harms and benefits (Glasgow, Vogt, & Boles, 1999; Moore &
Gibbs, 2010; Pettman et al., 2012; Rychetnik et al., 2012).

4
This lack of crucial information has been argued to result from the evaluation
approaches, in childhood obesity prevention (Gill et al., 2010; Kumanyika, Jeffery,
Morabia, Ritenbaugh, & Antipatis, 2002; Kumanyika et al., 2010; Moore & Gibbs,
2010; Waters, de Silva-Sanigorski et al., 2011; Waters, Hall et al., 2011) but also in
the prevention of most chronic diseases (Nutbeam, 1998; Pettman et al., 2012;
Rychetnik et al., 2012; Rychetnik, Frommer, Hawe, & Shiell, 2002). This places
evaluation at the core of childhood obesity prevention. It is acknowledged that RCT
design is the evaluation research method that provides gold-standard evidence with
high internal validity of causal relationship between an intervention and its outcomes
(i.e. efficacy). In contrast, it is also argued in health promotion, that with such a
design external validity of intervention, such as applicability and generalisability to
other contexts, is rarely addressed, limiting research translation into practice (Bonell,
Oakley, Hargreaves, Strange, & Rees, 2006; Craig et al., 2008; Green & Glasgow,
2006; Pettman et al., 2012; Rychetnik et al., 2002).
This PhD research uses the case of the NOURISH Randomised Controlled Trial
(RCT) to address this gap by proposing a novel evaluation approach in childhood
obesity prevention.
The NOURISH RCT is a multisite research project conducted by QUT in Brisbane
and Flinders University in Adelaide between 2008 and 2011 (Daniels et al., 2009).
Its primary goal was to influence children weight status at five year of age (Daniels
et al., 2009). NOURISH investigators postulated that early guidance of first-time
mothers in making healthy feeding choices would impact on the development of
child food preferences and eating behaviour, which would in turn influence child
dietary intake and then child weight status. Thus, they developed a programme with a
single level intervention that focused on the nutritional aspects of the energy balance.
Specifically, the intervention provided new mothers with information about what
they could expect when feeding their growing child and guidance with respect to
practices that foster healthy child eating.
The primary evaluation framework developed by chief investigators relied on an
RCT design. However, process data were also collected. The aim of this research is
to revisit, from an external evaluator perspective, the primary evaluation framework

5
of the NOURISH research programme on first-time mother feeding choices in order
to address the limitations of an evaluation based on an RCT design alone. The thesis
is structured in seven chapters, including this introduction.
The second chapter, uses the literature to describe the methodological foundations
underlying the evaluation of health promotion programmes (i.e. construction of a
programme theory or logic model), identifies the two key dimensions that evaluation
should address (i.e. effect and process), and reviews methodological considerations
to effect and process evaluations. Then, the chapter extracts, from the literature on
childhood obesity, determinants that should be included in the construction of
programme theories and reviews the extent to which such programme theories have
been addressed given the complexity of childhood overweight prevention. Consistent
with the focus of the primary data set, the literature review focuses on nutritional
determinants of child overweight. Finally, the chapter concludes on the necessity to
base evaluation on programme theories that address effect and process dimensions of
research programmes and proposes to adopt such an approach for a secondary
evaluation of the NOURISH research programme.
The third chapter applies the key principles and methodology of health promotion
programmes development identified in chapter 2, to reconstruct a programme theory
of the NOURISH research programme. The resulting programme theory particularly
emphasises the distinction between effect and process objectives against which
programme achievements will be evaluated. Then, the chapter describes briefly the
implementation of the NOURISH research programme in order to outline the broad
context of the secondary evaluation. Finally, the chapter discusses what has been
learnt from the reconstruction of the NOURISH programme theory. Then it reveals a
summative evaluation framework, which consists of considering both the effects and
the process of the NOURISH research programme, with respect to its impacts on
maternal feeding choices outcomes when children are 24 months old. The three sets
of specific evaluation research questions that this PhD thesis addresses in the
following chapters are also presented.
The fourth chapter addresses the intervention effects on selected maternal feeding
choices outcomes. It applies analytical methods that are recommended by the

6
CONSORT guidelines. Thus, an Intention-To-Treat analysis, which compares
selected maternal feeding choice outcome between intervention and control groups’
participants, is conducted.
The fifth chapter reports on the NOURISH process evaluation in order to address
generalisability and applicability of the NOURISH research programme. The
analytical approach is based on the description of key process components identified
in Chapter 2 that allow description of circumstances within which the NOURISH
research programme was implemented. The chapter also reports on implementation
achievement relative to programme process objectives defined in Chapter 3, and on
encountered difficulties to perform each process objective.
The sixth chapter addresses by multivariate analyses, the influences of the process
components of the research programme on selected maternal outcome variables
observed in the intervention group. It discusses how the implementation process of
the NOURISH research programme has influenced the variability of selected
maternal feeding choice outcomes within the intervention group and provide
interpretation of its potential influences on the effect evaluation results.
The seventh chapter summarises key results from this secondary analysis. It
discusses how the process evaluation added value to the effect evaluation of the
NOURISH RCT from two perspectives: (i) interpretation of non-observed effect
results with respect to type II error (i.e. lack of statistical power) and type III error
(i.e. lack of implementation); (ii) understanding gained with respect to
generalisability and applicability of the NOURISH RCT. It concludes this research
by providing recommendations on further research perspectives.
7
Chapter 2 Foundations of evaluation in health promotion and
application in childhood obesity prevention
2.1 Introduction
The term “evaluation” is commonly used in colloquial language. According to the
Oxford English Dictionary, evaluation is an action that consists of “appraising or
valuing (goods etc.), a calculation or statement of value”. This requires
identification of valuation criteria that might depend on the rapport of the evaluator
with the object of the evaluation (Nutbeam, 1998; Rychetnik et al., 2002; WHO,
2001a). In health studies, the concept of evaluation is relatively recent and has been
developed with the emergence of the field of health promotion, as defined by the
Ottawa Charter in 1986 (Contandriopoulos, Champagne, Denis, & Avargues, 2000).
Since this field is at the interface between medicine, epidemiology, public health and
social sciences, multiple interpretations of how value should be measured are
encountered in the literature (WHO, 2001a). Nevertheless, a European WHO
Working Group proposed a consensual definition of the evaluation of interventions
in public health. According to this working group:
“Evaluation is the systematic examination and assessment of features of a
programme or other intervention in order to produce knowledge that different
stakeholders can use for a variety of purposes” (WHO, 2001a, p. 26).
In parallel to the definition of valuation criteria, evaluation requires the definition of
comparators or a standard of acceptability against which an object of interest is
compared (Green & Kreuter, 2005). In health promotion, criteria of interest and
comparators are expected to be defined in the planning stages of a programme.
Hence, programme evaluation is dependent on programme planning. This
interdependency between evaluation and planning is described by Bartholomew et al.
as “a parallel process with program planning” (2010, p. 473). Therefore, the
definition of a health promotion evaluation framework necessitates comprehending
its programme-planning framework. This is particularly the case when evaluators are
external to the development and/or coordination of the programme, as they are less
8
likely to have an in-depth intuitive understanding of the motivations and reasoning
which led to the adoption of a particular approach. This is the case of this PhD thesis,
which is a secondary evaluation of the NOURISH obesity prevention programme
(Daniels et al., 2009).
The aim of this chapter is to identify the key components that evaluation of a health
promotion programme should address, and to assess the existing state of such
evaluation in the specific domain of childhood obesity prevention.
The chapter starts by posing the methodological foundations underlying the
development of health prevention programmes. These include the construction of a
programme theory (section 2.2), and the identification of an evaluation framework
which recognises the two key dimensions of programme effectiveness and
reproducibility (section 2.3). Section 2.3 also discusses the dilemma faced by
programme evaluators, when attempting to address these two key dimensions
simultaneously, and the solution proposed in the literature, which involves
broadening the evaluation framework.
Section 2.4 then reviews the existing literature, on the basis on which programme
theories relating to childhood obesity prevention, in particular in young children, can
be developed. This leads to a demonstration of the complexity of determinants,
which must be considered (section 2.4.1), and the different approaches which have
been proposed to address childhood obesity (section 2.4.2). The major limitations of
these approaches as highlighted in the literature are also reviewed.
Section 2.5 proposes, in conclusion, an evaluation approach which builds on the
methodological foundations of a programme theory. This leads to an introduction of
the approach undertaken in this thesis, that is, a secondary evaluation of the
NOURISH obesity prevention programme (Daniels et al., 2009).
2.2 The foundation of evaluation in Health Promotio n: the
construction of a programme theory
There is an extensive health promotion literature proposing diverse conceptual
frameworks or models to guide the development of health promotion programmes.

9
The term “programme” here is defined as a succession of activities, from the
identification of a health problem to its resolution, which includes the design of one
or several health interventions (Issel, 2009). “Intervention” is defined as a specific
set of activities, within a programme, that aims to positively affect (directly or
indirectly) one particular aspect of the health problem (Issel, 2009). When several
interventions are designed, the programme is a “multi-component” programme.
The following review sections have been primarily developed with reference to the
PRECEDE-PROCEED8 (Green & Kreuter, 2005) and “Intervention Mapping”
(Bartholomew et al., 2010) models. These models have resulted from extensive
research in health promotion on programme development. For instance, the
PRECEDE component of the PRECEDE-PROCEED model was first developed in
the 1970s, it evolved into the PRECEDE-PROCEED model in 1991 and was revised
in 2005 (Gielen, McDonald, Gary, & Bone, 2008). Similarly, the Intervention
Mapping model was first published in 1998 and evolved as a result of feedback to
give rise to the 2010 version. The rationale for using both of them in this research is
underpinned by their complementarities. For instance, the PRECEDE-PROCEED
model details very comprehensively the development of programme planning and
systematically guides the developer in addressing planning questions. It assumes that
the evaluation logically follows the development of programme planning, which
might be the case true when the evaluator is internal to the project. However, when
the evaluator is external to the programme, as it is the case in this research, this is not
as self-evident. The Intervention Mapping model (Bartholomew et al., 2010) better
emphasises the parallel of the programme planning with the evaluation by requiring
the developer to clearly specify performance objectives, that would serve as the
definition of evaluation criteria. Finally, both models comprehensively guide the
development of a health promotion programme and have been extensively used
(Glanz, Rimer, & Viswanath, 2008). The review also relies on the programme theory
model developed by Issel (2009). Although less widely used but drawn from a broad
8 PRECEDE stands for predisposing, reinforcing, and enabling, constructs in educational/ecological
diagnosis and evaluation. PROCEED stands for policy, regulatory and organizational constructs in
educational and environmental development.

10
literature on health intervention planning and evaluation9, Issel’s programme theory
model emphasises aspects of planning developed in the PRECEDE-PROCEDE
model that are particularly relevant when the evaluator is external to the programme
(see section 2.2.2). This model helps to identify the two overarching evaluation
research questions that need to be addressed when evaluating prevention
programmes. These three planning models are considered here as roadmaps that
assist health promotion planners in developing comprehensive health promotion
programmes. Hereafter, they will be referred as “the roadmap models”
(Bartholomew et al., 2009; Green & Kreuter, 2005; Issel, 2009) and the authors will
not be further cited. This review also relies on the RE-AIM10 framework developed
by Glasgow and colleagues (Glasgow, McKay, Piette, & Reynolds, 2001; Glasgow et
al., 1999). This evaluation framework is increasingly used (Gaglio, Shoup, &
Glasgow, 2013) and guides the evaluation of public health interventions, with a
particular focus on capturing real-world implementation conditions. This framework
is complementary to the roadmap models because it provides specific evaluation
components that should be addressed, while the former provide specific guidance on
the process to develop evaluation frameworks in health promotion. Lastly, although
this literature relies heavily on the above cited works, other relevant works are
included that add to the programme evaluation.
2.2.1 General principles to develop health promotion programmes
Despite differing terminologies11, the three roadmap models agree on the necessity to
adopt a formal approach to programme development using a conceptual or “logic
model”. The terminology of a “logic model” is borrowed from Bartholomew et al.
(2010) and is often used in the health programme development literature (Renger &
Titcomb, 2002). A logic model is defined as the final product of the thinking process
that links together (graphically or in a table) the hypothetical or demonstrated
relationships between programme input, output, impact and outcomes (Issel, 2009).
The development of a logic model constitutes the final plan of a programme. It is
9 e.g. Patton, Rossi, Stufflebeam, Green and Kreuter
10 RE-AIM stands for Reach, Efficacy or Effectiveness, Adoption, Implementation, and Maintenance
11 Corresponding terminologies across these three roadmap models will be given in the footnotes
whenever necessary.

11
central in programme development as it guides actions and their evaluation
(Anderson et al., 2011; Renger & Titcomb, 2002). It is equivalent to the “programme
theory” terminology used by Green and Kreuter (1995) and Issel (2009), with the
difference being that programme theory is not necessarily formalised graphically or
in a table. While the terms logic model and programme theory can be
interchangeably used, a preference is given to programme theory in this literature
review as it corresponds to the terminology used by Issel (2009) and does not imply a
graphical or tabulated format.
The roadmap models agree on the way in which this programme theory should be
developed. They stress the need to involve a variety of stakeholders, from potential
users to planners and implementers, at each stage of programme development. This
is to ensure, in particular, that programmes will be useful and realistic. In addition,
they strongly recommend that programme development be theory driven in order to
guide programme planners in identifying key aspects they need to consider.
Moreover, the use of theory is also acknowledged as a requisite to inform evidence-
based health practice (Des Jarlais, Lyles & Crepaz, 2004; Glanz et al., 2008; Issel,
2009; Waters, Hall et al., 2011). Issel defines theory as “a description of how
something works. It is a set of statements or hypotheses about what will happen and,
therefore, contains statements about the relationship among the variables” (Issel,
2009, p. 177). Thus, theory is the result of a thinking process, articulating variables
amongst each other in order to create a representation of a specific question. It is
worth noting that in health promotion the “theory” terminology is used to describe
either relationships between determinants and health behaviours, called hereafter
health behaviour theories (e.g. Health Belief Model, Transtheoretical Model), or
relationships between planning actions and expected outcomes, called hereafter
planning theories (e.g. programme, implementation or process theory). Glanz et al.
(2008) have classified health behaviour theories according to the focus level of
behavioural change that is considered: individual, interpersonal, community or
system levels. Because most health problems are complex, there is often a need to
combine several theories with empirical findings to develop conceptual models
(Glanz et al., 2008; Green & Kreuter, 2005; Thomas, 2006). This gives rise to
various health behaviour models or to ecological models in the case where several

12
theories relating to each level of behaviour are combined (McLeroy, Bibeau,
Steckler, & Glanz, 1988). For example, the ecological model based on Ecological
Systems Theory (EST) conceptualised by Bronfenbrenner (1986, 1994), assumes that
behaviour cannot be explained without considering the context in which the
individual is embedded. This includes not only the proximal context of individuals
(i.e. families) but also the broader context in which this proximal context is
embedded. Similarly, when referring to planning, various types of logic models or
planning models can be defined from a combination of multiple planning theories.
Lastly, the roadmap models also agree that the development of a health programme
is a sequential, iterative, informative and cyclical process. This cyclical sequence is
represented in Figure 1, by a spiralling path that assumes that each cycle improves
the health problem. Anti-clockwise arrows show the iterative approach of
programme development and adaptation, which can be broken into four distinct
stages: (1) scoping the health problem, (2) planning for action, (3) implementing
action, and (4) evaluating actions. Achieving each of these stages requires the
successive completion of several activities12. The extent to which a particular stage is
reached leads one to either proceed to the next activities and stages, or revise the
activity process. Information gathered alongside activities is cumulative and is
important in adapting the programme as it develops.
A programme cycle starts by stating the health problem of interest and identifying
causal determinants. This first stage involves drafting a preliminary diagram that
explains the health problem and its direct and indirect determinants. Green and
Kreuter (2005) and Issel (2009) call this preliminary diagram causal theory13.
Mediating factors are intermediate factors sitting between the causal factors and the
health problem, and are necessary for the health problem to occur. Moderating
factors are factors that have the capacity to exacerbate or reduce the health problem.
Across the three roadmap models it seems that the approach to list determinants is
consensual and agreed upon following the guidelines of the PRECEDE-PROCEED
12 The stages and activities are differently named across the three roadmap models: “phase and
activities” for PRECEDE-PROCEED model, “steps and tasks” for the Intervention mapping model, and
“stages and activities” in the programme theory model. 13 Named by Bartholomew et al. (2010) the “logic model of the health problem”

13
model (Green & Kreuter, 2005). Specifically, the model recommends that
programme planners14 conduct an epidemiological assessment, structured in
biological, behavioural and environmental determinants of the health problem. Then,
Green and Kreuter (2005) suggest conducting an educational assessment that consists
of defining for each determinant, the predisposing, enabling and reinforcing factors.
Green and Kreuter (2005) state these three interacting types of factors trigger
behavioural changes. Predisposing factors relate to the motivation of an individual to
act given his/her knowledge, attitudes, beliefs, values, personal preferences, existing
skills and self-efficacy beliefs. Reinforcing factors relate to the feedback the
individual receives from his/her peers as well as from the broader society because of
his/her actions. Enabling factors relate mostly to conditions in the individual’s
environment that facilitate change such as accessibility to a service or programme,
affordability, and the skills needed. The use of existing health behaviour theories is
expected to help planners specify determinants comprehensively. In addition, the
model recommends these determinants be rated in terms of changeability possibility
in order to allow prioritisation of the causal factors of interest, and a first delineation
of programme goals.
The second stage, once the programme goals are delineated, involves developing a
comprehensive plan for action (i.e. logic model or programme theory), which
suggests two equally important dimensions, relating to (i) the solutions proposed to
modify the main causal factors of the health problem, and (ii) the ways in which
those solutions can be implemented (see next paragraph). This programme theory is
expected to provide a complete picture of the programme plan and the expected
causal relationships between programme input, output and outcomes. This allows
one to proceed to the following stage of a programme cycle: conducting a pilot study
or the actual implementation of the health programme. It also provides the
framework to proceed to the last stage of a programme cycle: the evaluation of the
entire programme (see section 2.3).
14 As seen above, in collaboration with a variety of stakeholders.

14
(1) Health problem definition + Needs assessment
Causal theory or logic model of the health problem
What is the health problem, and for whom? What are the determinants? Use health behaviour theories to define for each behavioural and environmental determinants the predisposing, reinforcing and enabling factors.
� Define the goal of the programme
(3) Implementation
(4) Programme evaluation
(2) Programme planning = Programme theory or logic model
• Effect theory or logic model of change . How can the health problem be addressed comprehensively? Use theories of behavioural change.�Define specific intervention objectives for resolving the problem or revise the goal of the programme
• Process theory or strategies: What needs to be implemented for addressing specific intervention objectives and measuring them?�Define specific implementation objectives or revise specific intervention objectives and the programme goal(define Reach, Adoption, Implementation, Maintenance)
Figure 1: The health promotion programme development cycle

15
2.2.2 A distinction between “effect” and “process” theories
As part of the programme theory, and in contrast to the Green and Kreuter (2005)
and Bartholomew et al. (2010) models, Issel (2009) proposes to clearly distinguish
activities specifically dedicated to changing the health problem, from those dedicated
to implementing the intervention. This is because without careful planning of the
implementation, a planned intervention might not be delivered, and thus the effect of
the intervention cannot be tested. This implies the need to develop not only an “effect
theory” but also a “process or implementation theory” which is an equally important
component of the programme theory (see Figure 1).
2.2.2.1 The “Effect theory”
According to Issel (2009), an “effect theory” specifies what will happen as a result of
the intervention (“what”), and in which population (“who”), in relation to a particular
objective. Specifically, an “effect theory” describes how the intervention will affect
the causal, moderating or mediating factors of the health problem (short- to medium-
term effects), eventually leading to the reduction or even the disappearance of this
health problem in the target population (long-term or final effects). This “effect
theory” includes: (i) a “causal theory” which includes the determinants that need to
be changed; (ii) an “intervention theory”15 which describes the proposed solution to
change the targeted determinants; and (iii) an “impact theory” which makes a clear
distinction between intermediate and long-term effects. The words “impacts” and
“outcomes” have been variably used in the literature to characterise the effects of
interventions. In this thesis, contrary to Issel16 but in line with Bartholomew et al.
(2010), and Green and Kreuter (2005), the term “intervention impact” will be used to
refer to intermediate, mediating or short-term effects. The term “intervention
outcomes” will refer to long-term or final effects17. Hence, the effects of changes in
15 Named by Bartholomew et al. (2010) the “logic model of change”. Green and Kreuter (2005) seem
to include this in a broader action theory which also includes elements of the implementation plan. 16
In the course of this literature review, impact and outcome have been more often found as
respectively short- and long-term effect. 17
Definitions of short- and long-term are arbitrary and depend on time length necessary for a
succession of events to occur.

16
the driving factors of the health problem on the health problem itself will be called an
“outcome theory”.
Establishing a comprehensive “outcome theory” allows prioritisation of the effects
of interest (intervention impact and/or intervention outcome). Using existing health
behavioural change theories is particularly relevant to describe the “intervention
theory” as it allows the evaluator to define the number of programme components
the intervention should contain. Altogether, each component of the effect theory
allows delineation of the objectives of the effect theory as well as performance
objectives required to achieve the objectives. In turn, if objectives are found to be
unrealistic this finding can lead to an eventual revision of the programme goals.
2.2.2.2 The “Process or implementation theory”
While “effect theory” postulates what intervention(s) are needed to change the health
problem, Issel (2009) proposes that process theory is concerned with the logistical
issues and resources needed to implement the programme. In short, process theory
identifies the activities that are needed to implement the solutions suggested by the
“effect theory” on the target population. This requires the planner to have a good
understanding of the intervention theory and of the target population. In other words,
the process theory is a parallel of the intervention theory with emphasis on the
logistical aspects.
Strategies for developing a process theory vary between authors. Issel (2009) and
Bartholomew et al. (2010) give general principles, while Linnan and Steckler (2002)
and Glasgow et al. (1999) suggest more specific process components or dimensions.
Below, the key components of a process theory proposed by these authors are briefly
reviewed, and a summary of the process components that should be used is provided.
Issel (2009) suggests focusing on organisational and utilisation issues. Organisational
issues relate to the different resources needed to implement the intervention (i.e.
human, physical, financial, material, time, and informational). Utilisation questions
relate to reaching the target audience and delivering the intervention to that audience.
For each set of issues, Issel suggests a comprehensive listing of inputs and outputs.

17
With the same implicit organisational and utilisation issues, Bartholomew et al.
(2010) suggest that the perspective of the use of a programme should drive planning
implementation. They suggest three important dimensions, which need to be
addressed when determining an intervention process: these are the adoption, the
implementation, and the sustainability of the programme.
Linnan and Steckler (2002) suggest addressing a number of key process component
which relate to context, target audience, the doses received and delivered, fidelity of
the intervention delivery, and the overall quality of the implementation of the
programme.
Lastly, as its acronym indicates the RE-AIM (Reach, Efficacy or Effectiveness,
Adoption, Implementation, and Maintenance) framework suggests addressing all the
process components suggested by Bartholomew et al. (2010) and Linnan and
Steckler (2002) but rearranged in another manner. For instance, maintenance is
equivalent to the sustainability component defined by Bartholomew et al. (2010); and
adoption includes the dose delivered, defined by Linnan and Steckler (2002). The
specificity of the RE-AIM framework is that it addresses the process components
jointly with the question related to the effectiveness, hence the effect theory. Thus, it
gives an equal importance to the effect and process theories.
Overall, although approaches to constructing a theory of the process (or
implementation) of a programme differ in their details, they all appear to contain the
same key components: reach, implementation, adoption, maintenance and context,
which are defined as follows.
• Reach
The reach component relates to the strategies and necessary resources required to
approach, attract, and involve the target population, which has been identified in the
“effect theory”18. The questions addressed here are: Who should be reached? How is
18 This component includes the recruitment and reach components identified by Linnan and Steckler
(2002). Reach is included in the adoption component identified by Bartholomew et al. (2010), who
stress the importance of knowing who the users of the programme will be. Although the PhD
candidate agrees with Bartholomew et al. (2010) that reach and adoption overlap, she believes that
separating reach from adoption, as proposed by Glasgow et al. (1999), is relevant as it leads to

18
it possible to reach them? What are the resources needed? When is a person
considered to be reached? The primary process objectives derived from addressing
Reach are to determine the methods required to reach the population at risk and the
proportion of the target population which needs to be reached (Glasgow et al., 1999;
Linnan & Steckler, 2002). This cannot be obtained without knowing the
characteristics of the target population (Aitken, Gallagher, & Madronio, 2003).
These characteristics should be specified when stating the health problem and
defining the goal (Figure 1).
• Adoption
The adoption component addresses the content that should be developed to match
recipients’ needs and expectations, in order to promote compliance. Specific needs or
expectations may vary within the target audience and should be accounted for in a
needs assessment (Figure 1). The presence of users in the programme planning is
important as it can help in planning to address these various needs. For instance,
while in some cases, a single intervention design might be sufficient to address the
needs of the target audience, in others, the needs of the population might differ
according to age, gender or education, leading to a need for tailored interventions
according to these variables. When intervention tailoring is necessary to meet the
specific needs of the audience, feasibility issues need to be considered, including
feasibility of the research methods. Difficulty in matching the intervention content
with specific needs might lead to a revision of the definition of the target audience,
hence expanding the exclusion criteria used in the “effect theory”. As before, there is
also a need to define adoption objectives.
The adoption and reach components are related, since matching target needs and
expectations may enhance involvement of the target population. Some authors have
suggested that marketing techniques could be applied to health programme
considering the feasibility of reaching a target population, and in some cases may lead to a revision
of the definition of the target population.

19
development (Evans, Christoffel, Necheles, & Becker, 2010; Gordon, McDermott,
Stead, & Angus, 2006). In marketing, emphasis is also placed on understanding the
needs and the environment of the target population prior to the development of
segmented and targeted strategies aimed at triggering behavioural change.
• Implementation
Following the definition by Linnan and Steckler (2002)19, the implementation
component addresses both the ascertainment and quality of the intervention delivery.
Without delivery, a programme cannot be used; and poor delivery of a programme
may not result in the implementation of the planned interventions. Addressing
programme delivery ascertainment implies clearly specifying the dose of the
intervention that participants need to receive in order to trigger the health
behavioural change, as defined in the intervention theory. Related to this, the
resources and strategies needed to deliver this dose and the conditions (e.g.
incentives, accessibility etc.) for people to receive this dose, must be addressed. It
also implies defining a minimum number of participants to be reached by the
programme out of the target audience. Lastly, addressing programme delivery quality
involves ensuring that the actual intervention is consistent with the intended
intervention: over time, across groups and across intervention staff, and that it
conforms to the integrity of the health message delivered. This aspect of the
implementation refers to addressing the fidelity of the programme plan. Again, there
are overlaps with the previous process components. A poor implementation may
limit involvement of the target audience. Conversely, a poor “reach” of the target
audience might limit Implementation. A similar interaction exists between the
adoption and implementation components: specifically when adoption is also
addressed from the implementer perspective, as Bartholomew et al. (2010) suggest in
their definition of the adoption component. They consider that adoption is not only
recipients related but also implementers related. A lack of adoption by the
programme implementers may impair the fidelity of an intervention. As for the other
components, implementation objectives need to be defined.
19 Linnan and Steckler (2002) see implementation as a composite score derived from reach, dose
delivered, dose received and fidelity.

20
• Maintenance
Maintenance of the programme relates to the continued delivery of a usable and
utilised intervention in the long term, beyond the initial implementation of the
programme. It is synonymous with sustainability. This component is particularly
concerned with the feasibility of implementing the programme on a routine basis.
Specifically it addresses (i) resource availability, (ii) the level of adoption of the
programme by the target population and the implementers, and (iii) the evolution of
the programme needed in the longer term to continue the programme. Maintenance
objectives need to be defined consistent with the previous objectives. In turn, reach,
adoption and implementation objectives might be revised if they are perceived to be
non-sustainable when addressing maintenance.
• Context
This process component relates to social, political, economic and physical factors
that might influence (negatively or positively) the implementation of the programme.
It is acknowledged that public health interventions depend on the context (Linnan &
Steckler, 2002; Rychetnik et al., 2002; Wang, Moss, & Hiller, 2006). The broader
environment in which individuals are embedded might predispose or reinforce
certain behaviours20. In contrast, barriers related to the broader environment can
prevent certain behaviours that programme planners need to address to verify that the
previous process objectives are realistic. This process component does not address
any objective, but should help define whether the previous objectives are feasible in
the context of the programme.
Figure 2 summarises into a single conceptual model the recommended process
components to consider when planning for the implementation of a health promotion
programme. Interactions between components are represented by overlaps, indicating
that the direction of these interactions is undefined. The maintenance component is
represented as a repetition of programme delivery following initial implementation,
with an unknown number of iterations (represented here by an incomplete iteration)
20 For instance, Hendricks et al. (2006) observed in a large American cross sectional study (FITs),
differential maternal feeding behaviours between regions after controlling on maternal covariates,
and suggested different policies or regional differences between States.

21
as this will depend on the evolution of resources, participant and implementer
adoption, and need. Barriers and Context need to be considered simultaneously with
each process component and are represented in the peripheral circles.
As in the “effect theory”, this conceptual framework can be used as a basis to
identify both overall objectives and performance objectives for the process of a
health programme.

22
Recipient acceptability
Implementation
Target reach
Adoption
Audience
Population
Recipient use
Dose received
Dose delivered
Fidelity: consistency + integrity
Recipient perception usefulness
Context
Recipient
BarriersRecipient acceptabilityRecipient acceptability
Implementation
Target reach
Adoption
Audience
Population
Recipient use
Dose received
Dose delivered
Fidelity: consistency + integrity
Recipient perception usefulness
Context
Recipient
Barriers
Implementation
Target reach
Adoption
Audience
Population
Recipient use
Dose received
Dose delivered
Fidelity: consistency + integrity
Recipient perception usefulness
Context
Recipient
Barriers Recipient acceptability
Implementation
Target reach
Adoption
Audience
Population
Recipient use
Dose received
Dose delivered
Fidelity: consistency + integrity
Recipient perception usefulness
Context
Recipient
BarriersRecipient acceptabilityRecipient acceptability
Implementation
Target reach
Adoption
Audience
Population
Recipient use
Dose received
Dose delivered
Fidelity: consistency + integrity
Recipient perception usefulness
Context
Recipient
Barriers
Implementation
Target reach
Adoption
Audience
Population
Recipient use
Dose received
Dose delivered
Fidelity: consistency + integrity
Recipient perception usefulness
Context
Recipient
Barriers
Implementation
Adoption
Recipient use
Dose received
Dose delivered
Fidelity: consistency + integrity
Recipient perception usefulness
Context
Recipient
Implementation
Adoption
Recipient use
Dose received
Dose delivered
Fidelity: consistency + integrity
Recipient perception usefulness
Context
Recipient
Implementation
Adoption
Recipient use
Dose received
Dose delivered
Fidelity: consistency + integrity
Recipient perception usefulness
Context
Recipient
Time
Maintenance
Figure 2: Components addressed by the Process theory (own production)

23
2.3 Evaluation of health promotion programmes, base d on
programme theories
As broadly defined by the European WHO Working Group, the purpose of
evaluation in public health is to produce usable knowledge (WHO, 2001a). In health
promotion, including childhood obesity prevention, important aspects of knowledge
that are to be produced relate to the effectiveness of programmes and their
reproducibility (Green & Glasgow, 2006; Kumanyika et al., 2010; Nutbeam, 1998;
Rychetnik et al., 2002; Swinburn, Gill, & Kumanyika, 2005; Wang et al., 2006).
Specifically, effectiveness is related to whether the solutions described in the
programme theory modify the health behaviour or, in other words, do they work? In
turn, reproducibility is related to the extent to which an effective programme is
feasible (or applicable) and generalisable (or transferable) to other contexts or
environments (Bonell et al., 2006; Wang et al., 2006). This is where the emphasis on
the “effect” and “process” theories made by Issel (2009), becomes highly relevant.
Indeed, it helps to address upfront these two evaluation questions and to guide the
evaluator in framing the evaluation objectives to pursue. In addition, it also makes
clear which evaluation criteria need to be considered to address each of these
evaluation questions. Specifically, criteria to evaluate effectiveness relate to the
achievement measures of the programme goal (i.e. primary outcome), objectives (i.e.
secondary outcome) and performance objectives (i.e. impact) defined in the “effect
theory”. Similarly, criteria to evaluate reproducibility relate to the achievement
measures of the process objectives (i.e. intervention implementation) and
performance objectives defined in the “process theory”. Goal, objectives and
performance objectives defined in the programme theory serve as comparators to
evaluate programme effectiveness and process achievements (Bartholomew et al.,
2010; Issel, 2009; Nutbeam, 1998; Renger & Titcomb, 2002).
Although evaluation is the last sequence of activities in the programme cycle, the
roadmap models agree that its planning should begin concurrently with programme
planning. Specifically, questions related to the evaluation of each stated objective
should be raised and their measurements anticipated at the programme planning stage
as well as consequent data collection. Objectives, which cannot be evaluated, need to

24
be revised. Similarly, evaluation methods should be planned at the same time as
programme planning as they require human, financial and time resources for data
collection and analysis (Bartholomew et al., 2010; Issel, 2009; Nutbeam, 1998;
Renger & Titcomb, 2002). Thus, the parallel between programme planning and
evaluation becomes clear, making evaluation part of the iterative process of the
programme cycle.
The ways of addressing effectiveness and reproducibility are reviewed below, as well
as the dilemma faced by programme promoters in attempting to achieve both.
2.3.1 Addressing the effectiveness of an intervention: RCT design,
the gold standard
The purpose of addressing effectiveness (i.e. effect evaluation) is to provide evidence
that the programme has achieved its objectives of modifying targeted outcomes (i.e.
impact and outcome evaluations) and that these achievements are attributable to its
implementation. Several families of study designs exist to provide evidence of
success such as experimental, quasi-experimental and observational designs.
However, experimental designs such as Randomised Controlled Trials (RCT) have a
higher ability to infer statistical causal relationships between the intervention and
programme impacts or programme outcomes (Attia, 2005; Cochrane, Rougemont,
Gubéran, & Massé, 1977; Higgins & Green, 2008; Issel, 2009; Kirkwood & Sterne,
2003; Margetts & Nelson, 1997). This ability refers to the internal validity of a
design in providing evidence of a cause-effect relationship. It is because of this high
internal validity that the RCT design has been widely acknowledged to be the “gold
standard” method to use in clinical settings since the works of A. Bradford Hill and
A. Cochrane in the 1950s (Cochrane et al., 1977; Kirkwood & Sterne, 2003;
Margetts & Nelson, 1997). RCT design has been rapidly applied to healthcare
services and widely advocated in the wider public health arena as providing the
stronger basis of evidence (Curnan, LaCava, Langenburg, Lelle, & Reece, 1998;
Moore & Gibbs, 2010; Nutbeam, 1998).
To understand how RCT designs provide internally valid (i.e. correct) evidence of
causal relationship, their key features are reviewed. This review also provides the

25
core foundation of the analytical approach conducted in this PhD thesis. Thus it is
extensively developed. Variants of RCT exist such as cluster RCTs and crossover
trials but are not expanded on here. Other families of designs are not expanded on
either.
An RCT design is an evaluation method which aims to measure the effect of an
intervention by comparing impacts or outcomes21 resulting from an intervention,
with impacts or outcomes without this intervention (Attia, 2005; Cochrane et al.,
1977; Issel, 2009; Kirkwood & Sterne, 2003; Margetts & Nelson, 1997). To infer a
valid (i.e. correct) causal relationship between an intervention and a difference in
impacts or outcomes between groups (i.e. effect), groups need to be as similar as
possible before the intervention and remain as comparable as possible in all respects
other than the intervention condition. The best ways of achieving this is to control for
all of the parameters which may have an influence on the relationship (Higgins &
Green, 2008; Issel, 2009).
The best method to define comparable groups is to recruit eligible participants within
the same population, then assign them randomly to groups according to their
experimental condition: the group to receive the intervention is called the
intervention group; and the group without intervention, the control group. This
random allocation ensures that participants are assigned to the intervention or control
group purely by chance, hence preventing allocation bias (Higgins & Green, 2008;
Issel, 2009; Odgaard-Jensen et al., 2011). Whenever differences occur between
groups before an intervention, it is difficult to interpret whether an observed effect is
due to the intervention or to the difference in the characteristics of the groups. As a
result, risk factors should be equally distributed between groups and thus any
differences in groups would be due to chance. However, if the randomisation process
is not concealed from the investigator, then the benefits of random allocation are
potentially reduced and allocation bias might be introduced. Therefore, to ensure
effective randomisation, allocation needs to be concealed (Higgins & Green, 2008;
Jadad & Enkin, 2008; Odgaard-Jensen et al., 2011).
21 See glossary or section 2.2.2.1 for definitions of impact and outcome.

26
In addition to attempting to reduce allocation bias through random allocation of the
intervention condition, the investigator must devote considerable effort to ensure that
comparability persists during the experiment and other biases are not introduced at
each stage of the trial (Higgins & Green, 2008; Jadad & Enkin, 2008). Whenever
possible the experimental condition of participants should be hidden (concealed)
from participants themselves and study personnel, until the end of the trial, in order
to avoid differential measurement bias and attrition bias. For example, if study
personnel are aware of participant allocation, their expectations of the likely effects
of the intervention may influence any subjective ratings, resulting in a false inflation
of intervention effects. Similarly, if participants are aware of the expected effects of
their intervention condition, this may influence their subjective ratings, and again
result in a false inflation of intervention effects. Alternatively, participants might
drop out more when they know they are not in the intervention group, resulting in
reduced comparability between those allocated to intervention versus control,
making it more difficult to assume that later differences are due to the intervention as
opposed to differential attrition. Whenever differences occur between groups when
measuring impact or outcome, interpreting the effect of an intervention becomes
spurious. In addition, effort should be devoted to keeping all participants active in the
trial in order to perform an Intention-To-Treat analysis.
Intention-To-Treat (ITT) analysis is a key element in preserving randomisation
benefits and should always be sought (Jadad & Enkin, 2008; Moher et al., 2010). Its
principle relies on the comparison of groups at the end of the trial by including all
participants in groups from which they were allocated even if, for whatever reason,
they failed to complete post intervention measurements or to receive the intervention
they were allocated. As a result, ITT analysis provides an estimate of average effect
across all participants regardless of whether they were exposed to the intervention.
Hence, ITT might correspond to an underestimation of the potential effect of the
dose that was planned to be received. Nevertheless, compared to the alternative
approach of “subgroup analyses”22 which excludes cases in the analyses, ITT is less
22 For instance, exploring intervention outcome within gender groups while participants are both
males and females. Subgroup analysis without a pre-specified subgroup hypothesis is not a good
practice (Sun et al., 2011). Another example of subgroup analysis is “per protocol analysis” or “on-

27
likely to introduce biases associated with non random loss of participants and the
underestimation of effect is preferred to uncertainties in the results generated by
unknown biases (Moher et al., 2010; Petticrew et al., 2012; Sun et al., 2011). For
instance, the decision to exclude participants below a certain level of exposure to the
intervention is arbitrary, and participants who drop out are usually different from
those who adhere in terms of their risk of adverse outcome (Moher et al., 2010;
Petticrew et al., 2012; Sun et al., 2011). This can mislead interpretation of results.
However, ITT can be challenging when outcome data are missing since it means
excluding participants from the analysis for whom it is unknown whether missing
reasons are related to the intervention. When less than 10% of randomised
participants are missing, and provided they are balanced between groups, conducting
an ITT analysis on available cases or complete cases23 is rarely an issue (Moher et
al., 2010). In contrast, a situation of greater than 10% of participants missing might
generate a loss of statistical power. An alternative is a “full Intention-to-Treat
analysis”, where missing outcomes are estimated by imputation24. Nevertheless,
imputation is criticised as it “requires strong assumptions, which may be hard to
justify” (Moher et al., 2010, p. 23).
Another key feature of RCTs is prospective measurement requirements before and
after the intervention (Issel, 2009). Measuring prospectively (rather than
retrospectively) increases the ability to control for confounding factors and to control
exposure. Prospective measurements would include variables that are expected to
change as a result of the intervention, and which are collected at baseline, prior to the
commencement of the intervention, as well as after the intervention has been
completed. Comparison of intervention versus control participants with respect to
changes from pre- to post-measurements is generally the main way to assess the
Treatment analysis” which consists of analysing group according to the intervention dose
participants received. For instance, participants who were allocated to the intervention group but
who did not adhere to the protocol might be excluded from the analysis. 23
Called “available case ITT” or “complete case ITT” 24
For instance, missing measures of BMI for an individual can be predicted by regression modelling
from previous or anterior BMI measures.

28
effect of the intervention. In addition, baseline data are important for verifying that
randomisation was successful, that is to ensure that the groups were initially
comparable with respect to key measurements. Baseline data should therefore also
include all the variables that are known or thought to affect the effect. These data are
also used to describe participant characteristics, which are necessary to assess the
extent to which results can be generalised and for possible adjustment of results if the
randomisation is not effective for all relevant variables.
As it is the case for any effect evaluation, RCTs require additional scientific rigour to
preserve the framework of the experiment and maximise the chances of detecting the
postulated effects. The investigator must make specific efforts to follow the control
and intervention participants over time, in such a way that control participants are not
contaminated by the intervention, and that drop-outs are minimal and equivalent in
both groups. Importantly drop-outs affect the statistical power of detecting an effect
and different drop-out rates between groups potentially bring further attrition bias
which may affect the ability to attribute causality to the intervention. In addition,
measurements by the investigator must (i) measure what is expected to be measured
(validity), (ii) minimise measurement error (reliability) and (iii) avoid missing data
(completeness). For each phase of the RCT (enrolment, allocation, follow-up and
analysis), investigators need to develop protocols and standardised measurement
tools. Without this scientific rigour, the ability to infer causal relationships from an
RCT might be compromised and the internal validity of the study affected.
Conversely, if all these features can be met, this design can provide the best evidence
of efficacy of an intervention with a strong internal validity, hence the “gold
standard” labelling. Efficacy is the maximum potential effect under ideal conditions
of an intervention, whereas effectiveness is the potential effect of an intervention
under real-life conditions (Issel, 2009).
Since 1996, a group of scientists has been developing a checklist of items that
investigators should consider when reporting RCTs to demonstrate high internal
validity of evidence. This is the CONSORT (Consolidated Standards of Reporting
Trial) statement. This checklist provides guidance on how to report RCTs and is also
becoming a reference when designing or reviewing RCTs. The latest revision of the

29
CONSORT statement25 provides a checklist of 25 items that should be considered
(Moher et al., 2010). These 25 items detail what the six sections26 of RCT reports
should take into account. Specifically, ten items are devoted to detail the methods:
description of trial design, eligibility criteria, detailed description of intervention,
definition of primary and secondary outcomes, sample size calculation, sequence of
randomisation, allocation concealment, randomisation implementation, blinding,
statistical methods to compare groups and additional analyses. Seven items are
devoted to report results: description of participant flow detailing the number of
participants through the four phases27 of the trial, recruitment period, baseline
demographic and clinical characteristics of both groups, numbers analysed per group,
primary and secondary outcomes for each group with estimated effect size and
precision, additional analyses, and unintended effects. Using a standardised chart (i.e.
CONSORT Flow Chart) to describe participant flow is strongly recommended. Three
items are devoted to the structure and content of the discussion that should include
limitations and potential bias, generalisability and interpretations consistent with
results and other relevant evidence. The item related to generalisability addresses
briefly the other dimension of validity: external validity. This validity dimension is
the focus of the second evaluation question developed in section 2.3.2.
Finally, addressing effectiveness with an RCT design is complex and requires a great
amount of resources and rigour in order to ascertain internal validity. Nevertheless,
this strength has been largely stressed in public health research and RCTs have been
increasingly used to evaluate health promotion interventions (Avenell & Goode,
2008; Connelly, 2007; Green & Glasgow, 2006; Moore & Gibbs, 2010; Nutbeam,
1998).
25 For non-cluster randomised trials. A recent extension of the CONSORT 2010 statement to cluster
randomised trials (e.g. community-based trials or field trials or group randomised trials or place-
based trials) has recently been published (Campbell, Piaggio, Elbourne, & Altman, 2012) 26 Title and abstract, introduction, methods, results, discussion and other information 27 Enrolment, allocation, follow-up, analysis

30
2.3.2 Addressing the reproducibility of the intervention
Addressing the reproducibility of an intervention generally refers to the evaluation of
the process theory which should be developed as part of the programme theory. One
purpose is to provide evidence that the programme was applicable and specifically
that process objectives with respect to reach, adoption, implementation, and
maintenance were achieved in the specific context of the programme (Bonell et al.,
2006). A second purpose is to provide information with respect to the conditions of
implementation in order to determine the potential transferability of the programme
to other contexts (Bonell et al., 2006) .
Applicability or feasibility of interventions and generalisability or transferability of
results are concerns that address the external validity of studies (Green & Glasgow,
2006; Higgins & Altman, 2008; Wang et al., 2006). Specifically, process evaluation
describes recipients’ characteristics and can address those for whom the programme
was more or less effective (Bonell et al., 2006; Linnan & Steckler, 2002). This
facilitates comparison with the general population, hence informs on the
generalisability of results, but also indicates whether strategies to reach the target
population have been efficient. Process evaluation also describes how recipients and
implementers adopt the programme, and thus informs whether there is a need to
modify it. Lastly, it describes solutions proposed by the programme, human,
financial and time resources engaged in the programme, as well as the context of
implementation which is understood as the social, political and organisational
setting, and hence informs on the conditions to meet for implementation (Linnan &
Steckler, 2002; Rychetnik et al., 2002). All these descriptions also serve to meet
accountability requirements of funders and stakeholders. However, addressing
feasibility with respect to (i) fidelity with the planned intervention components, (ii)
the population reached compared to the target population, and (iii) the compliance of
recipients and implementers to the protocol, also verifies that the programme could
be implemented as planned (Bonell et al., 2006). As a result, it also contributes to the
ascertainment of internal validity by avoiding interpreting a programme as
ineffective in the case this programme has been poorly or even not implemented.
Such a misinterpretation in health promotion has been called “type III error”

31
(Bartholomew et al., 2010; Durlak, 1998; Helitzer et al., 1999; Issel, 2009; Linnan &
Steckler, 2002).
Since process evaluation involves addressing a broad range of questions, it usually
relies on the use of a combination of both quantitative and qualitative methods
(Bartholomew et al., 2010; Hawe, Shiell, Riley, & Gold, 2004; Issel, 2009; Linnan &
Steckler, 2002; Nutbeam, 1998; Saunders, Evans, & Joshi, 2005). Quantitative
methods using self-completed or directed questionnaires with close-ended questions
can be used to assess the performance of intervention implementation. Qualitative
methods can provide in-depth understanding of the mechanisms which explain
failure or success in reaching the target population and audience, as well as
programme adoption and implementation (Hawe, Shiell, Riley et al., 2004; Noyes,
Popay, Pearson, & Hannes, 2008). However, qualitative methods are time-intensive
and costly (Helitzer et al., 1999), so cannot always be performed and are rarely used
alongside RCTs (Lewin, Glenton, & Oxman, 2009). Surveying participants or
intervention stakeholders via questionnaires that include written open-ended
questions may be an alternative. The major limitation of such collection methods is
that responses are not always easy to read or understand, leading to potential
difficulty in interpretation. Additionally, respondents may vary in the extent to which
they consider (and therefore report) the full range of relevant factors. To minimise
these limitations while still taking the opportunity to collect participants’ or
stakeholders’ points of view, it is possible to combine close-ended questions with
open-ended comments (Saunders et al., 2005).
Although elements to address the external validity of intervention are important to
inform health prevention, they have been poorly reported in peer review journals
leaving a gap in the critical knowledge necessary for implementing successful
interventions (Bonell et al., 2006; Branscum, Sharma, Wang, Wilson, & Rojas-
Guyler, 2013; Green & Glasgow, 2006; Klesges et al., 2008; Nutbeam, 1998;
Patrick, Scutchfield, & Woolf, 2008; Waters, Swinburn et al., 2011; Wolfenden et
al., 2010). For instance, recruitment and retention processes of RCTs are rarely
evaluated (Brueton, Stevenson, Vale, & Rait, 2011; Foster et al., 2011; Treweek et
al., 2011).

32
2.3.3 Choosing evaluation objectives and methods: a dilemma for
programme evaluators in health promotion
Finally, with the two evaluation questions in mind, the evaluators need to define
evaluation objectives. As suggested by the roadmap models, this definition should be
made early in the planning cycle as feasibility issues need to be considered within the
overall programme plan. Various stakeholders, including those with implementation
decision responsibilities as well as users, should be involved (Waters, Swinburn et
al., 2011). Indeed, they help to define evaluation objectives that match with their
domain of interest to guide the production of relevant knowledge (Bartholomew et
al., 2010; Issel, 2009; Rychetnik et al., 2002). Nevertheless, depending on when, in
the course of the planning cycle, this definition of evaluation objectives is made,
various types of evaluations that yield various types of information can be planned.
Consistent with the parallel between programme planning and evaluation, Figure 3
reports the different types of evaluation that should be conducted at different stages
of a health promotion programme cycle. The earlier the evaluation objectives are
defined, the better these evaluations can be planned and the more useful the
information derived from evaluations can be (Pettman et al., 2012). In practice, this
seems to favour the position of the evaluator being an internal rather than an external
position in the programme development process.
Evaluation activities that precede implementation of a final version of a programme
produce formative information (Helitzer et al., 1999; Saunders et al., 2005). The
results of this formative evaluation may lead to modifying the methods and adjusting
the objectives of the programme, until the programme is deemed ready for
implementation (Foster et al., 2011; Glasgow & Linnan, 2008; Helitzer et al., 1999;
Issel, 2009; Saunders et al., 2005). Similarly, evaluation that addresses whether
intervention and process objectives were met produces summative information.
Similar to the formative evaluation, this summative evaluation informs whether the
programme is worth being scaled up or revised (Glasgow & Linnan, 2008; Issel,
2009). Within the summative evaluation, process evaluation should precede effect
evaluation as data are collected during the course of the implementation and help in
adjusting unplanned issues (Linnan & Steckler, 2002; Saunders et al., 2005).

33
Conversely, measuring effect requires time beyond the completion of interventions
(Glasgow & Linnan, 2008; Issel, 2009). Effect evaluation assesses whether the effect
theory works. Consistent with impact and outcome theories defined in section
2.2.2.1, impact and outcome evaluations measure change in short- and long-term
outcomes, hence are part of effect evaluation (Glasgow & Linnan, 2008). If measures
of costs are planned, cost can be evaluated within the process evaluation as part of
the description of the conditions of implementations. Alternatively, economic
evaluations can take place if costs are related to intervention effects. Conducting all
of these evaluations gives rise to comprehensive evaluation (Glasgow & Linnan,
2008; Issel, 2009). Along with addressing evaluation objectives, evaluation methods
need to be addressed as they determine necessary resources (Mathews, Moodie,
Simmons, & Swinburn, 2010). For instance, to complete a thorough evaluation,
Pettman et al. (2012) suggest a minimum budget equal to 15% of the overall project
budget. Moreover, time needs to be considered as the time for a primary outcome to
be observed might exceed the time devoted to the evaluation (Bartholomew et al.,
2010; Issel, 2009).
It has been argued that the strengths of RCT design with respect to internal validity
have biased scholars, funding and publications (Nutbeam, 1998; Patrick et al., 2008)
leading some researchers to use it as a subject of research rather than a tool (Jadad &
Enkin, 2008). In turn, this would have generated an evaluation culture around RCT
design that would have led researchers to focus their efforts on internal validity;
perhaps at the expense of external validity (Green & Glasgow, 2006; Kessler &
Glasgow, 2011; Nutbeam, 1998). Indeed, although RCT design uses several
techniques28 to control a number of biases after participants’ recruitment, it does not
control for all biases, such as selection bias that occurs at recruitment (Jadad &
Enkin, 2008). The RCT design has been reported to select highly motivated
participants, those who are often less at risk of the studied disease (Glasgow et al.,
1999). This makes generalisability difficult and raises equity issues (Bonell et al.,
2006; Glasgow et al., 1999; Thomas, 2006). In addition, because the environment of
the community or population setting is less manipulable than that of clinical settings,
28 As developed in section 2.3.1, randomisation, ITT analyses, and standardisation.

34
RCTs tend to disconnect intervention from their context of applicability. For
instance, strategies for the researcher seeking evidence on intervention efficacy are to
focus on a selection of determinants to modify, and to mimic ideal implementation
conditions in order to isolate the sole effects of the intervention (Glasgow,
Lichtenstein, & Marcus, 2003).

35
(1) Health problem definition + Needs assessmentCausal theory or logic model of the health problemWhat is the health problem, and for whom? What are the determinants? Use health behaviour theories to define for each behavioural and environmental determinants the predisposing, reinforcing and enabling factors.� Define the goal of the programme
(3) Implementation = action
Monitor action
Collect data: process + costs
(2) Programme planning = programme theory or logic model
• Effect theory : How can the health problem be addressed comprehensively? Use theories of behavioural change�Define specific intervention objectives for resolving the problem (intermediate objectives) or revise the goal of the programme
• Process theory or strategies : What needs to be implemented for addressing specific intervention objectives and measuring them? �Define specific implementation objectives or revise specific intervention objectives and the programme goal (define Reach, Adoption, Implementation, Maintenance)
(2a) Pilot*Formative evaluation
(4) Programme evaluation
Sum
mat
ive
eval
uatio
n
Com
preh
ensi
ve e
valu
atio
n
Economic evaluations
Outcome evaluation: Was the programme goal achieved? (primary outcome)
Impact evaluation : Were the intermediate programme objectives achieved (secondary outcome/impact)?
Process evaluation : Were the specific programme implementation objectives achieved with respect to Reach, Adoption, Implementation, Maintenance?What were the conditions of implementation (e.g. participant and facilitator characteristics, costs, time, political support..)
Effect evaluation
(s)
Figure 3: The different categories of evaluation in the programme development cycle
36
These limitations of RCT design have raised debate about their relevance in health
promotion (Hawe, Shiell, & Riley, 2004; Macintyre, 2011). However, evidence that
programmes work and do not harm is ethically and economically essential before
scaling them up in the population (Moore & Moore, 2011). Thus it has been
increasingly acknowledged that a balanced focus in evaluation research be found
between internal and external validity (Audrey, Holliday, Parry-Langdon, &
Campbell, 2006; Glanz et al., 2008; Pettman et al., 2012; Rychetnik et al., 2002).
Although finding this balance is challenging, as internal and external validities are
inversely related, some authors have been optimistic and have suggested new
evaluation orientations (Glasgow & Linnan, 2008; Helitzer et al., 1999). Specifically,
Glasgow et al. (2003) have suggested abandoning the application in health promotion
of the five-phase intervention research model, used for drug therapy development.
This model postulates that intervention research evidence is building on a continuum
of research achievements, from intervention hypotheses (phase I) to large-scale
intervention implementation (phase V). The purpose of phase III is to test
interventions in efficacy trials in small groups, under high control. Resulting
efficacious interventions are next re-tested in phase IV in effectiveness trials in
populations. The model assumes that the transition between phase III and IV can be
made smoothly and that effective trials from phase IV would provide sufficient
knowledge to move forward to the last phase. Glasgow et al. (2003) argue that the
complexity of the real world moderates effect, and thus not considering it in the
efficacy trial is unlikely to allow the transition of what works into the effectiveness
trial, resulting in stopping the development of the intervention research (i.e.
knowledge) process in phase IV. Therefore, they suggest that efficacy or
effectiveness trials consider the complexity of the intervention context by addressing
participant characteristics (i.e. reach), characteristics of adoption of the intervention
by participants and implementers, implementation fidelity, and maintenance
perspectives. The complementary nature of effect and process components of a
programme’s evaluation appear central to the understanding of programme results,
shifting the focus away from intervention outcomes only. In addition, this
information can provide important elements to determine reasons for apparently
unsuccessful interventions (Helitzer et al., 1999). In particular, it helps to determine

37
whether interventions are implemented as planned, and that in turn helps to avoid a
misinterpretation of non-effectiveness (or Type III errors).
This approach is consistent with the development of programmes suggested by the
roadmap models (Bartholomew et al., 2009; Green & Kreuter, 2005; Issel, 2009),
that address prevention with an ecological approach perspective and participation of
users and implementers.
2.4 Evaluation of childhood obesity prevention: a r eview of
programme theories
Sections 2.2 and 2.3 have established the foundations on which the evaluation of a
health promotion programme stands. Specifically, these sections have stressed the
definition of an exhaustive plan for the whole programme (i.e. programme theory)
and the methods for developing such a plan. These methods include the definition of
theory-based interventions and implementation. This section is a turning point of this
chapter as it reviews the literature on childhood obesity prevention by addressing the
construction of programme theories to provide evaluation frameworks, addressed in
section 2.5.
2.4.1 The causal theory or mapping the determinants
As highlighted in section 2.2.1, the construction of programme theories of child
obesity prevention programmes should start by mapping the determinants of
childhood obesity. Multiple representations of causal theory of child obesity have
been described in the literature29 (e.g. Butland & Britain (2007), Davison & Birch
(2001), Kumanyika et al. (2002) Story, Kaphingst, Robinson-O’Brien, & Glanz
(2008), Swinburn et al. (2011), WHO (1997)30). Even though they are different, they
all agree on the complexity of the problem of child obesity. They all acknowledge
29 The most comprehensive but highly complex model has been proposed in the Foresight report in
2007 (Butland & Britain, 2007). The heart of the model is the energy balance of the child, directly or
indirectly influenced by 108 variables, which are driven by four key domains: physiology, activity,
food and psychology. The result is a complex web-like representation of relationships between the
many determinants of child obesity. http://www.bis.gov.uk/assets/foresight/docs/obesity/17.pdf 30
Non-exhaustive list

38
that the starting points are the etiological determinants of a chronic energy imbalance
in children, namely increased energy intakes and decreased energy expenditures. In
turn these determinants have biological, behavioural and socio-physico
environmental determinants, embedded in different spheres of influences:
intrapersonal (e.g. individual), interpersonal (e.g. proximal environments) and
organisational, community and environment/policy (e.g. distal environments)
(Butland & Britain, 2007; Lobstein et al., 2004; McLeroy et al., 1988; Spruijt-Metz,
2011; Story et al., 2008; Wang, 2008; Wang & Lim, 2012). Given the growing
literature on childhood obesity in the last years, the complexity of interactions
between determinants and the nutritional focus of this PhD thesis, only child obesity
determinants related to child nutrition are briefly reviewed hereafter. The influence
of sleeping patterns31 on some pathways of hormonal regulation is out of the scope of
this PhD thesis, and thus is not developed either.
2.4.1.1 Biological determinants and weight gain
Biological determinants of overweight are at the core of the energy balance
maintenance. It is acknowledged that genetics plays a role in obesity, however, this
cannot account for the rapid rise of the obesity epidemic (Dattilo et al., 2012;
Lobstein et al., 2004). Rather, interactions between genes and environmental changes
are emphasised (Butland & Britain, 2007; French, Story, & Jeffery, 2001; Lobstein et
al., 2004). For instance, it has been suggested that children are equipped with innate
predispositions inherited from gene evolution in food scarcity conditions rather than
abundance. Specifically, children have an innate capacity to self-regulate their
energy intake in response to hunger and satiety cues, and to achieve an adequate
growth (Birch, Johnson, Anderson, Peters, & Schulte, 1991; Davis, 1939; Schwartz,
Scholtens, Lalanne, Weenen, & Nicklaus, 2011). Other genetic predispositions
include: (i) preferences at birth for sweet taste, such as that of breast milk (Birch,
1999); (ii) bitter and sour tastes aversions, such as that of most poisonous substances
(Birch, 1999); (iii) preferences for salty taste at around four months of age (Birch,
1999; Cowart, 1981; Schwartz et al., 2011), and for energy-dense foods (Birch &
31 Short sleeping duration is increasingly suggested to positively stimulate hormonal regulation of
appetite and to decrease physical activity (Spruijt-Metz, 2011).

39
Fisher, 1996); and (iv) neophobic reactions towards new and unfamiliar foods, to
protect the child from potentially dangerous substances (Birch, 1998). Contrary to an
innate self-regulation capacity, innate food preferences and neophobic traits are
considered to be maladaptive to today’s societal abundance of sweetened, salty and
high energy dense foods (Birch & Fisher, 1996; Schwartz & Puhl, 2003).
Biological determinants also include weight gain predisposition that is governed by
genetics and early life growth patterns. For instance, rapid weight gain up to two
years of age has been associated with a two- to threefold increase in risk of obesity in
adulthood (Ong & Loos, 2006). In turn, growth patterns are also suggested to be
shaped by in utero and postnatal experiences (Esposito, Fisher, Mennella, Hoelscher,
& Huang, 2009; Gill et al., 2010).
2.4.1.2 Individual behavioural determinants of energy intakes of young
children
Behavioural determinants of overweight overlap with biological and environmental
determinants. This reflects the complex interplay between determinants of child
energy intakes. Loss of self-regulation capacity and reinforcement of innate food
preferences are suggested to be the child-driven determinants of increased energy
intakes (Esposito et al., 2009) and are discussed in the following section.
It has been suggested that an innate self-regulation capacity could be overridden by
non-responsive feeding interaction between the caregiver and child cues and would
contribute to overweight or rapid weight gain (DiSantis, Hodges, Johnson, & Fisher,
2011). Non-responsive feeding interaction is a discordant response from the
caregiver to child hunger or satiety cues (DiSantis, Hodges et al., 2011). Pressuring
the child to eat when he/she is not hungry or restricting the child when he/she is
hungry are two examples of non-responsive feeding. This discordant feeding
interaction might occur because the child does not express his/her appetite cues or
because the caregiver does not know about these cues. Hence, a bi-directional
association between child cues and parent feeding response or child behaviour in
response to parent behaviour should be explored. Finally, loss of self-regulation
would also be a child-carer driven determinant of increased energy intakes. It is
worth noting that few studies have specifically explored a caregiver’s responsive

40
feeding interaction and their cross-sectional design or low quality preclude strong
evidence for this hypothesis (DiSantis, Hodges et al., 2011). In contrast, there is a
growing research literature exploring the uni-directional association between the way
caregivers feed a child, and children’s eating and / or weight. Specifically, this
literature has mainly focused on the measurement of parental control over child
eating (DiSantis, Collins, Fisher, & Davey, 2011). This will be further developed in
the paragraph entitled “parents’ feeding influence of how”.
There is also evidence that food preferences are not exclusively established on the
ground of evolutionary inheritance, but also evolve through an early learning process
which involves (i) new sensory experiences, (ii) social learning, and (iii) associative
learning (Birch & Fisher, 1996; Ogden, 2010). This evidence relies mainly on
research dating back several decades, summarised below (e.g. (Birch, 1979; Davis,
1928, 1939; Duncker, 1938; Rozin & Schiller, 1980)).
(i) New sensory experiences refer to exposure to sensory characteristics of
food (e.g. taste, vision, smell and texture) other than those with which children
are already familiar (i.e. innate likes and dislikes predisposition). It is
acknowledged that repeated exposure to unfamiliar food, starting even in the
womb, increases familiarity, acceptance and intake of offered unfamiliar food
(Aldridge, Dovey, & Halford, 2009; Cooke, 2007; Maier, Chabanet, Schaal,
Leathwood, & Issanchou, 2007; Mennella & Beauchamp, 1999; Mennella,
Jagnow, & Beauchamp, 2001; Mennella & Trabulsi, 2012; Sullivan & Birch,
1994).
(ii) Social learning occurs by observing the behaviour of others in a variety of
social situations (Ogden, 2010). For instance, meal sharing with parents or
peers or even media exposure, can be effective in modelling what others eat
even though the target food is a priori not the preferred food (Birch, 1980), or
innately rejected (e.g. chilli) (Rozin & Schiller, 1980). In addition, modelling
is increased if the model eats the same unfamiliar food (Addessi, Galloway,
Visalberghi, & Birch, 2005), the model is familiar (Duncker, 1938; Harper &
Sanders, 1975; Salvy, Vartanian, Coelho, Jarrin, & Pliner, 2008), the context
of eating is pleasant (Birch, Zimmerman, & Hind, 1980). What is more, there

41
is evidence of increased willingness to try foods that are presented in fun or
“heroic” situations (Duncker, 1938; Hastings, McDermott, Angus, Stead, &
Thomson, 2006).
(iii) Children also learn to associate sensory experiences with physiological
consequences and the nature of the social context of a meal (Aldridge et al.,
2009; Birch & Fisher, 1996; Cooke, 2007; Mennella & Trabulsi, 2012;
Schwartz et al., 2011). Positive physiological consequences (e.g. pleasure,
satiety) tend to increase like for the food tried, conversely discomfort (e.g.
sickness) tends to increase dislike (Birch & Fisher, 1996; Rozin, 1990).
Similarly, positive social interactions during meals (e.g. pleasant meal
atmosphere, encouragement to try new foods, positive facial expressions)
influence food likes, whereas negative ones (e.g. battlefield atmosphere,
parental coercion) influence dislikes.
In summary, child energy intakes are determined by two main drivers, which in turn
have several determinants external to the child. The first driver is child capacity to
adjust energy intakes (i.e. self-regulate) to physiological needs, which is in turn
determined, by parental feeding capacity to respond appropriately to child hunger
and satiety cues. The second driver is child food preferences that are shaped by: (i)
repeated exposure to food with new sensory characteristics; (ii) modelling others’
behaviour and (iii) physiological or emotional associations when eating. It is
understood that exposure to unhealthy foods and modelling unhealthy behaviours
mould unhealthy child dietary intakes.
2.4.1.3 Proximal environmental determinants of child energy intakes:
parental determinants
Consistent with the above determinants, it is widely acknowledged that the proximal
environmental determinants of child energy intakes are related to choices that child
primary caregivers make with respect to feeding (Patrick & Nicklas, 2005; Rhee,
2008; Savage et al., 2007; Ventura & Birch, 2008). The younger the child, the more
important are caregivers feeding choices (Dattilo et al., 2012; Schwartz et al., 2011).

42
It is also acknowledged that parents are predominantly the primary carer(s)32. The
structure of the following review has been inspired by the model of division of
responsibilities developed by Satter (2000). This is further developed in section
2.4.2.
• Parents’ feeding choices of “what”
Parents are generally in charge of choosing the foods offered to their child, hence are
responsible for early exposure to a diversity of foods. This exposure responsibility
starts very early since food choices that pregnant and lactating women make for
themselves influence the food acceptance of their children (Mennella & Beauchamp,
1999; Mennella et al., 2001). In addition, the feeding mode mothers choose (i.e.
breastfeeding versus formula feeding) impacts on infant opportunities to develop a
diversity of food tastes. Similarly, at the introduction of solid foods, parents choose
to purchase the food available at home (i.e. visual exposure), as well as to prepare or
not and decide how to give it to their child. Besides taste exposure, these choices also
have consequences on the different types of sensory exposure that parents can
provide children with. Purchasing ready to eat meals (or eating out) is more likely to
expose children to salt and high fat diet and reinforce innate food preferences.
Choosing to cook meals may familiarise children with different smells, visualisation
of different types of foods, and different meal textures (Aldridge et al., 2009).
Cooking meals may even help children develop later preparation skills. For instance,
in two separate reviews on the fruit and vegetable intake determinants of 6–18 year
old children, Rasmussen and colleagues (Krolner et al., 2011; Rasmussen et al.,
2006) report positive correlation between fruit and vegetable intake and their
preparation methods (i.e. cooking mode), their availability at home and accessibility
as defined by the displaying mode (i.e. peeled, sliced).
32 For instance in the Longitudinal Study on Australian Children (LSAC), an average of 65% of children
from birth to four years old, received exclusive parental care. This proportion was inversely related
to infant age: from birth to 6 months, between 6 to 9 months and up to one year, exclusive parental
care was received by 82%, 70% and 50% of infants respectively (Harrison et al., 2009).
43
• Parents’ feeding choice of “when” and “where”
Parents are also responsible for deciding on a mealtime schedule, whether they share
meals, eat the same food, and eat at table or in front of the television. It has been
suggested that these decisions are key elements in child eating because mealtime
sharing is a social time which might provide an opportunity to talk, observe others
(Horodynski & Stommel, 2005) and model familiar individuals (i.e. parents,
siblings), especially if they eat the same food (Addessi et al., 2005; Harper &
Sanders, 1975; Salvy et al., 2008). Based on the few cross-sectional studies on school
children, healthy influences of family meals have been suggested on child diet
(Christian, Evans, Hancock, Nykjaer, & Cade, 2013; Neumark-Sztainer, Hannan,
Story, Croll, & Perry, 2003; Rasmussen et al., 2006; Skafida, 2013). Specifically,
increased intakes of fruit and vegetable have been reported. In contrast, television
watching during meals has been associated with unhealthy dietary intakes such as
increased energy intakes (Coon, Goldberg, Rogers, & Tucker, 2001). Specifically,
when controlling for parental education, television on during meals has been
associated with lower consumption of carbohydrates and fruit and vegetables and
greater consumption of more energy-dense foods, salty snacks and sodas. The cross-
sectional design of these studies does not, however, include the scope of specific
meal practices (i.e. meal sharing at the table, or television watching at meal time) that
might confound broader parenting behaviours. In addition, these studies have had
only a quantitative focus of the benefits of family meals excluding qualitative
exploration of the benefits of eating together (Skafida, 2013). Family meals which
are battle fields may not be as beneficial as happy ones.
• Parents’ feeding choices of “how”
As mentioned in section 2.4.1.2, there is a growing research literature exploring the
association between the way parents feed their child, and child dietary intakes
and / or weight. This literature has been mainly limited to the exploration of mono-
directional feeding interactions, in particular, parental control of child dietary intake
(DiSantis, Hodges et al., 2011), and has found inconsistent evidence. This
inconsistency could be related to a lack of consensus on how feeding is defined and
measured (Jansen, Daniels, & Nicholson, 2012). In particular, the way parents feed

44
their children has been inconsistently described as feeding practices, feeding styles or
feeding behaviours (Ventura & Birch, 2008). A summary is proposed below which
aims to clarify definitions of primary carer behaviours that may affect child eating,
and the corresponding measures, which will be used in the thesis.
This domain of research appears to be largely dominated by work conducted with
Caucasian schoolchildren from English speaking countries. This limits generalisation
of results and transferability of validated tools to other populations and age groups.
Also, research examining the relationship between caregiver feeding and children’s
eating/weight is largely cross-sectional, that may preclude conclusions about the
directions of relationships and causality. In addition, the relationships examined are
between feeding practices and either dietary intakes or body weight, but rarely both,
making comparisons between studies difficult.
Definitions
Feeding practices are strategies that parents use in a specific context when feeding
their children (Ventura & Birch, 2008). They are the expression of parental choices
about when and how they should feed their children, given a certain context, and
about which food they should give to their child.
Feeding styles are the ways in which parents interact with their child when feeding,
and are embedded within a larger parenting style of child rearing (Hughes, Power,
Orlet Fisher, Mueller, & Nicklas, 2005; Ventura & Birch, 2008). Research in this
specific area goes beyond the definition of feeding practices related to child dietary
intake and obesity (see above) as it explores parenting determinants of child eating
and obesity. Feeding styles overarch feeding practices (Hughes et al., 2005; Rhee,
2008) and theoretically, are considered more stable traits than feeding practices as
they are less context-related (Ventura & Birch, 2008). Feeding styles and their
measurement are out of the scope of this PhD thesis so will not be further expanded
upon.
Measures of feeding practices
The most widely used tool to measure feeding practices is the self report Child
Feeding Questionnaire (CFQ) developed by Birch and colleagues (2001) (Hurley,

45
Cross, & Hughes, 2011; Jansen et al., 2012). This questionnaire includes 31 items
grouped into seven scales, of which three measure specific feeding practices: (i) food
restriction, (ii) pressure to eat and (iii) intake monitoring. While the food restriction
and pressure-to-eat scales are more often used to assess parental control over child
feeding, the intake monitoring scale does not appear to have been explored as
extensively33. Thus, it is not expanded upon here. The restriction scale includes eight
items which address simultaneously caregivers’ control of child intake of sweet
foods, and use of food rewards. The pressure to eat scale includes four items which
all address parental practices of forcing a child to eat. Both of these scales are 5-point
Likert scales, ranging from 1-Disagree to 5-Agree.
The CFQ was initially validated by Birch et al. (2001) on mid-30s American
Caucasian and Hispanic parents of 5–11 year old children. More recently, its
reliability and validity have been tested on younger children in two other
populations. Powers and Boles (2010; 2006) used the CFQ with slightly younger
Afro-American mothers (mean age 27.9 +7.67) of 2–5 year old children. They
questioned the validity of this questionnaire in other cultures given the low reliability
of the pressure-to-eat scale (alpha= 0.58) (Boles et al., 2010; Powers et al., 2006).
Conversely, Polat et al. (2010) found that the CFQ construct was reliable in Turkish
35-year-old mothers of 2–11 year old children.
Overall, cross-sectional studies based on the CFQ measurement tool have shown that
pressure to eat and restriction work against improving the quantity and quality of
dietary intake (Faith, Scanlon, Birch, Francis, & Sherry, 2004; Hurley et al., 2011),
and can be described as non-responsive feeding practices (McPhie, Skouteris,
Daniels, & Jansen, 2014). However, evidence is equivocal when considering body
weight or dietary intake as the outcome of interest, and across various age groups.
Ogden, Reynolds and Smith (2006) have argued that the CFQ stigmatises control as
a negative strategy. This overlooks the potential positive role of caregivers’ control
on the obesogenic environment. This absence of distinction between positive and
negative control provides one explanation for inconsistent results. Thus, based on a
33 For instance, Ventura and Birch (2008) do not mention it in their review of literature.

46
cross-sectional study of 297 English parents of children aged between 4 and 11,
Ogden and colleagues (2006) validated a new self-report questionnaire which
expands the concept of parental control into two distinctive constructs: overt and
covert controls. Overt control (4 items) can be detected by the child and to some
extent corresponds to the feeding practices described above (i.e. restriction,
pressure). Covert control (5 items) is not detected by the child (e.g. avoiding
purchasing unhealthy foods) and measures the control over the exposure to unhealthy
foods. Both of these constructs are measured on a 5-point Likert scale ranging from
1-Never to 5-Always. From their validation study, Ogden et al. (2006) reported that
unhealthy snacking was inversely34 predicted by covert control but not by overt
control. Conversely, healthy snacking was to a lesser extent positively predicted by
overt control but not by covert control35. The authors suggested that covert and overt
controls should be included into a broader conceptualisation of control, and
complement the CFQ.
It is worth noting that this growing area of research on child-carer influences has
been largely dominated in the past 30 years by the quasi-experimental studies
conducted by Birch and colleagues on small groups of pre-school children from the
Pennsylvania State University day-care centre. In addition, it has focused on mono-
directional feeding interactions, leaving aside the two previous key pathways of
influence of parents on their child: namely, exposure and modelling. As seen above,
Ogden et al. (2006) consider the concept of covert control of unhealthy food
exposure. Musher-Eizenman and Holub (2007) argued that feeding practices should
not be restricted to those described by the CFQ. Specifically, they argue that parental
modelling, exposure to new food and teaching children about nutrition should also be
addressed as feeding practices. Thus, they developed and validated the
Comprehensive Feeding Practices Questionnaire (CFPQ) on 152 American
Caucasian mothers of 1.6 to 8 year old children. This questionnaire includes 49 items
grouped in 12 scales from which parental modelling for healthy eating, the extent to
which healthy foods are available at home, as well as the above feeding practices are
measured. In addition, a clear distinction is made between the use of restriction and
34 Beta = -0.36, p=0.0001, accounting for 12% of the variance. 35 Beta = 0.19, p=0.001, accounting for 4.3% of the variance.

47
the use of food as a reward. Despite their apparent relevance, these tools do not seem
to have been extensively used (Hurley et al., 2011), leaving the definition of feeding
practices to the more commonly used constructs, namely pressure-to-eat and
restriction. In order to avoid this limitation and to remain consistent with the
previous sub-headings, the term feeding choices will be used across this PhD thesis
and will include choices related to food exposure, modelling and social interactions
when feeding. The latter includes the commonly used feeding practices.
Lastly, it is also worth noting that mealtime is often approached with a limited
nutritional perspective that often ignores the social dimension of associative learning
(Skafida, 2013).
2.4.1.4 Distal environmental determinants of child eating
While parents are key actors influencing child eating and are responsible for
controlling the home food environment, they are not solely responsible for children’s
eating environments (Benton, 2004; Butland & Britain, 2007; Schwartz & Puhl,
2003). As the child grows, he/she develops other eating interactions with a broader
environment (e.g. day care, school). In addition, it is acknowledged that structural
macro-economic changes in the organisation of societies have been playing an
important role in the development of the obesity epidemic (French et al., 2001;
Lobstein et al., 2004). For instance, some authors have argued that the obesity
epidemic, including in Australia, is an adaptation to economic deregulation36
resulting from political choices (Banwell et al., 2008; Friel, 2009; Qvortrup, 2005;
Sassi & Devaux, 2012; Swinburn et al., 2011). Specifically, it is suggested that a
deregulated food market, agricultural policies and socio-economic choices with
respect to food supply, availability, advertisement, and pricing trends have shifted
people towards unhealthy life choices (e.g. convenience food, car transportation)
(Banwell et al., 2008; 2001; Friel, 2009; Story et al., 2008)37. It has also been argued
that structural changes in labour organisation have increased time pressure on daily
36 Deregulation is understood as a decrease in government control over market forces.
37 Similarly, societal choices with respect to television, automobile transportation, urbanisation and
occupational activity trends have shifted physical activities towards more sedentary lifestyles (French
et al., 2001).

48
life activities (e.g. cooking, transportation, child rearing) and have contributed to this
unhealthy shift (Banwell et al., 2008).
The following review expands progressively on more distal environmental
determinants such as those related to other child-carer and peer interactions and those
related to parental capacity to cope with the broader environment in which they are
embedded.
• The growing importance of time constraints
It is also argued that employment of both parents of most OECD families have
decreased the time mothers spend with their children in the past decades (Banwell et
al., 2008; Jaumotte, 2003; Mindlin, Jenkins, & Law, 2009). As a result, child care
responsibility, including feeding responsibility, has been increasingly shared with
other child-carers (Adema & Thévenon, 2008; Harrison et al., 2009). Approximately
50% of Australian infants over 12 months of age received non-parental childcare in
2003 (Harrison et al., 2009). In many cases where meals are not provided by child
care facilities, it could be argued that parents are still responsible for “the What”
they provide in lunchboxes, for instance (Kelly et al., 2010). In contrast, parents
cannot control caregivers’ feeding perceptions, beliefs or practices, hence are not
always in a position of choosing “the When”, “the Where” and “the How” their
children are fed. Including such influences on child feeding implies considering a
level beyond the family setting in trying to understand and ultimately prevent child
obesity.
Another acknowledged consequence of this time constraint is an observed declining
amount of time spent in meal preparation, counter-balanced by increased use of
ready-to-eat meals, either in restaurants or from pre-packaged food sections of
grocery stores, and using quick-cooking devices such as microwave ovens (Banwell
et al., 2008; French et al., 2001; Grzywacz, Tucker, Clinch, & Arcury, 2010;
Monceau, Blanche-Barbat, & Echampe, 2002; OCDE, 2011; Patrick & Nicklas,
2005). This increasing trend over the past decades may be an explanation of the non-
transferability of cooking skills across to new generations, making young adults less
confident in cooking meals from scratch, and more dependent on ready-to-eat meals
(Winkler & Turrell, 2010).

49
• The influence of information and marketing
Parents remain free to choose the foods they purchase. However, making appropriate
nutritional choices is not an easy task in obesogenic environments. First, parents
receive confusing messages from their environment (Banwell et al., 2008). On the
one hand, healthy eating is advocated by health departments (Department of Health
and Ageing, 1998; Hercberg, Chat-Yung, & Chauliac, 2008), while on the other
hand, the definition of what is healthy is unclear and is often not supported by the
food environment to which parents are exposed. For instance, parents reported
respectively in Australian and Swedish focus groups, that it is difficult to distinguish
between healthy and non-healthy pre-packaged food (Hesketh, Waters, Green,
Salmon, & Williams, 2005), and that contradictory media publication confused them
(Stenhammar et al., 2012). Moreover, education institutions (e.g. schools) which are
key learning places and are expected to show good examples, may paradoxically
support negative feeding choices such as using food as a reward, negative social
interaction at meal times, child peer pressure and stocking fast food in school
canteens (Hesketh et al., 2005).
Parents also face intrusion of the obesogenic environment into their home through
food marketing. There is evidence that “extra foods” 38 also called non-core foods are
most often marketed towards children, more so than “healthy” foods also called core
foods (Hastings et al., 2006; Kelly, Bochynska, Kornman, & Chapman, 2008; Kelly,
Smith, King, Flood, & Bauman, 2007). There are also suggestions that school
children exposed to food marketing request their parents to purchase food they have
seen advertised, hence influencing children’s consumption (Hastings et al., 2006).
What is more, these “extra foods” are marketed in ways that suggest fun and taste.
This positive perception contrasts with a common interpretation of a healthy diet
which distinguishes “healthy or good foods” from “bad but palatable foods”, and
suggests limiting use of the latter (Birch & Fisher, 1998). As a result, with all good
intentions, parents may adopt overtly restrictive practices towards “bad” foods,
38 Defined as other foods which are not part of the main five food groups and which should be eaten
sometimes or in small amounts (Department of Health and Ageing, 1998)
50
which have been shown to potentially be counterproductive, particularly with regard
to older children (Faith et al., 2004; Hurley et al., 2011).
• The influence of parental socio-economic position and family
composition
Although inconsistencies have been observed in the association of Socio-Economic
Position (SEP) and adiposity in school children, overall it is acknowledged that the
combined impact of social changes, previously described, is unequally experienced
across familial SEP (Glickman et al., 2012; Knai, Lobstein, Darmon, Rutter, &
McKee, 2012; Lakshman, Zhang et al., 2013; Lee, 2011; Morley et al., 2012; Sassi &
Devaux, 2012; Shrewsbury & Wardle, 2008; Story et al., 2008; Wang & Lim, 2012).
Overall, an inverse association between familial SEP and adiposity in school children
of Western developed countries, including Australia, has been suggested
(Shrewsbury & Wardle, 2008). However, pathways through which familial SEP
influences child adiposity are unclear as associations with SEP depend upon the age
and gender of the child, culture as well as the measure of SEP (e.g. education,
income, occupation)39 (Shrewsbury & Wardle, 2008). Sobal (1991) suggested that
education, income and occupation are different pathways to the development of child
adiposity. Education would be related to obesity through knowledge and beliefs and
would (i) make individuals more aware of overweight issues, and (ii) provide them
with intellectual capacity to be informed. It appears that several studies in Australia
are supporting this pathway (Ball, Crawford, & Mishra, 2006; Cameron et al., 2012;
McLeod, Campbell, & Hesketh, 2011; Turrell & Kavanagh, 2006). Income would be
related to overweight through food access: lower incomes provide fewer options in
food access and choices (Sobal, 1991). This pathway is supported by the differential
evolution over the past decades of food prices in western countries which had led
families under budget constraints to purchase less healthy foods (Burns, Sacks, &
Gold, 2008; French et al., 2001). In Australia, Burns et al. (2008) reported that
between 1989 and 2007, core foods prices have risen at a higher rate than overall
food prices. In addition, the price of specific core foods has risen at a higher rate than
39 Shrewsbury and Wardle (2008) have reported that familial SEP has been more often measured by
parental education, followed by occupation, income, composite measure of SES and neighbourhood
SES.

51
the price of their parent non-core foods (e.g. bread versus cakes and biscuits) and
even in some cases the price of non-core foods has risen at a lower rate than overall
food prices (e.g. milk versus fruit juices and soft drinks). These Australian
observations are in line with reports from the USA and France of energy dense foods
being cheaper per calorie (Drewnowski & Darmon, 2005; Drewnowski & Specter,
2004; Monsivais, Aggarwal, & Drewnowski, 2010; Mwanri et al., 2012). The last
pathway that Sobal (1991) suggested is occupation. Sobal (1991) argues that
occupation influences lifestyle because those with a higher status occupation are
more in control of their work time and schedule. Hence, they would be more inclined
to take time preparing meals or exercise (Strazdins et al., 2011). Finally, these three
pathways of influence of SEP are consistent with observation of unequal prevalence
of overweight across social groups. The more vulnerable are those who cumulate a
low level of education, with high budgetary and time constraints. It appears that
single parent families are facing at least one of these constraints and have also been
reported in Australia to be at increased risk of raising an overweight child40 (Byrne,
Cook, Skouteris, & Do, 2011).
2.4.2 Programme theories of child obesity prevention: towards
identifying solutions
The previous section has demonstrated that determinants of child dietary intakes are
numerous and are embedded in multilevel and cumulative spheres of influences. In
response to this complex interplay of determinants, it is widely acknowledged that
programme theories developed to tackle child energy intakes, hence child overweight
prevention, should be underpinned by ecological models (Butland & Britain, 2007;
Davison & Birch, 2001; Gill et al., 2010; Kumanyika et al., 2002; Lobstein et al.,
2004; Story et al., 2008). Thus, it implicitly assumes that multi-setting approaches,
hence programmes with multilevel interventions (i.e. individual and environmental)
are needed to tackle childhood obesity (Butland & Britain, 2007; Davison & Birch,
2001; de Silva-Sanigorski & Economos, 2010; Gill et al., 2010; Glanz et al., 2008;
Kumanyika et al., 2002; Lobstein et al., 2004; Story et al., 2008).
40 Single families versus dual families and overweight or obesity in 4–9 year old Australian children
OR=1.60 95%CI[1.25-2.05}

52
It is also acknowledged that a life-long approach to prevention should be taken with
specific interventions adapted to development stages of individuals (Butland &
Britain, 2007; Esposito et al., 2009; Hector et al., 2012; Savage et al., 2007; Waters,
Swinburn et al., 2011). Indeed, as the child grows some behaviours are acquired,
hence some determinants which were interpersonal determinants become
intrapersonal determinants. In addition, child interpersonal determinants are no
longer exclusively related to parents but also to other social interactions.
As a result, if the goal is to prevent childhood obesity, the next stage in the planning
cycle (Figure 3) requires defining both intervention objectives to modify individual
behaviours and the environments of individuals, and process objectives to implement
all the necessary interventions.
Given the complexity of developing solutions with such an ecological and life-course
perspective, no country has yet developed such a programme for obesity prevention
(Gill et al., 2010; Swinburn et al., 2011). Although community-based approaches are
not synonymous with whole ecological approaches, as they do not cover
intrapersonal influences and global drivers, they have been considered promising
prevention avenues because they have been associated with decreased BMI z score
(Bleich, Segal, Wu, Wilson, & Wang, 2013; de Silva-Sanigorski & Economos, 2010;
Gill et al., 2010). For instance, the EPODE (“Ensemble Prévenons l’Obésité des
Enfants”)41 programme (Borys et al., 2011) and the Sentinel Site for Obesity
Prevention42 (Bell, Simmons, Sanigorski, Kremer, & Swinburn, 2008) have managed
to tackle overweight risk from 6 months of age to adolescence, by involving families,
childcare services, schools, and community representatives in the definition of
priorities to address, objectives and strategies to achieve the latter. However, few
community-based prevention programmes with a life-long perspective have been
reported (Bleich et al., 2013; Simmons, Borys, & Swinburn, 2010).
41 Together let’s prevent childhood obesity. Initially developed in France, the EPODE programme
logic model has become the most widely used logic model and is applied in several countries
including Australia (Borys et al., 2011). 42
This includes several community-based obesity preventions supported by the Victorian State
Government in Australia (Haby, Doherty, Welch, & Mason, 2012).

53
In contrast, most published obesity prevention programmes, have reduced their
objectives to individual behavioural change and until recently, most were restricted
to school settings. Thus, the early stage of overweight development43 and the broader
environmental determinants have been set aside in most published prevention
programmes (Swinburn et al., 2011; Waters, de Silva-Sanigorski et al., 2011).
Funding feasibility issues are acknowledged to be a major reason for this occurring
(Denney Wilson, Campbell, Hesketh, & de Silva Sanigorski, 2011; Swinburn & de
Silva-Sanigorski, 2010). This is of concern as it has been suggested that interventions
that focus on individual behaviour change (i.e. downstream approach) are more
likely to increase health inequalities than interventions with a focus on structural
changes (i.e. upstream approach) (Lorenc, Petticrew, Welch, & Tugwell, 2013).
Although there are a few instances where evidence of successful programme has
been recorded, it is worth noting that some of the intervention components that
should be implemented at school age are yet known (Waters, de Silva-Sanigorski et
al., 2011). In contrast, those related to preschool age children have been considered
to require further research (Ciampa et al., 2010; Khambalia, Dickinson, Hardy, Gill,
& Baur, 2011; Waters, de Silva-Sanigorski et al., 2011). One explanation for the lack
of evidence with respect to successful interventions aimed at preschool children is
that the necessity to start prevention earlier than school age has only been recently
acknowledged (Anzman, Rollins, & Birch, 2010; Baidal & Taveras, 2012; Esposito
et al., 2009; Glickman et al., 2012; Hector et al., 2012). This acknowledgment relies
on the observations of early onset (i) of overweight (Department of Health and
Ageing, 2008; WHO, 2012) and (ii) overweight risks such as early exposure to poor
quality diet,44 alongside the evidence of early food preference development and self-
regulation capacity from work dating back several decades (see section 2.4.1).
Nevertheless, it is increasingly acknowledged that components of a programme
theory which specifically address infant eating should be guided by the objectives of
normal weight gain, child self-capacity regulation maintenance and healthy food
43 Weight gain in infancy, food preference development and self–regulation maintenance, as
previously developed. 44
(Chan, Magarey, & Daniels, 2010; Fox, Pac, Devaney, & Jankowski, 2004; Jensen et al., 2012; Koh,
Scott, Oddy, Graham, & Binns, 2010; Sherry, Mei, Scanlon, Mokdad, & Grummer-Strawn, 2004;
Webb et al., 2006)

54
preference development. This places pregnant women and child-carers in a central
position to prevent overweight risk development of infants (Anzman et al., 2010;
Esposito et al., 2009; Rhee, 2008).
Although it appears that no model has been tested to address overweight prevention
at this stage of development (Lakshman, Paes et al., 2013), the “Division of
responsibilities” principles suggested by Satter (2000) seem highly relevant here.
These principles postulate that “Parents are responsible for the what, when, and
where of feeding. Children are responsible for the how much and whether of eating.”
(Satter, 2000, p. 33). Specifically, letting the child decide when he/she needs food or
has had enough food is hypothesised to preserve their innate self-regulation capacity.
In addition, offering a diversity of foods (i.e. exposure) with positive rather than
negative social interference (i.e. no coaxing, healthy role modelling), is hypothesised
to help the child develop food preferences beyond innate predispositions. These
principles are the pillars of the “trust model” developed by Satter (Eneli, Crum, &
Tylka, 2008) and could be included in an effect theory of a programme as defined in
section 2.2.2.
Anticipatory guidance has been proposed as an effective strategy to educate parents
in this direction (Dattilo et al., 2012). Anticipatory guidance is used in clinical
settings, where a health expert (e.g. dietitian, psychologist, nurse, paediatrician) takes
advantage of a health visit to inform a patient about “what to expect and how to deal
with unwanted or challenging events or conditions related to developmental stages”
(Nelson, Wissow, & Cheng, 2003; Pridham, 1993, p. 49). Anticipatory guidance
takes its foundation in the Health Belief Model, an individual theory for health
behavioural change (Rosenstock, Strecher, & Becker, 1988)45. Although anticipatory
guidance appears to be a promising approach and has been recommended by the
American Academy of Pediatrics (American Academy of Pediatrics, 2003), it has
been rarely used in published trials of childhood obesity prevention (Campbell et al.,
45 This theory postulates that for individuals to engage in change, they need to perceive the extent to
which they are susceptible to be affected, and the benefits they will draw from changing and
overcoming barriers to change (Bartholomew et al., 2009; Glanz et al., 2008).

55
2008; Daniels et al., 2009; French et al., 2012). Nevertheless, it could be part of a
process theory of a programme as defined in section 2.2.2.
2.5 The need for broadened evaluation framework of early
childhood obesity prevention programmes
So far, the previous review has reported on methods of planning a health promotion
programme that leads to approaching health issues with an ecological perspective
and the specification of a programme theory. This programme theory includes both
an effect and a process theory and constitutes the foundation on which any evaluation
should be based. Application of this methodological approach to the planning of
childhood obesity prevention has highlighted the multilevel determinants and agrees
with an ecological approach of prevention. However, prevention programmes with
ecological approaches are complex to implement. This complexity provides one
explanation as to why (i) no single complete model for a complete multilevel
approach of actions has yet been found (Swinburn et al., 2011), (ii) promising
published multilevel interventions are scarce (Borys et al., 2011; Economos et al.,
2007; Haby et al., 2012), and (iii) to date most prevention programmes of childhood
obesity have targeted individual behavioural change (Waters, de Silva-Sanigorski et
al., 2011).
An additional explanation to the few childhood obesity prevention programmes with
an ecological approach is that the theoretical basis of prevention programmes (i.e.
logic model) is not systematically reported by programme developers (Waters, de
Silva-Sanigorski et al., 2011) nor in systematic reviews (Waters, Hall et al., 2011).
For instance, only two published logic models of childhood obesity prevention
programmes were found during the course of this review (Simmons et al., 2010; Van
Koperen et al., 2013). However, the programme theory or logic model provides
useful information about what has been tested and how it has been tested and thus
helps in reproducing the programme in other settings or populations (Anderson et al.,
2011; Waters, Hall et al., 2011). In addition, the objectives defined in the programme
theory are the comparators against which programme achievement are evaluated,

56
hence guiding evaluation approaches with a balanced focus between internal and
external validities. As in the broader health promotion domain (see section 2.3.3),
and not unrelated to the focus of interventions on individual behaviour, published
evaluations of childhood obesity prevention have increasingly relied on RCTs
(Avenell & Goode, 2008; Connelly, Duaso, & Butler, 2007; Waters, de Silva-
Sanigorski et al., 2011). For instance, the proportion of Australian childhood obesity
prevention studies based on RCTs increased from one out of four studies up to 2007,
to six out of eight studies between 2008 and 201046 (Waters, de Silva-Sanigorski et
al., 2011). However, few of these RCTs in childhood obesity prevention report
process evaluation alongside effectiveness outcomes (Branscum et al., 2013; Klesges
et al., 2008; Waters, de Silva-Sanigorski et al., 2011; Waters, Swinburn et al., 2011;
Wolfenden et al., 2010). Therefore, the published evaluations to date have largely
focused on outcomes only, leaving the context and process of implementation largely
undocumented. This has limited the possibility to interpret and generalise from the
results obtained in these studies. As Bartholomew et al. state:
“Measuring and attributing outcomes to a programme, without insight into
whether a programme was delivered, what programme was delivered, and how
it was delivered is a black box evaluation. A black box evaluation contributes
little to any field because the evaluator does not know why a programme
succeeded or failed” (Bartholomew et al., 2010, p. 485).
As in the broader health promotion domain, such observations have led to
acknowledge the need for broader evaluation approaches of obesity prevention
programmes, hence adopting a balanced focus in obesity prevention evaluation
between internal and external validity (Klesges et al., 2008; Kumanyika et al., 2010;
Linnan & Steckler, 2002; Rychetnik et al., 2002; Swinburn et al., 2007; Waters,
Swinburn et al., 2011). Additional information needs to be included in the evidence
in order to consider the entire system involved in determining childhood obesity and
understand how an intervention can work in real world conditions (Glasgow et al.,
1999; Moore & Gibbs, 2010; Rychetnik et al., 2012). As a result, there is also a need
46 This specific count is not provided in the paper, but has been made by the PhD candidate from this
paper.
57
in obesity prevention for evaluations that simultaneously address intervention
effectiveness (effect evaluation), as well as identification of for whom and under
which circumstances the intervention has been implemented (process evaluation).
2.6 Application to the evaluation of the NOURISH RC T
This PhD thesis proposes an application of these key evaluation principles to the case
of the NOURISH research programme (Daniels et al., 2009). The primary evaluation
framework developed by chief investigators relied on an RCT design to measure the
efficacy of the intervention developed for the trial (Daniels et al., 2009).
Nevertheless, data on the implementation process were collected during the
implementation, which took place between early 2008 and mid 2011 in Brisbane and
Adelaide. Queensland University of Technology (QUT) and Flinders University co-
directed this research programme.
The NOURISH RCT has been registered on the Australian New Zealand Clinical
Trials Registry (ANZCTR)47 as a trial for preventing childhood obesity and was
funded by a National Health and Medical Research Council Primary Health Care
Grant. The trial identified maternal early feeding choices48 as a key determinant of
obesity in Australian children. Its main intervention objectives were to change these
key determinants early in the life of the child, to prevent the development of obesity
at five years of age (Daniels et al., 2009). The author of this PhD thesis was not
involved in the development of this research, hence is an external evaluator.
The central research question of this PhD thesis is: “How does the process
evaluation help improve understanding of the generalisability and applicability
of the results of the effect evaluation of the NOURISH research programme,
and in doing so, help identify key aspects that need to be considered when
translating this research into the real world?”
47 reference: ACTRN12608000056392.
48 The NOURISH protocol paper (Daniels et al., 2009), used “feeding practices”. However, for
consistency with the present literature review and terminology used across this research, “feeding
choices” is used instead. This includes feeding practices and means implemented by parents when
interacting with children at feeding time.

58
Analysis of this question is conducted based on a secondary evaluation of the
NOURISH research programme by, first, revisiting the primary evaluation
framework of the NOURISH research programme (Chapter 3), second, applying this
new evaluation framework. Specifically, separate effect and process evaluations are
conducted in Chapters 4 and 5 respectively. Then, selected maternal outcomes of
Chapter 4 are explored in light with findings from Chapter 5 in Chapter 6, in order to
address the influence of the process on selected outcomes observed in the
intervention group. Chapter 7 summarises the extent to which the process evaluation
helped interpreting the effect evaluation and provides recommendations or further
research activities in order for the NOURISH programme to be later translated in
practice.

59
Chapter 3 Revisiting the evaluation framework of the
NOURISH RCT
3.1 Introduction
The literature review in the previous chapter highlights three key dimensions of
childhood obesity prevention.
First, childhood obesity prevention is complex since both macro- and micro-level
determinants of obesity need to be addressed simultaneously and adapted to
developmental stages of individuals (Davison & Birch, 2001).
Second, although the use of RCT designs to evaluate prevention programmes can
address whether prevention programmes work in a “controlled” world, these designs
alone are limited in capturing their effectiveness in the real world (Green &
Glasgow, 2006). Thus, applicability and transferability of interventions implemented
within RCTs are uncertain in other contexts. Therefore, a need exists to integrate into
the evaluation of childhood obesity preventions, information that captures the
conditions (i.e. process) of the programme’s effectiveness within the real world. The
type of useful information that is required relates to the context and conditions of
implementation as well as to whom the programme is delivered (Glasgow et al.,
2003).
Third, simultaneously addressing effect and process evaluations is challenging as
they cover different aspects of programmes that address conceptual opposite
dimensions of programme validity. In turn, this implies using a range of evaluation
research methods that have been unequally valued across the multi-disciplines,
funding and publication of public health (Nutbeam, 1998; Patrick et al., 2008).
Nevertheless, it is increasingly acknowledged that a balance in evaluation research
focus needs to be found to benefit from both evaluations and to help scale up
successful interventions in populations. It has been suggested to distinguish between
the programme theory (i.e. plan) activities that are dedicated to change the behaviour
of concern (i.e. effect theory) and those that are dedicated to the implementation of

60
the intervention in the targeted population (i.e. process theory) (Issel, 2009). This
clarifies evaluation objectives that need to be addressed to translate obesity
prevention research into practice.
The aim of this chapter is to propose a secondary evaluation framework of the
NOURISH research programme (Daniels et al., 2009) that can address both
programme effectiveness and provision of information to help in the translation of
the NOURISH research into practice.
Section 3.2 reports on the methods used to broaden the primary evaluation
framework. It also provides the rationale for describing the NOURISH research
programme development following the four consecutive stages49 of a programme
development cycle (Figure 3). Section 3.3 details the reconstruction of the
NOURISH programme theory with a particular emphasis on the distinction between
effect and process objectives against which programme achievements will be
evaluated. Section 3.4 provides a brief description of the implementation of the
NOURISH research programme, in order to outline the broad context of the
NOURISH intervention. Section 3.5 discusses lessons learnt from the construction of
this secondary evaluation framework and concludes by revealing a summative
evaluation framework for the NOURISH programme research as well as specific
evaluation research questions addressed by this PhD thesis.
3.2 Methods
Given that the author of this PhD was external to the development of the NOURISH
research programme (i.e. external evaluator), the first step of this work was to gather
information that helped in terms of (i) comprehending the NOURISH research
programme goal, (ii) retrieving programme objectives (i.e. comparators), and (iii)
defining evaluation criteria to measure objective achievements. In the absence of a
single document reporting on the NOURISH programme development, the second
step of this work consisted on an a posteriori reconstruction of the NOURISH
49 These stages are: needs assessment and programme goal definition, programme planning,
programme implementation, and evaluation.

61
programme theory as recommended in the literature (Bartholomew et al., 2010; Issel,
2009; Nutbeam, 1998; Renger & Titcomb, 2002). This a posteriori reconstruction
was guided by the general principles of the development of a health promotion
programme and by Issel’s programme theory conceptualisation (Bartholomew et al.,
2010; Green & Kreuter, 2005; Issel, 2009) reviewed in sections 2.2.1 and 2.2.2.
Thus, this reconstruction sought to determine the various theories underpinning the
programme activities and to define effect and process objectives of the NOURISH
programme.
This reconstruction was primarily sourced from written documents that the author of
this thesis could access. To address gaps in the accessed documentation, informal
discussions with the NOURISH principal investigator and research staff in Brisbane
were conducted as well as email enquiries to the NOURISH staff in Adelaide. The
principal investigator, who was also the principal supervisor of this thesis, received
several versions of this reconstruction and could correct it. Table 1 details the source
of information used to reconstruct the NOURISH programme. When discrepancies
occurred between staff recollections and written documents, the written document
version was used provided the document was an official document such as a
submitted grant application.
When this PhD started, few primary analyses of the NOURISH research programme
had been conducted. Thus, the description of the implementation stage of the
NOURISH programme has been mainly documented by the database analyses
conducted by the PhD candidate in collaboration with two research officers from the
Brisbane NOURISH team. The CONSORT Flow Chart presented in this chapter is
the product of this collaborative work conducted between March 2011 and October
2011. The contribution of the PhD candidate consisted of clarifying the flow of
NOURISH participants in accordance with recommendations for reporting RCTs
(Moher, 2010) (see section 2.3.1) and specificities of the NOURISH research
programme (e.g. consecutive sampling, intervention delivery format and multiple
data collection periods). This collaborative work also consisted of resolving
inconsistency issues between figures that had been extracted from two distinct
Access tracking databases managed independently in Brisbane and Adelaide (see

62
section 3.4.5). A parallel analysis conducted by the NOURISH research team led to
the publication of a paper that was not used for this research (Daniels, Wilson et al.,
2012).

63
Table 1: Sources of information used for the reconstruction of the NOURISH programme and its implementation
Needs assessment
Goal definition
Effect theory
Process theory
Pilot Implementation
National Institutes of Health (NIH) grant application (PHS 398/2590), 2004 � � � The Channel 7 Children’s Research Foundation grant application, 2005 � � Chan, L. (2005). BSc Honours Thesis – Positive feeding practices in very early childhood. Parental needs assessment. Flinders University of South Australia.
�
Notes on three focus groups conducted in February and March 2006 with a total of 11 mothers.
�
Application for approval of social or behavioural research involving human subjects dated 19/11/05
� � �
Undated notes on parent satisfaction questionnaires from the control and intervention groups included in the pilot study (estimated date: after April 2006 based on other document)
�
National Health & Medical Research Council (NHRMC) grant application (ID426704), 2006.
� � �
NHRMC grant application (ID497218), 2007 � � � Daniels, L., Magarey, A., Battistutta, D., Nicholson, J., Farrell, A., Davidson, G., & Cleghorn, G. (2009). The NOURISH randomised control trial: Positive feeding practices and food preferences in early childhood - a primary prevention program for childhood obesity. BMC Public Health, 9(1), 387.
� � � � �
NHRMC grant application (614240), 2009 � � NHRMC grant application (APP1002274), 2010 � � � Chan, L., Magarey, A., & Daniels, L. (2010). Maternal Feeding Practices and Feeding Behaviours of Australian Children Aged 12–36 Months. Maternal and Child Health Journal, 1–9.
�
Informal discussion with Chief investigator � � � Informal discussion with research staff � � Databases analyses by PhD candidate �

64
3.3 Reconstructing the NOURISH programme theory
3.3.1 Mapping the determinants of early childhood obesity, needs
assessment and goal setting
When the NOURISH programme was being first developed, determinants of
childhood obesity reviewed in section 2.4.1 had already been mapped on an
ecological model (Davison & Birch, 2001; Kumanyika et al., 2002). In addition,
based on research largely dominated by the quasi-experimental and observational
studies conducted by Birch and colleagues, it was increasingly acknowledged that
child food preferences were shaped by (i) repeated exposure to food with new
sensory characteristics; (ii) modelling others’ behaviour and (iii) physiological or
emotional associations when eating (see section 2.4.1.2).
To address childhood obesity prevention, NOURISH chief investigators decided to
specifically focus on the child eating development pathway and implemented a needs
assessment of knowledge and concerns of parents of children aged 12–36 months
(Chan, 2005). Results of this needs assessment, which was finally conducted with on
average 32.5 (+ 5.2) year old mothers, confirmed the hypothesis that there was room
in childhood obesity prevention for guiding parental feeding choices50 (Chan et al.,
2010). Child eating determinants on this specific pathway were mapped on the
following pictorial reproduced on Figure 4.
Although the focus at this stage appeared to be on parental feeding choices, the
ultimate goal was to impact the weight status of children at five years of age
“It is intended that weight status at five years of age will be the primary outcome in
longer follow up of the cohort, subject to further funding” (Daniels et al., 2009, p. 3).
50 The needs assessment addressed “feeding practices” that correspond to the definition in this PhD
of feeding choices (see Measures of feeding practices, p. 30).

65
Figure 4: “Key factors that influence the reciprocal relationships between parent feeding practices and infant feeding behaviour.” Figure title
and figure reproduced from Daniels et al., 2009, BMC Public Health, 9(1), 387, p. 3.51
51 Article distributed on Open Access which permits unrestricted use, distribution and reproduction in any medium, provided the original work is properly cited.

66
3.3.2 Planning for action: definition of effect and process objectives
and their measurement
Given the results of the needs assessment, it was hypothesised that a primary
prevention intervention providing guidance and support52 to mothers, with a specific
focus on feeding53, could be a key strategy in childhood obesity prevention.
As discussed in section 2.2.1, programme development is an iterative process, which
involves the assessment of feasibility issues with implications for final programme
planning and in particular inclusion criteria. Reporting on this iterative process of the
NOURISH programme planning would have made it unclear how the four process
components were addressed in the final plan. Thus, it was chosen to report on each
specific plan in a linear manner. As a result, measurement tools, the pilot study and
the final inclusion criteria are described at the end of this section. This is also
consistent with the sequences of a programme cycle as summarised in Figure 3.
3.3.2.1 The NOURISH effect theory: how can maternal feeding choices be
changed?
Consistent with Issel’s conceptual approach (Issel, 2009) (see section 2.2.2.1),
reconstructions of causal outcome and intervention theories were first addressed
separately and then articulated together to finally reveal the effect theory of the
NOURISH research programme. This process is described below and summarised in
Figure 5.
The causal theory of the key determinants of child food intake focused on the
maternal feeding choices, child food preferences, and child eating behaviour (see
section 2.4.1.2). It also included maternal characteristics as moderating factors of
maternal feeding choices, but did not include distal moderating factors (see section
52 This corresponds to one of the five areas of actions in health promotion suggested by the Ottawa
Charter. 53
As no national physical activity recommendation existed for under five year olds, it was decided
that the programme would only focus on a nutritional intervention, but would not include a physical
activity intervention.

67
2.4.1.4). In such a presentation of the causal theory, emphasis is placed on individual
behavioural change (Glanz et al., 2008).
The outcome theory was centred on the pathway between child food intake and child
weight status. However, these details were not available in the documentation and
information available for this research.
The intervention theory was underpinned by Satter’s “Division responsibility”
principles (Satter, 2000) (see section 2.4.2) that are the key foundation of the trust
model (Eneli et al., 2008).
“The trust model emphasizes the division of feeding responsibility between
caregivers and children and trust in the child’s ability to self-regulate food intake by
recognizing hunger, appetite, and satiety cues within the context of regular eating
patterns (i.e. pleasant and structured meals and snacks)” (Eneli et al., 2008, p.
2197).
Finally, the reconstructed effect theory, underlying the trial development, considered
that the risk to develop obesity at five years of age was predicted by: (i) poor dietary
intakes, as indicated by a low frequency and variety of fruit and vegetables, and a
high frequency of non-core food, (ii) as mediated by infant eating behaviour (i.e.
self-regulation capacity) and infant food preferences, and (iii) which were in turn
influenced by maternal feeding choices. In addition, maternal feeding choices were
considered to be moderated by maternal age, existing health conditions (including
BMI), participants’ social, economic and cultural background (including education),
and pre-existing beliefs about feeding choices.
Consistent with the definition of this effect theory, NOURISH investigators
postulated that enhancing parent knowledge, skills and confidence to initiate and
maintain positive feeding choices (intervention objective) would positively impact
maternal feeding choices (Figure 5, impact A). That would in turn influence the
development of child food preferences and eating behaviour (Figure 5, impacts B),
leading to healthier dietary intakes (Figure 5, impact C). This was then considered to
potentially have an influence on the weight status of children (Figure 5, outcome D)
at five years of age (Daniels et al., 2009).

68
Age, existinghealth conditions, participants’social, cultural & economicalbackground, beliefs about feeding strategies.
Maternal feedingchoices
INTERVENTION
fostering Satter’s principles †
Intervention theory
Child food preferences
Causal theory of food intake in preschool children
Child food intake
Weight status or BMIz scores of
childrenChild eating behaviour
= Mediating factors**
= Moderating factors*
Outcome theory
B
A
C D
* Moderating factors are factors that have the capacity to exacerbate or reduce childhood obesity
** Mediating factors are intermediate factors sitting between the causal factors (i.e. maternal choices) and childhood obesity, and are
necessary for childhood obesity to occur.
† “ Parents are responsible for the what, when, and where of feeding; children are responsible for the how much and whether of eating”
(Satter, 2000, p 3)
‡ include intervention impacts on: (i) maternal feeding choices, (ii) child food preferences, (iii) child eating behaviour and (iv) child food
intake
‡ ‡ includes intervention primary outcome
Final effect ‡ ‡
Intermediate effects ‡
Figure 5: The NOURISH effect theory modified from Issel, L. M. (2009). Health program planning and evaluation: A practical, systematic
approach for community health (2nd ed.): Jones & Bartlett Learning, p. 181. Permission reference: 197910110-0912.

69
The translation of the intervention objective into performance objectives was to
foster the enactment of Satter’s feeding principles by mothers: (i) “listen” to the
child’s hunger and fullness; (ii) offer healthy foods; (iii) limit unhealthy foods; (iv)
re-offer new foods neutrally; and (v) be a model.
To measure the achievement of these intervention objectives, NOURISH
investigators decided to design a Randomised Controlled Trial (RCT). This choice
was related to the research context. Firstly, few studies had explored the causal
pathway between parents’ feeding choices, child eating and weight status and so the
NOURISH research programme was designed to be an efficacy trial54.
3.3.2.2 The NOURISH process theory: how can the intervention be
implemented?
As developed in section 2.2.2.2, the process theory is concerned with planning the
logistical aspects and resources necessary to implement the intervention objectives.
Thus, the reconstruction of the process theory involved thinking through what the
chief investigators had planned in order to address the five intervention performance
objectives described above, and encourage targeted mothers to participate and apply
these key messages. In addition, the planning also involved thinking through the
process by which the programme would be implemented along with the choice of an
RCT design to evaluate the intervention effect.
In this section, process theory components of the NOURISH research programme are
described, using the structure identified in section 2.2.2.2 which involves four
components (i.e. implementation, adoption, reach, and maintenance) that are
considered in the regional context55 of the research programme (i.e. Adelaide and
Brisbane). Based on this description, a number of process performance objectives for
the NOURISH research programme are also defined.
54 See section 2.3.1.
55 Consistent with the structure proposed in section 2.2.2.2, Context is not addressed on its own but
through the four other components.

70
• Planning intervention delivery implementation
To address how Satter’s feeding principles would be fostered in first-time mothers,
chief investigators reported “a cognitive-behavioural approach [would] be used to
enhance maternal self-efficacy, competence and confidence to adopt program
recommendations” (Grant Application ID497218, 2007). In health promotion, a
cognitive-behavioural approach is an educational approach which attempts “to
provide knowledge, information and develop […] skills so that people can make an
informed choice” (Naidoo & Wills, 2009, p. 71).
Three focus groups with a small number of mothers56 were conducted between
February and March 2006 in South Australia57. Aims of these focus groups were to
identify the specific needs of first-time mothers with respect to a programme which
addressed feeding practices, as well as the content, format and timing of such a
programme. Anticipatory guidance was thought to be a relevant strategy to deliver
the intervention message to first-time mothers. Anticipatory guidance is the provision
of information to parents ahead of the potential development of the issues considered
(see section 2.4.2).
The content of this anticipatory guidance was largely based on the work of Birch and
colleagues and Satter’s work (see sections 2.4.1.2 and 2.4.1.3). In addition, Satter
(2000) argues that attachment is a key process in establishing maternal
responsiveness to child hunger and satiety cues (see section 2.4.1.3). Attachment is
the emotional bond that develops between the child and his/her caregiver, often the
mother (Ainsworth, 1979). Attachment theory describes how this bond develops and
its influence on child psychological development, character and habits: specifically it
describes three types of emotional bonds from which child behaviour develops. (i.e.
secure, ambivalent and avoidant attachment). Secured attachment is associated to
increased caregiver’s sensitivity to child cues (Ainsworth, 1979; Bakermans-
Kranenburg, van IJzendoorn, & Juffer, 2003). A child with a secure attachment to
his/her caregiver explores (e.g. tastes) freely while the caregiver is present. Thus, the
56 3, 5 and 3 mothers participated in three separate focus groups
57 Characteristics of these 11 participants and detailed results of these focus groups were not
available.

71
chief investigators decided that making mothers aware of the importance of this
emotional bond during the anticipatory guidance would help in reinforcing the
message related to trusting child hunger and satiety cues.
The initial format of the anticipatory guidance was similar to that of an existing
universal service provided to first-time parents in a primary care setting in South
Australia58, where the chief investigators were based at the time and where the
NOURISH project originated. As in the universal service, the initial plan was that the
information would be delivered in six fortnightly one to one hour and a half group
information sessions, to mothers of 6–10 month old infants. However, at some stage
in the development process, it was judged that there was also a need to support
parents with feeding toddlers. Thus, a second module of six one to one hour and a
half group information sessions was also developed to be delivered to first-time
mothers.
The first module would be delivered to mothers at a point when their baby was 4–7
months old and would introduce the contact with new foods. It was underpinned by
the principle that children learn to like as previously described in section 2.4.1.2. The
second module would be introduced at about 13–16 months and would cover the
division of responsibility developed by Satter (2000) (see section 2.4.2). The
messages would thus be delivered via a total of 12 sessions of one to one hour and a
half (i.e. 12–18 hours in total per group). This led to the process performance
objective for dose delivered of organising 12 group information sessions per
group of participants.
An information syllabus would be organised around the provision of these 12
information sessions, where each session would introduce a new message. The
succession of messages would progressively increase knowledge, and skills and
competence in achieving the five intervention performance objectives (see section
3.3.2.1). This implied that every session was important; hence, the process
58 A universal approach targets the population as a whole; in a universal approach, interventions are
designed to reach all the members of an eligible population. The existing universal service for young
mothers, delivered in South Australia by the Children Youth and Women’s Health Service (CYWHS),
did not cover feeding practices.

72
performance objective for dose received by any individual participant was set to
12 group sessions.
Various training strategies would be used during sessions: visual aids, group
interaction and provision of various written materials for the participants and other
child-carers59. In addition, all sessions would be similarly structured, with an
introduction to the session including a summary of the previous sessions,
identification of a key message in each of the sessions, interactive activities around
this key message, a conclusion to the session, and a set of additional activities to try
at home. The process of developing this syllabus does not appear to have been
formally documented but was undertaken by experienced paediatric dietitians.
Implementation of an anticipatory guidance approach meant that experts would
deliver the information (see section 3.3.2.1): it was decided that the information
sessions would be run by several teams of two composed of a dietitian and a
psychologist. The dietitian would provide specific expertise on food issues while the
psychologist would provide specific guidance on parenting and interactions with the
child during feeding time.
Finally, to some extent, as suggested by Green and Kreuter (2005) (see section
2.2.1), NOURISH investigators might have addressed some (i) predisposing, (ii)
reinforcing and (iii) enabling factors that trigger behavioural change in child feeding.
Indeed, provision of information is a predisposing factor. Similarly, activities to try
at home as well as potential interactions that the intervention generated between
participants and expert facilitators, other group members, their partner or other
carers60, are reinforcing factors. Lastly, availability of support from experts that
assisted mothers in their development of new skills, as well as ability for parents to
exchange with other participating mothers on their experience of activities to try at
home, are enabling factors.
59 This included a specific workbook for participants and their partner, and a summary workbook for
other child-carers. 60
This was expected to be obtained by other carers via the provision of specific written material.

73
Resources needed and feasibility of information delivery
In any study, it is necessary to adjust duration, sample size and inclusion criteria to
the objectives of the study, which in turn might be revised with respect to feasibility.
In the case of NOURISH, using an RCT design to test the “effect theory” implied the
involvement of two groups61, each large enough to provide sufficient power for group
comparison at the end of the trial. This necessarily large number of mothers required
might have guided the development of an approach ensuring concomitantly (i) that a
substantial fraction of the target audience could receive the full dose of information,
and (ii) that information sessions would be consistently and fully delivered across
groups, within the limited time-frame of the first funding round (2008–2011). Using
a group session format involving about 16 mothers, run fortnightly by multiple
facilitator and co-facilitator pairs seems to be a feasible way to manage the large
number of recipients to reach. However, it may have created a difficulty with respect
to fidelity across facilitators and groups. To address this issue, the dietitian and
psychologist who developed the programme would provide a full-day training and
standardised material (standard PowerPoint presentation) to facilitators and co-
facilitators. Teleconferences would also be planned for solving issues. However, it
appears that specific performance objectives relating to fidelity were not formally
documented in the course of developing the intervention.
• Planning intervention adoption
This component of process theory centres on whether the intervention delivers
useful, acceptable and usable information. For the intervention to be usable by
participants, accessibility is a prerequisite. Limited information was available
regarding how this component was addressed in developing the programme, and no
adoption performance objective was stated in the documentation available.
Chief investigators chose to adopt a universal approach conducted in English. Hence,
content delivery was not tailored to meet the needs of only one particular group (e.g.
non-university educated, young mothers). Since dealing with specific needs was not
61 As opposed, for instance, to a before/after study where subjects are their own control, thus
making only one group necessary.

74
possible in this approach, unhealthy infants, mothers with a specific psychological
condition or recipients of intensive parenting support were excluded. In addition,
recipients were required to have a good working knowledge of English. Thus, non-
English speakers were also excluded from the project.
While the information content was universal, having recourse to psychologists and
dietitians with paediatric experience to deliver the information can be seen as
providing for the ability to respond to specific questions from participants, hence
assisting to meet not only the generic needs of participants, but also some of their
more specific needs.
• Planning intervention reach
This component of process theory centres on how the programme is organised to
recruit and involve a large number of participants. This requires addressing not only
the issue of reaching participants at both the enrolment and the delivery phases, but
also identifying realistic strategies to address reach with a large number of
participants. The ways in which these two issues were addressed are described here.
As sample size calculations are based on the number of mothers needed to conduct
final analyses, a chronological description of the reach process is provided, along
with a description of the strategies planned to attract, engage and retain participants
at each stage. Performance objectives for the reach process are also identified.
Calculating the sample size was a difficult issue as there had been no such prevention
intervention on Australian children under two years old. Thus, there was no report of
intervention effect size with respect to changes in weight-for-length z-score or in
dietary intakes, on which to base sample size calculation. The sample size calculation
assumed an 80% statistical power and a 5% type-I error (two-tailed) to detect
meaningful clinical differences in the prevalence of behaviours for positive feeding
choices between the control and the intervention groups. The aim was to have 265
participants per group for the final analysis after two years (Daniels et al., 2009).

75
Because, participants would have been randomly allocated to each arm, an equal
completion rate of 65% was assumed62. Thus, the overall enrolment performance
objective was 820 participants, 410 in each arm. To recruit these 820 participants, a
two-stage enrolment strategy (Recruit-1 and Recruit-2, see below), hence a
consecutive sampling framework, was planned for which an overall 42%
recruitment performance objective was assumed (Daniels et al., 2009). Overall,
this implied approaching approximately 1950 eligible mother–infant dyads (820 x
100/42).
The strategy adopted for the first stage of the recruitment process (Recruit-1) was
thus to screen for age, parity and healthy term infant eligibility criteria and then to
approach all eligible first-time mothers at major public maternity hospitals in
Brisbane and Adelaide63. This Recruit-1 was planned to take place within three days
of a baby’s birth. Out of the total number of births, 40% were expected to be first-
time mothers (Grant application ID 497218, 2007). This Recruit-1 stage would also
consist of (i) checking additional eligibility criteria64, expected to be met by 90% of
first-time mothers (Grant application ID 497218, 2007); (ii) approaching eligible
mothers to determine whether they would agree to be recontacted for potential
enrolment into the study; (iii) obtaining written consent for later contact as well as
contact details; and (iv) collecting a small set of demographic and pregnancy history
information from both consenters and non-consenters. The performance objective
for reach at Recruit-1 was that 60% of eligible mother–infant dyads would
consent to be recontacted (Figure 6).
The initial intention was that the project staff would perform this task, explaining the
study verbally with the assistance of a pamphlet. Whereas this was feasible in
Adelaide, the Brisbane ethics committees did not approve this procedure. This
complicated the recruitment process, as midwives employed by the maternity
hospitals and paid via study funds had to be involved, and a procedure needed to be
62 Based on similar experience with a first-time parent group in South Australia (Grant ID 497218,
2007) 63
See section 3.3.2.3 for an exhaustive list of eligibility criteria. 64
See previous note.

76
established to communicate the data collected to the NOURISH staff (e.g.
standardised fax sheets).
The second stage of the recruitment process (Recruit-2) would consist of (i)
recontacting those mothers who at Recruit-1 had consented a second contact, four to
seven months later, (ii) updating their eligibility with respect to mental health, baby
health and living area, (iii) obtaining written consent for full enrolment in the trial,
and (iv) obtaining information on the reasons for refusing to participate and on
breastfeeding intention of non-consenters. The performance objective for reach at
Recruit-2 was a 70% full enrolment consent rate, out of the eligible mothers that
had been recontacted and were still eligible to participate in the trial (Figure 6).
Given the high number of participants to recontact, the primary method of recontact
chosen was by postal mail, followed by telephone call in cases of non response65. The
choice of this approach was based on the previous, successful, experience of one of
the chief investigators in recruiting participants in this way.
For mothers who would consent at Recruit-2 and would be subsequently allocated to
the intervention group66, strategies to facilitate attendance at the information sessions
and high level of engagement would have to be defined. For instance, location and
time of session delivery had to be convenient for mothers, as well as easy to find and
to remember. It was decided that intervention delivery would take place in child
health-care centres across both cities. Mothers would have the option to select the
location, day or time which would be most convenient for them. Lastly, mothers
would be provided with clear instructions (maps) and reminders of session dates and
times.
No specific performance objective for audience reach was stated. In the absence of
such an a priori statement, the number of participants of the intervention group (265)
who had to be included for final analysis at two years was used to define a posteriori
the performance objective for the overall reach at delivery.
65 Numbers of planned attempts were not accessed. 66 This was also the case for attending clinics for measurements, and thus concerned the control
group.

77
The translation of assumptions made in the development of the NOURISH research
programme, into specific performance objectives, is reported in Figure 6, on an
inverted CONSORT Flow Chart. It reports calculations and assumptions made by the
chief investigators in order to define how many participants they needed to screen.
Thus, it starts by stating the number of participants that are necessary to include in
the final analyses in both arms.
• Planning the maintenance of the intervention
This component of the process theory relates to the requirements for continuation of
the programme beyond the original implementation. The fact that NOURISH was to
deliver a universal intervention, in existing child health-care facilities, was
underpinned by an objective to facilitate maintenance of the programme. It was
thought that integrating the delivery of the intervention within an existing set of
structures would better reflect the real-world accessibility conditions required for the
programme to be used, and would facilitate the translation of the programme into
routine services. The issue was that the investigators could not get buy in from senior
nursing staff so were not able to involve existing child health staff as they had
originally hoped. In addition, because NOURISH was designed to be an efficacy
trial, then maintenance was not initially a priority. In light of these considerations, no
process objective was documented in relation to intervention maintenance.
3.3.2.3 Measurement tools, pilot study and inclusion criteria
• Measurement tools
Consistent with an Intention-To-Treat analysis, a wide range of variables relating to
outcome, impacts and co-variates were sought. For feasibility issues, three collection
methods were planned: self-administered questionnaires, direct assessments
conducted at community child health clinics and telephone interviews relating to
dietary intake. Since this thesis is not concerned with child dietary intake, telephone
interviews will not be expanded upon further in this evaluation.

78
Assumptions Performance objectives
CONTROL INTERVENTION
265* 265*
410 410
820 at Recruit-2
1170 at Recruit-1
1950 eligible infant-mother pairs
2167 eligible 1st time mothers
5418 to be screened for eligibility
* Number of subjects required for Intention-to-Treat analyses
Reach at Recruit-2 out of Recruit-1
subjects = 70%
Overall reach at delivery out of enrolled
participants =65%
Assumed equal completion rate
Reach at Recruit-1 out of eligible
subjects = 60 %
90% healthy infant-mother pairs out of
1st time mothers
Overall reach at
enrolment out of
eligible subjects =
42%
40% eligible first time mothers out of
birth delivery
Overall eligibility
out of screened
subjects = 36%
Figure 6: Transcription of assumptions made by NOURISH chief investigators for reach performance objectives
79
Two self-administered questionnaires were developed for Recruit-1. One was for
collecting written consent to a later contact, checking eligibility, contact details and
basic socio-demographics and other maternal characteristics (Appendix 1). The
second was for collecting the same sub-set of data including breastfeeding intention
and pre-pregnancy weight status for those declining a subsequent contact (Appendix
2). A specific questionnaire was developed to collect reasons for those recontacted
who decided not to further participate in the NOURISH research programme
(Appendix 3). Three other self-administered questionnaires were developed to
measure intervention effects, and to collect data on maternal and child covariates.
These latter questionnaires were on average 31 pages long, of similar structure, and
covered a broad range of information, including feeding modes and practices, timing
of solid food introduction, child and maternal health issues, maternal work status and
family income. Extracts of these questionnaires are provided in Appendix 4, and
Appendix 5. The questionnaires were based on validated questionnaires relating to
child feeding practices, styles and control, as well as measures developed and
validated for the Longitudinal Study of Australian Children (LSAC) (Gray &
Sanson, 2005) and measures developed by the chief investigators. The purpose of
organising child health clinic assessments was to directly measure and weigh
children and their primary caregivers.
To simplify data gathering, mothers would return questionnaires when they attended
health clinic assessments and anthropometric measures would be reported at the back
of these questionnaires.
To assess the fidelity of information delivery, standardised attendance logs
(Appendix 6) and session monitoring books (Appendix 7) were developed based on
the “Sing and Grow” intervention (Nicholson, Berthelsen, Williams, & Abad, 2010).
In case of non-attendance to one session, a semi-structured telephone call survey was
planned which aimed to identify the reasons for non-attendance and obtain feedback
on the attended sessions. Intervention delivery was planned to be evaluated at the end
of each session, independently first by each facilitator, and then compared and
discussed by facilitators and co-facilitators using the session monitoring books
(Appendix 7). Lastly, to ascertain the reliability of these evaluations, an independent

80
observer would rate one session per module, per group. Session monitoring books
included four groups of open-ended questions, focused on (i) management and
facilitation, (ii) group response, (iii) environmental influences, and (iv) coverage of
key content and a “comment” space. The questions used various Likert-style scales
with a mix of 5-point or 3-point ranges of multiple statements (see Session
monitoring books in Appendix 7). Items related to the coverage of key content were
organised according to the chronological order of the session content, but were
adapted to the content of the session. Hence, the number and the headings relating to
key content varied slightly across sessions. With respect to the three other groups of
items, these remained unchanged across sessions.
In addition, a participant questionnaire (Appendix 8) was developed to collect
feedback on the intervention in a confidential manner (i.e. sealed envelope). This
included nine closed and four open-ended questions which were variously rated, but
which addressed participant satisfaction, perceived usefulness, attendance barriers,
and concomitant source(s) of information that mothers could seek on child feeding
alongside the NOURISH programme.
• Pilot study or formative evaluation
As indicated in Table 1, only a limited number of documents were available on the
pilot study. Based on the application for ethical approval of social or behavioural
research involving human subjects, a pilot study was conducted between July and
November 2006. The aims were to test the recruitment protocol, test the information
delivery of the first module with a group of 15 mothers of children aged 6–10
months, and pre-test questionnaires used to measure intervention impacts. A quasi
control design was used where 15 participants per arm were sought to participate.
Based on the 2007 National Health Research Medical Council (NHRMC) grant
application for project funding, 28 first-time mothers of infants 6–8 months were
selected from the Children, Youth and Women’s Health Service (CYWHS) database
in Adelaide and were randomly allocated to the intervention or the control group.
Thirteen mothers participated in the pilot intervention group and gave positive
feedback on this pilot intervention. In addition, they suggested that the information
sessions be organised before the baby was aged six months, which was consequently
81
addressed in the NOURISH final project. These mothers were satisfied with the pilot
intervention and found the assessment materials acceptable. The extent to which the
entire material (including the second module) of the intervention was tested and the
involvement of potential users in the development of this material is not documented.
Initially, the plan was to recruit participants from a South Australian primary care
service database of mothers interested in research projects. With the move of one of
the chief investigators to Brisbane, it was decided that this offered the opportunity to
also recruit from another large metropolitan city. Standardising the recruitment
process between cities led to modifying the recruitment strategy that had been tested
in the pilot study. It does not appear that this adapted recruitment strategy was
specifically piloted for the NOURISH research programme. However, one of the
chief investigators was reported to have successfully used this adapted recruitment
procedure previously.
• Inclusion criteria
Some of the inclusion criteria have been alluded to in the description of the above
components of the process theory. However, others were not derived from the
previous descriptions and are given here. For instance, the choice of including first-
time mothers was based on developing positive feeding choices rather than
modifying existing ones (Grant application ID426704, 2006). In addition, it avoided
interference between feeding of the child considered in the intervention and feeding
of other children in the household (Grant application ID426704, 2006). Specifically,
participants had to be healthy primiparous mothers aged 18 years or older, with a
healthy term new-born infant (born after 35 weeks) and weighing at least 2500g,
without any abnormality or chronic condition likely to influence normal
development, including feeding behaviour (e.g. severe unmanaged reflux). Mothers
had to have facility with English, live in Brisbane or Adelaide metropolitan areas,
and not be enrolled in an intensive home-visiting program or have self-reporting
eating disorders, or documented domestic violence, substance abuse or mental health
problems assessed by the Kessler Psychological Distress Scale (K10) at second
Recruit-2 (Andrews & Slade, 2001).

82
3.4 NOURISH Implementation and data.
Implementation of the NOURISH programme started following a successful
NHRMC grant application in 2007 and ethical approval to conduct the trial. The
following description of this implementation is based on the CONSORT 2010
guidelines (Moher et al., 2010). Thus, it starts by describing a detailed CONSORT
flow chart (Figure 7) of the NOURISH Research programme. The flow chart
presents the traditional phases of a clinical trial, as well as the specific stages
developed within these phases for the NOURISH Research programme. The flow
chart also identifies periods when data were collected in the course of the trial. The
chart provides a basis for the chronological description, of the implementation and
data collection.
Data management for NOURISH is presented at the end of this section.
3.4.1 Participant enrolment
The Recruit-1 process started in 2008, in eight public and private maternity hospitals
in Brisbane and Adelaide67. Midwives employed by the maternity hospitals in
Brisbane, but using study funds, and study employed staff in Adelaide screened
eligible mother–infant dyads, approached them, and obtained their written consent
for later contact. In addition, midwives and study staff handed two separate self-
administered questionnaires to these mothers to collect basic socio-demographics
from both those who consented to a later contact and non-consenters (see Appendix 1
and Appendix 2). In this research, mothers who gave their consent at this stage will
be called “Recruit-1 consenters to a later contact” and those who did not will be
called “Recruit-1 non-consenters to a later contact”.
67 In Brisbane: Royal Brisbane and Women’s Hospital (RBWH) (public and private), Mater Hospital
(private), Logan Hospital (public). In Adelaide: Women’s & Children Hospital (W&CH), Flinders
Medical Centre (FMC), Lyell McEwin Hospital (LMH), Ashford, Flinders Private.

83
* from allocation
SCREENED FOR ELIGIBILITY (n=4376; ≥18 years; primiparous)
ELIGIBLE (n=3334)
NOT APPROACHED (n=464). No data
DID NOT CONSENT to later contact (n=701)
CONSENTED to later contact + data (n=2169)
DID NOT CONSENT TO PARTICIPATE (n=885). 823 gave reasons
Allocated to INFORMATION group (n=352)
Discontinued (n=61)
Discontinued (n=92*)
Allocated to CONTROL group (n=346)
Discontinued (n=39)
Discontinued (n=65*)
NOT ELIGIBLE (n=1042). No dataRecruit 1 (maternity hospitals, Brisbane + Adelaide)
Recruit 2 (mail, email or phone)
Module 1 information sessions (4 months age)
DID NOT ATTEND any session (n=80)
BECAME INELIGIBLE (n=75)
Enr
olm
ent
Inte
rvent
ion
ATTENDED at least 1 session
(n=272)
ATTENDED at least 1 session
(n=155)
DID NOT ATTEND any session (n=197*)
APPROACHED (n=2870)
DATA (n=309) NO DATA (n=392)
CONSENTED TO PARTICIPATE (n=698)
Module 2 information sessions (14 months age)
UNABLE TO CONTACT (n=511)
Randomisation
9 months after baseline
ITT analysis
18 months after baseline
Analysed (n=281) Analysed (n=260)
Fol
low
-up
Implementation
Reach
Adoption
Data collection
For Recruit 2 Consenters
Assessment T1 Questionnaire
Assessment T2 Questionnaire
Assessment T3 Questionnaire
Recruit-1 consent & non
consent to a later contact
Questionnaires
Recruit 2 non consent
Questionnaire
Module 1 Attendance log
+ Monitoring book
Study phases & stages
Module 2 Attendance log
+ Monitoring book
Figure 7: NOURISH CONSORT Flow Chart and Process Evaluation (own production, with assistance from Wilson J. & Meedeniya J.)
84
“Recruit-1 consenters to a later contact” were re-contacted by mail at Recruit-2, four
to seven months later. They were sent a NOURISH labelled envelope containing
specific instructions asking that they provide (i) their decision with respect to
participation (written consent or non-consent); (ii) the Assessment T1 questionnaire
for consenters (Appendix 4) or the “no longer wish to participate” questionnaire for
Recruit-2 non-consenters (Appendix 5); and (iii) a form for consenters to indicate a
preferred time and venue for their baseline assessment clinic appointment. To
increase the likelihood of questionnaire returns, a prepaid envelope was also included
in this mail and entry into a AUD50 baby-product voucher draw was used as an
incentive, independent of the consent decision. Mothers who did not return any
questionnaire were recontacted by study staff at least three times by telephone, and
eventually by email or text message.
Since the reach number of mothers who consented to be fully enrolled after Recruit-2
stage was lower (32%) than expected (42%), a second cohort of participants was
recruited in 2009 in one maternity hospital in Brisbane and four hospitals in
Adelaide68. This selection of hospitals was based on the highest consent rate for
cohort 1. The group of mothers whose recruitment started in 2008 will be called
cohort 1 in this research, while those recruited in 2009 will be called cohort 2.
A total of 4376 mothers were screened in maternity hospitals, of whom 3334 (76%)
were eligible to participate. Out of these 3334 eligible mother–infant pairs, 464
(14%) mothers could not be approached before their discharge from hospital. Of the
remaining 2870 who could be approached, 2169 (76%) consented to be re-contacted
and provided contact details. Among these Recruit-1 “consenters to a later contact”,
511 (24%) could not be recontacted, and 75 (3.5%) became ineligible69. Finally,
among the remaining 1583 eligible “Recruit-1 consenters to a later contact”, 698
(44%) consented to full enrolment, completed the baseline Assessment T1
questionnaire and measurements (see below “Follow-up”) and were thus enrolled
into the trial (Figure 7).
68 In Brisbane: Mater Hospital. In Adelaide: Women’s & Children Hospital (W&CH), Flinders Medical
Centre (FMC), Ashford, Flinders Private 69 See inclusion criteria p. 30

85
3.4.2 Randomisation
Following consent and baseline assessment, randomisation was conducted by an
external statistician based on the list of these 698 participants. Three hundred and
fifty-two (352) participants were randomly allocated in a permutated block manner70
to the intervention condition and entitled to receive anticipatory guidance on child
feeding by attending 12 information group sessions. In addition, this random
allocation was stratified by assessment clinic in order to limit a potential cluster
effect associated with the socio-economic location of the clinic. Three hundred and
forty-six (346) mothers were allocated to the control condition and did not receive
such parenting support on feeding advice, but were assumed to maintain self-directed
access to services typically available at their local child health clinics, which
potentially include breastfeeding support, growth monitoring and feeding advice (see
Figure 7).
3.4.3 Intervention delivery
As planned, to facilitate attendance at the information group sessions, several
strategies were implemented. First, mothers could select a clinic from a list of
designated child health clinics when they filled in the consent form for full
enrolment. Second, mothers that had been allocated to the intervention were offered
several forms of session-time reminders, including a card containing details of all
information session dates and times, and a text message before each session. Third,
for most participants, the measurement and intervention sessions were at the same
venue; if they were not, new maps and parking information of the alternative venue
were provided. Fourth, free childcare was provided, at some Module-1 sessions in
Adelaide (as it was freely available at the venue), and at all Module-2 sessions in
both cities. Providing this service for Module-2 sessions was anticipated to improve
attendance and reduce the distractions that would arise from having 12–14 month old
children present. Considerable efforts were made to keep as many mothers as
possible engaged in the trial, and to encourage them to attend information sessions.
For instance, mothers were called in case of non-attendance of a session, and efforts
70 so that there were an equal number of control and intervention participants in each clinic.

86
were made to allocate mothers to those groups which were the most convenient to
them.
Thirty groups of mothers were formed across both cities for delivery of the first
module. This corresponded to the organisation of 180 information sessions. Because
of the lower attendance rate than expected at Module-1, a smaller number of groups
(twenty) was formed for Module-2, corresponding to the organisation of 120
information sessions.
As planned, most of the sessions were facilitated by two professionals with
complementary disciplinary expertise, the facilitator in nutrition and dietetics and the
co-facilitator in psychology. To ensure session delivery as planned, 13 facilitators
and 13 co-facilitators were trained together. This number was sufficient to ensure
potential replacement in case a facilitator or a co-facilitator defaulted. However, due
to budgetary constraints, single facilitators, rather than facilitator and co-facilitator
pairs, ran all Module-2 sessions for cohort 2 mothers.
Information sessions were standardised: an “Intervention Document Manual” and
PowerPoint presentations were provided to the facilitators to be used in running the
sessions. The first module was entitled “learning to like, liking to eat”71, the second
module “Parent provides, child decides” (see Appendix 9). Participants were
provided with one “workbook” per module, designed for both parents, and one
“carer workbook” which they could give to the other carer(s) of the child. With
different level of detail, workbooks summarised key messages addressed in the
course of information sessions. Participants allocated to the intervention group who
notified that they wished to, but could not, attend sessions for reasons such as work
commitment were sent E. Satter’s text72 (Satter, 2000).
As planned at the commencement of each information session, facilitators kept
attendance logs (Appendix 6). These logs recorded, in a table format, the
71 “children eat the foods that they like. The only way for them to like a new food is to be familiar
with it. They get to know and like new foods by trying them/being exposed to them.” In Carer’s
booklet, p. 6, developed by the NOURISH team. 72 Satter, E. 2000. Child of Mine: Feeding with Love and Good Sense. (3rd ed.). Boulder, Colorado: Bull
Publishing.

87
participant’s details (e.g. identification, contact number), identification of the
information group, session attendance and standardised reasons for non-attendance
whenever the study staff could document this73. As planned, at the end of each
session, facilitators and co-facilitators filled in session monitoring books (Appendix
7), however, this procedure was not applicable to sessions of Module-2 delivered to
cohort 2 participants given the funding issues previously mentioned.
As planned, towards the end of each module, intervention recipients were asked to
fill in a “parent feedback questionnaire” (Appendix 8) that facilitators had pre-filled
with participant identification and group identification. This questionnaire was
collected in a confidential manner (i.e. in a sealed envelope) by the facilitators.
3.4.4 Follow-up
To measure the effect of the intervention by comparison with baseline Time 1
Assessment, both groups were similarly followed up at two points in time (Time 2
and Time 3 Assessments), when children were about 14 and 24 months old. A Time
Point Assessment consisted of collecting data from a self-administered questionnaire
(Appendices 4, 6 and 7) that mothers returned when they attended the child health
clinic assessment, which was followed a few days later by telephone interviews
relating to dietary intake (not expanded upon here). Child health clinic assessments
were performed by trained study staff and included measuring and weighing the
child and the primary caregiver (most often the mother). Time 2 and 3 Assessments
took place approximately six months after completion of each module delivery.
To maintain contact, control and intervention mothers were also sent regular
newsletters on childhood topics other than feeding and parenting.
As noted in Figure 7, a number of mothers discontinued their participation in both
allocated groups. It is worth noting that this discontinuation occurred mainly at the
first stage of follow-up (at Time 2 Assessment) and was higher in the intervention
than in the control condition (61 versus 39). Between the first and the final stages of
73 Reasons could be obtained prior to the session or at the following session. Study staff contacted
participants in case of repeated non-attendance. However, the systematic telephone survey of non-
attendants was not conducted as planned.

88
follow-up, discontinuation was similar in both groups. In the end, 281 and 260
participants respectively allocated to the control and the intervention groups
completed anthropometric measurements at the Time 3 Assessment.
3.4.5 Data management
The data collection commenced in late 2008, and was completed in June 2011 for the
two-year follow-up of the NOURISH research programme74. Data specifically
devoted to measure the effect of the NOURISH intervention (e.g. Time Point
Assessments) were centralised in Brisbane, while those devoted to measure the
programme’s process were entered in separate databases held in Brisbane and
Adelaide. Further details on data management and the involvement of the author of
this thesis in this data management are provided in Chapters 4 and 5 and in Appendix
10.
3.5 Discussion, secondary evaluation framework and PhD
research questions
The purpose of defining the programme theory or logic model of the NOURISH
research programme was first to map resources or activities that needed to be
developed to implement the proposed intervention, and second to define each
programme objectives on which to base evaluation criteria of this PhD research
(Anderson et al., 2011; Renger & Titcomb, 2002).
Based on a systematic approach suggested by the health promotion literature
(Bartholomew et al., 2009; Green & Kreuter, 2005; Issel, 2009)75, section 3.3.2 has
reconstructed a programme theory of the NOURISH research programme and has
defined specific intervention and process objectives to achieve.
Following a systematic approach allowed the assessment of how the programme was
developed compared to what is suggested in the health promotion literature
74 Further funding has been obtained for a five-year follow-up.
75 See section 2.2.

89
(Bartholomew et al., 2009; Green & Kreuter, 2005; Issel, 2009). In turn as described
below, such an approach highlighted that some recommended principles to develop
health promotion programmes (see section 2.2.1) and subsequent recommended
activities to conduct at programme development stages76 might not have been applied
by the NOURISH research programme developers. Such understanding of the
development process of the NOURISH research programme might be useful in order
to understand potential issues observed at programme implementation. In turn, this
might help to guide further research activities to address these potential issues.
First, it is unclear as to the extent to which the programme was developed following
an iterative approach between the initial goal setting (i.e. child obesity prevention at
5 years of age), definition of research programme priority and action planning.
Indeed, although the multiple determinants of childhood obesity (see section 2.4.1)
had been already mapped by other scholars when the development of the NOURISH
research programme began (Davison & Birch, 2001; Kumanyika et al., 2002),
NOURISH investigators chose to focus on a single determinant of child obesity,
namely maternal feeding choices77, but kept weight status of children as a primary
outcome of the trial (Daniels et al., 2009). Second, the extent to which the needs
assessment was comprehensively conducted is uncertain as it involved relatively old
mothers (mean age 32.5 years, SD: + 5.2) (Chan, 2005; Chan et al., 2010), and did
not address whether this was a high priority for younger parents.
Third, the lack of documentation with respect to the needs assessment and the pilot
study, as well as uncertainty that the pilot study tested the entire reach process from
recruitment to delivery (see section 3.3.2.3, p. 80), suggests that programme
developers might not have perceived the importance of conducting these separate
activities within the programme cycle (see Figure 1). The use of the same citations
(Chan, 2005; Chan et al., 2010) to cite the needs assessment and the pilot study, in
reference lists of the 2006 and 2007 NHRMC Grant Applications (see Table 1) and
the Protocol Paper (Daniels et al., 2009), support such a suggestion.
76 Stages 1 and 2 in Figure 1
77 Originally called maternal feeding practices by chief investigators (see sections 2.4.1.3 and 3.3.1.)

90
Fourth, the extent to which healthcare services staff and potential programme users
were involved at the different stages of the programme cycle was unclear. However,
involvement of a variety of stakeholders allows approaching solutions from
complementary perspectives and designing useful and realistic programmes
(Bartholomew et al., 2010; Green & Kreuter, 2005; Issel, 2009; Thomas, 2006). For
instance, at the needs assessment stage, experts might provide a comprehensive
picture of determinants of the health problem. Conversely, potential beneficiaries
might wish to narrow this picture down to the issues that are most relevant to them
(e.g. food access or cooking skills may not be issues for some mothers). Community
members and potential programme implementers might complete this picture using
their knowledge of existing policies and feasibility issues. Similarly, at the planning
stage, experts might suggest methodological approaches; potential beneficiaries
might suggest solutions in line with their needs, while community members and
implementers might focus on organisational and resource issues and address
maintenance (Bartholomew et al., 2010; Green & Kreuter, 2005; Issel, 2009).
Related to these methodological limitations at programme development, the resulting
programme theory has some gaps with respect to the description and purposes of
some aspects of the programme. For instance, within this overall programme theory,
the process theory that identifies activities or resources (process input78), which are
necessary to consider in order to implement the intervention as planned (process
output79), could not specify any objectives for three key process components such as
intervention delivery, adoption and maintenance. Nevertheless, process data were
collected for intervention delivery and adoption (see section 3.4.3). Similarly, within
the effect theory (Figure 5), first the outcome theory did not specify pathways that
contribute to child weight status, hence it did not address how the multiple
determinants of childhood obesity would be considered. Second, the causal theory
was underpinned by a cognitive behaviour approach from an unspecified model of
individual behavioural change. Glanz et al. (2008) argue that knowledge or the
78 Such as activities and resources to recruit the target population or to encourage participants to
comply with the intervention 79
Such as representativeness of the target population or representativeness of participants
attending the intervention

91
perception of risks associated with certain behaviours are necessary factors in
individual behavioural change theories, but they are not sufficient to induce sustained
changes, or even short-term changes, in behaviour. Hence, among the numerous
models of individual behaviour change that exist, other dimensions could have been
considered80. Glanz et al. (2008) also argue that interventions underpinned by tested
theories may be more effective than those not underpinned by theories. Thus,
describing the model of individual behavioural change is of importance as it
emphasises the different aspects that trigger behaviour changes and guide the
development of specific programme components as well as definition of intervention
objectives to perform. In the case of the NOURISH research programme, the other
aspects of the programme that had been planned to make mothers adopt and apply
the principles of the trust model were not known. Green and Kreuter (2005) suggest
that behavioural factors be addressed according to three main categories:
predisposing, reinforcing and enabling factors. In the reconstruction of the
programme theory, it was assumed that some of these factors might have been
somewhat addressed. However, the extent to which these factors had been addressed
by programme developers was uncertain.
Third, while the intervention theory appears to have been underpinned by the trust
model (Eneli et al., 2008) and allowed developing the content of the intervention, its
articulation with the attachment paradigm (Ainsworth, 1979) is unclear. Was the use
of the attachment paradigm a way to reinforce the responsiveness message included
in the trust model, hence part of the intervention content? Alternatively, was
attachment a construct included in a model of individual behavioural change (e.g.
emotional construct)? ²
Such gaps in the description of the programme theory are consistent with
observations made by other scholars who noted that logic models and underlying
80 For instance, the Health Belief Model (HBM) (Champion & Skinner, 2008) adds to the cognitive
dimension several constructs such as risk or threat perception, benefits and barriers to behaviour
change and cues to change. Conversely, the Theory of Reasoned Action (Montaño & Kasprzyk, 2008)
adds constructs such as behavioural intention. Similarly, the Transtheoretical Model (Prochaska,
Redding, & Evers, 2008) includes cognitive dimensions of behaviour as well as processes that trigger
behavioural change such as stages of change readiness, process of change, decisional balance, and
self-efficacy.

92
theoretical frameworks are rarely reported in childhood obesity prevention (Thomas,
2006; Waters, de Silva-Sanigorski et al., 2011). What is more, not addressing the
maintenance process component is consistent with an approach of programme
development that follows a five-phase research continuum model (Glasgow et al.,
2003). Indeed, with such an approach, the addressing of maintenance, which includes
programme sustainability beyond the research context, hence intervention costs,
staff, etc., is postponed to Phase IV where applicability and generalisability (i.e.
external validity) are examined. In turn, Phase III focused on efficacy (i.e. internal
validity, RCT) only, hence maintenance does not need to be addressed.
Altogether, these gaps of the reconstructed programme theory make it difficult to
perform a comprehensive evaluation of the NOURISH research programme as
defined in Figure 3. In turn, this might slow down the translation of the NOURISH
intervention to other settings, as some necessary information with respect to
applicability in routine will not be available (e.g. maintenance) (Kessler & Glasgow,
2011). Another step in the prevention programme cycle might be necessary.
Nevertheless, consistent with Figure 3, at least a summative evaluation framework
can be defined from this uncompleted existing programme theory.
Figure 8 proposes a conceptual summative evaluation framework of the NOURISH
research programme by combining Figure 5 and Figure 2 without the maintenance
process component. Factors that moderate maternal feeding choices in Figure 5 have
been included in Figure 8, in the characteristics of the population of the reach
component. This summative evaluation framework links effect and process theories
and guides the evaluation research questions and objectives that are addressed by
comparing programme objectives with achievements.
Within the scope of this PhD thesis, it was not possible to address all the evaluation
questions that this summative evaluation framework of the NOURISH research
programme raised. Thus, this PhD thesis is concerned with addressing impact A of
the intervention theory and does not address impacts B, C and D, which have been
shaded in Figure 8. The dashed frame delineates the scope of this evaluation within
the whole NOURISH evaluation framework. Nevertheless, this framework remains
applicable to interpret results of the NOURISH effect evaluation that are outside of

93
Effe
ct e
valu
atio
nPro
cess
eva
luat
ion
Summative evaluation
Intervention theory
Mediating factors
Child
food
intake
Weight status or
BMIz
scores of children
Outcome theory
C DChild eating
behaviour
Child food preferences
B
Maternal feeding choices (i) no coaxing, (ii) child exposure to healthy foods, (iii) limited
exposure to unhealthy food, (iv) maternal modelling, (v)
structured meals
INTERVENTIONAnticipatory guidance based on Satter’s principles
A
Causal theory of obesity in preschool children
Intervention
theory
Figure 8: Thesis conceptual evaluation framework

94
this dashed frame (Daniels, Mallan et al., 2012; Daniels, Mallan, Nicholson,
Battistutta, & Magarey, 2013).
Thus, the main evaluation research questions of this PhD thesis are: i) how does
process evaluation help improve understanding of the generalisability and
applicability of the results of the NOURISH research programme effect evaluation,
for selected maternal feeding choices? ii) how does the process evaluation help
identify key aspects that need to be considered when translating this research into the
real world? In turn, these general research questions imply three sets of specific
evaluation questions.
1. What are the intervention effects on selected maternal feeding outcomes?
This question aims to assess the extent to which the NOURISH intervention
modified selected maternal feeding choices six months after the completion of the
intervention, as compared to the control group.
As described in section 2.4.1.3, feeding choices involve three pathways of maternal
influence on child eating development: mother–child interaction when feeding,
maternal capacity to expose the child to new foods, and maternal eating modelling.
The specific research questions related to the effect evaluation should reflect the five
intervention performance objectives identified in section 3.3.2.1. However, while
some information was collected on the number of times a mother would offer food to
her child before deciding whether the child liked or disliked the food, no specific
variable could be identified which would allow an assessment of whether re-offering
of new food was being done in a neutral way or not. Given this, the specific research
question related to this component of the NOURISH message could not be
addressed. In contrast, research questions related to the other components of the
NOURISH message could be addressed when children were about 24 months old.
These questions are:
� Are mothers in the intervention condition more likely to trust their
child’s satiety cues?
� Are mothers in the intervention condition more likely to offer healthy
food?

95
� Are mothers in the intervention condition more likely to limit unhealthy
food?
� Are mothers in the intervention condition more likely to be model
eaters and establish ideal meal conditions (e.g. quiet time without TV
and child seated at table)?
2. How could the implementation process of the NOURISH research
programme be described?
Two main research questions can be identified to evaluate the NOURISH process
and address the internal and external validity of the intervention impacts.
� Was the NOURISH intervention delivered as planned?
This question addresses the internal validity of the results of the intervention, and
specifically four sub-process components as described in sections 2.2.2.2 and 2.3.2.
– How well did NOURISH reach its target audience?
– How well was the dose delivered?
– How well was the delivered dose received?
– How well did the NOURISH content match the planned content?
� For whom and under which circumstances was the NOURISH research
programme implemented?
This research question informs the conditions of the intervention delivery and
addresses the external validity of the trial. By specifically addressing the context, the
recruitment procedure, participants who received the intervention and their
perception of the NOURISH information group sessions, it also provides elements
for future translation of the programme. Specifically,
– Who were participants who were reached at each stage of the NOURISH research
programme?
– How well was the NOURISH intervention adopted by participants?

96
– What were the barriers to attendance, adoption and implementation of the trial?
3. Could the Implementation process of the NOURISH research
programme have influenced intervention effectiveness?
This last research question addresses the influence of the process on the observation
of selected maternal feeding choices within the intervention group and the
interpretation of the effect evaluation in the real world. Specifically,
� How could selected maternal outcomes observed in the intervention
group be influenced by the Implementation process of the NOURISH
research programme?
� How could the Implementation process have influenced the results of
the effect evaluation?
3.6 Conclusion
Based on the literature review developed in Chapter 2, this chapter has expanded the
original evaluation framework of the NOURISH research programme which focused
on effect evaluation. The resulting conceptual framework allows specific research
questions regarding effect and process evaluations to be addressed, and the
combination of the outcomes of these evaluations to further address applicability and
generalisability of the NOURISH research programme.
The following chapters will address three sets of research questions. They detail
methods and results of effect evaluation on selected maternal feeding choices
(Chapter 4), process evaluation (Chapter 5) and exploratory analyses that relate
selected maternal feeding choices variables to process variables (Chapter 6). Chapter
7 will combine results of these three chapters with the understanding of the
development process of the NOURISH research programme gained from this chapter
to recommend further research perspectives of the programme.

97
Chapter 4 Effect evaluation
4.1 Introduction
As explained in Chapter 3, 346 and 352 first-time mothers were randomly allocated
to the control and the intervention groups of the NOURISH research programme.
The control group received the usual self-directed community care, while the
intervention group was entitled to attend two modules, each comprising six
fortnightly interactive group information sessions, delivered six months apart.
This chapter focuses on the effect evaluation of selected maternal outcomes of the
NOURISH research programme. Given that an RCT design had been chosen to
evaluate the intervention, the following effect evaluation question is addressed:
compared to the control group, did the NOURISH intervention modify maternal
feeding choices in the intervention group six months after completion of the
intervention when the participating child was 24 months old?
The aim of this chapter is to report on the Intention-To-Treat analysis of intervention
effect on selected maternal feeding choices. This report follows the guidelines of the
CONSORT 2010 but does not repeat section 3.4 (Moher et al., 2010). Hence, the
methods section of this chapter details only the measures used to evaluate, as
compared to the control group, the achievements of anticipatory guidance in
changing mothers’ feeding choices towards (i) increased trust in their child eating,
(ii) greater exposure to healthy food, (iii) lower exposure to unhealthy food, and (iv)
better role modelling and better mealtime conditions (sections 3.3.2.1 and 3.5).
4.2 Methods
4.2.1 Summary of the data collection process
Measurement tools to evaluate NOURISH effects with respect to selected maternal
outcomes have been described in section 3.3.2.3. Data collection has been described

98
in sections 3.4.4 and 3.4.5. Figure 9 below provides a timeline of the NOURISH data
collection to evaluate the effect of the intervention.
Baseline data include data collected at recruitment and at T1 Assessment (see
Appendices 1 and 4). To evaluate the effects of the NOURISH programme, maternal
feeding choices data have been collected at T2 for interim assessment and at T3 for
final assessments (Appendix 5). Only T3 assessments are used for these analyses
since effect evaluation in this thesis focuses on final maternal outcome only (see
section 3.5).
Control group
T2
Ass
ess
me
nts
T3
Ass
ess
me
nts
Intervention group
Re
cru
it 1
da
ta c
oll
ect
ion
Re
cru
it 2
da
ta c
oll
ect
ion
T1
Ass
ess
me
nts
Baby
birth
Randomisation (4-7
months )
End first phase of
follow-up (24
Module 1 Module 2
Figure 9: Data collection timeline of the NOURISH research programme
4.2.2 Data selection
4.2.2.1 Baseline analyses
Preliminary analyses were undertaken to describe the 698 participants enrolled in the
trial and to establish statistical summaries of selected characteristics of the
participants. Selection of the variables retained for this analysis was done
anticipating the required analyses to ascertain that the randomisation procedure had
been successful, i.e. that the allocated groups were comparable before intervention
delivery. Retained variables were those that, based on a review of the literature,
could confound maternal feeding choices and child obesity risks (e.g. introduction of
solids, breast-feeding, maternal diet) and socio-demographic covariates, such as

99
education level, which could have affected the extent to which participants benefited
from the intervention (e.g. understanding the key messages). These variables are
listed in Table 2, along with the rationale for selecting them for the analysis.
Table 2: Selected covariates to describe enrolled participants
Covariates (Collection tool, Section)
Justification for inclusion Re-coded scales or
units of measurement
Ch
ild
fac
tors
Gender (Recruit-1 form for consenters to a later contact )
More restrictive practices by mothers have been found to be applied to girls (Francis, Hofer, & Birch, 2001; Tiggemann & Lowes, 2002)
Male /Female
Baby age (Recruit-1 form for consenters to a later contact )
A late entry into the intervention might dilute the influence of the trial.
Baby age at baseline (continuous, months)1
Baby weight status (Assessment T1 measurement)
Parents exert more pressure to eat when they perceive their child is thin (Birch & Davison, 2001; Farrow & Blissett, 2008).
Baby weight-for-age Z score (continuous)2
Easy to feed (Assessment T1 form, C)
Mother of difficult to feed baby might be more or less inclined to change.
Agree/disagree
Mate
rnal
So
cial
fact
ors
Mother date of Birth (Recruit-1 form for consenters to a later contact )
Mother age inconsistently associated across age groups to childhood overweight (Hawkins, Cole, & Law, 2009). Parental age moderates feeding choices (Mindlin et al., 2009).
Mother age1 (continuous, yrs)
Mother return to work (Assessment T1 form, Q)
Time at work may limit time for feeding and alter childcare (Grzywacz et al., 2010; Mindlin et al., 2009) and influence of mother might be diluted (Harrison et al., 2009).
Yes / No 3
Baby age when mother returned to work (Assessment T1 form, Q)
Influence of mothers might be diluted when mothers are not the sole carer.
(Continuous, months)
Mother Education Level (EL) (Recruit-1 form for consenters to a later contact )
EL is inversely associated with childhood obesity (Hawkins et al., 2009; Shrewsbury & Wardle, 2008) plus understanding of the intervention might vary with EL.
University education / non University education
Family income (Assessment T1 form, Q)
Family income is inversely associated with obesity in developed countries (Mindlin et al., 2009; Shrewsbury & Wardle, 2008).
$0–$673 per week; $674–$1346 per week; >=$1347 per week
1 Calculated by NOURISH officer at date of data collection. 2 Calculated by the NOURISH team from baby weight and age using WHO standards (Mihrshahi, Battistutta, Magarey, & Daniels, 2011). 3
Maternal work at baseline was defined by any (part-time or full-time) maternal professional activity or study. As the question related to this information was ambiguous (see Question Q1, Appendix 4), other criteria were examined to define current work: maternal situation with respect to maternal leave, answer related to baby’s age when mother returned to work. If answers were still discordant, maternal work was coded as missing data.

100
Table 2 continued
Covariates (Collection tool,
Section) Justification for inclusion
Re-coded scales or units of
measurement
Oth
er m
ater
nal
fact
ors
Mother weight and height (Assessment T1 measurement)
Obese mothers exert more control over child eating (Wardle, Sanderson, Guthrie, Rapoport, & Plomin, 2002). As direct measurement was made by trained staff only a few months after baby delivery, weight status perception before pregnancy was also retained.
Wt/ht2 = BMI (continuous, kg/m2)
Weight status perception before pregnancy
1-Normal; 2-Underweight or overweight; 3-Missing
Mother own weight concern (Assessment T1 form, O)
Maternal body dissatisfaction has been associated with verbal pressure to eat (Blissett & Haycraft, 2011).
Average of 5-item construct (Killen et al., 1994)4
Mother concern for child weight (Assessment T1 form, I)
Concern about baby weight was found to be associated with maternal use of pressure to eat (Hurley et al., 2011).
Yes / No
Mother diet (Assessment T1 form, L)
Maternal diet related to the type of food the child is exposed to.
Daily serves of vegetables: 0–2; 3–4; >=5 Fruits: 0–1; 2; >=3 5
Current breastfeeding (Assessment T1 form, A)
Breastfeeding denotes an existing knowledge of positive feeding choice.
Yes /No
Breastfeeding duration if terminated (Assessment T1 form, A)
Exclusive breastfeeding up to six months is recommended by WHO since 2001 (WHO, 2001b). It denotes the extent to which mothers make a positive feeding choice.
Continuous (days)
Age of introduction of solids (Assessment T1 form, B)
WHO recommendation is derived from exclusive breastfeeding recommendation, however, WHO acknowledges that evidence is lacking to define an exact timeframe for complementary food after four months (WHO, 2001b): between 4–6 months may be an adequate timeframe (Marriott, Foote, Bishop, Kimber, & Morgan, 2003; Przyrembel, 2012).
For babies having been already introduced to solid foods: 1: < 4months 2: 4–5 months 3: >= 6 months
4 Four of them rank on a 5-point Likert scale and one on a 6-point Likert scale (Appendix 5 section O). The scoring of this construct averages the five sub-scores obtained from the five items, and provides on a 0–100 scale the weight concern: a higher score indicating a higher concern.
5 Re-coding based on median splits.

101
4.2.2.2 Intention-To-Treat analysis.
Variables selected from the self-administered Assessment T3 Questionnaire
(Appendix 5) were those which were perceived to be the most relevant to evaluate
the achievement of the intervention performance objectives for which data were
available (sections 3.3.2 and 3.5).
To evaluate whether mothers in the intervention condition were more likely to report
trusting child satiety cues, the four-item construct on “pressure to eat”81 from the
Child Feeding Questionnaire (CFQ) (Birch et al., 2001) was considered to be
particularly relevant (see section 2.4.1.3 and Table 3).
To evaluate successively the capacity of mothers to expose their child to healthy
foods and prevent unhealthy foods exposure, the list of 84 solid foods (i.e. beverages
excluded) adapted from Wardle et al. (Wardle, Sanderson, Leigh Gibson, &
Rapoport, 2001) (section G, Appendix 5) was used. Initially, this list gave the
possibility to describe how specific foods are appreciated by children based on a 5-
point Likert scale. The NOURISH investigators added a sixth “never tried” category
to this scale to capture cases when the food had never been tried. It was assumed that
dichotomising this 6-point Likert scale into “ever tried” versus “never tried” could
be used as a basis to create scores for healthy and unhealthy exposures to food.
The subset of 18 fruits and 21 non-starchy82 vegetables included in this list was
considered as a basis for the questions relating to offering healthy foods. In contrast,
the sub-set of 24 non-core foods included in the list was considered as one of the two
proxy measures to evaluate whether mothers in the intervention condition were more
81 Cronbach alpha= 0.70
82 Starchy vegetables such as potatoes, corn and sweet potatoes were excluded from the analyses as
their carbohydrate content is largely above that of non-starchy average vegetables. That is why some
countries (e.g. France) do not include starchy vegetables in the vegetable food group (Hercberg et
al., 2008). Similarly, some scholars excluded them from analyses on vegetable intakes in preschool
children (McGowan, Croker, Wardle, & Cooke, 2012). The high carbohydrate content gives them a
sweet taste as compared to non-starchy vegetables suggesting why generally children will like the
taste of these foods. This suggestion is consistent with the results of other analyses of this subset of
data (control group) that ranked potatoes, corn and cooked vegetables the most preferred
vegetables (Howard, Mallan, Byrne, Magarey, & Daniels, 2012). In addition, the inclusion of the
starchy vegetables in the vegetable food group seems to create confusion in people as people report
fried potato chips as vegetables (Watt et al., 2009).

102
likely to limit unhealthy foods. The second proxy measure of unhealthy food
exposure was the five-item construct on Covert control83 from the Ogden et al.
(2006) questionnaire (see section 2.4.1.3 and Table 3,).
To evaluate whether mothers in the intervention condition were more likely to role
modelling and to establish better mealtime conditions, five independent questions
developed by the NOURISH investigators were selected. The first three of these
questions were of particular relevance to maternal modelling and were used to
develop an integrated score to measure the necessary prerequisites of role modelling;
the physical presence of the child at the table and offering the same food (see Table
3). This new scale had a good internal reliability (Cronbach’s alpha: 0.86). However,
the quality of potential maternal modelling could not be assessed, as no data were
available (e.g. maternal dietary intakes), therefore the assessment of maternal
modelling focused on the opportunities that mother created and were defined as
“maternal modelling opportunities”. Lastly, the last two questions relating to
mealtime environment were considered separately (see Table 3 continued).
83 Cronbach alpha= 0.79

103
Table 3: Selected data to evaluate effects of key messages of the NOURISH intervention on maternal feeding choices for a child of two years
Effects Measures or construct
(section in Assessment T3 Questionnaire)
Original measurement
scales Scoring
Are mothers in the intervention condition more likely to trust their child’s satiety cues?
Pressure to eat (E3) (Birch et al., 2001). My child should always eat all of the food on his/her plate
5-point Likert-type scale: 1-Disagree to 5-Agree
Pressure to eat factor score = mean of the four items as indicated by Birch et al. (Birch et al., 2001). A lower mean score indicates a lower report of pressure to eat use, hence a positive feeding choice.
I have to be especially careful to make sure my child eats enough If my child says “I’m not hungry” I try to get him/her to eat anyway If I did not guide or regulate my child’s eating, (s)he would eat much less than (s)he should
Are mothers in the intervention condition more likely to expose their child to healthy food?
List of non-starchy vegetables and fruit ever tried (G2) 6-point Likert-type scale: 1-Likes a lot to 5-Dislike a lot + 6-Never tried
Recoding “ever tried” versus “never tried”. Vegetable exposure score = sum of vegetable ever tried out of number of vegetables suggested. Same calculation for fruit exposure score. Higher scores indicate higher exposure to a variety of healthy foods, hence positive feeding choices.
Do mothers in the intervention condition report being more likely to control unhealthy food exposure?
List of non-core foods ever tried (G2) Same as above except that a lower score for ‘‘non-core food exposure’’ indicates a lower exposure to unhealthy food, hence a positive feeding choice.
Covert control (E3) (Ogden et al., 2006) How often do you avoid going with your child to cafes or restaurants that sell unhealthy foods?
5-point Likert-type scale: 1-Never to 5-Always.
Covert control factor score = mean of the five items as indicated by Ogden et al. (2006). A higher score indicates a lower exposure to unhealthy foods, hence a positive feeding choice.
How often do you avoid buying lollies and snacks, e.g. Potato chips and bringing them into the house? How often do you not buy foods that you would like because you do not want your children to have them? How often do you try not to eat unhealthy foods when your child is around? How often do you avoid buying biscuits and cakes and bringing them into the house?

104
Table 3 continued
Effects Measures or construct
(section in Assessment T3 Questionnaire) Original Units of
measurement Scoring
Are mothers in the intervention condition more likely to be model eaters?
“Maternal modelling opportunities”
My child eats main meals with the rest of the family (F3)
5-point Likert-type scale: 1- Lot of the time to 5- Hardly ever
Maternal modelling opportunities score = reverse coding of the last question, then mean of the three items. A lower mean score indicates more maternal modelling opportunities, hence a positive feeding choice. However, this does not examine the quality of what is modelled.
My child eats the same food as the rest of the family (F3)
I cook separate meals for my child (F3)
Are mothers in the intervention condition more likely to create a positive meal time environment?
Positive meal time environment My child sits down when having meals (F3)
Dichotomisation on median split “a lot of the time” (positive feeding choice) versus others = Not a lot of the time.
My child watches television when having meals (F3) Dichotomisation on median split “a lot of the time” to “often” = yes versus “sometimes” to “hardly ever” = positive feeding choice.

105
4.2.3 Data management and analyses
Prior to the secondary analyses conducted for this PhD, data quality was assured by
several procedures. First, questionnaire data entry was centralised in Brisbane and
completed questionnaires were reviewed by a research assistant for missing
information and potential response errors before data entry occurred. Second, most
quantitative data were double entered, using either SPSS 18.0 for Windows (SPSS
Inc., Chicago, IL, USA) or Microsoft Access version 2007. Discrepancies were
cross-checked against the raw data and corrected if necessary. Third, data entry
issues were reported at fortnightly meetings where decisions were made and
recorded. In the case of unresolved issues, a second level of decision-making was
made by the Research Officer, the Postdoctoral Fellow and the Chief Investigator
and reported on a spreadsheet. A number of PhD candidates were also involved in
data entry and checking, including checks for coding and data consistency errors.
For the purpose of this PhD thesis secondary analyses, data were transferred to
Epi6Info84 in which all the syntax for secondary data manipulations and analysis
were performed, unless otherwise specified. Data were checked for outliers, and
tested for normality. Specifically, the distributional properties of the variables for
both the intervention and control participants (i.e. frequency counts and percentages
for categorical variables; means, medians, and standard deviations for ordinal and
continuous variables) were produced, to identify potential data errors and outliers,
and to assess whether variables were normally distributed85. Although, data had been
double entered by the NOURISH team including the present PhD candidate, a few
errors were found and checked against original data and corrected where appropriate.
84 Epidemiological software, made by the Centers for Disease Control and Prevention (CDC, Atlanta)
and WHO. 85 Histograms of the distributions of variables were first produced in order to identify the variables
which might not be normally distributed. For these variables, a check of whether the mean was
within 10% of the median value was performed. If it was not within 10%, the minimum and
maximum values were then checked to see if they were within three standard deviations of the
mean. If this last check was inconclusive, skewness and kurtosis coefficients were calculated to check
whether they were within the -3/+3 range. If not, the variables were assumed to be normally
distributed.

106
Specific re-coding and score calculations have been detailed in footnotes of Table 2
and Table 3. As certain measures were extracted from validated constructs, the
original scales were not modified. Therefore, scales used to measure each maternal
outcome were all different; hence, the expected effect of the intervention could be
indicated either by an increased or a decreased score in the intervention group
compared to the control group.
To consider potential missing data in the calculation of the fruit and non-starchy
vegetable “ever tried” scores, and of the non-core food “never tried” score, results
were expressed in percentages of the total number of responses per participant. This
allowed for the acknowledgement of missing data without assuming that non-
responses corresponded to “never tried foods”. Mean percentages of “ever-tried
food” and “never tried food” were calculated per group (control and intervention).
Consistent with this approach, for other maternal outcome scores (pressure to eat,
‘covert control’’, maternal modelling opportunities), all the questions needed a
response from each participant, so missing information for one question or more
resulted in the score being entered as missing.
To check internal consistency of existing constructs (e.g. pressure to eat, Killen
scale), Cronbach’s alphas were calculated on SPSS 18.0 for Windows (SPSS Inc.,
Chicago, IL, USA). A 0.7 Cronbach’s alpha was considered to indicate a reliable
measure (Field, 2009).
To compare groups, Chi-square (χ2) tests were performed for categorical variables86,
and the student t-test was used for normally distributed continuous variables, while
the Kruskall-Wallis (H) non-parametric test was used for continuous variables that
were not normally distributed. The traditional (two-tailed) 5% level of significance
was used to indicate statistically significant differences on selected maternal feeding
choices variable at T3. In contrast, no statistical tests were performed to compare
groups at baseline, as the groups had been randomly selected such that any difference
86 The corrected Yates Chi-square was used in the case of dichotomous variables, while the non-
corrected Chi-square test (equivalent to the Pearson test) was used in the case of ordinal variables.
The bilateral Fisher exact test was used in the case of small sample sizes (n<40) or for cell-counts less
than 5.
107
would have been due to chance (Kirkwood & Sterne, 2003, p. 400; Moher et al.,
2010).
The Intention-To-Treat analysis (comparison of maternal feeding outcome between
intervention and control groups) was conducted on all available cases87. For each
effect measure, a no-difference between control and intervention group (Null
hypothesis) was tested.
Results with categorical variables were expressed as a percentage. Results with
continuous and normally distributed variables were expressed in means with standard
deviation. For non-normally distributed variables median, 25th and 75th inter-quartiles
(IQR) were reported.
4.3 Results
4.3.1 Participant characteristics at baseline
Mothers’ ages ranged from 18 to 46 years, with a mean age of 30 years (SD = +5).
Most (542, 78%) were born in Australia, were married or living with a partner (659,
95%), and received university education (406, 58%). A minority (97, 15%) had
returned to work at the time of the assessment. For the latter mothers, return to work
took place at the child’s mean age of 3 months (SD= +1.5). The median family
income of mothers was high (3) corresponding to a family income above $1 347 per
week, or $70 001 per year. However, 113 mothers (17 %) reported having a
healthcare card, this being considered a proxy to identify mothers in financial need.
At first recruitment (Recruit-1), 571 (82%) mothers had reported a healthy weight
status before pregnancy. At Time 1 Assessment, on average, mothers were little
concerned with their own weight: the mean-weight-concern index was only 36%
(SD= +19) on the 0–100% scale of concern. The mean maternal BMI calculated from
direct measures taken on mothers four months after delivery was 26 (SD= +5.3). In
addition, 469 (69%) mothers did not have any concern at all with their baby’s
weight. Three hundred and seventy-five mothers (55%) reported having one or less
87 See section 2.3.1.

108
serve of fruit daily, and 380 (56%) reported two or less daily serves of vegetables. As
shown in Table 4, control and intervention groups were not different at baseline with
respect to maternal characteristics.
Table 4: Baseline characteristics of 698 first-time mothers enrolled in the
NOURISH trial
Control
(n=346)
Intervention
(n=352)
n
% or mean
(SD) n
% or mean
(SD)
Percentage born in Australia 343 79% 349 78%
Mean age at delivery (years) 346 30 (5) 352 30 (5)
Percentage married or living with partner 345 95% 351 95%
Percentage working 332 13% 351 16%
Mean baby age when mother returned to work
(months) 39 3 (1.5) 51 3 (1.5)
Percentage family income-per-week (AU$)
category
0–673 26 8% 25 8%
674–1346 128 39% 132 39%
>=1347 177 54% 178 53%
Percentage with healthcare card 332 18% 339 16%
Percentage with university education 199 58% 207 59%
Weight status
Before pregnancy (reported)
Percentage perceived normal 281 81% 290 83%
Percentage perceived under or overweight 64 19% 60 17%
Mean BMI (~4 months after delivery) 344 26.2 (5.5) 348 25.8 (5.1)
Mean score of maternal concern with own
weight a (5 items, α= 0.79) 333 37 (20) 337 35 (18)
Percentage maternal concern with baby
weight 334 34% 342 28%
Percentage reported in daily-fruit-serve
categories
0–1 serves 193 58% 182 53%
2 serves 107 32% 123 36%
>=3 serves 35 11% 37 11%
Percentage reported in daily vegetable-serve
categories
0–2serves 190 57% 190 56%
3-4 serves 119 36% 139 41%
>=5 serves 23 7% 11 3%
Differences between n and N indicate missing data; Percentages per category may not sum to 100% because of rounding; a Lower score indicates lower concern.

109
At baseline, 344 babies (49%) were male, aged between 2.2 and 7.3 months (mean
4.3 [SD = +1]). The weight for age z-score of all babies ranged between -2.8 and 3.1
(median -0.1 [IQR: -0.6 to 0.5]). Most of the babies (662, 97%) had been breastfed,
and 464 (74 %) were still being breastfed. Information on the reasons for stopping
breastfeeding was available for 163 of the 198 babies who were no longer being
breastfed: the median age at which breastfeeding was stopped was 1.4 months (IQR:
0.7–3). Around a quarter (166, 24%) of all babies had been introduced to solid foods.
The mean age of solid food introduction was 3 months [SD = + 0.07). For 40 babies
(24%) this introduction to solids was earlier than the recommendation. For 116
(70%) babies it occurred between 4–5 months. And for 10 babies (6%) it occurred
according to the 6-month WHO recommendation (WHO, 2001b). Of the babies who
had had solid foods, 145 (90%) were reported to be easy to feed by their mothers. As
reported in Table 5, babies from the control and intervention groups were similar at
baseline.
Table 5: Baseline characteristics of 698 babies enrolled in the NOURISH trial
Control (n=346) Intervention (n=352)
n % or mean (SD) or median (IQR) n
% or mean (SD) or median (IQR)
Percentage of males 346 50% 352 49% Mean baby age (months) 346 4.3 (0.9) 350 4.3 (0.9)
Median weight for age z-score at T1 346 -0.07 (-0.7 to
0.54) 350
0.00 (-0.6 to 0.55)
Percentage currently breastfed a 312 73% 319 74% Median baby age at breastfeeding
termination (months) 82 1.4 (0.5 to 2.3) 81 1.4 (0.7 to 3)
Percentage of babies who had been
introduced solid foods 346 24% 352 24%
Percentage of solid foods introduced
babies relative to baby age b
<4 months 21 26% 19 23% 4–5 months 54 66% 62 74%
>= 6 months 7 9% 3 4% Percentage easy to feed 80 91% 81 89% Differences between n and N indicate missing data; a Exclusive or mixed with formula feeding; b
Percentages per category may not sum to 100% because of rounding
110
4.3.2 Attrition comparison between control and intervention groups
Two potential reasons existed for data to be missing with respect to the variables
considered in the Intention-To-Treat analysis, which could affect the comparability
of the two groups: (i) some mothers discontinued their participation; and (ii) despite
continued participation, some of the data collected were not complete.
Of the 346 and 352 mothers who were allocated to the control and the intervention
group, 65 (19%) and 92 (26%) mothers respectively informed the NOURISH staff,
before T3 Assessment, that they would discontinue participation (Figure 7). These
attrition rates were significantly different between groups (χ21 =4.97, p<0.03). In
addition to this informed attrition, 36 mothers from the control group and 38 mothers
from the intervention group provided anthropometric data but did not return the T3
assessment questionnaire.
Comparisons of participants who did complete (hereafter called “completers”) and
did not complete (hereafter called “non-completers”) the T3 questionnaire were
conducted. This included participants who had dropped out formally from the
follow-up. Given that updated data at Assessment T2 were most likely to be missing
for these participants, the comparisons were made from data collected at baseline.
Observed differences between completers and non-completers are reported in Table
6.88
Missing data checks for outcome variables were performed, and did not show any
major decrease in data availability for the variables selected for the purpose of the
effect evaluation carried out in this chapter (see n values reported in Table 7).
88 Furthermore, the characteristics of mothers and children for “non-completers” were similar
between the control and intervention groups.

111
Table 6: Baseline characteristics of “completers” versus “non-completers” of
Assessment T3 Questionnaire (n=698)
“Non-
completers”
(n=231)
“Completers”
(n=467) χ2 c t P
n
% or mean
(SD) n
% or mean
(SD)
Mean age at delivery
(years) 231 29 (5) 467 31 (5) - 5.76 <0.001
Percentage married or
living with partner 229 90% 467 97% 13.79 - <0.001
Percentage with
healthcare card 216 25% 455 13% 14.30 - <0.001
Percentage with university
education 102 44% 304 65% 27 - <0.001
Mean score of maternal
concern with own weighta 215 41 (20) 455 34 (18) - 4.24 <0.001
Percentage breastfeeding
at baselineb 206 61% 446 77% 16.55 - <0.001
Differences between n and N indicate missing data; a A lower score indicates a lower concern; b
Exclusive or mixed with formula feeding; c Yates corrected Chi-square
4.3.3 Measuring the effects of NOURISH on selected maternal feeding
choices, six months after intervention completion
As shown in Table 7, pressure to eat and maternal modelling opportunities scores, as
well as mean percentages of ever tried vegetables were significantly modified in the
expected direction in the intervention group.

112
Table 7: Comparison between control and intervention groups on selected maternal outcomes when the child was 24 months old
Selected maternal outcomes
Control (n=245) Intervention (n=222) Statistical tests
P
value
n Mean (sd) or % n Mean (sd) or %
Student
t
Corrected
Yates χ21
Pressure to eat (↓= )
(1: Disagreement to 5: Agreement) 244 2.3 (1) 220 1.8 (0.9) 5.1 - <0.001
% of tried fruits from 18 suggested fruits (↑= ) 245 89 (9) 222 91 (8) 1.4 - 0.17
% of tried vegetables from 21 suggested vegetables (↑=
) 245 86 (11) 222 89 (10) 2.8 - 0.01
% of tried non-core foods from 24 suggested non-core
foods (↓= ) 245 74 (17) 222 71 (17) 1.6 - 0.11
Covert control (↑= )
(1: Never to 5: Always) 243 3.3 (0.9) 220 3.3 (0.7) 1 - 0.33
Maternal modelling opportunities (↓= )
(1: A lot of the time to 5: Hardly ever) 244 2 .2 (1.1) 221 1.9 (1) 3.6 - <0.001
Child sits down when having a meal
Yes: A lot of the time 149 61% 148 67% 1.48 0.22
No: Not a lot of the time 96 39% 74 33%
Child may watch TV when having a meal
No: “sometimes” to “hardly ever” 179 73% 170 77% 0.59 0.44
Yes: a lot of the time” to “often” 66 27% 52 23%
(↓= ): Lower scores indicate better feeding choice. (↑= ) Higher scores indicate better feeding choice. : positive feeding choice

113
4.4 Discussion
The results presented here suggest that the NOURISH intervention was effective in
equipping mothers with some positive feeding choices. The mothers from the
intervention group reported decreased scores of pressure and maternal modelling
opportunities and an increased score for vegetable exposure. These outcomes were
expected effects of the intervention. In contrast, it does not appear that the
intervention modified the strategies of mothers relating to limiting exposure to
unhealthy food, increasing exposure to a diversity of fruits, and positive mealtime
conditions.
This observation of a partial effectiveness in modifying selected maternal feeding
choices is consistent with results of two other Australian RCTs (Infant Feeding
Activity and Nutrition Trial, INFANT (Campbell et al., 2013; Lioret, Campbell et al.,
2012), Healthy Beginning Trial, HBT (Wen et al., 2012)) and one American RCT
(“Making Our Mealtimes Special” (MOMS) study (French et al., 2012; Groner et al.,
2009), which all have used anticipatory guidance for first-time mothers to prevent
childhood obesity. In contrast, the parallel analyses conducted by the NOURISH
team on maternal choices related to “what” and “how” feeding, recently reported that
the intervention modified 17 maternal feeding practices, including Pressure to eat,
out of the 21 reported (Daniels et al., 2013). Prior to further comparisons, it is
worthwhile noting that, similar to these secondary analyses, only HBT (Wen et al.,
2012) reported on the four maternal feeding choices as to what, when, where and
how they influence child eating (see section 2.4.1.3).
INFANT was very similar to the NOURISH research programme with respect to its
objectives and methods to achieve them. INFANT was a cluster RCT developed in
Melbourne (Campbell et al., 2008; McLeod et al., 2011) which addressed obesity
prevention by using anticipatory guidance to 542 first-time parents of 3.9-month-old
babies in order to improve aspects of child diet as well as child sedentary patterns.
Similar to the NOURISH Research programme, anticipatory guidance coincided with
child development stages but INFANT consisted of six two-hour information group
sessions and was run by a dietitian only. In addition, the key messages of INFANT

114
relied on Satter’s division of responsibility, parent feeding skills development and
parent modelling of eating (Campbell et al., 2008). Although INFANT measures to
evaluate the impact of key messages on maternal outcomes were not all the same as
those used for this present research, outcome comparisons with the NOURISH
research programme remain worth exploring. Specifically, at post-intervention and
20 months of child age, partial changes in the expected direction were observed in
INFANT outcomes. For instance, the quality of maternal modelling outcome as
measured by maternal dietary pattern scores, physical activity and sedentary times
(i.e. quality of modelling) partially improved: non-healthy dietary patterns score
decreased significantly in the intervention group, while no modification in other
maternal outcomes was observed (Lioret, Campbell et al., 2012). In addition, child
sweet snack (i.e. specific non-core food) intakes decreased significantly and non
significant trends in the expected directions were observed in child dietary intakes
(e.g. increased fruit, vegetable and water intakes and decreased non-core drinks and
savoury snack intakes (Campbell et al., 2013). Both present NOURISH and INFANT
results suggest that first-time mothers might be receptive to the modelling message
and to some extent to the healthy and non-healthy foods exposure messages as
assessed by child increased vegetable exposure in NOURISH and decreased intake of
sweet snacks in INFANT.
The Healthy Beginning Trial (n=667), was designed to provide, during eight home
visits, proactive support with respect to maternal feeding to first-time mothers in
disadvantaged areas of Sydney (Wen et al., 2007). Again, it impacted partially on
some maternal feeding and modelling outcomes. Specifically, the “use of food as a
reward” feeding practice, the number of daily vegetable serves consumed by
children at 24 months of age and by mothers were positively affected by the
intervention (Wen, Baur, Simpson, Rissel, & Flood, 2011; Wen et al., 2012).
However, fruit and non-core food intakes of mothers and children were not modified.
In contrast to NOURISH, exposure to TV during meals, measured by two indicators,
was decreased in the intervention group. It is worth noting that compared to the
NOURISH sample, prevalence of TV exposure during meals was higher in the HBT
sample. Specifically post-intervention, 56% of children from the HBT intervention
group and 68% of children from the HBT control group had dinner while watching

115
television (p=0.01). This is approximately twice the prevalence reported in the
NOURISH children. This difference in prevalence is consistent with inverse
associations found in the literature between maternal income, maternal education and
watching television during meals (Baughcum et al., 2001; Coon et al., 2001; Dubois,
Farmer, Girard, & Peterson, 2008)89. HBT mothers were younger, living in a
disadvantage area and less educated than NOURISH mothers. The lower prevalence
in NOURISH of children watching TV during meals (i.e. mothers complying
relatively well to health recommendations) might have limited the capacity to show a
smaller effect than this observed in HBT90. This interpretation might also apply to
the measure of the difference in fruit, vegetable and ‘‘non-core food exposure’’
outcomes. Campbell et al. (2013) reported that child intakes of fruit and vegetables
were particularly high, while non savoury snack intakes were particularly low in both
intervention and control groups of the INFANT. This could have been related to the
high education profile of the INFANT participants, which was similar to that of
NOURISH participants. The extent to which the selection of mothers with specific
maternal characteristics might have contributed to the intervention impact will be
further discussed in Chapter 6.
The MOMS study which also used an anticipatory guidance with 292 American
mothers (mean age 24 years) of 0–6 month infants (Groner et al., 2009), was also
partially effective at modifying feeding choices (French et al., 2012). This cluster
RCT, designed to prevent childhood obesity, tested two anticipatory guidance
conditions against the usual care condition in low-income areas of Columbus, Ohio.
The first condition focused on maternal eating habits and their modelling influence
on child eating. Messages to mothers included quality and quantity of meals and
89 Maternal education and income have been inversely associated with TV watching during meals
(r=-0.25, p <0.05 and r=-0.29, p<=0.01) in an American cross-sectional study examining the food
consumption patterns of 10-year-old children (n= 91) (Coon et al., 2001). Similarly, Dubois et al.
(2008) reported increased proportions of 4 to 5-year-old Canadian children watching TV when having
meals in lower educated and lower income families (χ2 = na, p<0.05). Baughcum et al. (2001)
reported a lower degree of interaction at meals in 634 mothers of 23 to 60 months old children.
Their measure of interaction at meals included TV at meals, set mealtime and sitting down with the
child at meal. 90
23% of the intervention group versus 27% of the control group of NOURISH let their child have a
meal while watching TV. The difference between groups after the intervention was thus 4 per cent.
In the HBT trial, the difference observed between groups after the intervention, measured by two
indicators, was 10 and 12 per cent (i.e. 2.5 to 3 times more than in the NOURISH trial).

116
mealtime context (e.g. TV off and eating with other family members). The second
condition focused on child-eating and, similar to NOURISH, it provided mothers
with guidance with respect to solids introduction, portion size and preservation of
child satiety cues. Compared to the usual care condition, increased serves of fruits to
children aged 12 months were reported in both anticipatory conditions, while
increased vegetable serves were observed in the maternal-focused condition only
(Frenchet al., 2012). Results with respect to pressure to eat were not reported.
Skouteris et al. (2011) have reported in a systematic review six other trials which
attempted to modify concomitantly several of the selected feeding choices of
preschool children (Dennison, Russo, Burdick, & Jenkins, 2004; Fitzgibbon et al.,
2005; Haire-Joshu et al., 2008; Harvey-Berino & Rourke, 2003; Horodynski &
Stommel, 2005; McGarvey et al., 2004). None of these successfully modified all the
selected feeding choices they addressed. Further comparisons of present results with
all of these studies but one (McGarvey et al., 2004) are difficult given differences in
design and sample size. Although, not randomised, the “Fit WIC” controlled trial
(McGarvey et al., 2004) (USA, n=386, child-age: 2–4 years) is worth noting given its
similarities to the NOURISH research programme. This trial was developed to test
the effectiveness of an improved version of the Women, Infant and Child program
(WIC) designed for American low-income mothers. The intervention group could
attend six educational groups and receive two individual sessions with a WIC
nutritionist. An anticipatory approach was used to deliver six key messages similar to
NOURISH messages91. These messages were reinforced by provision of written
materials, staff modelling healthy lifestyles and by collaborating organisations in the
community. Control participants received the usual WIC program. Both groups were
comparable at baseline. One year after baseline, only frequency of parent offering
child water increased significantly in the intervention group, while no difference with
respect to daily offer of fruits and vegetables, modelling and mealtime with TV off
were observed.
91 (1) increase physical activity, (2) monitor mealtime behavior, (3) limit household television
viewing, (4) drink water instead of sweetened beverages, (5) consume 5 fruits or vegetables daily,
and (6) increase family activities to promote fitness (McGarvey et al., 2004).

117
4.5 Conclusion
Based on the results of the effect evaluation of NOURISH on selected maternal
outcomes presented in this chapter, it appears that anticipatory guidance was
effective in modifying some of the selected feeding choices (pressure to eat, maternal
modelling opportunities and child exposure to vegetables) of first-time mothers at
child age 24 months. These group differences were small, and it is difficult to
interpret whether effect sizes are clinically meaningful. The Intention-To-Treat did
not address whether NOURISH messages were implemented as planned and thus
could not distinguish between ineffectiveness of intervention on some outcome and
implementation failure. Type III error will be addressed in Chapter 5. In addition, as
for any RCT, the ability to extrapolate these results, from the intervention to the
broader population, will be largely dependent on the representativeness of the sample
of participants, as compared to the population. This question of representativeness of
the sample will be explored in Chapter 5, and how the intervention process may have
affected effectiveness of the intervention, will be examined in Chapter 6.

118

119
Chapter 5 Process evaluation
5.1 Introduction
As stressed in section 2.5, elements relating to the context, generalisability and
dissemination of childhood obesity prevention research have rarely been reported
(Klesges et al., 2008). This makes the translation of research results into policy
difficult. However, it is important to understand the factors that may influence the
effectiveness of the intervention. The process data collected as part of the NOURISH
research programme provides an opportunity to gain insights into the reasons for the
results of the effect evaluation. Specifically, it helps addressing internal validity of
effect evaluation results with respect to type III errors92 (i.e. Was the NOURISH
intervention delivered as planned?), and it provides useful information with respect
to applicability and generalisability (i.e. for whom and under what circumstances was
the programme implemented?) to future child obesity prevention programmes in
Australia.
The objective of this chapter is to report on the NOURISH process evaluation
including the assessment of the overall implementation, reach and adoption
performance within their temporal and regional context (see Figure 2). This
assessment also includes reporting on encountered barriers to performance. Thus,
this chapter addresses specific and complementary research questions that are listed
below with their related aims. Because addressing overall Implementation of the
NOURISH research programme involves addressing quantitative measures of reach
and adoption, to avoid repetition each specific research question addressed by the
process evaluation is developed in the methods and result sections following the
above order:
(i) Reach: who were the participants reached by the NOURISH research programme?
The aims of this analysis were twofold: first, to describe the process by which
92 See Glossary

120
participants were retained; second, to assess the generalisability (i.e. the external
validity) of the effect evaluation of the NOURISH RCT.
(ii) Adoption: how well was the NOURISH intervention adopted by participants?
The aim of this analysis was to determine the extent to which the NOURISH
research programme provided participants with a range of activities that met their
needs and encouraged continued attendance.
(iii) Implementation: how well was the NOURISH intervention delivered? The aim
of this analysis was to examine the internal validity of the NOURISH RCT, by
specifically examining whether a type III error had occurred93.
5.2 Methods
The research methods in this chapter are presented using the following structure. In
the first sub-section, the data collection and management implemented by the
NOURISH research programme, as related to process evaluation, are presented. This
provides the empirical information on which analyses are based. The following sub-
sections successively present the analytical methods for the reach, adoption and
implementation components of the process evaluation carried out in this chapter. For
each process component, overall approach, data selection, and analytical methods are
described.
Brisbane and Adelaide are the two Australian Capital cities of two Australian Federal
States. Both have specific histories of social, political, economic and urban
infrastructure policies, hence living conditions. For instance, the “Australian Cities
Accounts report”94 has shown fluctuating economic differences over years between
Australian Capital Cities, as measured by their different contributions to the national
Gross Domestic Product (GDP). Similarly, in the course of the NOURISH research
programme development differences were reported between the two cities with
93 For definitions see Glossary or section 2.3.2
94 http://www.sgsep.com.au/files/GDP_by_Major_Capital_City.pdf. accessed on 7/11/2013.
121
respect to the organisation of primary care services95. Such differences might have in
turn influenced the implementation of the research programme. Thus, cities and
cohorts were considered relevant proxies to address the context of each process
component of the NOURISH research programme.
5.2.1 Data collection and management
Data collection by the NOURISH research programme has been described in section
3.4, alongside the description of the trial’s implementation. It is also illustrated on
the right-hand side of the CONSORT flow chart (see Figure 7). Process data were
collected at the enrolment and intervention delivery phases of the trial. Some of these
data were collected by the same measurement tools used for effect evaluation (T1,
T2 and T3 Assessment questionnaires), but some were collected using
tools/questionnaires specific to the process evaluation. Most process data were close-
ended questions, with a few open-ended questions relating to participants’ and
facilitators’ perceptions. All questionnaires were self-reported and confidentiality of
responses was respected. Table 8 presents a summary of data collection tools used, as
well as the data that were selected or generated for the process evaluation.
The quality of process data was assured by several procedures. First, staff were
specifically employed to undertake the initial contact and data collection at maternity
hospitals (see section 3.4.1). Second, when participants96 were recontacted by mail,
they were provided with a covering letter detailing the enclosed colour-coded
questionnaires, and providing information on what to do with those questionnaires.
Third, staff involved in the delivery of the intervention (facilitators and co-
facilitators) received a full day of training which included intervention delivery and
process data collection protocols. Fourth, process data extracted from the T1, T2 and
T3 Assessment questionnaires were managed following a standardised procedure by
Brisbane research staff (see section 4.2.3). Conversely, data that were specifically
collected for the process evaluation, were
95 For instance, in contrast to Queensland Health services, a primary care service database with
respect to child and women’s health existed in South Australia. 96
Recruit-1 participants who consented to a later contact

122
Table 8: Sources of data to inform the process evaluation: key components and sub-components
Key process component and overall research questions
Process sub-component
Collection tools (see appendices 1–8 ) Data
Reach and barriers at enrolment and intervention delivery within their context. Who were mother–infant dyads involved in the NOURISH research programme?
Reach at Recruit-1 Recruit-1 form for consenters to a later contact + Recruit-1 form for non-consenters to a later contact.
Participant socio-demographic characteristics (mother age, education level, birth location, indigenous status, marital status). Reported maternal weight status, child feeding mode intention. Alcohol* and cigarette smoking during pregnancy*. Baby’s birth weight.
Reach at Recruit-2 Recruit-2 non-consent form + Sections A, C, Q of Assessment T1 form for consenters
+ Breastfeeding, concern about baby’s weight, solid food introduction, reasons for not participating.
Reach at Module-1 delivery
Sections A, C, Q Assessment T1 form for intervention allocated participants + Module-1 attendance log
+ Feeding mode and solid or semi-solid introduction. Mother employment status and conditions, occupation, income. Attendance per session Reasons for 0 attendance
Reach at Module-2 delivery
Sections A, C, Q Assessment T2 form for intervention allocated participants + Module-2 attendance log
Same as above raw
Intervention adoption and barriers for each module within their context. How well was NOURISH adopted by recipients?
Participant perception of usefulness Parent feedback surveys
Usefulness of teaching strategies Usefulness for knowledge development Usefulness for behavioural change
Participant satisfaction Satisfaction with staff and programme Intervention acceptability
Attendance logs
Count of attended sessions per participant Reported difficulties to attendance
Implementation and barriers for each module within their context. How well was the NOURISH intervention implemented?
Reach rate Attendance logs 0 attendance versus attendance Dose delivered Session monitoring books Count of delivered sessions
Full dose received Attendance logs Count of full dose participants
Fidelity Session monitoring books Q1,2,3,5 + Q10–15
Quality of management and facilitation, and content coverage rated by facilitators and co-facilitators.
Difficulties Session monitoring books Q8–9
* data not collected for “non-consenters to a later contact”

123
primarily entered by research staff of each city in either of two distinct databases97 or
as text in Word documents (e.g. participants’ open-ended responses). The PhD
candidate accessed whole copies of Word documents and partial copies of the
separate databases via SPSS 18.0 for Windows (SPSS Inc., Chicago, IL, USA), and
MS Excel spreadsheets. Management by the PhD candidate of these process data
consisted of organising data in a consistent manner, and checking for coding
consistency and coding errors against original data before merging database copies
into MS Excel spreadsheet files. It also consisted of coding open-ended questions
and in some cases of checking data against information recorded in Excel
spreadsheets that research officers held to organise information session venues (e.g.
booking sheets). Further details are provided in Appendix 10. In addition, for all
process data, the PhD candidate followed the same prior analytical procedures as
those used for the effect evaluation data (i.e. transfer of data, data checking and
cleaning, and analysis in Epi-Info 6) (see section 4.2.3). Appendix 12 outlines for
each process component the data selected amongst the data collected, provides
justification for the selection, and details of re-coding as well as performance score
calculations.
5.2.2 Reach: Who were the participants involved in the NOURISH
research programme?
Overall approach
The initial analytical objective, in addressing the reach of the NOURISH research
programme, was to determine the characteristics of attendees versus non-attendees,
considering the intervention condition only. Given that data were collected alongside
the enrolment process, it was felt that describing this enrolment process, which led to
the selection of the final audience of the intervention, would provide a more in-depth
understanding of the enrolment and engagement processes. In turn this would
advance the health promotion field as such data on recruitment and retention
97 These could be Microsoft Access version 2007 (e.g. participant attendance) or SPSS 18.0 for
Windows (SPSS Inc., Chicago, IL, USA) (e.g. implementation process component).

124
processes are rarely reported (Foster et al., 2011; Treweek et al., 2011). Thus, the
analytical objective was extended to include comparisons between all mothers who
remained in the trial versus mothers who did not, at each stage of the enrolment and
the intervention phases of the research programme. Finally, this analytical approach
of the NOURISH research programme process from screening to Module-2 delivery
led to the fifth longitudinal description of reach performance. This fifth descriptive
stage allowed reach process comparisons with other similar obesity prevention
research and suggestion of key elements that might have led to the selection and
retention of mother–infant dyads with a particular profile. For each of these five
descriptive stages a specific research question was addressed:
1. Who were first-time mothers approached at maternity hospitals (reach at
Recruit-1)?
2. Who were first-time mothers who could be recontacted, 4–7 months after
Recruit-1 (reach at Recruit-2)?
3. Who were the first-time mother–child dyads who attended at least one
information session, when baby was about 4–7 months old (reach at
Module-1)?
4. Who were the first-time mother–child dyads who attended at least one
information session, when baby was about 13 months old (reach at Module-
2)?
5. Compared to other trials and to characteristics of >=18-year-old first-time
mothers of the general population, how did the proportions and
characteristics of participants evolve across study stages?

125
Data selection
Table 39, Table 40 and Table 41 in Appendix 12 outline the data selected to conduct
the reach analyses.
Analytical approach
First, for each of the four cross-sectional analytical stages of the NOURISH research
programme (see Figure 7), the reach process was examined by calculating reach
performance scores of mothers retained out of the total number of mothers involved
at the relevant stage. These performance scores were then compared to reach
performance objectives presented in section 3.3.2.2.
Definitions of each reach performance score is given in Table 9, where reach
performance objectives defined in section 3.3.2.2, are also reported. No difference
with respect to performance objectives was assumed between cohorts and cities.
Table 9: Definitions of reach performance scores at the end of each stagea of the
NOURISH research programme
Reach performance scores
Definitions Reach Performance objectives
Recruit-1 Reach performance score
=
Number of mothers who consented to be recontacted
60% Number of mothers approachedb at Recruit-1
Recruit-2 Reach performance score
=
Number of mothers who consented to full enrolment
70% Number of mothers recontacted and eligible at Recruit-2
Module-1 Reach performance score
=
Number of mothers who attended at least one Module-1 information session
Not specified 352 mothers allocated to the intervention condition
Module-2 Reach performance score
=
Number of mothers who attended at least one Module-2 information session
Not specified 352 mothers allocated to the intervention condition
a see left-hand side of the CONSORT flow chart presented in Figure 7; b These mothers were eligible as they had already been screened for eligibility see CONSORT flow chart

126
Second, comparisons between mothers retained and not retained were carried out,
with respect to maternal and child characteristics. Since these analyses were similar
to those conducted to compare groups at baseline (see sections 4.2.3 and 4.3.1), the
syntax written in Epi-Info6 for this purpose was re-run for each new comparison, at
each stage of the trial. In addition, data check methods and statistical tests used to
compare groups were the same as those described for the effect evaluation (see
section 4.2.3).
To provide insight into potential reasons for such a reach process, a two-step
longitudinal analysis was conducted.
The first step consisted of comparing the NOURISH reach process with other
studies, with respect to reach performance and strategies used at the different phases
of trials. Calculations of specific reach performance scores were standardised and
calculated from numbers of participants involved at each stage of enrolment,
randomisation, delivery and follow-up extracted from published CONSORT Flow
Charts. The resulting reach performance scores were reported in a table with specific
strategies used by studies to enrol, randomise and follow-up participants as well as to
deliver intervention. Selection criteria of comparable studies were: studies i) with the
same primary outcome of preventing childhood obesity by developing prevention
early in infancy (i.e. around solids introduction), ii) with an RCT design, and iii)
conducted in Australia in order to account for potential cultural specificities in
research involvement (Askie et al., 2010). As using clusters to enrol participants into
research programme addresses a recruitment strategy rather than a research
programme objective per se, process results from cluster RCTs were also considered.
The second step of the longitudinal analysis consisted of identifying when
differences occurred between the local reference population and the NOURISH
participants. Characteristics of NOURISH participants at each stage of the trial were
plotted together with the reference population characteristics in Figure 23. The
choice of characteristics to plot was based on available data for the reference
population. Mother age, country of birth, indigenous status, marital status and baby
gender distributions were available at State level. Queensland data were extracted

127
from the Perinatal Data Collection database and communicated by the Health
Statistic Centre of Queensland Health. South Australia data were extracted from the
“Pregnancy Outcome in South Australia 2009” report (Chan A et al., 2011). In
addition, statistical summaries on education attainment for 15–44 year old people
(males and females combined) in Brisbane and Adelaide were extracted from the
national Survey of Education and Training (SET) conducted on 15–64 year old
people (males and females combined) by the Australian Bureau of Statistics (ABS)
between March and June 2009
(http://www.abs.gov.au/AUSSTATS/[email protected]/DetailsPage/6278.0.55.0052009?OpenDocument).
Comparison of education attainment between the sample and the target population
was then conducted, for both cities. To match with ABS population data and the
purpose of this comparison only, first, both maternal and paternal education levels
were considered in the analyses and combined proportions per level of education
attainment were then calculated. Second, education attainment was recoded in two
categories: post-secondary versus others. Post-secondary education included all
certificates, diploma and bachelor degrees obtained at University or Technical and
Further Education College (TAFE).
Finally, reasons for not participating, collected from the Recruit-2 stage of the trial
process, were summarised as counts of cited reasons. This formed the basis on which
to seek reasons for non-participation. Reasons given by mothers at Recuit-2 were
sourced from the Recruit-2 non-consent form (Appendix 3). Reasons for non-
attendance to a module were sourced from the notes entered into the two separate
tracking databases held by research officers in Adelaide and Brisbane. Although
attempts were made to standardise reasons on the basis of the attendance log (see
Appendix 6), data entry between the two cities was not consistent, and the “other
reasons” item was the one most frequently selected98. The “other” reasons category
was re-coded based on the notes provided in the tracking databases. Reasons for not
reaching people at module delivery (0-session attendance) were collected with the
same tool as reasons for those who had been reached but missed some sessions.
However, for the latter mothers, difficulties to attendance were also addressed via a
98 7 categories of reasons for not attending were suggested in this order: “Time”, “Away”, “Illness”,
“Transport”, “Childcare”, “Work”, “Other”.

128
set of close-ended questions (Q8) contained in the Parent feedback questionnaire
(Appendix 8). Since the initial coding of difficulties to attendance between the parent
feedback questionnaire and the attendance log was inconsistent, re-coding of the
reasons for non-attendance was performed by the PhD candidate in order to establish
consistent treatment of the information collected across both tools and reach analyses
(see Table 41 in Appendix 12). In addition, given that participants could cite the
same reasons for missing several sessions, a single citation count was made for each
participant per module.
5.2.3 Adoption: How well was the NOURISH intervention adopted by
participants?
Overall approach
Given that, limited information was available regarding how this component was
addressed at programme development, the evaluation of intervention adoption was
based on data availability and focused on the following research questions:
1. To what extent did participants comply to the intervention?
2. How satisfied were the participants with the intervention?
3. How useful was the intervention to participants?
4. What were the difficulties which prevented adoption?
Data selection
Data selected to assess the adoption process component were extracted from the
Parent Feedback questionnaires (Appendix 8) and the attendance logs (Appendix 6).
These are listed in Table 42 in Appendix 12.
Analytical approach
Given that no performance objective had been defined for this process component,
rather than objective achievement assessment, performance assessment was defined
from measures of identified proxies of adoption (i.e. session attendance, reported
129
usefulness of the intervention and reported satisfaction by mothers). As related data
were mostly quantitative and provided complementary information, the analytical
approach consisted of quantifying each of these adoption proxies.
Session attendance or intervention dose received by participants, or exposure level,
was defined as the number of attended sessions per participant. For each module, the
dose received could range from 0 to 6 group sessions.
Because participant satisfaction and perceived usefulness were measured by several
questions rated on various Likert style scales, quantification of satisfaction and
usefulness consisted of two analytical stages. Frequencies of response options for
questions related to satisfaction and usefulness measures were first calculated. This
allowed identification of the strengths and weaknesses of the intervention delivery.
Second, satisfaction and usefulness scores were created by averaging response scores
across questions for each individual. This allowed reporting of satisfaction and
usefulness scores by cohort, city and module. For satisfaction scores, questions Q1
and Q2 related to satisfaction with staff and sessions were considered; for usefulness
scores, 10 variables included in questions Q4 and Q5 were considered (see Table 42
in Appendix 12). The calculated scores ranged from 1 to 399, where a score of 3
indicates satisfaction or high perceived usefulness. Given right skewness of these
adoption scores, median scores per participant were calculated.
Adoption difficulty analyses were based on the recoded reasons of non attendance
given by mothers who attended at least one session (Attendance log and Question 8
of the parent feedback questionnaire, see section 5.2.2), and on one open-ended
question (Q11) from the parent feedback questionnaire (see Appendix 8) related to
what participants disliked most about NOURISH. These latter responses had been
entered as text into separate Word documents by study staff (see Appendix 11). The
PhD candidate conducted a qualitative thematic content analysis of these responses.
This consisted first in identifying an exhaustive thematic list. Then, responses were
checked in relation to this list of themes and counted (see Table 35 in Appendix 10
and Table 42 in Appendix 12)
99 Satisfaction score scale: 1-Not satisfied, 2-Neutral, 3-Satisfied. Usefulness perception score scale:
1-Not at all useful, 2-Useful, 3-Very useful.

130
Finally, to assess the extent to which responses to the parent feedback questionnaire
could be biased, those who completed at least one Parent Feedback questionnaire
were compared to those who did not complete any, with respect to the dose received,
maternal age and education.
5.2.4 Implementation: compared to the plan, how well was the
NOURISH Research Programme implemented?
Overall approach
To address the Implementation process component, the approach suggested by
Linnan et al. (2002) was adopted. These authors suggest that Implementation can be
quantified using “a composite score that indicates the extent to which the
intervention has been implemented and received by the intended audience” (Linnan
& Steckler, 2002, p. 12). Specifically, they suggest considering reach, dose
delivered, dose received and fidelity. Thus, five research questions were considered
in this part of the analysis:
1. How well did NOURISH reach its target audience?
2. How well was the dose delivered?
3. How well was the delivered dose received?
4. How well did the NOURISH content match the planned content?
5. What were the barriers to the information delivery?
Data selection
Data selected to address the Implementation process component were extracted from
attendance logs (Appendix 6) and session monitoring books (Appendix 7), as listed
in Table 43 in Appendix 12.
131
Analytical approach
To define an overall Implementation composite score, methods suggested by Linnan
et al. (2002) and Bartholomew et al. (2010) were used. The former suggest
percentage calculations of reach, dose delivered, dose received and quality of
delivery (fidelity), which should then be combined into the composite score with an
equal weight. Bartholomew et al. (2010) follow the same approach, but rather than
percentage calculations, they suggest that indices reflecting the intervention’s
observed process performance relative to process performance objectives be
calculated, hence rating the extent to which these objectives are being met. The
analytical approach of Bartholomew et al. (2010) was primarily sought as it provides
objective measurement of performance objectives. However, given that no
performance objective had been stated with respect to the fidelity component (see
section 3.3.2.2), no fidelity performance index could be calculated. Consequently, an
Implementation composite score was calculated rather than an Implementation
composite Index. Nevertheless, both calculations were performed whenever possible
and are described in the following sub-sections.
5.2.4.1 Reach performance at intervention delivery (How well did
NOURISH reach its target audience?)
The overall reach performance score at intervention delivery is the count of
participants who attended at least one group information session across both modules
out of the 352 participants that had been allocated to the intervention. This
performance score is complementary of the two distinct performance scores
calculated for each module (see section 5.2.2).
Since a performance objective for overall reach at delivery was established at 65%
(see section 3.3.2.2 ), an overall reach performance index could be calculated as
followed:
Overall reach performance index = performance score / 65.

132
This could not be calculated per module as no specific performance objectives had
been defined at the level of individual modules.
5.2.4.2 Dose delivered performance (How well was the dose delivered?)
The dose delivered performance score was defined as the number of information
groups to which the full dose was delivered, out of the total number of information
groups. A full dose delivered was 6 sessions per module, hence 12 information
sessions at the end of the intervention. In addition, as a 100% performance objective
had been stated, the dose delivered performance index was calculated as followed:
Dose delivered performance index = performance score / 100.
In cases where no data were recorded in session monitoring books for a particular
session, a check was carried out as to whether this was due to missing data resulting
from facilitator or co-facilitator non-response, or due to the fact that the session had
been cancelled (see Table 43 in Appendix 12).
5.2.4.3 Dose received performance (How much of the full dose was
received?)
The performance score for the dose received was defined as the number of
participants who attended all the information sessions that were delivered, out of the
352 participants who had been allocated to the intervention group. It assesses the
extent to which participants received the full content of the intervention. In some
cases, the denominator used to calculate this score was not always based on the full
dose delivered as defined above. Indeed, in cases where sessions were cancelled, the
project team endeavoured to deliver the content of the cancelled session, by either
inviting participants in the group that had a session cancelled to join another group,
or delivering the content of the cancelled session alongside the content of another
session. For example, content of sessions 5 and 6 was delivered in a single session
for some groups. Hence, in some cases, the full content of the intervention was
delivered in fewer than 12 group sessions. Thus for each participant, the denominator
was adjusted case by case, and the percentage dose received was calculated per

133
participant, then averaged per module. Participants were then dichotomised into two
categories: full dose participants (100%) and non-full dose participants (<100%).
As a 100% performance objective had been defined for this process component, an
index of performance could be calculated, per module and for the intervention as a
whole.
5.2.4.4 Fidelity performance (How well did the NOURISH content match
the planned intervention content?)
The fidelity performance score was defined as the number of sessions which were
consistently delivered and for which the intervention content was fully covered, out
of the total number of delivered sessions (i.e. the fidelity score combines consistency
and integrity scores).
Prior to the calculation of fidelity, consistency and integrity scores, and percentage
agreement analyses were performed. Indeed, since all group information sessions,
with the exception of cohort 2 Module-2 sessions, were independently rated by both
facilitators and co-facilitators (see 3.4.3), checking the agreement of these ratings
allowed estimation of their reliability (see note in Table 43 in Appendix 12).
Consistency score calculations were derived from four questions (Q1, Q2, Q3 and
Q5, see Appendix 7 and Table 43 in Appendix 12). These questions addressed: (i)
how well facilitator pairs managed to develop an interaction with the audience, and
(ii) reinforce the intervention message, (iii) how confident they were with the
message included in the standardised resource, and (iv) their ability to deliver the
content within the planned session time. These questions were initially rated on a 5-
point Likert scale ranging from 1-“much less than planned” to 5-“much better than
planned”. They were re-coded into two categories “less well than planned” and “at
least achieved as planned” because no answer was found for “much less well than
planned”, and because one facilitator with a significant contribution to the overall

134
intervention100 stressed that “the much better than planned” did not make sense to her,
and only gave a maximum rate of 3, equivalent to “as planned”.
Integrity score calculations were derived from responses to six questions (Questions
10 to 15, see Appendix 7) which assessed how much of the content required by the
intervention was covered. Since this information content was developed following a
similar structure across all sessions, each question was themed and could be repeated
across sessions. Question 10 rated the introduction of the session, which reviewed
the previous session. Questions 11 to 13 rated coverage of the topics that were to be
developed during sessions. Question 14 rated the coverage of interactive activities
and Question 15 rated the coverage of the take-home message and things to try at
home. Answers were rated on a 3-point scale: 1-“did not manage to get to it”, 2-
“only just touched on it”, 3-“covered all”. As the objective was to provide
participants with the full content of the message, these questions were re-coded into
two categories: “fully covered” and “not fully covered”. Each item included in the
consistency and integrity analyses were separately described as percentage of
protocol “at least achieved as planned” or “fully covered”. This was used to identify
where potential issues occurred. In addition, scores on relevant items were averaged
to define overall consistency and overall integrity scores. These scores were in turn
averaged into the fidelity score. Calculations are detailed in Table 43, in Appendix
12.
Analyses of barriers to intervention delivery Implementation were based on two
close-ended questions (Q8 and Q9) and one open-ended question (free comments)
(see Appendix 7 and Table 43 in Appendix 12) completed by facilitators and co-
facilitators. Q8 and Q9 address specifically environmental influences such as
distraction and disruption and quality of environment and physical resources, which
were summarised as count of responses. To analyse facilitators’ comments, which
were entered as text into separate Word documents by study staff, the PhD candidate
conducted a qualitative thematic content analysis (see Table 38 in Appendix 10).
100 This facilitator ran about a third (54/171) of total group information sessions delivered in Brisbane
and reported this spontaneously when preliminary results of these analyses were presented.
According to her, using the 5-point Likert scale did not make sense to several raters.

135
5.2.4.5 Implementation composite score: finally was the NOURISH
intervention delivered as planned?
Finally, the four overall previous performance scores were combined into an overall
Implementation score as follows:
Implementation score = (Ereach + Edose del +Edose rec + Efidelity ) / 4.
5.3 Results
5.3.1 Reach performance
Results of the reach evaluation are presented below, for each stage of the enrolment
and intervention delivery. To assist the reader, a brief summary of the aims of the
analysis at each stage is provided in italics at the beginning of each sub-section. In
addition, to simplify, concise results of participants’ characteristics across each stage
of the research programme are given in text and detailed results are reported in
footnotes or in Tables 39–42 of Appendix 13.
5.3.1.1 Recruit-1 reach performance
The purpose of this analysis was to determine the capacity of the NOURISH research
programme to recruit 2169 first-time mothers at maternity hospitals, with no bias in
regard to the characteristics of mothers that could affect the obesity risk for their
child.
• Recruit-1 quantitative description
Of the 2870 mothers approached at maternity hospitals, 2169 provided consent for
later contact, as well as demographic and lifestyle data (see Appendix 1). Of the 701
who declined consent for further contact, 309 agreed to provide a subset of the data
provided by consenters (see Appendix 2) and the remaining 392 did not provide any
data at all (see Figure 7). Thus, the overall Recruit-1 reach performance score at
maternity hospitals was 76% (2169) of approached mothers and 86% of those

136
approached provided demographic and health-related data101. These data are the basis
for descriptive analyses at Recruit-1 of participants relative to approached mothers
that declined participation. They are also the basis for descriptive analyses of
participants that could not be re-contacted or declined participation at Recruit-2,
which is addressed in section 5.3.1.2.
The same procedures were followed across cohorts and cities. However, more
mothers were approached at cohort 1 (1930 versus 940) in a greater number of
hospitals (8 versus 5). This enrolment strategy difference was justified by the
unexpected necessity to organise enrolments of cohort 2 mothers (see section 3.4.1),
for which the objective was to concentrate recruitment efforts in hospitals offering
greater consent rates. In addition, more mothers were approached in Brisbane (1558
versus 1312) as compared to Adelaide.
Results for cohorts relating to the Recruit-1 process as a whole are reported in Table
10.
101 Including traditional data (i.e. maternal age, education level attainment) but also other
characteristics such as self-report maternal pre-pregnancy weight status, and breastfeeding
intention (see Appendix 1 and Appendix 2).
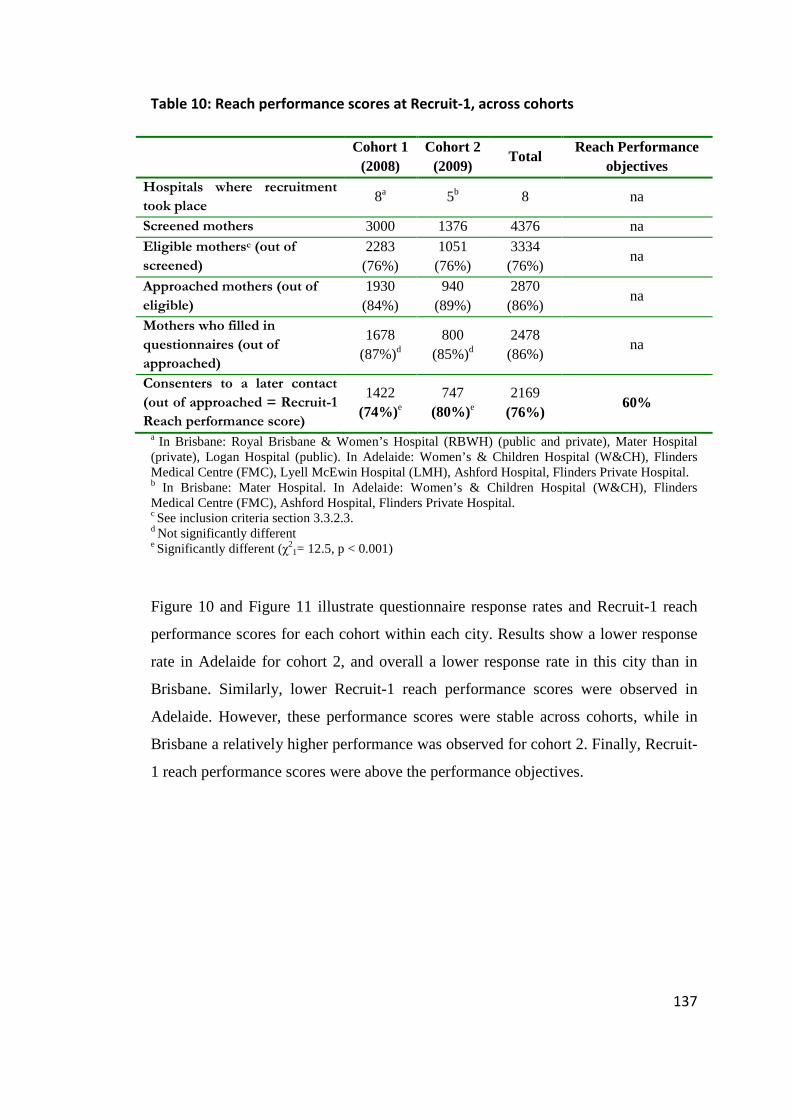
137
Table 10: Reach performance scores at Recruit-1, across cohorts
Cohort 1
(2008) Cohort 2
(2009) Total
Reach Performance objectives
Hospitals where recruitment
took place 8a 5b 8 na
Screened mothers 3000 1376 4376 na Eligible mothersc (out of
screened)
2283 (76%)
1051 (76%)
3334 (76%)
na
Approached mothers (out of
eligible)
1930 (84%)
940 (89%)
2870 (86%)
na
Mothers who filled in
questionnaires (out of
approached)
1678 (87%)d
800 (85%)d
2478 (86%)
na
Consenters to a later contact
(out of approached = Recruit-1
Reach performance score)
1422 (74%)e
747 (80%)e
2169 (76%)
60%
a In Brisbane: Royal Brisbane & Women’s Hospital (RBWH) (public and private), Mater Hospital (private), Logan Hospital (public). In Adelaide: Women’s & Children Hospital (W&CH), Flinders Medical Centre (FMC), Lyell McEwin Hospital (LMH), Ashford Hospital, Flinders Private Hospital. b In Brisbane: Mater Hospital. In Adelaide: Women’s & Children Hospital (W&CH), Flinders Medical Centre (FMC), Ashford Hospital, Flinders Private Hospital. c See inclusion criteria section 3.3.2.3. d Not significantly different e Significantly different (χ2
1= 12.5, p < 0.001)
Figure 10 and Figure 11 illustrate questionnaire response rates and Recruit-1 reach
performance scores for each cohort within each city. Results show a lower response
rate in Adelaide for cohort 2, and overall a lower response rate in this city than in
Brisbane. Similarly, lower Recruit-1 reach performance scores were observed in
Adelaide. However, these performance scores were stable across cohorts, while in
Brisbane a relatively higher performance was observed for cohort 2. Finally, Recruit-
1 reach performance scores were above the performance objectives.
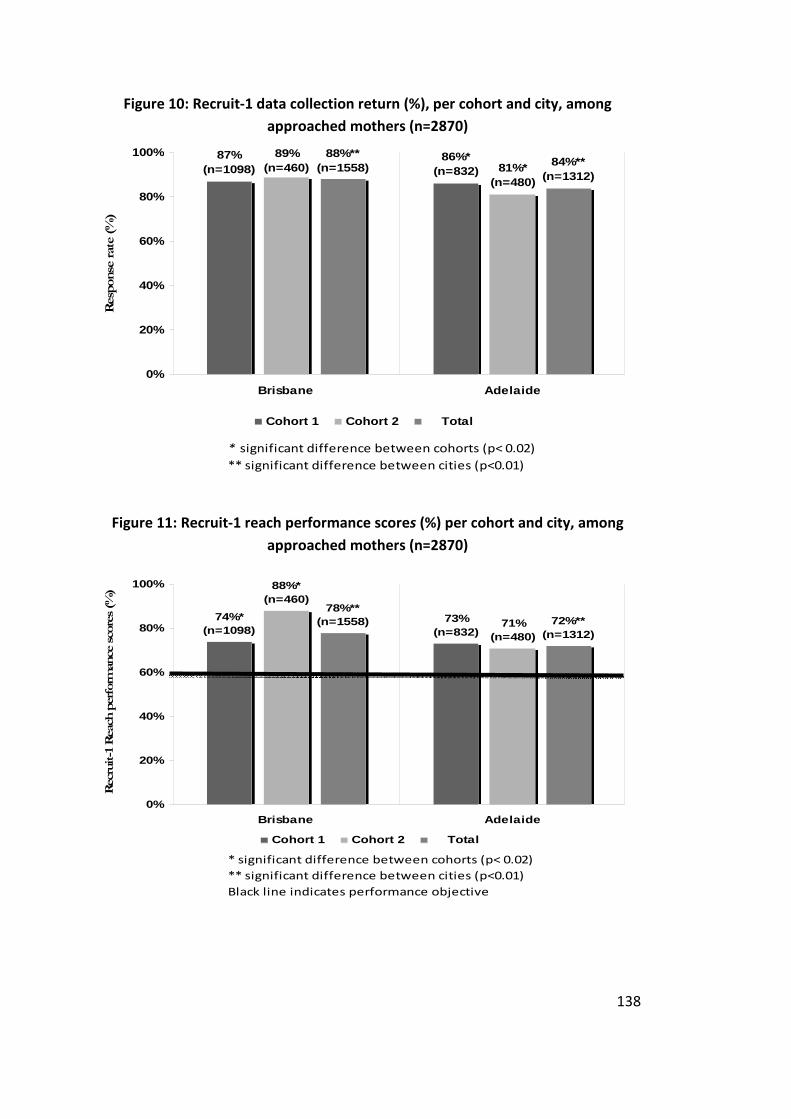
138
Figure 10: Recruit-1 data collection return (%), per cohort and city, among
approached mothers (n=2870)
87%(n=1098)
86%*(n=832)
89%(n=460) 81%*
(n=480)
88%**(n=1558) 84%**
(n=1312)
0%
20%
40%
60%
80%
100%
Brisbane Adelaide
Resp
onse
rat
e (%
)
Cohort 1 Cohort 2 Total
* significant difference between cohorts (p< 0.02)
** significant difference between cities (p<0.01)
Figure 11: Recruit-1 reach performance scores (%) per cohort and city, among
approached mothers (n=2870)
74%*(n=1098)
73%(n=832)
88%*(n=460)
71%(n=480)
78%**(n=1558) 72%**
(n=1312)
0%
20%
40%
60%
80%
100%
Brisbane Adelaide
Rec
ruit-1
Reac
h p
erf
orm
ance
sco
res
(%)
Cohort 1 Cohort 2 Total
* significant difference between cohorts (p< 0.02)
** significant difference between cities (p<0.01)
Black line indicates performance objective

139
• Characteristics of the 2478 approached mothers for whom
information could be collected.
Among the 2478 approached mothers who returned questionnaires, 77% were born
in Australia, 0.8% were Aboriginal or Torres Strait Islanders, and 90% were married
or living with a partner. The age of mothers ranged from 18 to 46 years, with a mean
of 28 years (+ 6). The minimum age of 18 was consistent with the eligibility criteria.
Forty per cent of mothers had received university education. Eighty per cent of
women self-reported a healthy weight before pregnancy, and 96% intended to
breastfeed exclusively or in combination with formula feeding.
Half of the newborns were boys. Birth weight ranged between 2.5 and 5.3 kg, with a
mean of 3.4 kg (+ 0.4). The minimum birth weight was consistent with the inclusion
criteria. Gestational age ranged between 37 and 43 weeks with a mean of 39 weeks
(+ 1.2), which slightly differed from the inclusion criteria relating to gestational age,
but was probably consistent with birth-weight inclusion criteria (see 3.3.2.3)102.
• Characteristics of Recruit-1 “consenters to a later contact” and
“non-consenters to a later contact”
Analyses (see Appendix 13) of the information provided at Recruit-1 from all
“consenters to a later contact” (n= 2169), and from the “non-consenters to a later
contact” who completed questionnaires (n=309), show that the former differed from
the latter only in the category of university education (41% versus 26%) and slightly
on age (mean 28 (+ 6) versus 27 (+ 5)).
5.3.1.2 Recruit-2 reach performance
The aim of this analysis was to determine the capacity of the NOURISH research
programme to retain in the study, after 4–7 months of motherhood experience, the
2169 Recruit-1 “consenters to a later contact”, with no bias in regard to the
characteristics of mothers that could affect the obesity risk for their child. Based on
102 35-week-old babies may have been lighter than 2500 g (the minimum weight accepted in the
trials) and were thus systematically excluded.

140
data collected at the previous stage (see Figure 7), comparisons were carried out
between:
• the 1658 “able to be re-contacted” and the 511 “unable to be re-contacted”
mothers;
• the 1583 eligible and the 75 non-eligible mothers;
• and the 698 consenters and the 855 non-consenters to full enrolment.
• Recruit-2 quantitative description
Out of the 2169 «Recruit-1 consenters to a later contact», 76% responded to the mail,
email or telephone call made when their baby was about 4–7 months. Of these
“successfully recontacted mothers”, 96% were still eligible for participation. Of these
eligible mothers, 44% gave their consent for full enrolment into the trial. Consistent
with the Recruit-1 process, more mothers were able to be recontacted from cohort 1
than from cohort 2 (see Table 11) and more in Brisbane than in Adelaide (1008
versus 650). In contrast to Recruit-1 (see 5.3.1.1), no difference in the overall
enrolment process was found between cohorts. Similar to the Recruit-1 stage, higher
performance scores with respect to recontacting participants, were observed in
Brisbane than in Adelaide. However, for both cities overall reach performance scores
at Recruit-2 were below the performance objective. Table 11 presents the overall
results of the Recruit-2 process for each cohort. Figure 12 and Figure 13 present the
results by cohort and city.

141
Table 11: Reach performance scores at Recruit-2, across cohorts
Cohort 1 Cohort 2 Total
Reach
Performance
objectives
Recruit-1 “consenters to a later
contact” 1422 747 2169 na
“Successfully recontacted” (out of
consenters to a later contact)
1079
(76%)
579
(78%)
1658
(76%) na
Eligible (out of successfully
recontacted)
1017
(94%)
566
(97%)
1583
(96%) na
Enrolled mothers (out of eligible =
Recruit-2 reach performance score)
436
(43%)a
262
(46%)a
698
(44%) 70%
a Not significantly different
Figure 12: Successful recontact rates (%) at Recruit-2 per cohort and city among
«Recruit-1 consenters to a later contact» (n=2169)
81%(n=816)
69%(n=606)
85%(n=406)
68%(n=341)
83%**(n=1222)
69%**(n=947)
0%
20%
40%
60%
80%
100%
Brisbane Adelaide
Suce
ssfu
l re
conta
ct r
ates
(%
)
Cohort 1 Cohort 2 Total
** significant difference between cities (p<0.001)

142
Figure 13: Recruit-2 reach performance scores (%) per cohort and city among
recontacted eligible mothers (n=1583)
37%*(n=401)
47%(n=616)
46%*(n=231)
47%(n=335) 40%
(n=632)
47%(n=951)
0%
10%
20%
30%
40%
50%
60%
70%
80%
90%
100%
Brisbane Adelaide
Rec
ruit
-2 R
each
per
form
ance
sco
res
(%)
Cohort 1 Cohort 2 Total
* significant difference between cohorts (p< 0.03)
Black line indicates performance objective
• Characteristics of mothers who could and could not be recontacted
at Recruit-2
Compared to mothers who could not be recontacted 4–7 months after the first contact
at the maternity hospital, those who were recontacted were 3 years older (29 (+ 6)
versus 26 (+ 6)); were more likely to be married or living with a partner (92% versus
83%) and to have received university education (45% versus 27%). They were also
more likely to have reported: a healthy pre-pregnancy weight status (81% versus
76%), a breastfeeding intention (97% versus 94%) and alcohol consumption during
the second term of pregnancy (14% versus 9%). In contrast, they were less likely to
have smoked after the first term of pregnancy (6% versus 13%). See detailed results
in Appendix 13 tables.

143
• Characteristics of Recruit-2 eligible versus ineligible mothers
Among the 1658 mothers who could be recontacted, 2% of cohort 2 versus 6% of
cohort 1 had become ineligible103. This difference was observed in both cities
(Brisbane: 93% versus 97%104; Adelaide: 96% versus 99%105). Compared to
ineligible mothers, eligible mothers were more often born in Australia (77% versus
62%)106 and were less likely to have smoked during pregnancy (6%, versus 12 %)107.
Reasons for ineligibility were collected on 74 of the 75 ineligible mothers. The major
reason for ineligibility was living outside the Brisbane or Adelaide metropolitan
areas (59/74), and the second most commonly reported reasons were psychological
distress and child health issues (6/74). Language facility was the least reported
reason (3/74) for ineligibility.
• Characteristics of Recruit-2 consenters versus non-consenters to
full enrolment
Similar differences, to those previously described between participants that were able
to be contacted and those unable to contacted, were observed between Recruit-2
consenters and non-consenters to full enrolment (see Figure 14 and Appendix 13). In
addition, consenters were more likely to have ever breastfed (97% versus 94%) and
to currently breastfeed (74% versus 56%) (see Table 45 in Appendix 13). Moreover,
among those who stopped breastfeeding, consenters stopped later than non-
consenters did (median 1.4 versus 0.9 months). Consenters also introduced solid food
later than non-consenters did (mean 4.3 versus 3.6 months) but were more likely to
have concern with baby weight (31% versus 12%) (see Table 46 in Appendix 13).
103 χ
21 = 9.9, p<0.01.
104 χ
21 = 5.37, p = 0.02.
105 χ
21 = 3.88, p = 0.05.
106 χ
21 = 8.35, p<0.01.
107 χ
21= 4.63, p = 0.03.

144
Figure 14: Characteristics at Recruit-2 of mothers that could not be contacted,
non-consenters and consenters to full enrolment
77
16
3
58
78
82
95
97
94*
83*
76*
27*
13*
9*
75
12**
7**
36**
90**
96
80
0 10 20 30 40 50 60 70 80 90 100
Alcohol consumer at 2ndterm of pregnancy
Smoking after f irst term ofpregnancy
University education
Born in Australia
Healthy w eight status
Married or living defacto
Breastfeeding intention (a)
Percentages
(a) exclusive or mixed w ith formula feeding * Signif icantly different from non consenters + consenters ** Signif icantly different from consenters
Consenters (n= 698)
Non consenters (n= 885)
Unable to contact (n=511)
• Reasons for not consenting to participate
Among the 885 mothers who no longer wished to be involved in the trial, although
they were successfully recontacted, 809 (91%) gave at least one reason. Lack of time
was reported 532 times (66%) and was the most frequently cited reason. Return to
work was reported 244 times (30%) as the second most commonly reported reason,
followed by no longer being interested in the trial (159, 20%), transport issues (149,
18%), and no need of advice on feeding (106, 13%). The remaining reasons were
cited by less than 3% of mothers, including: health issue in their family (24; 3%), a
personal health issue or other issues (19; 2%), unavailability for session attendance
(15; 2%), a concern with the organisation of the delivery of the intervention (11;
1%), a lack of support from the other carer of the child (9; 1%), family issues (8; 1%)
and an existing engagement in another research study (5; 0.6%).
In addition to analyses by cities and cohorts (see section 5.2), further comparisons
were made between those who received university education versus those who did
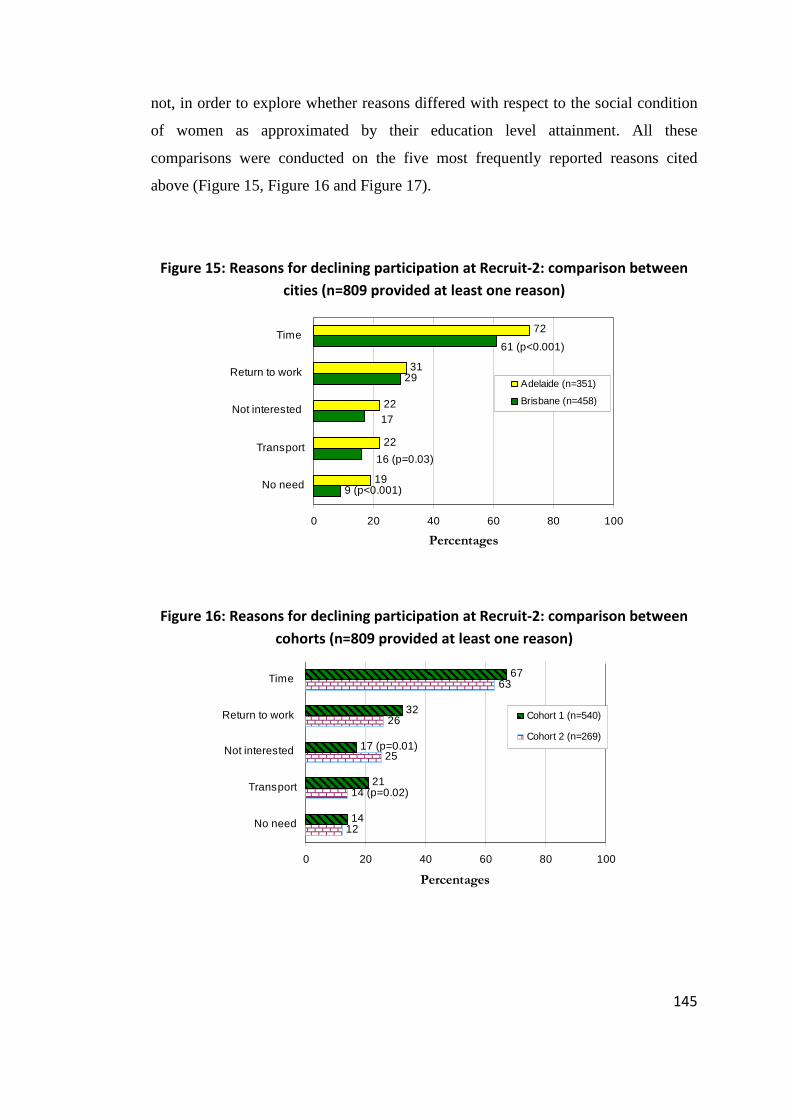
145
not, in order to explore whether reasons differed with respect to the social condition
of women as approximated by their education level attainment. All these
comparisons were conducted on the five most frequently reported reasons cited
above (Figure 15, Figure 16 and Figure 17).
Figure 15: Reasons for declining participation at Recruit-2: comparison between
cities (n=809 provided at least one reason)
29
19
22
22
31
72
17
61 (p<0.001)
9 (p<0.001)
16 (p=0.03)
0 20 40 60 80 100
No need
Transport
Not interested
Return to work
Time
Percentages
Adelaide (n=351)
Brisbane (n=458)
Figure 16: Reasons for declining participation at Recruit-2: comparison between
cohorts (n=809 provided at least one reason)
12
25
26
63
14
21
32
67
14 (p=0.02)
17 (p=0.01)
0 20 40 60 80 100
No need
Transport
Not interested
Return to work
Time
Percentages
Cohort 1 (n=540)
Cohort 2 (n=269)

146
Figure 17: Reasons for declining participation at Recruit-2: comparison between
university and non-university educated mothers (n=804* provided at least one
reason)
20
10
11
34
67
15
64
28
24 (p<0.001)
15
0 20 40 60 80 100
No need
Transport
Not interested
Return to work
Time
Percentages
University (n=520)
No university (n=284)
* education was not informed for 5 mothers
5.3.1.3 Module-1 reach performance
The purpose of this analysis was to determine the capacity of the NOURISH research
programme to engage the intervention target audience in attending at least one
information session for Module-1, with no bias in regard to the characteristics of
mothers that could affect the obesity risk for their child. Hence, comparisons were
made between “Module-1 exposed” and “Module-1 non-exposed” mothers, who
were defined respectively as those who attended at least one Module-1 information
session and those who did not.
• Module-1 delivery quantitative description
Out of the 352 mothers allocated to the intervention group, 80 mothers (23%) did not
attend any of the 6 sessions of Module-1. As a result, the reach performance score of
Module-1 was 77%. As shown in Figure 18, a difference was found across cohorts in
Brisbane but not in Adelaide where Module-1 reach performance scores were more
stable and were similar to that of Brisbane cohort 1.

147
Figure 18: Module-1 reach performance scores (%) per cohort and city (n=352)
81%*(n=145) 78%
(n=73)69%*(n=78)
79%(n=56)
77%(n=223)
78%(n=129)
0%
20%
40%
60%
80%
100%
Brisbane Adelaide
Mod
ule
-1 R
each
per
form
ance
sco
res
(%)
Cohort 1 Cohort 2 Total
* significant difference between cohorts (p< 0.05)
• Characteristics of Module-1 exposed and non-exposed mothers.
As for the previous comparisons in the enrolment phase (see sections 5.3.1.1 and
5.3.1.2), similar differences with respect to maternal age, marital status, education,
current breastfeeding, and smoking during pregnancy were observed between
mothers who were exposed to Module-1 information sessions and those who were
not (see Appendix 13). In addition, Module-1 exposed mothers were less likely to
have a healthcare card (14% versus 25%), and had a lower score that reflects a lower
concern for their own weight (mean 33% versus 42%). Their babies were also
younger but this difference was meaningless (4.2 versus 4.6 months).
In contrast to expectations, no difference was shown between Module-1 exposed and
non-exposed mothers with respect to return to work.
• Reasons for not attending sessions of Module-1
Out of the 80 mothers who did not attend any session, the NOURISH staff collected
reasons by telephone for 39 (49%) mothers. Figure 19 outlines reasons given by
those mothers. Reasons given by mothers who attended at least one information
session are considered in section 5.3.2.

148
Figure 19: Reasons for no Module-1 attendance, provided by 39 mothers
3
3
6
6
18
20
1.0
0 5 10 15 20 25
Forgot
Inconvenient session Time
Organisation default **
Away/Moved/Unable to contact
Inconvenient location
Clash with other life events *
Too difficult to attend with work, time , child…
Citation counts ***
* Unplanned events such as child or maternal illness, family events or exceptional event (i.e.
wedding). ** session rescheduled, participant not randomised in time. *** Repeated citations over
several sessions by the same participant have been counted once.
5.3.1.4 Module-2 reach performance
The same research question was applied to the second module and the same analyses
were conducted as for Module-1, using the data generated from the Assessment 2
questionnaire and at Module-2 on the same set of variables. “Module-2 exposed”
and “Module-2 non-exposed” mothers were defined respectively as those who
attended at least one Module-2 information session and those who did not.
• Module-2 delivery quantitative description
Out of the 352 mothers allocated to the intervention, 197 mothers (56%) did not
attend any Module-2 sessions108. As a result, the reach performance score of Module-
2 was 44%. As reported in Figure 20, a lower score was observed in Brisbane.
108 Surprisingly, five mothers who did not attend any session of Module-1 attended some Module-2
sessions.

149
Figure 20: Module-2 reach performance scores (%) per cohort and city (n=352)
40%(n=145)
51%(n=73)
40%(n=78)
52%(n=56)
40%*(n=223)
51%*(n=129)
0%
10%
20%
30%
40%
50%
60%
70%
80%
90%
100%
Brisbane Adelaide
Mo
du
le-2
Rea
ch p
erfo
rman
ce s
core
s (%
)
Cohort 1 Cohort 2 Total
** significant difference between cities (p<0.05)
• Characteristics of Module-2 exposed and non-exposed mothers
Similar statistical differences as in the previous comparisons were found (5.3.1.1,
5.3.1.2 and 5.3.1.3) between mothers who were exposed to Module-2 information
sessions and those who were not (see Appendix 13). In addition, exposed mothers
returned to work when their baby was older (mean 37 versus 31 weeks) and worked
fewer hours per week (mean 19 versus 23 hours) than their non-exposed counterparts
who had returned to work.
• Reasons for not attending Module-2 sessions
As in Module-1, out of the 197 mothers who did not attend any session, the
NOURISH staff collected reasons from 61 mothers (31%). The reasons reported are
presented in Figure 21. Reasons given by mothers who attended at least one Module-
2 information session are considered in section 5.3.2.

150
Figure 21: Reasons for no Module-2 attendance, provided by 61 mothers
1
1
8
11
15
26
1.0
0 5 10 15 20 25 30
Forgot
Inconvenient session Time
No longer interested
Inconvenient location
Away/Moved/Unable to contact
Clash with other life events *
Too difficult to attend with work, time , child…
Citation counts **
* = unplanned events such as child or maternal illness, family events or exceptional event (i.e.
wedding). ** Repeated citations over several sessions by the same participant have been counted
once.
5.3.1.5 Longitudinal perspective on reach
The aim of this analysis was to summarise the reach process component in order to
provide from screening to Module-2, retention rates and a profile of participants that
could be compared to other studies and characteristics of the target population
respectively. These comparisons allowed suggestions of key elements that might have
contributed to the retention of participants.
• Quantitative description of the overall reach process
Table 12 reports on the calculated reach performance scores of three child obesity
prevention research programmes, including NOURISH, at each of the enrolment,
randomisation, follow-up, and analysis phases of the RCT. It also reports on the
various strategies used by each study to address these RCT phases. The shaded box
points out a different recruitment approach based on a random selection of parent
groups rather than individuals (Campbell et al., 2008).

151
Table 12: Reach process of the NOURISH research programme compared with two Australian RCTs with similar objectives
NOURISH
INFANT (Infant Feeding Activity and
Nutrition Trial)
(Campbell et al., 2008; McLeod, 2011; Lioret et
al., 2012; Campbell et al., 2013)
HBT (Healthy Beginning Trial)
(Wen et al., 2012; Wen et al., 2011; Wen
et al., 2007)
Strategies n % Strategies n % Strategies n %
Screened for eligibility
Maternity
hospital
4376 -
Parent groups
run by child
health services
62 parent groups Antenatal
clinics in
disadvantage
areas
2700h -
Eligible 3259 - 62 parent groups na -
Eligible & approached
participants
(denominator a)
2870 - 630 - 780 -
Declined to participate at R1&R2 1586 55%e 88 14%e 113 14%e
Randomised
(denominator b)
Permuted-block
Randomisationb 698 24%e
Cluster
Randomisationg 542 86%e Randomisation 667 86%e
Attrition at 9–12
months follow-up
12 info group
sessions starting
at ~4 months of
baby age
100 14%f 6 info group
sessions from
existing groups
starting at ~4
months of baby
age
21 4%f 8 home visits
starting
prenatally + at
1, 3, 5, 9, 12,
18, 24 months
of baby age
150i 23%f
Analysed at 9–12
months follow-upa 566
c 81%f 505 93%f 517 78%f
Total Attrition at 20–24
months follow-up 157 22%f 48 9%f 190 28%f
Analysed at 20–24
months follow-upa 530
d 76%f 457 84%f 497 75%f
a for anthropometric outcome. b Blocks of 4 within each assessment clinic that participants selected prior to randomisation. c (Daniels, Mallan et al., 2012) d (Daniels et al., 2013) e Out of denominator a. f Out of denominator b. g Cluster of parent groups. h were approached by research assistants who gave a letter of invitation and information about the study. Pregnant women who declined participation were not screened for eligibility nor surveyed. i total attrition from beginning of follow-up (i.e. 6 months).

152
• Comparison with general population
Figures 22 provide trends in maternal and infant characteristics alongside the
NOURISH research programme stages, as compared to the target populations. For
normally distributed variables, 95% confidence intervals are reported.
In contrast to the Brisbane sample, the Adelaide sample matched the South
Australian population relatively well until Recruit-2 stage, with respect to most of the
characteristics examined. Compared to the reference populations, differences with
respect to the educational attainment of parents were observed from the early stage of
the trial, and increased alongside the trial stages. These differences were more
pronounced for the Brisbane sample than the Adelaide sample.

153
Figure 22 a-e: Comparisons of the NOURISH population characteristics at each stage of the trial with reference populations
(a) Proportions Born in Australia
(b) Mean Maternal age at Birth
20
30
40
Recruit-1
approached
(n=1298)
Recruit-1
consenters to
later contact
(n=1218)
Re-contacted
Recruit-1
mothers
(n=1005)
Recruit-2
consenters
(n=443)
Module-1
exposed
(n=171)
Module-2
exposed
(n=89)
Years
20
30
40
Recruit-1
approached
(n=1095)
Recruit-1
consenters to
later contact
(n=943)
Re-contacted
Recruit-1
mothers
(n=646)
Recruit-2
consenters
(n=255)
Module-1
exposed
(n=101)
Module-2
exposed
(n=66)
Years
Brisbane NOURISH sample
Queensland population between 01/2008 - 05/2009 (n=30166)
(Perinatal Data Collection database, Queensland Health)
max 95CI min 95CI
South Australian population in 2009 (n=19604)(Chan et
al., 2011).
Adelaide NOURISH sample
60
70
80
90
Recruit-1
approached
(n=1304)
Recruit-1
consenters to
later contact
(n=1206)
Re-contacted
Recruit-1
mothers
(n=997)
Recruit-2
consenters
(n=437)
Module-1
exposed
(n=168)
Module-2
exposed
(n=88)
%
100
60
70
80
90
100
Recruit-1
approached
(n=1087)
Recruit-1
consenters to
later contact
(n=930)
Re-contacted
Recruit-1
mothers
(n=639)
Recruit-2
consenters
(n=255)
Module-1
exposed
(n=101)
Module-2
exposed
(n=66)
%
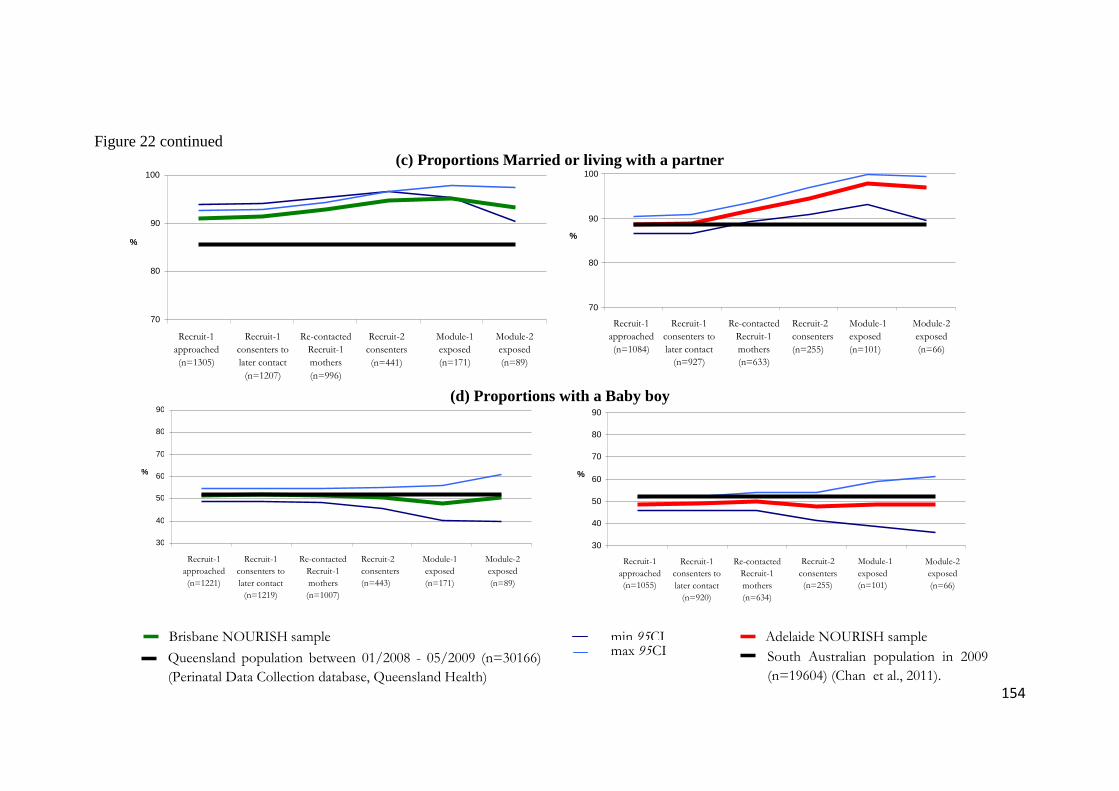
154
Figure 22 continued (c) Proportions Married or living with a partner
(d) Proportions with a Baby boy
Brisbane NOURISH sample
Queensland population between 01/2008 - 05/2009 (n=30166)
(Perinatal Data Collection database, Queensland Health)
max 95CI Adelaide NOURISH sample min 95CI
South Australian population in 2009
(n=19604) (Chan et al., 2011).
70
80
90
100
Recruit-1
approached
(n=1305)
Recruit-1
consenters to
later contact
(n=1207)
Re-contacted
Recruit-1
mothers
(n=996)
Recruit-2
consenters
(n=441)
Module-1
exposed
(n=171)
Module-2
exposed
(n=89)
%
70
80
90
100
Recruit-1
approached
(n=1084)
Recruit-1
consenters to
later contact
(n=927)
Re-contacted
Recruit-1
mothers
(n=633)
Recruit-2
consenters
(n=255)
Module-1
exposed
(n=101)
Module-2
exposed
(n=66)
%
30
40
50
60
70
80
90
Recruit-1
approached
(n=1221)
Recruit-1
consenters to
later contact
(n=1219)
Re-contacted
Recruit-1
mothers
(n=1007)
Recruit-2
consenters
(n=443)
Module-1
exposed
(n=171)
Module-2
exposed
(n=89)
%
30
40
50
60
70
80
90
Recruit-1
approached
(n=1055)
Recruit-1
consenters to
later contact
(n=920)
Re-contacted
Recruit-1
mothers
(n=634)
Recruit-2
consenters
(n=255)
Module-1
exposed
(n=101)
Module-2
exposed
(n=66)
%

155
Figure 22 continued (e) Proportions with Post-secondary education of males and females
Brisbane NOURISH sample
Queensland 15–44 year old males and females
education (n=1,816,200)*
max 95CI Adelaide NOURISH sample min 95CI
South Australian 15–44 year old males and females
education (n=627,500)*
* Extracted from tables of the Survey of Education and Training (SET) conducted on 15–64 year old people (males and females) by the Australian
Bureau of Statistics (ABS) between March and June 2009.
http://www.abs.gov.au/AUSSTATS/[email protected]/DetailsPage/6278.0.55.0052009?OpenDocument
50
60
70
80
90
100
Recruit-1
approached
(n=2577)
Recruit-1
consenters to
later contact
(n=2385)
Re-contacted
Recruit-1
mothers
(n=1979)
Recruit-2
consenters
(n=876)
Module-1
exposed
(n=340)
Module-2
exposed
(n=177)
%
50
60
70
80
90
100
Recruit-1
approached
(n=2137)
Recruit-1
consenters to
later contact
(n=1830)
Re-contacted
Recruit-1
mothers
(n=1263)
Recruit-2
consenters
(n=504)
Module-1
exposed
(n=201)
Module-2
exposed
(n=131)
%

156
5.3.2 Adoption
The following sub-sections address one by one, proxies identified to measure
different aspects of adoption.
5.3.2.1 Dose received
Table 13 and Figure 23 provide complementary descriptions of session attendance.
Table 13 shows that median overall attendance across both modules was 5 (IQR: 1–
8) and ranged from 0 to 12 information sessions. Figure 23 describes the variation in
attendance across sessions and across modules.
Table 13: Dose received by participants per module, city and cohort
Median 25th–75th IQ
Dose received at Module-1
Brisbane cohort 1 (n=145) 3 1–5
Brisbane cohort 2 (n=78) 3 0–5
Adelaide cohort 1 (n=73) 3 1–5
Adelaide cohort 2 (n=56) 4 1–5
Overall Module-1 (n=352) 3 1–5
Dose received at Module-2
Brisbane cohort 1 (n=145) 0 0–3
Brisbane cohort 2 (n=78) 0 0–3
Adelaide cohort 1 (n=73) 1 0–4
Adelaide cohort 2 (n=56) 1.5 0–4
Overall Module-2 (n=352) 0 0–4
Overall dose received (n=352) 5 1–8
Minimum and maximum overall doses received were respectively 0 and 12. For other strata, minimum and maximum doses received were 0 and 6 respectively.

157
Figure 23: Attendance rates (%) across sessions for modules 1 and 2 (aggregated
across cohorts and cities)
0
10
20
30
40
50
60
70
session 1 session 2 session 3 session 4 session 5 session 6
Per
cen
tag
es
module 1
module 2
5.3.2.2 Participant satisfaction
Participant satisfaction frequencies are shown in Table 14.
Table 14: Participant satisfaction of group information across modules
Would recommend
NOURISH (Q9)
Satisfieda with…
skills of the staff
(Q2)
the sessions (Q1)
Module-1 (n=222) 98% 94% 90%
Module-2 (n=121) 100% 97% 94%
Overall feedback
(n=343)
98% 95% 92%
a include mostly satisfied and very satisfied participants
Satisfaction score distribution was right skewed, with a median of 3 (IQR:3–3)
corresponding to the maximal rating. The satisfaction median score was the same
across modules, cohorts and cities. There was no unsatisfied mother among Adelaide
cohort-2 participants (Table 48 in Appendix 14).

158
5.3.2.3 Participant perception of usefulness
Participant perception of usefulness with respect to overall content of the information
session and to the specific strategies used to deliver NOURISH messages is reported
in Table 15. In addition, usefulness in terms of knowledge development and
behavioural changes are presented in Table 16 and Table 17.
Table 15: Participant perception of usefulness of group information across
modules
Usefulness
of the
provided
information
(Q3)
Usefulness of information delivery
strategies
Suggested
activity to try
at home
(Q4c)
Workbook
&
handouts
(Q4b)
Social time
after the
group
sessions
(Q4d)
Module-1
(n=223)
“not at all useful” 1% 4% 2% 11%
“useful” 31% 41% 52% 62%
“very useful” 68% 55% 46% 27%
Module-2
(n=121)
“not at all useful” 1% 7% 2% 17%
“useful” 31% 43% 53% 58%
“very useful” 68% 50% 45% 25%
Overall
feedback
(n=344)
“not at all useful” 1% 5% 2% 13%
“useful” 31% 42% 53% 61%
“very useful” 68% 53% 45% 26%

159
Table 16: Participant perception of usefulness of group information with respect
to knowledge development across modules
Information sessions helped …
Understand
child’s food
needs (Q5a)
Learn new ways to
interact with child
during feeding (Q5d)
Learn new ways to
interact with child
at other times (Q5e)
Module-1
(n=223)
“not at all” 1% 2% 10%
“a little” 14% 28% 55%
“a lot” 85% 70% 35%
Module-2
(n=121)
“not at all” 1% 3% 14%
“a little” 10% 31% 57%
“a lot” 89% 66% 29%
Overall
feedback
(n=344)
“not at all” 1% 2% 11%
“a little” 13% 29% 56%
“a lot” 86% 69% 33%
Table 17: Participant perception of usefulness of group information with respect
to behavioural change across modules
Information sessions
helped feel more
confident about child
feeding (Q5b)
Information sessions encouraged …
trusting child
eats enough
(Q5f)
changing foods
available at home
(Q5c)
Module-1
(n=223)
“not at all” 1% 0% 11%
“a little” 14% 8% 35%
“a lot” 85% 92% 54%
Module-2
(n=121)
“not at all” 3% 2% 13%
“a little” 10% 3% 33%
“a lot” 87% 95% 54%
Overall
feedback
(n=344)
“not at all” 2% 1% 12%
“a little” 13% 6% 34%
“a lot” 85% 93 % 54%
Median overall usefulness score was 2.6 (IQR:2.5–2.8) and was similar across
modules, cohorts and cities (see Table 49 in Appendix 14).
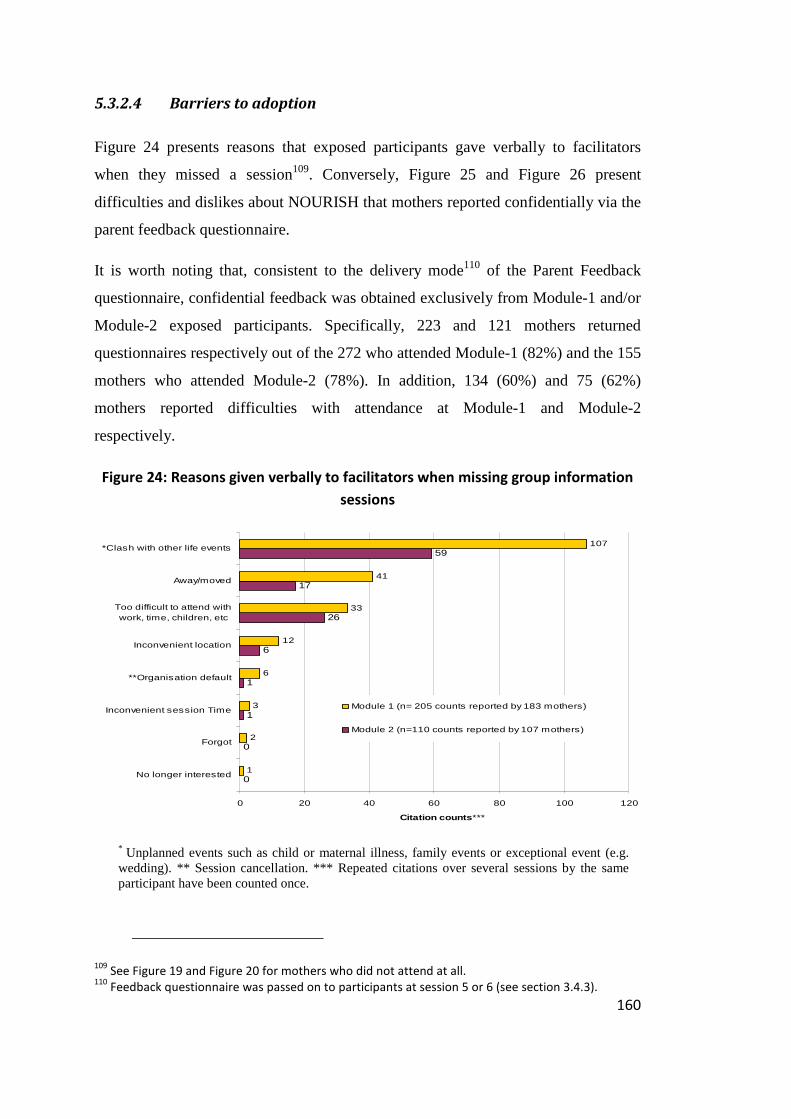
160
5.3.2.4 Barriers to adoption
Figure 24 presents reasons that exposed participants gave verbally to facilitators
when they missed a session109. Conversely, Figure 25 and Figure 26 present
difficulties and dislikes about NOURISH that mothers reported confidentially via the
parent feedback questionnaire.
It is worth noting that, consistent to the delivery mode110 of the Parent Feedback
questionnaire, confidential feedback was obtained exclusively from Module-1 and/or
Module-2 exposed participants. Specifically, 223 and 121 mothers returned
questionnaires respectively out of the 272 who attended Module-1 (82%) and the 155
mothers who attended Module-2 (78%). In addition, 134 (60%) and 75 (62%)
mothers reported difficulties with attendance at Module-1 and Module-2
respectively.
Figure 24: Reasons given verbally to facilitators when missing group information
sessions
0
0
1
1
6
26
17
59
1
2
3
6
12
33
41
107
0 20 40 60 80 100 120
No longer interested
Forgot
Inconvenient session Time
**Organisation default
Inconvenient location
Too difficult to attend withwork, time, children, etc
Away/moved
*Clash with other life events
Citation counts ***
Module 1 (n= 205 counts reported by 183 mothers)
Module 2 (n=110 counts reported by 107 mothers)
* Unplanned events such as child or maternal illness, family events or exceptional event (e.g. wedding). ** Session cancellation. *** Repeated citations over several sessions by the same participant have been counted once.
109 See Figure 19 and Figure 20 for mothers who did not attend at all.
110 Feedback questionnaire was passed on to participants at session 5 or 6 (see section 3.4.3).

161
Figure 25: Difficulties to attend, confidentially reported in the parent feedback
questionnaire (Q8)
1
6
8
18
49
61
2
6
13
27
32
87
103
0 20 40 60 80 100 120
**Organisation default
Away/moved
Did not like info group, didnot find useful
Inconvenient location
Inconvenient session Time
*Clash with other life events
Too difficult to attend withwork, time, children, etc
Citation counts
Module 1 (n= 270 counts reported by 134 mothers)
Module 2 (n=143 counts reported by 75 mothers)
* Unplanned events such as child or maternal illness, family events or exceptional event (e.g. wedding). ** Parking space.
Consistent with how responses regarding participant dislikes about the intervention
were entered (see Table 35 in Appendix 10), Figure 26 shows themed responses
given by 161 participants without specification of modules. Specific maternal
responses are provided in Table 36 in Appendix 10.

162
Figure 26: What 161 mothers disliked most about NOURISH (Q11)
2
11
11
18
27
29
30
30
42
0 5 10 15 20 25 30 35 40 45
No refreshment
** Self-organisation for attendance
Group composition
Facilitator session management and rapport
* Inconvenient room
Inconvenient session time
Time required
Unadapted content to needs
Repetitive content across sessions
Citation counts
* With respect to access and appropriateness for both childcare and mother’s concentration. ** Such as travel distance and finding suitable childcare.
5.3.2.5 Assessing respondent bias
Among the 277 mothers who attended at least one group information session, 47 did
not complete any of the parent feedback questionnaires they could have returned
after Module-1 and Module-2. Median percentages of attendance for these non-
completers was 17% versus 50% for completers (H1= 83.6; p<0.001). Non-
completers were 3 years younger (28 versus 31, t = 3.6, p <0.001) and were less
likely to have received university education (43% versus 65%, χ21= 7.5, p = 0.01).
5.3.3 Implementation
The following subsections address one by one each of the four performance scores
included into the evaluation of the Implementation. Then, the last subsection
addresses the calculation of the composite Implementation score.

163
5.3.3.1 Reach performance at intervention delivery
As previously mentioned, performance indices could not be calculated per module
(see section 5.2.4.1), so results per module have not been included in Table 18.
Nevertheless, reach performance scores per module have already been reported in
sections 5.3.1.3 and 5.3.1.4.
Table 18: Reach performance at intervention delivery across cohorts and cities
Eligible
audience
Areach
Exposed
audience
Breach
Reach
performance
score (CReach
=Breach/Areach)
*100
NOURISH
Reach
performance
objectivea
(Dreach)
Reach
performance
index (Ereach
=Creach/Dreach)
Brisbane cohort 1 145 118 81% 65% 1.25
Brisbane cohort 2 78 55 71% 65% 1.09
Adelaide cohort 1 73 59 81% 65% 1.25
Adelaide cohort 2 56 45 80% 65% 1.23
Overallb 352 277 79% 65% 1.21 a at delivery b at least one information session attended.
5.3.3.2 Dose delivered performance
Out of the 180 group information sessions planned to deliver Module-1 (see section
3.4.3), one session was cancelled for 3 groups (Table 19). However, efforts were
made to deliver the content of the cancelled session, by either delivering the content
alongside the content of another session (e.g. content of sessions 5 and 6 delivered in
one session for two groups) or by inviting participants (of one group) to join another
group.
Out of the 120 group information sessions planned to deliver Module-2 (see section
3.4.3), one session was cancelled for 4 groups (Table 19). The content of these
cancelled sessions was delivered in addition to the content of another session for two
groups (merged content session) while it was delivered for the two other groups by
merging group (participants were invited to attend another group). In addition, given
budget constraint due to the necessity of organising a second round of recruitment,
Module-2 sessions were run for cohort 2 by facilitators on their own.

164
Finally, 23 facilitator and co-facilitator pairs plus 3 facilitators on their own delivered
293 sessions to 50 groups across cities and cohorts. Overall, the content of the
information was delivered in 6 sessions per module, except for 4 groups for which
this content was delivered in 5 sessions per module. Three groups were merged with
other groups to deliver one session.
5.3.3.3 Dose received performance
Distribution of the dose received by participants has been given previously in Table
13, p156 of adoption results. Table 20 reports “full dose participants” counts as well
as corresponding performance indices.
5.3.3.4 Fidelity performance
• Rating agreement
All the 293 delivered information sessions were at least rated by a facilitator or a co-
facilitator. Moreover, 223 sessions were run by a facilitator and a co-facilitator and
were doubly rated. Median agreement between co-raters to rate consistency and
integrity items was 100% with minimum percentages of 75 and 67. On this basis,
ratings were judged reliable enough to be used in the assessment of the fidelity
performance. To calculate the performance score of each fidelity item, an average of
the facilitators’ ratings was used.

165
Table 19: Dose delivered performance across modules, cohorts and cities
Information session
to be delivered
(Adose del)
Delivered
information session
(Bdose del)
Dose delivered performance
score (Cdose del =
Bdose del /Adose del) *100
NOURISH
performance objective
(Ddose del)
Dose delivered performance
index
(Edose del = Cdose del /Ddose del)
Mo
du
le-1
Brisbane cohort 1 72 71 99% 100% 0.99
Brisbane cohort 2 48 46 96% 100% 0.96
Adelaide cohort 1 36 36 100% 100% 1
Adelaide cohort 2 24 24 100% 100% 1
Total 180 177 98% 100% 0.98
Mo
du
le-2
Brisbane cohort 1 36 36 100% 100% 1
Brisbane cohort 2 30 27 90% 100% 0.9
Adelaide cohort 1 30 29 97% 100% 0.97
Adelaide cohort 2 24 24 100% 100% 1
Total 120 116 97% 100% 0.97
Overall dose delivered 300 293 98% 100% 0.98
Table 20: Dose received performance across modules, cohorts and cities
Number of
recipients
(Adose rec)
“Full dose
participants”
(Bdose rec)
Dose received performance
score (Cdose rec =
Bdose rec /Adose rec) *100
NOURISH
performance
objective (Ddose rec)
Dose received performance
index
(Edose rec = Cdose rec /(Ddose rec)
Mo
du
le-1
Brisbane cohort 1 145 23 16% 100% 0.16
Brisbane cohort 2 78 12 15% 100% 0.15
Adelaide cohort 1 73 12 16% 100% 0.16
Adelaide cohort 2 56 10 18% 100% 0.18
Total 352 57 16% 100% 0.16
Mo
du
le-2
Brisbane cohort 1 145 7 5% 100% 0.05
Brisbane cohort 2 78 3 4% 100% 0.04
Adelaide cohort 1 73 6 8% 100% 0.08
Adelaide cohort 2 56 5 9% 100% 0.09
Total 352 21 6% 100% 0.06
Overall dose received 352 6 1.7% 100% 0.02

166
• Consistency
Consistency scores per item and across cities, cohorts and modules are presented in
Table 21 and Table 22.
Facilitators and co-facilitators rated that the “planned session time” was an issue for
28 groups (out of 50), hence median and minimum achievement percentages for this
item were 92% and 50% respectively.
Table 21: Consistency and subcomponent performance scores per group (n=293
rated sessions)
Items Percentages of protocol item followed
as planned
Min Max Median
Rapport and engagement (Q1) 92 100 100
Appropriate management of time (Q2) 50 100 92
Positive reinforcement/encouragement (Q3) 92 100 100
Comfort and fluency with content (Q5) 88 100 100
Overall consistency (Q1 + Q2 + Q3 + Q5) 83 100 98
Q refers to question number from session monitoring books
Table 22: Consistency scores across modules, cohorts and cities (n=293 rated
sessions)
Percentages of protocol followed as planned
Min Max Median
Module-1
Brisbane cohort 1 90 100 97
Brisbane cohort 2 97 100 100
Adelaide cohort 1 92 100 96
Adelaide cohort 2 96 100 98
Total 90 100 100
Module-2
Brisbane cohort 1 83 100 93
Brisbane cohort 2 90 100 100
Adelaide cohort 1 88 98 92
Adelaide cohort 2 88 96 90
Total 83 100 93
Overall consistency 83 100 98

167
• Integrity
Integrity rates per item and integrity scores across cities, cohorts and modules are
presented in Table 23 and Table 24. Facilitators and co-facilitators reported they
covered 100% of the content of each activity of the program. However, as shown by
minimum percentages of coverage, 8 groups covered less than 75% of some
activities. Specifically for these 8 groups, interactive activities which consisted of a
group discussion around a case study were not always covered111, nor take home
messages112 which repeated the content of the session, the coverage of some of the
third topic from Module-2113 and the review of the previous session.
Table 23: Integrity and subcomponent performance scores (n=293 rated sessions)
Items Percentages of protocol
item followed as planned
Min Max Median
Coverage of introduction and review of previous sessions (Q10) 70 100 100
Coverage of topic 1 (Q11) 80 100 100
Coverage of topic 2 (Q12) 80 100 100
Coverage of topic 3 (Q13) 60 100 100
Coverage of interactive activities (Q14) 42 100 100
Coverage of take home message (Q15) 60 100 100
Overall integrity (Q10 + Q11 + Q12 + Q13 + Q14 + Q15) 79 100 99
Q refers to question number from session monitoring books
111 3 groups covered 42%, 44% and 75% of this activity. 112 5 groups covered 60%, 67% and 75% of the “take home message”. The same facilitator was
running 3 of these groups. 113 Two groups in Adelaide did not see a video about family food and for one group in Adelaide, the
content regarding managing eating away from home was not covered.

168
Table 24: Integrity performance scores across modules, cohorts and cities (n=293
rated sessions)
Percentages of planned content covered
Min Max Median
Module-1
Brisbane cohort 1 94 100 100
Brisbane cohort 2 96 100 100 Adelaide cohort 1 83 100 98 Adelaide cohort 2 94 99 95 Total 83 100 100
Module-2
Brisbane cohort 1 84 100 99 Brisbane cohort 2 79 100 97 Adelaide cohort 1 86 100 93 Adelaide cohort 2 83 91 91 Total 79 100 94
Overall Integrity score 79 100 99
• Fidelity
As mentioned before (see section 5.2.4.4), a performance index could not be
calculated. Nevertheless, consistency and integrity subcomponents were averaged to
quantify an overall fidelity performance of the intervention delivery (see Table 25).
Although fidelity is not normally distributed, means have also been reported as they
were used for Implementation score calculations (see below section 5.3.3.5).
Table 25: Fidelity performance scores across modules, cohorts and cities (n=293
rated sessions)
Percentages of protocol followed as planned
Min Max Median Mean % (sd)
(Cfidelity)
Module-1
Brisbane cohort 1 93 100 99 98 (3) Brisbane cohort 2 96 100 100 99 (1) Adelaide cohort 1 86 100 98 96 (5) Adelaide cohort 2 95 99 96 97 (2) Total 86 100 99 98 (3)
Module-2
Brisbane cohort 1 88 100 96 95 (5) Brisbane cohort 2 88 100 94 94 (6) Adelaide cohort 1 91 97 94 93 (3) Adelaide cohort 2 86 93 90 90 (3) Total 86 100 93 93 (4)
Overall fidelity score 86 100 97 96 (4)

169
5.3.3.5 Difficulties to Intervention delivery
Based on session ratings (Q8 and Q9), facilitators did not report any distraction or
disruption for 155 sessions (53%). In addition, they reported that 132 sessions (45%)
had been moderately distracted or disrupted. In contrast, they reported that 6 (2%)
sessions of four groups had been affected by significant disruptions or distractions.
Similarly, facilitator pairs rated quality of environment and physical resources
available (Q9) as excellent for 144 sessions (49%) and adequate for a similar number
of sessions. In contrast, 6 sessions (2%) of six information groups were rated as
inadequate. Figure 27 provides difficulties or challenges reported for 35 information
groups (70%)114 by facilitator pairs.
Figure 27: Intervention delivery difficulties or challenges, reported by
facilitators for 35 information groups
1
4
16
17
18
0 2 4 6 8 10 12 14 16 18 20
Co-facilitator absence
Session time management
Inconvenient environment: room size, and babypresence
Physical and educational resources: venueaccessibility, equipment, material
,Group management: too small or too large groupparticipant disruption, difficult to establish rapport, poor
attendance
Citation counts
5.3.3.6 Implementation composite score
Finally, Table 26 reports on the Implementation composite scores that were averaged
from previous sub-Implementation performance scores (C columns from Table 18,
Table 19, Table 20 and Table 25).
114 See Table 26

170
Table 26: Implementation composite scores (%) across modules, cohorts and cities
N groups Reach
(Creach)
Full dose delivered
(Cdose del)
Full dose received
(Cdose rec)
Fidelity
(Cfidelity)
Implementation score
(Creach + Cdose del +Cdose rec + Cfidelity )/4
Mo
du
le-1
Brisbane cohort 1 12 81 99 16 98 74
Brisbane cohort 2 8 69 96 15 99 70
Adelaide cohort 1 6 78 100 16 96 73
Adelaide cohort 2 4 79 100 18 97 74
Overall Module-1 30 77 99 16 98 73
Mo
du
le-2
Brisbane cohort 1 6 40 100 5 95 60
Brisbane cohort 2 5 40 90 4 94 57
Adelaide cohort 1 5 51 97 8 93 62
Adelaide cohort 2 4 52 100 9 90 63
Overall Module-2 20 44a 97 6 93 60a
Overall Implementation 50 79b 98 2 96 69 a Due to rounding percentages for subgroups, overall Module-2 reach performance score and Implementation score slightly differ from the average of the column. b as overall count of participants who were reached by the intervention was made by counting participants who at least attended one information session, overall count does not average Module-1 and Module-2.

171
5.4 Discussion
The first research question that this chapter aimed to address was to determine
whether the NOURISH research programme was implemented as planned, assessing
the internal validity of this research with respect to a type three error. The second
research question addressed was to assess the circumstances or conditions under
which the intervention was implemented. Specific aims were to assess to whom the
trial was applied, the extent to which participants received the information delivered
and how they adopted it. This second question relates to the external validity of the
NOURISH research programme, and aimed at providing information to further
address effectiveness interpretation, applicability and generalisability.
Implementation composite score results (Table 26) highlight that, compared to what
had initially been planned, the implementation of the NOURISH trial was
satisfactory overall, across both cities and cohorts (69% score). However, results
indicate first that the reasons for a satisfactory implementation score rather than an
excellent score, were related to relatively lower performance scores for reach (79%)
and full dose received (2%). Second, Module-2 was relatively less well implemented
than Module-1 (73% versus 60%). Third, Module-2 performance scores for reach
and full dose received were relatively lower in Brisbane than in Adelaide (40%
versus 51–52%, and 4–5% versus 8–9% respectively).
Reach, adoption and implementation analyses provide insights into the determinants
of this overall performance, from three complementary perspectives. (i) Ability to
implement as planned each process component (i.e. intervention delivery, reach,
adoption). (ii) Ability to similarly implement the NOURISH research programme in
two cities and at two different time periods. (iii) Ability to implement the trial with
regard to specific recruitment, engagement and retention strategies.
To assess such abilities, comparisons were sought with other trials. It is worth noting
that several issues have limited the number of potential studies on which to base
these comparisons with the NOURISH process.

172
First, few childhood obesity prevention programmes have reported process
evaluation (Branscum et al., 2013; Campbell et al., 2013; de Silva-Sanigorski et al.,
2012; Fotu et al., 2011; Horodynski & Stommel, 2005; Mathews et al., 2010;
McGarvey et al., 2004; Miller et al., 2001; Nicholson et al., 2011; Salmon et al.,
2005; Sekhobo, Egglefield, Edmunds, & Shackman, 2011; Steckler et al., 2003;
Warren, Henry, Lightowler, Bradshaw, & Perwaiz, 2003).
Second, consistent with other observations (Branscum et al., 2013; Durlak, 2010;
Klesges et al., 2008)115, few of these publications have reported all the process
components that were addressed in this PhD research in spite of their acknowledged
relevance in health promotion (Green & Glasgow, 2006; Linnan & Steckler, 2002).
Even “Pathways” investigators116 (Helitzer et al., 1999; Steckler et al., 2003) who
developed a primary evaluation framework that addressed the achievement of both
process and effect objectives, or “Comics for Health”117 (Branscum et al., 2013)
investigators who comprehensively reported the process evaluation of an educational
intervention, did not address representativeness of participants.
Third, investigators who have reported process evaluations are often those who have
developed community-based programmes, hence implemented multi-setting and
multilevel interventions (i.e. multi-component research programme). In turn, this
involves the evaluation of a multiplicity of process objectives that encompass
reporting on process evaluation activities beyond the single activity of delivering
information sessions118. In addition, they have not reported the overall
implementation performance of entire programmes (i.e. composite implementation
115 Branscum et al. (2013) reported that among the 84 studies they reviewed, only 40% had
addressed at least one process component. Durlak (2010) observed that most process evaluations of
child education programmes address dose and fidelity, but do not explore whether these
programmes attract parents and maintain their involvement. Similarly, Klesges et al. (2008) did not
find any papers on childhood obesity prevention that reported testing representativeness of the
involved population. 116
A four-component intervention of this RCT was developed to prevent obesity of 2000 grade 3–5
American Indian Children and was based on the Social Learning Theory. It consisted of i) delivering a
culturally appropriate classroom curriculum; ii) delivering a physical education intervention; iii)
improving school food service; and iv) involving families (Caballero et al., 1998). 117
An RCT designed to address childhood obesity prevention to 71 schoolchildren randomly
allocated to an experimental condition that received a knowledge-based intervention and to a
comparison condition that received a theory-based intervention. Each intervention consisted of four
30-minute lessons delivered in 12 after-school facilities, by a unique facilitator. 118
As for the NOURISH intervention.

173
performance)119. For instance, the New York State special supplemental Nutrition
Project for Women, Infants and Children (NY Fit WIC)120 (Sekhobo et al., 2011); or
the quasi-experimental projects supported by Deakin University in the State of
Victoria (Australia) such as Romp & Chomp121 (de Silva-Sanigorski et al., 2012), the
Ma’alahi Youth Project122 (Fotu et al., 2011), and the “It’s Your Move” project123
(Mathews et al., 2010), reported on activities as diverse as training childcare staff
and dissemination of postcards to families. Given that these activities were part of
separate interventions with different targets, reporting unique implementation
performance did not appear relevant.
Fourth, process component measures are not comparable if they apply to children as
compared to adults. For instance, the reach measure in the “Comics for Health” trial
(Branscum et al., 2013) targeted children at school, which was a more captive
audience than the new first-time mothers targeted by the NOURISH trial.
Altogether, this leaves few studies to compare against the process results of the
NOURISH research programme.
5.4.1 Ability to implement each process component as planned
Intervention delivery
In spite of the complexity of the intervention delivery organisation and of the budget
constraints that applied to the intervention on the second cohort, the number of
sessions delivered was conducted nearly as planned, and the overall fidelity
performance was excellent. It was feasible to run 12 information group sessions by
119 Indeed, it seems that it would be irrelevant to combine the performance of multiple activities
developed for the delivery of multiple interventions, as it would lose the benefit of informing what
should be improved in such community-based programmes. 120
A quasi experimental intervention aiming at training WIC counsellors of low income mothers of
preschool children with respect to delivering physical activity and healthy lifestyle messages
(Sekhobo et al., 2011). 121
This quasi experimental trial targeted obesity prevention of 12,000 0–5 year old children in the
State of Victoria (Australia) from 2004–2008, via community capacity building, environmental
changes and promotion of healthy eating and physical activity (de Silva-Sanigorski et al., 2012). 122
This trial was similar to the above trial but targeted 2868 11–19 year old children in Tonga from
2004–2008 (Fotu et al., 2011). 123
This trial was similar to the two previous but targeted obesity prevention of 3406 13–17 year old
children in the State of Victoria (Australia) from 2005–2008 (Mathews et al., 2010)

174
several facilitators, with a high level of fidelity to the original intended messages.
Such results are consistent with reports of others. For instance, Branscum et al.
(2013) reported that the 96 “Comics for Health” lessons that a unique facilitator
delivered, reached excellent or nearly excellent fidelity. Similarly, high fidelity and
dose delivered performance for interventions delivered by multiple facilitators was
reported for the Pathways programme (Steckler et al., 2003). Other trials such as the
NEAT124, “Switch-to-Play”125 and “High Five for Kids”126 interventions did not
address programme fidelity but reported high dose delivery (Haire-Joshu et al., 2008;
Horodynski & Stommel, 2005; Salmon et al., 2005).
Reach
Reaching first-time mothers was an issue in the NOURISH research programme
from two perspectives: (i) recruitment and retention of a sufficient number of
participants, as observed by the necessity to organise a second round of recruitment;
(ii) enrolment of representative participants of the target population.
The NOURISH research programme was able to attract more participants than was
originally intended at the Recruit-1 stage. This suggests that, the strategies developed
by the NOURISH investigators to attract a sufficient number of participants into the
trial, such as approaching mothers at maternity hospitals and the level of information
provided to approached mothers, led participants to perceive the benefits they could
potentially derive from participation if they were allocated to the information group
sessions. However, this attraction ability was moderated by first, the non-
achievement of the Recruit-2 performance objective (4–7 months after first contact)
and the fact that fewer than half the target audience was reached at Module-2, when
infants were older (13 months). This suggests that strategies to attract and engage
124 The NEAT (Nutrition Education Aimed at Toddlers) program was an adaptation of the Early Head
Start in Michigan (USA) that offers child and family development services to low-income households.
The NEAT study was a quasi experimental trial that provided four group classes every two months
and 18 home-based reinforcement visits (Horodynski & Stommel, 2005). 125
An Australian school-based RCT aiming at preventing unhealthy weight gain in 10-year-old
children. Children were randomly allocated to one of the four conditions: i) 19 lessons focusing on
mastery of Fundamental Skills (FMS) (n=73); ii) 19 lessons encouraging non-sedentary activities (BM)
(n=69); iii) 19 lessons combining FMS and BM (n=90); and iv) control (usual school curriculum) (n=61)
(Salmon et al., 2005). 126
see footnote 130

175
mothers after four months (see section 3.4.1) and then 13 months of motherhood
experience were insufficient (see section 3.4.4). Steckler et al. (2003) reported that
reaching Pathways families127, was the hardest process objective to achieve.
Surprisingly, they reported similar family involvement to the programme after one
year (as expressed by a 0.45 reach ratio) compared to the NOURISH trial (as
expressed by a reach percentage at Module 2). Based on this reach result, Pathways
investigators fine tuned their strategies to involve families and managed to improve
family reach during the third year of the programme (ratio 0.63). Conversely,
Nicholson et al. (2011) knew from the outset of the Making Our Mealtime Special
(MOMS) RCT128, that to successfully recruit American low-income mothers of
infants, they needed to address the “chaotic” life conditions of the target population.
Thus, they developed a set of recruitment strategies that matched with the profile of
their participants, such as face-to-face recruiting with research staff that was able to
explain the study, form relationships with participants and inform participants about
financial incentives. Investigators did not formally track refusals, but reported “that
refusals were very rare” because approached mothers had the opportunity to
complete the initial questionnaire at a later visit if they felt rushed when first
approached by research staff (Nicholson et al., 2011). They also suggested that
consistent and multiple contacts were key strategies to successful recruitment and
engagement. This might explain the observed difficulty with the NOURISH two
stage recruitment strategy. Indeed, a relatively significant time lapse occurred with
limited contact129 between first contact and enrolment finalisation. In turn, first-time
mothers might have had time to reconsider their potential enrolment decision and
have lost their initial motivation after their 4–7 month motherhood experience.
In parallel to these recruitment and engagement difficulties, selection, attendance and
retention biases occurred with respect to maternal age, parental education and marital
status, between those who remained at the different stages of the trial and those who
127 see footnote 116
128 This RCT tested the effectiveness of two anticipatory guidance conditions on childhood obesity
prevention at 24 months of age with a group of 292 low-income American mothers (see section 4.4)
(French et al., 2012; Groner et al., 2009) 129
No contact was planned at recruitment of Cohort 1, while one contact was planned six weeks
after contact at the maternity hospital for Cohort 2 recruitment.

176
did not. In the end, throughout the following stages of the research programme, on
average participants were older; more often married; and had achieved higher
education levels than the target population (see Figure 22). As compared to those
who dropped out, participants also returned to work when their baby was older and
worked fewer hours per week. Conversely, they were less likely to have financial
difficulties, stopped breastfeeding at 6 and 15 months and early introduced solid
foods (see Appendix 13). This suggests that the importance of early feeding in child
nutrition may have been perceived differently between mothers with different
profiles and seems to have been less attractive to mothers with more complicated life
conditions. Similar biases have been observed with participation of parents in other
RCTs specific to child obesity prevention (Thomas, 2006) as well as in trials non-
specific to obesity prevention. For instance, Taveras et al. (2011) reported that
college graduate parents were more likely to consent to participation in the High Five
for Kids RCT130. High level educated mothers were overrepresented in the INFANT
RCT (Campbell et al., 2013). Similarly Mihrshahi et al. (2002) reported that new
parents recruited into the Childhood Asthma Prevention Study (CAPS)131 were more
likely to have achieved tertiary education132 than those who refused participation. In
addition, those who stopped participation were younger, less educated, and full time
employed.
Together these biases pose a generalisability issue in regard to the results of the
effect evaluation because what works in one group may fail for others, specifically
when education is one of the differential characteristic (Moore & Gibbs, 2010). For
instance, in an intervention for prevention of chronic disease among children (“Know
your body”), Walter et al. (1989) reported significant results in high income families
but not in low-income families while they conducted two parallel RCTs (one within
130 Home based intervention with an RCT design, targeting 2–5 year old children in Missouri (Haire-
Joshu et al., 2008). The intervention consisted of receiving (i) a tailored nutrition newsletter, (ii) four
home visits delivered by parent educators specifically trained, (iii) a storybook which reinforced area
of the programme. The objective was to change parent behaviour with respect to fruit and vegetable
exposure, modelling and feeding practices in order to increase fruits and vegetables intake of
children. 131
Although this RCT did not aim for childhood obesity prevention, it is worth referring to as
recruitment process, reasons for non-participation and socio-demographic characteristics of
participants, non-participants and those who withdrew were analysed. 132
Trade/apprenticeship + TAFE/college certificate + University degree

177
white middle class populations and one in the Bronx in New York). They suggested
that the intervention message was probably “derived from a white middle-class
orientation, and may not be the most relevant concept for economically
disadvantaged minority youth”. A similar risk may impact the effectiveness of the
NOURISH intervention if it were implemented on groups of single and younger
mothers with lower educational backgrounds and financial difficulties who do not
breastfeed. Evaluation of such risks is important, since the prevalence of childhood
obesity is known to be higher in households with these characteristics (Glickman et
al., 2012; Knai et al., 2012; Lakshman, Zhang et al., 2013; Lee, 2011; Moore &
Gibbs, 2010; Morley et al., 2012; Sassi & Devaux, 2012; Shrewsbury & Wardle,
2008; Story et al., 2008; Wang & Lim, 2012). Selected NOURISH mothers might
have been more likely to already use some of the positive feeding choices that were
communicated by the intervention. For instance, it has been shown in an Australian
cross-sectional study that breastfeeding mothers had higher intakes of fruit and
vegetables than non-breastfeeding mothers (Leslie, Hesketh, & Campbell, 2012), and
hence might expose their child to a healthy diet more so than their non-breastfeeding
counterparts. Maternal age has been shown in an Australian cohort study to
positively predict age of solids introduction, which is not recommended before four
months of age (Scott, Binns, Graham, & Oddy, 2009), reflecting one example of
better feeding choices among older Australian mothers. Similarly, mothers from
advantaged social groups are often reported as being aware of health issues related to
nutrition, including for their children, engaging in health promotion activities
focused on these issues, and adopting nutritional practices that conform to
recommendations (McLeod et al., 2011; Pampel, Krueger, & Denney, 2010; Skafida,
2013). In turn, such pre-existing predispositions in NOURISH participants with
respect to positive feeding choices might have yielded underestimated effect size or
even non-observation of difference between groups due to a type II error133. This
could explain non-observed effects with respect to “exposure to fruits”, “exposure to
non-core foods”, “covert control use”, “child sitting during meal” and “child
watching TV during meals”. In their feedback, some participants who reported that
133 As the difference to detect between the intervention group and the control group might have
been smaller than what had been planned at sample size calculation.

178
they did not learn much, support such a suggestion (see Figure 26 and Table 36 in
Appendix 10). Alternatively, selected participants may not have yet been aware of
positive feeding choices as they were first-time mothers but might have been
particularly receptive to the intervention as compared to non-participants, and might
have better applied the NOURISH guidance than non-participants would have done.
In turn, this would have yielded a potential overestimation of the effect size. Thus, at
this stage of the analyses it is difficult to indicate in which direction the selection bias
influenced the effect size of the intervention.
Some insights into the reasons for selection bias were gained via univariate analyses
between non-participation reasons and maternal characteristics. Such analyses were
possible because basic maternal socio-demographics were available for all (n=2169)
Recruit-1 mothers, and could be related to non-participation reasons obtained from
823 mothers who could be recontacted at Recruit-2 and were still eligible (see Figure
7). To the best of our knowledge, such analyses have rarely been conducted.
Thus, consistent with the suggestion of Banwell et al. (2008), lack of time and work
commitments were reported as the main barriers to participation, and were similarly
reported across education levels (Figure 17). In contrast, based on an identical
sample size as for those who cited time and work reasons, participants with a lower
education level were more likely to report at Recruit-2 that they were not interested
in participating (Figure 17). A lack of attractiveness related to differential interest, is
consistent with observed positive associations between participation and participants’
SEP as assessed by education or income as well as maternal age in other studies
(Foster et al., 2011; Mihrshahi et al., 2002; Regber et al., 2013; Taveras et al., 2011).
In turn, such differential interest in the intervention might be related to differential
perception regarding the topic of the intervention. For example, Barrat et al. (2012)
interviewed non-responders of an RCT in Melbourne aimed at evaluating the effect
of an intervention delivered by general practitioners to families of overweight or
obese children. They reported that non-participants did not perceive a level of risk
that could have motivated their participation, which, in turn, was thought to require a
high level of time commitment that participants thought they would not be able to

179
meet. Barrat et al. (2012) also reported that non-participants perceived a risk of a
negative experience if they participated.
Adoption:
Based on participant feedback with respect to satisfaction, overall, mothers who
attended information group sessions were satisfied with both modules, perceived the
intervention as being “very useful”, and reported that the intervention helped them “a
lot” in developing their knowledge and in changing behaviour with respect to child
food needs and feeding. Hence, it appears that the content of the information sessions
was largely perceived as relevant and was not a major reason for poor attendance.
Such results are consistent with the results of the comparison between T3 completers
and non-completers conducted for the effect evaluation (see section 4.3.2). Indeed,
whereas attrition was higher in the intervention group than the control group after the
delivery of Module-1, no difference was observed between the control and
intervention groups with respect to characteristics of non-completers after Module-2.
This suggests that attending both group information sessions and clinical assessment
(i.e. intervention group) was as acceptable as attending clinical assessment only (i.e.
control group) in terms of time commitment and maternal availability. In turn, this
suggests that intervention delivery organised around group information sessions
might have been relevant to the specific audience, as defined by those who remained
in the trial.
These results are also consistent with others that have reported on adoption based on
participant feedback. For instance, INFANT134 investigators (Campbell et al., 2013)
reported similar proportions of first-time mothers (99%) who found the provided
information useful. Others (Salmon et al., 2005; Warren et al., 2003) have
summarised adoption results with a single sentence such as participants “enjoyed”
the intervention. However, such results on adoption as measured by participant
feedback need to be taken with caution. Recurrent positive published results on
adoption might indicate publication bias (i.e. positive results being more likely to be
published), or potential respondent bias as it was found in the present adoption
analyses: respondents to the feedback questionnaire were those who attended more
134 See section 4.4. for a description of the objectives and the intervention content.

180
group information sessions and, in turn, might have been more receptive to the
intervention.
In contrast, adoption analyses based on an objective measure (i.e. number of sessions
attended per participant), pointed out the incapacity of the NOURISH research
programme to maintain full engagement of enrolled participants such that they
received the full dose of the intervention. This was disappointing, given the efforts
deployed by the NOURISH team to optimise conditions for participant engagement
(e.g. letting mothers choose the venue, offer the possibility to swap groups in case of
a missed session, childcare provision, etc. See section 3.4.3).
Although not exhaustive because participants who attended fewer sessions were less
likely to respond to the Parent Feedback questionnaire, analyses of participant
perceptions regarding difficulties to attendance (Q8) and reports of what they
disliked most about NOURISH (Q11, Figure 26), provide some insights into the
reasons behind such a low adoption performance achievement.
Consistent with intervention delivery performance, few organisational issues (i.e.
relating mainly to session organisers) were mentioned as having affected attendance,
and thus do not appear either as a major limiting factor to attendance (see Figure 25).
In contrast, events related to participants and children were reported as being major
barriers to attending. These events included planned events such as work, children
sleeping time, and unplanned events such as child or maternal illness, and family
events (see Figure 25). The initial perceived benefits of attending multiple
information sessions that motivated enrolled mothers may have been overridden by
constraints to attendance experienced by mothers. Indeed some comments from
mothers suggest that once they had attended a few sessions, they may have been able
to revise their time commitment against their expectation of the amount of new
information they would receive.
“Often I knew so much of the info given so the ratio of time spent getting to and
from the session and being at the session versus new info learned was very low.
This made it sometimes a chore to go rather than new and informative.” ID
7198, see Appendix 11.

181
“Location and time not convenient and I found that a 2 hour session plus 20
minutes travel time each way took up too much of my time.” Individual: 295,
see Appendix 11.
The parallel attendance trends at modules 1 and 2 (Figure 23), and the fact that
most mothers who gave up at Module-1 did not attend any other session at
Module-2 (Table 13) also support this suggestion.
Consistent with the initiative of some facilitator pairs to uncover repetitive
activities (Table 23), mothers suggested that the important time commitment
could have been minimised by avoiding repetition across sessions and even
condensing sessions.
“Sometimes it was a bit repetitive. Perhaps could’ve condensed the information
into less sessions.” ID 1591, see Appendix 11.
“Too much repetition of the main messages – felt the information could have
been combined into 3-4 sessions- Was a big commitment to go to 6 sessions.”
Individual: 4, see Appendix 11.
For many scholars, such initiative taken by facilitators might be perceived as a
failure in delivering a standardised intervention among participants, hence
introducing a bias to RCT design. Some authors (Craig et al., 2008; Hawe, Shiell, &
Riley, 2004; Macintyre, 2011) however argue that standardisation is not necessarily
synonymous to providing exactly the same content to all participants, especially if
some of this content is relevant only to certain participants. Flexibility is inevitable to
increase the adoption by recipients, and hence intervention outcome, as it allows
meeting the needs of beneficiaries (Durlak, 2010; Hawe, Shiell, & Riley, 2004).
Thus, facilitators’ adaptation of the intervention delivery by shortening some of the
sessions might have been a positive initiative.
Other comments of mothers suggest that adequate childcare during session times was
also an issue. Adequate childcare is understood here, as childcare that meets baby
needs such as sleep, comfort and activities. Specifically, most mothers that reported
inconvenient session time also reported that it overlapped with baby naptime and that
the inconvenience of the session was directly related to difficulties in coping with

182
both mother concentration and adequate childcare (Figure 26 and Table 36 in
Appendix 10). Some facilitator pairs appear to have perceived this issue too as they
reported for about half of the information groups (16/35, see Figure 27) that baby
presence was an issue. In turn, investigators considered this issue and arranged
childcare for all Module-2 sessions at venues where it was not already available (see
section 3.4.3).
Lastly, although participants reported they were satisfied with the intervention
content (see above), they did not find that the information they were given assisted
them in changing the types of food available at home. This might explain why no
difference was observed, with respect to fruit and “non-core food” exposure, between
control and intervention groups. In turn, three interpretations can be suggested for
such feedback. First, the intervention may not have succeeded in communicating the
importance of healthy food exposure to participants. Given the level of education of
participants and the level of promotion of fruit and vegetables as healthy food in
Australia (McLeod et al., 2011), this appears unlikely. Second, the intervention may
not have addressed all the various necessary dimensions for behavioural change.
Specifically, the intervention was limited in involving both parents who are
potentially decision makers with respect to food available at home. Thus, the
intervention might have been limited in addressing reinforcing (e.g. partner
acceptability to changing food) and enabling factors (e.g. skills needed to cook new
food) of behavioural change. Third, the mothers who ended up participating, being
more aware of the importance of child nutrition, may not have needed to change the
food available at home as this was already consistent with the recommendations
provided by NOURISH. Such a result would be consistent with observations by other
researchers, that advantaged social position groups are more likely to be aware of
health issues related to nutrition, including for their children, hence are more likely to
engage in health promotion activities focused on these issues, and to adopt nutritional
practices that conform to recommendations (McLeod et al., 2011; Pampel et al.,
2010; Skafida, 2013).

183
5.4.2 Ability to similarly implement the research programme in two
cities and at two different periods
Overall, Implementation composite scores were similar across cities and cohorts,
with excellent fidelity and dose delivery scores. Thus, the delivery protocol was
transferable over different spatial and temporal contexts.
In contrast, reach longitudinal analyses identified four types of differences with
respect to recruitment and engagement abilities between cities and cohorts. First, the
ability to attract participants at Recruit-1 stage in Brisbane was overall higher (78%
versus 72%), inconsistent across cohorts (Figure 11) and lower with respect to
maternal education representativeness (Figure 22). Second, the ability of
investigators to successfully recontact mothers after 4–7 months of maternal
experience was higher in Brisbane than in Adelaide (83% versus 69%, Figure 12),
and as opposed to Adelaide, Recruit-2 reach performance scores for Brisbane were
consistent across cohorts (Figure 13). Third, the ability to engage enrolled
participants in the first module in Brisbane was similar to that of Adelaide (77%
versus 78%, Figure 18), but inconsistent across Brisbane cohorts. Fourth, this former
ability was lower in Brisbane than in Adelaide for the second module (40% versus
51%, Figure 20) but consistent across cities’ cohorts. These differences may partly
reflect the various choices that chief investigators had to make at recruitment
between cohorts (i.e. cohort 2 recruitment within a selection of hospitals that
generated the highest consent rates for cohort 1), and between cities (i.e. study staff
involved in Adelaide at Recruit-1 versus midwives in Brisbane). Alternatively, these
differences may also partly reflect differences in daily conditions between cities such
as transport, and State policies.
Based on ABS statistics, there is no evidence that maternal education levels of the
target populations were different between cities (Figure 22e). In contrast, statistics
obtained from the research centre of the hospital, which was retained to recruit
cohort 2 participants in Brisbane, suggest that the change in the recruitment strategy
between the two cohorts generated a change in the selection process. Indeed, first-
time mothers giving birth at that particular hospital during the NOURISH
recruitment periods were on average two years older and had more often achieved

184
post-secondary education than the overall Brisbane target population135. Consistent
with the acknowledged relationship between education and participation, this in turn
might have positively affected the likelihood for mothers to engage at Recruit-1 in
Brisbane. This interpretation is also consistent with the differential report between
Brisbane and Adelaide on reasons related to a “no need to participate” at Recruit-2
(9% versus 19%, Figure 15).
As suggested by researchers in Australia (Aitken et al., 2003; Barratt et al., 2013),
research staff involvement in approaching participants allows for better responses to
participants’ questions with regards to the programme. In Adelaide, the NOURISH
study staff might have better promoted the value of the trial to each participant
(better representativeness) and given a more realistic view of commitment time
required to approached mothers than the midwives in Brisbane. In turn, approached
mothers in Adelaide might have anticipated the practical implications of engagement
in the NOURISH trial (including transport, and time), resulting in an earlier
disengagement of Adelaide mothers (at Recruit-1 and 2 stages) than Brisbane
mothers who disengaged at later stages of the trial (Module-2). Higher proportions in
Adelaide of reasons to decline participation at Recruit-2 (Figure 15) stage related to
time (72% versus 61%), and transport (22% versus 16%) support this suggestion. In
spite of their relatively greater representation in the target population, and hence a
relatively higher proportion of mothers with a lower education level were approached
in Adelaide, initial interest in the trial did not differ between the cities (22% versus
17%, Figure 15), which appears to reinforce the role played by the research staff in
Adelaide.
Lastly, as suggested by the “Australian Cities Accounts report”136 differences in daily
life conditions of the mothers between Brisbane and Adelaide, might also have
influenced reach performance between the cities. Such a suggestion is supported by
the aforementioned differential reasons related to transport and time (Figure 15).
135 Statistical summaries were obtained from the Mater Hospital research centre as well as from
Queensland Health for other major hospitals in Brisbane, for first-time mothers aged 18 years or
over who had a live born singleton with a birth weight of >2500 g or gestation >=37 weeks, who
matched the corresponding recruitment periods. 136
http://www.sgsep.com.au/files/GDP_by_Major_Capital_City.pdf. accessed on 7/11/2013.

185
The extents to which each of these three identified factors contributed to the reach
process, and interacted with each other, are unknown as analyses relied on univariate
associations. It is acknowledged that other non-measured factors such as differential
staff capacities in communicating with participants, and differential time and budget
constraints between cohorts, might have contributed to explaining the reach results.
5.4.3 Ability to implement the trial with regards to specific
recruitment, engagement and retention strategies
Although few RCTs report on process evaluation, they however often provide, via
CONSORT Flow Charts, key results that allow calculation of reach process
performance as was conducted for this PhD. In turn, this allows potential
comparisons with similar trials from which insight on recruitment, delivery and
retention strategies might be gained. To the best of our knowledge, such comparative
work has rarely been conducted for child obesity prevention studies137 and few
trialists have evaluated recruitment (Treweek et al., 2011). The existence of two
culturally similar trials Healthy Beginning Trial (HBT) (Wen et al., 2012) and Infant
Feeding Activity and Nutrition Trial (INFANT) (Campbell et al., 2013), with the
same primary objective to NOURISH and with an anticipatory guidance approach
toward first time-mothers (see Table 12 and section 4.4 for description of objectives
and intervention content) provided a good place to seek out such specific insights.
Before comparing these three culturally similar trials, key descriptions of strategies
and the performance of recruitment, intervention delivery, and follow-up stages are
given.
NOURISH participants were first approached at maternity hospitals a few days after
birth delivery, and then were recontacted for full enrolment 4–7 months later if they
had provided consent at first contact (see section 3.4). Contacts were made using a
universal approach, materialised by provision of standardised pamphlets. Mothers
were invited to choose the assessment clinic they would attend and were randomly
allocated to groups by clinic blocks. Although the time between consent to full
enrolment and the beginning of active participation (i.e. baseline assessment) was
short, the time between first contact at the maternity hospital and active participation
137 Skouteris et al.

186
was four to seven months. The intervention consisted of two six-group information
sessions delivered fortnightly over two separate three-month periods. First and
second follow-ups occurred after six and 12 group information sessions when the
babies were about 13 and 24 months respectively. At the 13-month follow-up, 16%
of participants had received the six planned sessions. At the 24-month follow-up,
50% had received five sessions (7.5 hours).
INFANT participants (Campbell et al., 2008; McLeod, 2011; Lioret et al., 2012;
Campbell et al., 2013) were approached through 62 pre-existing first-time parents
groups. The groups were selected from a two-stage random sampling, from existing
parents groups in local governments areas in Victoria (Australia). The first random
stage involved local government area selection as the unit of randomisation, within a
60-kilometre radius around the research centre. The second random stage involved
sampling parents groups within the same proportions of the total number of existing
first-time parents groups in selected local government areas. Randomly selected
groups were retained if at least eight mothers in an affluent area and six mothers in a
poor area gave consent to participation. Groups were then randomly allocated to the
control or intervention conditions. First contact with the study took place during one
of the standard parents group sessions in the first three months of their baby’s life.
Active participation started at baseline assessment (mean baby age 3.8 months).
Thus, time between first contact and the beginning of active participation is relatively
unclear but was a maximum of four months. Intervention consisted of six group
information sessions, delivered quarterly. First and second follow-ups took place
after two and six group information sessions, when babies were about 9 and 20
months respectively. At the 20-month follow-up 68% had attended at least 4 sessions
(>= 8 hours).
INFANT investigators (Campbell et al., 2013) did not find that reaching participants
was an issue as noted by high reach scores at different stages of the trial (86% of
eligible and approached participants were recruited versus 24% in NOURISH), and
attrition rates were 4% versus 14%, and 9% versus 22% at 9–10 months and 20–24
months follow-ups, respectively (see Table 12). Such results are consistent with the
aforementioned positive influence of SEP level on participation. Indeed, it appears
that to test the efficacy of the intervention, INFANT investigators adopted a more
187
pragmatic strategy than the NOURISH universal approach by recruiting first-time
mothers among existing mother-groups, which were known to be more likely
attended by mothers from high SEP (Campbell et al., 2013). Finally, with two
different recruitment strategies, the INFANT and NOURISH trials recruited similar
mothers with respect to university education (54% versus 58%), age (32 years, SD=
+4 versus 30 years, SD= +5), return to work (10% versus 15%) and current
breastfeeding (72% versus 74%) at baseline assessments.
HBT participants (Wen et al., 2011; Wen et al., 2012) were approached when
attending antenatal clinics in disadvantaged areas of Sydney by research assistants
who gave potential participants a letter of invitation and information about the study.
Pregnant women who declined participation when approached were not screened for
eligibility nor surveyed. For two thirds of recruited mothers, first contact with the
study took place between 24–34 weeks of pregnancy and active participation started
between 30–36 weeks of pregnancy with a home visit by a community health nurse
who conducted a baseline assessment. For the remaining recruited mothers the time
that elapsed between first contact and baseline assessment is less clear. Intervention
delivery took place during eight home visits by a research nurse. Follow-up
assessments took place during home visits for both groups. Specifically, the first
follow-up measures took place at 6 months of baby’s age and after 3–4 home visits
for the intervention group. Second follow-up took place at 12 months of baby’s age
and after 5–6 home visits for the intervention group. At the 12 month-follow-up,
35% of the intervention group had received all the planned home visits.
HBT targeted a more difficult to reach population and recruited on average younger
(26 years) and relatively less educated mothers (24% had completed tertiary
education) than NOURISH. Consistent with the positive influence of age and SEP
level on participation described previously, a higher recruitment performance could
have been expected for the NOURISH trial that targeted mothers within a broader
range of age and education than HBT. However, the HBT strategy led to higher
recruitment performance than the NOURISH universal approach. From eligible and
approached mothers, rates of randomised participants were 86% versus 24%
respectively (see Table 12). What is more, the HBT recruitment performance score
was similar to that of INFANT (86%) (see Table 12). It appears that HBT

188
investigators planned a recruitment strategy adapted to a more restricted target
population than the NOURISH investigators could propose with a broader target
population.
Consistent to suggestions made by others (Hendricks, Briefel, Novak, & Ziegler,
2006; Lakshman, Zhang et al., 2013; McGowan et al., 2012; Skafida, 2013; Thomas,
2006), these comparisons suggest that a “one size-fits all” recruitment strategy may
not be relevant to certain subgroups when recruiting participants to a childhood
obesity prevention programme. While offering group information sessions appears to
attract relatively “old” and university educated mothers, home intervention delivery
might be more convenient for younger and less educated mothers. In turn, this
suggests adapting recruitment strategies to the various profiles of the target
population, hence either planning multiple sets of specific recruitment strategies to
recruit a broad target population (e.g. first-time mothers) or a single set of specific
recruitment strategies to attract a more specific target population (e.g. young first-
time mothers in poor suburbs of a city). Conversely, as for NOURISH recruitment, it
appears that Childhood Asthma Prevention Study (CAPS) investigators in Australia
(Mihrshahi et al., 2002) used a universal approach to recruit eligible parents138. The
recruitment performance of CAPS was similar to that of the NOURISH trial (29%
versus 24%) and participants were more educated than the overall eligible target
population.
Another factor that might have affected recruitment effectiveness of the NOURISH
trial is the time elapsed between first contact and the commencement of intervention
delivery due to the two stage recruitment strategy. It is likely that this time was
slightly shorter for INFANT, as mothers were first approached when they attended a
first-parent group within the first three months of their baby’s life; and active
participation, as noted by mean baby age at baseline assessment, took place at 3.8
months. In contrast, in the Healthy Beginning trials, it appears that this elapsed time
might have been as short as two weeks and anticipatory guidance started at an earlier
infant age than for NOURISH. This shorter time lapse between the first contact with
138 a standard letter was sent to eligible parents to inform them about the study and that they would
be contacted by research nurses.

189
the trial and the intervention might have not left time to HBT mothers to reconsider
their consent decision. Conversely, the first-time mothers approached in the
NOURISH trial had 4–7 months to experience the busyness of motherhood before
finalising full enrolment in the study. In addition, during that period limited
contact139 was planned, contrasting with a suggestion made by Nicholson et al.
(2011) to maintain participation in the MOMS trial. However, such contact could
also have been an opportunity for mothers to report on some difficulties they could
have realised with respect to self-organisation for attendance (e.g. time, work), hence
might have helped investigators anticipate on attendance issues.
These trial comparisons also suggest that the intensity of the interventions might
have contributed to differential retention performance. The INFANT intervention
appears to have been less intensive than the HBT and NOURISH programme.
Indeed, the INFANT intervention was less demanding than the NOURISH
intervention with respect to mother time commitment as it delivered a total of 12
hours of group information sessions spread over 18 months in 6 x two-hour sessions.
NOURISH delivered 18 hours of group information sessions that were concentrated
into 2 x three-month periods. Fitting these sessions in around appropriate childcare
(including sleeping, and eating) and work might have been more difficult for
NOURISH participants than for INFANT participants. In addition, given the
intervention was delivered in 1.5-hour slots rather 2-hour sessions, the transport /
session time ratio might have been higher in the NOURISH trial than in the INFANT
intervention140. Consistent with the findings of Barratt et al. (2013), mothers may
have prioritised their time commitment and limited their group information session
attendance. This interpretation is consistent with attendance figures of both trials as
well as with suggestions by participants to condense sessions.
The HBT intervention was home-based and thus maternal burden with respect to
childcare organisation and transportation was lower than for NOURISH and
INFANT participants. Thus, a higher proportion of HBT mothers as compared to
NOURISH mothers received the full dose of the anticipatory guidance. However,
139 No contact was planned at recruitment of Cohort 1, while one contact was planned six weeks
after contact at the maternity hospital for Cohort 2 recruitment. 140
Assuming similar traffic across study cities.
190
attrition rates were higher at both follow-ups than in the NOURISH trial, suggesting
that retention strategies for the HBT could be improved. The HBT intervention
intensity (7 to 8 home visits) might have been an issue even with a home delivery
protocol for disadvantaged mothers for whom perceived benefits from participation
might have been overridden by other constraints such as work.
5.5 Conclusion
Based on the detailed description of the implementation process of the NOURISH
research programme presented in this chapter, it appears that the NOURISH
intervention was qualitatively and quantitatively relatively well delivered. This
should limit type III errors when interpreting the results of the effect evaluation
addressed in chapter 4.
In addition, participants who attended group information sessions were satisfied and
found the information useful. However, they reported that participation in the
intervention was time demanding which was the most frequently cited barrier to
attendance. As a result, few participants received the full intervention dose. In
particular, fewer mothers were exposed to the content of the second module, which
addressed positive feeding environment and specifically promoted the division of
responsibility described by Satter (2000) (“parent provides, child decides”). The
extent to which full dose compliance impacted the effectiveness of the intervention
on the selected maternal outcomes will be examined in Chapter 6.
Reach process analyses revealed that first-time mothers who participated in the
NOURISH research programme were not representative of the target population.
Mothers who engaged with the NOURISH programme were older, more likely to
live with a partner, to be university educated and wealthier and to breastfeed, than
mothers who did not engage. The extent to which maternal profile selection limits
the generalisability of the intervention impact results addressed in Chapter 4, will be
further examined in Chapter 6.
The process evaluation provided useful information on process elements that are
transferable to real world conditions and on those that need revision. Specifically,

191
with limited modification (e.g. avoid repetition, condensing), the NOURISH material
for group information delivery is transferable to other contexts. Strategies to reach
the target population need revision in order to increase perceived benefits of
receiving the NOURISH information content, and to increase the accessibility by all
first-time mothers. Key research perspectives to address such revision will be
discussed in Chapter 7.

192

193
Chapter 6 Exploring process influences on maternal feeding
choices
6.1 Introduction
The results from the effect evaluation (Chapter 4) suggest that the NOURISH
intervention was effective in guiding mothers to make some positive feeding choices.
In turn, the process evaluation led to the following key results with respect to the
NOURISH implementation. Overall, the NOURISH intervention was delivered at
least partially to 272 first-time mothers (i.e. Module-1) and fully to 150 mothers (i.e.
Module-1 and 2), after a two-stage sampling process that occurred consecutively
over two141 4-month and two 2-month periods. Attrition rate was significantly higher
in the intervention group than in the control group, suggesting that the time
commitment required to attend the information sessions was a barrier to
participation. As shown in Chapter 5, compared with those who remained in the trial,
those who dropped out were significantly younger, less likely to live with a partner,
less likely to have received university education and to breastfeed at baseline; but
they were more likely to be in financial need142, and concerned with their own
weight. Nevertheless, maternal and child characteristics of the participants who
dropped out were similar in both arms of the trial, excluding a retention bias between
the two groups. This shows that allocation to the information sessions was not the
sole motive for trial attrition, but that maternal characteristics also influenced
participation. This selective process with respect to maternal characteristics did not
only occur during the intervention phase, but started to develop from the enrolment
phase. Hence, the final study sample was not representative of the targeted
population. Finally, while the NOURISH intervention was delivered as planned, the
process evaluation demonstrated that people who felt they did not have time, who
were less interested and/or who had a greater chance of being in financial difficulty
were less likely to be involved in either the intervention group or in the control.
141 Because of two cohorts
142 Based on the proxy used in this research, i.e. that mothers had a health-care card.

194
Selection of participants appears to be a classical limitation of interventions with an
RCT design (Campbell et al., 2013; Glasgow et al., 1999; Watt et al., 2009; Wen et
al., 2012). There is a risk that generalisation of the effects of an intervention may
become more difficult, due to the fact that participants may not be fully
representative of the target population, or of the broader population including non-
eligible participants (a problem of external validity). In the case of NOURISH,
conclusions of the RCT may only generalise to the fraction of Brisbane and Adelaide
first-time mothers that remained well represented in both the control and the
intervention conditions of the trial.
The aim of this chapter is to address whether the implementation process of the
NOURISH research programme might have influenced intervention effectiveness.
This chapter addresses first the extent to which the process components of the
research programme contributed to explain the variability of selected maternal
outcome variables and then discuss how the implementation process might have
influenced results of the effect evaluation.
6.2 Methods
The analytical approach was driven by addressing the influence of the full process of
the NOURISH research programme on the selected maternal feeding choices while
respecting the robustness of the RCT design analysis (Intention-to-treat analysis).
This approach was in line with an increasing acknowledgement, conceptualised by
the RE-AIM framework (Glasgow et al., 1999), that conditions of implementation
and effectiveness evidence contribute equally to research translation into real world
condition programmes (see section 2.3.3).
Given that a full intervention process includes consideration of reach, adoption and
implementation process components143, analyses could only concern participants
who received the intervention. Thus, they focused only on the intervention group.
They were based on a modelling approach aimed at measuring the relative influence
143 …and maintenance component, which could not be addressed in this research as no data
permitted (see section 3.3.2.2, p. 30)

195
of predictors including participant characteristics, dose of intervention received, and
implementation process as measured in Chapter 5, on the eight maternal outcome
variables selected in Chapter 4144. As a result, these analyses were not per protocol
analysis145 as they did not explore the contribution of each process component on the
effectiveness of the NOURISH research programme on selected maternal outcomes.
To determine the contribution of each of the process components on the eight
selected maternal feeding choice variables, regression analyses were used. Eight
separate regression analyses were performed where a single selected maternal
feeding choice variable was entered as the dependent variable of the model, while the
same process variables were simultaneously entered as independent variables
(predictors). Consistent with the RE-AIM approach, the objective was to include, in
each model, at least one variable measuring each of the three components of the
process, as well as variables related to the context of the implementation. For
consistency with the analysis carried out in previous chapters, the same definitions of
the independent variables included in the analysis were used.
Selection of the independent variables measuring the reach process component was
based on the characteristics of recipients for which meaningful statistical differences
were observed between those who were reached at Module 1 and Module 2, and
those who were not (see section 5.3.1.3).
Percentage dose received was the sole measurement of the adoption process
component, which was retained in the models, since utility and usefulness
performance were potentially biased measurements, being derived from parent
feedback questionnaires (see section 5.3.2.). Given that Module-1 and Module-2
144 Maternal outcomes considered in the intervention impact analysis (see glossary and chapter 4)
include: pressure to eat, exposure to vegetables and fruits, exposure to non-core food, covert
control to restrict unhealthy food, maternal modelling, child sitting at meal time, TV switched off at
meal time. 145
A per protocol analysis (a specific case of subgroup analysis) would have meant exploring the
contribution of various levels of dose received on the effect of the NOURISH trial, hence including
control and intervention groups in these analyses. For instance, this could have compared outcome
of control and outcome of intervention participants who attended a minimum number of sessions.
As mentioned earlier (see footnote 22, p29 ) this is criticised, as it would have excluded participants
from analyses and might have included an unknown bias (Kirkwood & Sterne, 2003; Moher et al.,
2010).

196
covered different aspects of the NOURISH messages (see Appendix 9), the dose of
each module that was received was considered more relevant than an overall dose
received, so these variables were entered into the models, after having checked that
this approach would not generate a multi-collinearity issue146.
Fidelity performance147 of the Implementation process component was considered
but, given that this was very stable across information groups (see Table 26), was not
included in the models.
Finally, elements of the context of the intervention as approximated by the setting
(i.e. city) and the period of the intervention (i.e. cohort) were also included as
independent variables in the regression models.
In summary, for each selected maternal feeding choice described in Chapter 4, a
regression model on available cases was tested with the following independent
variables listed in Table 27.
146 Although a positive correlation between dose received at Module-1 and dose received at Module-
2 was found (r= 0.41, p<0.001), both doses received were entered as this was not a strong
correlation (r < 0.9) (Field, 2009). 147
Only fidelity was considered as other sub-components of implementation were already included
via reach and adoption.

197
Table 27: Description of independent variables entered in
the eight regression models
Independent
variables
Description Codinga
Reach1 Maternal education 0: No University education
1: University education
Reach2 Healthcare card holder 0: Yes; 1: No
Reach3 Marital status 0: not married 1: Married or in a de
facto relationship
Reach4 Maternal age Continuous (years)
Reach5 Smoking during pregnancy 0: Yes; 1: No
Reach6 Breastfeeding at baseline 0: No; 1: Yes
Reach7 Maternal concern with own weight 0–100%, increased = more concern
Adoption1 % Dose received at Module-1 Continuous (%)
Adoption2 % Dose received at Module-2 Continuous (%)
Context1 City 1: Brisbane; 2: Adelaide
Context2 Cohort 1: Cohort 1; 2: Cohort 2 a For logistic regression with SPSS, higher values are reference groups
For predictors related to the reach process component and variables describing the
context of implementation, no direction in the relationship between predictors and
the selected maternal outcome variables was assumed. Increases in the dose received
were expected to improve the selected maternal outcome variables.
Analyses were performed on SPSS 18.0 for Windows (SPSS Inc., Chicago, IL,
USA). The preliminary objective was to conduct linear multivariable regression as
most outcome variables were scores of several items and were treated as continuous
variables. For continuous dependent variables such as “pressure to eat”, “exposure to
vegetables”, “exposure to fruits”, “exposure to non-core foods”, “covert control use”
and “maternal modelling opportunities”, linear regression was used. For the two
dichotomised variables, “child sitting during meal” and “child watching TV during
meals” (see Table 3) logistic regression was used.
198
Statistical assumptions necessary to conducting a regression were checked via the
analysis of residuals148, the variance inflation factor (VIF)149 and outliers150
(Chatterjee & Hadi, 2006; Field, 2009).
For linear regression models, F ratios (and associated p values) expressed with their
degree of freedom were considered to determine the significance of models. For
significant models, the overall variance explained for each model was assessed using
R-squared (R2) and adjusted R-squared (R2Adj) coefficients151, as well as un-
standardised coefficients (B), standard errors (SE), standardised coefficients (β),
statistical t-tests and probability errors to interpret the unique contribution of each
predictor. To assess the significance of logistic regression models, χ2 (and associated
p values) expressed with their degree of freedom were reported. For significant
models, the log-likelihood statistics were performed and Nagelkerke (R2N) and Cox
and Snell (R2CS) coefficients were reported as well as un-standardised coefficients
(B), standard errors (SE), Wald statistics and probability errors, Odds Ratios (ORs)
and their 95CI, to interpret the unique contribution of each predictor. Potential power
issues were considered for all of the models.
As explained in section 4.2.3, a positive feeding choice could be indicated by either
an increased or a decreased score, given that the scales used to measure each
maternal outcome variables were all different. Thus, the contribution of independent
variables to a positive feeding choice could be indicated by either a positive or a
negative regression coefficient or an OR above or less than 1. Table 28 summarises
the directions of regression coefficients and ORs that correspond to positive feeding
choices.
148 Scatter plots of residuals were examined to check normality (applicable to linear regression only),
linearity and variance homogeneity (homoscedasticity) between dependent variables scores and
errors of prediction. 149 VIF is a collinearity diagnosis used to assess multicollinearity between predictors. A VIF greater
than 10 was judged to be a source of concern (Chatterjee & Hadi, 2006; Field, 2009). 150
Influential points were considered by examining Cook’s distance above 1. 151
R2
Adj describes the proportion of the variance that is explained by the model, adjusting for the
number of independent variables.

199
Table 28: Directions of associations between process predictors and maternal
feeding choices that indicate positive feeding choices
Pressure to eat (1: Disagreement to 5: Agreement)
(-)
% of tried vegetable from 21 listed vegetables (+)
% of tried fruits from 18 listed fruits (+)
% of tried non-core food from 24 listed non-core foods (-)
Covert control towards unhealthy foods (1: Never to 5: Always)
(+)
Maternal modelling opportunities (1: A lot of the time to 5: Hardly ever)
(-)
Child sits down when having a meal (0: not a lot of the time, 1: A lot of the time)
OR<1
Child watches TV when having a meal (0: Often/most of the time, 1: Sometimes/rarely)
OR>1
6.3 Results
Of the 352 mothers who were allocated to the information group, 130 (36%) did not
return T3 assessment questionnaires (non-completers, see section 4.3.2). Consistent
with this, completers had been more exposed to the intervention than non-
completers: median exposure levels (out of the full dose delivered) were 50% (IQR:
25–75) and 8% (IQR: 0–33) respectively (H1= 86.3, p< 0.001) (see section 5.2.4.3).
As data were missing with respect to both dependent (see Table 7) and independent
variables considered for the analyses, less than 222 cases were included in the
models (details of the number of cases that could be included in each model are
reported in the result tables).
6.3.1 Process factors influencing reported use of “pressure to eat”
The full model was significant (F11, 190= 3.127, p<0.001) but accounted for only 15%
(R2) of the variability in the pressure to eat score observed in the intervention group,
and would explain 10% (R2Adj) of this variability if the model was derived from the
population. As shown in Table 29, doses received at Module-1 and Module-2
influenced pressure to eat scores in the expected direction (i.e. higher dose was
associated with lower pressure scores, hence positive feeding choices). Cohort was
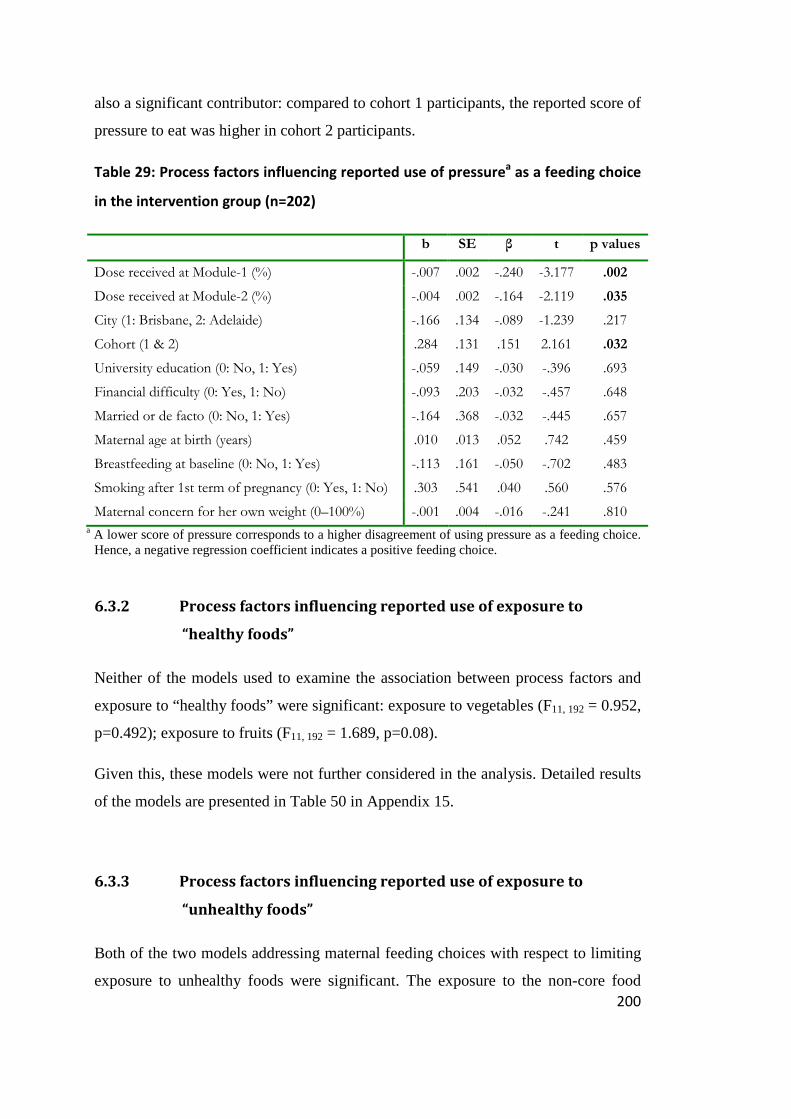
200
also a significant contributor: compared to cohort 1 participants, the reported score of
pressure to eat was higher in cohort 2 participants.
Table 29: Process factors influencing reported use of pressurea as a feeding choice
in the intervention group (n=202)
b SE β t p values
Dose received at Module-1 (%) -.007 .002 -.240 -3.177 .002
Dose received at Module-2 (%) -.004 .002 -.164 -2.119 .035
City (1: Brisbane, 2: Adelaide) -.166 .134 -.089 -1.239 .217
Cohort (1 & 2) .284 .131 .151 2.161 .032
University education (0: No, 1: Yes) -.059 .149 -.030 -.396 .693
Financial difficulty (0: Yes, 1: No) -.093 .203 -.032 -.457 .648
Married or de facto (0: No, 1: Yes) -.164 .368 -.032 -.445 .657
Maternal age at birth (years) .010 .013 .052 .742 .459
Breastfeeding at baseline (0: No, 1: Yes) -.113 .161 -.050 -.702 .483
Smoking after 1st term of pregnancy (0: Yes, 1: No) .303 .541 .040 .560 .576
Maternal concern for her own weight (0–100%) -.001 .004 -.016 -.241 .810 a A lower score of pressure corresponds to a higher disagreement of using pressure as a feeding choice.
Hence, a negative regression coefficient indicates a positive feeding choice.
6.3.2 Process factors influencing reported use of exposure to
“healthy foods”
Neither of the models used to examine the association between process factors and
exposure to “healthy foods” were significant: exposure to vegetables (F11, 192 = 0.952,
p=0.492); exposure to fruits (F11, 192 = 1.689, p=0.08).
Given this, these models were not further considered in the analysis. Detailed results
of the models are presented in Table 50 in Appendix 15.
6.3.3 Process factors influencing reported use of exposure to
“unhealthy foods”
Both of the two models addressing maternal feeding choices with respect to limiting
exposure to unhealthy foods were significant. The exposure to the non-core food

201
model (F11, 192 = 3.884 p< 0.001) accounted for 18% (R2) of the variability while the
‘covert control’ model (F11, 190 = 1.985, p<0.03) accounted for 10% (R2) of the
variability of each of these variables respectively in the NOURISH intervention
group. However, in the general population, these two models would explain
respectively 14% and 5% of the variance in these outcome variables (R2Adj).
As shown in Table 30, university education was a significant predictor in both
models while maternal age was a significant predictor of ‘non-core food exposure’
only and breastfeeding at baseline was a significant predictor of ‘covert control’’.
Compared to non-university educated mothers, university educated mothers reported
providing lower exposure to non-core foods and consistently also reported using
more covert control on unhealthy foods. Maternal age was inversely associated with
exposure to non-core food. Mothers who breastfed at baseline reported a higher score
of ‘covert control’ than those who did not.

202
Table 30: Process factors influencing exposure to a diversity of non-core foods and covert control of “unhealthy foods” in the intervention
group
Exposure to a diversity of non-core foodsa (n=204) Covert controlb of unhealthy foods (n=202)
b SE β t p values b SE β t p values
Dose received at Module-1 (%) .000 .000 .029 .390 .697 -.001 .002 -.041 -.526 .600
Dose received at Module-2 (%) .000 .000 -.102 -1.340 .182 .002 .002 .080 1.003 .317
City (1: Brisbane, 2: Adelaide) -.027 .024 -.081 -1.160 .248 -.089 .111 -.059 -.798 .426
Cohort (1 & 2) .013 .023 .039 .570 .570 -.074 .109 -.049 -.676 .500
University education (0: No, 1: Yes) -.059 .026 -.166 -2.245 .026 .244 .124 .153 1.971 .050
Financial difficulty (0: Yes, 1: No -.026 .035 -.051 -.751 .454 -.150 .167 -.064 -.900 .369
Married or de facto (0: No, 1: Yes) .025 .065 .028 .389 .698 -.388 .306 -.095 -1.271 .205
Maternal age at birth (years) -.010 .002 -.294 -4.295 .000 .008 .011 .051 .705 .481
Breastfeeding at baseline (0: No, 1: Yes) -.024 .028 -.059 -.855 .394 .284 .133 .156 2.140 .034
Smoking after 1st term of pregnancy (0: Yes, 1: No) -.048 .096 -.035 -.503 .615 .626 .450 .101 1.391 .166
Maternal concern for her own weight (0–100%) .001 .001 .093 1.397 .164 -.002 .003 -.044 -.631 .529
a Diversity is expressed by the percentages of non-core foods ever tried out of the total of non-core foods suggested on the food list. A lower percentage corresponds to a lower diversity of exposure to non-core foods, and thus a positive feeding choice.
b A higher score of ‘covert control’’ corresponds to a greater avoidance to buy unhealthy foods or to go to places where unhealthy foods are served and thus a positive feeding choice.

203
6.3.4 Process factors influencing reported “maternal modelling
opportunities”
The full model was significant (F11, 191 = 2.522, p<0.01) but accounted for only 13%
(R2) of the variance of the capacity of the mother to play a modelling role when
feeding her child, observed in the intervention group. In the population, it would
explain 9% (R2Adj).
As shown in Table 31, three factors were significant predictors of “maternal
modelling opportunities”: dose received at Module-2, and breastfeeding influenced
the outcome in the expected direction. Conversely, maternal age influenced
modelling in a direction opposite to that expected.
Table 31: Process factors influencing “maternal modelling opportunities”a in the
intervention group (n=203)
b SE β t p values
Dose received at Module-1 (%) -.001 .002 -.025 -.323 .747
Dose received at Module-2 (%) -.006 .002 -.219 -2.795 .006
City (1: Brisbane, 2: Adelaide) -.047 .150 -.023 -.316 .752
Cohort (1 & 2) -.109 .147 -.053 -.742 .459
University education (0: No, 1: Yes) .159 .168 .073 .945 .346
Financial difficulty (0: Yes, 1: No -.268 .223 -.085 -1.202 .231
Married or de facto (0: No, 1: Yes) .116 .412 .021 .281 .779
Maternal age at birth (years) .048 .015 .233 3.277 .001
Breastfeeding at baseline (0: No, 1: Yes) -.356 .178 -.144 -1.999 .047
Smoking after 1st term of pregnancy (0: Yes, 1: No) -.043 .606 -.005 -.070 .944
Maternal concern for her own weight (0–100%) -.002 .004 -.034 -.490 .625
a A lower score of maternal role modelling corresponds to organising child meal such as he/she can copy parents. It is a positive feeding choice.
6.3.5 Process factors influencing reported use of child sitting down
when having a meal (logistic regression)
The full model was not significant (χ211, = 16.54, p=0.119) and was therefore not
further considered. Detailed results are reported in Table 51, Appendix 15.

204
6.3.6 Process factors influencing child watching television at meal
time
The full model was significant (χ211, = 28.53, p<0.01) but accounted for only between
13% (R2CS)
152 and 20% (R2N)153 of the variance in children watching television
during meals. As shown in Table 32, compared to university educated mothers, those
who did not complete university had an increased probability of letting their child
watch TV at mealtime. Conversely, compared to those who did not hold a healthcare
card, mothers who had a healthcare card (i.e. financial difficulties) had a decreased
probability of letting their child watch TV at mealtime.
6.3.7 Results summary of exploratory analyses
Table 33 summarises the significant results obtained for the significant models, as
well as significant regression coefficients (standardised betas or ORs) and their level
of significance.
152 Cox and Snell coefficients for log-likelihood statistics
153 Nagelkerke coefficients for log-likelihood statistics

205
Table 32: Process factors influencing child watching TV at meal timea in the intervention group (n=204) (logistic regression)
B S.E. Wald test P values OR 95% C.I. for OR
Lower Higher
Dose received at Module-1 (%) .004 .006 .591 .442 1.004 .993 1.015
Dose received at Module-2 (%) .008 .006 2.033 .154 1.008 .997 1.020
City (Adelaide=ref) -.323 .389 .689 .407 .724 .338 1.552
Cohort (2=ref) .513 .378 1.839 .175 1.670 .796 3.506
University education (Yes=ref) -.967 .406 5.663 .017 .380 .172 .843
Financial difficulty (No=ref) 1.503 .766 3.843 .050 4.493 1.000 20.180
Married or de facto (Yes=ref) 20.306 14345.324 .000 .999 6.589E8 .000 .
Maternal age at birth (years) .066 .039 2.805 .094 1.068 .989 1.153
Breastfeeding at baseline (Yes=ref) -.740 .417 3.148 .076 .477 .210 1.081
Smoking after 1st term of pregnancy (No=ref) .604 1.501 .162 .687 1.830 .097 34.694
Maternal concern for her own weight (0–100%) .008 .010 .563 .453 1.008 .988 1.028 a The model considers the probability of watching TV rarely or sometimes.

206
Table 33: Summary of significant results of analytical modelling within the intervention group
Dependent variables Pressure to eat
Maternal
modelling
opportunities
‘non-core food
exposure’ ‘covert control’’ TV on at mealtime
Regression coefficients (-)1 β (p values) (-)1 β (p values) (-)1 β (p values) (+)1 β (p values) OR (>1) 1 (p values)
Dose received at Module-1 (%) -0.24 (.002)
Dose received at Module-2 (%) -0.16 (.04) -0.22 (.006)
Cohort (1 & 2) 0.15 (.03)
University education (0: No, 1: Yes) -0.17 (.03) 0.15 (.05) 0.38 (.02)a
Financial difficulties (0: Yes, 1: No) 4.5 (.05)b
Married (0: No, 1: Yes)
Maternal age (years) 0.23 (.001) -0.29 (.000)
Breastfeeding (0: No, 1: Yes) -0.14 (.05) 0.16 (.03)
Smoking in pregnancy (0: Yes, 1: No)
Maternal weight concern (0–100%)
1 Indication of a positive feeding choice. a OR with University education as a reference
b OR with No financial difficulty as a reference.

207
6.4 Discussion and conclusion
Results from these analyses are discussed successively below, with respect to the two
research questions of the chapter.
Research question 1: could the Implementation process of the NOURISH
research programme influence selected maternal outcomes?
First, results from the regression analyses provide insights into the contribution of the
process components on the selected maternal feeding choices in the intervention
group. Out of the eight regression models, three were not significant. This includes
vegetable exposure for which a significant effect of the NOURISH intervention had
been found (Chapter 4), as well as fruit exposure and child sitting during meals.
Doses of the intervention received at Module-1 or 2 were found to be significant
contributors in the expected direction, in two models only: the “pressure to eat” and
“maternal modelling opportunities” models. This is consistent with the results from
the effect evaluation with respect to these two outcome variables and implies that
greater doses received were likely to have strengthened the influence of the
intervention on these two maternal outcome variables. In turn, this may imply that
variation in doses received by participants, with some participants receiving lower
doses than was initially planned due to attrition (see Chapter 5), could also have had
an impact on the intervention versus control group differences observed in Chapter 4.
This may have led to an underestimation of the effect size observed with the
Intention-To-Treat analyses.
While both doses received at Module-1 and Module-2 were associated with the
pressure to eat outcome, only the dose received at Module-2 significantly contributed
to the variance in “maternal modelling opportunities”. This result is consistent with
the fact that the importance of maternal modelling was mainly addressed in Module-
2 (sessions 2 and 6) and only minimally covered in Module-1 (parts of session 5
only) (see Appendix 9). This suggests that designing a set of sequential sessions
involving some repetition of the key messages was efficacious in getting first-time
mothers to avoid using pressure when feeding their child, and to increase the

208
opportunities for maternal modelling. However, the effect could potentially have
been greater than was eventually observed, given that more than half the participants
did not attend Module-2, at which the latter key message was delivered (see section
5.3.1.4). Apart from finding solutions to increase attendance at Module-2, another
option to address this limitation could be try to deliver this key message earlier in the
intervention process. A difficulty here may be that the child is not yet old enough to
share meals with the rest of the family, although some tasting of shared food may
occur when the child is older than six months. However, the presence of the child at
the family table, even if she/he is not offered the same food, may provide
opportunities for role modelling, in that it allows the child to become familiarised
with the sight and smell of foods, which have also been recognised as potentially
important aspects of the physical presence of children at the same meals as the rest of
the family (Aldridge et al., 2009). It is important to note here that if modelling does
play a role at this early stage, this may not necessarily have a positive effect on the
child, as it will depend on what the mother is modelling, and this may vary according
to subgroups in the population. In particular, given the observation of a positive
correlation between maternal education and quality of maternal diet154 (Ball et al.,
2006; Lioret, McNaughton et al., 2012; McLeod et al., 2011), it could be expected
that increased modelling by mothers with lower educational levels, in the absence of
additional guidance as to adequate modelling styles, might lead to negative outcomes
with respect to familiarisation of the child with a diversity of foods. Therefore, early
delivery of an adapted version of the modelling message, if this explained to mothers
the process of food preference development and the importance of adequate eating
modelling, could create incentives for mothers to have the child present at
mealtimes155, with potential benefits with respect to familiarisation to a diversity of
foods.
154 In a cross-sectional study of the INFANT cohort mothers (first-time Australian mothers, see
Chapter 4 discussion), a positive association was found between maternal education and maternal
dietary quality score (McLeod et al., 2011). Similarly, Ball et al. (2006) found a positive association
between education of Australian women (n=1347, 18–65 years old, randomly selected) and fruit and
vegetable consumption. 155 For instance, the child can be present at some meal preparations or mealtimes either in the same
room or at the table in an adapted seat.

209
Apart from these two maternal outcome variables (“maternal modelling
opportunities” and “pressure when feeding”), the dose received did not contribute to
the remaining maternal feeding choices. In addition, although, the Intention-To-Treat
analysis showed that the intervention was efficacious at increasing the exposure to a
diversity of vegetables, the full model considered in this chapter was not significant.
Thus, it was not possible to further explore the extent to which the dose received
contributed to the vegetable exposure outcome when controlling for maternal factors.
The potential influence of dose received on the effectiveness of health interventions
has been increasingly considered as a key issue in a variety of settings, including but
not limited to interventions promoting physical activity among obese populations
(Gourlan, Trouilloud, & Sarrazin, 2011), school-based interventions relating to diet
and physical activity promotion (Legrand et al., 2012; Nader et al., 1996; Thomas,
2006), or the prevention of cancer-related health behaviours among working-class
participants in community health centres (Kaphingst et al., 2007). As stressed by
Legrand et al. (2012), it is necessary to consider the dose of intervention received by
recipients when interpreting the results of an intervention, which poses the question
of formal measurement approaches to the dose received, hence a priori definition of
the dose. In their analysis of the family component of the CATCH study, Nader et al.
(1996) considered this issue. Using a measure of dose of intervention received based
on a number of activity components completed by participants, and including this in
a multiple regression analysis, the authors conclude that dose effects occurred, albeit
at variable levels according to subgroups in the population. In their analysis of the
influence of intervention dose on cancer-related health behaviours (RCT design),
Kaphingst et al. (2007) used the number of six possible intervention components
administered to participants (intervention group, n=848) as a measure of dose
received, and found little intervention dose-response on dietary intakes and physical
activity variables in bivariate analyses. In addition, when adjusting for participant
characteristics (e.g. SES, gender), no significant intervention dose–response was
observed. Based on these results, the authors concluded that future studies were
needed to better understand the number, content, and length of interactions needed in
health promotion interventions to obtain behavioural changes. In a meta-analysis of
the global effect of interventions promoting physical activity among overweight

210
populations considering 46 studies, Gourlan et al. (2011) reported that shorter
interventions (less than six months) showed significantly larger effects than longer
ones. However, authors warned caution about these results as they might have been
biased by a time interval measurement. Measured effect of longer studies at the same
time as shorter studies might have shown similar effect. In contrast, Gourlan et al.
(2011) found that neither the number of sessions nor the frequency of sessions
moderated the intervention effects and stressed the need for further research into the
optimal dose for interventions. The results presented in this chapter highlight the fact
that the optimal dose may be a key question that also needs to be addressed in early
childhood obesity prevention interventions, although this is usually not reported in
existing studies (Thomas, 2006). For instance, none of the comparable studies to the
NOURISH trial reported comprehensively dose received by participants (Campbell
et al., 2013; Wen et al., 2011)
While dose was associated with maternal feeding choices in two models, various
maternal characteristics including educational level, age, breastfeeding and financial
difficulties, were also associated with selected maternal outcome variables in four
models. Most of these results are consistent with the results from the limited number
of studies that are available for the purpose of comparison.
University education of mothers had significant effects towards positive feeding
choices156 with respect to ‘non-core food exposure’, ‘covert control’’ and TV at
mealtime. Similar results have been obtained in other studies. For example, using
different measures of ‘non-core food exposure’ (e.g. timing of introduction, non-core
food or drink intakes), similar significant inverse association between child ‘non-core
food exposure’ and maternal education has been reported from cohort studies in the
UK (McGowan et al., 2012; Robinson et al., 2007; Schrempft, van Jaarsveld, Fisher,
& Wardle, 2013), Australia (Koh et al., 2010) and the US (Hendricks et al., 2006)157.
156 Positive feeding choices are feeding practices which do not override child innate self-regulation
capacity, and feeding approaches which promote the development of healthy food preferences. 157
From the Southampton Women’s survey (SWS, UK, n= 1981), Robinson et al. (2007) found
repeated inverse and significant associations between child diet patterns characterised by

211
Only one British cross-sectional study (n=518, 4–7 year old children) which
addressed the correlation between covert control and education was found in the
literature (Brown, Ogden, Vögele, & Gibson, 2008). The study showed a similar
positive and significant association between parental education and two measures of
the covert control score (betas for covert control over meals and over snacks: 0.135
(p<0.05) and 0.15 (p<0.01) respectively). In addition, the results of the positive
influence of education on preventing meals in front of TV are consistent with three
of the very few studies that have addressed the presence of TV at mealtime
(Baughcum et al., 2001; Coon et al., 2001; Dubois et al., 2008)158
The inverse relationship found between maternal age and ‘non-core food exposure’
also appears consistent with findings from studies which measured overall ‘non-core
food exposure’ (Hendricks et al., 2006; Robinson et al., 2007; Schrempft et al.,
2013), rather than exposure to specific non-core foods (Koh et al., 2010)159.
consumption of a diversity of non-core foods and maternal education (beta at 6 months -0.166 [-
0.208, -0.128], beta at 12 months -0.107 [-0.145, -0.069]). Consistently, they found positive
association between child diet characterised by meeting infant guidelines and maternal education
(beta at 6 months 0.130 [0.089, 0.172]; beta at 12 months 0.057 [0.015, 0.100]). Consistently with
these results, McGowan et al. (2012) found from a cross-sectional study of 434 2–5 year old British
children, an inverse significant association of non-core food and drink intakes (rSpearman= -0.35,
p<0.001) and maternal education. Child non-core food and drink were in turn significantly and
positively associated with maternal non-core snacks and drinks intakes in linear regression model
(unstandardised betas 0.25 (p=0.029) and 0.32 (p=0.000) respectively). In addition, from the British
Gemini Twin Birth cohort (n=1861, 15.8 month old infants), Schrempft et al. (2013) observed in a
multivariable regression analysis that lower education level was associated with earlier introduction
of non-core foods which was confounded by earlier introduction to solids. Similarly, in the Perth
Infant Feeding Study II (PIFSII, Australia, n=587 infants followed-up from birth to 52 weeks), Koh et
al. (2010) found that lower educated mothers had a greater probability than higher educated
mothers to introduce ice-cream (OR=2.73, p <0.05) by one year of child age. From the Feeding
Infants and Toddlers Study (FITS, US, n= 2515 infants followed-up from 4–24 months), Hendricks et
al. (2006) found that mothers who had a college education were less likely (OR=0.6, p<0.05) to offer
unhealthy foods as measured by child intakes of desserts or candy. 158
See note 89 159
See previous note for study details. SWS (Robinson et al., 2007): beta at 6 months -0.03 [-0.043, -
0.017], beta at 12 months -0.040 [-0.053, -0.027]). Gemini twin birth cohort (Schrempft et al., 2013):
AdjOR=0.94 p<0.001. PIFSS (Koh et al., 2010): no significant contribution of maternal age with any of
the seven specific measured non-core foods. FITS (Hendricks et al., 2006) OR not reported, p=0.052
for child consumption of candy and desserts.

212
Maternal age did not always contribute to feeding choices in the expected direction.
The older the mothers were, the less likely they were to expose their child to non-
core foods. This is consistent with observations made by Winkler at al. (2010) in a
cross-sectional study of 426 randomly selected households in Brisbane. This study
reported an increase in purchasing a wider variety of vegetables amongst older adults
with increased confidence in cooking. This suggests differential skills embedded in a
larger context. Conversely, the younger the NOURISH mothers were, the more likely
they were to create opportunities for role-modelling. This suggests that changing via
anticipatory guidance, established routines with respect to meal sharing in older
mothers might be more challenging than in younger mothers.
Breastfeeding at baseline also appeared as a significant contributor and in the
expected direction in the ‘covert control’ and the ‘maternal modelling opportunity’
models. Although no study specifically assessing the association between
breastfeeding and either ‘covert control’’ or maternal modelling opportunities was
identified to which to compare, these results appear to be partially consistent with
those of Leslie et al. (2012). Indeed, based on an Australian cross-sectional study
(n=529), Leslie et al. (2012) reported that, compared to non-breastfeeding mothers
and after adjustment for maternal education level attainment and BMI, breastfeeding
mothers consumed more serves of vegetables, had diets with greater varieties of
fruits and vegetables, but also more non-core sweet snacks (e.g. chocolate,
confectionary, jam). No difference was found with respect to other non-core foods
(i.e. savoury snacks). However, as authors could not adjust on maternal energy
intakes they could not determine whether these observed increased intakes reflected a
healthier diet of breastfeeding mothers (i.e. a greater value on nutrition) or an overall
increase in energy related to breastfeeding. Nevertheless, this suggests greater
availability of fruit and vegetable (i.e. exposure) at home amongst breastfeeding
mothers.
Finally, results from the analyses presented in this chapter also showed a significant
relation between the proxy variable (i.e. health care card) used to assess the financial
situation of participants and TV watching during meals. The probability of the child
watching TV when having a meal was nearly five times greater for mothers who did

213
not have financial difficulties when controlling for education and maternal age.
Although Cameron et al. (2012) did not measure TV viewing at mealtime; they also
observed positive association between income and TV viewing in 9–16 year old
children160from the Australian National Children’s Nutritional and Physical Activity
Survey. In contrast, Coon et al. (2001) have reported an inverse relationship between
American family income and presence of television at meal times in a bivariate
correlation matrix (r=-0.29, p<0.01). Similarly, Dubois et al. (2008) also reported
higher proportions of children watching TV when having a meal in lower income
Canadian families (χ2 = na, p<0.05). However, it is worthwhile noting that both Coon
et al. (2001) and Dubois et al. (2008) did not report on association when controlling
for other factors, and based their assessment of financial difficulties on income
ranges of participants rather than on participant entitlement to financial supports.
Both of these analytical differences might explain inconsistencies between results.
The «pressure to eat» model was the only significant model for which none of the
selected demographic maternal characteristics appeared to be a significant predictor.
This result appears consistent with a systematic review that reports on correlations
between maternal characteristics and feeding practices. Specifically, this review
shows that pressure to eat tends to be more often161 associated with maternal
psychological characteristics (e.g. maternal bulimia and body dissatisfaction) than
with maternal demographic characteristics (McPhie et al., 2014). In turn, this might
also explain why an increased pressure to eat score (i.e. a negative outcome) was
found for cohort 2 participants for which no psychologist co-facilitator participated
in the delivery of Module 2 sessions162. The dietitian facilitator may not have been
able to detect mothers with such psychological traits and consequently adjust the
160 Univariate regression coefficients for measuring the association between income and television
viewing were 2.9 [1-4.8] for boys and 4.4 [2.6-6.2] for girls. 161
Based on the PhD candidate’s own calculations from tables 2 and 3 of the (McPhie et al., 2012)
review: out of the 13 studies authors reviewed to examine maternal demographic characteristics and
feeding practice associations, six reported pressure to eat as a feeding practice, of which only one
(Ystrom, Barker, & Vollrath, 2012) found significant associations with maternal education and
maternal age. In contrast, out of the nine studies reviewed by the authors to examine maternal
psychological characteristics, seven examined pressure to eat, of which four reported an association
between pressure to eat and at least one maternal psychological characteristic. 162
Due to budget constraints, see section 3.3.3.

214
message related to pressure to eat. This limitation of the process may have impacted
on the effect size of the intervention on the pressure to eat intervention (Chapter 4).
Research question 2: how the Implementation process might have influenced
results of the effect evaluation?
Results of the models considered provide insights into whether intervention or
process components of the NOURISH research programme may have been found
efficacious at modifying only some of the selected maternal outcome variables
(Chapter 4). Several interpretations of these results can be proposed.
First, for some of the key messages delivered by NOURISH, the effectiveness of the
intervention appears to be reinforced by the format of the anticipatory guidance (i.e.
12 information group sessions and dietitian-psychologist facilitators). This is
particularly the case for Pressure to Eat, in which the dose received appeared to
influence the feeding choice independently of any maternal characteristics. This
points to the value of interventions aimed at providing guidance to mothers with
respect to this particular feeding choice. Given the psychological drivers associated
with this feeding choice (McPhie et al., 2014), it appears that provision of guidance
in this domain would best be carried out with the assistance of psychological experts.
The fact that only a limited dose was often received by participants, combined with
the observation that dose influences feeding choices in this case, indicates that the
effectiveness of the intervention on this outcome could have been even greater had
the full dose been received by participants. The intervention process may thus have
limited the effect of the intervention, particularly in those subgroups in the target
population who had greater chances of receiving a lower dose of the intervention, i.e.
younger, less educated mothers, that less often breastfeed.
Second, the fact that maternal characteristics appear to be correlated with the extent
to which certain feeding choices were observed in the intervention group indicates
the existence of process-related influences which may have affected the effectiveness
of the trial. For example, age was significant in the prediction of role modelling,
which may indicate relatively greater difficulty to change acquired habits in older
participants. Age was also significant in predicting ‘non-core food exposure’, which
may reflect a generational influence, younger mothers being less aware of this

215
problem or less capable of cooking healthier food such as vegetables. Another
example is the role of education and breastfeeding which seemed to act in the same
way as the expected influence of some of the NOURISH key messages. Thus,
characteristics of mothers who remained engaged in the trial might have confounded
the intervention effectiveness. For some outcome variables of interest (e.g. ‘covert
control’’, ‘non-core food exposure’) the effect of the intervention might not have
been observed because selected mothers were more likely to already use the positive
feeding choices that were reinforced by the NOURISH messages (e.g. older,
breastfeeding and educated mothers). For other outcome variables such as maternal
modelling opportunities, the effect of the intervention might have been increased
with younger, non-breastfeeding mothers. This interpretation of influence of
maternal characteristics on the effectiveness of the intervention is consistent with the
differential results with respect to the use of TV during meals observed in the
Healthy Beginning Trial (HBT) (Wen et al., 2012) that targeted young and less
educated mothers (see section 4.4).
Thus, the exploratory analyses identified the potential influence of various
participants’ characteristics on the differential maternal outcome variables observed
within the intervention group. Information gained via this analysis allows further
identifying potential complementarities between the intervention messages and
certain participant characteristics. For example, breastfeeding mothers appear to be
more inclined to covert control, hence the intervention acts in the same direction as
this mother characteristic, and may in some cases even be redundant, explaining
why, in most of the models relating to this outcome, the dose regression coefficient is
not significant. The information gained may also allow identification of possible
conflicts between participant characteristics and the “one size fits all approach” such
as a universal approach. It is increasingly acknowledged that a “one size fits all”
approach may not be relevant to certain subgroups (Hendricks et al., 2006;
Lakshman, Zhang et al., 2013; McGowan et al., 2012; Skafida, 2013; Thomas,
2006). For example, younger mothers with lower levels of education appear to have
had difficulties attending the group information sessions. Hendricks et al. (2006)
suggested from cross-sectional analysis of the FIT study cohort that mothers who

216
have lower education, who are single and who have financial difficulties should be
specifically targeted to improve infant and toddler feeding practices.
Although results of the exploratory analyses are overall in line with this suggestion,
in turn this subgroup of mothers should not be stigmatised with systematic poor
feeding choices. For instance, it is worth noting that mothers who did have financial
difficulties made better feeding choices with respect to the use of TV at mealtime
than those who did not have financial difficulties. In addition, although the
NOURISH sample involved relatively well educated mothers as compared to the
HBT sample, about one fourth of mothers continued to allow their child to watch TV
while having a meal, and the intervention did not succeed in changing this behaviour.
This suggests that to change the behaviour of these mothers, delivering a message
such as NOURISH is not sufficient and other specific strategies need to be
developed. This, in turn, suggests that a multiple intervention programme targeting
different groups would better address specific maternal needs. The potential
implications of these results in terms of future approaches to implementing of the
NOURISH programme will be discussed in chapter 7.

217
Chapter 7 Conclusion and recommendations
7.1 Introduction
This chapter summarises key results from this PhD research, and provides
recommendations on further research perspectives.
As shown in Chapter 2, while the use of RCT design is acknowledged to be the “gold
standard” method to evaluate intervention efficacy with high internal validity (Bond,
Wyatt, Lloyd, Welch, & Taylor, 2009; Curnan, LaCava, Langenburg, Lelle, &
Reece, 1998; Moore & Moore, 2011), it may not, alone, capture the complexity of an
issue such as childhood obesity (Butland & Britain, 2007; Davison & Birch, 2001;
Gill et al., 2010; Green & Glasgow, 2006; Kumanyika et al., 2002; Lobstein et al.,
2004; Moore & Moore, 2011; Story et al., 2008).
It is increasingly recognised that interpretation of an RCT intervention’s
effectiveness can thus be improved if a detailed understanding of the process of
implementing the prevention programme, providing information on the
circumstances of intervention implementation, i.e. who was involved
(generalisability) and how was the intervention delivered (applicability), is available,
a question of external validity (Audrey et al., 2006; Glanz et al., 2008; Glasgow et
al., 2003; Pettman et al., 2012; Rychetnik et al., 2002).
This PhD postulated that process evaluation would improve understanding of the
generalisability and applicability of the results of the effect evaluation of the
NOURISH research programme on selected maternal feeding choices. In order to
examine this proposition, the researcher developed a secondary evaluation
framework with a balanced focus on both internal and external validity of
programme results for selected maternal feeding outcomes, based on clearly distinct
effect and process theories (Chapter 3). This was used to specify and evaluate
research questions, separately addressing i) effect evaluation (Chapter 4), ii) process
evaluation (Chapter 5), and iii) the influence of the implementation process on the
observed maternal feeding outcomes (Chapter 6).

218
7.2 Results summary
From the effect evaluation …
The effect evaluation (Chapter 4) was concerned with assessing whether the
intervention influenced first-time mothers’ adoption of eight163 selected feeding
choices promoted by the NOURISH intervention.
Overall, the effect evaluation showed that the NOURISH intervention was applied to
352 first-time mothers who were 30 years old, most of whom were married or living
with a partner, and had a high level of education. Amongst the eight selected
maternal feeding choices, effects of the NOURISH intervention were observed
for three (see Table 7). Specifically, maternal outcome mean scores indicated that
mothers in the intervention group reported lower levels of pressure to eat (1.8 versus
2.3, p<0.001), but reported increased modelling opportunities (1.9 versus 2.2,
p<0.001) and exposure of their child to a greater diversity of vegetables (89 versus
86, p<0.01).
Key methodological elements suggest a high level of internal validity of these
results. First, the random group allocation was effective as indicated by group
comparability at baseline. Second, although attrition rate was higher in the
intervention condition than in the control, the group comparability was maintained at
effect measurement as no intervention versus control differences in child and
maternal characteristics in the non-completers were observed. Third, the
experimental condition of participants was concealed from the study staff that
measured maternal outcomes. Fourth, an Intention-To-Treat analysis was conducted
on available cases that were equally distributed across condition groups.
As is usually the case with RCTs (Gaglio et al., 2013; Klesges et al., 2008;
Wolfenden et al., 2010), the effect evaluation could not provide further
understanding of non-observed effects. In particular, for the five maternal feeding
choice variables for which no effects were observed (‘exposure to fruits’, ‘exposure
163 “pressure to eat”, “exposure to vegetables”, “exposure to fruits”, “exposure to non-core foods”,
“covert control use”, “maternal modelling opportunities”, “child sitting during meal” and “child
watching TV during meals”.
219
to non-core foods’, ‘covert control use’, ‘child sitting during meal’ and ‘child
watching TV during meals’), the effect evaluation could not assess whether such
non-observations were due to a lack of effectiveness or to a failure of the programme
implementation. This latter case could have included the absence of delivery of the
intervention as planned (type III error); the recruitment of an insufficient number of
participants to detect statistical differences (type II error); an over-representation of
mothers who already knew some of the NOURISH key messages (type II error);
and/or a lack of adoption of the intervention. The influence of these factors was
examined in the process evaluation.
… to the process evaluation …
The process evaluation (Chapter 5) was concerned with the description of the
implementation process of the NOURISH research programme and aimed to
assess the implementation, reach and adoption performance, taking into account
the temporal and regional context of programme implementation, as well as reported
barriers to performance. This evaluation was based on both objective measures of the
process (i.e. count of participants reached at each stage of the trial, count of sessions
attended per participant) and participant and facilitator feedback.
The process evaluation showed that on average 69% of process objectives,
which had been planned to test the effectiveness of the NOURISH intervention
on >18-year-old first-time mothers, were achieved. While process objectives
specifically dedicated to the intervention delivery (i.e. 12 group information sessions,
consistent and full coverage of intervention messages) were well achieved, those that
were dedicated to attract and engage (i.e. reach) the target participants such that they
received the full dose of the intervention (i.e. Dose received), were less well
achieved.
Analyses related to the Implementation of the intervention delivery showed that
the intervention was very well delivered (high dose delivered and fidelity scores)
for both group information modules, across cohorts, multi-sites and facilitators. This
pointed out the relative contribution of material developed to deliver the NOURISH
key messages (including facilitator material, session monitoring books, forms, etc.).
In turn, this suggested that non-observations of intervention effect were probably

220
unrelated to the quality of delivery, hence excluding a potential type III error. These
analyses also showed that having dietitian–psychologists pairs facilitate Module-2
group information sessions for cohort 2 participants was not sustainable (possibly
due to resource constraints), and that dietitians had to facilitate these sessions on
their own.
Reach analyses showed that study participants were not fully representative of
the target population in terms of their age, education, marital status, feeding
choices (i.e. breastfeeding, baby age when introducing solids), lifestyle factors (i.e.
smoking during pregnancy) and financial difficulties. Given that these maternal
characteristics had been associated with positive feeding choices that the intervention
aimed to address (Leslie et al., 2012; McLeod et al., 2011; Pampel et al., 2010; Scott
et al., 2009; Skafida, 2013), the non-representativeness of participants raised a
generalisability issue of the effect results.
Nevertheless, at this stage of the analyses, the process evaluation could not
suggest any specific direction of the influence of the selection bias (i.e. over or
underestimation) on NOURISH effect results. The fact that participants might
have been more receptive to the intervention might have yielded overestimated
effects. Conversely, higher levels of education in both groups might have implied
baseline participant behaviours more in line with the NOURISH message, and hence
less potential for large changes due to the NOURISH message on intervention
participants. This could have yielded type II errors with respect to ‘exposure to
fruits’, ‘exposure to non-core foods’, ‘covert control use’, ‘child sitting during meal’
and ‘child watching TV during meals’.
These descriptive analyses of the reach process, however, provided information
on reasons for limited maternal consent rates to participation. Results indicate
that recruitment was best achieved with staff fully dedicated to the programme.
However, limited contact over a relatively significant period of time (4 to 7 months)
between first contact with the study and enrolment finalisation, might have impeded
recruitment effectiveness. For two in three mothers across all education levels, it
appears that the programme was perceived to be un-adapted to maternal

221
commitments (e.g. work, childcare). One in five non-university educated mothers
stated a lack of interest.
Adoption analyses showed that attendance was partial (2% of participants
received the full dose of the intervention) and only 155 (44%) of participants
were exposed to some content of the second module. Given that some feeding
choices, such as maternal modelling opportunities and positive mealtime
environment, were mainly addressed at Module 2, the effect size of the intervention
might have been underestimated for the ‘maternal modelling opportunities’ outcome
or even non-observed for the ‘child sits and no TV at meal time’ outcomes. The
intervention delivery timing format (12 x 1.5-hour group information sessions) did
not appear to be fully adapted to the constraints (i.e. time and childcare) of first-time
mothers, who in turn might have balanced these constraints against perceived
benefits of attending. In turn, this might have contributed to the attrition observed in
the intervention group. Such interpretation was supported by the fact that one in four
mothers attending at least some of the sessions reported they most disliked the
repetitive nature of the information delivery, one in five mothers reported they most
disliked the unadapted contents to needs and the time required to attend (Figure 26).
More than 92% of the 222 and 121 participants who provided feedback on
Module-1 and Module-2 group information sessions, respectively, were satisfied,
and perceived the intervention as being useful to develop knowledge and change
behaviour with respect to child food needs and feeding. However, 46% found that
the information they were given assisted them little or not at all in changing the
types of food available at home. In turn, this might explain why no differences were
observed, with respect to fruit and ‘non-core food exposure’, between control and
intervention groups.
… and to a combined effect and process evaluation.
The analyses developed in Chapters 4 and 5 provide the information needed for a
summative evaluation of the NOURISH intervention effectiveness,
representativeness and applicability, and could have completed the research work.
This is generally the case in studies which have reported process evaluation along
with effect evaluation (Branscum et al., 2013; de Silva-Sanigorski et al., 2012; Fotu

222
et al., 2011; Griffin et al., 2010; Helitzer et al., 1999; Mathews et al., 2010; Salmon
et al., 2005; Sekhobo et al., 2011; Steckler et al., 2003). However, a limitation of
these parallel analyses is that they do not formally quantify the potential influence of
specific circumstances of implementation (i.e. cohort, city), nor the influence of the
various doses participants received, nor the influence of the selection bias (i.e.
generalisability) on the intervention effectiveness.
Chapter 6 aimed to assess whether the process influenced the selected maternal
feeding choices (including the way the intervention was delivered across cities and
cohorts, the way the intervention was received and who received the intervention).
Eight multi-regression analyses (Table 33, p206) that considered the variability of
the selected maternal outcome variables with respect to cohort, city, doses received
at modules, and seven maternal characteristics were conducted. Results indicated that
the implementation process of the research programme contributed to five of the
eight maternal feeding choices variables (pressure to eat, maternal modelling
opportunities, non-core food exposure, covert control, and TV at mealtime), to
various extents (R2 range: 13% to 18%). In the three remaining models (vegetable
exposure, fruit exposure, child sits during meal), these influences could not be further
examined as the models were not significant (Table 33).
Delivery of the intervention across cohorts contributed to explain the variability
of only one model: the ‘pressure to eat’ model. Specifically, better positive ‘pressure
to eat’ scores were observed for cohort 1 participants than for cohort 2 participants.
Given that the main process difference between cohorts at delivery was a difference
in the skill of the facilitators (i.e. dietitian–psychologist pairs at cohort 1, versus
dietitians only for Module-2 of cohort 2), this may suggest a role for psychologist
facilitators when delivering messages related to pressure to eat.
Dose of the intervention received also contributed to explain the variability of
two models in the expected direction: ‘pressure to eat’ and ‘modelling
opportunities’. Specifically, the more frequently participants attended Module-1 and
Module-2 information sessions (i.e. the higher the dose), the more the intervention
influenced the pressure to eat outcome variable. Similarly, the more frequently
participants attended Module-2 sessions, the more the intervention influenced the

223
modelling opportunities outcome variable. This suggested that, at least for these two
outcomes, repetition of the message was probably necessary to influence maternal
positive feeding choices.
Four maternal characteristics (i.e. educational level, age, breastfeeding and
financial difficulties) of those who received the intervention contributed to
explain the variability of four outcome variables, namely ‘maternal modelling
opportunities’, ‘non-core food exposure’, ‘covert control’ and ‘TV exposure at
mealtime’. Specifically, university education had an influence on ‘non-core food
exposure’, ‘covert control’ and ‘TV exposure at mealtime’, that was in the same
direction as the expected influence of the intervention itself. In contrast, older age
had an influence on the ‘maternal opportunities’ outcome in the opposite direction,
while it influenced the ‘non-core food exposure’ outcome in the same direction as
that expected from the intervention. Breastfeeding exerted a similar positive
influence on the ‘maternal opportunities’ and ‘covert control’ outcomes, as did
financial difficulties on the ‘TV exposure at mealtime’ outcome.
Overall, these multivariate analyses provided insights into specific ways the
implementation process of the NOURISH research programme influenced the
effect size of effect evaluation results:
� First, because of a low attendance to group information sessions (i.e. dose
received) and the absence of psychologist facilitators at some Module-2
sessions, it appears that the intervention effect size for the ‘pressure to eat’
outcome might have been underestimated;
� Second, the intervention effect size on the ‘maternal modelling opportunities’
outcome might have been underestimated because of poor session attendance
and lack of representativeness of younger and non-breastfeeding mothers;
� Third, consistent with the results of the effect evaluation, it does not appear
that the three remaining outcome variables (i.e. ‘non-core food exposure’,
‘covert control’ and ‘TV at mealtime’) were affected by the intervention as
none of the doses received contributed to explain their variability. In turn, this

224
suggests that the non-observation of effect in the effect evaluation was related
to intervention ineffectiveness rather than a type II error.
7.3 Implications for programme implementation
The overall evaluation carried out in this PhD research provided an improved
understanding of the NOURISH research programme effectiveness, applicability and
generalisability, which provides a basis for recommendations regarding further
implementations of the programme, and progress towards its future translation.
First, in regard to programme effectiveness:
� the NOURISH anticipatory guidance, delivered in several structured group
information sessions, was effective at modifying first-time mothers’
perception of ‘use of pressure to eat’ and teaching them prerequisites of
‘maternal modelling’. Effectiveness was even enhanced by an increased
number of group information sessions for both of these outcome variables
and by the presence of a psychologist (to assist in delivering session
information) for the ‘pressure to eat’ outcome;
� In contrast, such guidance was not sufficient to change maternal feeding
choices with respect to ‘non-core food exposure’, ‘covert control’, and ‘TV
exposure at mealtime’. In turn, this suggests further research is required on
how best to address these determinants of child eating.
Second, in regard to programme applicability:
� Approaching first-time mothers at maternity hospitals was a good strategy to
approach a representative sample of first-time mothers provided that a
diversity of hospitals was involved;
� Consistent with others’ suggestions (Aitken et al., 2003; Barratt et al., 2013),
recruitment was best achieved by staff fully dedicated to the programme;
� However, limited contact during the time elapsed between first approach and
full consent may be an issue that deserves better consideration. This may

225
involve either decreasing the length of this period or, as suggested by
Nicholson et al. (2011), maintaining contact with the approached participants
during this period;
� A single recruitment strategy did not similarly attract first-time mothers with
respect to their general socio-demographic characteristics. It appears that
those who were attracted by the NOURISH research programme were those
who had more time, had achieved a higher education level and had positive
predispositions with respect to child feeding, such as breastfeeding.
Consistent with other observations, this suggests that strategies that facilitate
participation need to be adapted to the various subgroups of the target
population (Nicholson et al., 2011; Thomas, 2006; Warner et al., 2013) and
made explicit at recruitment. This in turn suggests segmenting strategies
according to maternal socio-demographic profiles. For instance, on the same
topic as that of the NOURISH intervention, Campbell et al. (2013)
successfully attracted participants by proposing group information sessions
targeted to pre-existing groups of first-time mothers which were known to be
mainly tertiary educated. Alternatively, Wen et al. (2012) successfully
attracted young first-time mothers from disadvantaged areas of Sydney by
proposing home-based intervention delivery;
� Process evaluation results pointed to the fact that maternal time constraints
and childcare constraints needed to be considered, as these affect maternal
capacity to attend the programme: the intensity of group information sessions
over the intervention period may have been a barrier to attendance, being too
demanding for mothers with busy lifestyles. Such an interpretation is
consistent with the acknowledgement that parents are time poor and will not
benefit from obesity prevention if time constraints are not considered in the
intervention design (Banwell et al. (2008). Comparisons with two similar
trials (the unsuccessful HBT (Wen et al., 2012) and the successful INFANT
(Campbell et al., 2013)) suggested that the number of group information
sessions should probably be up to six and could be adapted to maternal
characteristics. For instance, in the NOURISH case, breastfeeding and highly

226
educated mothers who may already have been in tune with some of the
NOURISH key messages probably did not need to receive the same
intervention as others, in particular as a repetitive message;
� More generally and consistent with other observations (Hendricks et al.,
2006; Lakshman, Zhang et al., 2013; McGowan et al., 2012; Skafida, 2013;
Thomas, 2006), these results suggest that a “one size-fits all” approach may
not be relevant to accommodate constraints and the interest of all subgroups
of first-time mothers. In terms of evaluation, rather than an absolute fit with a
unique way of delivering key messages, intervention fidelity could be defined
as evidence of fit with the principles of the trust model (Eneli et al., 2008)
that underlies the intervention. To some extent this was the approach adopted
in the course of the NOURISH intervention by some facilitators who covered
content only once as they perceived unnecessary repetition;
� Tailoring an intervention to subgroups raises a number of practical
difficulties, particularly where an RCT design is sought. This is because
while an intervention could be tailored to a greater number of subgroups in
order to adapt more to each subgroup’s characteristics, this implies increasing
the number of participants in the sample in order to evaluate intervention
effectiveness with sufficient analytical statistical power. This might in turn
raise feasibility issues, thereby limiting the generalisability of the results from
the intervention.
Third, in regard to programme generalisability:
� Even if the effect of the NOURISH intervention on the pressure to eat
outcome might have been underestimated, this result appears generalisable as
it was dose- and potentially facilitator-related rather than participant-related;
� Conversely, generalisability of intervention effects with respect to maternal
modelling opportunities is unclear because, first, this maternal outcome was
related to both dose and participant characteristics (i.e. breastfeeding and
age), and, second, the relative contribution of each independent variable
could not be determined with the regression analyses within the intervention

227
group. For instance, the NOURISH anticipatory guidance with respect to the
implementation of the pre-requisite of maternal modelling (e.g. sharing the
same meals at the same time) could have been more effective with younger
mothers as compared to older mothers. This is because such guidance might
have been easier to follow for younger rather than older mothers, as it implies
that mothers accept changing meal sharing routines that were most likely
developed with their partner before their baby’s birth. This may be more
difficult for older mothers who might have developed meal routines with their
partner (e.g. eating separate meals via takeaway order, absence of meal
sharing or even a willingness to share a meal with their partner only) over a
longer period of time.
7.4 Strengths and limitations of this research
To our knowledge, this PhD constitutes the first application of a summative
evaluation approach to an early childhood obesity prevention programme focused on
maternal feeding choices and parenting skills. The evaluation addresses process and
effect evaluations and demonstrates their complementary importance in translating a
trial into real-world settings. In addition, it proposes an alternative analytical
approach to the use of process evaluation, which formally quantifies the potential
influence of the process on outcome variables, and constitutes an alternative to the
commonly encountered per protocol analysis. Per protocol analysis has been reported
to be a poor practice for RCTs, because it generates a risk of misinterpreting the
Intention-To-Treat analyses by excluding participants from the evaluation on a non-
randomised basis, hence introducing an unknown bias and overriding the benefits of
an RCT design (Kirkwood & Sterne, 2003; Moher et al., 2010; Petticrew et al., 2012;
Sun et al., 2011). The approach developed in this research reduces this risk.
There were a number of strengths to this research.
First, the use of an objective and robust analytical approach to the evaluation
contributed to the strength of the proposed approach. This involved:

228
� The external position of the evaluator with respect to the research
programme (i.e. the PhD candidate);
� The development of a summative evaluation framework underpinned by
recognised and complementary models of health programme
development, i.e. the PRECEDE-PROCEED (Green & Kreuter, 2005),
“Intervention mapping” (Bartholomew et al., 2010) and RE-AIM (Glasgow et
al., 2001) frameworks (Chapter 3);
� An objective definition of the process evaluation variables and criteria
based on the literature. The adoption process component that aimed to
assess participant compliance to the intervention was objectively measured by
participant attendance (i.e. dose received), as suggested by Linnan et al.
(2002), rather than participant satisfaction. The latter, although often reported
in publications (see section 5.4.1), is not an objective measure of adoption as
it usually represents perceptions of only those who participate and who might
be more receptive to the intervention, as was shown in the case of NOURISH
(see section 5.3.2.5). Similarly, evaluating reach was based on performance
achievements as compared to performance objectives, as well as compared
with the performance of two other similar trials (Campbell et al., 2013; Wen
et al., 2012), and on assessing target population representativeness. This, in
turn, allowed objective identification of the strengths and weaknesses of the
recruitment and engagement process of the NOURISH trial (chapter 5) and
relevant suggestions with respect to recruitment and retention processes that
few trialists have addressed (Brueton et al., 2011; Foster et al., 2011;
Treweek et al., 2011);
� A priori selection of independent variables that were included in
regression models for the exploratory analyses, based on these objective
criteria . Only variables that measured intervention reach, adoption,
implementation and context, were included. Moreover, selection of maternal
characteristics to measure reach was (i) literature based (see Appendix 12)
and (ii) based on observed significant differences between participants who
remained at a specific stage of the NOURISH research programme and those

229
who dropped out at the same stage (see Appendix 13). This precluded any
“data dredging” to influence the analysis;
� Use of reliable or valid measures of the predictor variables in the
regression models, in all but one case (i.e. maternal concern for own
weight). In particular, agreement analyses of the Fidelity measure found this
measure to be reliable in that responses to two measures used agreed (see
section 5.3.3.4). Maternal characteristics were objectively reported (e.g. age,
education level attainment, breastfeeding) as well as the dose that was
measured by facilitators at the time of the attendance (or non-attendance) of
participants, and then recoded in percentage of dose delivered on a
continuous scale;
� Exploratory analyses on a selection of feeding choices made by mothers
allocated to the intervention group only, since by definition of the study
design, these were the only participants who were eligible to receive the
content of the intervention. On one hand, this precluded post-hoc per
protocol analysis, which would have meant exploring the contribution of a
minimum dose received on the effect of the NOURISH trial, by comparing
the control group with intervention participants who received such a
minimum dose. On the other hand, exploratory analyses conducted on
intervention participants only, allowed the capture of potential relationships
between maternal outcomes of interest and variables measuring various
components of the implementation process, including participant
characteristics.
Second, process data was available to carry out the evaluation. The data
collection was conducted as planned with all the 293 group information sessions
being rated, attendance logs kept at each session and about 80% of those who
attended at least one session of each Module returned feedback. This allowed key
process components to be addressed (reach, adoption, intervention delivery
implementation). These are acknowledged to be relevant in translating the research,
however, they have been rarely addressed in childhood obesity prevention (Bonell et
al., 2006; Branscum et al., 2013; Green & Glasgow, 2006; Klesges et al., 2008;

230
Nutbeam, 1998; Patrick et al., 2008; Waters, Swinburn et al., 2011; Wolfenden et
al., 2010). In addition, this allowed an examination of both participant and facilitator
perceptions, and thus the ability to address applicability from end-user and
implementer perspectives.
A number of limitations to this research must also be acknowledged.
First, in some cases, the process evaluation did not provide information
regarding the potential reasons for the observed effectiveness of the trial. In
particular, while the effect evaluation showed a change in vegetable exposure, the
evaluation did not provide any additional information on the potential influence of
the process on this change (the regression model that explored this outcome variable
with respect to dose and maternal characteristics was not significant). Did vegetable
exposure increase with dose? Hence, would it help to cover this topic over several
sessions? Or was vegetable exposure related to dose and some maternal
characteristics as for the maternal modelling opportunity variable? Similarly, the
process evaluation was unable to provide any suggestions regarding the reasons for
non-effectiveness of the intervention with respect to child non-core food exposure,
child TV exposure at mealtime and use of covert control;
Second, proportions of variance that were explained by models were small164,
suggesting that other factors that contribute to the variability of selected
maternal feeding choices would need to be considered. For instance, as suggested
by participant feedback and consistent with Banwell et al. (2008), any type of time
constraints, such as work-related, childcare or transport constraints, could be key
factors to consider as additional independent maternal characteristics in the models.
As suggested by Barrat et al. (2012), a measure of the level of interest in or
motivation for the topic could also be included. Similarly, as shown by Hoddinot et
al. (2010), the level of interaction between the group and the facilitator could also be
a reinforcing factor, which in turn might influence the quality of the message
delivery and intervention impact. Detailed specification of a behavioural theory of
164 i.e. between 5% and 14% of the variability of maternal outcomes of interest if derived from the
population (R2Adj).

231
change in maternal feeding choices could assist in the identification of other relevant
independent variables that could be included in the exploratory regression models.
Third, with respect to applicability and generalisability, non-recorded barriers
to participation or attendance may have been missed by the process evaluation.
Notably:
� Most process data were collected from self-administered questionnaires,
which were completed by only a fraction of the target population at
recruitment (59%) and at intervention delivery (83%). Thus, the views of
those who did not complete any questionnaires were not considered. In
addition, most of questions were closed questions, which pre-determined the
scope of the potential responses from participants. For instance, suggested
responses to reasons for non-participation at Recruit-2 (see Appendix 3) or
non attendance (see Appendix 6) guided participant responses to either
factors associated with lack of time (i.e. work, childcare, transport), which
was also a suggested response, or to factors associated with a lack of interest
(i.e. no need, no longer interested). While time commitment has been shown
to constitute an important driver of participation in health promotion (Barratt
et al., 2013; Strazdins, Broom, Banwell, McDonald, & Skeat, 2011), Barrat et
al. (2013) also reported that non-participation could also be motivated by
concerns about risk of a negative experience or being allocated to the control
group, hence not receiving the intervention, or conversely being allocated to
the intervention group, hence a time commitment required;
� Reasons for lack of interest or no need could not be expanded upon by the
respondents, hence providing no further information on how to make the
intervention more attractive;
� The description of participants was limited to a few maternal characteristics
(e.g. age, educational level, breastfeeding). However, other maternal
characteristics such as occupation, income, time at work (Sobal & Stunkard,
1989; Strazdins, Broom et al., 2011) might also be useful to better define
maternal SEP profiles, and in assessing the adaptation of the programme to
these profiles.

232
Fourth, while the process evaluation pointed to the fact that strategies to reach
the target population needed revising, in order to increase the perceived benefits
of receiving the NOURISH information content, as well as the accessibility of
the programme to all first-time mothers, the practical approach to
implementing such broad suggestions would require further exploration. For
instance, what would the decision tree be based on (e.g. age or education level or
breastfeeding intention, etc…) in order to direct mothers to various modes of
intervention delivery such as home-based or group-information sessions? How would
it be possible to organise different intervention delivery modes? Similarly, the
process evaluation suggested reducing the number of group information sessions.
Nevertheless, it did not provide a definitive response as to how many sessions would
best work to deliver the intervention.
7.5 Recommendations
The summative evaluation carried out in this PhD can be considered a step in the
prevention programme cycle (see Figure 3) that NOURISH investigators have
proposed to address child obesity. This step provides information on the basis of
which a second cycle of the intervention programme could be developed, with an
improved understanding of the way in which the effectiveness of this intervention
could be increased, for the particular maternal outcome variables considered in this
research and to some extent for other outcome variables of the programme (Daniels,
Mallan et al., 2012; Daniels et al., 2013).
Specifically, the results of this PhD research point to the need to revisit the
formative stages (stages 1 and 2) of the NOURISH programme cycle (see Figure
3), with the aim to develop a realistic and sustainable programme that best matches
the needs and constraints of various end-users. This new research cycle:
� could be underpinned by the Intervention Mapping roadmap
(Bartholomew et al., 2010);
� would benefit from the use of qualitative, as well as quantitative
research methods, involving stakeholders such as potential users,

233
programme implementers and staff from healthcare services as well as
scholars (e.g. sociologists) familiar with qualitative research methods (e.g.
focus groups, qualitative interviews).
� would assist in refining an adapted and specific information content, as
well as delivery mode, including a decision tree that could be used when
approaching mothers at hospitals.
This new cycle of the research programme could follow the following three research
components.
i) Conduct a comprehensive needs assessment.
Consistent with the Intervention Mapping tool (Bartholomew et al., 2010),
addressing the needs assessment should be underpinned by the PRECEDE
component of the PRECEDE-PROCEED model (Green & Kreuter, 2005) which
suggests conducting four diagnostics: epidemiological, behavioural, environmental
and educational. As the three former diagnostics have already been conducted
during the first cycle of the NOURISH research programme (see section 3.3.1),
research efforts could be focused on the educational diagnostic.
Following Green and Kreuter (2005), such an educational assessment should:
� First, identify the relative interests, within the target population, in
being provided with anticipatory guidance with respect to the key
messages of the NOURISH intervention. In particular, it should
complement the previous needs assessment by addressing the needs of those
who were not involved at programme development, and were less well
represented in the NOURISH intervention, namely single, younger, less
educated, non-breastfeeding mothers with financial difficulties;
� Second, identify the predisposing, enabling and reinforcing factors that
will allow first-time mothers to make positive feeding choices. In turn,
addressing these factors should guide the development of intervention
components that lead to changes in mother behaviour;

234
� Third, based on this identification, select the most relevant theory of
behavioural change for the intervention. Selecting among the existing
theories of behavioural change will help define multiple constructs of
behavioural change that need to be addressed, and hence plan for the
intervention components that need to be developed, following for instance
Kok et al. (2004).
This research component may involve revising the overall goal of the NOURISH
research programme towards increasing positive maternal feeding choices, rather
than preventing childhood obesity. Such a narrower research scope would provide a
sufficient evidence-based rationale for including maternal feeding choices as one of
the multiple components that need to be considered in child obesity prevention.
ii) Identify successful administration modes for the intervention.
Alongside the needs assessment, the research should also aim to identify delivery
modes for the intervention that match the constraints and needs of recipients, as
well as of healthcare services that will implement the programme. In particular, this
research component should determine whether there is a need to segment the
implementation of the prevention programme. Such segmentation would aim to
adapt the intervention to mothers who are: (a) interested in, and attracted by the
content of the programme, but unable to attend; (b) interested but finding the format
of the delivery unattractive, or (c) uninterested by the content of the programme.
In particular, research should seek:
� to examine the influence of individual time constraints on the ability of
first-time mothers to receive the information content of anticipatory
guidance, depending on the delivery format. Research should seek to better
understand the nature of these constraints for different groups of mothers in
the target population, as well as how the intervention programme could be
adapted to address these. If, for instance, work is the major contributor to
lack of time, then focus should be on the development of strategies adapted
to working mothers, such as material that can be used when commuting to
work, or programmes that can be accessed on the work site. This

235
examination should be based on strong initial interactions with first-time
mothers, for example, via the administration of qualitative surveys and the
organisation of focus groups;
� to explore the possible use of new social networking technologies which
limit the logistical difficulties of coordination and information
exchange. For example, Lohse et al. (2013) have suggested that Facebook
is an effective strategy to recruit low income women to online nutrition
education. Knowlden et al. (2012) are experimenting with an online
preventative program for childhood obesity targeting parents; the use of
such internet alternatives for an intervention may save parents time, and
hence increase the retention of participant in trials;
� to identify the advantages and limitations of alternative delivery modes
with respect to the attractiveness of the material and activities
provided. The importance of adapting intervention material to the diversity
of respondents has been increasingly stressed (Bartholomew et al., 2010;
Durlak, 2010; Green & Kreuter, 2005; Issel, 2009; Nicholson et al., 2011;
Thomas, 2006; Warner et al., 2013). This should consider differences in
perceptions by mothers with different socio-economic and cultural
backgrounds;
� to consider the sustainability of the proposed programme
implementation as part of the design of the new research cycle,
including cost-effectiveness analyses of the alternative approaches
envisaged. Such considerations are increasingly considered in the
evaluation of intervention processes in public health (Godfrey, 2001;
Moodie & Carter, 2010; Waters, Hall et al., 2011). In particular, the long-
term viability of an intervention that needs to be delivered by specialist
(dietitian–psychologist) pairs, and the potential consequences of changing
the composition of these pairs if they cannot be maintained for economic or
other reasons, should be considered, as well as potential alternative delivery
approaches.

236
iii) Adapt the existing evaluation framework to account for changes in the
programme.
The programme theory or logic model, which maps resources or activities that need
to be developed to achieve each of the revised programme objectives should be
described and published (Anderson et al., 2011; Renger & Titcomb, 2002). By
specifying the model of behavioural change that underpins the intervention, such a
theoretical framework would help researchers identify the constructs that must be
considered to change behaviour. This should logically guide the practical
implementation of the intervention, and provide the programme description that
serves as an essential basis for comprehensive evaluation, as well as facilitate
potential programme reproduction.
7.6 Final conclusion
This research developed and applied a summative evaluation approach which, when
carried out alongside the Intention-To-Treat analysis, provides a number of insights
regarding the potential impacts of the implementation process on the observed effects
of an intervention such as NOURISH. The results point to the fact that some of the
key messages have succeeded in changing maternal feeding choices, and that the
intervention messages were in tune with the experience of the women who were
involved in the trial. However, the intervention eventually impacted a restricted
section of the initial target population.
The analysis presented clearly reinforces the observation increasingly encountered in
the public health literature that it is crucial that public health promotion programmes
report on their process, whatever the degree of complexity of these programmes.
This includes the need to publish the description of the programme theory, or logic
model, underlying the intervention. Doing so enables the identification of potential
limitations in the implementation, and of areas in which further research, that can
increase the effectiveness of interventions and their translation into routine health
services, is warranted.

237
The analysis identifies potential reasons for maternal participation issues, that should
be considered in any further NOURISH developments. Hence, further research
directions for a new cycle of NOURISH would need to focus on revising the needs
assessment, exploring alternative formats for intervention delivery, and developing a
detailed logic model of the revised programme that can drive its implementation,
serve as a basis for its comprehensive evaluation, and ultimately, help translate the
programme in the target population. Using participatory research methods in a mixed
qualitative and quantitative approach would likely assist in this new cycle of
NOURISH.

238

239
Bibliography
Addessi, E., Galloway, A. T., Visalberghi, E., & Birch, L. L. (2005). Specific social influences on the acceptance of novel foods in 2–5-year-old children. Appetite, 45(3), 264–271.
Adema, W., & Thévenon, O. (2008). Les politiques de conciliation du travail et de la vie familiale en France au regard des pays de l’OCDE. Recherches et Prévisions, 93, 51–72.
Ainsworth, M. S. (1979). Infant–mother attachment. American Psychologist, 34(10), 932-937.
Aitken, L., Gallagher, R., & Madronio, C. (2003). Principles of recruitment and retention in clinical trials. International Journal of Nursing Practice, 9(6), 338–346.
Aldridge, V., Dovey, T. M., & Halford, J. C. G. (2009). The role of familiarity in dietary development. Developmental Review, 29(1), 32–44.
American Academy of Pediatrics. (2003). Prevention of Pediatric Overweight and Obesity. Pediatrics, 112(2), 424–430.
Anderson, L. M., Petticrew, M., Rehfuess, E., Armstrong, R., Ueffing, E., Baker, P., ... Tugwell, P. (2011). Using logic models to capture complexity in systematic reviews. Research Synthesis Methods, 2(1), 33–42.
Andrews, G., & Slade, T. (2001). Interpreting scores on the Kessler Psychological Distress Scale (K10). Aust NZ J Public Health, 25, 494–497.
Anzman, S. L., Rollins, B. Y., & Birch, L. L. (2010). Parental influence on children’s early eating environments and obesity risk: implications for prevention. Int J Obes, 34(7), 1116–1124.
Askie, L., Baur, L., Campbell, K., Daniels, L., Hesketh, K., Magarey, A., . . . Taylor, B. (2010). Study protocol: The Early Prevention of Obesity in CHildren (EPOCH) Collaboration—an Individual Patient Data Prospective Meta-Analysis. BMC Public Health, 10(1), 728.
Attia, A. (2005). Evidence-Based Medicine Corner – Bias in RCTs: confounders, selection bias and allocation concealment. Middle East Fertility Society Journal, 10(3), 258–261.
Audrey, S., Holliday, J., Parry-Langdon, N., & Campbell, R. (2006). Meeting the challenges of implementing process evaluation within randomized controlled trials: the example of ASSIST (A Stop Smoking in Schools Trial). Health Education Research, 21(3), 366–377.
Avenell, A., & Goode, A. (2008). Assessing the Evidence Base for Interventions to Prevent the Further Increase in Obesity. Australian Economic Review, 41(1), 97–104.

240
Baidal, J., & Taveras, E. M. (2012). Childhood obesity: Shifting the focus to early prevention. Archives of Pediatrics & Adolescent Medicine, 1–3.
Bakermans-Kranenburg, M., van IJzendoorn, M., & Juffer, M. (2003). Less is more: Meta-analysis of sensitivity and attachment interventions in early childhood. [Meta analysis]. Psychological Bulletin, 129(2), 195–215.
Ball, K., Crawford, D., & Mishra, G. (2006). Socio-economic inequalities in women’s fruit and vegetable intakes: a multilevel study of individual, social and environmental mediators. Public Health Nutrition, 9(05), 623–630.
Banwell, C., Broom, D., Davies, M. A., Dixon, J., Hattersley, M. L., Hinde, M. S., & Strazdins, L. (2008). Inquiry into obesity in Australia Standing Committee on Health and Ageing (pp. 1-14): National Centre for Epidemiology and Population Health, the Australian National University.
Barratt, R., Levickis, P., Naughton, G., Gerner, B., & Gibbons, K. (2013). Why families choose not to participate in research: Feedback from non-responders. Journal of Paediatrics and Child Health, 49(1), 57-62.
Bartholomew, L. K., Cushman, W. C., Cutler, J. A., Davis, B. R., Dawson, G., Einhorn, P. T., . . . Roccella, E. J. (2009). Getting clinical trial results into practice: design, implementation, and process evaluation of the ALLHAT Dissemination Project. Clinical Trials, 6(4), 329–343.
Bartholomew, L. K., Parcel, G. S., Kok, G., & Gottlieb, N. H. (2010). Planning health promotion programs: An intervention mapping approach (3 ed.): Jossey-Bass.
Baughcum, A., Powers, S., Bennett-Johnson, S., Chamberlin, L., Deeks, C., Jain, A., & Whitaker, R. (2001). Maternal feeding practices and belief and their relationship to overweight in early childhood. Journal of Developmental and Behavioral Pediatrics, 22, 391–408.
Bell, A. C., Simmons, A., Sanigorski, A. M., Kremer, P. J., & Swinburn, B. A. (2008). Preventing childhood obesity: the sentinel site for obesity prevention in Victoria, Australia. Health Promotion International, 23(4), 328–336.
Bell, L. M., Curran, J. A., Byrne, S., Roby, H., Suriano, K., Jones, T. W., & Davis, E. A. (2011). High incidence of obesity co-morbidities in young children: A cross-sectional study. Journal of Paediatrics and Child Health, 47(12), 911–917.
Benton, D. (2004). Role of parents in the determination of the food preferences of children and the development of obesity. International Journal of Obesity, 28(7), 858–869.
Birch, L. (1979). Experiential Determinants of Children. In L. Katz (Ed.), Current Topics in Early Childhood Education. Norwood, NJ, US: Ablex Publishing Corp.
Birch, L. (1980). Effects of peer models’ food choices and eating behaviors on preschoolers’ food preferences. Child Development, 51(2), 489-496.
Birch, L. (1998). Development of food acceptance patterns in the first years of life. Proceedings of the Nutrition Society, 57, 617–624.

241
Birch, L. (1999). Development of food preferences. Annual Review of Nutrition, 19, 41–62.
Birch, L., Fisher, J., Grimm-Thomas, K., Markey, C., Sawyer, R., & Johnson, S. (2001). Confirmatory factor analysis of the Child Feeding Questionnaire: a measure of parental attitudes, beliefs and practices about child feeding and obesity proneness. Appetite, 36(3), 201–210.
Birch, L., Johnson, S., Anderson, G., Peters, J., & Schulte, M. (1991). The variability of young children’s energy intake. N Engl J Med, 324, 232–235.
Birch, L. L., & Davison, K. K. (2001). Family environmental factors influencing the developing behavioral controls of food intake and childhood overweight. Pediatric Clinics of North America, 48(4), 893.
Birch, L. L., & Fisher, J. A. (1996). The role of experience in the development of children’s eating behavior. In E. D. Capaldi (Ed.), Why we eat what we eat: The psychology of eating. (pp. 113-141). Washington, DC, US: American Psychological Association.
Birch, L. L., & Fisher, J. O. (1998). Development of eating behaviors among children and adolescents. Pediatrics, 101, 539.
Birch, L. L., Zimmerman, S. I., & Hind, H. (1980). The influence of social -affective context on the formation of childrens food preferences. Child Development, 51(3), 856–861.
Bleich, S. N., Segal, J., Wu, Y., Wilson, R., & Wang, Y. (2013). Systematic Review of Community-Based Childhood Obesity Prevention Studies. Pediatrics. 132(1), e201-e210
Blissett, J., & Haycraft, E. (2011). Parental eating disorder symptoms and observations of mealtime interactions with children. Journal of Psychosomatic Research, 70(4), 368–371.
Boles, R. E., Nelson, T. D., Chamberlin, L. A., Valenzuela, J. M., Sherman, S. N., Johnson, S. L., & Powers, S. W. (2010). Confirmatory factor analysis of the Child Feeding Questionnaire among low-income African American families of preschool children. Appetite, 54(2), 402.
Bonell, C., Oakley, A., Hargreaves, J., Strange, V., & Rees, R. (2006). Assessment of generalisability in trials of health interventions: suggested framework and systematic review. BMJ, 333(7563), 346–349.
Borys, J. M., Le Bodo, Y., Jebb, S. A., Seidell, J. C., Summerbell, C., Richard, D., . . . the E. E. N. Study Group. (2012). EPODE approach for childhood obesity prevention: methods, progress and international development. Obesity Reviews, 13(4), 299-315.
Branscum, P., Sharma, M., Wang, L. L., Wilson, B., & Rojas-Guyler, L. (2013). A Process Evaluation of a Social Cognitive Theory–Based Childhood Obesity Prevention Intervention: The Comics for Health Program. Health Promotion Practice, 14(2), 189–198.
Bronfenbrenner, U. (1986). Ecology of the family as a context for human development: Research perspectives. Developmental Psychology, 22(6), 723.

242
Bronfenbrenner, U. (1994). Ecological models of human development. In M. C. Gauvain, M. (Ed.), Readings on the Development of Children (2nd ed., pp. 37–43). NY: Freeman.
Brown, K. A., Ogden, J., Vögele, C., & Gibson, E. L. (2008). The role of parental control practices in explaining children’s diet and BMI. Appetite, 50(2–3), 252–259.
Brueton, V., Stevenson, F., Vale, C., & Rait, G. (2011). Complexities of retention in primary care randomised trials: A thematic analysis of in-depth interviews. Trials, 12(Suppl 1), A132.
Burns, C., Sacks, G., & Gold, L. (2008). Longitudinal study of Consumer Price Index (CPI) trends in core and non-core foods in Australia. Australian and New Zealand Journal of Public Health, 32(5), 450–453.
Butland, B., Jebb, S., Kopelman, P., McPherson, K., Thomas, S., Mardell, J., & Parry, V. (2007). Foresight. Tackling obesities: future choices. Project report (2nd ed.). London: Government Office for Science.
Byrne, L. K., Cook, K. E., Skouteris, H., & Do, M. (2011). Parental status and childhood obesity in Australia. International Journal of Pediatric Obesity, 6(5–6), 415–418.
Caballero, B., Davis, S., Davis, C. E., Ethelbah, B., Evans, M., Lohman, T., . . . White, J. (1998). Pathways: a school-based program for the primary prevention of obesity in American Indian children. The Journal of Nutritional Biochemistry, 9(9), 535–543.
Cameron, A. J., Ball, K., Pearson, N., Lioret, S., Crawford, D. A., Campbell, K., . . . McNaughton, S. A. (2012). Socioeconomic variation in diet and activity-related behaviours of Australian children and adolescents aged 2–16 years. Pediatric Obesity. 7(4), 329-342.
Campbell, K., Hesketh, K., Crawford, D., Salmon, J., Ball, K., & McCallum, Z. (2008). The Infant Feeding Activity and Nutrition Trial (INFANT) an early intervention to prevent childhood obesity: Cluster-randomised controlled trial. BMC Public Health, 8(1), 103.
Campbell, K. J., Lioret, S., McNaughton, S. A., Crawford, D. A., Salmon, J., Ball, K., . . . Hesketh, K. D. (2013). A Parent-Focused Intervention to Reduce Infant Obesity Risk Behaviors: A Randomized Trial. Pediatrics, 131(4), 652–660.
Campbell, M., Piaggio, G., Elbourne, D., & Altman, D. G. (2012). Consort 2010 statement: extension to cluster randomised trials. BMJ, 345. e5661
Champion, V. L., & Skinner, C. S. (2008). The Health Belief Model. In K. Glanz, B. K. Rimer & K. Viswanath (Eds.), Health behavior and health education: Theory, research, and practice (pp. 45–65): Jossey-Bass. (Reprinted from: 4th).
Chan A, Scheil W, Scott J, Nguyen A-M, & Sage L. (2011). Pregnancy Outcome in South Australia 2009. Adelaide: Pregnancy Outcome Unit, SA Health, Government of South Australia.
Chan, L. (2005). BSc Honours Thesis – Positive feeding practices in very early childhood. Parental needs assessment. Flinders University of South Australia.

243
Chan, L., Magarey, A., & Daniels, L. (2010). Maternal Feeding Practices and Feeding Behaviors of Australian Children Aged 12–36 Months. Maternal and Child Health Journal, 1–9.
Chatterjee, S., & Hadi, A. S. (2006). Regression analysis by example (4th ed): Wiley-Interscience.
Christian, M. S., Evans, C. E. L., Hancock, N., Nykjaer, C., & Cade, J. E. (2013). Family meals can help children reach their 5 A Day: a cross-sectional survey of children’s dietary intake from London primary schools. Journal of Epidemiology and Community Health, 67(4), 332–338.
Ciampa, P., Kumar, D., Barkin, S., Sanders, L., Yin, H., Perrin, E., & Rothman, R. (2010). Interventions aimed at decreasing obesity in children younger than 2 years: a systematic review. Archives of Pediatrics and Adolescent Medicine, 164(12), 1098.
Cochrane, A. L., Rougemont, A., Gubéran, É., & Massé, L. (1977). L’Inflation médicale: réflexions sur l’efficacité de la médecine. Paris : Editions galilée.
Connelly, J. B. (2007). Evaluating complex public health interventions: theory, methods and scope of realist enquiry. Journal of Evaluation in Clinical Practice, 13(6), 935–941.
Connelly, J. B., Duaso, M. J., & Butler, G. (2007). A systematic review of controlled trials of interventions to prevent childhood obesity and overweight: A realistic synthesis of the evidence. Public Health, 121(7), 510–517.
Contandriopoulos, A. P., Champagne, F., Denis, J. L., & Avargues, M. C. (2000). L’évaluation dans le domaine de la santé: concepts et méthodes. Revue épidémiologie et santé publique, 48, 517–539.
Cooke, L. (2007). The importance of exposure for healthy eating in childhood: a review. Journal of Human Nutrition & Dietetics, 20(4), 294–301.
Coon, K. A., Goldberg, J., Rogers, B. L., & Tucker, K. L. (2001). Relationships between use of television during meals and children’s food consumption patterns. Pediatrics, 107(1), e7.
Cowart, B. J. (1981). Development of taste perception in humans: Sensitivity and preference throughout the life span. Psychological Bulletin, 90(1), 43–73.
Craig, P., Dieppe, P., Macintyre, S., Michie, S., Nazareth, I., & Petticrew, M. (2008). Developing and evaluating complex interventions: the new Medical Research Council guidance. BMJ, 337, a1655.
Curnan, S., LaCava, L., Langenburg, D., Lelle, M., & Reece, M. (1998). WK Kellogg foundation evaluation handbook. Online [URL]: http://www. wkkf. org/pubs/Tools/Evaluation/Pub770. pdf.
Daniels, L., Magarey, A., Battistutta, D., Nicholson, J., Farrell, A., Davidson, G., & Cleghorn, G. (2009). The NOURISH randomised control trial: Positive feeding practices and food preferences in early childhood – a primary prevention program for childhood obesity. BMC Public Health, 9(1), 387.

244
Daniels, L., Mallan, K., Battistutta, D., Nicholson, J., Perry, R., & Magarey, A. (2012). Evaluation of an intervention to promote protective infant feeding practices to prevent childhood obesity: outcomes of the NOURISH RCT at 14 months of age and 6 months post the first of two intervention modules. International Journal of Obesity, 36(10), 1292–1298.
Daniels, L. A., Mallan, K. M., Nicholson, J. M., Battistutta, D., & Magarey, A. (2013). Outcomes of an Early Feeding Practices Intervention to Prevent Childhood Obesity. Pediatrics. doi:10.1542/peds.2012-2882
Daniels, L. A., Wilson, J. L., Mallan, K. M., Mihrshahi, S., Perry, R., Nicholson, J. M., & Magarey, A. (2012). Recruiting and engaging new mothers in nutrition research studies: lessons from the Australian NOURISH randomised controlled trial. International Journal of Behavioral Nutrition and Physical Activity, 9(1), 129.
Dattilo, A. M., Birch, L., Krebs, N. F., Lake, A., Taveras, E. M., & Saavedra, J. M. (2012). Need for Early Interventions in the Prevention of Pediatric Overweight: A Review and Upcoming Directions. Journal of Obesity, 2012. 2012, 18. doi: 10.1155/2012/123023.
Davis, C. M. (1928). Self selection of diet by newly weaned infants: an experimental study. Archives of Pediatrics and Adolescent Medicine, 36(4), 651.
Davis, C. M. (1939). Results of the self-selection of diets by young children. Canadian Medical Association Journal, 41(3), 257.
Davison, K., & Birch, L. (2001). Childhood overweight: a contextual model and recommendations for future research. Obesity Reviews, 2, 159–171.
de Silva-Sanigorski, A., & Economos, C. (2010). Evidence of multi-setting approaches for obesity prevention: translation to best practice for future interventions. In E. Waters, B. Swiburn, J. Seidell & R. Uauy (Eds.), Preventing childhood obesity: evidence, policy and practice (pp. 306). Chichester, UK: Wiley-Blackwell.
de Silva-Sanigorski, A. M., Bell, A. C., Kremer, P., Park, J., Demajo, L., Smith, M., . . . Boak, R. (2012). Process and Impact Evaluation of the Romp & Chomp Obesity Prevention Intervention in Early Childhood Settings: Lessons Learned from Implementation in Preschools and Long Day Care Settings. Childhood Obesity (Formerly Obesity and Weight Management), 8(3), 205–215.
Denney Wilson, E., Campbell, K., Hesketh, K., & de Silva Sanigorski, A. (2011). Funding for child obesity prevention in Australia. Australian and New Zealand Journal of Public Health, 35(1), 85–86.
Dennison, B. A., Russo, T. J., Burdick, P. A., & Jenkins, P. L. (2004). An intervention to reduce television viewing by preschool children. Archives of Pediatrics & Adolescent Medicine, 158(2), 170.
Department of Health and Ageing. (1998). Australian Guide to Healthy Eating (pp.1-27). http://www.health.gov.au/internet/main/publishing.nsf/Content/health-pubhlth-publicat-document-fdcons-cnt.htm

245
Department of Health and Ageing. (2008). 2007 Australian National Children’s Nutrition and Physical Activity Survey. http://www.health.gov.au/internet/main/publishing.nsf/Content/phd-nutrition-childrens-survey
Des Jarlais, D. C., Lyles, C. & Crepaz, N. (2004). Improving the reporting quality of non randomized evaluations of behavioral and public health interventions: The TREND statement. American Journal of Public Health, 94(3), 361–366.
DiSantis, K., Collins, B., Fisher, J., & Davey, A. (2011). Do infants fed directly from the breast have improved appetite regulation and slower growth during early childhood compared with infants fed from a bottle? International Journal of Behavioral Nutrition and Physical Activity, 8(1), 89.
DiSantis, K., Hodges, E., Johnson, S., & Fisher, J. (2011). The role of responsive feeding in overweight during infancy and toddlerhood: a systematic review. International Journal of Obesity. (35), 480-492.
Doak, C. M., Visscher, T. L. S., Renders, C. M., & Seidell, J. C. (2006). The prevention of overweight and obesity in children and adolescents: a review of interventions and programmes. Obesity Reviews, 7(1), 111–136.
Drewnowski, A., & Darmon, N. (2005). Food Choices and Diet Costs: an Economic Analysis. The Journal of Nutrition, 135(4), 900–904.
Drewnowski, A., & Specter, S. (2004). Poverty and obesity: the role of energy density and energy costs. The American Journal of Clinical Nutrition, 79(1), 6–16.
Dubois, L., Farmer, A., Girard, M., & Peterson, K. (2008). Social factors and television use during meals and snacks is associated with higher BMI among pre-school children. Public Health Nutrition, 11(12), 1267–1279.
Duncker, K. (1938). Experimental modification of children’s food preferences through social suggestion. The Journal of Abnormal and Social Psychology, 33(4), 489–507.
Durlak, J., & DuPre, E. (2008). Implementation Matters: A Review of Research on the Influence of Implementation on Program Outcomes and the Factors Affecting Implementation. American Journal of Community Psychology, 41(3–4), 327–350.
Durlak, J. A. (1998). Why Program Implementation is Important. Journal of Prevention & Intervention in the Community, 17(2), 5–18.
Durlak, J. A. (2010). The importance of doing well in whatever you do: A commentary on the special section, “Implementation research in early childhood education”. Early Childhood Research Quarterly, 25(3), 348–357.
Economos, C., Hyatt, R., Goldberg, J., Must, A., Naumova, E., Collins, J., & Nelson, M. (2007). A community intervention reduces BMI z-score in children: Shape Up Somerville first year results. Obesity (Silver Spring, Md), 15(5), 1325–1336.
Eneli, I. U., Crum, P. A., & Tylka, T. L. (2008). The Trust Model: A Different Feeding Paradigm for Managing Childhood Obesity. Obesity, 16(10), 2197–2204.

246
Esposito, L., Fisher, J., Mennella, J., Hoelscher, D., & Huang, T. (2009). Developmental perspectives on nutrition and obesity from gestation to adolescence. Preventing Chronic Disease, 6(3), A94.
Evans, W. D., Christoffel, K. K., Necheles, J. W., & Becker, A. B. (2010). Social Marketing as a Childhood Obesity Prevention Strategy. Obesity, 18(S1), S23–S26.
Faith, M. S., Scanlon, K. S., Birch, L. L., Francis, L. A., & Sherry, B. (2004). Parent-child feeding strategies and their relationships to child eating and weight status. Obesity Research, 12, 1711.
Farrow, C. V., & Blissett, J. (2008). Controlling feeding practices: cause or consequence of early child weight? Pediatrics, 121(1), e164.
Field, A. P. (2009). Discovering statistics using SPSS. SAGE publications Ltd.
Fitzgibbon, M. L., Stolley, M. R., Schiffer, L., Van Horn, L., KauferChristoffel, K., & Dyer, A. (2005). Two-year follow-up results for Hip-Hop to Health Jr: A randomized controlled trial for overweight prevention in preschool minority children. The Journal of Pediatrics, 146(5), 618–625.
Foster, C., Brennan, G., Matthews, A., McAdam, C., Fitzsimons, C., & Mutrie, N. (2011). Recruiting participants to walking intervention studies: a systematic review. International Journal of Behavioral Nutrition and Physical Activity, 8(1), 137.
Fotu, K. F., Moodie, M., Mavoa, H., Pomana, S., Schultz, J., & Swinburn, B. A. (2011). Process evaluation of a community-based adolescent obesity prevention project in Tonga. BMC Public Health, 11(1), 284.
Fox, M., Pac, S., Devaney, B., & Jankowski, L. (2004). Feeding infants and toddlers study: What foods are infants and toddlers eating? Journal of the American Dietetic Association, 104(1 Suppl 1), s22-s30.
Francis, L., Hofer, S., & Birch, L. (2001). Predictors of maternal child-feeding style: maternal and child characteristics. Appetite, 37(3), 231–243.
French, G. M., Nicholson, L., Skybo, T., Klein, E. G., Schwirian, P. M., Murray-Johnson, L., . . . Groner, J. A. (2012). An Evaluation of Mother-Centered Anticipatory Guidance to Reduce Obesogenic Infant Feeding Behaviors. Pediatrics , 130(3), e507–e517.
French, S. A., Story, M., & Jeffery, R. W. (2001). Environmental influences on eating and physical activity. Annual Review of Public Health, 22(1), 309–335.
Friel, S. (2009). Health equity in Australia: A policy framework based on action on the social determinants of obesity, alcohol and tobacco (pp.45). Canberra.
Gaglio, B., Shoup, J. A., & Glasgow, R. E. (2013). The RE-AIM Framework: A Systematic Review of Use Over Time. American Journal of Public Health, 103(6), e1–e9.
Gielen, A. C., McDonald, E. M., Gary, T. L., & Bone, L. R. (2008). Using the PRECEDE-PROCEED model to apply health behavior theories. In K. Glanz, B. K. Rimer & K. Viswanath (Eds.), Health behavior and health education: Theory, research, and practice (pp. 407). San Francisco, CA: Jossey-Bass.

247
Gill, T., King, L., Bauman, A., Vita, P., Caterson, I., Colagiuri, S., . . . Gomez, M. (2010). A ‘state of the knowledge’ assessment of comprehensive interventions that address the drivers of obesity (pp. 171). Sydney: The Boden Institute of Obesity, Nutrition, Exercise and Eating Disorders,University of Sydney.
Glanz, K., Rimer, B. K., & Viswanath, K. (2008). Health behavior and health education: Theory, research, and practice (4th ed.). San Francisco, CA: Jossey-Bass.
Glasgow, R. E., Lichtenstein, E., & Marcus, A. C. (2003). Why don’t we see more translation of health promotion research to practice? Rethinking the efficacy-to-effectiveness transition. Journal Information, 93(8).
Glasgow, R. E., & Linnan, L. A. (2008). Evaluation of theory-based interventions. In K. Glanz, B. K. Rimer & K. Viswanath (Eds.), Health Behavior and Health Education: Theory, Research, and Practice.(pp. 487–508). San Francisco, CA: Jossey-Bass.
Glasgow, R. E., McKay, H. G., Piette, J. D., & Reynolds, K. D. (2001). The RE-AIM framework for evaluating interventions: what can it tell us about approaches to chronic illness management? Patient Education and Counseling, 44(2), 119–127.
Glasgow, R. E., Vogt, T. M., & Boles, S. M. (1999). Evaluating the public health impact of health promotion interventions: the RE-AIM framework. American Journal of Public Health, 89(9), 1322–1327.
Glickman, D., Parker, L., Sim, L. J., Cook, H. D. V., & Miller, E. A. (Singer-songwriters). (2012). Accelerating Progress in Obesity Prevention: Solving the Weight of the Nation. Washington, DC: Institute of Medicine of the National Academies.
Godfrey, C. (2001). Economic evaluation of health promotion. In I. Rootman (Ed.), Evaluation in Health Promotion. Principles and Perspectives (pp. 533). Copenhagen, DNK: WHO Regional Office for Europe.
Gordon, R., McDermott, L., Stead, M., & Angus, K. (2006). The effectiveness of social marketing interventions for health improvement: What’s the evidence? Public Health, 120(12), 1133–1139.
Gourlan, M., Trouilloud, D., & Sarrazin, P. (2011). Interventions promoting physical activity among obese populations: a meta-analysis considering global effect, long-term maintenance, physical activity indicators and dose characteristics. Obesity Reviews, 12(7), e633–e645.
Gray, M., & Sanson, A. (2005). Growing up in Australia: the longitudinal study of Australian children. Family Matters (72), 4–9.
Green, L. W., & Glasgow, R. E. (2006). Evaluating the relevance, generalization, and applicability of research issues in external validation and translation methodology. Evaluation & the Health Professions, 29(1), 126–153.
Green, L. W., & Kreuter, M. W. (2005). Health program planning: an educational and ecological approach. New York, London: McGraw-Hill.

248
Griffin, S. F., Wilcox, S., Ory, M. G., Lattimore, D., Leviton, L., Castro, C., . . . Rheaume, C. (2010). Results from the Active for Life process evaluation: program delivery fidelity and adaptations. Health Education Research, 25(2), 325–342.
Groner, J., Skybo, T., Murray-Johnson, L., Schwirian, P., Eneli, I., Sternstein, A., . . . French, G. (2009). Anticipatory Guidance for Prevention of Childhood Obesity: Design of the MOMS Project. Clinical pediatrics, 48(5), 483.
Grzywacz, J., Tucker, J., Clinch, C., & Arcury, T. (2010). Individual and Job-Related Variation in Infant Feeding Practices among Working Mothers. American Journal of Health Behavior, 34(2), 186.
Haby, M. M., Doherty, R., Welch, N., & Mason, V. (2012). Community-based interventions for obesity prevention: lessons learned by Australian policy-makers. BMC Research Notes, 5(1), 20.
Haire-Joshu, D., Elliott, M. B., Caito, N. M., Hessler, K., Nanney, M., Hale, N., . . . Brownson, R. C. (2008). High 5 for Kids: the impact of a home visiting program on fruit and vegetable intake of parents and their preschool children. Preventive Medicine, 47(1), 77–82.
Harper, L. V., & Sanders, K. M. (1975). The effect of adults’ eating on young children’s acceptance of unfamiliar foods. Journal of Experimental Child Psychology, 20(2), 206–214.
Harrison, L., Ungerer, J. A., Smith, G. J., Zubrick, S., Wise, S., Press, F., & Waniganayake, M. (2009). Child Care and Early Education in Australia: The Longitudinal Study of Australian Children. (pp 222). Canberra : Dept. of Families, Housing, Community Services and Indigenous Affairs.
Harvey-Berino, J., & Rourke, J. (2003). Obesity prevention in preschool native-American children: a pilot study using home visiting. Obesity Research, 11(5), 606–611.
Hastings, G., McDermott, L., Angus, K., Stead, M., & Thomson, S. (2006). The extent, nature and effects of food promotion to children: a review of the evidence. Geneva: World Health Organization.
Hawe, P., Shiell, A., & Riley, T. (2004). Complex interventions: how “out of control” can a randomised controlled trial be? BMJ, 328(7455), 1561–1563.
Hawe, P., Shiell, A., Riley, T., & Gold, L. (2004). Methods for exploring implementation variation and local context within a cluster randomised community intervention trial. Journal of Epidemiology and Community Health, 58(9), 788–793.
Hawkins, S. S., Cole, T. J., & Law, C. (2009). An ecological systems approach to examining risk factors for early childhood overweight: findings from the UK Millennium Cohort Study. Journal of Epidemiology and Community Health, 63(2), 147–155.
Hector, D., King, L., Hardy, L., St George, A., Hebden, L., Espinel, P., & Rissel, C. (2012). Evidence update on obesity prevention across the life-course. Sydney : Physical Activity Nutrition Obesity Research Group: Prepared for NSW Ministry of Health.

249
Helitzer, D. L., Davis, S. M., Gittelsohn, J., Going, S. B., Murray, D. M., Snyder, P., & Steckler, A. B. (1999). Process evaluation in a multisite, primary obesity-prevention trial in American Indian schoolchildren. The American Journal of Clinical Nutrition, 69(4), 816S–824S.
Hendricks, K., Briefel, R., Novak, T., & Ziegler, P. (2006). Maternal and Child Characteristics Associated with Infant and Toddler Feeding Practices. Journal of the American Dietetic Association, 106(1, Supplement), 135–148.
Hercberg, S., Chat-Yung, S., & Chauliac, M. (2008). The French national nutrition and health program: 2001–2006–2010. International Journal of Public Health, 53(2), 68–77.
Hesketh, K., Waters, E., Green, J., Salmon, L., & Williams, J. (2005). Healthy eating, activity and obesity prevention: a qualitative study of parent and child perceptions in Australia. Health Promotion International, 20(1), 19–26.
Higgins, J. P. T., & Altman, D. G. (2008). Assessing Risk of Bias in Included Studies. In Cochrane Handbook for Systematic Reviews of Interventions (pp. 187–241). Chichester, UK : John Wiley & Sons, Ltd.
Higgins, J. P. T., & Green, S. (2008). Cochrane handbook for systematic reviews of interventions. Chichester, UK : John Wiley & Sons, Ltd.
Hoddinott, P., Allan, K., Avenell, A., & Britten, J. (2010). Group interventions to improve health outcomes: a framework for their design and delivery. BMC Public Health, 10(1), 800.
Horodynski, M., & Stommel, M. (2005). Nutrition Education Aimed at Toddlers: an intervention study. Pediatric Nursing, 31(5), 364.
Howard, A. J., Mallan, K. M., Byrne, R., Magarey, A., & Daniels, L. A. (2012). Toddlers’ food preferences. The impact of novel food exposure, maternal preferences and food neophobia. Appetite, 59(3), 818–825.
Hughes, S., Power, T., Orlet Fisher, J., Mueller, S., & Nicklas, T. (2005). Revisiting a neglected construct: parenting styles in a child-feeding context. Appetite, 44(1), 83–92.
Hurley, K. M., Cross, M. B., & Hughes, S. O. (2011). A systematic review of responsive feeding and child obesity in high-income countries. The Journal of Nutrition, 141(3), 495.
Issel, L. M. (2009). Health program planning and evaluation: A practical, systematic approach for community health (2nd ed.). London: Jones & Bartlett Pub.
Jadad, A. R., & Enkin, M. W. (2008). Bias in Randomized Controlled Trials. In Randomized Controlled Trials (pp. 29–47). Oxford, UK: Blackwell Publishing Ltd.
Jansen, E., Daniels, L. A., & Nicholson, J. M. (2012). The dynamics of parenting and early feeding – constructs and controversies: a viewpoint. Early Child Development and Care, 182(8), 967–981.

250
Jaumotte, F. (2003). Les femmes sur le marché du travail: évidence empirique sur le rôle des politiques économiques et autres déterminants dans les pays de l’OCDE. Revue économique de l’OCDE(2), 57–123.
Jensen, B. W., Nichols, M., Allender, S., de Silva-Sanigorski, A., Millar, L., Kremer, P., . . . Swinburn, B. (2012). Consumption patterns of sweet drinks in a population of Australian children and adolescents. BMC Public Health, 12, 771.
Kaphingst, K. A., Lobb, R., Fay, M. E., Hunt, M. K., Suarez, E. G., Fletcher, R. H., & Emmons, K. M. (2007). Impact of intervention dose on cancer-related health behaviors among working-class, multiethnic, community health center patients. American Journal of Health Promotion, 21(4), 262–266.
Kelly, B., Bochynska, K., Kornman, K., & Chapman, K. (2008). Internet food marketing on popular children’s websites and food product websites in Australia. Public Health Nutrition, 11(11), 1180–1187.
Kelly, B., Hardy, L. L., Howlett, S., King, L., Farrell, L., & Hattersley, L. (2010). Opening up Australian preschoolers’ lunchboxes. Australian and New Zealand Journal of Public Health, 34(3), 288–292.
Kelly, B., Smith, B., King, L., Flood, V., & Bauman, A. (2007). Television food advertising to children: the extent and nature of exposure. Public Health Nutrition, 10(11), 1234–1240.
Kessler, R., & Glasgow, R. E. (2011). A proposal to speed translation of healthcare research into practice: dramatic change is needed. American Journal of Preventive Medicine, 40(6), 637–644.
Khambalia, A. Z., Dickinson, S., Hardy, L. L., Gill, T., & Baur, L. A. (2011). A synthesis of existing systematic reviews and meta-analyses of school-based behavioural interventions for controlling and preventing obesity. Obesity Reviews, 13(3), 214–233.
Killen, J., Taylor, C., Hayward, C., Wilson, D., Haydel, K., Hammer, L., . . . Varady, A. (1994). Pursuit of thinness and onset of eating disorder symptoms in a community sample of adolescent girls. International Journal of Eating Disorders, 16, 227–238.
Kirkwood, B. R., & Sterne, J. A. C. (2003). Essential medical statistics (Second ed.). Oxford, UK: Wiley-Blackwell.
Klesges, L. M., Dzewaltowski, D. A., & Glasgow, R. E. (2008). Review of external validity reporting in childhood obesity prevention research. American Journal of Preventive Medicine, 34(3), 216–223.
Knai, C., Lobstein, T., Darmon, N., Rutter, H., & McKee, M. (2012). Socioeconomic Patterning of Childhood Overweight Status in Europe. International Journal of Environmental Research and Public Health, 9(4), 1472–1489.
Knowlden, A., & Sharma, M. (2012). A Feasibility and Efficacy Randomized Controlled Trial of an Online Preventative Program for Childhood Obesity: Protocol for the EMPOWER Intervention. JMIR Research Protocols, 1(1), e5.

251
Koh, G., Scott, J., Oddy, W., Graham, K., & Binns, C. (2010). Exposure to non core foods and beverages in the first year of life: Results from a cohort study. Nutrition & Dietetics, 67(3), 137–142.
Kok, G., Schaalma, H., Ruiter, R. A. C., Van Empelen, P., & Brug, J. (2004). Intervention mapping: protocol for applying health psychology theory to prevention programmes. Journal of Health Psychology, 9(1), 85.
Krolner, R., Rasmussen, M., Brug, J., Klepp, K.-I., Wind, M., & Due, P. (2011). Determinants of fruit and vegetable consumption among children and adolescents: a review of the literature. Part II: qualitative studies. International Journal of Behavioral Nutrition and Physical Activity, 8(1), 112.
Kumanyika, S., Jeffery, R., Morabia, A., Ritenbaugh, C., & Antipatis, V. (2002). Obesity prevention: the case for action. International Journal of Obesity and Related Metabolic Disorders: journal of the International Association for the Study of Obesity, 26(3), 425.
Kumanyika, S. K., Parker, L., & Sim, L. J. (2010). Bridging the evidence gap in obesity prevention: a framework to inform decision making. Washington, DC: Institute of Medicine of the National Academies.
Lakshman, R., Paes, V., Hesketh, K., OMalley, C., Moore, H., Ong, K., . . . Summerbell, C. (2013). Protocol for systematic reviews of determinants/correlates of obesity-related dietary and physical activity behaviors in young children (preschool 0 to 6 years): evidence mapping and syntheses. Systematic Reviews, 2(1), 28.
Lakshman, R., Zhang, J., Zhang, J., Koch, F. S., Marcus, C., Ludvigsson, J., . . . Sobko, T. (2013). Higher maternal education is associated with favourable growth of young children in different countries. Journal of Epidemiology and Community Health. doi:10.1136/jech-2012-202021
Lee, H. (2011). Inequality as an Explanation for Obesity in the United States. Sociology Compass, 5(3), 215–232.
Legrand, K., Bonsergent, E., Latarche, C., Empereur, F., Collin, J. F., Lecomte, E., . . . Briançon, S. (2012). Intervention dose estimation in health promotion programmes: a framework and a tool. Application to the diet and physical activity promotion PRALIMAP trial. BMC Medical Research Methodology, 12(1), 146.
Leslie, D. A., Hesketh, K. D., & Campbell, K. J. (2012). Breastfeeding mothers consume more vegetables and a greater variety of fruits and vegetables than non-breastfeeding peers: The influence of socioeconomic position. Nutrition & Dietetics, 69(2), 84–90.
Lewin, S., Glenton, C., & Oxman, A. D. (2009). Use of qualitative methods alongside randomised controlled trials of complex healthcare interventions: methodological study. BMJ, 339.
Linnan, L., & Steckler, A. (2002). Process evaluation for public health interventions and research: an overview. In A. Steckler & L. Linnan (Eds.), Process evaluation for Public Health (p. 400). San Francisco: Jossey-Bass.

252
Lioret, S., Campbell, K., Crawford, D., Spence, A., Hesketh, K., & McNaughton, S. (2012). A parent focused child obesity prevention intervention improves some mother obesity risk behaviors: the Melbourne infant program. International Journal of Behavioral Nutrition and Physical Activity, 9(1), 100.
Lioret, S., McNaughton, S. A., Crawford, D., Spence, A. C., Hesketh, K., & Campbell, K. J. (2012). Parents’ dietary patterns are significantly correlated: findings from the Melbourne Infant Feeding Activity and Nutrition Trial Program. British Journal of Nutrition, 108(3), 518.
Lobstein, T., Baur, L., & Uauy, R. (2004). Obesity in children and young people: a crisis in public health. Obesity Reviews, 5(s1), 4–85.
Lohse, B. (2013). Facebook Is an Effective Strategy to Recruit Low-income Women to Online Nutrition Education. Journal of Nutrition Education and Behavior, 45(1), 69–76.
Macintyre, S. (2011). Good intentions and received wisdom are not good enough: the need for controlled trials in public health. Journal of Epidemiology and Community Health, 65(7), 564–567.
Maier, A., Chabanet, C., Schaal, B., Leathwood, P., & Issanchou, S. (2007). Food-related sensory experience from birth through weaning: contrasted patterns in two nearby European regions. Appetite, 49(2), 429–440.
Margetts, B. M., & Nelson, M. (1997). Design concepts in nutritional epidemiology (2n ed). Oxford: Oxford University Press..
Marriott, L., Foote, K., Bishop, J., Kimber, A., & Morgan, J. (2003). Weaning preterm infants: a randomised controlled trial. Archives of Disease in Childhood-Fetal and Neonatal Edition, 88(4), F302–F307.
Mathews, L., Moodie, M., Simmons, A., & Swinburn, B. (2010). The process evaluation of It’s Your Move!, an Australian adolescent obesity prevention project. BMC Public Health, 10(1), 448.
May, A., Donohue, M., Scanlon, K., Herry, B., Dalenius, K., Faulkner, P., & Birch, L. (2007). Child-feeding strategies are associated with maternal concern about children becoming overweight, but not children’s weight status. Journal of the American Dietetic Association, 107, 1167–1174.
McGarvey, E., Keller, A., Forrester, M., Williams, E., Seward, D., & Suttle, D. E. (2004). Feasibility and Benefits of a Parent-Focused Preschool Child Obesity Intervention. Am J Public Health, 94(9), 1490–1495.
McGowan, L., Croker, H., Wardle, J., & Cooke, L. J. (2012). Environmental and individual determinants of core and non-core food and drink intake in preschool-aged children in the United Kingdom. European Journal of Clinical Nutrition, 66(3), 322–328.
McLeod, E. R., Campbell, K. J., & Hesketh, K. D. (2011). Nutrition Knowledge: A Mediator between Socioeconomic Position and Diet Quality in Australian First-Time Mothers. Journal of the American Dietetic Association, 111(5), 696–704.
253
McLeroy, K. R., Bibeau, D., Steckler, A., & Glanz, K. (1988). An ecological perspective on health promotion programs. Health Education & Behavior, 15(4), 351–377.
McPhie, S., Skouteris, H., Daniels, L., & Jansen, E. (2014). Maternal correlates of maternal child feeding practices: a systematic review. Maternal & Child Nutrition. 10(1), 18-43.
Mennella, J., & Beauchamp, G. (1999). Experience with a flavor in mother’s milk modifies the infant’s acceptance of flavored cereal. Developmental Psychobiology, 35(3), 197–203.
Mennella, J., Jagnow, C., & Beauchamp, G. (2001). Prenatal and postnatal flavor learning by human infants. Pediatrics, 107(6), e88.
Mennella, J. A., & Trabulsi, J. C. (2012). Complementary Foods and Flavor Experiences: Setting the Foundation. Annals of Nutrition and Metabolism, 60(Suppl. 2), 40–50.
Mihrshahi, S., Battistutta, D., Magarey, A., & Daniels, L. (2011). Determinants of rapid weight gain during infancy: baseline results from the NOURISH randomised controlled trial. BMC Pediatrics, 11(1), 99.
Mihrshahi, S., Vukasin, N., Forbes, S., Wainwright, C., Krause, W., Ampon, R., . . . Peat, J. (2002). Are you busy for the next 5 years? Recruitment in the Childhood Asthma Prevention Study (CAPS). Respirology, 7(2), 147–151.
Miller, M., Newell, S., Huddy, A. D., Adams, J. K., Holden, L., & Dietrich, U. C. (2001). Tooty Fruity Vegie Project: process and impact evaluation report (pp138). Lismore, NSW: Health Promotion Unit, Northern Rivers Area Health Service.
Mindlin, M., Jenkins, R., & Law, C. (2009). Maternal employment and indicators of child health: a systematic review in pre-school children in OECD countries. Journal of Epidemiology and Community Health, 63(5), 340–350.
Moher, D., Hopewell, S., Schulz, K. F., Montori, V., Gøtzsche, P. C., Devereaux, P. J., . . . Altman, D. G. (2010). CONSORT 2010 Explanation and Elaboration: updated guidelines for reporting parallel group randomised trials. Journal of Clinical Epidemiology, 63(8), e1–e37.
Monasta, L., Lobstein, T., Cole, T. J., Vignerová, J., & Cattaneo, A. (2011). Defining overweight and obesity in pre-school children: IOTF reference or WHO standard? Obesity Reviews, 12(4), 295–300.
Monceau, C., Blanche-Barbat, E., & Echampe, J. (2002). La consommation alimentaire depuis quarante ans. De plus en plus de produits élaborés. INSEE première, 846, 1–4.
Monsivais, P., Aggarwal, A., & Drewnowski, A. (2010). Are socio-economic disparities in diet quality explained by diet cost? Journal of Epidemiology and Community Health. doi:10.1136/jech.2010.122333
Montaño, D. E., & Kasprzyk, D. (2008). Theory of Reasoned Action, theory of Planned Bahavior, and the Integrated Behavioral Model. In K. Glanz, B. K. Rimer

254
& K. Viswanath (Eds.), Health behavior and health education: Theory, research, and practice (4th ed., pp. 67–96). San Francisco, CA: Jossey-Bass.
Moodie, M., & Carter, R. (2010). Economic evaluation of obesity interventions. In E. Waters, B. Swinburn, J. Seidell & R. Uauy (Eds.), Preventing Childhood Obesity (p. 306): Wiley-Blackwell.
Moore, L., & Gibbs, L. (2010). Evaluation of community-based obesity interventions. In E. Waters, B. Swiburn, J. Seidell & R. Uauy (Eds.), Preventing Childhood Obesity. Evidence policy and practice. (p. 306). Chichester, UK : Wiley-Blackwell.
Moore, L., & Moore, G. F. (2011). Public health evaluation: which designs work, for whom and under what circumstances? Journal of Epidemiology and Community Health, 65(7), 596–597.
Morley, B. C., Scully, M., Niven, P., Okely, A., Baur, L., Pratt, I., & Wakefield, M. (2012). What factors are associated with excess body weight in Australian secondary school students? The Medical Journal of Australia, 196(3), 189–192.
Musher-Eizenman, D., & Holub, S. (2007). Comprehensive Feeding Practices Questionnaire: validation of a new measure of parental feeding practices. Journal of Pediatric Psychology, 32(8), 960.
Mwanri, L., Foley, W., Coveney, J., Muller, R., Verity, F., Ward, P. R., . . . Taylor, A. (2012). Food supply and the obesity scourge: Is there a relationship? Health 4(12A), 1457-1463.
Nader, P. R., Sellers, D. E., Johnson, C. C., Perry, C. L., Stone, E. J., Cook, K. C., . . . Luepker, R. V. (1996). The Effect of Adult Participation in a School-Based Family Intervention to Improve Children’s Diet and Physical Activity: The Child and Adolescent Trial for Cardiovascular Health. Preventive Medicine, 25(4), 455–464.
Naidoo, J., & Wills, J. (2009). Foundations for health promotion (Third ed.). London: Baillière Tindall/Elsevier.
Nelson, C., Wissow, L., & Cheng, T. (2003). Effectiveness of anticipatory guidance: recent developments. Current Opinion in Pediatrics, 15, 630–635.
Neumark-Sztainer, D., Hannan, P. J., Story, M., Croll, J., & Perry, C. (2003). Family meal patterns: associations with sociodemographic characteristics and improved dietary intake among adolescents. Journal of the American Dietetic Association, 103(3), 317–322.
Nicholson, J., Berthelsen, D., Williams, K., & Abad, V. (2010). National Study of an Early Parenting Intervention: Implementation Differences on Parent and Child Outcomes. Prevention Science, 1–11.
Nicholson, L. M., Schwirian, P. M., Klein, E. G., Skybo, T., Murray-Johnson, L., Eneli, I., . . . Groner, J. A. (2011). Recruitment and retention strategies in longitudinal clinical studies with low-income populations. Contemporary Clinical Trials, 32(3), 353–362.
Noyes, J., Popay, J., Pearson, A., & Hannes, K. (2008). 20 Qualitative research and Cochrane reviews. In J. P. T. Higgins & S. Green (Eds.), Cochrane handbook for

255
systematic reviews of interventions (pp. 571). Chichester, UK: John Wiley & Sons, Ltd.
Nutbeam, D. (1998). Evaluating health promotion-progress, problems and solutions. Health Promotion International, 13(1), 27.
OCDE. (2011). Cuisiner, s’occuper des enfants, construire ou réparer : Le travail non rémunéré à travers le monde. In Panorama de la société 2011: OCDE.
Odgaard-Jensen, J., Vist Gunn, E., Timmer, A., Kunz, R., Akl Elie, A., Schünemann, H., . . . Oxman Andrew, D. (2011). Randomisation to protect against selection bias in healthcare trials. Cochrane Database of Systematic Reviews. Retrieved from http://onlinelibrary.wiley.com/doi/10.1002/14651858.MR000012.pub3 /abstract.
Ogden, J. (2010). Eating Behaviour. In D. French, K. Vedhara, A. Kaptein & J. Weinman (Eds.), Health Psychology (2nd ed., pp. 59). Chichester, UK: BPS Blackwell.
Ogden, J., Reynolds, R., & Smith, A. (2006). Expanding the concept of parental control: A role for overt and covert control in children’s snacking behaviour? Appetite, 47(1), 100–106.
Ong, K. K., & Loos, R. J. F. (2006). Rapid infancy weight gain and subsequent obesity: systematic reviews and hopeful suggestions. Acta Paediatrica, 95(8), 904–908.
Pampel, F. C., Krueger, P. M., & Denney, J. T. (2010). Socioeconomic disparities in health behaviors. Annual review of sociology, 36, 349.
Park, M., Falconer, C., Viner, R., & Kinra, S. (2012). The impact of childhood obesity on morbidity and mortality in adulthood: a systematic review. Obesity Reviews, 13(11), 985-1000.
Patrick, H., & Nicklas, T. A. (2005). A Review of Family and Social Determinants of Children’s Eating Patterns and Diet Quality. J Am Coll Nutr, 24(2), 83–92.
Patrick, K., Scutchfield, F. D., & Woolf, S. H. (2008). External validity reporting in prevention research. American Journal of Preventive Medicine, 34(3), 260-262.
Petticrew, M., Tugwell, P., Kristjansson, E., Oliver, S., Ueffing, E., & Welch, V. (2012). Damned if you do, damned if you don’t: subgroup analysis and equity. Journal of Epidemiology and Community Health, 66(1), 95–98.
Pettman, T. L., Armstrong, R., Doyle, J., Burford, B., Anderson, L. M., Hillgrove, T., . . . Waters, E. (2012). Strengthening evaluation to capture the breadth of public health practice: ideal vs. real. Journal of Public Health, 34(1), 151–155.
Polat, S., Erci, B., Li, C., Han, H., Lee, J., Lee, M., . . . Park, S. (2010). Psychometric Properties of the Child Feeding Scale in Turkish Mothers. Asian Nursing Research, 4(3), 111–121.
Powers, S. W., Chamberlin, L. A., van Schaick, K. B., Sherman, S. N., & Whitaker, R. C. (2006). Maternal feeding strategies, child eating behaviors, and child BMI in low-income African-American preschoolers. Obesity, 14, 2026.

256
Pridham, K. F. (1993). Anticipatory Guidance of Parents of New Infants: Potential Contribution of the Internal Working Model Construct. Journal of Nursing Scholarship, 25(1), 49–56.
Prochaska, J. O., Redding, C. A., & Evers, K. E. (2008). The Transtheoretical Model and Stages of Change In K. Glanz, B. K. Rimer & K. Viswanath (Eds.), Health behavior and health education: Theory, research, and practice (4th ed., pp. 97–121). San Francisco, CA: Jossey-Bass.
Przyrembel, H. (2012). Timing of Introduction of Complementary Food: Short- and Long-Term Health Consequences. Annals of Nutrition and Metabolism, 60(Suppl. 2), 8–20.
Qvortrup, M. (2005). Globalisation and obesity. Obes Pract, 1(2), 10–12.
Rasmussen, M., Krølner, R., Klepp, K. I., Lytle, L., Brug, J., Bere, E., & Due, P. (2006). Determinants of fruit and vegetable consumption among children and adolescents: a review of the literature. Part I: quantitative studies. International Journal of Behavioral Nutrition and Physical Activity, 3(1), 22.
Regber, S., Novak, M., Eiben, G., Lissner, L., Hense, S., Sandström, T. Z., . . . Mårild, S. (2013). Assessment of selection bias in a health survey of children and families—the IDEFICS Sweden-study. BMC Public Health, 13(1), 418.
Reilly, J., & Kelly, J. (2011). Long-term impact of overweight and obesity in childhood and adolescence on morbidity and premature mortality in adulthood: systematic review. International Journal of Obesity, 35(7), 891–898.
Reilly, J. J., Kelly, J., & Wilson, D. C. (2010). Accuracy of simple clinical and epidemiological definitions of childhood obesity: systematic review and evidence appraisal. Obesity Reviews, 11(9), 645–655.
Renger, R., & Titcomb, A. (2002). A three-step approach to teaching logic models. American Journal of Evaluation, 23, 493–504.
Rhee, K. (2008). Childhood overweight and the relationship between parent behaviors, parenting style, and family functioning. The ANNALS of the American Academy of Political and Social Science, 615, 11–37.
Robinson, S., Marriott, L., Poole, J., Crozier, S., Borland, S., Lawrence, W., . . . Inskip, H. (2007). Dietary patterns in infancy: the importance of maternal and family influences on feeding practice. British Journal of Nutrition, 98(05), 1029–1037.
Rosenstock, I. M., Strecher, V. J., & Becker, M. H. (1988). Social learning theory and the health belief model. Health Education & Behavior, 15(2), 175–183.
Rozin, P. (1990). The importance of social factors in understanding the acquisition of food habits. In E. D. Capaldi & T. L. Powley (Eds.), Taste, experience, and feeding (pp. 255-269). Washington, DC, US: American Psychological Association.
Rozin, P., & Schiller, D. (1980). The nature and acquisition of a preference for chili pepper by humans. Motivation and Emotion, 4(1), 77–101.

257
Rychetnik, L., Bauman, A., Laws, R., King, L., Rissel, C., Nutbeam, D., . . . Caterson, I. (2012). Translating research for evidence-based public health: key concepts and future directions. Journal of Epidemiology and Community Health. 66(12), 1187-1192.
Rychetnik, L., Frommer, M., Hawe, P., & Shiell, A. (2002). Criteria for evaluating evidence on public health interventions. Journal of Epidemiology and Community Health, 56(2), 119–127.
Salmon, J., Ball, K., Crawford, D., Booth, M., Telford, A., Hume, C., . . . Worsley, A. (2005). Reducing sedentary behaviour and increasing physical activity among 10-year-old children: overview and process evaluation of the ‘Switch-Play’ intervention. Health Promotion International, 20(1), 7–17.
Salvy, S., Vartanian, L., Coelho, J., Jarrin, D., & Pliner, P. (2008). The role of familiarity on modeling of eating and food consumption in children. Appetite, 50, 524–528.
Sassi, F., & Devaux, M. (2012). Obesity update 2012 Retrieved 22-12-2012, from http://www.oecd.org/dataoecd/1/61/49716427.pdf.
Satter, E. (2000). Child of Mine. Feeding with love and good sense. (3rd ed.). Boulder, Colorado: Palo Alto, California: Bull Publishing Company.
Saunders, R. P., Evans, M. H., & Joshi, P. (2005). Developing a process-evaluation plan for assessing health promotion program implementation: a how-to guide. Health Promotion Practice, 6(2), 134.
Savage, J., Fisher, J., & Birch, L. (2007). Parental influence on eating behavior: conception to adolescence. The Journal of law, medicine & ethics: a journal of the American Society of Law, Medicine & Ethics, 35(1), 22.
Schrempft, S., van Jaarsveld, C. H. M., Fisher, A., & Wardle, J. (2013). Family and infant characteristics associated with timing of core and non-core food introduction in early childhood. Eur J Clin Nutr, 67(6), 652–657.
Schwartz, C., Scholtens, P. A. M. J., Lalanne, A., Weenen, H., & Nicklaus, S. (2011). Development of healthy eating habits early in life. Review of recent evidence and selected guidelines. Appetite, 57(3), 796–807.
Schwartz, M. B., & Puhl, R. (2003). Childhood obesity: a societal problem to solve. Obesity Reviews, 4(1), 57–71.
Schwimmer, J. B., Burwinkle, T. M., & Varni, J. W. (2003). Health-related quality of life of severely obese children and adolescents. JAMA: The Journal of the American Medical Association, 289(14), 1813–1819.
Scott, J., Binns, C., Graham, K., & Oddy, W. (2009). Predictors of the early introduction of solid foods in infants: results of a cohort study. BMC Pediatrics, 9(1), 60.
Sekhobo, J. P., Egglefield, K., Edmunds, L. S., & Shackman, G. (2011). Evidence of the adoption and implementation of a statewide childhood obesity prevention initiative in the New York State WIC Program: the NY Fit WIC process evaluation. Health Education Research. doi: 10.1093/her/cyr100.

258
Sherry, B., Mei, Z., Scanlon, K. S., Mokdad, A. H., & Grummer-Strawn, L. M. (2004). Trends in state-specific prevalence of overweight and underweight in 2-through 4-year-old children from low-income families from 1989 through 2000. Archives of Pediatrics and Adolescent Medicine, 158(12), 1116.
Shrewsbury, V., & Wardle, J. (2008). Socioeconomic status and adiposity in childhood: a systematic review of cross-sectional studies 1990–2005. Obesity (Silver Spring, Md.), 16(2), 275.
Simmons, A., Borys, J. M., & Swinburn, B. (2010). Community interventions—planning for sustainability. Preventing Childhood Obesity: Evidence Policy and Practice, 220.
Singh, A. S., Mulder, C., Twisk, J. W. R., Van Mechelen, W., & Chinapaw, M. J. M. (2008). Tracking of childhood overweight into adulthood: a systematic review of the literature. Obesity Reviews, 9(5), 474–488.
Skafida, V. (2013). The family meal panacea: exploring how different aspects of family meal occurrence, meal habits and meal enjoyment relate to young children’s diets. Sociology of Health & Illness, 35(6), 906-923.
Skouteris, H., McCabe, M., Swinburn, B., Newgreen, V., Sacher, P., & Chadwick, P. (2011). Parental influence and obesity prevention in pre-schoolers: a systematic review of interventions. Obesity Reviews, 12(5), 315-328.
Sobal, J. (1991). Obesity and socioeconomic status: a framework for examining relationships between physical and social variables. Medical Anthropology, 13(3), 231–247.
Sobal, J., & Stunkard, A. J. (1989). Socioeconomic status and obesity: A review of the literature. Psychological Bulletin, 105(2), 260–275.
Spruijt-Metz, D. (2011). Etiology, Treatment, and Prevention of Obesity in Childhood and Adolescence: A Decade in Review. Journal of Research on Adolescence, 21(1), 129–152.
Steckler, A., Ethelbah, B., Martin, C. J., Stewart, D., Pardilla, M., Gittelsohn, J., . . . Vu, M. (2003). Pathways process evaluation results: a school-based prevention trial to promote healthful diet and physical activity in American Indian third, fourth, and fifth grade students. Preventive Medicine, 37, S80–S90.
Stenhammar, C., Wells, M., Åhman, A., Wettergren, B., Edlund, B., & Sarkadi, A. (2012). “Children are exposed to temptation all the time”—parents’ lifestyle-related discussions in focus groups. Acta Paediatrica, 101(2), 208-215.
Story, M., Kaphingst, K. M., Robinson-O’Brien, R., & Glanz, K. (2008). Creating healthy food and eating environments: policy and environmental approaches. Annu. Review of Public Health, 29, 253–272.
Strazdins, L., Broom, D. H., Banwell, C., McDonald, T., & Skeat, H. (2011). Time limits? Reflecting and responding to time barriers for healthy, active living in Australia. Health Promotion International, 26(1), 46–54.
Strazdins, L., Griffin, A. L., Broom, D. H., Banwell, C., Korda, R., Dixon, J., . . . Glover, J. (2011). Time scarcity: another health inequality? Environment and Planning—Part A, 43(3), 545.

259
Sullivan, S., & Birch, L. (1994). Infant dietary experience and acceptance of solid foods. Pediatrics, 93(2), 271.
Sun, X., Briel, M., Busse, J. W., You, J. J., Akl, E. A., Mejza, F., . . . Guyatt, G. H. (2011). The influence of study characteristics on reporting of subgroup analyses in randomised controlled trials: systematic review. BMJ, 342, d1569.
Swinburn, B., Bell, C., King, L., Magarey, A., O’Brien, K., Waters, E. Adolescent Obesity Research, N. (2007). Obesity prevention programs demand high-quality evaluations. Australian and New Zealand Journal of Public Health, 31(4), 305–307.
Swinburn, B., Gill, T., & Kumanyika, S. (2005). Obesity prevention: a proposed framework for translating evidence into action. Obesity Reviews, 6(1), 23–33.
Swinburn, B. A., & de Silva-Sanigorski, A. M. (2010). Where to From Here for Preventing Childhood Obesity: An International Perspective. Obesity, 18(S1), S4–S7.
Swinburn, B. A., Sacks, G., Hall, K. D., McPherson, K., Finegood, D. T., Moodie, M. L., & Gortmaker, S. L. (2011). The global obesity pandemic: shaped by global drivers and local environments. The Lancet, 378(9793), 804–814.
Taveras, E. M., Hohman, K. H., Price, S. N., Rifas-Shiman, S. L., Mitchell, K., Gortmaker, S. L., & Gillman, M. W. (2011). Correlates of Participation in a Pediatric Primary Care-Based Obesity Prevention Intervention. Obesity, 19(2), 449–452.
Thomas, H. (2006). Obesity prevention programs for children and youth: why are their results so modest? Health Education Research, 21(6), 783–795.
Tiggemann, M., & Lowes, J. (2002). Predictors of maternal control over children’s eating behaviour. Appetite, 39(1), 1–7.
Treweek, S., Mitchell, E., Pitkethly, M., Cook, J., Kjeldstrøm, M., Johansen, M., . . . Lockhart, P. (2011). Strategies to improve recruitment to randomised controlled trials. Cochrane Database of Systematic Reviews, (4). doi:10.1002/14651858.MR000013.pub5
Turrell, G., & Kavanagh, A. M. (2006). Socio-economic pathways to diet: modelling the association between socio-economic position and food purchasing behaviour. Public Health Nutrition, 9(03), 375–383.
Van Koperen, T., Jebb, S., Summerbell, C., Visscher, T., Romon, M., Borys, J., & Seidell, J. (2013). Characterizing the EPODE logic model: unravelling the past and informing the future. Obesity Reviews, 14(2), 162–170.
Ventura, A., & Birch, L. (2008). Does parenting affect children’s eating and weight status? International Journal of Behavioral Nutrition and Physical Activity, 5, 15–44.
Walter, H. J. (1989). Primary Prevention of Chronic Disease among Children: The School-Based “Know Your Body” Intervention Trials. Health Education & Behavior, 16(2), 201–214.

260
Wang, S., Moss, J. R., & Hiller, J. E. (2006). Applicability and transferability of interventions in evidence-based public health. Health Promotion International, 21(1), 76–83.
Wang, Y. (2008). Child Obesity and Health. In H. Kris (Ed.), International Encyclopedia of Public Health (pp. 590–604). Oxford: Academic Press.
Wang, Y., & Lim, H. (2012). The global childhood obesity epidemic and the association between socio-economic status and childhood obesity. International Review of Psychiatry, 24(3), 176–188.
Wang, Y., & Lobstein, T. (2006). Worldwide trends in childhood overweight and obesity. International Journal of Pediatric Obesity, 1(1), 11–25.
Wardle, J., Sanderson, S., Guthrie, C., Rapoport, L., & Plomin, R. (2002). Parental feeding style and the inter-generational transmission of obesity risk. Obesity, 10(6), 453–462.
Wardle, J., Sanderson, S., Leigh Gibson, E., & Rapoport, L. (2001). Factor-analytic structure of food preferences in four-year-old children in the UK. Appetite, 37(3), 217–223.
Warner, E. T., Glasgow, R. E., Emmons, K. M., Bennett, G. G., Askew, S., Rosner, B., & Colditz, G. A. (2013). Recruitment and retention of participants in a pragmatic randomized intervention trial at three community health clinics: Results and lessons learned. BMC Public Health, 13(1), 192.
Warren, J., Henry, C., Lightowler, H., Bradshaw, S., & Perwaiz, S. (2003). Evaluation of a pilot school programme aimed at the prevention of obesity in children. Health Promotion International, 18(4), 287–296.
Waters, E., de Silva-Sanigorski, A., Hall, B. J., Brown, T., Campbell, K. J., Gao, Y., . . . Summerbell, C. D. (2011). Interventions for preventing obesity in children (Review). The Cochrane Collaboration(12), 1–191.
Waters, E., Hall, B. J., Armstrong, R., Doyle, J., Pettman, T. L., & de Silva-Sanigorski, A. (2011). Essential components of public health evidence reviews: capturing intervention complexity, implementation, economics and equity. Journal of Public Health, 33(3), 462–465.
Waters, E., Swinburn, B., Seidell, J., & Uauy, R. (2011). Preventing childhood obesity: Evidence policy and practice. Chichester, UK: Wiley-Blackwell.
Watt, R. G., Tull, K. I., Hardy, R., Wiggins, M., Kelly, Y., Molloy, B., . . . McGlone, P. (2009). Effectiveness of a social support intervention on infant feeding practices: randomised controlled trial. Journal of Epidemiology and Community Health, 63(2), 156.
Webb, K., Lahti-Koski, M., Rutishauser, I., Hector, D., Knezevic, N., Gill, T., & Peat, J. (2006). Consumption of extra foods (energy-dense, nutrient-poor) among children aged 16–24 months from western Sydney, Australia. Public Health Nutrition, 9(8), 1035–1044.
Wen, L. M., Baur, L. A., Rissel, C., Wardle, K., Alperstein, G., & Simpson, J. M. (2007). Early intervention of multiple home visits to prevent childhood obesity in

261
a disadvantaged population: a home-based randomised controlled trial (Healthy Beginnings Trial). BMC Public Health, 7(1), 76.
Wen, L. M., Baur, L. A., Simpson, J. M., Rissel, C., & Flood, V. M. (2011). Effectiveness of an Early Intervention on Infant Feeding Practices and “Tummy Time”: A Randomized Controlled Trial. Archives of Pediatrics & Adolescent Medicine, 165(8), 701.
Wen, L. M., Baur, L. A., Simpson, J. M., Rissel, C., Wardle, K., & Flood, V. M. (2012). Effectiveness of home based early intervention on children’s BMI at age 2: randomised controlled trial. BMJ, 344, e3732
WHO. (1997). Obesity: preventing and managing the global epidemic: Report of the WHO Consultation. Technical Report series 894. Geneva : WHO.
WHO. (2001a). Evaluation in Health Promotion. Principles and perspectives. Copenhagen, DNK: WHO Regional Office for Europe.
WHO. (2001b). Global strategy for infant and young child feeding. The optimal duration of exclusive breastfeeding. Fifty-fourth World Health Assembly. Retrieved from http://apps.who.int/gb/archive/pdf_files/WHA54/ea54id4.pdf.
WHO. (2012). Obesity and Overweight. Fact sheet 311. Retrieved from http://www.who.int/mediacentre/factsheets/fs311/en/.
Wijga, A., Scholtens, S., Bemelmans, W., Jongste, J. D., Kerkhof, M., Schipper, M., . . . Smit, H. (2010). Comorbidities of obesity in school children: a cross-sectional study in the PIAMA birth cohort. BMC Public Health, 10(1), 184.
Winkler, E., & Turrell, G. (2010). Confidence to Cook Vegetables and the Buying Habits of Australian Households. Journal of the American Dietetic Association, 110(5, Supplement 1), S52–S61.
Wolfenden L, Wiggers J, Tursan d’Espaignet E, & Bell A C. (2010). How useful are systematic reviews of child obesity interventions? Obesity Reviews, 11(2), 159–165.
Young, L., Anderson, J., Beckstrom, L., Bellows, L., & Johnson, S. (2004). Using social marketing principles to guide the development of a nutrition education initiative for preschool-aged children. Journal of Nutrition Education and Behavior, 36(5), 250–257.
Ystrom, E., Barker, M., & Vollrath, M. E. (2012). Impact of mothers’ negative affectivity, parental locus of control and child-feeding practices on dietary patterns of 3-year-old children: The MoBa Cohort St6udy. Maternal & Child Nutrition, 8(1), 103–114.

262

263
Appendices

264
Appendix 1: Recruit-1 form for consenters to a later contact

265

266
Appendix 2: Recruit-1 form for non-consenters to a later contact

267
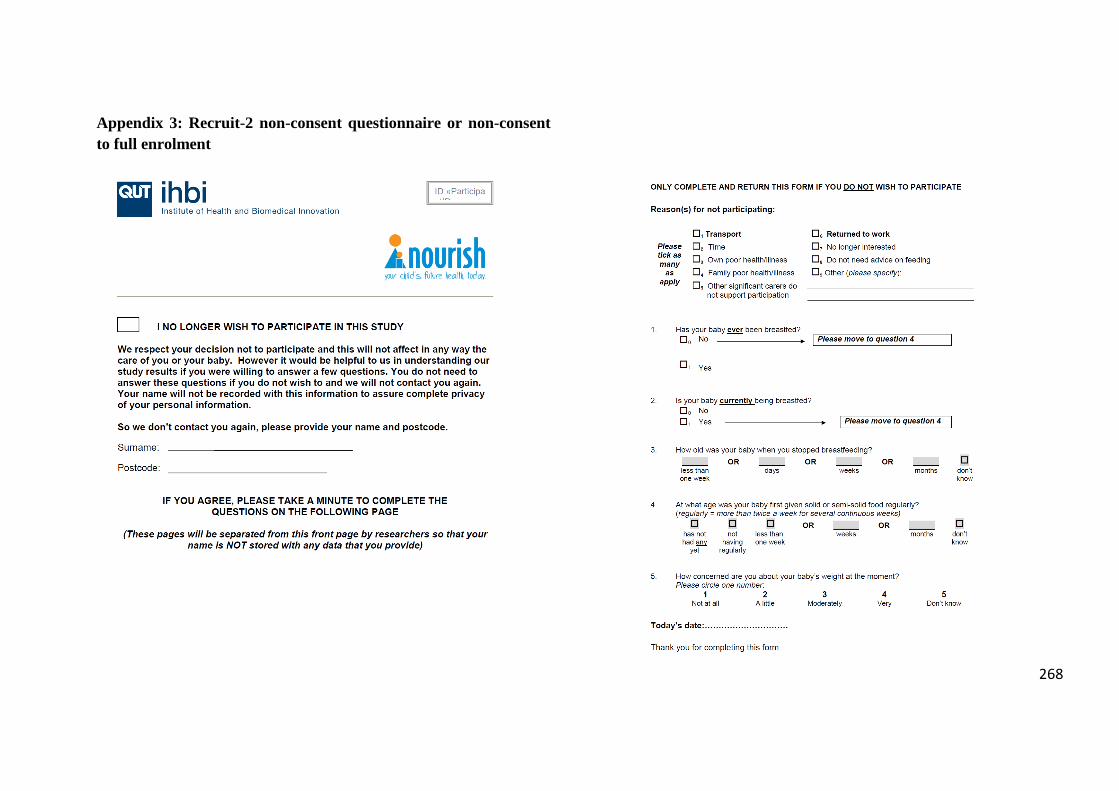
268
Appendix 3: Recruit-2 non-consent questionnaire or non-consent to full enrolment

269
Appendix 4: Extracts of Assessment T1 questionnaire = baseline data collection for full enrolment of consenters at Recruit-2

270

271

272

273
Appendix 5: Extracts of T3 Assessment questionnaire

274

275

276
Appendix 6: Attendance log

277
Appendix 7: Group session rating for Module-1 or session monitoring book

278
The grid to rate sessions 2-6 had the same structure than for rating session 1. However,
rating Coverage of Key Content slightly differed between sessions and is reported
hereafter.
Session 2
Session 3
Session 4

279

280
Appendix 8: Parent feedback survey

281

282

283
Appendix 9: Planned message content to cover at specific session
Module-1
“Learning to like, liking to eat” Contact with new foods.
Positive exposure
Module-2 “Parent provides, child decides”
Positive feeding environment
Ses
sio
n 1
Program introduction: “learning to like, liking to eat”: the way we feed young children affects the foods they will like and their health. “parents provide, children decide” : listen to and trust your child. Plenty of exposure to healthy foods. Limit exposure to unhealthy foods. Offer new foods 10–15 times. Be neutral.
Toddler growth and development. Toddlers are learning to be independent, to do things for themselves. Weight gain slows down as compared to that of baby, and appetite is smaller. The amount they eat changes each day. Learn their hunger and fullness signs. Trust these, don’t force feed or reward eating. Parent provides, child decides.
Ses
sio
n 2
Parenting styles and feeding practices: feeding is parenting. Provide a secure base for infant to explore. Follow your baby’s cues, not your own expectations. Offer praise for tasting and touching new foods, be encouraging but not pushy. Make feeding fun, but not a game. Be safe, but not over anxious. Allow time for feeding.
Toddler nutrition. Offer your toddler a variety of foods from the five core food groups every day. Limit “extra” foods and avoid foods that present choking risks. Don’t focus on amount consumed. Set pleasant mealtimes (5–6 every day, toddler stays at table, turn off TV, let your child choose how much, have meals that the whole family likes, eat with toddler, don’t force or bribe, use and praise table manners).
Ses
sio
n 3
Healthy growth and feeding for babies. Developmental readiness for solids. Nutrient needs, texture tolerance, learning to like new food. Solids introduction around 6 months, healthy family meals from 12–15 months.
Parenting styles and feeding practices. Warm and independent parenting means more pleasant mealtimes. Common problems can be managed with warm and independent parenting. When faced with a problem, try to think of answers that support warm and independent parenting.
Ses
sio
n 4
Feeding infants: the feeding relationship. Child innate preferences, variable intake, child needs to learn to like new tastes, and needs support to try new things. Feeding relationship is a blend of parenting and feeding.
Feeding toddlers. Toddlers meals, planning snacks, managing dessert, managing treats, snacks at home, snacks on the run, dessert ideas, and quick easy meals. Snacks and dessert are not treats or rewards. Quick food doesn’t have to be unhealthy.
Ses
sio
n 5
Feeding infants: healthy and safe feeding skills. Trust, offer healthy meals, limit unhealthy foods, re-offer new foods, and role modelling. Rewards of sensitive feeding. Safe food handling. Safe expressed breast milk, and infant formula preparation.
Food refusal and food fads. Food refusal is normal in toddlers. Food fads are also common. It is okay to have some dislikes. Offer a range of healthy foods from all five food groups.
Ses
sio
n 6
Planning for the future: sessions review, management of food refusal, division of responsibility.
Program overview and planning for the future. Getting some help. Parental concerns about weight and eating. Be a good role model. Active play. Food away from home. Nutrition in child care.

284
Appendix 10: Management of process data files
Table 34: Data file management to address reach process component
Measures Collected data
Primary data entry
Data access PhD candidate observations What has been done
Reach at Recruit-1 and Recruit-2
Participant socio-demographic characteristics (Appendices 1,2,3)
Merged Access Tracking databases
Recruit1_R2_ALL_2011April29.sav
1) Approached mothers who declined later contact and did not provide any information were not entered into the database. 2) Data for Recruit-2 consenters and non consenters to full enrolment were not recorded in the same database: items related to breastfeeding were inconsistently coded between consenters and non consenters questionnaires. 3) Inconsistent coding for one Brisbane hospital (Mater Hospital): specific codes were used for 387 participants of cohort 1 (2008 recruitment) that distinguished participants from private (218) and public (169) sectors, conversely another code that did not make such a distinction was used for 123 participants during the same recruitment period and 409 participants during the 2009 recruitment (cohort 2). 4) It was not possible to retrieve infant age at second contact
1) Count by cohort and city of approached eligible mothers who did not both consent to later contact and provide any information, was based on figures extracted from the Brisbane research officer’s spreadsheets with the assistance of the research officer. Figures were then cross checked with the Adelaide research officer. 2a) Recoding of breastfeeding item to standardise Recruit-2 consenters and non-consenters answers. 2b) Data files merged into one unique file based on participant Identification number. 3) Recoding of Mater Hospital using one unique code.
Reach at Module-1 and 2 delivery
Participant and infant characteristics at Time 1 (baseline) and 2 (Appendices 4, 5)
Unique SPSS database dedicated to effect evaluation
SectionA_T1_2010Nov11.sav SectionB_2010August19.sav SectionC_2010August20.sav Sect_I_T1_2010May28.sav SectQ_T1_2010July01.sav SectionA2_2010Oct13_T2.sav SectB_T2_2010Nov19_Include
sText.sav SectionC2_2010October28.sav Section_Q_T2_IncludesText_2
010Nov15.sav
Attendance per participant
Merged Access tracking databases
Both Modules & Cohorts_attendance with Gp ID.sav
1) Attendance data was stored in a separate file to that of participant characteristics. 2) Attendance data was missing for 21 participants in this file.
1) Files merged based on participant ID with relevant participant characteristics. 2) Retrieval of attendance information for the 21 missing records from hard copies.

285
Table 34 continued
Measures Collected data
Primary data entry
Data access PhD candidate observations What has been done
Reasons for not participating
… at Recruit-2
Merged Access tracking databases
ReasonsForNonConsentR2.sav Non-participation reasons recorded in a separate file to that of participant characteristics.
Relate reasons to selected characteristics of participants.
… at any informa-tion session
Non-merged tracking databases
Adelaide-WithdrawalreasonInfo noattendreason181110.xls Reasons for non attendance _M1 Bris 2010Dec01.xls. Reasons for non attendance _M2 Bris 2010Dec01.xls.
1) Inconsistent data entry between cities. 2) “Other” responses are the most cited reasons and are explicated in the notes taken by research officers.
Response recoding. 1) research officer notes held in the tracking database were merged into a unique Word document table. 2) as the notes were not exclusively related to attendance, to retrieve reasons, a search on key words by reading was undertaken first to select relevant key words. 3) automatic search using search function in Word was then performed on: “not participating”, “no longer wish to participate”, “not be attending”, “not attending”, “no longer attend”, “withdraw”, “withdrew” and “info Non attendance letter”. This search allowed expliciting most of the “other” responses that were in turn recoded following the standardised code used in the “attendance logs” but other categories were also created.

286
Table 35: Data file management to address adoption process component
Measures Collected data Primary data entry
Data access PhD candidate observations
What has been done
Participant engagement
Attendance log at each session (Appendix 6)
See Table 34
Participant satisfaction
Satisfaction with staff and sessions
SPSS databases specifically dedicated to address participant feedback
“Other” difficulties, entered as text into Word documents
Mod1 Both Cohorts Mod2 Cohort 1 Only Parent Feedback.sav Mod2 Cohort 2 ONLY Parent Feedback
2010.sav
1) Separate files 2) No connection with Attendance logs
Files merged based on participant ID with relevant participant characteristics and attendance.
Participant perception of usefulness
Usefulness of information, information strategies, for knowledge development and for behavioural change (Appendix 8)
Participant difficulties
Suggested list of difficulties + other
AdelAdditionalResponsesParentfdbk_C1M1.doc BothSitesParentFeedback 2009_C1M2 AND C2 M1.docx BothSitesParentFeedback_2010_C2M2.doc
1) List of comments made by participants entered following an inconsistent layout as text on separate word documents (either question by question, or participant by participant) (see Appendix 11)
Recoding of “Other” difficulties according to theme structure used to re-code reasons for non-attendance (see Table 34.)
Open-ended questions on things most disliked about NOURISH
Word documents
AdelAdditionalResponsesParentfdbk_C1M1.doc AdelParent Feedback Form - Q11_C1M1.doc BothSitesParentFeedback 2009_C1M2 AND C2 M1.docx BothSitesParentFeedback_2010_C2M2.doc BrisParent Feedback Form - Q11_C1M1.doc
Open-ended questions coding: first, similar sentences were screened by manual colour coding via highlighting. Key words from similar sentences were then grouped under a specific theme. A thematic list was thus obtained with corresponding key words. This list was re-examined against an existing list obtained from non-attendance reasons and Q8 items. And themes were rearranged into a final list. A second reading of all participant responses was conducted to check against this final list and a final manual recount done. Whenever the same colour-code was repeated for a participant, the colour code was counted only once (see Table 36).

287
Table 36: Q11 open-ended question coding
Participant comments summarised or “exactly reported” First coding (counts) Second coding
Theoretical, “unrealistic”, “basic”, “light”, “teach nothing new”, “limited”, “common sense – very general”. Nothing new, basic content,
theoretical, unrealistic (25) Content not
adapted to needs Baby age was younger or older in relation to the relevancy of the information – not good timing of
some content, e.g. expression of breast milk was covered in session 5 of Module 1 rather than at
first session.
Wrong timing of content
delivery with regards to needs
(5)
“Information could have been condensed”, “Time consuming”, “Time commitment required”, “Too long information
sessions”, “Too many sessions”, “Slow moving”, “Shorter sessions”, “Maybe some of the info could have been
presented in 5 sessions instead of 6”, “I think we could have crammed more info into less time”, “The session times
were too long for the content covered”, “I feel we could have covered more topics quicker”, “Length of session and
program”, “Some sessions could have had more content”, “Felt the information could have been combined into 3–4
sessions”, “Was a big time commitment to go to 6 sessions”, “Regular 2 hour time commitment (plus travel) kept me
from being able to be present and other commitments”.
Time required, sessions too
long (18) Time required
“Found large parts of information a little dry to sit through-when there was lots of information in one session”,
“Sessions need to be weekly”.
Timing of content delivery
(12)
Session time clashed with nap time. “Waking child to attend.” “1–3 pm is generally sleep time.”
“Inconvenient session time.” Difficult when working.
Session time difficult with nap
time or work (29)
Inconvenient
session time
“Repetition”, “Redundant”, “Repetitive”, “Repeated”, “Most weeks had similar content”, “Went over some of the
same things again and again”, “Reviewed things too much”. Repetitive content (42)
Repetitive content
across sessions
“Coming with a baby”, “I had difficulty listening to all that was said as my baby couldn’t last the session with the
child carer”, “Trying to look after a baby who was unsettled and needed to sleep as well as listen”. childcare offered
during group information sessions, “Difficult to hear, to concentrate due to baby” Baby presence (11)
Inconvenient room
with respect to
access

288
Table 36 continued
Participant comment summarised or “exactly reported” First coding Second coding
Inconvenient room to fit mothers and babies. “Sitting around a board room table wasn’t the most child
friendly”, “Cramped room”, Car park issues. Inconvenient venue to fit
mothers and babies or car
park (16)
Venue
appropriateness for
both child care and
mother
concentration
Distance to travel. “Driving home taking over 30 minutes so meal times were rushed and difficult – tiring!” Inconvenient session location
(10) Self-organisation to
attend “Finding suitable childcare”. Finding childcare (1)
“Felt I wasn’t doing anything right”, “Made me feel even worse”, “Felt frustrated and patronised”, “Felt that I was
failing my child”, “I felt like I was being talked down to”, “The way in which the participants were ‘quizzed” each
week about previous sessions”.
Feeling of being patronised (7)
Facilitator session
management and
rapport “Facilitators were not parents”, “Teaching style – at time little authoritative teaching style”, “Presenters not
experienced parents”.
Facilitators were not parents,
authoritative teaching style (6)
Management of discussion. “Getting off track with discussion” Getting off track with
discussion (5)
Group composition: number of people in the group (too large or too small). Other parents.
“Parents opinions”, “Dominated discussions”, “Having to attend the same group”. Other mothers (11)
Group
composition
“No cup of tea”, “No refreshment”. No refreshment (2) No refreshment

289
Table 37: Data file management to address Implementation process component
Measures Collected data
Primary data entry
Data access PhD candidate observations What has been done
Delivered dose
Session monitoring (Appendix 7)
SPSS databases specifically dedicated to address implementation component
Mod1W1BothCo&Fac SessQual.sav Mod2FacilitatorSession Evaluation 2010.sav AdelCo&FacSessQual. sav
1) Data was entered into separate files for Brisbane and Adelaide that were meant to monitor group information delivery per information group. 1a) coding inconsistencies of information group identification between cities: in Adelaide, group coding was based on the location of the information group session and did not distinguish information groups between cohorts. 1b) coding ambiguity with respect to session cancellation; difficult to know whether the absence of record was due to missing data or a session cancellation, or corresponded to a merging of sessions. 2) No connection between information group and participants.
1a) Group re-coding for consistency between cities: new coding allows distinguishing of each information group. Re-coding of Adelaide group Id consistent with Brisbane 5 digit codification: 1st digit: cohort and city (6 – cohort 1 Adelaide; 5 – cohort 2 Adelaide; 8 – cohort 1 Brisbane; 7 – cohort 2 Brisbane); 2nd digit: module; 3rd digit: group; last 2 digits: location. Use of “booking sheets” held by research officers when organising group sessions: records independently kept in Excel spreadsheets. Adelaide Group ID_M1+2.xls + BookingSheets_Cohort1_Module1.xls + Cohort1_Module2bookings.xls + Cohort2_Module_2_bookings.xls + Mod1_Cohort2a_bookings.xls + Mod1_Cohort2b_2009_bookings.xls. From these files 1b) missing data of session delivery was retrieved. In case of contradictory information between resources, data was checked against hard copies of attendance logs. 2a) Connection between recoded information groups and participants was made. 2b) Data files merged
Received dose
Attendance log for each session (Appendix 6)
Merged Access Tracking databases
Both Modules & Cohorts_attendance with Gp ID.sav
1) Data missing for 21 participants in attendance file. 2) Due to ambiguity with respect to session cancellation (see above) it was not possible to determine whether some participants received the full dose in 5 sessions rather than 6.
1) Retrieval of attendance information for the 21 missing records from hard copies. 2) From booking sheets (see above), it was ascertained that some information group sessions were merged (so these groups received the full dose in only 5 info sessions ).

290
Table 37 continued
Measures Collected data
Primary data entry
Data access PhD candidate observations What has been done
Fidelity Session monitoring (Appendix 7).
SPSS databases specifically dedicated to address implementation component
Mod1W1Both Co&Fac SessQual.sav Mod2FacilitatorSession Evaluation 2010.sav AdelCo&FacSessQual.sav
1) Data presented per group ID and do not relate to participants of groups. 2) Data presented per session and not per assessed item. 3) Data presented separately between facilitators and co-facilitators.
1) Relate groupID to participants in order to use appropriate fidelity rating for participants. Difficulty was that participants could change their information group. Use of “booking sheets” held by research officers to allocate group fidelity scores to participants. 2) Data reorganisation per item and category of item across Modules. 3) Data reorganisation to address rating agreement between facilitators and co-facilitators.
Facilitators difficulties
Word documents
Adel….Additional info_M1C1.doc Bris …Additional info_M1C1.doc Facilitators comments.doc
1) List of comments made by facilitators entered as text following an inconsistent layout into separate Word documents (either session by session, or by information group; inconsistent report of commentator). 2) For Adelaide, no distinction was made between modules and cohorts.
1) Comment source retrieval. 2) Open-ended questions coding: consisted first of screening similar sentences by manually colour coding via highlighting. Key words from similar sentences were then grouped under a specific theme. A thematic list was thus obtained with corresponding key words that were then counted. Whenever the same colour-code was repeated for a group, the colour code was counted only once. (See Table 38).

291
Table 38: Coding of facilitator and co-facilitator comments on difficulties and challenges
Facilitator or co-facilitator comment summarised or “exactly reported” First coding Second coding
“Talkative group and difficult to stick to session content with the frequent questions”, “Chatty group”, “Lengthy discussions”, “Adhering to time”.
Time management Session time management
“Pace too slow” Pace too slow
“Mum’s would be having own conversations when other Mums were talking to facilitators or when facilitator talking”, “One mum was quite vocal in the group”, Participant raised issues that were unrelated to the NOURISH purpose.
Group management
Group management and rapport
“Some parents attending for the first time at session 3 disrupted group process slightly”. Difficulty with some participants
“Quiet personalities”, “Difficult to generate discussion with small group”, “Potential language barrier with one Mum”.
Interaction difficulty
“Very busy mothers [...] did not really take the time for the social chit chat at the end”. No time for social time
“Large group”. Large group
“Difficult to gather feedback at time”. Feedback at time
“Poor attendance”, “Low attendance rate”, “Only 1 mother turned up”. Poor attendance
Equipment issues. Equipment issues Physical and educational resources
“Power point (formal) seems a bit inappropriate for small group”. Inconvenient educational resource
“Room changes”, “Difficulties with parking”, “Parents got lost”. Venue accessibility
“Room too small”, “No air con”. Inconvenient room Inconvenient environment
“Babies very vocal”, “Older children – lots of crawlers”, “Very busy toddlers”, “General noises of babies”.
Baby presence
“Psychologist not present”. Psychologist absence Co-facilitator absence

292
Appendix 11: Participant open-ended responses to Question 11 of the Parent Feedback Questionnaire
Note: This appendix reproduces comments as they have been originally entered in Word documents: spelling or coding mistakes have not been modified. However, to preserve participant confidentiality some words have been replaced by X.
ADELAIDE Cohort 1, Module 1
Group: 9101 Individual: 6529 •Time required to attend sessions (stressful with baby’s routines) •Too much repetition – felt each session should have been shortened or number of sessions decreased •Some advice received good in theory but impracticable (or not age-appropriate) •Presenters not experienced parents Group: 9104 Individual: 6460
Nothing
Group: 9104 Individual: 6346
Car parking
Group: 9104 Individual: 6378
Nothing it was all good
Group: 9104 Individual: 5403
Repetition of info
Could have been condensed a bit
Group: 9103 Individual: 6403
•Sessions were too long
•Felt like all we do in Country X is wrong
•Too many restrictions on what we feed baby
Group: 9103 Individual: 6085
Enjoyed every session
Group: 9103 Individual: 6091
Car parking at Marion
Group: 9103 Individual: 6518

293
Sometimes it was hard to contribute as much if your child was a bit younger and hadn’t started solids
Group: 9103 Individual: 6100
The discussions sometimes were a bit too long than necessary. Parents tend to talk over the speaker and go on too much about general comments
Group: 9103 Individual: 6128
Some information was a bit repetitive occasionally. More research to support principles – but that doesn’t appeal to all so perhaps references
Group: 9105 Individual: 5389
Sometimes a little repetitive
Group: 9105 Individual: 5339
Parking
Group: 9105 Individual: 5348
Sometimes felt that I was failing my child as he won’t really eat vegetables. Is eating a little better now he can eat finger foods
Group: 9105 Individual: 5298
I was overseas for several sessions
Group: 9105 Individual: 5393
Some advice was unrealistic I felt – or maybe idealistic (something to aim for I guess)
Also some advice conflicted with other advice (which is okay, but as there is so much advice given it just adds to the confusion)
Group: 9105 Individual: 5758
Session times were difficult (baby missed nap times)
Group: 9105 Individual: 6072
It was sometimes difficult to concentrate on having baby there but it was very helpful being able to bring baby because otherwise would have been difficult to attend
Group: 9105 Individual: 5038
Time consuming (for a busy lifestyle)
Group: 9103 Individual: 5122
Getting off track with discussions but sometimes it was very interesting
Group: 9103 Individual: 6366
The amount to weeks it ran for – maybe ½ hr longer each session – so fewer weeks

294
Group: 9106 Individual: 5430
Nothing!
BRISBANE Cohort 1, Module 1
Group: 81103 Individual: 0219
Other mothers’ strong opinions made me feel less confident and judged as a bad parent.
Group: 81103 Individual: 0825
Sometimes there was lots of repetition about some subjects.
Group: 81104 Individual: 0197
Sometimes a little repetitive session to session.
Group: 81104 Individual: 0245
Session time not suitable once back at work.
Group: 81104 Individual: 0513
The session times were too long for the content covered. I feel we could have covered more topics quicker.
Group: 81108 Individual: 0996
Unfortunate timing of group made it difficult to get my baby to nap on the day of NOURISH – a bit disruptive.
Group: 81110 Individual: 0205
Parking.
Group: 81110 Individual: 0919
Kind of redundant, not too much new info. Pretty much everything I was already doing.
Group: 81111 Individual: 0301
The first session was a little light on for information so felt it was going to be slow but from there everything picked up.
Group: 81111 Individual: 0355
Inconsistent room location.
Group: 81111 Individual: 0417
The facilitators are not parents.
Group: 81112 Individual: 0905

295
Having to travel from northside of Brisbane each time, although the education I received outweighed the negative.
Group: 81112 Individual: 0997
All the other babies in the group were a little ahead on eating.
Group: 81202 Individual: 0056
Fixed time sessions, which is sometimes hard to meet. Not much can be done about that, I know!
Group: 81202 Individual: 0890
Sessions were very repetitive and not all sessions contained new information.
Group: 81202 Individual: 1009
Length of sessions and program
Group: 81206 Individual: 0090
Safe expressed breast milk handling prep/infant formula prep. Only because it was irrelevant at the time. Most participants have probably been doing them for months.
Group: 81206 Individual: 0306
Some sessions were a bit repetitive with the info, but not enough to not enjoy it.
Group: 81209 Individual: 1316
Some things were repeated a lot.
Group: 81209 Individual: 1160
Repetition of information, too many sessions for the amount of information provided.
Group: 81209 Individual: 478
Some sessions could have had more content.
Group: 81209Individual: 30
Probably prefer if it didn’t run into December.
Group: 81207 Individual: 285
I felt the program didn’t teach me anything I didn’t already know, so it was a bit of a waste of time. I felt the sessions were a bit patronising and aimed at people with no idea and who don’t do any research themselves. I felt the opinions and teachings were a little dated and the staff tended to give ‘opinion’ on some things rather than fact and went against some of the World Health Organisation’s information.
Group: 81103 Individual: 894
Didn’t dislike anything about Nourish, think it is a valuable and unique program

296
On a couple of occasions I experienced some resentment/hostility from mothers who chose to formula feed their infants, felt these women need to be educated that breast milk is a superior form of nutrition (scientific fact!). I realise a small percentage of women cant breastfeed for good medical reasons but most choose formula as a result of lack of knowledge and support, Nourish should address this pre-natally to prevent problems such as obesity and lack of parental attachment later on (post-natally).
Group: 21206 Individual: 4
Too much repetition of the main messages – felt the information could have been combined into 3-4 sessions. Was a big time commitment to go to 6 sessions.
Group: 81110 Individual: 420
Regular 2 hour time commitment (plus travel) kept me from being able to be present and other commitments
Session attended could have been condensed – a lot of repetition in presentation
Group: 81103 Individual: 856
Repetition
Group: 81108 Individual: 354
Often found that the info – both in the booklet and in the session was very repetitive and sometimes very basic which meant that it became boring at times. I would have preferred more comprehensive/detailed information
Sometimes felt like I was being talked down to
Group: 21206 Individual: 295
Information sessions – location and time not convenient and I found that a 2 hour session plus 20 minutes travel time each way took up too much of my time.
Group: 81111 Individual: 388
The mater car parking is horrendous (awful).
Group: 81103 Individual: 423
The information session I attended was marred by opinionated mothers who came across as “knowing best”.
Group: 81207 Individual: 1320
My sessions were changed from Thursday 10-12 to Monday 1-3
Babies get fussy in the arvo
Sessions too long – need to be weekly
Group: 81205Individual: 0472

297
The repetitive nature of the information, there are only so many times you need to hear about parenting styles. The number of sessions could have been reduced and the information condensed.
The order in which the info was presented eg. Storage of breast milk in session 5 while for most babies are between 6 to 8 months of age. This is needed immediately after birth.
The way in which the participants were “quizzed” each week about previous sessions (the style of the quizzing)
Group: 81207 Individual: 0422
The set up. We all had little babies, and there was no room to put them. We had to sit behind desk and was uncomfortable with a baby. They need to cater for the kids, as everyone brings them.
Group: 81201 Individual: 0435
Very repetitive.
Group: 81201 Individual: 0251
Mothers having their own conversations during the sessions, distracting staff and other mothers.
Group: 81201 Individual: 1171
Sometimes a little repetitive.
Group: 81104 Individual: 0179
The timeslot of 1-3 pm is hard to fit sleeps around.
Group: 81110 Individual: 0046
The fact that I didn’t get to all the sessions due to unforeseen circumstances
Both sites Cohort 1 Module 2 AND Cohort 2 Module 1
ID1414 – the amount of information provided was pretty limited considering the length and number of sessions. The facilitators often could not answer questions – although I was referred to other sources
ID1510 – some repetition in information. Parking
ID1410 – Quite a lot of repetition but understandable given a lot of mums didn’t come every week
ID1493 – Found most weeks had similar content and sessions too long for young babies

298
ID1591 – Sometimes a little repetitive, but then, that can be a help sometimes too
ID1598 – [participant wrote: “see Q13”]
ID1536 – Time slot difficult at times due to need of afternoon sleep for bub
ID1557 – Just session time – 1pm prime nap time @ our house!
ID1469 – Coming with a baby
ID1573 – Was a bit repetitive
ID1444 – Sometimes I felt the pace of content delivery was a bit slow
ID158 – session time -> after lunch 1pm -> due to my son’s sleep time
ID894 – Some other parent’s opinions that I couldn’t address. Some parents dominated the sessions
ID235 – Second module seem to cover what was covered in first module so didn’t provide as much value/learning
ID219 – In the first sessions (when the children are 6 mths) I felt like I wasn’t doing anything right. Being a first time parent was stressful
ID852 – Sometimes wanted black and white answers when probably not available. More suggestions/discussions. Large group in info sessions from 9mths to 15mths which was when I had the most problems/concerns
ID504 – not flexible on hours. E.g. if sick difficult to arrange different session
ID 1487 – at first the thought of attending sessions on the weekend was a bit off putting, but the first one was so good, I was happy to keep coming!
ID 1542 – Somewhat repetitive but given my “baby brain” it was probably a good thing!
ID 1473 – Small groups could be bigger
ID 368 – the time clashed with nap time
ID 513 – That more detailed content couldn’t be covered within the time frame. A little repetitive.
ID 470 – I had to travel to Kelvin Grove to attend – it was easier when I attended at Keperra as I live at X, though I understand it is hard to offer a variety of locations when there is not enough participants.

299
ID 1029 – Had difficulty finding a time and location that suited my work commitments.
ID 1322 – Session times
ID 411 – That the info sessions are ending!
ID 30 – Was maybe a little too repetitive from session one.
ID 301 – The distance from home.
ID 1490 – Inability to attend further sessions due to time restraints (work/family)
ID1009 – Waking child to attend
ID 996 – Distance from home, Child care (though now I am more confident)
ID 4 – Too much repetition, 6 sessions is a big commitment – could have been condensed into 4 sessions.
ID 472 – Session times.
ID 1622 – Bit repetitive but understand why. Logistics of trying different foods at beginning a little difficult as easier making one large batch rather than lots of small.
ID 1696 – Sometimes difficult to hear what is being said or participate in conversation due to kids/babies.
ID 1726 – Difficulty managing cranky baby while trying to listen.
ID 1761 – Very repetitive.
ID 1706 – Not being able to have a cup of tea during the session!!
ID 257 – Session times.
ID 46 – Nothing – actually the fact that my son hated the childcare and got really upset the two times I tried it!
ID 388 – Sometimes I felt that more information could fit into each session.
ID 355 – The second lot of sessions were nowhere near as helpful and informative as the first block. It felt more of a Mothers group catch up than info session with dietician and psychologist.
ID 1316 – Some things were a little repetitive.
ID 1676 – Sessions should have been condensed down – went too long,

300
ID 1605 – Session times often clashed with nap times after my daughter changed her sleep habits.
ID 6346 – There is no more modules.
ID 5801 – Some of the info was a little repetitive.
ID 5430 – Initially finding suitable child care so that I could attend the sessions.
ID 5038 – Time consuming.
ID 5389 – Inconvenient location to attend.
ID 5405 – It was difficult being the only parent with a child who was refusing food. It made me feel even worse, like there was something “wrong” with my parenting or my child. Even though I know I am a caring parent.
ID 5758 – Late start times and late finishes.
ID 5348 – That I had to travel so far for the sessions, but they were both it.
ID 5122 – Too much repetition.
ID 6318 – 2nd Module – 1st session. I was really disappointed in the first session. I appreciate that it was a re-cap, but there didn’t seem to be any info that I didn’t learn from module 1, or didn’t learn along the way. I also understand that children can be a distraction – hence the childcare, but I found it more distractive having the kids next door and trying to work out who’s baby was crying.
ID 6378 – I felt like the information provided was common sense...well to me anyway. I understand that it may have been very helpful to other parents. However, the parenting techniques/styles and info about food/feeding is what I already practice as a parent and was how I was raised by my Mum.
ID 6518 - Maybe some of the info could have been presented in 5 sessions instead of 6.
ID 5403 – Some repetition.
ID 6089 – Info – sometimes a bit basic. Teaching style – at times a little authoritative.
ID 6667 – Sometimes the ‘crowded’ space in the rooms.
ID 6661 – Hard to concentrate on the info and not enough written in the booklet, compared to sessions.

301
ID 7214 – Presentations were a little one dimensional – OHP study of the booklet. Presenters were not parents – shouldn’t matter but it did! The room was too small and stuffy.
ID 7213 – Went over some of the same things again and again. Sometimes felt there was nothing I learnt that I didn’t find in books already (from other Mums/from CYH group).
ID 6815 – Since there was nothing I really disliked, the only thing I can say is that I noticed as it went along that 1-3pm is generally sleep time, so lots of babies were restless and grizzly at times, including mine!
ID 7171 – The room at WCH was too small!
ID 6669 – Group room too small for numbers; information too repetitive, 4 sessions would have been enough.
ID 7217 – Parking at location – WCH.
ID 7169 – Small room.
ID 6804 – Parking is rotten at WCH.
ID 7038 – Would have preferred it to be run every week rather than fortnight – would be easier to remember previous sessions.
ID 7095 – Much of the information provided was very basic and I often felt frustrated and patronised throughout the 6 sessions.
ID 7198 – Would sometimes have like more specific ideas/help as it was very general information. I understand that they need to be general but as a first time Mum, a bit more guidance would have been helpful at time. Sometimes reviewed things too much.
ID 7116 – Some of the content of the sessions was very basic. I would be interested on more in-depth information about feeding children.
ID 7115 – Nothing (just having to wake son for getting to sessions on time – always late). Great theory – just making it happen in reality is not always as straight forward – but it is useful to work towards.
ID 6998 – I was sorry that my baby was only 3 months old at the beginning – wished we were ready to start solids, to participate more in homework/things to try at home.
ID 6976 – Time at 1pm – too early to have lunch before setting off. Better time would be in the morning or a little later, say 2pm?
ID 7100 – Some of the things are a bit repetitive.

302
ID 7105 – The commitment – but fine really!
ID 6967 – Too much theory and not enough practical information i.e. healthy recipes, food storage tips etc.
ID 6997 – Nothing though tried hard thinking about it. Wish there’s more of it!
ID 7108 – Late afternoon finish – driving home taking over 30 minutes so meal times were rushed and difficult – tiring!
ID 7141 – Time of day of sessions – nap time.
ID 6966 – Not everything is practical when trying at home. But at least you know the theory.
ID 6961 – Some repetition – but it wasn’t a problem ☺
ID 6100 – Sometimes the discussion got a little long winded. Everyone wants to talk about their child of course, but we tend to get off the topic all the time. I think we could have crammed more info into less time.
ID 6918 – The sessions were not run at suitable times for me – i.e. need to be after working hours.
ID 1670 – That it was in the afternoon – harder time to keep baby happy – and in a small room without fun things for babies to look at or explore.
ID 431 – Some parents dominate discussions.
ID 1760 – Sitting around a board room table wasn’t the most child friendly / non-intimidating setting. We had a small group, so a more relaxed setting would have been more conductive to chatting etc.
ID 7160 – Inconvenient session times; difficulty parking near WCH (did not want to pay car park fees as well); cramped room; no refreshments.
Both sites cohort 2, Module 2
ID 1591 – Sometimes it was a bit repetitive. Perhaps could’ve condensed the information into less sessions.
ID 1622 – Occasionally repetitive but not as much as session 1, otherwise nothing.
ID 1726 – very hard to fault the program & quality of presentation. Honestly can’t think of anything.
ID 1536 - Not much!

303
ID 1578 – Nothing! I wish it covered all areas of parenting other than healthy eating – I really enjoyed it.
ID 1706 – Some information was very basic.
ID 1598 – Module 2 was very repetitive and mostly re-hashed the Module 1 information. I learned very little new information. The sessions could easily have been condensed into 3-4 sessions only, as they never went for the full 2 hours. As most Mums are back at work by this stage, it became extremely onerous and a major effort to get to 6 sessions.
ID 1765 – No weekend session close to my home.
ID 1760 – Sometimes slow moving, easy to get stuck focussing on discussions about individual participates & their situation.
ID1670 – I had difficulty listening to all that was said as my baby couldn’t last the session with the child carer
ID1685 – People not turning up
ID6667 – Finding a car park at WCH and trying to look after a baby who was unsettled and needed to sleep as well as listen! This only applied first module when baby was 3-5 mths – I’d recommend shorter sessions.
ID 7141 – Can’t think of any dislikes
ID 6997 – Not that I can think of any
ID 6918 – A bit repetitive in parts
ID 6998 – Found large parts of information a little dry to sit through – when there was lots of information in one session.
ID 7108 – The fact that I wasn’t able to attend all the sessions!
ID 6815 – Nothing – I would’ve been keen to stay after sessions & have more social time but mostly people had to go. A reality of busy lives!
ID 6961 – Occasional repetition of information but v. minor.
ID 7038 – That it’s not continuing
ID 6966 – Bit repetitive
ID 7213 – For Module 2, I was in a small group and one woman dominated every session and was very opinionated and a little aggressive. It made me hesitate about giving up my time to come.

304
ID 7214 – Overheads! Good to know unrelated (i.e. tell us again) goals of the study – I think I forgot!!!
ID 6669 – Discussions could sometimes get away from intended topics.
ID 7198 – Often I knew so much of the info given so the ratio of time spent getting to & from the session & being at the session versus new info learned was very low. This made it sometimes a chore to go rather than new and informative.
ID 7160 – The sometimes poor attendance of parents, this is a disappointment more than anything.
ID 6804 – having to attend the same group – several things came up over the program unexpectedly & had to miss a few sessions.
ID 6976 – Childcare needed to attend second half (even though childcare at WCH was very good!)
ID 1605 – Time commitment required. I think perhaps internet based might have been more achievable for me – something I could do at odd hours due to work etc

305
Appendix 12: Data selection for analyses of each process component
Table 39: Data selection to explore reach at Recruit-1, first stage of the enrolment phase of the NOURISH research programme
Selected data from Recruit-1 forms
Justification for selection Re-coded scales or units of measurement
Mother age For demographic comparison with general population + see Table 2 (Continuous, years)
Mother ethnic origin Aboriginal and Torres Strait Island people are twice as likely as non indigenous Australians to be obese (Gill et al., 2010)
Aboriginal or Torres Strait Islander versus Not Aboriginal or Torres Strait Islander
Marital status Lone motherhood increases odds of childhood overweight at 3 years (Hawkins et al., 2009) Married/De facto: Yes/No
Mother highest Education Level (EL)
See Table 2. University versus non university education
Post-secondary (=Trade/apprenticeship +
TAFE/college certificate + University
education) versus no post-secondary (=< Yr
10 + Yr 10/11 + Yr 12)
Father highest Education Level (EL)
For population comparison.
Maternal reported weight status before pregnancy
Maternal pre-pregnancy overweight is positively associated to childhood overweight (Hawkins et al., 2009). Maternal underweight affects more early post natal growth than maternal overweight (Regnault et al., 2010).
Healthy; Unhealthy=Underweight or overweight; Missing
Child feeding mode intention
Breastfeeding intention existing already knowledge of positive feeding practice + see Table 2.
Formula; Exclusive or non exclusive Breastfeeding; Missing
Cohort Check whether the enrolment process was standardised across cohorts. 1: Enrolment in 2008; 2: Enrolment in 2009
City Check whether the enrolment process was standardised across cities + stratification on cities allowed for comparison with State statistics.
1: Brisbane; 2: Adelaide

306
Table 40: Data selection to explore reach at Recruit-2, second stage of the enrolment phase of the NOURISH research programme
Selected data (Collection tool) Justification for selection Re-coded scales or units of measurement
Ever breastfed (Recruit-2 non-consent, or Assessment T1)
See Table 2 Yes / No
Smoking pregnancy (Recruit-1 form for consenters to later contact)
Positively associated with childhood obesity. (Hawkins et al., 2009). Reflects a mother’s management of child health risk: for instance has been associated in Australia with negative feeding choices such as early introduction of non-core foods (Koh et al., 2010)
Smoking after first 3 months Yes / No
Alcohol during 2nd term of pregnancy (Recruit-1 form for consenters to later contact)
Reflects a mother’s management of child health risk Yes / No
Concern about baby’s weight (Recruit-2 non-consent, or Assessment T1)
Concern about baby weight was found to be associated with parental feeding choices (May et al., 2007). Concern about their baby’s weight may motivate a mother to enrol in the programme.
No; Yes (ranges from a little to very); Missing
Reasons for not participating Informs perceived difficulties of enrolment into the NOURISH research programme and helps to take these into account when reproducing such a programme.
Same as original coding (Appendix 3)
+ selected data reported in Table 39

307
Table 41: Data selection to explore reach at each stage of the NOURISH intervention delivery
Selected data from T1 & T2 Assessments (Section)
Justification for selection Re-coded scales or units of measurement
Mother return to work (Q) See Table 2 + May prevent attendance. Yes / No (see footnote 3 Table 2)
Family income (Q) See Table 2. $0–$673 per week; $674–$1346 per week; >=$1347 per week
Healthcare carda (Q) In particular for mothers in financial need, access to free information might be a motivation or might not be a priority.
Yes / No
Mother weight concern (O) Having a weight concern for herself may motivate or discourage mother attendance + see Table 2.
Average of 5-item construct (Killen et al., 1994) (see footnote 4 Table 2)
Current breastfeeding (A) See Table 2 + non-breastfeeding mothers might feel stigmatised in group session.
Yes / No (see Table 2)
Solid or semi-solid food introduction (B)
See Table 2. Mothers who introduced food before the start of the module might perceive there is no need for them to attend.
Baby age at solid introduction (see Table 2)
Update baby’s age Mothers of older babies might perceive there is less need for them to attend or might find it more difficult to attend.
Age (months)
Easy baby to feed (C) Perceived difficulty to feed a baby may motivate mother attendance.
Agree / Disagree
Reason for not attending selected from Attendance log
Outline points that could be considered when reproducing the programme.
Re-codification of the “other response” using a consistent theme structure across attendance log and Q8 of the parent feedback questionnaire. 1: Too difficult to attend; 2: clash with other life events; 3: away/moved/unable to contact; 4: inconvenient location; 5: inconvenient session time; 6: no longer interested; 7: forgot; 8: organisation default; 9: no reason given.
+ selected data reported in Table 39 and Table 40 a http://www.centrelink.gov.au/internet/internet.nsf/payments/conc_cards_hcc.htm#eligible

308
Table 42: Data selection to explore participant adoption of the NOURISH intervention
Selected data (Collection tool, Section)
Justification for selection Re-coded scales or units of measurement
Participant attendance (Attendance logs) Provides the level of “use” of the “programme” which is provided to mothers. Hence, it informs whether such an intervention format could be reproduced.
Dose = count of attended sessions
Satisfaction with session (Parent Feedback Survey, Q1)
Separate frequency analyses of these 2 items allow for the identification of issues. Combined items allows the creation of a satisfaction score per participant to rate satisfaction
1: Dissatisfied; 2: Neither 3: Satisfied
Satisfaction with staff (Parent Feedback Survey, Q2)
Satisfaction score = mean responses to Q1 +Q2
Overall usefulness of information (Parent Feedback Survey, Q3)
Translates overall usefulness perception by recipients. 1: Not at all useful; 2: Useful; 3: Very useful
Usefulness of 3 intervention information strategies (Parent Feedback Survey, Q4b, c, d)
Separate frequency analyses of these 3 items allow for the identification of which information strategies need to be modified.
Usefulness score of info strategies = mean responses to Q4b +Q4c +Q4d
Usefulness for knowledge development (Parent Feedback Survey, Q5 a, d, e)
Separate frequency analyses of each item translates what recipients perceive as useful. Combined items allows the creation of a score for usefulness with respect to knowledge development
1: Not at all; 2: A little; 3: A lot Usefulness score for knowledge = mean responses to Q5a +Q5d+Q5e
Usefulness for behavioural change (Parent Feedback Survey, Q5 b, c, f)
Idem above raw, but with respect to behavioural change. 1: Not at all; 2: A little; 3: A lot Usefulness score for behavioural change = mean responses to Q5b +Q5c +Q5f
Difficulties and things most disliked about NOURISH (Q8 + Q11, Parent Feedback Survey)
Provide generic difficulties to attendance anticipated by chief investigators (Q8) and difficulties spontaneously reported by participants (Q11).
“Other” response of Q8 recoded following consistent theme structure used for analysis of non-attendance reasons (see Table 34). Q11 qualitative data re-coded in 9 themes (see Table 36).

309
Table 43: Data selection to explore implementation of the NOURISH intervention
Selected data (Collection tool) Justification for selection Re-coded scales or units of measurement
Participant attendance (Attendance logs)
Reach performance score calculation = counts of participants who attended at least one group information session per module out of the 352 intervention allocated participants.
0 attendance versus attendance per module
Dose delivered (Session monitoring books)
Calculation of delivered sessions out of 12 planned sessions. Number of information sessions delivered per module
Full dose received (Session monitoring books + attendance logs)
Calculation of received dose out of the sessions delivered. “Full dose received participant”
Double rating of Management and facilitation per session Q1, 2, 3, 5a (Session monitoring books)
To describe how well intervention delivery matched the plan, based on whether 4 items (Q1, 2, 3, 5) were at least achieved as planned. Points out where issues occurred at intervention delivery (item consistency score). In contrast, averaging ratings for all 4 items provides an overall consistency score for the entire intervention.
0: “less well than planned”; 1: “at least achieved as planned” Item consistency scores = average of all ratings per item (includes double ratings by facilitators and co-facilitators). Overall consistency score (%)= average of all ratings related to the 4 selected items, to measure consistency.
Double rating of Coverage of Key content Q10–15a (Session monitoring books)
To describe how well the planned NOURISH content was covered at information delivery, based on 6 items (Q10–15). Similar to the above raw, descriptions per item indicate potential parts of the message that were not covered. In contrast, averaging ratings for all 6 items provides an overall coverage score of the planned message.
0: “not fully covered”; 1: “fully covered” Item integrity scores (%) = average of all ratings per item (includes double ratings by facilitators and co-facilitators). Overall integrity score (%) = average of all ratings related to the 6 selected items, to measure consistency.
Selected consistency and integrity items are averaged to measure fidelity scores, i.e. assessing the quality of the intervention delivery in comparison to the plan.
Fidelity score (%) = average of all ratings related to the 4 + 6 above selected items = percentage of information delivery which followed the plan.
Double rating of Environmental influences Q8–9a (Session monitoring books)
Provides counts of sessions for which environmental and physical difficulties were encountered.
Same as original see Appendix 7.
Facilitator and co-facilitator comments
Complement Q8 and Q9 open-ended questions. Qualitative data re-coded in 5 themes (see Table 38)
a Agreement analyses were performed to check the reliability of these ratings. First for each doubly rated item, agreement between facilitators and co-facilitators was defined when ratings varied by less than 1 point. Second, percentages of agreement between facilitator pairs were calculated for specific parts of the sessions, which were monitored out of the number of items included in the specific parts and doubly rated. Thus, it could be determined whether items included in the fidelity analyses were reliable per session and per information group (12 sessions). Percentage of agreement calculation was chosen rather than Kappa coefficient calculation because of the complexity of the data.

310
Appendix 13: Detailed results of characteristics of mothers and babies across each stage of the NOURISH research programme

311
Table 44: Maternal social factors across each stage of the NOURISH research programme
Study stages
Aboriginal or Torres
Strait Islander
(%)
Born in Australia
(%)
Mean (sd) age at birth
delivery (years)
Married or living
with partner
(%)
University education
(%)
Returned to work
(%)
Mean (sd) baby age
when mother
returned to work (wks)
Weekly mean
(sd) time at work (hours)
Healthcare cardholder
(%)
Rec
ruit
-1
Eligible and Approached at Hospital (n=2478)
0.8 77 28(5.5) 90 40 na na na no data
Later contact Consenters (n=2169) 0.8 76 28.3 (5.6) 90 41 na na na no data
Non consenters (n=309) 0.01 78 27 (5.1) 88 26
Statistical tests Fisher χ21 = 0.3 H= 9.5 χ2
1 = 0.9 χ21 = 21
p values 0.73 0.6 0.002 0.35 <0.001
Rec
ruit
-2
Recontact Able (n=1658) 0.8 77 28.9 (5.5) 92 45 no data no data no data no data
Unable (n=511) 0.8 75 26.2 (5.5) 83 27
Statistical tests Fisher χ21 = 0.4 t=9.6 χ2
1 = 35.3 χ21 = 51.2
p values 0.78 0.52 <0.001 <0.001 <0.001
Full enrolment Consenters (n=698)
not analysed
78 30 (5.3) 95 58 15 13 (7) no data
17
Non-consenters (n=885) 77 28 (5.5) 90 36 no data no data no data
Statistical tests χ21 = 0.5 t = 7.4 χ2
1 = 9.5 χ21 = 79.9
p values 0.51 <0.001 0.002 <0.001
Inte
rven
tio
n d
eliv
ery
Module-1
exposure (a)
Exposed (n=272)
not analysed
77 31 (5) 96 62 14 13 (7) no data
14
Non exposed (n=80) 80 28 (5.7) 89 49 21 14 (8) 25
Statistical tests χ21 = 0.1 t=4.8 Fisher 3.8 χ2
1 = 1.5 t=0.7 χ21 = 4.5
p values 0.72 <0.001 0.02 0.05 0.21 0.51 0.03
Module-2
exposure (a)
Exposed (n=155)
not analysed
78 31 (5) 95 68 62 37 (14) 19 (10) 17
Non exposed (n=197) 78 29 (5) 94 51 64 31 (15) 23 (12) 13
Statistical tests χ21 = 0.0 t=4.2 χ2
1 = 0.0 χ21 =9.8 χ2
1 = 0.0 t = 2.7 t=2.6 χ21 = 0.9
p values 0.9 <0.001 0.95 0.002 0.85 0.007 0.01 0.45
χ21 = Yates Chi-Square unless otherwise specified; t = student t-test; H = Kruskall-Wallis non-parametric test. na: not applicable. (a) Exposure to at least one group information session.

312
Table 45: Breastfeeding and solids introduction variables across each stage of the NOURISH research programme
Study stages BF intention (a)
(%) Ever BF (%) Currently BF (%)
Median (IQR) baby
age at BF termination
(months)*
Mean (sd) age of
first solid foods
(months)
Rec
ruit
-1
Eligible and Approached at Hospital (n=2478) 96
Later contact Consenters (n=2169) 96 na no data na na
Non consenters (n=309) 95
Statistical tests χ21 = 0.3
p values 0.61
Rec
ruit
-2
Recontact Able (n=1658) 97 no data no data na no data
Unable (n=511) 94
Statistical tests χ21 = 9.8
p values 0.002
Full enrolment Consenters (n=698) not analysed
97 74 1.4 (0.7; 3) 4.3 (1.1)
Non-consenters (n=885) 94 56 0.9 (0.5; 2.1) 3.6 (1.4)
Statistical tests χ21 = 10.9 χ2
1 = 44.2 H1= 9.0 H1= 22.6
p values <0.001 <0.001 0.003 <0.001
Inte
rven
tio
n d
eliv
ery
Module-1
exposure (a)
Exposed (n=272) not analysed not analysed
77 1.5 (0.8; 3.3) 4.3 (1)
Non exposed (n=80) 63 1.6 (0.7; 2.9) 4.3 (0.8)
Statistical tests χ21 = 4.6 H1=0.0 (b) t= 0.2 (d)
p values 0.03 0.96 0.84
Module-2
exposure (a)
Exposed (n=155) not analysed not analysed
38 8.1 (3;11) 5.3 (1)
Non exposed (n=197) 25 0.9 (0-5.1) 4.8 (1.2)
Statistical tests χ21 = 4.2 H1= 41.6(c) H1= 15.1(e)
p values 0.04 <0.001 <0.001
BF = Breastfeeding. *not normally distributed. χ21 = Yates Chi-Square unless otherwise specified. t = student t-test. H = Kruskall-Wallis non-parametric test. na: not
applicable. (a) exposure to at least one group information session. (b) out of 81 babies. (c) out of 292 babies. (d) out of 84 babies. (e) out of 292 babies.

313
Table 46: Other maternal factors across each stage of the NOURISH research programme
Study stages
Alcohol
consumers
during 2nd term
of pregnancy (%)
Smokers after 1st
term of
pregnancy (%)
Reported pre-
pregnancy
healthy weight
status (%)
Mean (sd)
Mother BMI
Mean (sd) score
of maternal
concern for own
weight (%)
Concerned for
Baby weight (%)
Rec
ruit
-1
Eligible and Approached at Hospital
(n=2478) no data no data 80 na no data no data
Later
contact
Consenters (n=2169) no data no data
80 na no data no data
Non consenters (n=309) 80
Statistical tests χ21 = 0
p values 0.98
Rec
ruit
-2
Recontact Able (n=1658) 14 6 81 no data no data no data
Unable (n=511) 9 13 76
Statistical tests χ21 = 9.1 χ2
1 = 27.3 χ21 = 6.0
p values 0.03 <0.001 0.01
Full
enrolment
Consenters (n=698) 16 3 82 26.1 (5.3) 36 (19) 31
Non-consenters (n=885) 12 7 80 no data no data 12
Statistical tests χ21 = 5.0 χ2
1 =13.8 χ21 = 1.1 χ2
1 = 71.8
p values 0.02 <0.001 0.29 <0.001
Inte
rven
tio
n d
eliv
ery
Module-1
exposure (a)
Exposed (n=272) 19 0.7 Not analysed
25.6 (4.8) 33 (17) 27
Non exposed (n=80) 18 8 26.7 (5.8) 42 (19) 29
Statistical tests χ21 = 0 Fisher t=1.7 t=3.92 χ2
1 =0.1
p values 0.99 0.002 0.09 <0.001 0.79
Module-2
exposure (a)
Exposed (n=155) 17 0.6 Not analysed
25 (4.7) 33 (19) 22
Non exposed (n=197) 20 4 25 (5.5) 38 (19) 26
Statistical tests χ21 = 0.2 Fisher t=0.7 t=1.8 χ2
1 = 0.5
p values 0.69 0.08 0.47 0.07 0.47
χ21 = Yates Chi-Square unless otherwise specified; t = student t-test; na: not applicable. (a) exposure to at least one group information session.

314
Table 47: Child factors across each stage of the NOURISH research programme
Study stages Boys (%)
Mean (sd)
Gestational age
(weeks)
Mean (sd)
baby age
(months)
Mean (sd)
Birth weight
(kg)
Median (IQR)
Weight for age
z-score
Easy to feed
babies (%)
Rec
ruit
-1
Eligible and Approached at Hospital
(n=2478) 50 39 (1.2) na 3.4 (0.4) na na
Later
contact
Consenters (n=2169) 51 39.4 (1.2)
na
3.46 (0.44)
na na Non consenters (n=309) 46 39.4 (1.2) 3.48 (0.46)
Statistical tests χ21 = 0.9 t= 0.2 t=0.5
p values 0.33 0.83 0.59
Rec
ruit
-2
Recontact Able (n=1658) 51 39.4 (1.2)
nc
3.46 (0.44)
no data no data Unable (n=511) 50 39.4 (1.2) 3.45 (0.46)
Statistical tests χ21 = 0.2 t= 0.3 t=0.5
p values 0.2 0.76 0.59
Full
enrolment
Consenters (n=698) 51
not analysed
4.3 (1) 3.49 (0.4) -0.1 (-0.6 ; 0.5) 90
Non-consenters (n=885) 48 nc 3.45 (0.5) no data no data
Statistical tests χ21 = 0.9 t = 1.9
p values 0.34 0.06
Inte
rven
tio
n d
eliv
ery
Module-1
exposure
(a)
Exposed (n=272)
not analysed not analysed
4.2 (0.9)
not analysed
-0.06 (-0.63;0.5) 92
Non exposed (n=80) 4.6 (1) 0.07 (-0.4;0.7) 84
Statistical tests t=3.0 t=1.0 Fisher
p values 0.003 0.29 0.29
Module-2
exposure
(a)
Exposed (n=155)
not analysed not analysed
14 (1.2)
not analysed
0.46 (-0.22; 0.9) 88
Non exposed (n=197) 14 (1.4) 0.67 (-0.05; 1.23) 84
Statistical tests t=1.8 t=1.3 χ21 = 0.6
p values 0.08 0.18 0.42
χ21 = Yates Chi-Square unless otherwise specified; t = student t-test; na: not applicable. nc: not calculable (a) Exposure to at least one group information session.

315
Appendix 14: Adoption analyses
Table 48: Participant Satisfaction score per module, city and cohort
Score Mediana 25th–75th IQ Min Max
Satisfaction at
Module-1
(n=222)
Brisbane cohort 1 (n=94) 3 3–3 1 3
Brisbane cohort 2 (n=41) 3 3–3 1 3
Adelaide cohort 1(n=47) 3 3–3 1 3
Adelaide cohort 2 (n=40) 3 3–3 2 3
Total Module-1 3 3–3 1 3
Satisfaction at
Module-2
(n=121)
Brisbane cohort 1 (n=44) 3 3–3 1 3
Brisbane cohort 2 (n=20) 3 3–3 1 3
Adelaide cohort 1 (n=31) 3 3–3 1.5 3
Adelaide cohort 2 (n=26) 3 3–3 2.5 3
Total Module-2 3 3–3 1 3
Overall satisfaction 3 3–3 1 3
a 1; Not satisfied, 2; neutral, 3: satisfied
Table 49: Participant Usefulness perception score per module, city and cohort
Score Mediana 25th–75th IQ Min Max
Usefulness at
Module-1
(n=223)
Brisbane cohort 1 (n=95) 2.7 2.5–2.8 1.2 3
Brisbane cohort 2 (n=41) 2.7 2.5–2.8 1.9 3
Adelaide cohort 1 (n=47) 2.6 2.3–2.9 1.7 3
Adelaide cohort 2 (n=40) 2.6 2.5–2.8 1.7 3
Total Module-1 2.6 2.5–2.8 1.2 3
Usefulness at
Module-2
(n=121)
Brisbane cohort 1 (n=44) 2.6 2.4–2.9 1.4 3
Brisbane cohort 2 (n=20) 2.5 2.4–2.8 1.3 3
Adelaide cohort 1 (n=30) 2.6 2.5–2.6 1.3 3
Adelaide cohort 2 (n=26) 2.6 2.5–2.8 2.1 3
Total Module-2 2.6 2.5–2.8 1.3 3
Overall usefulness score 2.6 2.5–2.8 1.2 3
a 1: Not at all useful, 2: useful 3: very useful
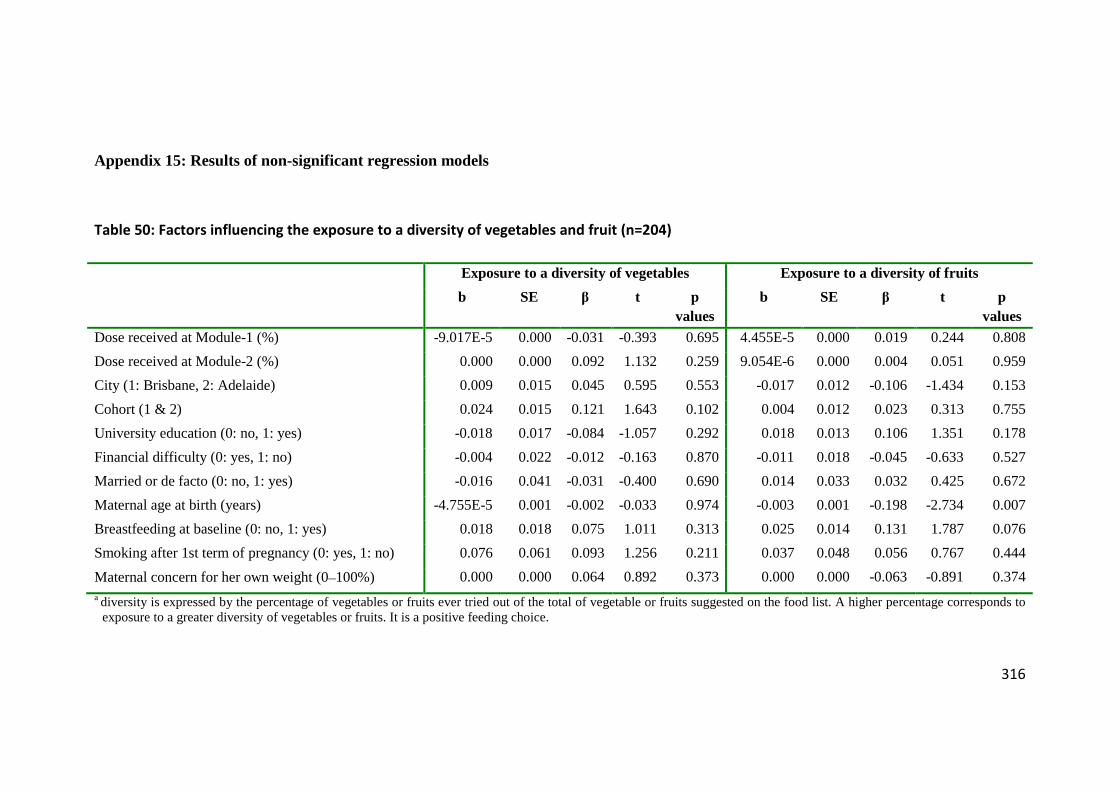
316
Appendix 15: Results of non-significant regression models
Table 50: Factors influencing the exposure to a diversity of vegetables and fruit (n=204)
Exposure to a diversity of vegetables Exposure to a diversity of fruits
b SE β t p values
b SE β t p values
Dose received at Module-1 (%) -9.017E-5 0.000 -0.031 -0.393 0.695 4.455E-5 0.000 0.019 0.244 0.808
Dose received at Module-2 (%) 0.000 0.000 0.092 1.132 0.259 9.054E-6 0.000 0.004 0.051 0.959
City (1: Brisbane, 2: Adelaide) 0.009 0.015 0.045 0.595 0.553 -0.017 0.012 -0.106 -1.434 0.153
Cohort (1 & 2) 0.024 0.015 0.121 1.643 0.102 0.004 0.012 0.023 0.313 0.755
University education (0: no, 1: yes) -0.018 0.017 -0.084 -1.057 0.292 0.018 0.013 0.106 1.351 0.178
Financial difficulty (0: yes, 1: no) -0.004 0.022 -0.012 -0.163 0.870 -0.011 0.018 -0.045 -0.633 0.527
Married or de facto (0: no, 1: yes) -0.016 0.041 -0.031 -0.400 0.690 0.014 0.033 0.032 0.425 0.672
Maternal age at birth (years) -4.755E-5 0.001 -0.002 -0.033 0.974 -0.003 0.001 -0.198 -2.734 0.007
Breastfeeding at baseline (0: no, 1: yes) 0.018 0.018 0.075 1.011 0.313 0.025 0.014 0.131 1.787 0.076
Smoking after 1st term of pregnancy (0: yes, 1: no) 0.076 0.061 0.093 1.256 0.211 0.037 0.048 0.056 0.767 0.444
Maternal concern for her own weight (0–100%) 0.000 0.000 0.064 0.892 0.373 0.000 0.000 -0.063 -0.891 0.374 a diversity is expressed by the percentage of vegetables or fruits ever tried out of the total of vegetable or fruits suggested on the food list. A higher percentage corresponds to
exposure to a greater diversity of vegetables or fruits. It is a positive feeding choice.

317
Table 51: Results of logistic regression of child sitting when having a meala (n=204) and variables associated with the process
B S.E. Wald test Sig. OR 95% C.I. for OR
Lower Higher
Dose received at Module-1 (%) 0.005 0.005 0.789 0.375 1.005 0.995 1.015
Dose received at Module-2 (%) 0.000 0.005 0.000 0.991 1.000 0.990 1.010
City (Adelaide=ref)* 0.243 0.339 0.512 0.474 1.275 0.656 2.477
Cohort (2=ref) 0.096 0.327 0.086 0.769 1.101 0.580 2.088
University education (Yes=ref) 0.667 0.400 2.782 0.095 1.949 0.890 4.271
Financial difficulty (No=ref) -1.016 0.477 4.534 0.033 0.362 0.142 0.922
Married or de facto (Yes=ref) 0.122 1.017 0.014 0.905 1.129 0.154 8.288
Maternal age at birth (years) -0.028 0.033 0.719 0.397 0.973 0.913 1.037
Breastfeeding at baseline (Yes=ref) -0.842 0.389 4.690 0.030 0.431 0.201 0.923
Smoking after 1st term of pregnancy (No=ref) -1.164 1.321 0.776 0.378 0.312 0.023 4.160
Maternal concern for her own weight (0–100%) -0.017 0.009 3.094 0.079 0.984 0.966 1.002 a 0: not a lot of the time, 1: A lot of the time. * SPSS 18.0 for Windows recodes highest value as reference.