effect of a rigid gas diffusion media applied as distributor
TRANSCRIPT
Int. J. Electrochem. Sci., 4 (2009) 1754 - 1769
International Journal of
ELECTROCHEMICAL
SCIENCE www.electrochemsci.org
Effect of a Rigid Gas Diffusion Media Applied as Distributor of
Reagents in a PEMFC in Operation, Part I: Dry Gases.
C. Moisés Bautista Rodríguez 1*
, M. G. Araceli Rosas Paleta 2, J. Antonio Rivera Marquez
2, A. Belén
Tapia Pachuca1, J. Roberto García de la Vega
1
1 Alter Energías Grupo, Tepetitlán No. 63, Col Lomas del Sur, 72470 Puebla, Puebla 2 BUAP. Facultad de Ingeniería Química. Av. San Claudio y 18 Sur -CU-, 72590 Puebla, Puebla *E-mail: [email protected] Received: 27 November 2009 / Accepted: 4 December 2009 / Published: 31 December 2009
Several mass transport phenomena develop during the operation of a PEMFC, each one of this generates a mechanical - physics resistance to some extent, implying limitations during operation. In a conventional fuel cell, the feeding reactive gases to the sites of reaction are performed by a series of elements such as: channels in the polar plates, diffusion layer on the electrodes and the active layer where it realizes the electrochemical semi reaction. Several studies reported show the generation of gradients of concentration in reagents between the channels of distribution and diffusion layer, representing a limiting in the transport of reagents to the active sites. Additionally, at high values of current density, the resistance to the mass transport of reagents is increased by the presence of water-product in the pores of electrodes, reducing significantly the performance of the PEMFC, including the complete cessation of its operation for flood. In consequent, this work focuses on reducing the resistance to mass transport by applying a rigid gas diffusion media with high number of macropores as distributor of reagents with the purpose to encourage the mass transport phenomena to the active sites on the electrodes. This gas distributor is manufactured using a commercial material, mixing carbon and graphite powders. The results show significant effects on the zone of diffusion in the PEMFC polarization curves, it is possible to reduce the mass transport limitations at high current density, however the ohmic losses zone on the polarization curves show an important electro-conductive limitation due to a deficient matrix. Keywords: Polar plates, Flow Gas Distribution, Gas Diffusion Media, PEMFC Performance, PEMFC Power
* Actual Address: Uhde Engineering de México. Sierra Gamon No. 120. Col. Lomas de Chapultepec. CP. 11000 México D.F.

Int. J. Electrochem. Sci., Vol. 4, 2009
1755
1. INTRODUCTION
The electrochemical device Proton Exchange Membrane Fuel Cell (PEMFC) is an
electrochemical reactor that converts in a direct way chemical energy into electrical energy.
Commercial applications of PEMFC are provided in mobile services such as automobile, maritime and mobile phones among others. Particularly PEMFC offers zero rate of pollution and high energy
efficiency, usually uses hydrogen as fuel and oxygen as oxidizer (it is desirable to use oxygen from the air). This device operates at temperatures below 120 °C and pressures in the range of 1 to 5
atmospheres, required for large-scale commercial application, the smaller volume of the major energy supply; this makes it necessary to operate the higher current density on the electrodes. Thus, in the case
of a PEMFC using H2 and O2, the two semi-reactions at the respective electrodes and the global
reaction can be written as follows:
At the anode: 2 H2 → 4 H+ + 4 e-
At the cathode: O2 + 4 H+ + 4 e- → 2 H2O
The global reaction: 2 H2 + O2 → 2 H2O
The global reaction in the electrochemical process on a PEMFC makes an exchange of 4
electrons per molecule of oxygen in an operating point (in voltage and current) dependent on the
external load. The kinetics of the reaction is stimulated by the impregnation of metallic catalysts (usually noble metals: Pt, Ru, etc...) dispersed in the form of nano-particles supported on carbon
powders. A fuel cell type PEMFC consists basically in: i) an Membrane-Electrode Assembly (MEA),
ii) gas distribution plates (polar plates) and iii) mechanical support plates. The ideal performance of a
PEMFC fuel cell depends of the number of electrochemical reactions and is defined by the Nernst’s Potential (equation 1) where the pressure and temperature in operation are key parameters. Moreover,
the functionality of a PEMFC is typically characterized by a polarization curve (I-E), which includes 4 areas classified as: i) zone of irreversible losses by the electrochemical reaction itself, ii) area
activation losses by the electrocatalyst used, iii) area of ohmic losses in the triple contact zone (interphase platinum-carbon-electrolyte) and iv) the diffusion losses area (mass transport limitations)
[1-3].
(1)
The PEMFC efficiency is limited by various transport and kinetic phenomena, such as: i) electrochemical kinetics, particularly the oxygen reduction reaction, ii) mass transportation phenomena as the diffusion of species (H2, O2, water and N2 if using air) in gas phase through the pores of the
electrodes, iii) the dissolution of species in the electrolyte membrane, moreover migration of ionic
species (H +) and electronic flow (e-), finally iv) the water management product of the reaction [1-6]. The mass transport phenomena (conduction and diffusion) generated by a PEMFC in operating
are developed mainly on channels of distribution plates (mass conduction), where the reactive gases
( )
+
+= 2
2
20 lnln2 O
OH
H PP
P
F
RTEE

Int. J. Electrochem. Sci., Vol. 4, 2009
1756
enter to the diffusion layer of porous electrodes (diffusion). In the distribution channels of reactive
gases, the transport phenomena currently considered by the literature, are: i) pressure drops, ii) variability in the profiles of speed of the gas flow, iii) variability in the profiles of flow direction and
distribution of reagents, iv) variability in the flow density of the gases by changes in the steam pressure
of water product at the cathode and its diffusion to the anode, v) dilution of the concentration in the reagents flow along of the distribution channels by consumption, vi) flood (the main cause of falls in the functionality of the PEMFC at high current densities), due to of barriers caused by the liquid water
trapped in the pores of electrodes, these barriers reach to cause dead zones on the active area of the
electrodes by reducing the effective reactive area, vii) direction of mass flow within the distribution
channels, viii) variability in concentration and density of the gas by changes in the pressure (the consumption of reagents and generation of products), ix) non-uniform distribution of reagents on the active layer of the electrodes due to the mechanical conditions between the distribution channels and
the diffusive layer (resulting in a heterogeneous distribution of current and potential on the electrode
area, is particularly significant in function of the increased surface. Determinants factors of these variables mentioned are the operating conditions of the PEMFC and the geometry of the channels of
distribution in where; an inefficient design of flow field can cause a decrease in the use of reactive
gases and an inefficient system of drainage of products reduce the active area of the electrode by the generation of concentration gradients in the flow of reagents), x) on the other hand, the use of oxygen from air as fuel represents a dilution in the concentration of oxygen in the stream gas (to develop a low
partial pressure of oxygen, which restrains the reduction reaction of oxygen and impacts the efficiency
and power developed by the PEMFC) [7-17]. Particularly for the gas distributor with serpentine
channels some studies [15.18], suggest the presence of concentration gradients of reagents on the active layer of electrodes, including the presence of dead zones (without reaction) for heterogeneous distribution of reagents due to the wide the walls between channels on the area of the electrode. Dutta
and coworkers confirmed the presence of concentration gradients along the channels; their
mathematical models also suggest the presence of different flow profiles based on the distance between the bottom of the channel and the electrode surface, including vortex. The direction in the
transport of water in the channels alters the density of local currents, mainly in the cathode, where
water is generated from the reaction product. The distribution of reactive gas flow is affected by consumption patterns in areas closest to the electrode surface. An interesting result is the determination of pressure drops in channels of distribution, lower than expected for both gases [17-18].
The commercial electrodes used in technology PEMFC (Figure 1) are type porous and typically
consist of three structural layers of materials of different nature, these constituents are assembled in
succession way until to get a thickness of approximately 0.5 mm [19]: i) the diffusion layer, the second layer and ii) support flexible mechanical and iii) the active layer. The diffusion layer (Figure 2.a) is composed of porous carbon particles with an size approximately of 0.1 µm, this acts as a means to
transport electrical power, mechanical support to anchor the inner layers and electric contact with the
gas distributor (mono or bipolar plate). The middle layer (support - diffusion, see Figure 2.b) consists of a physical mixture of carbon tissue and Polytetrafluoroethylene (PTFE), this polymer ensures the
structural strength and a solid character for the electrode, the polymer also provides a cohesive nature
between carbon tissue and agglomerated porous carbon particles, providing hydrophobic means to

Int. J. Electrochem. Sci., Vol. 4, 2009
1757
electrodes. In general, diffusion and intermediate layers allow the distribution of gases into the active
layer and the conduction electrons. The approximate electrical resistance of the first layer corresponds to 50 Ω • cm. The new technologies reduce the resistivity a 2 Ω• cm, however graphite tissue allow
lowest resistivity of 0.5 Ω • cm. The third layer (Figure 2.c), where is achieved electrochemical
reactions and the means which secures the triple contact, showing a hydrophobic character in the evacuation and a absorbing means of water for hydration of Nafion® membrane. This layer usually consists of porous carbon particles loaded with nanoparticles (2-10 nm) of platinum deposited. The
diameter of the porous carbon particles is determined between 20 - 40 Å, while the load in platinum is
determined between 0.2 - 0.4 mg/cm2. The conjunction of these materials generates a media known as
"active layer" which is partially flooded by Nafion solution. The thickness of the active layer depends of the proportion of loading of Pt (between 25 - 100 µm). The impregnation of active layer of the electrode by the electrolyte (Nafion film) may vary between 0.8 - 1.9 mg/cm2 [5, 19-28].
Polymer
Electrolyte
Pt or Ru
Active
Carbon
Particles
Diffusion
Layer
Support - DiffusionLayer
Polar
Plate
Gas Distribution
Channels
Polymer
Electrolyte
Pt or
Active
Layer
Carbon
Layer
Layer
Polar
Plate
Gas Distribution
Channels
Polymer
Electrolyte
Pt or Ru
Active
Carbon
Particles
Diffusion
Layer
Support - DiffusionLayer
Polar
Plate
Gas Distribution
Channels
Polymer
Electrolyte
Pt or
Active
Layer
Carbon
Layer
Layer
Polar
Plate
Gas Distribution
Channels
Figure 1. Schematic of a porous electrode used in PEMFC
(a) b) c)
Figure 2. Image of the basic structures of the porous electrodes type Sorapec: (a) Diffusion layer 20 x 0.45 increases, (b) carbon tissue at 500 µm in scale, (c) active layer with Nafion Film 20 x 0.45 increases.

Int. J. Electrochem. Sci., Vol. 4, 2009
1758
The mass transport limitations considered in the gas diffusion media of commercial porous
electrodes, are: i) diffusion limitations of reagents and products (water and waste gas) as a function of pore diameter, and ii) limitations of electrical conductivity. The nature, characteristics and proportions
of materials exert effects on limitations in the transport field. In the nomenclature of E-Tek materials
for the diffusion layer includes black carbon with 35% PTFE and this is known as the XC35 or XC72. The diffusion layer in the E-Tek electrodes counts with a thickness of 0.5 to 1 mm. The presence of PTFE in the diffusion layer is due to three functions: i) to form a large area of carbon particles in a
cohesive layer, ii) to form channels or pores, and iii) to provide a hydrophobic character to the layer
diffusion. Moreover, the predominant mass flow through the tiny pores in the diffusion layer is type
Knudsen, this occurs in pore diameters between 2-50 nm in which the molecules of a fluid collide with pore walls [24, 28]. Antolini and coworkers demonstrated a significant impact on the operation of a PEMFC based on the content of PTFE in the diffusion layers and reaction of the electrodes, with an
optimal combination (15% wt diffusion / 30% wt reaction) at the operation conditions of the study, but
at concentrations greater than 45 % wt decreases the efficiency of the PEMFC due to obstruction in the passage of reagents to the catalytic layer [28]. Moreover, Beuscher shows an adverse effect to the
operation of PEMFC based on the thickness of the diffusion layer in the electrodes; in addition, the
author proposes a model to measure the resistance to mass transport [18]. The model proposes that the total resistance to transport is composed of several resistances in series (Figure 3). The results show that less than 50% of the total resistance to mass transport is due to the amount of resistance in: the
channels of distribution, the gas diffusion (diffusion layer) and the active layer in the electrodes.
Moreover, describes concentration gradients of reagents gases through the diffusive mean, which leads
to a heterogeneous distribution on the active layer of the electrodes.
Figure 3. Schematic of mass transport resistances in series proposed by Beuscher [18].
Kong and coworkers have reported a methodology to generate porosity in the diffusive layer of
the electrodes; the LiCO3 added in the preparation of the diffusive layer can generate mainly
macropores to be subjected to heat treatment [8]. The immediate effect is observed in the area of diffusion of the corresponding polarization curves, being the obvious reduction of resistance to the
diffusion of reagents and products between the active layer and the polar plate. The presence of
significant numbers of macropores allows the diffusion of reaction product, allowing lower diffusion resistance of reagents to the area of catalytic electrodes. The global effect is a higher current density and in consequence the power of the PEMFC increases. Additionally, the authors propose an effect in
the morphology of the diffusion layer on the active layer of the electrode and the capacitive double
layer, showing an influence on the effective area of reaction. This work focuses on the effect to functionality of a PEMFC by applying a rigid gas diffusion
media (RGDM) in commercial graphite used as a distributor of reagents. The membrane-electrode
R Distribution
Plate
R Channels
R Diffusion
mean
R Electrode
R H2O
R Ionomer
Actives sites
Int. J. Electrochem. Sci., Vol. 4, 2009
1759
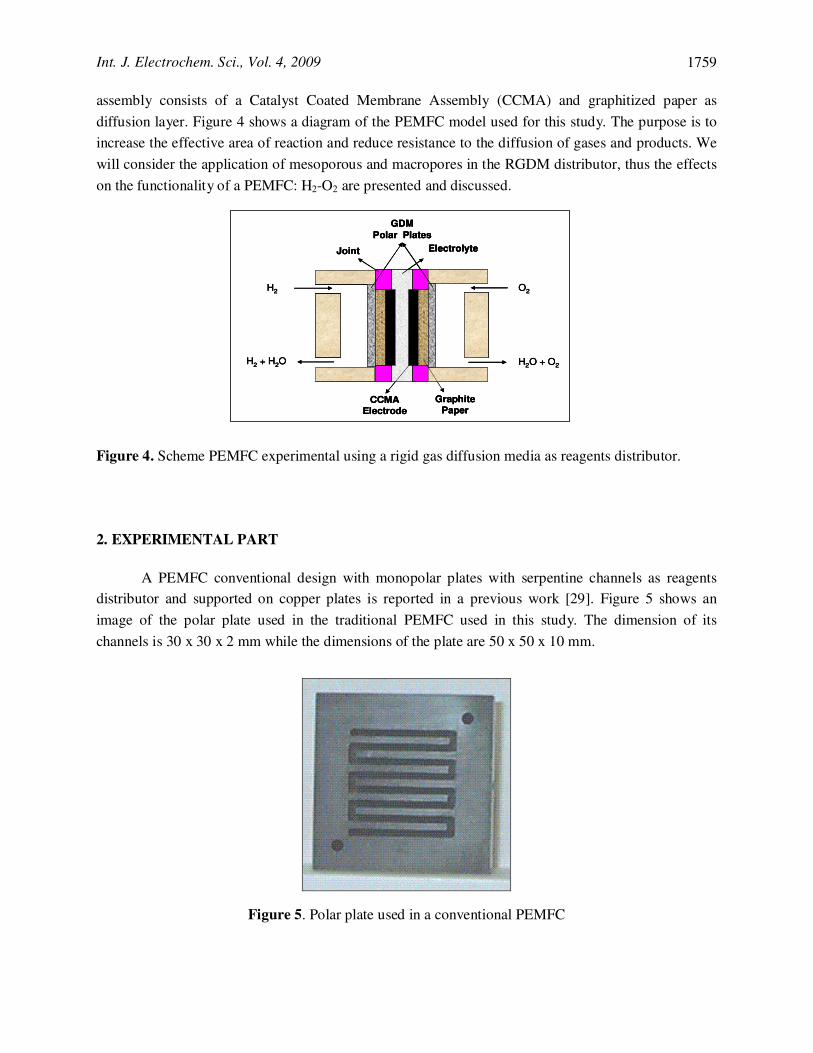
assembly consists of a Catalyst Coated Membrane Assembly (CCMA) and graphitized paper as
diffusion layer. Figure 4 shows a diagram of the PEMFC model used for this study. The purpose is to increase the effective area of reaction and reduce resistance to the diffusion of gases and products. We
will consider the application of mesoporous and macropores in the RGDM distributor, thus the effects
on the functionality of a PEMFC: H2-O2 are presented and discussed.
Figure 4. Scheme PEMFC experimental using a rigid gas diffusion media as reagents distributor.
2. EXPERIMENTAL PART
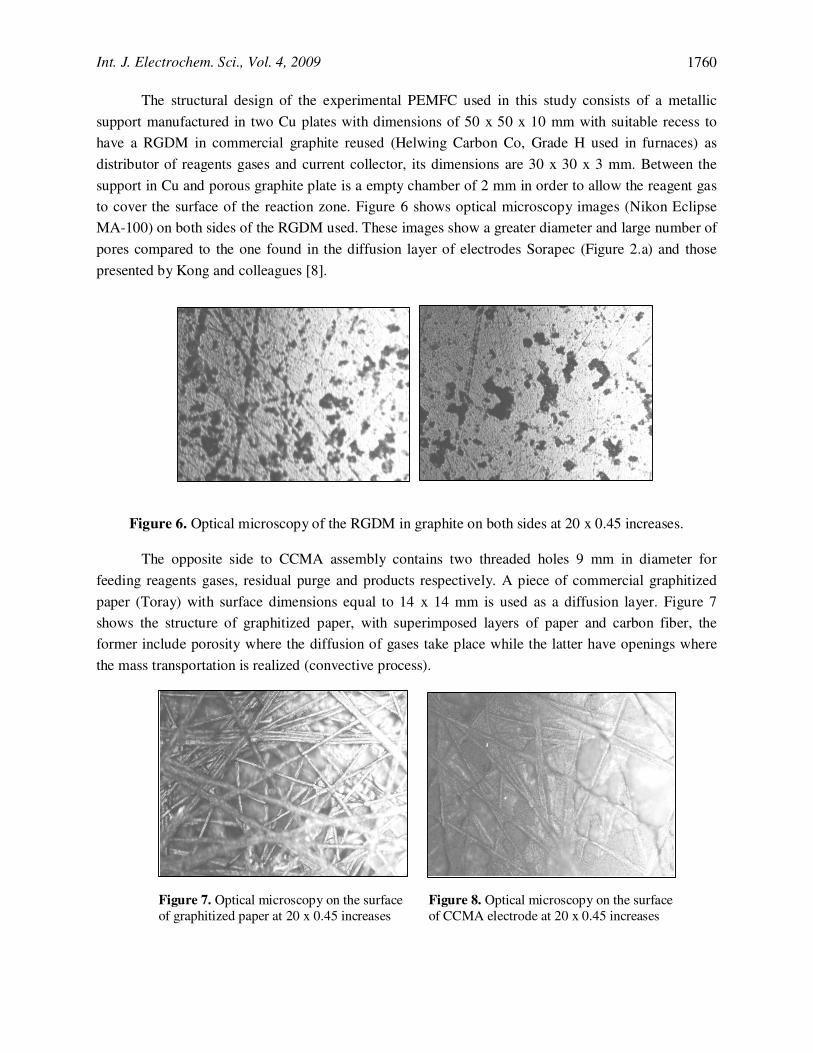
A PEMFC conventional design with monopolar plates with serpentine channels as reagents distributor and supported on copper plates is reported in a previous work [29]. Figure 5 shows an
image of the polar plate used in the traditional PEMFC used in this study. The dimension of its
channels is 30 x 30 x 2 mm while the dimensions of the plate are 50 x 50 x 10 mm.
Figure 5. Polar plate used in a conventional PEMFC
H2
H2 + H2O
O2
H2O + O2
GDM
Polar Plates
Joint Electrolyte
CCMAElectrode
GraphitePaper
H2
H2 + H2O
O2
H2O + O2
GDM
Polar Plates
Joint Electrolyte
CCMAElectrode
GraphitePaper
H2
H2 + H2O
O2
H2O + O2
GDM
Polar Plates
Joint Electrolyte
CCMAElectrode
GraphitePaper
Int. J. Electrochem. Sci., Vol. 4, 2009
1760
The structural design of the experimental PEMFC used in this study consists of a metallic
support manufactured in two Cu plates with dimensions of 50 x 50 x 10 mm with suitable recess to have a RGDM in commercial graphite reused (Helwing Carbon Co, Grade H used in furnaces) as
distributor of reagents gases and current collector, its dimensions are 30 x 30 x 3 mm. Between the
support in Cu and porous graphite plate is a empty chamber of 2 mm in order to allow the reagent gas to cover the surface of the reaction zone. Figure 6 shows optical microscopy images (Nikon Eclipse MA-100) on both sides of the RGDM used. These images show a greater diameter and large number of
pores compared to the one found in the diffusion layer of electrodes Sorapec (Figure 2.a) and those
presented by Kong and colleagues [8].
Figure 6. Optical microscopy of the RGDM in graphite on both sides at 20 x 0.45 increases.
The opposite side to CCMA assembly contains two threaded holes 9 mm in diameter for
feeding reagents gases, residual purge and products respectively. A piece of commercial graphitized
paper (Toray) with surface dimensions equal to 14 x 14 mm is used as a diffusion layer. Figure 7 shows the structure of graphitized paper, with superimposed layers of paper and carbon fiber, the former include porosity where the diffusion of gases take place while the latter have openings where
the mass transportation is realized (convective process). Figure 7. Optical microscopy on the surface Figure 8. Optical microscopy on the surface of graphitized paper at 20 x 0.45 increases of CCMA electrode at 20 x 0.45 increases

Int. J. Electrochem. Sci., Vol. 4, 2009
1761
On both sides of the CCMA electrode are placed together in Viton to avoid leaks of the
reagents, cut a hole in the center of the surface with an equivalent area to graphitized paper for free passage of reagents and products. Moreover, the electrolyte membrane was Nafion® 112, its thickness
of approximately 50.8 µm [3, 9, 10] and the area of the electrolyte used is equivalent to 35 x 35 mm.
The CCMA used in this work has been developed by the Department of Chemistry, CINVESTAV [30], the main features of preparation are: using an ink prepared with 2.5 mg of platinum (E-Tek), mixed with 1 mg of carbon powder (Vulcan XC-72, Cabot) with a 5% film Nafion in ethanol solution.
This ink is applied on the reactive area defined by spraying with air compressed on the Nafion
membrane. This procedure is used at both sides of Nafion membrane as electrodes (anode and
cathode), later the CCMA and the graphitized paper submit to thermopressure according to the literature [29.30]. The same CCMA was used in all experiences described in this work for both PEMFC systems (conventional and experimental). The Figure 8 shows the CCMA surface, its porosity
is observed similar as Sorapec electrodes (Figure 2.c). The fuel gas and oxidizer feds to the PEMFC
was of high purity (H2 and O2 at 99.9 %). The characterization of PEMFC was performed on a test bench model Fuel Cell Test System Globe Tech Compu-Cell GT-890-B. Experimental conditions
imposed on the PEMFC for this study were: gas flow at 50 cc / min to dry conditions, ambience
temperature has been imposed on the PEMFC (23 °C) while the pressure in the reagents gases was variable for each case. The present study using an experimental design 2k combining two types of distributors of reagents gases by varying the pressure of the reagents gases from 0 to 40 psi to analyze
the effects on the functionality of PEMFC based on the characteristics of mass transport (conduction
and diffusion) of reagents. Surface response graphics has been obtained with Statgraphics Plus v. 4.1,
software and electrical resistance measures have been obtained with a multimeter BK Precision model Test Bench-390A. The surface response methodology used has been reported in previous papers [32, 33].
3. RESULTS AND DISCUSSION
The electrical characteristics of the PEMFC registered at maximum values of electric power for the experimental conditions are shown in Table 1. A tendency for identifying the best electrochemical
PEMFC system is not easy to observe in the values of this table.
Table 1. Electrical characteristics by the PEMFC to experimental conditions
Serpentine Channels Distributor RGDM Distributor
Pressure Cathode Pressure Equivalent Pressures Cathode Pressure Equivalent Pressures psi P
(W) E (V) I
(A/cm2)
P (W)
E (V)
I (A/cm
2)
P (W)
E (V)
I (A/cm
2)
P (W)
E (V)
I (A/cm
2)
5 1.90 0.40 1.176 1.90 0.40 1.18 --- --- --- 2.41 0.44 1.095 10 2.08 0.40 1.276 2.16 0.43 1.27 1.97 0.39 1.00 2.43 0.41 1.187 15 2.20 0.41 1.339 2.33 0.44 1.30 2.09 0.38 1.10 2.28 0.41 1.166 20 2.31 0.41 1.399 2.51 0.45 1.41 2.33 0.40 1.16 2.50 0.43 1.160
Int. J. Electrochem. Sci., Vol. 4, 2009
1762
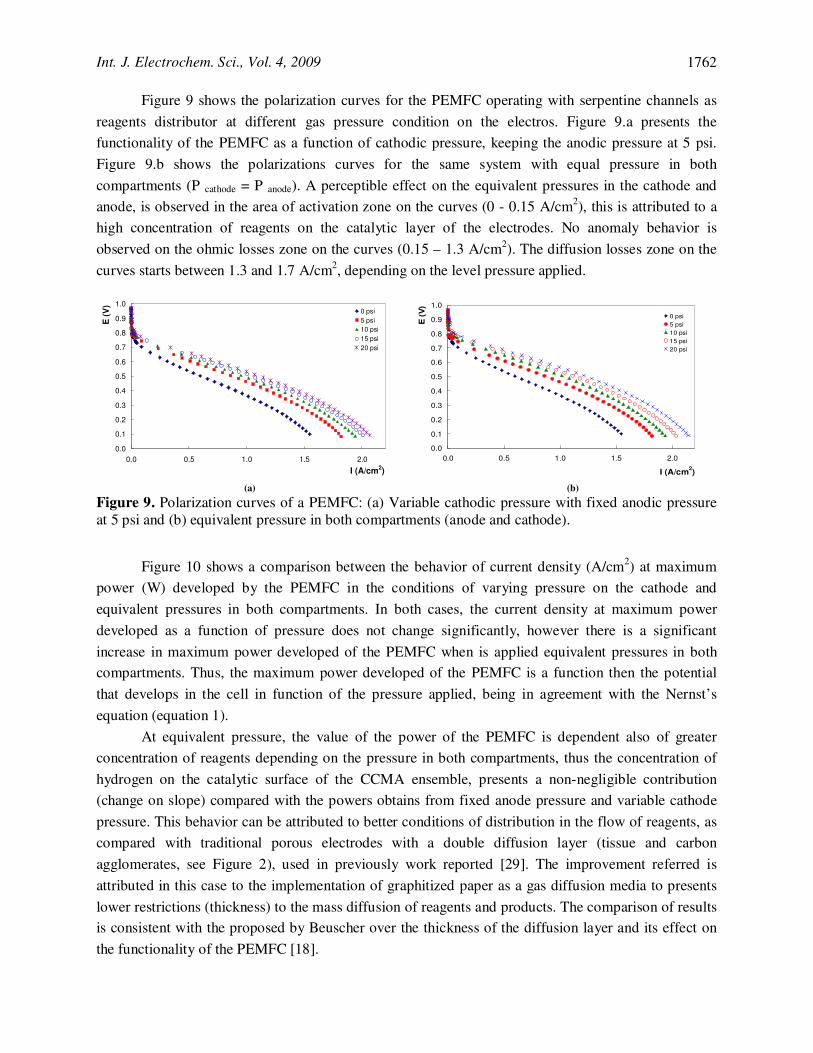
Figure 9 shows the polarization curves for the PEMFC operating with serpentine channels as
reagents distributor at different gas pressure condition on the electros. Figure 9.a presents the functionality of the PEMFC as a function of cathodic pressure, keeping the anodic pressure at 5 psi.
Figure 9.b shows the polarizations curves for the same system with equal pressure in both
compartments (P cathode = P anode). A perceptible effect on the equivalent pressures in the cathode and anode, is observed in the area of activation zone on the curves (0 - 0.15 A/cm2), this is attributed to a high concentration of reagents on the catalytic layer of the electrodes. No anomaly behavior is
observed on the ohmic losses zone on the curves (0.15 – 1.3 A/cm2). The diffusion losses zone on the
curves starts between 1.3 and 1.7 A/cm2, depending on the level pressure applied.
0.0
0.1
0.2
0.3
0.4
0.5
0.6
0.7
0.8
0.9
1.0
0.0 0.5 1.0 1.5 2.0
I (A/cm2)
E (
V)
0 psi
5 psi
10 psi
15 psi
20 psi
(a) (b)
Figure 9. Polarization curves of a PEMFC: (a) Variable cathodic pressure with fixed anodic pressure at 5 psi and (b) equivalent pressure in both compartments (anode and cathode).
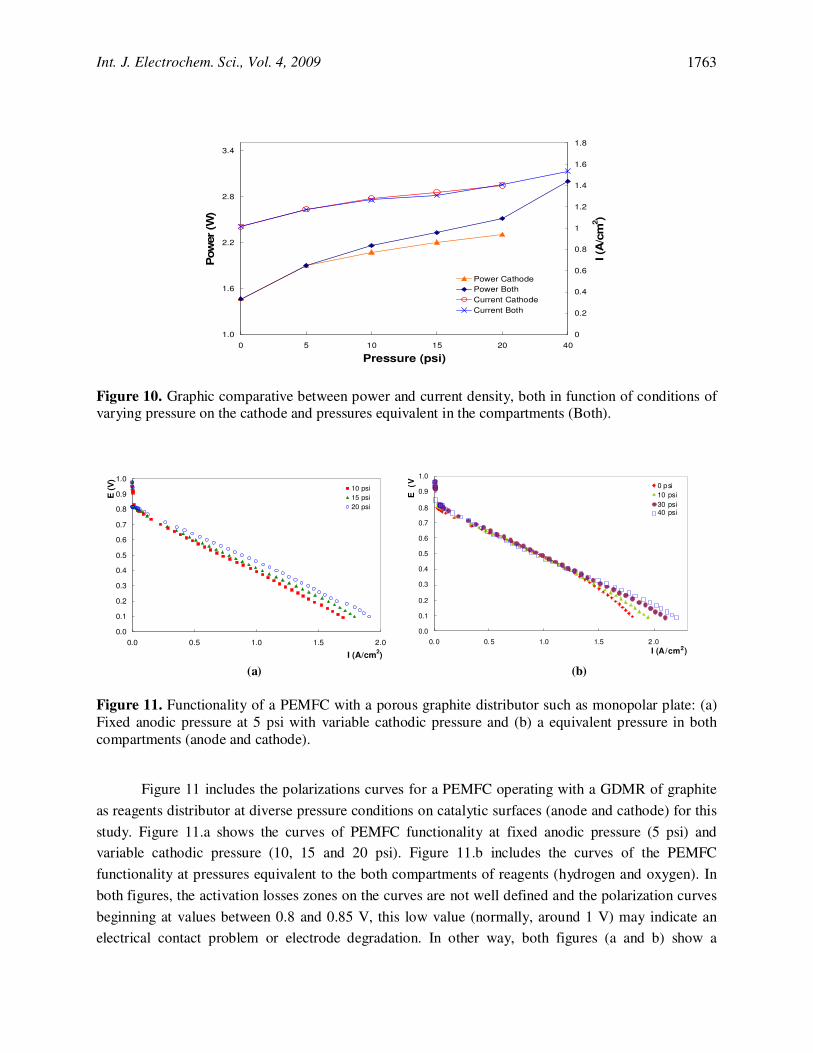
Figure 10 shows a comparison between the behavior of current density (A/cm2) at maximum power (W) developed by the PEMFC in the conditions of varying pressure on the cathode and
equivalent pressures in both compartments. In both cases, the current density at maximum power
developed as a function of pressure does not change significantly, however there is a significant
increase in maximum power developed of the PEMFC when is applied equivalent pressures in both compartments. Thus, the maximum power developed of the PEMFC is a function then the potential
that develops in the cell in function of the pressure applied, being in agreement with the Nernst’s
equation (equation 1).
At equivalent pressure, the value of the power of the PEMFC is dependent also of greater concentration of reagents depending on the pressure in both compartments, thus the concentration of
hydrogen on the catalytic surface of the CCMA ensemble, presents a non-negligible contribution (change on slope) compared with the powers obtains from fixed anode pressure and variable cathode
pressure. This behavior can be attributed to better conditions of distribution in the flow of reagents, as compared with traditional porous electrodes with a double diffusion layer (tissue and carbon
agglomerates, see Figure 2), used in previously work reported [29]. The improvement referred is
attributed in this case to the implementation of graphitized paper as a gas diffusion media to presents
lower restrictions (thickness) to the mass diffusion of reagents and products. The comparison of results is consistent with the proposed by Beuscher over the thickness of the diffusion layer and its effect on
the functionality of the PEMFC [18].
0.0
0.1
0.2
0.3
0.4
0.5
0.6
0.7
0.8
0.9
1.0
0.0 0.5 1.0 1.5 2.0
I (A/cm2)
E (
V)
0 psi
5 psi
10 psi
15 psi
20 psi
Int. J. Electrochem. Sci., Vol. 4, 2009
1763
1.0
1.6
2.2
2.8
3.4
0 5 10 15 20 40
Pressure (psi)
Pow
er
(W)
0
0.2
0.4
0.6
0.8
1
1.2
1.4
1.6
1.8
I (A
/cm
2)
Power Cathode
Power Both
Current Cathode
Current Both
Figure 10. Graphic comparative between power and current density, both in function of conditions of varying pressure on the cathode and pressures equivalent in the compartments (Both).
0.0
0.1
0.2
0.3
0.4
0.5
0.6
0.7
0.8
0.9
1.0
0.0 0.5 1.0 1.5 2.0
I (A/cm2)
E (
V)
10 psi
15 psi
20 psi
(a) (b)
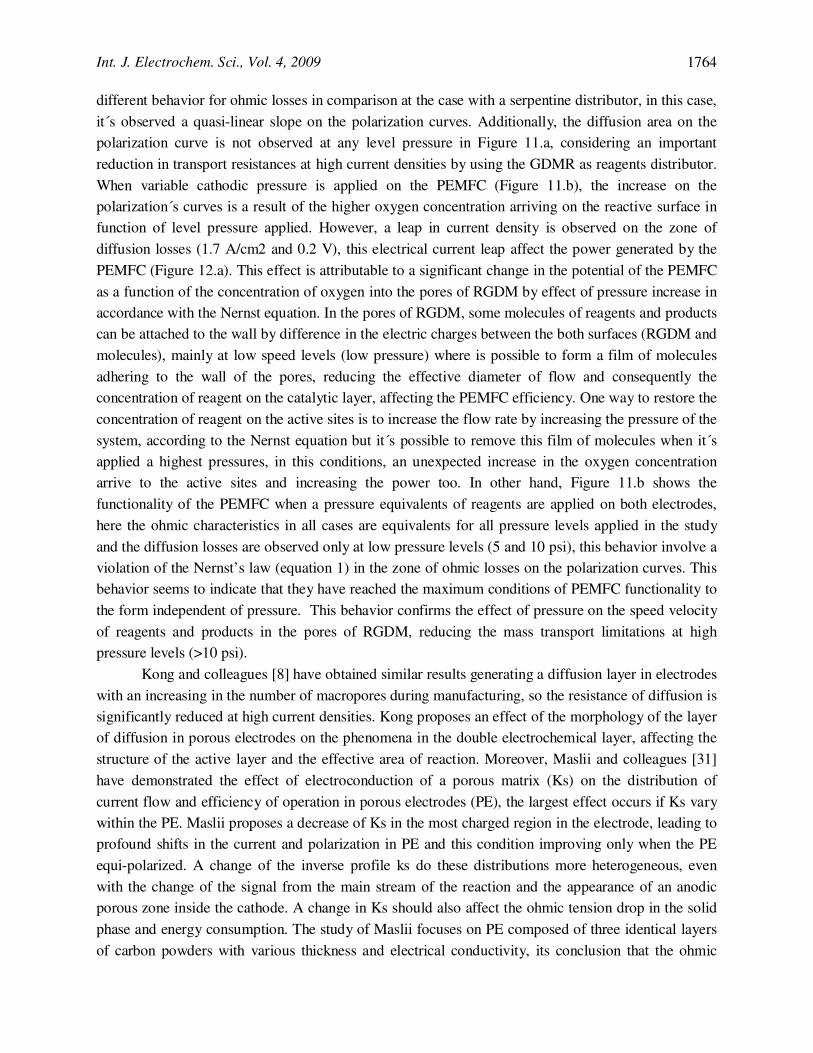
Figure 11. Functionality of a PEMFC with a porous graphite distributor such as monopolar plate: (a) Fixed anodic pressure at 5 psi with variable cathodic pressure and (b) a equivalent pressure in both compartments (anode and cathode).
Figure 11 includes the polarizations curves for a PEMFC operating with a GDMR of graphite
as reagents distributor at diverse pressure conditions on catalytic surfaces (anode and cathode) for this
study. Figure 11.a shows the curves of PEMFC functionality at fixed anodic pressure (5 psi) and variable cathodic pressure (10, 15 and 20 psi). Figure 11.b includes the curves of the PEMFC
functionality at pressures equivalent to the both compartments of reagents (hydrogen and oxygen). In
both figures, the activation losses zones on the curves are not well defined and the polarization curves
beginning at values between 0.8 and 0.85 V, this low value (normally, around 1 V) may indicate an electrical contact problem or electrode degradation. In other way, both figures (a and b) show a
0.0
0.1
0.2
0.3
0.4
0.5
0.6
0.7
0.8
0.9
1.0
0.0 0.5 1.0 1.5 2 .0
I (A/cm2)
E (
V)
0 psi
10 psi
30 psi40 psi
Int. J. Electrochem. Sci., Vol. 4, 2009
1764
different behavior for ohmic losses in comparison at the case with a serpentine distributor, in this case, it´s observed a quasi-linear slope on the polarization curves. Additionally, the diffusion area on the polarization curve is not observed at any level pressure in Figure 11.a, considering an important reduction in transport resistances at high current densities by using the GDMR as reagents distributor. When variable cathodic pressure is applied on the PEMFC (Figure 11.b), the increase on the polarization´s curves is a result of the higher oxygen concentration arriving on the reactive surface in function of level pressure applied. However, a leap in current density is observed on the zone of diffusion losses (1.7 A/cm2 and 0.2 V), this electrical current leap affect the power generated by the PEMFC (Figure 12.a). This effect is attributable to a significant change in the potential of the PEMFC as a function of the concentration of oxygen into the pores of RGDM by effect of pressure increase in accordance with the Nernst equation. In the pores of RGDM, some molecules of reagents and products can be attached to the wall by difference in the electric charges between the both surfaces (RGDM and molecules), mainly at low speed levels (low pressure) where is possible to form a film of molecules adhering to the wall of the pores, reducing the effective diameter of flow and consequently the concentration of reagent on the catalytic layer, affecting the PEMFC efficiency. One way to restore the concentration of reagent on the active sites is to increase the flow rate by increasing the pressure of the system, according to the Nernst equation but it´s possible to remove this film of molecules when it´s applied a highest pressures, in this conditions, an unexpected increase in the oxygen concentration arrive to the active sites and increasing the power too. In other hand, Figure 11.b shows the functionality of the PEMFC when a pressure equivalents of reagents are applied on both electrodes, here the ohmic characteristics in all cases are equivalents for all pressure levels applied in the study and the diffusion losses are observed only at low pressure levels (5 and 10 psi), this behavior involve a violation of the Nernst’s law (equation 1) in the zone of ohmic losses on the polarization curves. This behavior seems to indicate that they have reached the maximum conditions of PEMFC functionality to the form independent of pressure. This behavior confirms the effect of pressure on the speed velocity of reagents and products in the pores of RGDM, reducing the mass transport limitations at high pressure levels (>10 psi).
Kong and colleagues [8] have obtained similar results generating a diffusion layer in electrodes with an increasing in the number of macropores during manufacturing, so the resistance of diffusion is significantly reduced at high current densities. Kong proposes an effect of the morphology of the layer of diffusion in porous electrodes on the phenomena in the double electrochemical layer, affecting the structure of the active layer and the effective area of reaction. Moreover, Maslii and colleagues [31] have demonstrated the effect of electroconduction of a porous matrix (Ks) on the distribution of current flow and efficiency of operation in porous electrodes (PE), the largest effect occurs if Ks vary within the PE. Maslii proposes a decrease of Ks in the most charged region in the electrode, leading to profound shifts in the current and polarization in PE and this condition improving only when the PE equi-polarized. A change of the inverse profile ks do these distributions more heterogeneous, even with the change of the signal from the main stream of the reaction and the appearance of an anodic porous zone inside the cathode. A change in Ks should also affect the ohmic tension drop in the solid phase and energy consumption. The study of Maslii focuses on PE composed of three identical layers of carbon powders with various thickness and electrical conductivity, its conclusion that the ohmic

Int. J. Electrochem. Sci., Vol. 4, 2009
1765
losses in PE depend on the average value of Ks and its profile in the thickness of the PE, as well Maslii establishes a dependence to value of Ks and the effective electrode surface, resulting the second in function of the porosity of the electrode.
0.0
0.5
1.0
1.5
2.0
2.5
3.0
0.0 0.5 1.0 1.5 2.0
I (A/cm2)
P (
W)
10 psi
15 psi
20 psi
a) b)
Figure 12. Curves of electrical power developed by a PEMFC with a porous graphite distributor as a monopolar plate: (a) Fixed anode pressure at 5 psi pressure with variable cathodic pressure and (b) an equivalent pressure in both compartments (anode and cathode).
Figure 12 shows the power curves of the PEMFC to the conditions of Figure 11.a and b. Here, at variable cathodic pressure conditions, the power curves behave similarly to the case of a channels distributor, that is; the maximum power is increased as a function of cathodic pressure (Figure 10). However, at equivalent pressure conditions in the compartments, the maximum power values are very close for all cases, while the maximum point of power only moves to highest current densities as a function of applied pressure in both compartments. This effect may suppose that maximal PEMFC performance is arrived at low pressure levels with RGDM by reduction of mass transport limitations and a non-negligible contribution from the anode to these conditions is observed on the PEMFC functionality. Moreover, the effect of pressure when using RGDM in the diffusion zone is observable on the polarization curve of the PEMFC, also impacting the power developed by the fuel cell to current densities greater than 1.3 A/cm2 (Figure 11. b). Moreover, at 40 psi pressure of anodic and cathodic, there are 2 maximum points of power developed for the PEMFC around 2.5 W, the first at 1.27 A/cm2 and the second at 1.49 A/cm2, however with serpentine channels distributor is possible to obtain around of 3.2 W at 40 psi. These results may suppose that all these observations may be attributed to a participation of the RGDM as an integral part of the electrode, and secondly this composite electrode shows be sensitive to the presence of different interfacial phenomena compared to the case of the polar plate with distribution channels in serpentine form, caused by the pores and the structure of the electroconductive matrix as Maslii shows in its study
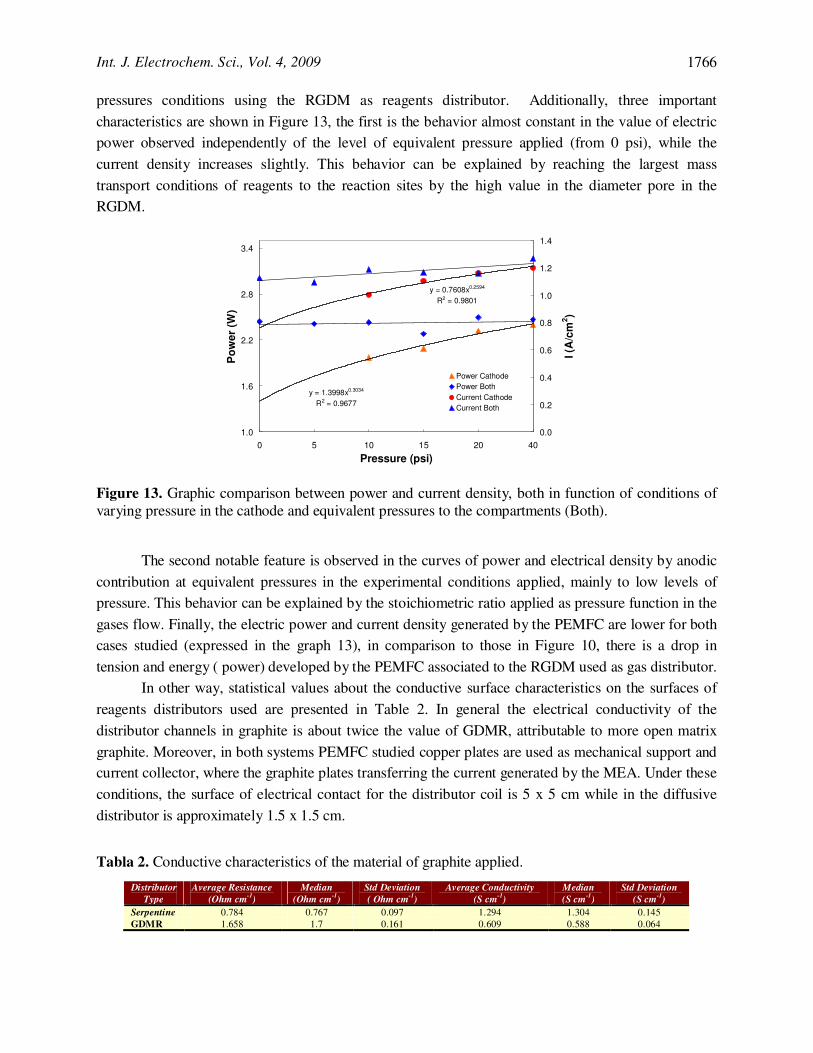
Figure 13 shows a comparison between the behavior of current density (A/cm2) at maximum power (W) developed by the PEMFC using the RGDM for both pressure conditions studied. In the case of variable cathodic pressure, the curves of current density and electric power obey mathematical power functions with increasing values towards higher pressures. The slopes of the curves of power and current density for the case of equivalent pressures obey to quasi-linear functions, this behavior may indicate that electrochemical mechanisms and mass transport phenomena are different for both
0.0
0.5
1.0
1.5
2.0
2.5
3.0
0.0 0.5 1.0 1.5 2.0
I (A/cm2)
P (W
)
0 psi
10 psi
30 psi
40 psi
Int. J. Electrochem. Sci., Vol. 4, 2009
1766
pressures conditions using the RGDM as reagents distributor. Additionally, three important characteristics are shown in Figure 13, the first is the behavior almost constant in the value of electric power observed independently of the level of equivalent pressure applied (from 0 psi), while the current density increases slightly. This behavior can be explained by reaching the largest mass transport conditions of reagents to the reaction sites by the high value in the diameter pore in the RGDM.
y = 1.3998x0.3034
R2 = 0.9677
y = 0.7608x0.2594
R2 = 0.9801
1.0
1.6
2.2
2.8
3.4
0 5 10 15 20 40
Pressure (psi)
Po
we
r (W
)
0.0
0.2
0.4
0.6
0.8
1.0
1.2
1.4
I (A
/cm
2)
Power Cathode
Power Both
Current Cathode
Current Both
Figure 13. Graphic comparison between power and current density, both in function of conditions of varying pressure in the cathode and equivalent pressures to the compartments (Both).
The second notable feature is observed in the curves of power and electrical density by anodic contribution at equivalent pressures in the experimental conditions applied, mainly to low levels of pressure. This behavior can be explained by the stoichiometric ratio applied as pressure function in the gases flow. Finally, the electric power and current density generated by the PEMFC are lower for both cases studied (expressed in the graph 13), in comparison to those in Figure 10, there is a drop in tension and energy ( power) developed by the PEMFC associated to the RGDM used as gas distributor.
In other way, statistical values about the conductive surface characteristics on the surfaces of reagents distributors used are presented in Table 2. In general the electrical conductivity of the distributor channels in graphite is about twice the value of GDMR, attributable to more open matrix graphite. Moreover, in both systems PEMFC studied copper plates are used as mechanical support and current collector, where the graphite plates transferring the current generated by the MEA. Under these conditions, the surface of electrical contact for the distributor coil is 5 x 5 cm while in the diffusive distributor is approximately 1.5 x 1.5 cm.
Tabla 2. Conductive characteristics of the material of graphite applied.
Distributor
Type
Average Resistance
(Ohm cm-1
)
Median
(Ohm cm-1
)
Std Deviation
( Ohm cm-1
)
Average Conductivity
(S cm-1
)
Median
(S cm-1
)
Std Deviation
(S cm-1
)
Serpentine 0.784 0.767 0.097 1.294 1.304 0.145 GDMR 1.658 1.7 0.161 0.609 0.588 0.064

Int. J. Electrochem. Sci., Vol. 4, 2009
1767
Figure 14 shows graphs of surface response methodology for the conductivity on the surfaces of reagents distributors under study. It observes in both cases heterogeneous surfaces with respect to the electrical conductivity of surfaces with different levels conductive. In the case of the GDMR distributor, the conductivity shows a maximum value at the center of the surface with the lowest values towards the edges where it is located electrical contact with the copper plates as current collectors, this allow assume limitations of electronic transport between the RGDM and the cooper current collector, in addition to the levels of conductivity, their profiles and the area of electrical contact between the GDMR and the copper plate (2.25 cm2). In comparison, the serpentine channel distributor shows a conductive surface with increases in the center and right of the surface, their values are twice those observed in GDMR and its contact surface with the current collector is 25 cm2. Figure 14. Surface response methodology for electrical conductivity in (a) GDMR distributor and (b) the serpentine channel distributor.
The results presented allow the authors to consider that in the experimental PEMFC, the GDMR used as distributor for the reagents has been integrated as part of a composed electrode with the graphitized paper and CCMA. The ohmic losses with lines behavior and reduction of power developed by the experimental PEMFC compared with conventional design can be explained in terms of proposed of Maslii and colleagues [31], that is: A change in the electro – conduction of graphite matrix affects the ohmic drop in the solid phase increasing the electronic conduction limitations in the graphite matrix (ohmic limitations) and also the energy loss as a result of these limitations (loss of electric power in the form heat).
4. CONCLUSIONS
A comparative study between the functionality of a PEMFC has been presented in this work. The principal difference involves the application of a rigid gas diffusion media as a reagents distributor with a serpentine channel distributor, both manufactured with mixes of carbon and graphite powder. In
Con
duct
ivit
y S/
cm
X
-1 -0.6 -0.2 0.2 0.6 1 -1 -0.6-0.20.20.610.590.630.670.710.750.79
Y
Con
duct
ivit
y S/
cm
X
-1 -0.6 -0.2 0.2 0.6 1 -1 -0.6-0.20.20.611.2
1.241.281.321.361.4
1.44
Y

Int. J. Electrochem. Sci., Vol. 4, 2009
1768
general, the GDMR becomes a diffusion layer, integrating a composite electrode with the graphitized paper and CCMA. Under conditions of variable cathodic pressure, the response of the GDMR becomes a combined distribution plate (conductive and diffusion mass transport), favoring the increase in current density and power developed by the PEMFC in pressure function. However, at same pressure level on the both electrodes, the RGDM distributor becomes to diffusion layer promoting the reduction in resistance to the mass transport of reagents and products. In this condition the maximum power developed by the PEMFC is obtained since very low pressure levels, and it observe almost constant values when the pressure increase in the gas flow feted. However, the conductive structure matrix in the RGDM increases markedly the ohmic resistance and increases the power losses along the functionality of the PEMFC in comparison with a conventional PEMFC design. ACKNOWLEDGMENTS
The authors are grateful to Alter Energias Grupo for partial financial support to this study and with Professor Octavio Olivares Xómetl of Chemical Engineering Faculty, BUAP for Optical Microscopy. References 1. Fuell Cell Hanbook. EG&G Services, Parsons Inc. 5th Edition, USA, 2000. 2. V. S. Bagotzky, N. V. Osetrova and A. M. Skundin. Russian Journal of Electrochemistry, V.39,
No. 9 (2003) 919 3. P. Costamagna, S. Srinivasan. Journal of Power Sources, 102 (2001) 242 4. J. Larminie and A. Dicks. Fuel Cell Systems Explained. Ed. Wiley 2nd edition, 2003. 5. Ton van der Does. Journal of Power Sources, 61 (1996) 49 6. D. L. Wood III, J. S. Yi and T. V. Nguyen. Electroquímica Acta, V. 43, No. 24 (1998) 3795 7. P. Costamagna, S. Srinivasan. Journal of Power Sources, 102 (2001) 253 8. Ch. S. Kong, D-Y Kim, H-K Lee, Y-G Shul, T-H Lee. Journal of Power Sources, 4725 (2002) 1 9. C. Boyer, S. Gamburzev and A. J. Appleby. Journal of Applied Electrochemistry, 29 (1999) 1095 10. K-H Choi, D-H Peck, Ch. S. Kim, D-R Shin, T-H Lee. Journal of Power Sources, 86 (2000) 197 11. J. J. Baschuk, Xianguo Li. Journal of Power Sources, 86 (2000) 181 12. V. A. Paganin, E. A. Ticianelli, E. R. Gonzalez. Journal of Power Sources, 70 (1998) 55 13. D. R. Sena, E.A. Ticianelli, V.A. Paganin, E. R. Gonzalez. Journal of Electroanalytical Chemistry,
477 (1999) 164 14. S. A. Grigor’ev. Rusian Journal of Elecrochemistry, V 40, 11 (2004) 1188 15. Zhigang Qi. Journal of Power Sources, 109 (2002) 469 16. S. Dutta, S. Shimpale and J. W. Van Zee. Journal of Applied Electrochemistry, 30 (2000) 135 17. Sandip Dutta, Srivatch Shimpale, J. W. Van Zee. International Journal of Heat and Mass Transfer,
44 (2001) 2029 18. Uwe Beuscher. Journal of the Electrochemical Society, 153, 9 (2006) A1788 19. M. S. Wilson, S. Gottesfeld. Journal of Applied Electrochemistry, 22 (1992) 1 20. Costamagna, P., Srinivasan, S. J. Power Sources, 102, (2001), 242. 21. Costamagna, P., Srinivasan, S. J. Power Sources, 102, (2001), 253. 22. http://irh.uqtr.ca/utilisation/piles/piles-combustible.pdf. 23. Mosdale, R. “Etude et development d´une pile á combustible hydrogéne/oxygéne en technologie
electrolyte polymére solide”. Grenoble, Thése INPG (1992). 24. Budevski, E. J. Optoelectronic and Advanced Materials 5, (2003) 1319.

Int. J. Electrochem. Sci., Vol. 4, 2009
1769
25. Antoine, O. “Préparation et activité électrocatalique des nano-particules de platine dans les électrodes de piles á combustible á membrane échangeuse de protons”. Grenoble, Thése INPG (1998).
26. Song, S. M., Koo, I. G., and Lee, W. M. Electrochim. Acta. 47, (2002) 2413. 27. Lee, S. J., Mukerjee, S. Ticianelli, and E. A. McBreen. J. Electrochim. Acta. 44, (1999) 3286. 28. E. Antolini, R. R. Passos and E. A. Ticianelli. J. of Applied Electrochemistry 32, (2002) 383 29. C. Moisés Bautista-Rodríguez*, Araceli Rosas-Paleta, Andrés Rodríguez-Castellanos, J. Antonio
Rivera-Márquez, Omar Solorza-Feria, J. Antonio Guevara-Garcia, J. Ignacio Castillo-Velázquez. Int. J. Electrochem. Sci., 2 (2007) 820
30. K. Suárez-Alcántara, A. Rodríguez-Castellanos, S. Durón-Torres, O. Solorza-Feria, J. Power
Sources 171 (2007) 381 31. I. A. Maslii, N.P. Poddubnyi and A. Zh. Medvedev. Russian Journal of Electrochemistry Vol 40, 2
(2004) 218 32. C. Moisés Bautista-Rodríguez, Araceli Rosas-Paleta, J. Antonio Rivera-Márquez, Omar Solorza-
Feria. Int. J. Electrochem. Sci., 4 (2009) 43 33. C. Moisés Bautista-Rodríguez, Araceli Rosas-Paleta, J. Antonio Rivera-Márquez, Omar Solorza-
Feria. Int. J. Electrochem. Sci., 4 (2009) 60 © 2009 by ESG (www.electrochemsci.org)