effect of amines as corrosion inhibitors …/67531/metadc4666/m2/1/high...effect of amines as...
TRANSCRIPT
APPROVED: Seifollah Nasrazadani, Major Professor Philip Foster, Committee Member Reza Mirshams, Committee Member Robert Thiemer, Committee Member Albert Grubbs, Chair of Engineering Technology
Department Oscar Garcia, Dean of College of Engineering Sandra L. Terrell, Dean of the Robert B. Toulouse
School of Graduate Studies
EFFECT OF AMINES AS CORROSION INHIBITORS FOR
A LOW CARBON STEEL IN POWER INDUSTRY
Jorge G. Díaz
Thesis Prepared for the Degree of
MASTER OF SCIENCE
UNIVERSITY OF NORTH TEXAS
December 2004
Díaz, Jorge G., Effect of Amines as Corrosion Inhibitors for a Low Carbon Steel in
Power Industry, Master of Science (Engineering Technology), December 2004, 72 pp., 5 tables,
31 figures, references 48 titles.
Commonly used amines in power industry, including morpholine, DBU (1,8-
diazabicyclo[5.4.0]undec-7-ene), and DMA (dimethylallylamine) were evaluated for their effect
on AISI 1018 steel at 250oF. Samples were exposed to an autoclave containing amine added
aqueous solution at pH of 9.5 for 1, 2, 4, 6, 8, and 12 hours. Morphology studies were carried
using scanning electron microscope (SEM), phase analysis was done utilizing Fourier transform
infrared spectroscopy (FTIR), and weight loss was performed to assess kinetics of oxidation.
Control samples showed the highest metal dissolution rate. DBU showed the best performance in
metal protection and SEM indicated the presence of a free-crack layer formed by fine particles in
that set. FTIR showed that DBU apparently favored the formation of magnetite. It is believed
that fine particles impede intrusion of aggressive ions into the metal surface by forming a barrier
layer. FTIR demonstrated that DMA formed more oxyhydroxides, whereas morpholine presented
magnetite to hematite transformation as early as 2 hours. SEM revealed that control and DMA
produced acicular particles characteristic of oxyhydroxides while morpholine and DBU
presented more equiaxed particles.

ii
ACKNOWLEDGEMENTS
I would like to express my deep regards to my committee chair Dr. Seifollah Nasrazadani
for his extraordinary guidance and support in every way possible in completion of this research
work. I would also like to thank my other committee members, Dr. Phillip Foster, Dr. Reza
Mirshams, and Mr. Robert Theimer (TXU, Glenn Rose) for their helpful observations to improve
this work. I would also like to thank Mr. Jim Stevens (TXU, Glenn Rose), Dr. Teresa Golden
(Chemistry Department, University of North Texas), Dr. Rick Reidy, and Rosa Orozco (both
Materials Science Department, University of North Texas), and my colleague Ms. Haritha
Namduri for her consistent encouragement and help without which this research would not have
been completed on time.
On a more personal level I want to thank my family for their encouragement, moral and
financial support, and Dr. S. Nasrazadani for his invaluable help, and guidance. God bless them.
iii
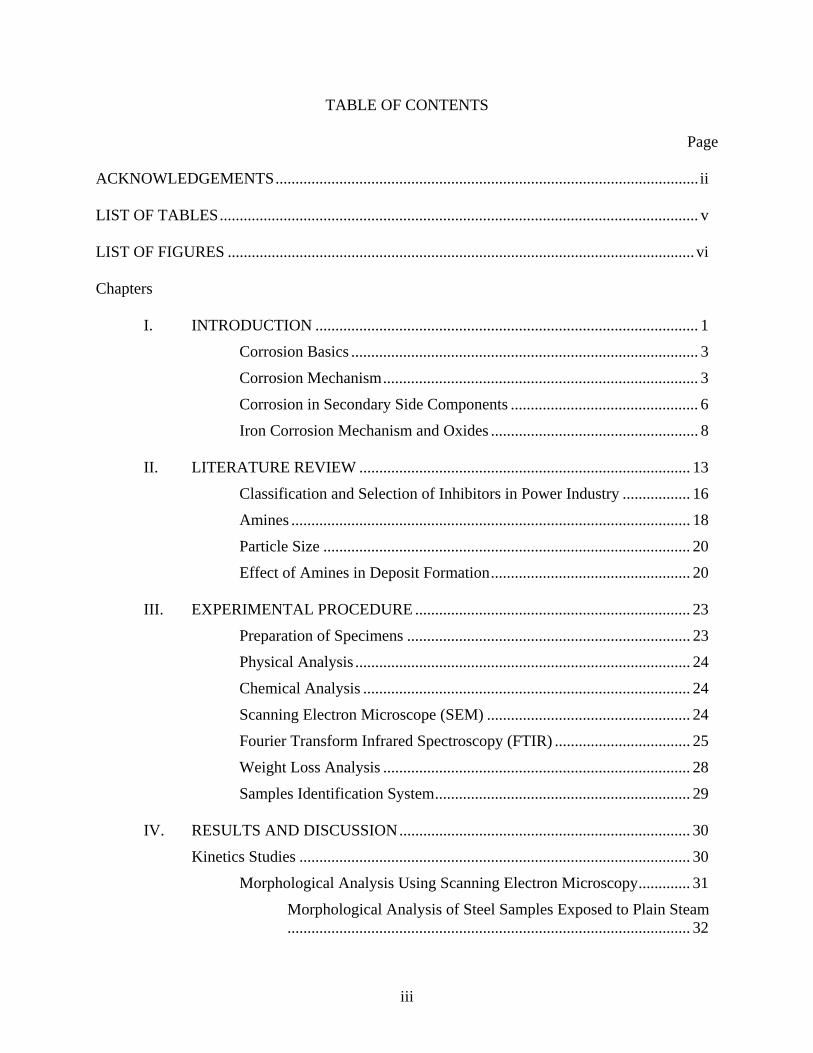
TABLE OF CONTENTS
Page
ACKNOWLEDGEMENTS.......................................................................................................... ii LIST OF TABLES........................................................................................................................ v LIST OF FIGURES ..................................................................................................................... vi Chapters
I. INTRODUCTION ................................................................................................ 1
Corrosion Basics ....................................................................................... 3
Corrosion Mechanism............................................................................... 3
Corrosion in Secondary Side Components ............................................... 6
Iron Corrosion Mechanism and Oxides .................................................... 8 II. LITERATURE REVIEW ................................................................................... 13
Classification and Selection of Inhibitors in Power Industry ................. 16
Amines .................................................................................................... 18
Particle Size ............................................................................................ 20
Effect of Amines in Deposit Formation.................................................. 20 III. EXPERIMENTAL PROCEDURE ..................................................................... 23
Preparation of Specimens ....................................................................... 23
Physical Analysis .................................................................................... 24
Chemical Analysis .................................................................................. 24
Scanning Electron Microscope (SEM) ................................................... 24
Fourier Transform Infrared Spectroscopy (FTIR) .................................. 25
Weight Loss Analysis ............................................................................. 28
Samples Identification System................................................................ 29 IV. RESULTS AND DISCUSSION......................................................................... 30
Kinetics Studies .................................................................................................. 30
Morphological Analysis Using Scanning Electron Microscopy............. 31
Morphological Analysis of Steel Samples Exposed to Plain Steam..................................................................................................... 32

iv
Morphological Analysis of Steel Samples Exposed to Steam with DBU ............................................................................................ 35
Morphological Analysis of Steel Samples Exposed to Steam + Morpholine.................................................................................. 39
Morphological Analysis of Steel Samples Exposed to Plain Steam with DMA ................................................................................... 43
Summary of Morphological Features ......................................... 47
Phase Formation and Transformation Analysis Using FTIR.................. 47
FTIR Analysis of Steel Samples Exposed to Plain Steam.......... 48
FTIR Analysis of Steel Samples Exposed to Steam with DBU ..................................................................................................... 49
FTIR Analysis of Steel Samples Exposed to Steam with Morpholine.................................................................................. 49
FTIR Analysis of Steel Samples Exposed to Steam with DMA ..................................................................................................... 49
V. CONCLUSIONS................................................................................................. 62
Recommendations for Future Work........................................................ 64 APPENDIX................................................................................................................................. 65 REFERENCES ........................................................................................................................... 69

v
LIST OF TABLES
Page
1. Iron oxides and oxyhydroxides......................................................................................... 9
2. Chemical composition of steel used for experiments ..................................................... 24
3. FTIR absorption bands for some iron oxides and oxyhydroxides .................................. 27
4. Summary of iron oxides and oxyhydroxides phases identified by FTIR........................ 51
5. Summary of morphologies identified by SEM ............................................................... 52

vi
LIST OF FIGURES
Page
1. Rankine cycle and stages of the working fluid ................................................................. 2
2. Schematic of metal dissolution in acidic media................................................................ 4
3. Common problems and their most common localization on the secondary side.............. 9
4. Pathway of transformation mechanisms accepted for some iron oxides ........................ 11
5. Representation of iron oxides and their transformation with associated mechanisms ... 12
6. Influence of steam quality over pH for different amines................................................ 22
7. Schematic of SEM .......................................................................................................... 26
8. Schematic diagram of an IR absorption instrument........................................................ 28
9. Schematic diagram of an IR Reflectance module........................................................... 29
10. Weight loss plot for AISI 1018 steel samples exposed to plain and amine containing steam for different exposure times at 250 °F.................................................................. 31
11. SEM micrographs of steel coupons exposed to clean steam for 1 hour ......................... 32
12. SEM micrographs of steel coupons exposed to clean steam for 2 hours (a, b), 4 hours (c, d), 6 hours (e, f)............................................................................................................... 33
13. SEM micrographs of steel coupons exposed to clean steam for 8 hours (a, b, c and d), and 12 hours (e, f) .................................................................................................................. 34
14. SEM micrographs of steel coupons exposed to 3ppm DBU + steam for 1 hour (a, b, c), and 2 hours (d, e, f) ......................................................................................................... 36
15. SEM micrographs of steel coupons exposed to 3ppm DBU + steam for 4 hours (a, b), and 6 hours (c, d, e, and f) ..................................................................................................... 37
16. SEM micrographs of steel coupons exposed to 3ppm DBU + steam for 8 hours (a, b, and c), and 12 hours (d, e, and f) ........................................................................................... 38
17. SEM micrographs of steel coupons exposed to 5ppm morpholine + steam for 1 hour (a, b, and c), and 2 hours (d, e, and f) ...................................................................................... 40
18. SEM micrographs of steel coupons exposed to 5ppm morpholine + steam for 4 hours (a, b, and c), and 6 hours (d, e, and f) .................................................................................. 41

vii
19. SEM micrographs of steel coupons exposed to 5ppm morpholine + steam for 8 hours (a, b, c, and d), and 12 hours (e and f) ................................................................................. 42
20. SEM micrographs of steel coupons exposed to 3ppm DMA + steam for 1 hour (a, b, and c), and 2 hours (d, e and f) .............................................................................................. 44
21. SEM micrographs of steel coupons exposed to 3ppm DMA + steam for 4 hours (a, and b), and 6 hours (c, d, e, and f) ......................................................................................... 45
22. SEM micrographs of steel coupons exposed to 3ppm DMA + steam for 8 hours (a, b, and c), and 12 hours (d, e, and f) ........................................................................................... 46
23. FTIR spectra of oxides formed on steel coupons exposed to steam for 2, 3 and 4 hours set at 250 °F.......................................................................................................................... 53
24. FTIR spectra of oxides formed on steel coupons exposed to steam for 6, 8 and 12 hours set at 250 °F .................................................................................................................... 54
25. FTIR spectra of oxides formed on steel coupons exposed to steam + 3ppm DBU for 2, 4 and 6 hours set at 250 °F................................................................................................. 55
26. FTIR spectra of oxides formed on steel coupons exposed to steam + 3ppm DBU for 8, and 12 hours set at 250 °F............................................................................................... 56
27. FTIR spectra of oxides formed on steel coupons exposed to steam + 5ppm morpholine for 1, 2 and 4 hours set at 250 °F .................................................................................... 57
28. FTIR spectra of oxides formed on steel coupons exposed to steam + 5ppm morpholine for 6, 8 and 12 hours set at 250 °F .................................................................................. 58
29. FTIR spectra of oxides formed on steel coupons exposed to steam + 3ppm DMA for 1, 2 and 4 hours set at 250 °F................................................................................................. 59
30. FTIR spectra of oxides formed on steel coupons exposed to steam + 3ppm DMA for 6, 8 and 12 hours set at 250 °F............................................................................................... 60
31. Comparison of FTIR spectra of oxides formed on steel coupons exposed to steam containing amines for 4 hours set at 250 °F.................................................................... 61
1
CHAPTER I
INTRODUCTION
Although corrosion is the thermodynamic method of returning a metal to its lowest
energy form, it is a non-desired situation that destroys cars, pipes, buildings, bridges, plant, and
factories. Every year the cost of maintaining, repairing and inspecting steam generators at U.S.
pressurized water reactors exceeds $100 million. This is approximately equivalent to $1.5
million per plant. These costs are excluding the cost incurred in routine inspection and repair.
French power plants spend similar amounts (Varrin et al., 1996). Steam generator (SG) fouling
involves deposition of iron corrosion mainly magnetite on the tube bundle. The cost of deposit
removal is $3,200/kg when is done chemically. One SG costs from $10 to $25 US million
dollars. Over the last 20 years 27 US plants have replaced 85 SGs and 13 more plants are
planning to replace 34 SGs over the next five years (Klimas et al., 2003).
The secondary cycle is a loop that consists generally of a steam generator, turbines (high
and low pressure) connected to an electric generator, a heat exchanger that condensates the
working fluid (steam), a pump that recirculates the condensate through the steam generator,
feedwater heaters and sometimes condensate demineralizers, among others. The materials for
those components are mild steel for the low pressure/temperature stage, stainless steel, copper
alloys for the feedwater tubing, and nickel alloys (Inconel-600 and Incoloy-800) for the
pressurized water reactor (PWR) which is high pressure/temperature operated (Passell et al.,
1988). Figure 1 shows the schematics of a typical Rankine cycle.

2
Figure 1. Rankine cycle and stages of the working fluid.
The major part of the cost involved in steam generator maintenance is related directly or
indirectly to the formation and transport of corrosion products in the secondary systems. The
accumulated corrosion products in one component increase the chances of other components to
corrode in the secondary cycle. Typical corrosion problems include, stress corrosion cracking
and inter-granular cracking. Corrosion products accumulate forming layers on the tube surfaces,
steam traps, condensers, and other places where condensate might form (Millet and Wood,
1997).
Deposit formation affects the performance of a power plant by lowering the heat transfer
rate, and increasing operational maintenance cost of the power plant. Fouling defined as the
deposition of insoluble oxides and debris onto the surface causes clogging of heat exchanger
tubes. Adequate prevention of fouling is facilitated by physical and chemical characterization of
these deposits. When track of the characteristics are kept, a trend could show when the failure
might happen.
Impurities of the corrosion products are transported due to ongoing erosion and corrosion
by make-up water, condensate and drain systems. Transported matters adhere on the surfaces as
3
deposit layers. These layers may consist of a mixture of iron oxides and oxyhydroxides in ferrous
systems or copper and zinc oxides or hydroxides in copper alloy and brass components. These
layers lead to problems such as denting, inter-granular attack, stress corrosion cracking
(IGA/SCC), and pitting at tube supports and sheet crevices, which in turn lead to high
maintenance cost of the secondary systems.
Corrosion Basics
Corrosion involves the interaction (reaction) between a metal or alloy and its
environment. Corrosion is affected by the properties of both the metal or alloy and the
environment. The most important factors affecting metal degradation are:
pH (acidity)
Oxidizing power (potential)
Temperature (heat transfer)
Velocity (fluid flow)
Concentration (solution constituents)
Corrosion Mechanism
Corrosion is the primary mean by which metals deteriorate. Most metals corrode on
contact with water (in any state), acids, bases, salts, oils, aggressive metal polishes, and other
solid and liquid chemicals. Metals will also corrode when exposed to gaseous materials like acid
vapors, formaldehyde gas, ammonia gas, and sulfur containing gases.
Corrosion is an electrochemical process in which a metal reacts with its environment to
form an oxide by loosing electrons. The cell, which causes this process, has three essential
constituents: an anode, a cathode and an electrolyte (electrically conducting solution). The anode
is the site at which the metal is corroded; the electrolyte is the corrosive medium; and the
4
cathode (part of the same metal surface or of another metal surface in contact with it) forms the
other electrode in the cell and is not consumed in the corrosion process. At the anode the
corroding metal passes into the electrolyte as positively charged ions, releasing electrons that
participate in the reaction. Hence the corrosion current between anode and the cathode consists
of electrons flowing within the metal and ions flowing within the electrolyte (Jones, 1992).
The surface of one of the components may become the anode and the surface of another
component in contact with it the cathode. Usually, corrosion cells will be much smaller and more
numerous, occurring at different points on the surface of the same component. Anodes and
cathodes may arise from differences in the constituent phases of the metal itself, from variations
in surface deposits or coatings on the metal, or from variations in the electrolyte.
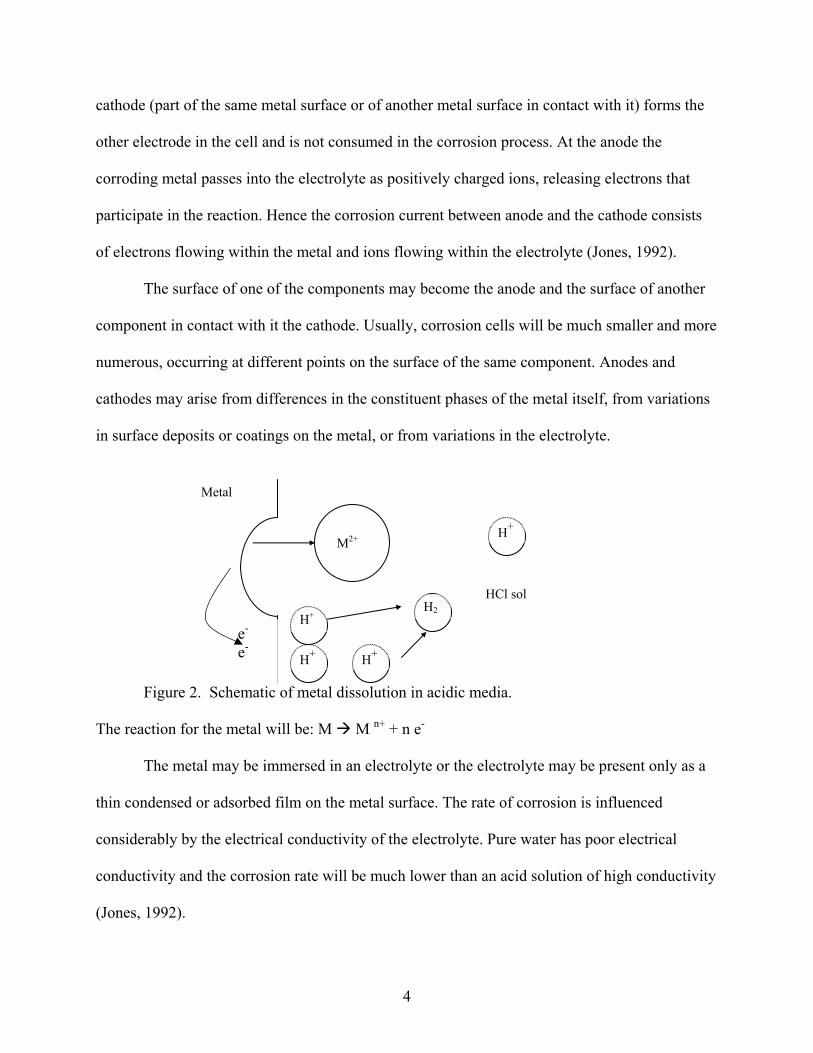
Figure 2. Schematic of metal dissolution in acidic media.
The reaction for the metal will be: M M n+ + n e-
The metal may be immersed in an electrolyte or the electrolyte may be present only as a
thin condensed or adsorbed film on the metal surface. The rate of corrosion is influenced
considerably by the electrical conductivity of the electrolyte. Pure water has poor electrical
conductivity and the corrosion rate will be much lower than an acid solution of high conductivity
(Jones, 1992).
M2+
e- e- H+
H+
H+
H2
H+
HCl sol
Metal
5
The ability of metals to resist corrosion when in contact with other metals depends in
their position in the electrochemical series. This means some metals are more inclined to loose
electrons than others.
Steel is the probably the most common material for construction, and its corrosion
characteristics in an aqueous media are important. When steel corrodes, the corrosion rate is
usually governed by the cathodic reaction of the corrosion process, and oxygen is an important
factor. In neutral waters (free-from dissolved oxygen) corrosion is usually negligible. The
presence of dissolved oxygen in water accelerates the cathodic reaction; and consequently the
corrosion rate increases in proportion to the amount of oxygen available for diffusion to the
cathode. Where oxygen diffusion is the controlling factor, the corrosion rate tends to increase
also with rise in temperature (Cohen et al., 1989).
The importance of the CO2 content is that concentrations as little as 1 ppm can lead to a
pH of 5.5 (Bloom and Daniel, 2001). Some plants maintain oxygen in the feedwater to the
reactor above 15 to 20 ppb (Davis et al., 1998).
Another factor to account is pH. In acid waters (pH <4), corrosion can occur even
without the presence of oxygen (Van Osch et al., 1986). Hydrogen ion activity is expressed in
terms of pH. Environments containing more of the OH- ion than H+ ion exhibit a higher pH
and are considered alkaline. Low pH environments, termed acidic, contain more H+ ions than
OH- ions. Generally, for a pH between 6.5 and 7.5 the environment is considered neutral.
Higher pH is considered caustic and a lower pH environment is considered more acidic, both
extremes are non-desired as well (Paul, 2000). Significant reduction in erosion-corrosion is
achieved in PWRs when pH is maintained above 9.3. Erosion corrosion rate drops
significantly at pH starting at 9.2, independent of the oxygen content (Davis et al., 1992).
6
A large number of important engineering systems operate at high temperatures (100°C)
and up) e.g. gas turbines, steam generators, incinerators, petrochemical process vessels.
Temperature increases dramatically the incidence of pH in a system. A pH of 7.5 is 100 times
more aggressive than a pH of 8.5. An idea on how temperature affects, is that for a change
between 140 and 190 oF the corrosion rate increases 2.5 times (Bloom and Daniel, 2001).
Corrosion in Secondary Side Components
Every component in a power plant has independent corrosion problems due to the
difference in material and steam conditions. This section presents how corrosion affects these
different components on the secondary cycle and the problems encountered.
Boiler
Corrosion affects the initial cost of the boiler by requiring the use of thicker walls on the
carbon steel-tubed water walls and by requiring the use of more expensive corrosion-resistant
materials for the superheater and reheater tubes if they are present. However, these more
expensive materials are also required to provide creep resistance; therefore the entire extra cost is
not directly related to corrosion. Water chemistry control equipment that is used to control
corrosion of the boiler materials is also an extra cost due to corrosion. This equipment includes
make-up water purification equipment, condensate demineralizers. Problems encountered are
impurities in make-up water and air ingress.
Turbine-Generator System
The turbine-generator system is affected mainly by requiring an optimization in the
design to prevent stress corrosion and corrosion fatigue in the rotor, disks, blades, and bolting.
This requires the use of more resistant materials (e.g., titanium alloys instead of high carbon steel
for blades), tighter control of water chemistry, and special design features to reduce stress and
7
minimize tolerances. Problems are related to condensate at high velocity that erodes blades, and
erosion of seals and gaskets.
Heat Exchangers and Piping
Heat exchangers, such as condensers, feedwater heaters, and moisture separators, require
the use of more corrosion-resistant materials, placing limits on flow velocities if carbon steel or
copper are used, so the final equipment size is increased, and increasing wall thicknesses. For
heat exchangers, cooled using raw service-water (heat sink side), corrosion control requires
installation of water treatment systems (e.g., for fish in the pond, leaves and so forth, or even the
use of dual systems, with only one heat exchanger exposed to raw water and the other cooled
using a closed cooling water system). For condensers, corrosion concerns often require the
installation of sponge ball cleaning systems. Carbon steel is probably the most used material for
U.S. PWRs, which has shown a susceptibility to erosion-corrosion. Common problems are tube-
sheet corrosion, air ingress in the low-pressure stage, condenser leaks that will attack outside
supports, and denting. Denting was discovered in 1975 when eddy-current probes were
prevented from going through tube-support plate intersections by tube diameter restrictions.
Denting is a term used to describe the localized tube diameter reduction that occurs when the
hole of a carbon steel tube supported by a plate corrodes to the point at which the corrosion
products deform the steam generator tubing (Cohen, 1989).
Piping systems require thicker walls to provide a cushion for metal dissolution; they
require the use of more corrosion-resistant materials in some areas, especially steam traps where
condensate forms, and for special applications such as valve seats, pump shafts, valve stems, and
bolting. The most frequent problem is erosion due to cavitation, or flow assisted corrosion.
Experimental work, using single and two-phase flow as well as in situ field-testing and
8
experiences in nuclear plants, indicates that wet steam erosion-corrosion is similar to that one
that occurs in single-phase situations. Pipe regions of high wear are typically those where the
metal surfaces are in contact with liquid water only (Davis et al., 1992).
On more form of corrosion identified in the last decade is what is called Tiger-striping. It
is characterized by a striping of uniform degradation on the inside diameter of a pipeline. The
damaged areas are not limited to areas of flow disturbances and have been documented in
numerous straight pipe sections. The cause of this phenomenon has not been determined with
accuracy (Davis et al., 1992). Figure 3 shows a summary of components and common problems
encountered.
The mentioned corrosion situations may evolve in different problems along the secondary
side. Some of the most important problems that they can be the reason for are:
Increase in temperature. Deposits in the line reduce the flow of steam and act as
insulators therefore reducing the heat transfer rate. The tubing will overheat at the external
surface. Rise in electrochemical potential. Experimental data have shown that corrosion products
can elevate the electrochemical potential to values where corrosion will be accelerated.
Impurity concentrations. The increase in impurity concentration ends up in corrosive
conditions. (Varrin et al., 1996)
Iron Corrosion Mechanism and Oxides
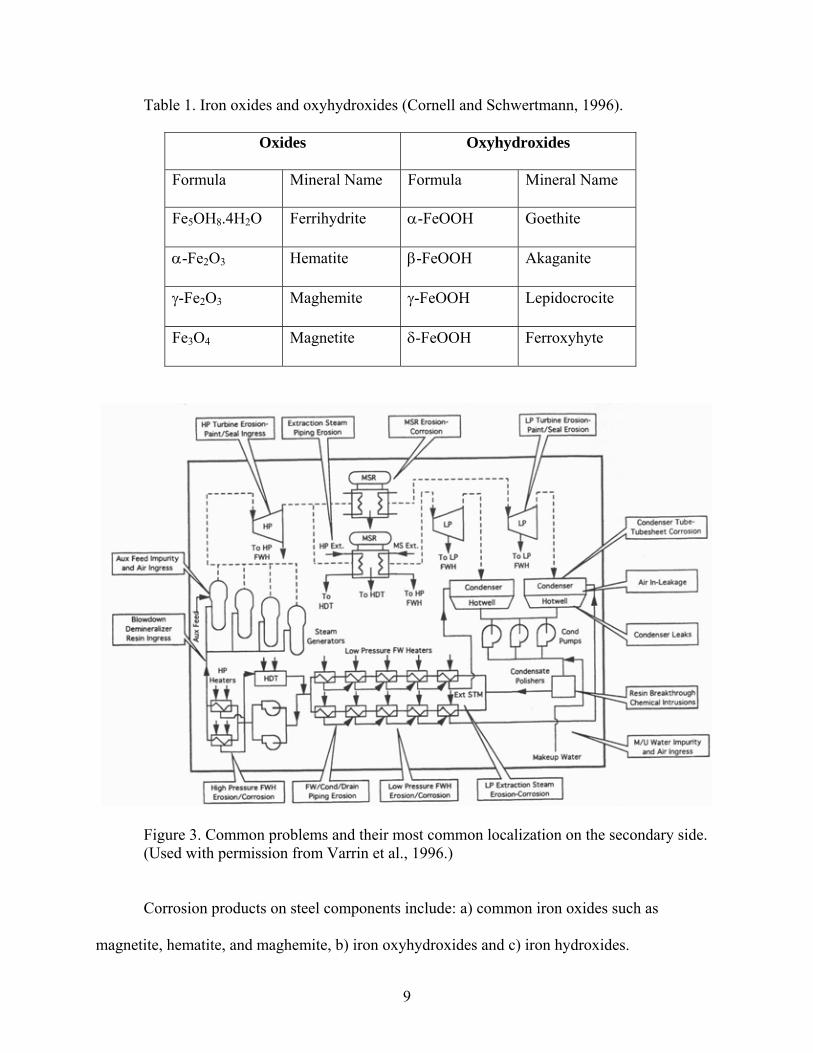
Iron Oxides formation depends on oxygen content, presence of other groups, such as
OH-, and environmental conditions in the aqueous media (Porter and Easterling, 1992). Table 1
shows a summary of them.
9
Table 1. Iron oxides and oxyhydroxides (Cornell and Schwertmann, 1996).
Oxides Oxyhydroxides
Formula Mineral Name Formula Mineral Name
Fe5OH8.4H2O Ferrihydrite α-FeOOH Goethite
α-Fe2O3 Hematite β-FeOOH Akaganite
γ-Fe2O3 Maghemite γ-FeOOH Lepidocrocite
Fe3O4 Magnetite δ-FeOOH Ferroxyhyte
Figure 3. Common problems and their most common localization on the secondary side. (Used with permission from Varrin et al., 1996.)
Corrosion products on steel components include: a) common iron oxides such as
magnetite, hematite, and maghemite, b) iron oxyhydroxides and c) iron hydroxides.
10
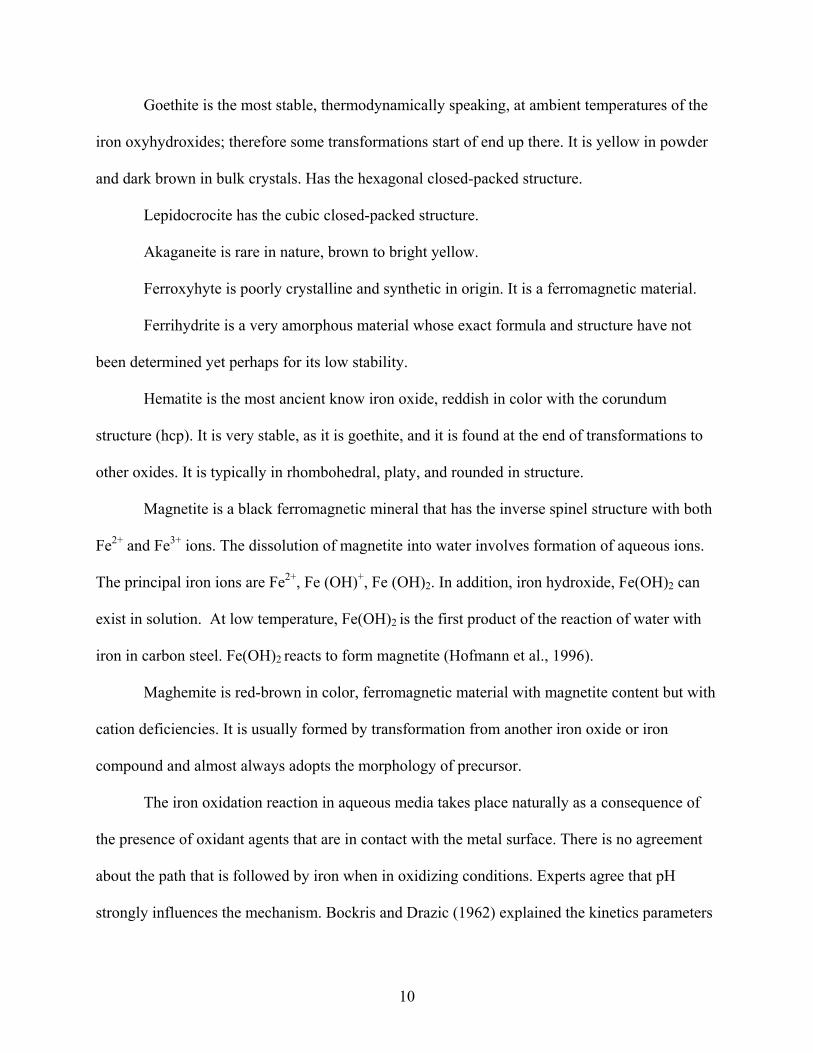
Goethite is the most stable, thermodynamically speaking, at ambient temperatures of the
iron oxyhydroxides; therefore some transformations start of end up there. It is yellow in powder
and dark brown in bulk crystals. Has the hexagonal closed-packed structure.
Lepidocrocite has the cubic closed-packed structure.
Akaganeite is rare in nature, brown to bright yellow.
Ferroxyhyte is poorly crystalline and synthetic in origin. It is a ferromagnetic material.
Ferrihydrite is a very amorphous material whose exact formula and structure have not
been determined yet perhaps for its low stability.
Hematite is the most ancient know iron oxide, reddish in color with the corundum
structure (hcp). It is very stable, as it is goethite, and it is found at the end of transformations to
other oxides. It is typically in rhombohedral, platy, and rounded in structure.
Magnetite is a black ferromagnetic mineral that has the inverse spinel structure with both
Fe2+ and Fe3+ ions. The dissolution of magnetite into water involves formation of aqueous ions.
The principal iron ions are Fe2+, Fe (OH)+, Fe (OH)2. In addition, iron hydroxide, Fe(OH)2 can
exist in solution. At low temperature, Fe(OH)2 is the first product of the reaction of water with
iron in carbon steel. Fe(OH)2 reacts to form magnetite (Hofmann et al., 1996).
Maghemite is red-brown in color, ferromagnetic material with magnetite content but with
cation deficiencies. It is usually formed by transformation from another iron oxide or iron
compound and almost always adopts the morphology of precursor.
The iron oxidation reaction in aqueous media takes place naturally as a consequence of
the presence of oxidant agents that are in contact with the metal surface. There is no agreement
about the path that is followed by iron when in oxidizing conditions. Experts agree that pH
strongly influences the mechanism. Bockris and Drazic (1962) explained the kinetics parameters

11
obtained experimentally regarding to the existence of iron hydroxides by proposing two different
ways that depend on the number of steps that can be shifted according to the conditions given by
the surrounding solution. If ferrous hydroxide or ferric hydroxides are formed the reactions will
take different paths (Montes and Mielczarski, 2003). Figure 4 shows the path and the
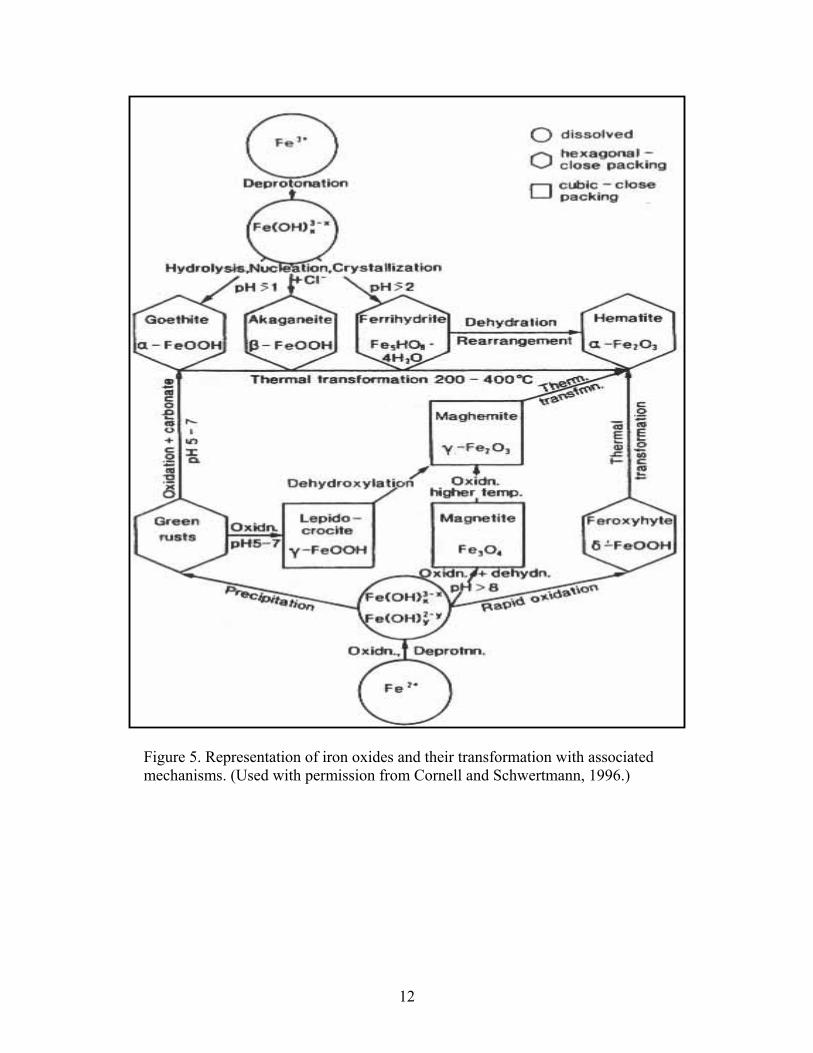
transformation mechanisms accepted for the expected iron oxides. The summary of all
transformations and their mechanisms for all iron oxides are depicted in Figure 4.
Figure 4. Pathway of transformation mechanisms accepted for some iron oxides (Cornell and Schwertmann, 1996). Although lot of work has been done regarding to corrosion inhibitors in power plants,
there still a couple of voids, such as: effect of amines in particle morphology and particle size.
Also there is not a lot of information available about DBU effects, mainly because is a new
amine in the market. This one has a particular interest for TXU’s Comanche Peak steam electric
station (CPSES). In this research mild steel was used as a test material.
To characterize these products, different techniques were used, such as, scanning electron
microscope (SEM), Fourier transform infrared spectrophotometry (FTIR), and weight loss
analysis.
Fe2+ Fe(OH)3 Fe3O4 γ-Fe2O3 α-Fe2O3
Oxidation
Oxidation, Dehydration
Oxidation at High Temperature
Thermal transformation
12
Figure 5. Representation of iron oxides and their transformation with associated mechanisms. (Used with permission from Cornell and Schwertmann, 1996.)
13
CHAPTER II
LITERATURE REVIEW
Practically all steam generators in steam power plants use some type of neutralizing
amines or a blend of neutralizing and filming amines to prevent corrosion in the secondary water
system (Bloom and Daniel, 2001). Neutralizing amines such as cyclohexyllamine,
methoxypropulamine, ethylamine (ETA), morpholine, and dimethylaminoethanol (DMA), work
by controlling pH. Barrier layer amines form a film between the metal and the condensate, thus
preventing both carbonic and oxygen attack. When they attach to the corroded metal surface,
they modify it, reducing the apparent corrosion rate. These are generally organic compounds.
The monomolecular film formed gives protection against carbonic acid attack. A clean surface is
needed, because the presence of impurities prevents film formation (Klechka, 2001).
Because high flow velocities could potentially erode the film, a continuous amine feed
directly to the main steam supply is required (Fellers et al., 2001). Some characteristics of
amines are exclusive, e.g., filming amines are likely less soluble and have volatility at high
temperatures. If an addition from an OH- group is made, its volatility will decrease and solubility
will increase. Usually a mixed amine treatment is the best solution to satisfy all needed criteria
(Turner et al., 2002). Utilities nowadays use the all volatile treatment (AVT), which keeps aside
ammonia as pH controller, data have shown that they are better agents than ammonia; they are
less volatile which guarantees a more stable pH at high temperatures. However, these amines are
absorbed with the deposits and still under research the effect they can have on deposition rates or
on the pressurized water reactor’s (PWR) tubes (Turner and Klimas, 1997).
14
The secondary water circuit in a steam power plant is always treated, almost solid-
particle free to protect mainly the turbines blades and with a basic pH to protect pipes lines and
tubing from corrosion (Fellers et al., 2001). For the last goal, industry uses two approaches, one
is a metallurgical enhancement of alloys used in steam/water conduction mainly steels and
nickel-chromium alloys and the other one is an additional water treatment with some organic
compounds. These chemical additives have the following objectives; minimize CO2 and O2
contamination and counteract corrosive conditions. To reduce levels of these gases, one has to
say first that carbon dioxide and oxygen are non-desirable molecules in this kind of system. They
usually enter the system in the low-pressure stage (condenser, steam traps, make-up water, etc).
Their levels can be greatly reduced by de-aeration plus the use of an oxygen scavenger (Yuzwa,
1998).
However this is not useful in large systems like the ones found in power plants. To
reduce corrosive conditions, industry uses two lines of attack; one is with neutralizing amines
that increase the pH level causing a delay in the corrosion rate. The second method is by adding
filming amines that create a stable film between the flow and the tube. The amine forms a barrier
between the metal and the condensate thus preventing both carbonic and oxygen attack without
affecting too much the heat transfer rate (Fiaud, 1993).
As mentioned above, water for the secondary system has to be treated to increase pH
minimizing corrosive conditions. Two are the non-desired gases that a chemist wants to
eliminate, CO2 and O2 (Bloom and Daniel, 2001). However, this is very difficult to achieve.
According to Passell et al. (1987), there is no chemistry that can fit in all possible combinations
of cooling water, materials, and components design. The main goal of the water chemistry
15
should be to have a “zero-iron chemistry” to minimize iron transportation which ultimately is the
root of corrosion problems in steam generators.
Optimizing the return of condensate for its reutilization in a PWR is an effective way to
save money, fuel, and improve thermal efficiency. A good chemical treatment in conjunction
with mechanical improvements, such as condensate polishers (where they are allowed), and
automatic dumping systems can guarantee a safe and clean return of the water to the boiler
(Bloom, 2003)
Condensate system corrosion is mostly associated with CO2, which is not corrosive until
it dissolves, forming carbonic acid in the condensate. Although water has CO2 contents,
permanent pretreatment and de-aeration can remove most of the gas, prior to its use as boiler
feedwater. Therefore, the major source of CO2 in a steam cycle is the thermal breakdown of
bicarbonate and carbonate alkalinity present in the feedwater at boiler water temperatures and
pressures. Another possible CO2 source is condensate contact with atmosphere in pumps, valves
and steam traps. To show the importance of CO2 content is that concentrations as little as 1 ppm
(a considerably low quantity) can lead to a pH of 5.5 (Bloom and Daniel, 2001).
The ideal pH for minimizing corrosion of mild steel is greater than 9.5. In spite of this,
values as low as 8.5 are usually accepted when in presence of copper alloys to minimize caustic
corrosion (Fiaud, 1993). Some operators of power plants recommend a pH range of 9.3 to 9.6 for
all ferrous systems and provide a list of some nuclear plants with PWRs over the world with the
pH the work at. The list include the Oldbury plant in the U.K. using morpholine to hold pH at
9.5, Canada’s Ontario Hydro units A and B that work between 8.8 and 9.7, Gentily-2 in Canada
works from 9.2 to 9.5, and Vandelos in Spain works at 9.85 (Passell et al., 1987). Berge et al.
(1987) inform of 31 power plants in France that used morpholine to hold pH between 9.1 and

16
9.3. pH values below 6.9 are not desirable because a decrease in solubility of corrosion products
may lead to heavier deposits (Millet and Wood, 1997).
A pH of 7.5 is 100 times more aggressive than a pH of 8.5. An idea on how temperature
affects, is that for a change between 140oF and 190oF the corrosion rate is increased 2.5 times
(Bloom, and Daniel, 2001).
O2 contents, even in low concentrations, in the presence of common impurities like
sulfates and chlorides, accelerate pitting. Praire Island unit 2 that works with a morpholine
concentration of 3 ppm in steam generator at blowdown with no operational impacts so far
(Passell et al., 1987).
Neutralizing amines, such as cyclohexyllamine, methoxypropulamine, ETA, morpholine,
and DMA, will contribute to copper corrosion if they are feed in excessive amounts or if the
amines thermally decompose in ammonia (NH3). From the above list, the latest is the least
thermally stable and decomposes at 850 oF. Their limitation is that they offer indirect protection
against O2, by raising the pH to a range where corrosion byproducts are more soluble (Bloom
and Daniel, 2001).
O2 common scavengers are sulfur, sulfides, and hydrogen sulfide. But at temperatures of
900 oF they attack copper and copper alloys (Klechka, 2001). Passell et al. (1987) refer to
Gentily-2 in Canada that uses morpholine only as oxygen scavenger.
Classification and Selection of Inhibitors in Power Industry
An inhibitor is a substance that, when added in small concentrations, decreases the
effective corrosion rate (Fiaud, 1993). There are two basic chemical inhibitors available,
neutralizing and filming amines.

17
Neutralizing amines are volatile, alkaline chemicals that increase the condensate pH
level. They offer protection against carbonic acid attack, but do not completely prevent oxygen
corrosion. Ammonia and morpholine fall into this category.
The main objective when selecting a pH reagent is to minimize the corrosion rate for the
whole tubing system. This might include protection of stainless steels (used in some heaters and
steam generator tubing), which accept a wider range of pH, and carbon steels and copper alloys
(often used for pressure heaters and/or moisture separators) which have a more limited pH range.
The ultimate driving force when selecting an amine is minimization of the SG fouling
rate, accounting too factors such as, cost, toxicity, volatility, etc (Turner et al., 2002). Next it is a
list of some aspects that have to be accounted when selecting a treatment agent:
• Transport of corrosion byproducts to the steam generator
• Impact on condensate polisher or demineralizers when they exist
• Low toxicity when released to the environment
• Thermal stability at operation temperature
• Decomposition product
• Concentration required to reach desired pH
• Commercial availability and cost (Nordmann and Fiquet, 1996)
EPRI (Electrical Power Research Institute) has developed a series of recommendation for
water chemistry and amines selection. These guidelines are revised every 2 or 3 years according
to new techniques, technologies and plant implementation. Some of the points that help chemists
are: improved and new amines, molar ratio control, and IGSCC inhibition control (Millet and
Welty).

18
According to Millet and Wood (1997) over 80% of US plants use one or more of the
following amines for pH control: ammonia, DMA, ETA, morpholine, and methoxypropylamine.
In the 1980s PWRs began replacing ammonia with AVT because its high temperature
operating pH requirement was insufficient to minimize iron transportation along the pipe lines
(Nordmann and Fiquet, 1996).
Amines
These are organic compounds, usually nitrogen based, that slow down the corrosion
process. The affinity of iron for nitrogen is low. However, it has been observed that corrosion
inhibitors adsorb better on iron in active state than in passive state. The adsorption behavior on
iron oxide is not very sensitive to the chemical structure of the adsorbing molecule, but is due to
the different nature of the surface or surface and chemical effects of the oxidized surface (Kern
and Landolt, 2001). At high temperatures the decomposition of organic amines can induce the
formation of amine compounds and or nitrile functions (Chevalier et al. 1999). The mechanism
or mechanisms by which amines inhibit fouling is it still unknown (Klimas et al., 2003).
Appendix A shows the vendor-chemical information for the used amines.
Morpholine is a colorless liquid with a characteristic amine-like odor. It is stable,
flammable, and incompatible with strong oxidizing agents, strong acids, acid chlorides, acid
anhydrides, and hygroscopic (morpholine material safety data sheet, 2002). It has been used in
French PWRs since 1984 successfully in more than 300 reactors. In 1986 Electricitie de France
(EdF) adopted morpholine as its inhibitor for two-phase erosion-corrosion control (Passell et al.,
1988). Morpholine appears to be the one of the best solutions for plants that still use copper
alloys along the pipelines. It works well than ammonia by lowering the needed pH to adequately
protect carbon steel from erosion-corrosion. Turner and Klimas (1997) mention the low
19
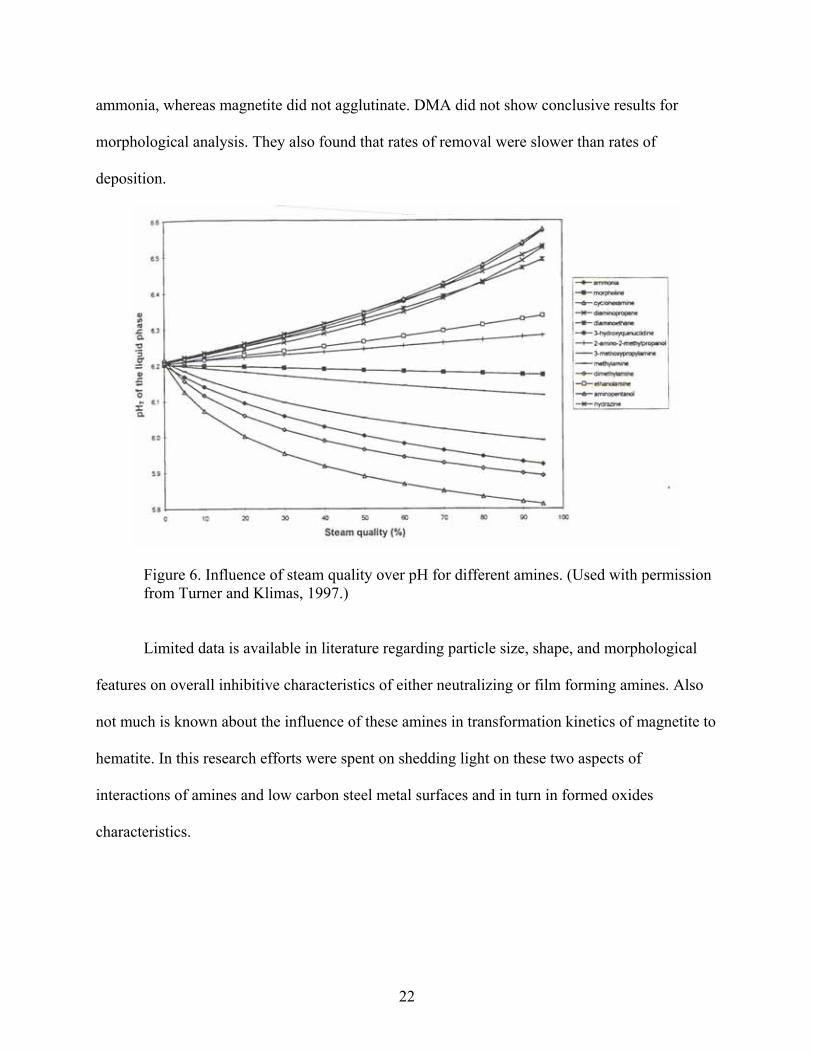
incidence of steam quality over pH change in morpholine steam mix. The initial pH of 6.2 keeps
almost unvaried when compared to other amines. Figure 6 shows that comparison. Some of
morpholine’s advantages are listed below:
• It has better distribution coefficient, close to 1, which is almost volatility, giving a better
distribution. This allows more of it to be retained in the water phase at high temperatures.
• French laboratories have studied its decomposition over a long time. Hydrolysis,
followed by oxidation, is its mechanism of decomposition.
However the disadvantages of morpholine are the higher molar concentration (measured
at a pH of 9.7), which becomes visible in condensate or blowndown polishers, and the second is
the higher chances of increasing organic compounds content (Nordmann and Fiquet, 1996).
Byproducts of morpholine are ammonia , CO2, and glycolic acid (Passell et al., 1987).
Transformation of morpholine to acetates is retarded by the presence of magnetite (Varrin et al.,
1996). A liquid chromatography study made in Quebec with the Gentilly–2 unit to investigate
the breakdown and recovery of various amines showed that morpholine was recovered on an
average of 96.4% from its initial concentration (Lamarre et al., 1989)
DMA (dimethylallylamine). With molecular formula C5H11N is a colorless liquid with a
weak but repellent odor like ammonia. It is very soluble in water, acetone, benzene, and
petroleum ether (DMA material safety data sheet, 2003). It is typically used to neutralize
carbonic acid and raise the condensate pH (Bloom, 2003). TXU’s CPSES implemented DMA to
reduce FAC and general corrosion exceeding expected inhibition levels (Fellers et al., 2001)
DBU (1,8-diazabicyclo[5.4.0]undec-7-ene) with molecular formula C9H16N2 is a light
yellow semi-viscous liquid organitrogen based (DBU material safety data sheet, 2003). It can be

20
categorized as an active base, which is noting but a substance that removes protons from
substrates in order to facilitate a reaction (Oxford University, chemistry department tutorial).
Particle Size
Not much was found on literature about particle size measurements or the method
utilized to obtain data. However, Varrin (1996) gives an idea of magnetite size in boiler systems:
• Angular crystals 2 to 12 µm
• Round or irregular pieces 0.25 to 1 µm
• Slim particles 2 to 3 µm
The predominant form was the round or irregular kind. They are considered round when the
ratio between the length and the width is close to one.
Sagochka (2003) presents values for particles accumulated on SG that were measured by
filters. The majority of particles were found to be between 0.2 and 0.4 µm
Effect of Amines in Deposit Formation
Epstein (1983) identified 5 steps in deposit accumulation: initiation, deposition,
attachment, removal from the surface, and consolidation.
The critical process is consolidation. This is the process where particles become
chemically bonded the surface, either a previous deposit or bare metal surface. This type of
deposit cannot be removed by the flow due to the strength in bond. It has been proved that sludge
consolidation involves recrystalization of solid material within the pores of the deposit (Turner
and Klimas, 1997). The driving force of deposit consolidation is precipitation of smaller
dissolved particles into the pores of the already formed deposit. In other words, the smaller
crystals act as nutrients for the bigger crystals. This is a spontaneous process that occurs because
larger crystals are more energetically favored than smaller crystals. While the formation of many
21
small crystals is kinetically favored, (i.e. they nucleate more easily) large crystals are
thermodynamically favored. The coarsening of crystals is impelled by a thermodynamic driving
force to reduce the surface to volume ratio; this in turn lowers the interfacial energy. This is what
is called Ostwald ripening (Boistelle and Astier, 1988).
Tuner et al. (2002) reported that fouling and deposit consolidation are connected. Low
fouling rates are associated with low deposition consolidation rates. Nonetheless, the reduced
rates of deposit consolidation could not account completely for the low rates encountered when
DMA and other amines are present. Their conclusion was that DMA reduced the rate of crud
deposition because the high removal rates found, which suggests that DMA lowered the
consolidation rate of deposited particles and/or enhanced the particle re-entrainment rates.
Miksic and Miller, (1980) investigated the effect of different corrosion inhibitors in pre-
cracked tension specimens in carbon steels. Plots of crack propagation versus stress intensity
showed that there was an improvement in crack growth from Hydrogen chemical absorption
when compared to inhibited water. The best of the inhibitors used was an organic nitrite salt.
In a study where pH was controlled with ammonia , morpholine , ETA, DMA, and KOH,
Turner and Klimas (1997) concluded that deposition of magnetite on Inconel 600 was a function
of steam quality (dryness), starting to decay drastically at qualities higher than 0.25 (25% of
water) when using ETA, DMA and KOH. No conclusions could be made for ammonia and
morpholine. For hematite deposition under ammonia chemistry, deposition rates where about 12
times higher than the average under similar conditions when compared to magnetite rates. This
led to conclude that when there is lower hematite to magnetite ratio, the deposition rate will
considerably lower the rate bundle fouling. In morphology they also found than hematite
particles tended to accumulate in large clusters on the surface when using morpholine and
22
ammonia, whereas magnetite did not agglutinate. DMA did not show conclusive results for
morphological analysis. They also found that rates of removal were slower than rates of
deposition.
Figure 6. Influence of steam quality over pH for different amines. (Used with permission from Turner and Klimas, 1997.)
Limited data is available in literature regarding particle size, shape, and morphological
features on overall inhibitive characteristics of either neutralizing or film forming amines. Also
not much is known about the influence of these amines in transformation kinetics of magnetite to
hematite. In this research efforts were spent on shedding light on these two aspects of
interactions of amines and low carbon steel metal surfaces and in turn in formed oxides
characteristics.

23
CHAPTER III
EXPERIMENTAL PROCEDURE
The experimental part of this research consisted of two stages. First, it was the
preparation of samples and second, the analysis of by products using different techniques for
chemical and physical characterization.
Preparation of Specimens
AISI 1018 steel coupons in dimensions of 1” wide, 2” long, and 0.125” thick from a
metal sheet were sandblasted cleaned. Then a 3/16” hole was punched so that they could be
freely suspended and not being in touch with other metallic components to avoid galvanic
corrosion. They were marked for future identification and their weight was recorded. To achieve
a recommended pH of 9.5, drops of amine were added to water while stirring the mix while
measuring the pH until a pH of 9.5 was reached. A 510 pH meter, from Oakton Corporation,
with temperature correction was used. pH calibration was made with standard pH solutions. A
set of six steel coupons were placed every time in an autoclave at 250 ºF and exposed to steam or
steam containing a specific amine. The exposure times were 1, 2, 4, 6, 8, and 12 hours. At the
end of each run, samples were dried and kept in a controlled environment in a vacuum
deseccator to avoid atmospheric corrosion when analysis could not be made right away. After
exposure to steamy conditions, samples were acid pickled with a mixture containing 5% in
volume solution of H2SO4 and 5% in volume of HCl, and agitated in an ultrasonic cleaner for 5
minutes. The objective of using this solution was to dissolve the oxides present without
removing metal. Samples were dried in an oven at 50 °C for 30 minutes following a procedure
given by Choi et al., (2001). The order and number of coupons for the analysis performed was:

24
FTIR (Fourier transform infrared spectroscopy) used five coupons; SEM (scanning electron
microscope) with one coupon used, and weight loss (same five coupons used for FTIR). Table 2
shows the chemical composition of the steel used.
Table 2. Chemical composition of steel used for experiments.
Steel grade %C % Mn % P % S 1018 0.14 - 0.20 0.60 - 0.90 0.040 0.050
Physical Analysis
Properties of deposits like the morphology were studied using SEM. Weight loss analysis
was performed to study kinetics of oxidation of steel samples with and without amine presence
in the autoclave.
Chemical Analysis
Chemical analysis basically deals with identification of the iron oxide phase present in
the deposits. Iron oxide phase formation and transformation was studied using a Perkin-Elmer
1750 spectrophotometer in transmittance mode for the first three batches (control, DBU, and
morpholine) and for the DMA batch a Thermo-Nicolet AVATAR 370 FTIR, in reflectance mode
was used simply because the Perkin Elmer was no longer available.
Scanning Electron Microscope
Like an optical microscope, the SEM is used for morphologic characterization and grain
size measurements but at greater magnification. It falls in the middle between an optical and the
transmission electron microscope (TEM) as far as resolution and image information is
concerned.
The basic principle behind the SEM is to scan a finely focused beam onto the specimen
surface to obtain the image. The beam is directed using different coils. The diameter of the beam
25
depends on the spot size used. As the electrons penetrate the surface, a number of interactions
occur which result in emission of electrons and photons. The electrons emitted from the surface
of specimen are called secondary electrons as the energy possessed by them is very small when
traveling out of the surface of the specimen. Detectors can perceive these electrons; the signal
produced is treated electronically to create an image of the surface in a cathode ray tube (CRT).
Obviously the sample must be conductive so the electrons can flow to it. That is probably the
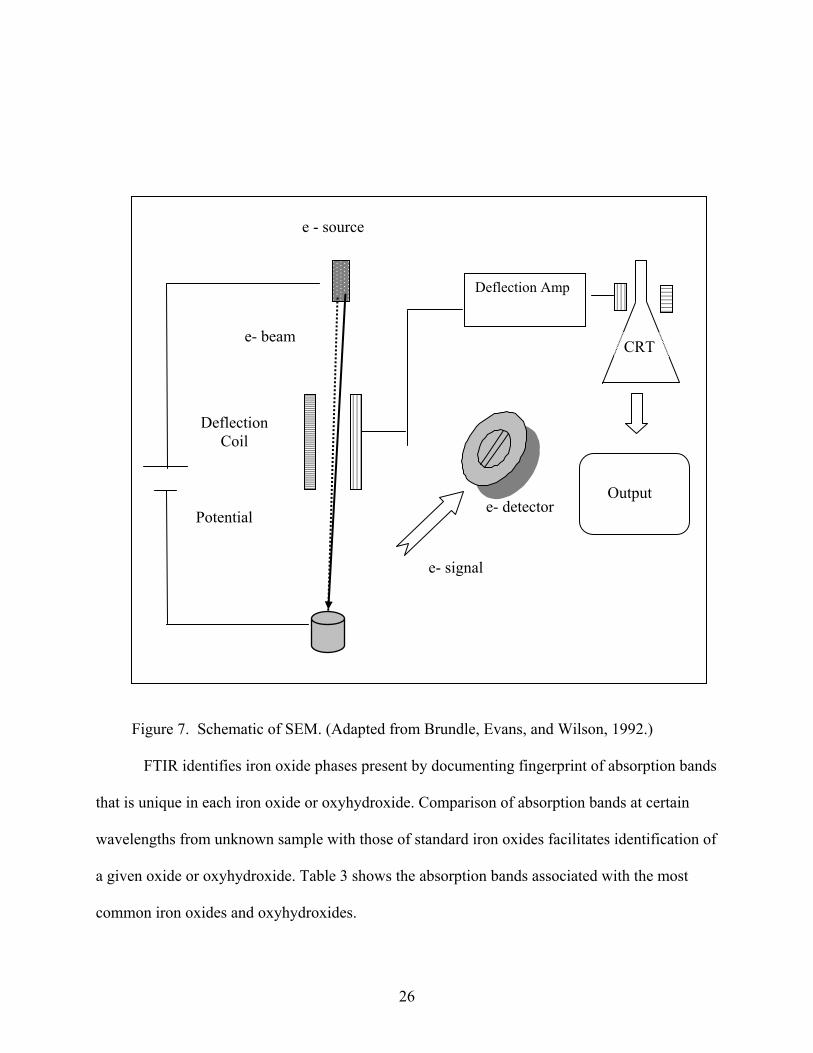
biggest constrain of the SEM technique (Brundle, Evans, and Wilson, 1992). Figure 7 shows the
schematic working principle of an SEM.
The typical energy of the primary electron beam used in SEM is in the range of 2eV-
30KeV (20 KeV was used for this work). Difference in a particular property like texture,
topography, etc at the point where the primary electron beam strikes the specimen, result in
variations in the electron current that reaches the collector, therefore, a change in the brightness
and the contrast of the CRT screen. Consequently, an image is formed which can be viewed,
transmitted or photographed. The ratio between the large scanning width on the CRT surface and
the width of the smaller raster on the specimen surface is equal to the image magnification. The
instrument used was a JEOL 840-A with digital photograph acquisition.
Fourier Transform Infrared Spectroscopy
The infrared spectroscopy consists of measuring the response of a sample subjected to
electromagnetic waves ranging from 4000 to 400 cm-1 (2.5 to50 µm) (Chevalier et al., 1999). It
is one of the few non-destructive techniques that can provide information regarding chemical
bonding in a material. It is not only useful for solid samples but liquid samples as well. The
importance of this technique is that it provides information about the material phase by observing
the chemical bonding in a material (Brundle, Evans, and Wilson, 1992).
26
Figure 7. Schematic of SEM. (Adapted from Brundle, Evans, and Wilson, 1992.)
FTIR identifies iron oxide phases present by documenting fingerprint of absorption bands
that is unique in each iron oxide or oxyhydroxide. Comparison of absorption bands at certain
wavelengths from unknown sample with those of standard iron oxides facilitates identification of
a given oxide or oxyhydroxide. Table 3 shows the absorption bands associated with the most
common iron oxides and oxyhydroxides.
Deflection Amp
CRT
e - source
e- beam
Deflection Coil
e- detector
e- signal
Potential Output

27
Table 3. FTIR absorption bands for some iron oxides and oxyhydroxides. (Used with permission from Cornell and Schwertmann, 1996.)
Iron oxide Characterictic peaks (cm-1)
Magnetite, Fe3O4 570 (very broad), 400 (broad)
Hematite, α-Fe2O3 470 (broad), 540 (very broad)
Maghemite γ-Fe2O3 700, 660, 640, 580, 460, 430 (medium sharp)
Lepidocrocite γ-FeOOH 1020, 750 (very sharp)
Goethite α-FeOOH 890, 795 (sharp always in pair)
FTIR spectra represent the twisting, bending, rotating of chemical bonds as well as the
vibrational motion of the atoms in a molecule. If Io is the infrared radiation intensity incident on
the sample, and I the intensity of the beam after it interacts with the sample, then ratio of
intensities I/Io as a function of frequency of the electromagnetic wave provides a spectrum. This
output can be presented in three formats: transmittance (the fraction of light transmitted through
the sample, which is the presentation form used in this research), reflectance (the light reflected
from the surface of the sample) and absorbance (the absorbed infrared radiation by the pellet).
The multiplicity of vibrations occurring simultaneously produces a highly complex absorption
spectrum, which is uniquely characteristic of the functional groups comprising the molecule and
also the configuration of the atoms. A detector is used to read the intensity of the light after it
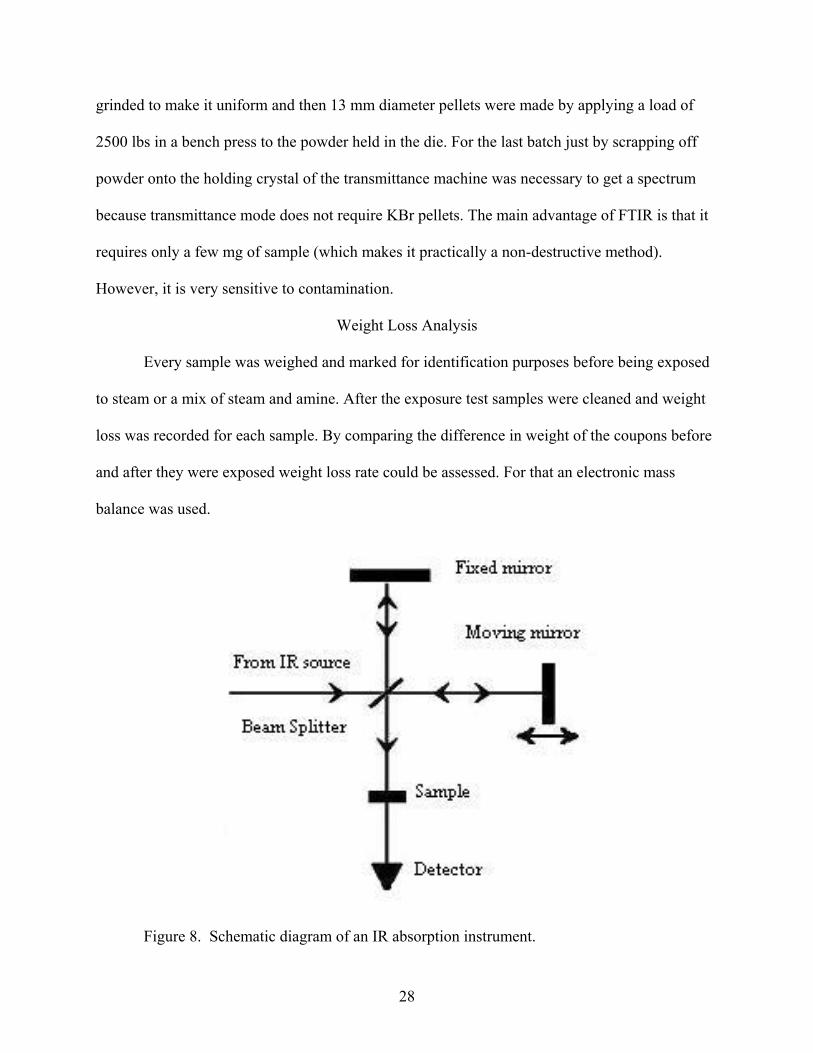
interacts with the sample. A common set up of a FTIR in transmittance mode is shown in Figure
8. The setup for reflectance module is show in Figure 9.
To prepare the samples for the first three batches (transmittance mode), 0.001 g of
powder was scratched off from exposed coupons and 0.999 g of KBr was added. The mix was
28
grinded to make it uniform and then 13 mm diameter pellets were made by applying a load of
2500 lbs in a bench press to the powder held in the die. For the last batch just by scrapping off
powder onto the holding crystal of the transmittance machine was necessary to get a spectrum
because transmittance mode does not require KBr pellets. The main advantage of FTIR is that it
requires only a few mg of sample (which makes it practically a non-destructive method).
However, it is very sensitive to contamination.
Weight Loss Analysis
Every sample was weighed and marked for identification purposes before being exposed
to steam or a mix of steam and amine. After the exposure test samples were cleaned and weight
loss was recorded for each sample. By comparing the difference in weight of the coupons before
and after they were exposed weight loss rate could be assessed. For that an electronic mass
balance was used.
Figure 8. Schematic diagram of an IR absorption instrument.

29
Figure 9. Schematic diagram of an IR reflectance module. (Adapted from the Nicolet http://www.thermo.com/com/cda/home.)
Samples Identification System
Identification of each sample consisted of a character (D for DBU, M for morpholine, and
A for DMA) followed by a sequential number. A total of 144 coupons were tested and analyzed.

30
CHAPTER IV
RESULTS AND DISCUSSION
This chapter contains analysis of results obtained for the study of influence of DBU,
morpholine, and DMA on oxidation kinetics, oxide formation/transformation in carbon steel
coupons, when exposed to 250 oF steam. This condition is relevant and of great interest to the
power industry. Specifically in certain stage of the secondary cycle in steam powered plants
when steam leaves the low pressure/temperature turbine and before entering the condenser where
the working fluid has a temperature of about 250oF and low quality. Hence, the results obtained
in this section would be relevant to that part of the secondary cycle. In this research efforts were
spent on kinetic studies, morphological analysis, and phase identification characterization using
Fourier transform infrared spectrophotometer (FTIR). Results and discussion are presented in the
aforementioned order.
Kinetics Studies
Figure 10 shows weight loss variation of steel coupons when exposed to steam containing
different types of amines as compared to plain steam. Clearly it can be seen that all steel samples
exposed to steam containing any amine show lower weight loss. Based on these results samples
exposed to plain steam (control) showed the most material loss, whereas samples exposed to
steam containing DBU appeared to have lowest corrosion rate. Steel samples exposed to steam
containing DMA followed by those tested in steam formulated by morpholine showed oxidation
rates less favorable when compared to samples exposed to DBU formulation. Comparison of this
laboratory data with actual field samples from the Comanche Peak Steam Electric Station
(CPSES) obtained by Namduri (2003) showed a significantly lower thickness loss if one

31
extrapolates these data obtained from autoclaved samples to one year of exposure. The
magnitude of thickness loss on the mentioned field samples ranges from 15 to 90 µm, where as
autoclave values range from 0.04 to 0.07 µm. This large difference originates from the fact that
in actual field conditions flow accelerated corrosion (FAC) exists, and it is not simulated in
autoclave studies.
Figure 10. Weight loss plot for AISI 1018 steel samples exposed to plain and amine containing steam for different exposure times at 250 °F.
Morphological Analysis Using Scanning Electron Microscopy (SEM)
In this research efforts were focused on surface characterization using SEM. The
importance of surface topography originates from the fact that the dense and uniform oxide
layers, that are chemically stable, provide an adequate protection of steel in a corrosive
environment. A combined analysis of surface morphology and phase identification of the oxide
32
formed on steel help corrosion engineers to assess the severity of corrosion and extent of
resistance offered by the oxide layer. This research work utilized FTIR and SEM analysis to
study interaction of amines with mild steel surfaces while forming an oxide layer during wet
corrosion reactions taking place on mild steel surfaces inside an autoclave. SEM results obtained
for AISI 1018 steel coupons exposed to plain steam followed by those for steam with DBU,
morpholine and DMA are presented.
Morphological Analysis of Steel Samples Exposed to Plain Steam
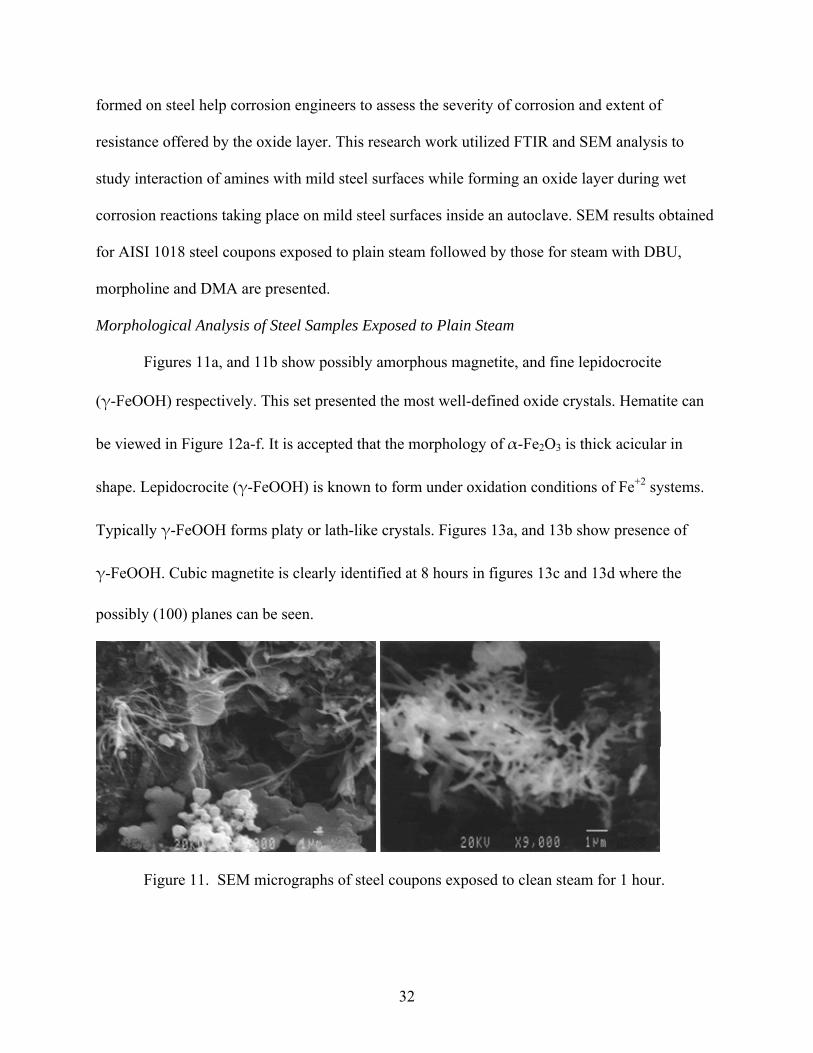
Figures 11a, and 11b show possibly amorphous magnetite, and fine lepidocrocite
(γ-FeOOH) respectively. This set presented the most well-defined oxide crystals. Hematite can
be viewed in Figure 12a-f. It is accepted that the morphology of α-Fe2O3 is thick acicular in
shape. Lepidocrocite (γ-FeOOH) is known to form under oxidation conditions of Fe+2 systems.
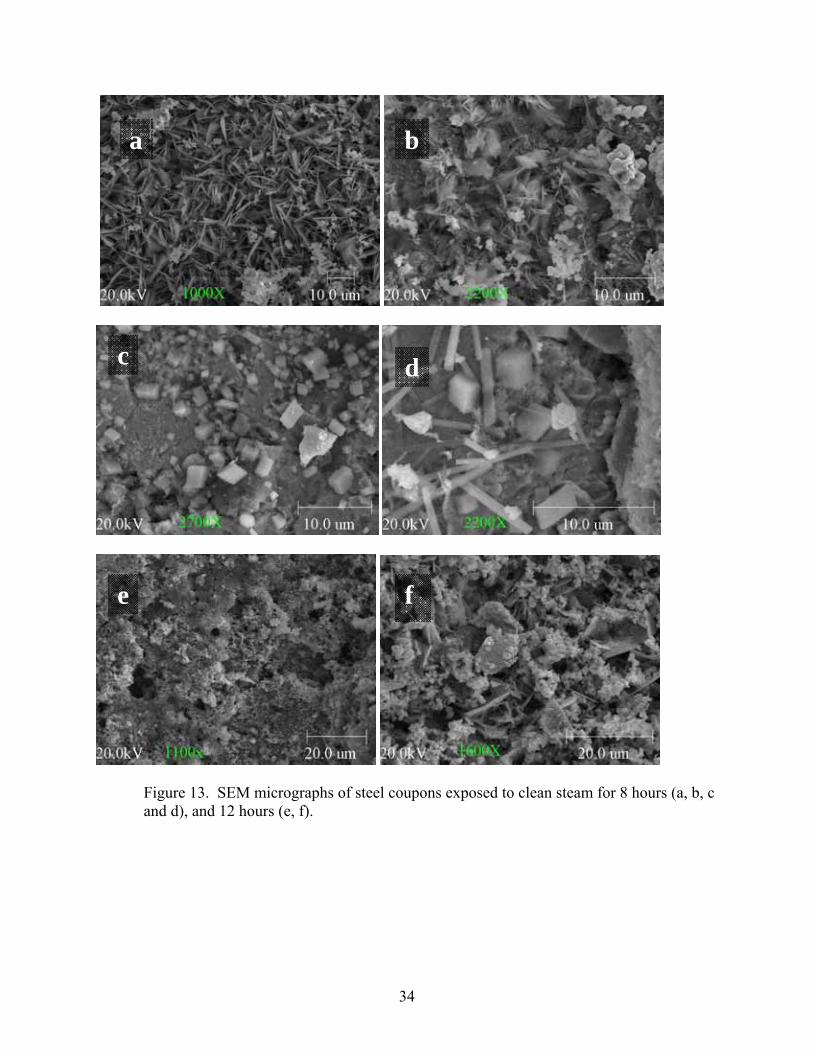
Typically γ-FeOOH forms platy or lath-like crystals. Figures 13a, and 13b show presence of
γ-FeOOH. Cubic magnetite is clearly identified at 8 hours in figures 13c and 13d where the
possibly (100) planes can be seen.
Figure 11. SEM micrographs of steel coupons exposed to clean steam for 1 hour.

33
Figure 12. SEM micrographs of steel coupons exposed to clean steam for 2 hours (a, b), 4 hours (c, d), 6 hours (e, f).
b a
c d
e f
34
Figure 13. SEM micrographs of steel coupons exposed to clean steam for 8 hours (a, b, c and d), and 12 hours (e, f).
a b
c d
e f
35
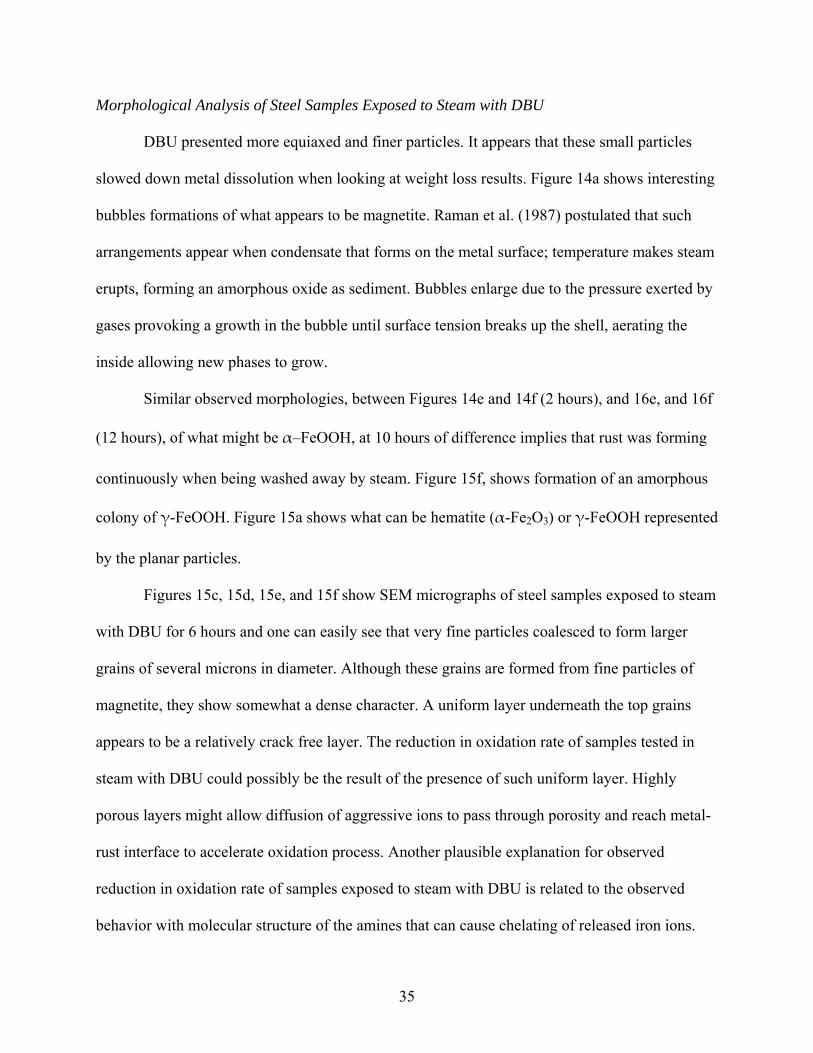
Morphological Analysis of Steel Samples Exposed to Steam with DBU
DBU presented more equiaxed and finer particles. It appears that these small particles
slowed down metal dissolution when looking at weight loss results. Figure 14a shows interesting
bubbles formations of what appears to be magnetite. Raman et al. (1987) postulated that such
arrangements appear when condensate that forms on the metal surface; temperature makes steam
erupts, forming an amorphous oxide as sediment. Bubbles enlarge due to the pressure exerted by
gases provoking a growth in the bubble until surface tension breaks up the shell, aerating the
inside allowing new phases to grow.
Similar observed morphologies, between Figures 14e and 14f (2 hours), and 16e, and 16f
(12 hours), of what might be α–FeOOH, at 10 hours of difference implies that rust was forming
continuously when being washed away by steam. Figure 15f, shows formation of an amorphous
colony of γ-FeOOH. Figure 15a shows what can be hematite (α-Fe2O3) or γ-FeOOH represented
by the planar particles.
Figures 15c, 15d, 15e, and 15f show SEM micrographs of steel samples exposed to steam
with DBU for 6 hours and one can easily see that very fine particles coalesced to form larger
grains of several microns in diameter. Although these grains are formed from fine particles of
magnetite, they show somewhat a dense character. A uniform layer underneath the top grains
appears to be a relatively crack free layer. The reduction in oxidation rate of samples tested in
steam with DBU could possibly be the result of the presence of such uniform layer. Highly
porous layers might allow diffusion of aggressive ions to pass through porosity and reach metal-
rust interface to accelerate oxidation process. Another plausible explanation for observed
reduction in oxidation rate of samples exposed to steam with DBU is related to the observed
behavior with molecular structure of the amines that can cause chelating of released iron ions.

36
Figure 14. SEM micrographs of steel coupons exposed to 3ppm DBU+ steam for 1 hour (a, b, c), and 2 hours (d, e, f).
a b
c d
e f
37
Figure 15. SEM micrographs of steel coupons exposed to 3ppm DBU+ steam for 4 hour (a, b), and 6 hours (c, d, e, and f).
f
a b
c d
e

38
Figure 16. SEM micrographs of steel coupons exposed to 3ppm DBU+ steam for 8 hour (a, b, and c), and 12 hours (d, e, and f).
a b
c d
e f

39
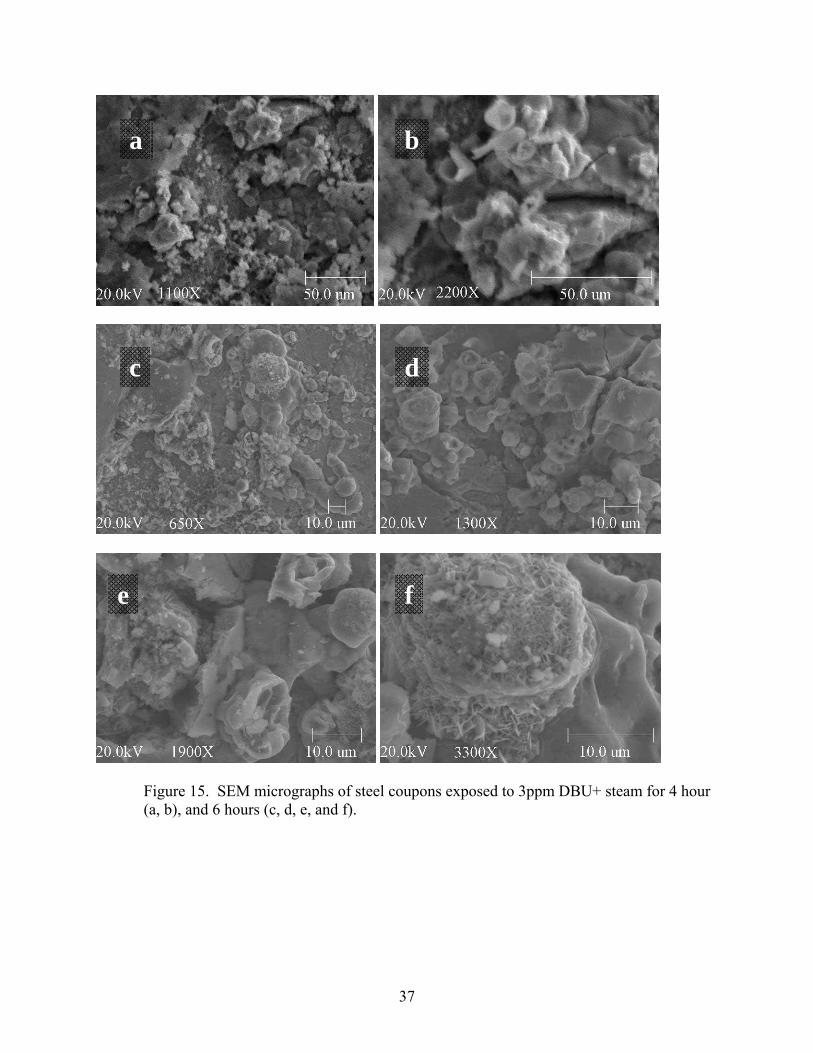
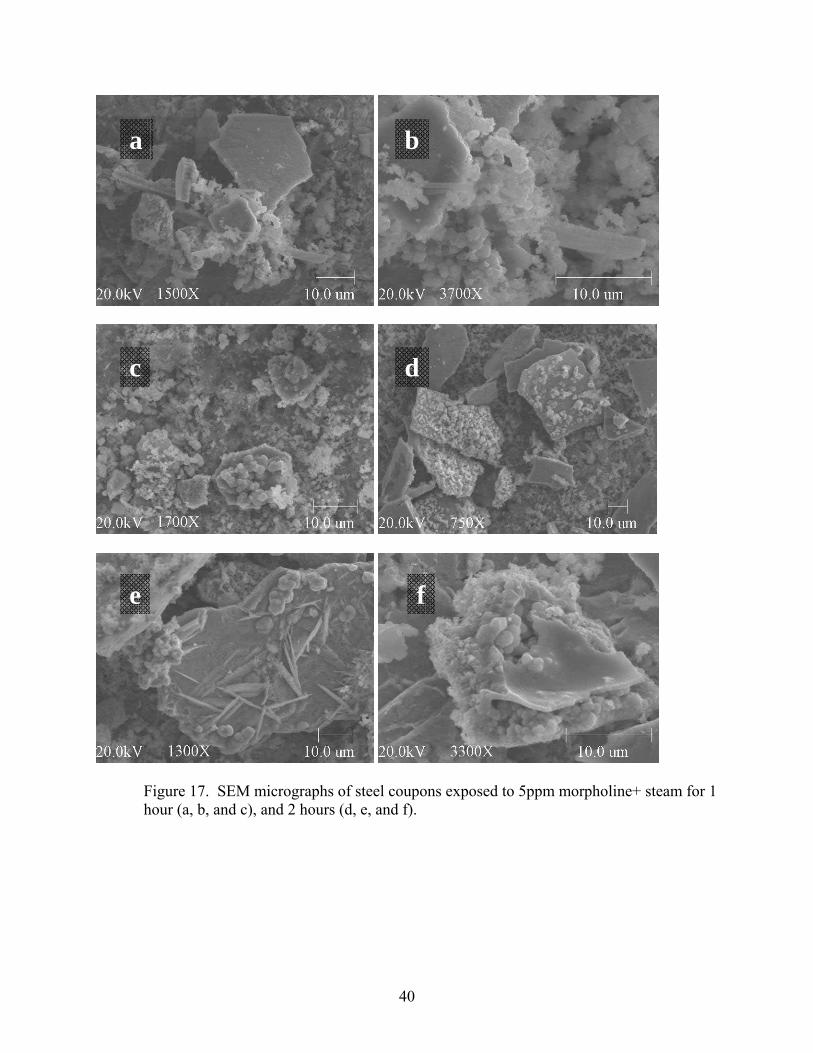
Morphological Analysis of Steel Samples Exposed to Steam with Morpholine
Figures 17 through 19 show SEM micrographs of steel samples exposed to steam
containing 5 ppm of morpholine. As one can easily see from these micrographs, morpholine
favors formation of coarse flakes even after 2 hours of exposure (Figure 17a-f). Particle size of
such flakes ranges from 1 to 70 µm. FTIR spectra indicated dominant presence of magnetite in
samples exposed up to six hours and hematite in other samples. Therefore one can assume that
these coarse particles shown in Figures 17a-e and 18a-e are mostly magnetite. Fine sandy grains
appeared to form initially and later agglomerated to form coarse grains. Longer exposure times
(8 and 12 hours) led to conversion of magnetite to hematite as indicated by FTIR results. SEM
micrographs, of corresponding samples depicted in Figure 19a-f, show formation of acicular and
thin platelets that are typical characteristics of α–Fe2O3.
An interesting observation is related to the presence of relatively dispersed grains on top
of each flake. It appears that oxide formation takes place in sequential order. Once growth of a
layer ends, formation of a new layer starts at the surface and by a process of nucleation and
growth the oxidation proceeds to form multi layered structures seen in many cases in the
literature (Nasrazadani et al. 1987, 1988). This case of thin platelets of hematite formed on layers
of magnetite is clearly demonstrated in Figures 17e and 18f. Some lepidocrocite that has cubic
crystal structure forms as cubic grains as depicted in Figure 19f.
Overall morpholine showed a tendency to form equiaxed grains initially and acicular
grains at longer exposure times.
40
Figure 17. SEM micrographs of steel coupons exposed to 5ppm morpholine+ steam for 1 hour (a, b, and c), and 2 hours (d, e, and f).
a b
c d
e f
41
Figure 18. SEM micrographs of steel coupons exposed to 5ppm morpholine+ steam for 4 hours (a, b, and c), and 6 hours (d, e, and f).
fe
dc
a b

42
Figure 19. SEM micrographs of steel coupons exposed to 5ppm morpholine+ steam for 8 hours (a, b, c, and d), and 12 hours (e and f).
fe
dc
a b
43
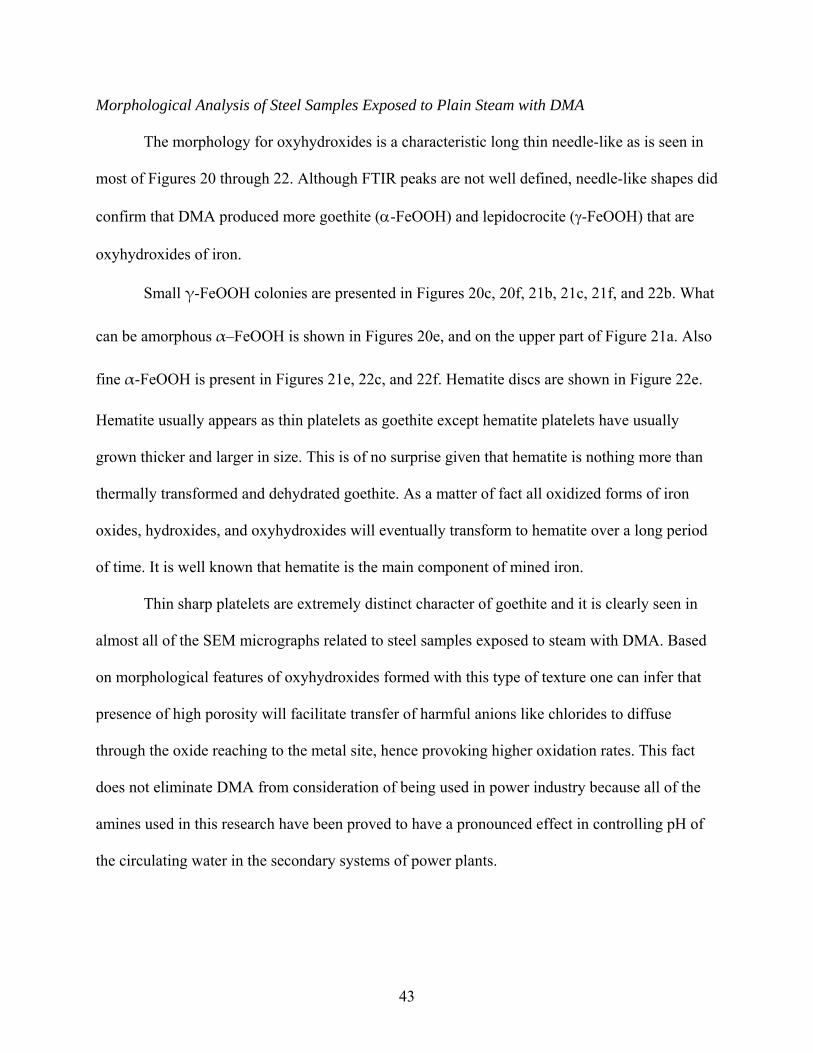
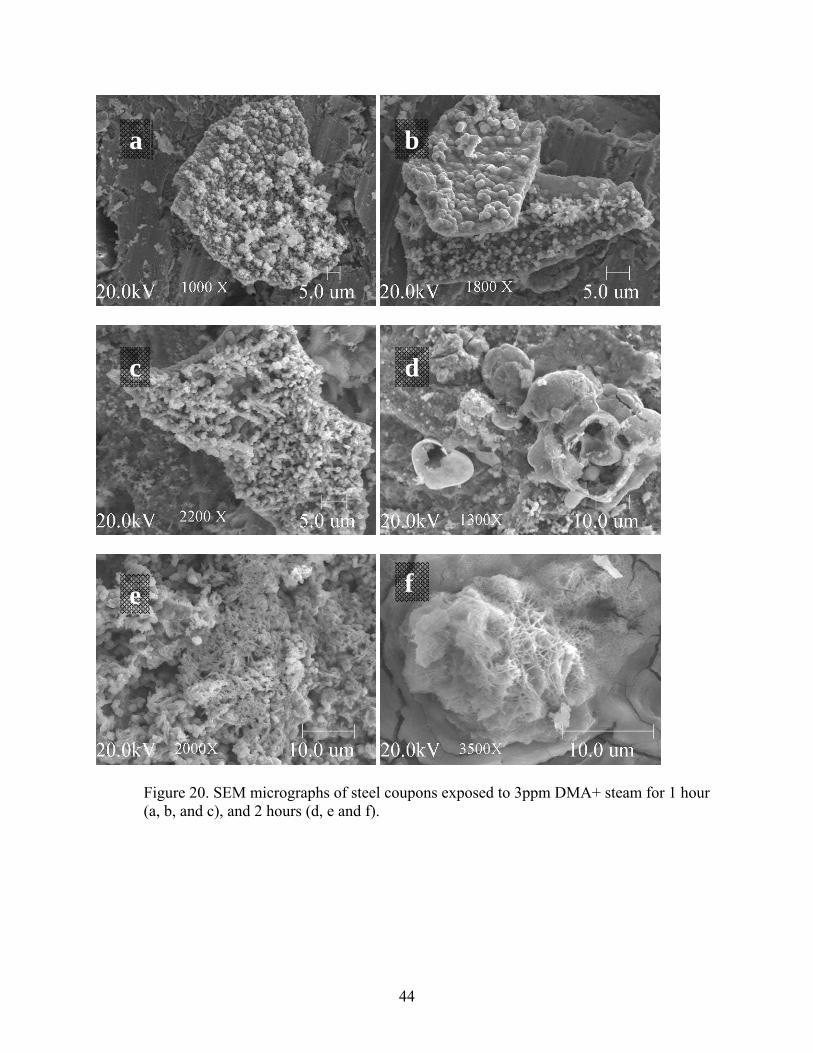
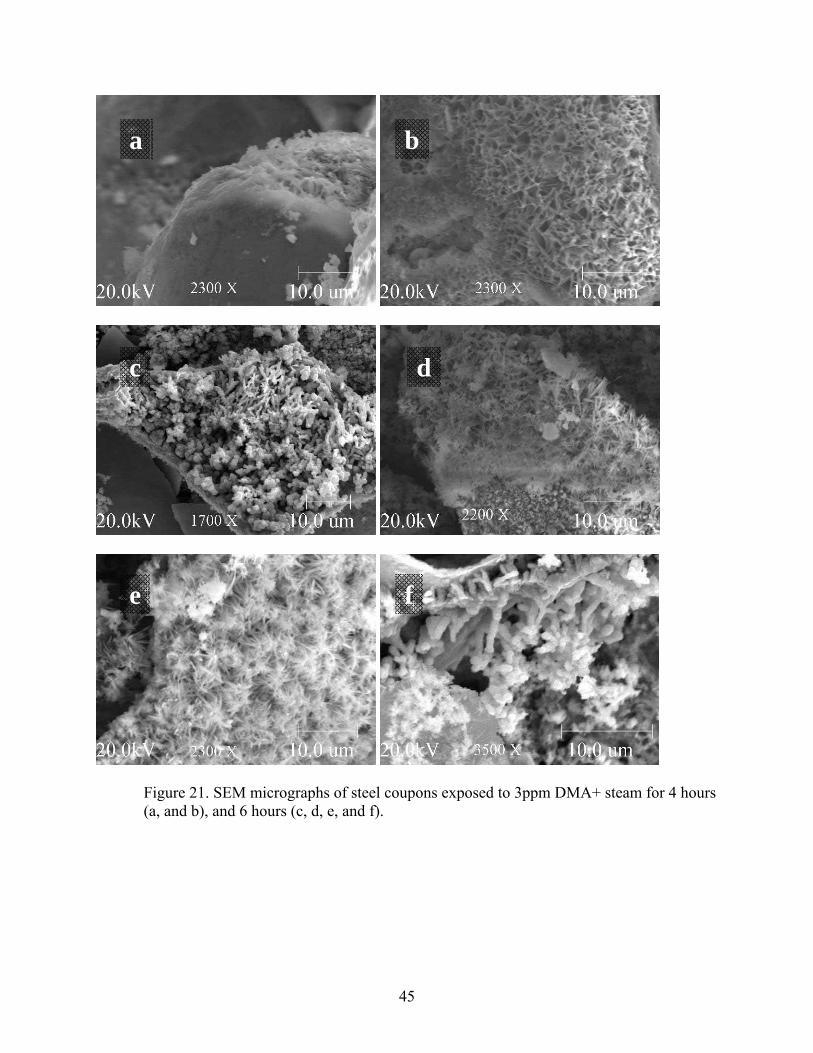
Morphological Analysis of Steel Samples Exposed to Plain Steam with DMA
The morphology for oxyhydroxides is a characteristic long thin needle-like as is seen in
most of Figures 20 through 22. Although FTIR peaks are not well defined, needle-like shapes did
confirm that DMA produced more goethite (α-FeOOH) and lepidocrocite (γ-FeOOH) that are
oxyhydroxides of iron.
Small γ-FeOOH colonies are presented in Figures 20c, 20f, 21b, 21c, 21f, and 22b. What
can be amorphous α–FeOOH is shown in Figures 20e, and on the upper part of Figure 21a. Also
fine α-FeOOH is present in Figures 21e, 22c, and 22f. Hematite discs are shown in Figure 22e.
Hematite usually appears as thin platelets as goethite except hematite platelets have usually
grown thicker and larger in size. This is of no surprise given that hematite is nothing more than
thermally transformed and dehydrated goethite. As a matter of fact all oxidized forms of iron
oxides, hydroxides, and oxyhydroxides will eventually transform to hematite over a long period
of time. It is well known that hematite is the main component of mined iron.
Thin sharp platelets are extremely distinct character of goethite and it is clearly seen in
almost all of the SEM micrographs related to steel samples exposed to steam with DMA. Based
on morphological features of oxyhydroxides formed with this type of texture one can infer that
presence of high porosity will facilitate transfer of harmful anions like chlorides to diffuse
through the oxide reaching to the metal site, hence provoking higher oxidation rates. This fact
does not eliminate DMA from consideration of being used in power industry because all of the
amines used in this research have been proved to have a pronounced effect in controlling pH of
the circulating water in the secondary systems of power plants.
44
Figure 20. SEM micrographs of steel coupons exposed to 3ppm DMA+ steam for 1 hour (a, b, and c), and 2 hours (d, e and f).
e
dc
a b
f
45
Figure 21. SEM micrographs of steel coupons exposed to 3ppm DMA+ steam for 4 hours (a, and b), and 6 hours (c, d, e, and f).
e
c d
ba
f
46
Figure 22. SEM micrographs of steel coupons exposed to 3ppm DMA+ steam for 8 hours (a, b, and c), and 12 hours (d, e, and f).
fe
dc
ba

47
Summary of Morphological Features
The control set produced more crystalline grains especially at the longer exposure times
(Figure 13a-f), DBU produced fine grains (Figures, 14, 15, and 16). Morpholine produced bulky
and porous particles (Figures, 17, 18, and 19), and DMA (Figures, 20, 21, and 22)showed mostly
thin porous formations.
Based on the observed images, it is noticed that control and DMA samples showed
acicular structure, whereas DBU and morpholine showed more equiaxed grains. FTIR results
indicated presence of magnetite in morpholine exposed samples (Nasrazadani and Raman, 1991).
However, those sets in some cases showed consolidation of acicular grains as well.
Higher oxidation rates were seen from consecutive exposure times. This can lead one to
conclude that the inhibition effect of amines vanishes at longer exposure times. One should also
note that these chemical are very volatile, and it is believed that after one loop circulation in the
secondary cycle they are thermally broken down. This observation confirms what Feller et al.
(2001) stated about keeping a continuous feed along the line to maintain non-aggressive
conditions.
Phase Formation and Transformation Analysis using FTIR
The main purpose of this analysis was to observe the relative delay in magnetite
transformation to hematite. Delay in this phase transformation is favorable due to general belief
that magnetite in crystalline form provides a passivating layer on steel surface that protects metal
from accelerated corrosion. Extensive discussion is found on literature about magnetite’s
passivation characteristics. It forms a protective film that inhibits further metal dissolution
(Nasrazadani, 1997, Tsuru et al., 1990, Novakovsky, 1965). Another oxide that is highly close to
magnetite is maghemite that in fact is somewhat oxidized form of magnetite. Differentiation of
48
these two forms of iron oxide is not an easy task. These two phases usually form in a solid
solution that is difficult to separate using x-ray diffraction technique that is commonly used by
industry. Fortunately our research group has developed a method based on FTIR spectra of these
two oxides so that on can examine the FTIR spectra and be able to get an idea of whether either
one or a mixture of these two phases are present. Fingerprint FTIR spectra of different iron
oxides and oxyhydroxides are unique, and this facilitates identification of these materials
(Nasrazadani, 1993).
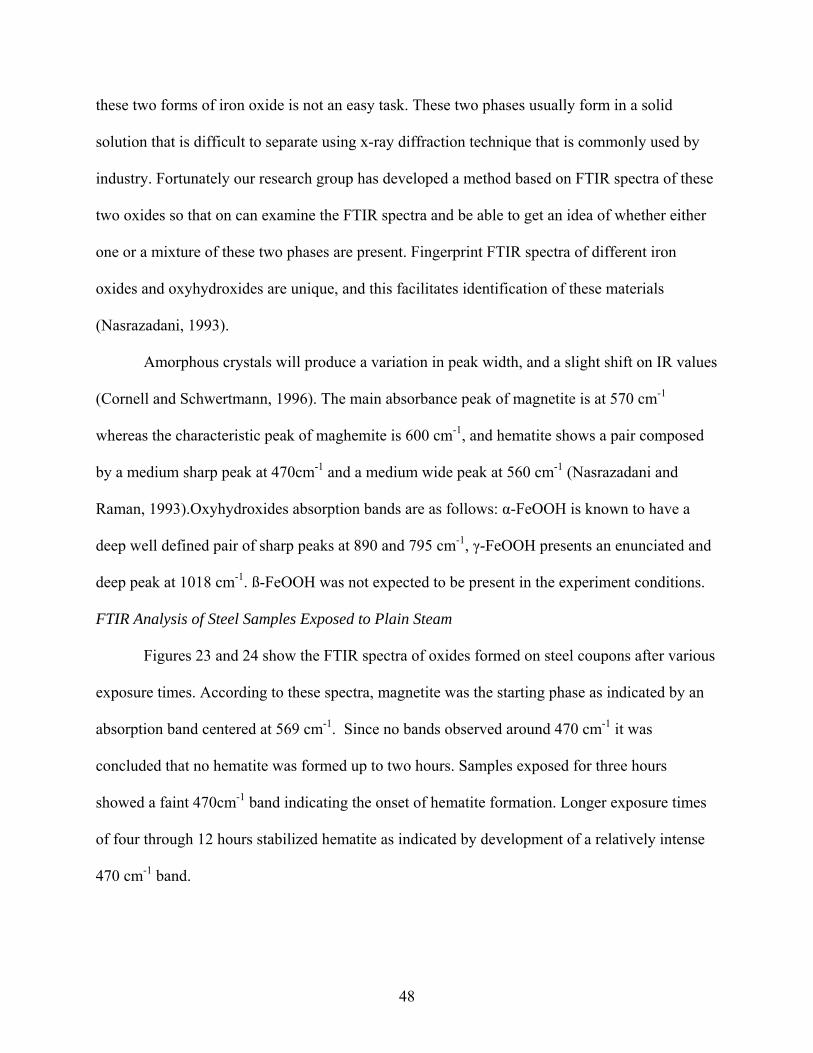
Amorphous crystals will produce a variation in peak width, and a slight shift on IR values
(Cornell and Schwertmann, 1996). The main absorbance peak of magnetite is at 570 cm-1
whereas the characteristic peak of maghemite is 600 cm-1, and hematite shows a pair composed
by a medium sharp peak at 470cm-1 and a medium wide peak at 560 cm-1 (Nasrazadani and
Raman, 1993).Oxyhydroxides absorption bands are as follows: α-FeOOH is known to have a
deep well defined pair of sharp peaks at 890 and 795 cm-1, γ-FeOOH presents an enunciated and
deep peak at 1018 cm-1. ß-FeOOH was not expected to be present in the experiment conditions.
FTIR Analysis of Steel Samples Exposed to Plain Steam
Figures 23 and 24 show the FTIR spectra of oxides formed on steel coupons after various
exposure times. According to these spectra, magnetite was the starting phase as indicated by an
absorption band centered at 569 cm-1. Since no bands observed around 470 cm-1 it was
concluded that no hematite was formed up to two hours. Samples exposed for three hours
showed a faint 470cm-1 band indicating the onset of hematite formation. Longer exposure times
of four through 12 hours stabilized hematite as indicated by development of a relatively intense
470 cm-1 band.
49
FTIR Analysis of Steel Samples Exposed to Steam with DBU
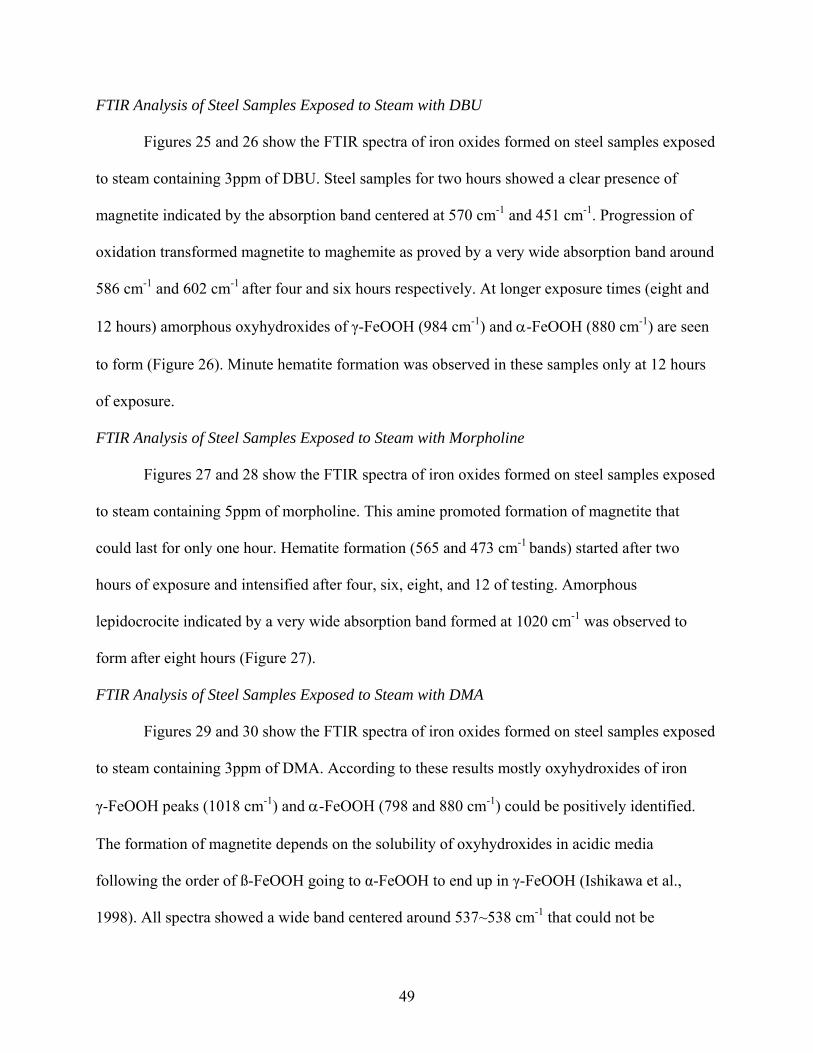
Figures 25 and 26 show the FTIR spectra of iron oxides formed on steel samples exposed
to steam containing 3ppm of DBU. Steel samples for two hours showed a clear presence of
magnetite indicated by the absorption band centered at 570 cm-1 and 451 cm-1. Progression of
oxidation transformed magnetite to maghemite as proved by a very wide absorption band around
586 cm-1 and 602 cm-1 after four and six hours respectively. At longer exposure times (eight and
12 hours) amorphous oxyhydroxides of γ-FeOOH (984 cm-1) and α-FeOOH (880 cm-1) are seen
to form (Figure 26). Minute hematite formation was observed in these samples only at 12 hours
of exposure.
FTIR Analysis of Steel Samples Exposed to Steam with Morpholine
Figures 27 and 28 show the FTIR spectra of iron oxides formed on steel samples exposed
to steam containing 5ppm of morpholine. This amine promoted formation of magnetite that
could last for only one hour. Hematite formation (565 and 473 cm-1 bands) started after two
hours of exposure and intensified after four, six, eight, and 12 of testing. Amorphous
lepidocrocite indicated by a very wide absorption band formed at 1020 cm-1 was observed to
form after eight hours (Figure 27).
FTIR Analysis of Steel Samples Exposed to Steam with DMA
Figures 29 and 30 show the FTIR spectra of iron oxides formed on steel samples exposed
to steam containing 3ppm of DMA. According to these results mostly oxyhydroxides of iron
γ-FeOOH peaks (1018 cm-1) and α-FeOOH (798 and 880 cm-1) could be positively identified.
The formation of magnetite depends on the solubility of oxyhydroxides in acidic media
following the order of ß-FeOOH going to α-FeOOH to end up in γ-FeOOH (Ishikawa et al.,
1998). All spectra showed a wide band centered around 537~538 cm-1 that could not be

50
associated with any of the oxides or oxyhydroxides. More research needs to be done to clarify
this issue. A comparison summary of FTIR spectra of samples exposed for four hours in different
environments is given in Figure 31. It can be clearly seen that control set developed hematite
peaks at 567 and 474 cm-1. The morpholine set showed some hematite presence (569 and 459
cm-1 bands) but no hematite was detected in samples tested with DBU and DMA steam. Tables 4
and 5 show a summary of phases identified by FTIR and morphology results respectively.

51
Table 4. Summary of iron oxides and oxyhydroxides phases identified by FTIR.
1 hour 2 hours 4 hours 6 hours 8 hours 12 hours
Control N/A Magnetite,
hematite,
γ-FeOOH
Hematite,
γ-FeOOH
Hematite,
amorphous
γ-FeOOH
Hematite,
γ-FeOOH
Hematite,
amorphous
γ–FeOOH
DBU N/A Amorphous
magnetite
γ-FeOOH,
amorphous
maghemite,
γ–FeOOH
amorphous,
maghemite.
Magnetite
amorphous
γ–FeOOH
amorphous
γ–FeOOH,
amorphous
Hematite,
unidentified
peaks
Morpholine Amorphous
magnetite
Magnetite
traces of
hematite
Amorphous
magnetite
Hematite Amorphous
γ–FeOOH,
hematite
Amorphous
γ–FeOOH,
hematite
DMA Fe complex Fe complex,
amorphous
γ–FeOOH,
α –FeOOH
Fe complex
γ–FeOOH,
amorphous
α –FeOOH
Fe complex
amorphous
γ –FeOOH
Fe complex Fe complex,
γ–FeOOH,
α –FeOOH

52
Table 5. Summary of morphologies identified by SEM.
1 Hour 2 Hours 4 Hours 6 Hours 8 Hours 12 Hours
Control Acicular Acicular Acicular Acicular Acicular,
crystalline
Acicular
DBU Equiaxed Equiaxed Equiaxed Equiaxed Equiaxed Equiaxed
Morpholine Equiaxed,
Clusters
Equiaxed,
Clusters
Porous,
flakes
Flakes Flakes Flakes
DMA Acicular Acicular Acicular Acicular Acicular Acicular

53
Figure 23. FTIR spectra of oxides formed on steel coupons exposed to steam for 2, 3 and 4 hours set at 250 oF.
432
569
473573
474
568
Control 2 hrs
Control 3 hrs
Control 4 hrs
30
35 40 45 50 55
60 65 70 75 80 85
90 95
100 105 110
600 800 1000 1200 1400
Wavenumber (Cm-1)
%Tr
ansm
ittan
ce

54
Figure 24. FTIR spectra of oxides formed on steel coupons exposed to steam for 6, 8 and 12 hours set at 250 oF.
474
567
893 1019
474
574
1018
471
572
980
Control 6 hrs
Control 8 hrs
Control 12 hrs
15
20
25
30
35
40
45
50
55
60
65
70
75 %
Tran
smitt
ance
600 800 1000 1200 1400
Wavenumber (Cm-1)
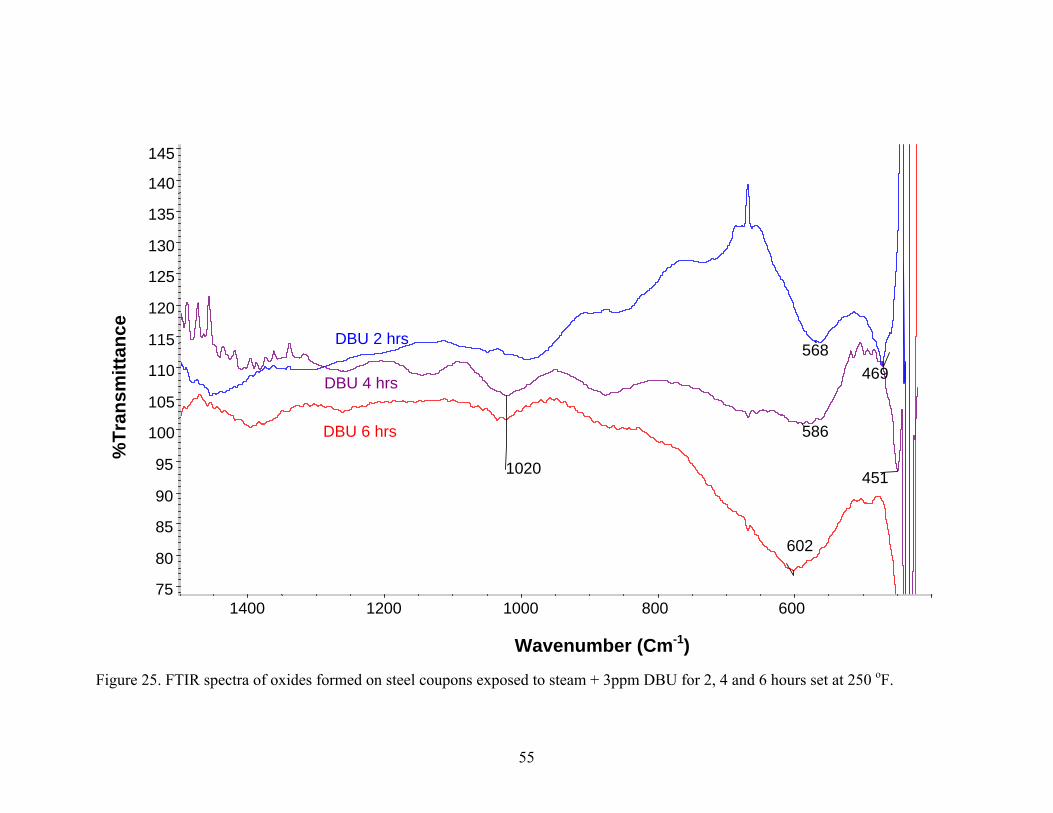
55
Figure 25. FTIR spectra of oxides formed on steel coupons exposed to steam + 3ppm DBU for 2, 4 and 6 hours set at 250 oF.
469568
451
586
1020
602
DBU 2 hrs
DBU 4 hrs
DBU 6 hrs
75
80
85
90
95
100
105
110
115
120
125
130
135
140
145
600 800 1000 1200 1400
%Tr
ansm
ittan
ce
Wavenumber (Cm-1)
56
Figure 26. FTIR spectra of oxides formed on steel coupons exposed to steam + 3ppm DBU for 8, and 12 hours set at 250 oF.
439
576
458
572734
984
DBU 8 hrs
DBU 12 hrs
35
40
45
50
55
60
65
70
75
80
85
90
95
600 800 1000 1200 1400
%Tr
ansm
ittan
ce
Wavenumber (Cm-1)
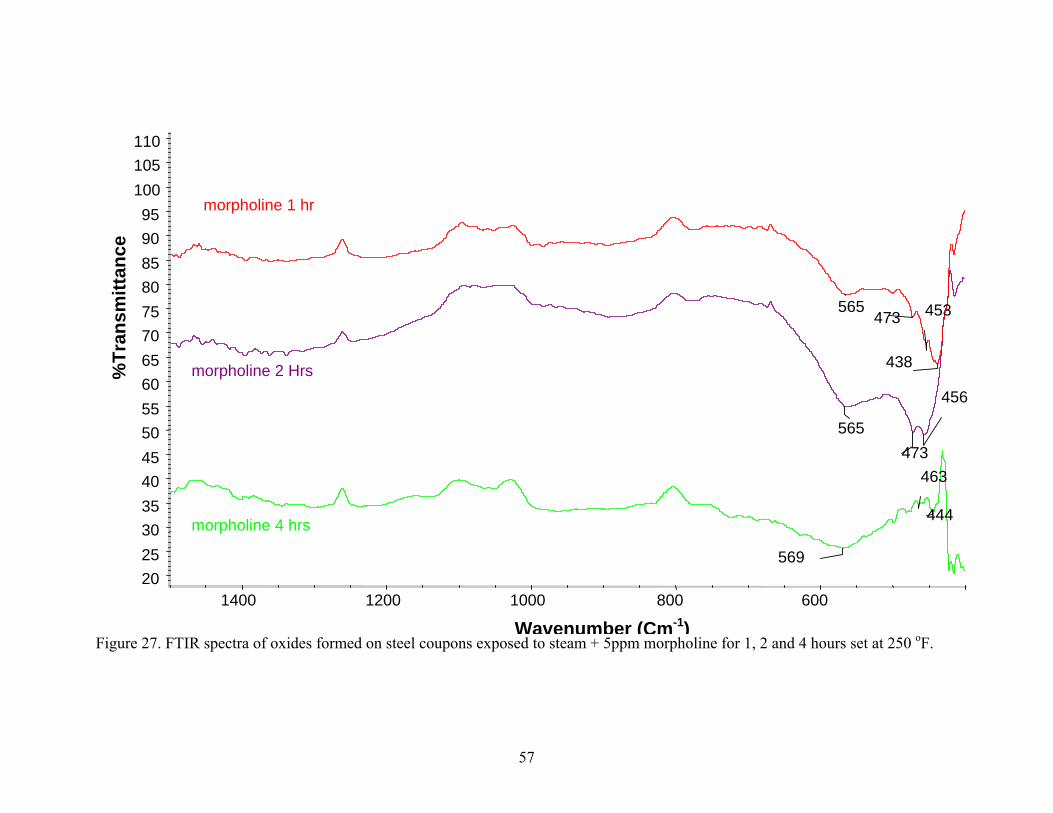
57
Figure 27. FTIR spectra of oxides formed on steel coupons exposed to steam + 5ppm morpholine for 1, 2 and 4 hours set at 250 oF.
438
453473565
456
473565
444
463
569
morpholine 1 hr
morpholine 2 Hrs
morpholine 4 hrs
20 25 30 35 40 45 50 55 60 65 70 75 80 85 90 95
100 105 110
600 800 1000 1200 1400
Wavenumber (Cm-1)
%Tr
ansm
ittan
ce
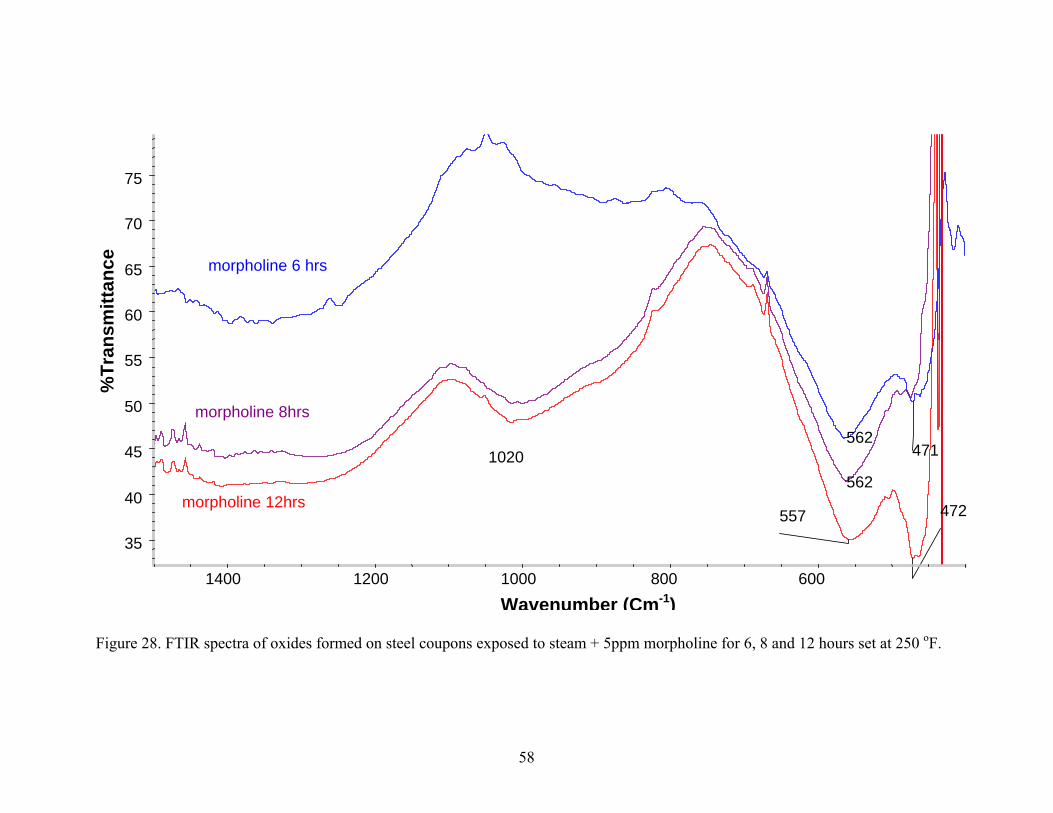
58
Figure 28. FTIR spectra of oxides formed on steel coupons exposed to steam + 5ppm morpholine for 6, 8 and 12 hours set at 250 oF.
471562
562
472557
morpholine 6 hrs
morpholine 8hrs
morpholine 12hrs
35
40
45
50
55
60
65
70
75
600 800 1000 1200 1400
Wavenumber (Cm-1)
%Tr
ansm
ittan
ce
1020
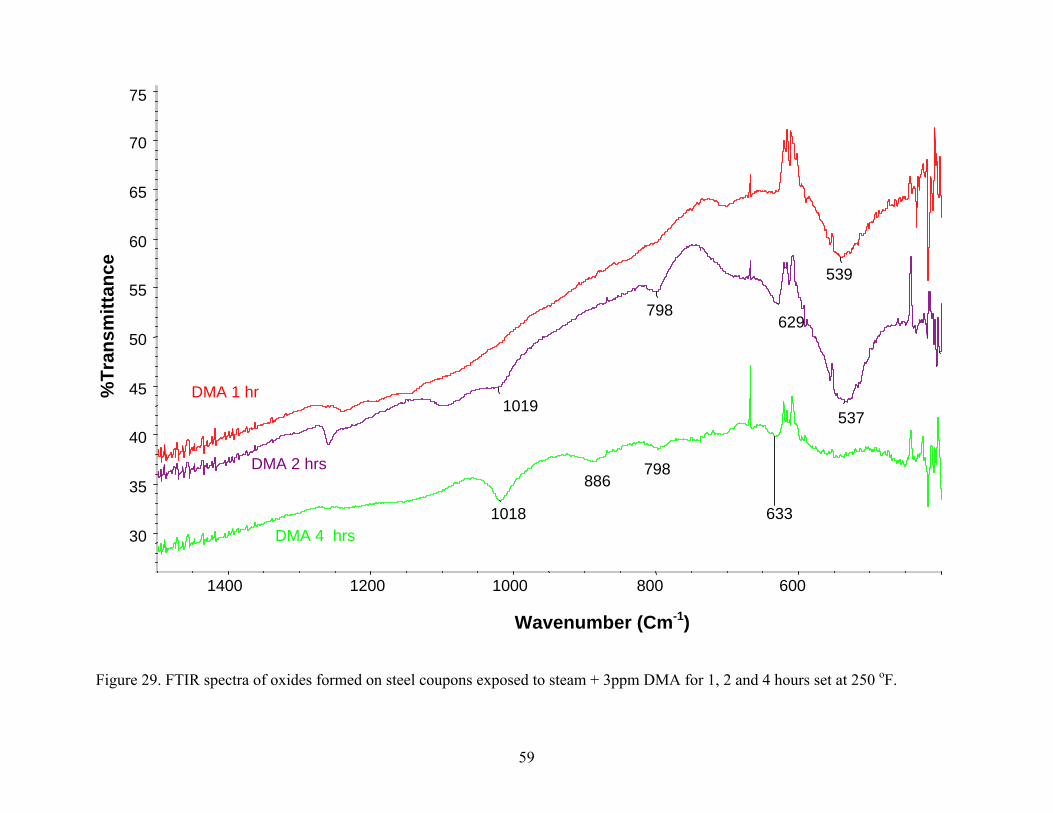
59
Figure 29. FTIR spectra of oxides formed on steel coupons exposed to steam + 3ppm DMA for 1, 2 and 4 hours set at 250 oF.
600 800 1000 1200 1400
539
537
629798
1019
6331018
DMA 1 hr
DMA 2 hrs
DMA 4 hrs 30
35
40
45
50
55
60
65
70
75%
Tran
smitt
ance
886 798
Wavenumber (Cm-1)

60
Figure 30. FTIR spectra of oxides formed on steel coupons exposed to steam + 3ppm DMA for 6, 8 and 12 hours set at 250 oF.
532
632
703
1020
533
705
798
538
628 700
798
888
1021
DMA 6 hrs
DMA 8 hrs
DMA 12 hrs
54 56 58 60 62 64 66 68 70 72 74 76 78 80 82 84 86 88 90 92
%Tr
ansm
ittan
ce
600 800 1000 1200 1400
Wavenumber (Cm-1)
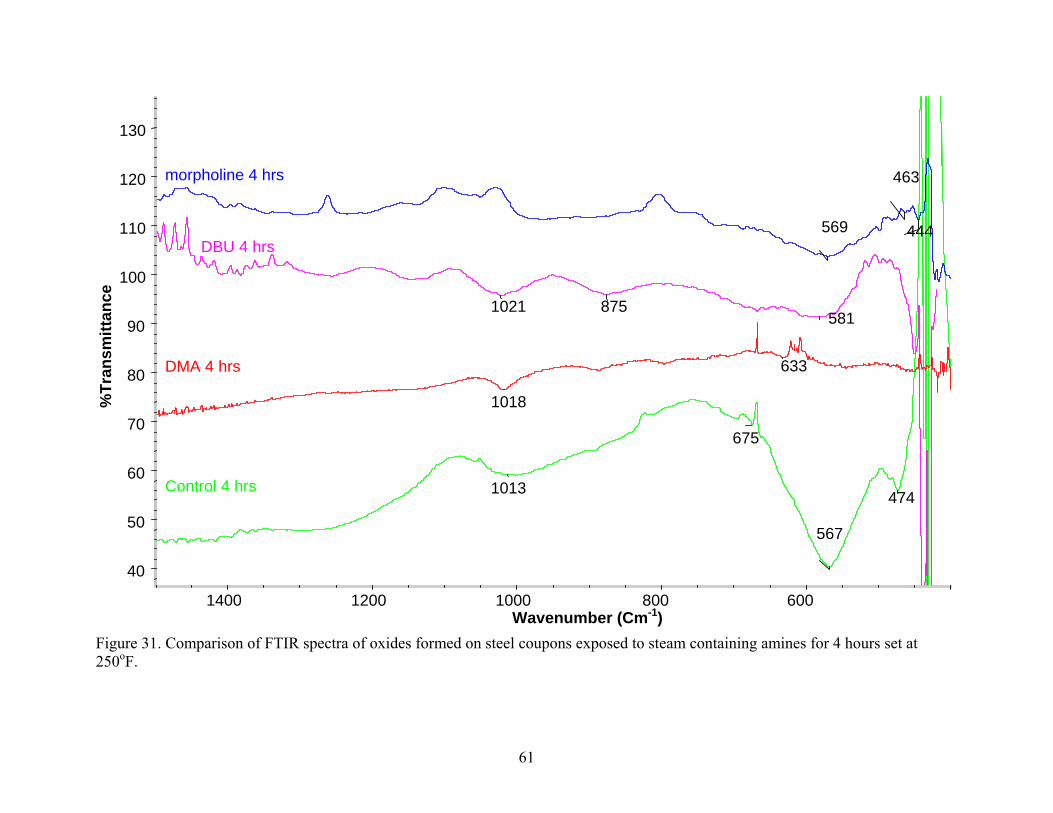
61
474
567
675
1013
633
1018
581875 1021
444
463
569
Control 4 hrs
DMA 4 hrs
DBU 4 hrs
morpholine 4 hrs
40
50
60
70
80
90
100
110
120
130 %
Tran
smitt
ance
600 800 1000 1200 1400 Wavenumber (Cm-1)
Figure 31. Comparison of FTIR spectra of oxides formed on steel coupons exposed to steam containing amines for 4 hours set at 250oF.

62
CHAPTER V
CONCLUSIONS
Different analytical techniques were used to analyze the physical and chemical properties
of AISI 1018 steel coupons exposed to steam with and without a given amine at 250oF. The
morphology of samples was studied using scanning electron microscopy (SEM). The different
phases of iron oxides present in the deposits were identified using Fourier transform infrared
spectroscopy (FTIR) in both, reflectance and transmittance modes. Weight loss was assessed to
establish the kinetics of metal loss. The following conclusions can be made from the above
analyses done on the deposit samples:
• An all volatile treatment (AVT) significantly reduced the metal dissolution rate for low
carbon steels. From the tested amines, DBU appeared to have the highest metal
protection. However, it had a little difference compared to DMA, and morpholine.
• Although SEM revealed qualitatively longer and wider particles in all AVT treated
samples than the control set, the significantly lower metal dissolution rates exhibited
confirmed the efficiency of amines as corrosion inhibitors.
• SEM revealed that control set and DMA produced acicular particles. This is an indication
of the presence of oxyhydroxides or hematite which are known to form needle-like
particles. On the other hand morpholine and DBU exhibited more equiaxed and cubic
particles.
• FTIR revealed the presence of oxyhydroxides (α-FeOOH at 795 and 890 cm-1 and
γ-FeOOH at 1018 cm-1) in control set and but mainly in DMA coupons, especially
towards longer exposure times. For DBU the end phase was mainly magnetite (570 cm-1),
showing some maghemite as well. FTIR spectra of samples exposed to steam with
63
morpholine presented hematite peaks (470 and 560 cm-1) in the sample exposed for two
hours which is a sign of magnetite to hematite final transformation at shorter times.
• While control samples formed hematite after 2-3 hours of exposure, samples exposed to
steam with DBU did not show magnetite to hematite transformation even after 12 hours
of exposure. It appears that DBU exposure results in forming oxides that are quasi-
crystalline and favor formation of maghemite.
• Oxide layers formed after 12 hours of exposure to steam with morpholine stabilized
hematite. Main absorption band at 570 cm-1 in all samples was broad indicating
amorphous nature of the oxide. DMA exposure favored formation of oxyhydroxides (α-
FeOOH, and γ-FeOOH). Neither hematite nor magnetite was detected in this set by FTIR.
• Magnetite to hematite transformation was the fastest in control samples and the slowest
in samples exposed to steam with DBU and morpholine in that order. DMA exposure
prevented the formation of either magnetite or maghemite.
Recommendations and Future Work
The following recommendations and future work are suggested in the area of deposit
characterization and deposit formation. Mild steel is used only in the lower pressure stage of the
secondary side cycle.
• Materials like alloys 600 and 800 are used in the higher stages. Those are more expensive
and much more critical. A study like this one should be made in order to understand how
the commonly used amines by the power industry, such as morpholine, ethanolamine,
diaminoethane, dimethyl amine, etc, interact with those alloys at the applied
temperatures. Along with that, elemental analysis ought to be carried since those
materials contain a rich mixture of different elements.
64
• Such test should be performed in a loop, so that flow assisted corrosion (FAC) can be
simulated to asses the stability and integrity of the protective film.
• pH measurements should be made after each run to establish how each amine keeps
basic, non-aggressive conditions. This may lead to understand of how these nitrogen-
based compounds work.
• Interaction of amines at surface level is not fully comprehended yet. A study about how
they interact with metal ions will enhance their effectiveness and will lead to
development of more efficient amines.
65
APPENDIX
MATERIAL SAFETY DATA SHEETS

66

67

68
69
REFERENCES
Berge P. Update on the Use of Morpholine in France. Proceedings of the Advanced Water Chemistry Advisory Meeting, Atlanta, 1987. Bloom D., “Strategies in Optimizing Condensate Return.” Steam Digest IV, pp 9-12, 2003. Bloom D., and Daniel D. “Advanced Amines Cut Condensate Corrosion.” Power, Vol 145 (4), pp 81-86, 2001. Bockris J., and Drazic D., “The Kinetics of Deposition and Dissolution of Iron: Effect of Alloying Impurities.” Electrochim. Acta Vol 7, pp 293-313, 1962. Boistelle R., and Astier J. “Crystallization Mechanisms in Solution.” Journal of Crystal Growth Vol 90, 1988. Brundle C., Evans C., and Wilson S. Encyclopedia of Materials Characterization. Butterworth-Heinemman, Stoneham MA, 1992, ISBN 0-75069168-9. Chemistry tutorials, Oxford University web page. http://users.ox.ac.uk/~mwalter/web_04/year1/nitr/organo_nitrogen_chem_ques.shtml March 2004 Chevalier M., Organista M., Jala M., Gelpi A., and Erre R. “Study of deposits and Corrosion Products in the Secondary Side of Steam Generators by Fourier Transfer Infrared Spectroscopy. Laboratory Study.” Proceedings of the TMS Ninth International Symposium on Environmental Degradation of Materials in Nuclear Power Systems-Water Reactors. Newport, pp 577-586, 1999. Choi D., Kim, Y., and Kim J. “Development of a Blended Corrosion, Scale, and Microorganism Inhibitor for Open Recirculating Cooling Systems.” Materials and Corrosion 52, pp 697-704, 2001. Cohen P. (senior editor) et al. The ASME Handbook on Water Technology for Thermal Power Systems. ASME, New York City, pp 569, 1989, ISBN 0-79180300-7. Cornell R., and Schwertmann. U. The Iron Oxides. Weinheim, New York City, 1996, ISBN 3-52728576-8. Davis J. (senior editor) et al. ASM Metals Handbook. Vol 13, pp 986-1010. ASM international, 1998, ISBN 0-87201154-2. DBU Material Safety Data Sheet, Aldrich Chemical Corp, 2003.
70
DMA Material Safety Data Sheet, Aldrich Chemical Corp, 2002. Epstein N. “Thinking about Heat Exchanger Fouling: a 5 x 5 Matrix.” Heat Transfer Engineering, Vol 4, 1983. Fellers B., Stevens J., and Nichols G. Strategic Elements of Steam Cycle Chemistry Control Practices at TXU’s Comanche Peak Steam Electric Station. CPSES, June 2001. Fiaud C., Harch A., Mallouh D., and Tzinmann M. “The Inhibition of Iron Corrosion by Acetylenic Alcohols in Acid Solutions at High Temperature.” Corrosion Science, Vol 35, pp 1437-1444, 1993. Hofmann. M., Campbell. S. J., and Kaczmarek. W.A., “Mechanochemical Transformation of Hematite to Magnetite: Structural Investigation.” Material Science Forum, 228-231(2), 1996. Ishikawa T., Kondo Y., Yasukawa A., and Kandori K. “Formation of Magnetite in the Presence of Ferric Oxyhydroxides.” Corrosion Science, Vol 40, pp 1239-1251, 1998. Jones D. Principles and Prevention of Corrosion. MacMillan New York City, 1992, ISBN 0-02361215-0. Kern P., and Landolt D., “Adsorption of Organic Corrosion Inhibitors on Iron in the Active and Passive State. A Replacement Reaction between Inhibitor and Water Studied with the Rotatory Quartz Crystal Microbalance.” Electrochim. Acta 47, pp 589-598, 2001. Klechka E. “Use of Corrosion Inhibitors on the Trans Alaska Pipeline.” Materials Performance, January 2001. Klimas S., Fruzzetti C., Turner W., Balakrishnan P., Strati G., and Tapping R. Identification and Testing of Amines for Steam Generator Corrosion and Fouling Control. 2003 ECI Conference on Heat Exchanger Fouling and Cleaning. Fundamentals and Applications. Santa Fe NM, 2003. Lamarre C., Gilbert R., and Gendron A. “Liquid Chromatography Determination of Morpholine and Its Thermal Breakdown Products in Steam-Water Cycles at Nuclear Power Plants.” Journal of Chromatography 467, 1989. Miksic B., and Miller R. H. Fundamental Principles of Corrosion Protection with Vapor Phase Inhibitors. 5th European Symposium of Corrosion Inhibitors. Italy, 1980. Millet P., and Welty C. Review of EPRI’s Steam Generator R&D Program. EPRI Web site, http://www.epri.com/ (November 2003) Millet P., and Wood C. J. Recent Advances in Water Chemistry Control at US PWRs. 58th EPRI International Water Conference, Pittsburgh PA, 1997.
71
Montes G., and Mielczarski J. “Some Aspects about Iron Oxidation Reaction in Aqueous Solutions.” Ciencia Abierta No. 24, Universidad de Chile 2003. Morpholine Material Safety Data Sheet, Aldrich Chemical Corp, 2002. Namduri H. Characterization of Iron Oxide Deposits Formed at Comanche Peak Steam Electric Station (CPSES). Master of Science thesis. University of North Texas, 2002. Nasrazadani S. “The Application of Infrared Spectroscopy to a Study of Phosphoric and Tannic Acids Interactions with Magnetite (Fe3O4), Goethite ( -FEOOH) and Lepidocrocite ( -FeOOH).” Corrosion Science, Vol 39, pp 1845-1859, 1997. Nasrazadani S., and Raman. A. “Application of IR Spectra to Study the Rust Systems.” Corrosion Science Vol 34, pp 1355-1365, 1993. Nasrazadani S., and Raman. A. “Morphology of Oxide Phases in the Scales Formed on Steels.” Prac. Met. Vol 28, pp 295-304, 1991. Nordmann F., and Fiquet J. “Selection Criteria for the Best Secondary Water Chemistry.” Nuclear Engineering and Design 160, pp 193-201, 1996. Novakovsky V. “Thermodynamic and Kinetic Causes of Passivity.” Electrochim. Acta, Vol 10, pp 353-365, 1965. Pasell T., Welty C. S., and Hobart S. “Use of Organic Amines in Water Chemistry Control for Pressurized Water Reactor Secondary Systems.” Progress in Nuclear Energy Vol 20, pp 235-254, 1987. Paul S. Minimizing Infrastructure Deterioration. 119th Annual Conference New England Water Works Association. Cambridge, MA. 2000. Porter D., and Easterling K. Phase Transformations in Metals and Alloys. Chapman & Hall London UK, 1992, ISBN 0-41245030-5. Raman A., Nasrazadani S., Sharma L., and Razvan A. “Morphology of Rust Phases Formed on Weathering Steels during Outdoor Atmospheric in Open, Bold Locations.” Prac. Met. Vol 24, pp 577-589, 1987. Raman A., Nasrazadani S., Sharma L., and Razvan A. “Morphology of Rust Phases Formed on Weathering Steels during Outdoor Atmospheric in Sheltered Locations.” Prac. Met. Vol 24, pp 535-548, 1987. Sagochka S. Corrosion Product Transport. EPRI SGPM 2003 Steam Generator Secondary Side Management Conference. Savannah, 2003.

72
Tsuru T., Fujii E., and Haruyama S. “Passivation of Iron and its Cathodic Reduction Studied with a Rotating Ring-disk Electrode.” Corrosion Science, Vol 31, pp 655-660, 1990. Turner C., and Klimas S. The Effect of Alternative Amines on the Rate of Boiler Tube Fouling. EPRI report TR-108004, 1997. Turner C., Guzonas D., and Klimas S. Identification and Testing of Amines for Steam Generator Chemistry Deposit Control. EPRI report 1002773, 2002. Van Osch G.A.A., and Huijbregts W.M.M. “Corrosion Potential Measurements in Boiler Water: The Influence of Oxygen Content.” Corrosion, Vol 42 (2), 1986. Varrin R. Jr et al. Characterization of PWR Steam Generator Deposits. EPRI report TR-106048, 1996. Yuzwa G. F., Corrosion Protection of Condensate Systems. Alberta Public Works, Supply & Services Property Management. Water Treatment Coordinators Meeting # 27, Alberta Canada, 1998.