effect of aquafeed on productivity of red amaranth and on … · effect of aquafeed on productivity...
TRANSCRIPT

Florida International UniversityFIU Digital Commons
FIU Electronic Theses and Dissertations University Graduate School
3-28-2014
Effect of Aquafeed on Productivity of RedAmaranth and on Water Quality under AquaponicCultivationMiles D. MedinaFlorida International University, [email protected]
Follow this and additional works at: http://digitalcommons.fiu.edu/etd
Part of the Agricultural Economics Commons, Agricultural Science Commons, Agronomy andCrop Sciences Commons, and the Aquaculture and Fisheries Commons
This work is brought to you for free and open access by the University Graduate School at FIU Digital Commons. It has been accepted for inclusion inFIU Electronic Theses and Dissertations by an authorized administrator of FIU Digital Commons. For more information, please contact [email protected].
Recommended CitationMedina, Miles D., "Effect of Aquafeed on Productivity of Red Amaranth and on Water Quality under Aquaponic Cultivation" (2014).FIU Electronic Theses and Dissertations. Paper 1206.http://digitalcommons.fiu.edu/etd/1206

FLORIDA INTERNATIONAL UNIVERSITY
Miami, Florida
EFFECT OF AQUAFEED ON PRODUCTIVITY OF RED AMARANTH AND ON
WATER QUALITY UNDER AQUAPONIC CULTIVATION
A thesis submitted in partial fulfillment of the
requirements for the degree of
MASTER OF SCIENCE
in
ENVIRONMENTAL STUDIES
by
Miles Medina
2014

ii
To: Dean Kenneth G. Furton College of Arts and Sciences This thesis, written by Miles Medina, and entitled Effect of Aquafeed on Productivity of Red Amaranth and on Water Quality under Aquaponic Cultivation, having been approved in respect to style and intellectual content, is referred to you for judgment. We have read this thesis and recommend that it be approved.
___________________________________________ Alok Deoraj
___________________________________________ Mahadev Bhat, Co-Major Professor
___________________________________________ Krishnaswamy Jayachandran, Co-Major Professor
Date of Defense: March 28, 2014 The thesis of Miles Medina is approved.
___________________________________________ Dean Kenneth G. Furton
College of Arts and Sciences
___________________________________________ Dean Lakshmi N. Reddi
University Graduate School
Florida International University, 2014

iii
© Copyright 2014 by Miles Medina
All rights reserved.

iv
ACKNOWLEDGMENTS
I would like to thank the members of my committee for their support. I will
always be grateful for the opportunities provided to me by the FIU Agroecology Program
under the direction of Drs. Mahadev Bhat and Krish Jayachandran, my Co-Major
Professors. Over the course of my degree program, Dr. Bhat’s enthusiastic
encouragement and our stimulating conversations were a source of strength. During my
thesis research his help and guidance were indispensible. Dr. Jayachandran’s technical
knowledge and good humor helped me stay relaxed and focused as obstacles presented
themselves. He provided essential lab training and the opportunity to present this work at
a national conference. I am also grateful to Dr. Alok Deoraj, committee member, whose
knowledge of aquaculture was most helpful in the development of the research questions
and during the design the experiment.
I would also like to thank Dr. Kateel Shetty and fellow graduate student Nina de
la Rosa for their assistance in the lab. I am grateful to Stephany Alvarez, Luis Garbinski,
Joshua Muñoz and Edy Cicilio for their help during construction of the aquaponic units.
And I am particularly grateful to undergraduate Carlos Pulido who fed the fish and
collected data while I was out of town at a conference. I would also like to thank Manny
García-Barbón for donating the Blue tilapia used in the study.
Finally, I wish to thank the USDA for funding under the National Institute of
Food and Agriculture's Hispanic Serving Institutions Higher Education Grant # 2011-
38422-30804.

v
ABSTRACT OF THE THESIS
EFFECT OF AQUAFEED ON PRODUCTIVITY OF RED AMARANTH AND ON
WATER QUALITY UNDER AQUAPONIC CULTIVATION
by
Miles Medina
Florida International University, 2014
Miami, Florida
Professor Krishnaswamy Jayachandran, Co-Major Professor
Professor Mahadev Bhat, Co-Major Professor
Aquaponics, the integrated production of fish and hydroponic crops in a
recirculating system, is an intensive cultivation method in which metabolic fish wastes
fertilize plants. This study compares the effects of two aquafeeds on Red amaranth
(Amaranthus tricolor) productivity and on water quality under cultivation of Blue tilapia
(Oreochromis aureus), with three aquaponic units (n=3) per treatment over a 60-day trial.
The fishmeal-based control feed contains higher crude protein (40%) and phosphorus
(1.12%) than the plant-based alternative feed (32% and 0.40%). The alternative feed
resulted in a significantly higher amaranth crop yield (p<0.05) with significantly lower
nitrate-N and TDS concentrations in the culture water over the course of the trial.
Orthophosphate, TAN, pH and DO levels were not significantly different between
treatments. An economic analysis revealed that an improved crop yield from a lower-
input aquafeed could potentially increase total aquaponic farm revenue in spite of a
reduction in fish yield.

vi
TABLE OF CONTENTS
CHAPTER PAGE
I. INTRODUCTION........................................................................................................... 1 Study objectives......................................................................................................... 3
II. LITERATURE REVIEW............................................................................................... 5 The global context of modern aquaculture................................................................ 5 Inland aquaculture: From wastewater-fed to recirculating systems.......................... 7 Ecological considerations for intensive aquaculture................................................. 9 Potential ecological benefits of urban aquaponic production.................................. 11 Structure and function of aquaponic systems........................................................... 14 Maintenance of water quality in aquaponic production........................................... 16 Environmental tolerances of tilapia.......................................................................... 18
III. METHODOLOGY...................................................................................................... 20
Design and setting of the aquaponic units ............................................................... 20 Experimental treatments .......................................................................................... 22 Data collection ......................................................................................................... 24 Statistical analysis ................................................................................................... 25 Economic analysis ................................................................................................... 25 Limitations of the study ........................................................................................... 26
IV. RESULTS AND DISCUSSION................................................................................. 27
Fish growth and feed conversion.............................................................................. 27 Plant growth and yield.............................................................................................. 30 Total ammonia-N (TAN) concentration................................................................... 34 Nitrate-N concentration............................................................................................ 35 Orthophosphate concentration.................................................................................. 37 Total dissolved solids (TDS) concentration and electroconductivity (EC).............. 38 pH............................................................................................................................. 41 Dissolved oxygen (DO) concentration and saturation level..................................... 42 Economic benefit from alternative aquafeeds.......................................................... 43
V. CONCLUSION............................................................................................................ 48 LIST OF REFERENCES.................................................................................................. 51 APPENDICES................................................................................................................... 57

vii
LIST OF TABLES
TABLE PAGE 1. Feeding rate schedule.................................................................................................... 23
2. Fish biomass data per replicate (source data)................................................................ 28
3. Normalized plant growth data per replicate.................................................................. 31
4. Normalized mean plant growth data per treatment group............................................. 31
5. P-values and statistical power given by one-way ANOVA, based on normalized plant growth data................................................................................... 32 6. Confidence intervals and p-values given by one-way ANCOVA, based on normalized plant growth data........................................................................ 33
7. Additional revenue generated from improved crop yields from adoption of an alternative aquafeed, under Scenarios 1a and 1b.................................. 44 8. Percentage change in total revenue as a function of changes in crop and fish yields from adoption of an alternative aquafeed, under Scenario 2................ 45

viii
LIST OF FIGURES
FIGURE PAGE
1. World production of fish and other aquatic animals, 1980-2010................................... 6
2. Diagram of one of the six aquaponic test units............................................................. 21
3. Net fish growth per treatment group (source data)........................................................ 28
4. TAN concentration per replicate (source data)............................................................. 34
5. Normalized nitrate-N concentration per replicate......................................................... 36
6. Normalized orthophosphate concentration per replicate............................................... 37
7. Normalized TDS concentration per replicate................................................................ 39
8. Electroconductivity per replicate (source data)............................................................. 39
9. Normalized mean TDS and nitrate concentrations per treatment group....................... 40
10. pH per replicate........................................................................................................... 41
11. Dissolved oxygen concentration per replicate............................................................. 42
12. Dissolved oxygen saturation level per replicate.......................................................... 43
13. Change in total revenue under Scenario 2, based on experimental results................. 47

ix
ABBREVIATIONS AND ACRONYMS CP Crude protein DO Dissolved oxygen EC Electroconductivity FAO Food and Agriculture Organization of the United Nations FCR Feed conversion ratio RAS Recirculating aquaculture system SGR Specific growth rate TAN Total ammonia nitrogen TDS Total dissolved solids UVI University of the Virgin Islands
1
CHAPTER I
INTRODUCTION
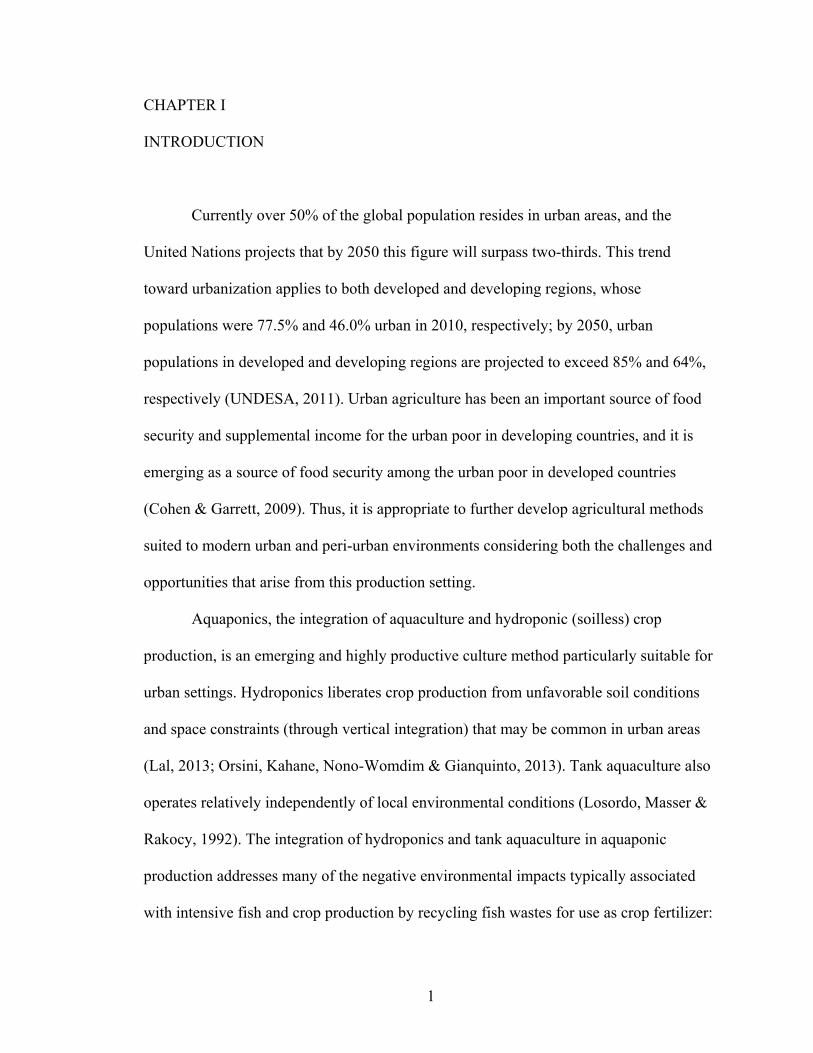
Currently over 50% of the global population resides in urban areas, and the
United Nations projects that by 2050 this figure will surpass two-thirds. This trend
toward urbanization applies to both developed and developing regions, whose
populations were 77.5% and 46.0% urban in 2010, respectively; by 2050, urban
populations in developed and developing regions are projected to exceed 85% and 64%,
respectively (UNDESA, 2011). Urban agriculture has been an important source of food
security and supplemental income for the urban poor in developing countries, and it is
emerging as a source of food security among the urban poor in developed countries
(Cohen & Garrett, 2009). Thus, it is appropriate to further develop agricultural methods
suited to modern urban and peri-urban environments considering both the challenges and
opportunities that arise from this production setting.
Aquaponics, the integration of aquaculture and hydroponic (soilless) crop
production, is an emerging and highly productive culture method particularly suitable for
urban settings. Hydroponics liberates crop production from unfavorable soil conditions
and space constraints (through vertical integration) that may be common in urban areas
(Lal, 2013; Orsini, Kahane, Nono-Womdim & Gianquinto, 2013). Tank aquaculture also
operates relatively independently of local environmental conditions (Losordo, Masser &
Rakocy, 1992). The integration of hydroponics and tank aquaculture in aquaponic
production addresses many of the negative environmental impacts typically associated
with intensive fish and crop production by recycling fish wastes for use as crop fertilizer:

2
Agricultural runoff is virtually eliminated, water is conserved through filtration and
recirculation, and the amount of land required per unit of production is reduced (Pillay,
2004; Losordo et al., 1992; Rakocy, Masser & Losordo, 2006). Further, the removal of
dissolved nutrients by plants generates revenue via cultivation of a marketable crop
(Bailey, Rakocy, Cole, & Shultz, n.d., Rakocy et al., 2006). A number of aquaponic
farms currently operate throughout the United States and abroad.
Formulated aquafeed is a crucial input that represents a substantial operating cost
for any intensive aquaculture operation (El-Sayed, 1999; El-Sayed, 2004). High protein
content provides rapid fish growth and higher yields, and fishmeal has generally been the
preferred source of protein in formulated feeds. In recent years, however, the supply of
fishmeal has plateaued, leading to rising prices and the development of alternative protein
sources (El-Sayed, 2004; Tacon, Hasan, & Metian, 2011). Based on improved
understanding of fish growth and nutrition as well as concern over the environmental
impacts of aquacultural waste, today’s aquafeed formulations achieve higher yields with
lower quantities of fishmeal and other nutrients (Cho & Bureau, 2001; Tacon et al.,
2011).
In aquaponic production, aquafeed is doubly important, because it is the primary
source of nutrients for both the fish and the plants: Nutrients that originate in the feed
become effluent that serves as hydroponic fertilizer. Typically, the nutrient profile of fish
effluent is remarkably well matched to the nutritive requirements of crops, but nutrient
supplementation for aquaponic crops is not uncommon among operations that rely on
standard aquafeeds (Bunting, 2013; Rakocy et al., 2006). For instance, while aquaculture
effluent often contains abundant nitrogen (derived from amino acids in the feed) and

3
phosphorus, it is often lacking in other important plant nutrients such as potassium and
chelated iron (N. Storey, personal communication, 2014; Rakocy et al., 2006; Rakocy,
Shultz, Bailey & Thoman, 2004b). To date, no studies have examined the effect of
aquafeed on aquaponic crop productivity.
Study objectives
The aim of the study is to explore the effects of two formulated aquafeeds on
plant productivity and effluent water quality in an aquaponic setting. The control
aquafeed is an industry-standard aquafeed based on fishmeal. The alternative aquafeed is
specially formulated for use in aquaponic production, and it is plant-based with lower
crude protein and phosphorus content than the control feed. Under the alternative
treatment we expect to observe greater plant productivity with lower concentrations of
nitrate and dissolved solids in the culture water. Other water quality parameters under
observation include pH and dissolved oxygen levels; these are expected to be similar
between treatments. Additionally, although fish growth is not the focus of the study we
expect to observe greater growth under the higher-protein control treatment.
The cultured crop species is Amaranthus tricolor, known colloquially as Red
amaranth, callaloo, or Chinese spinach. The leaves and stems of A. tricolor are a rich
source of protein, carotenoids, vitamins, minerals and fiber and are nutritionally similar
or superior to spinach (O’Brien & Price, 1983; Prakash & Pal, 1991). While its
consumption is common in temperate and tropical developing regions including China,
Africa and the Caribbean A. tricolor is considered an underexploited crop with high
economic potential (Shukla, Bhargava, Chatterjee, Pandey, & Kumar, 2010). A. tricolor

4
is an exceptionally tolerant and resistant leafy vegetable crop capable of being cultivated
during hot summer months when other leafy vegetables are out of season (Shukla,
Bhargava, Chatterjee, Srivastava, & Singh, 2006).
The cultured fish species is Blue tilapia (Oreochromis aureus). Tilapia comprise
the second most important group of cultivated fish worldwide (FAO, 2012A). They are
widely cultured throughout the tropics and subtropics due to their ease of cultivation,
high tolerance to poor water quality, rapid growth, and expanding market demand
(Popma & Masser, 2009). Tilapia are also a popular choice among aquaponic farmers and
hobbyists. Among tilapia species, Nile tilapia (O. niloticus) and Nile-Blue hybrids are the
most commonly cultivated (FAO, 2011). Live possession of any tilapia species except
Blue tilapia is prohibited by the State of Florida without a commercial permit. Because
the focus of the study is the plant productivity response, the results are presumed to be
relevant for tilapia in general.
In addition to the technical aspect of the study described above, I conduct an
economic analysis to explore the effect of aquafeeds on aquaponic farm revenue. The
analysis, based on production and revenue data from the literature as well as data from
the technical aspect of the study, estimates the economic benefit from adoption of an
alternative aquafeed that enhances crop production within the context of commercial
aquaponics, as compared to a standard aquafeed that would typically be used in
commercial aquaponics although it is formulated for commercial fish-only aquaculture.

5
CHAPTER II
LITERATURE REVIEW
The global context of modern aquaculture
The United Nations projects that the global population will reach 8.9 million by
2050 and that 99% of this growth will occur in developing regions including Asia, Africa,
and Latin America (United Nations Department of Economic and Social Affairs
[UNDESA], 2004). Consumption of fish in developing regions is increasing with
population and per capita income. For instance, from 1980 to 2010, consumption of fish
in developing countries increased more than four-fold (from 25.0 million to 104.3 million
tonnes per year) while consumption in developed countries remained relatively stable,
near 30 million tonnes per year (FAO, 2012a). Because capture production is not
expected to substantially increase, FAO predicts that the rising global demand for fish
will have to be met entirely by aquaculture (2012b).
Aquaculture includes the cultivation of fish, crustaceans, mollusks, and aquatic
plants. Since the 1980s it has emerged as the fastest growing form of agriculture
worldwide. Global aquacultural production of fish and other aquatic animals grew at an
average of 6.3% per year from 34.6 million tonnes in 2001 to 59.9 million tonnes in
2010, while capture production plateaued at around 90 million tonnes per year over the
same period. Asia consistently leads aquacultural production, with 53.3 million tonnes
representing 89.0% of global production in 2010. Global production of aquatic plants was
19.9 million tonnes in 2010, with 95.5% coming from aquaculture (FAO, 2012a).

6
Aquacultural operations are primarily categorized by the waters in which they
occur. Marine cultivation occurs within net pens in coastal or open ocean waters. Inland
cultivation occurs within pens in freshwater ecosystems (lakes and rivers) or in artificial
ponds, raceways, or tanks (Lovelace, 2009; Pillay, 2004). In 2010, inland cultivation
accounted for the bulk of global aquacultural production (69.6%) with 41.7 million
tonnes (Figure 1) (FAO, 2012a).
Figure 1. World production of fish and other aquatic animals, 1980-2010 (FAO, 2012a).
Aquacultural operations are also categorized by the intensity of management,
namely, extensive, semi-intensive, or intensive. Under extensive cultivation, fish receive
nutrition from naturally occurring food sources such as detritus and plankton;
management efforts focus on protection from predators and competition (Baulcomb,
2013; Bunting, 2013). Semi-intensive cultivation involves some supplementation of the

7
natural food supply, or fertilization to increase the natural food supply. Under intensive
cultivation, fish receive nutrition exclusively from formulated, high-protein aquafeeds.
Greater intensity implies higher stocking densities, concentrated waste, greater risk of
disease outbreak, and higher yield per unit of area (Beveridge & Little, 2002; Naylor et
al., 2000). Within these categories lie a diversity of practices, but the global trend is
toward intensification with formulated aquafeeds rapidly increasing in importance (Tacon
et al., 2011). Aquafeed production was 29.2 million tonnes in 2008 and is expected to
grow to 71.0 million tonnes by 2020 (FAO, 2012b).
Inland aquaculture: From wastewater-fed to recirculating systems
Semi-intensive wastewater-fed pond aquaculture has been practiced for centuries
throughout East, South, and Southeast Asia and remains common in undeveloped areas
where unpolluted freshwater is unavailable. Ponds constructed downstream from
discharge sites receive wastewater (typically untreated) that acts as fertilizer to stimulate
primary production. Plankton and other organisms serve as a natural food supply for the
fish. The destruction of pathogens can be achieved relatively quickly by retaining
wastewater in a series of stabilization ponds before it reaches the fishpond. The fishpond
effluent, often of higher quality than the influent, may be used to irrigate downstream
crops, trees, or pasture. Thus, the use of wastewater in aquaculture and irrigation presents
an environmentally friendly and agriculturally productive alternative to mechanical
wastewater treatment that is especially relevant for urban and peri-urban areas where
mechanical treatment infrastructure is not economically feasible (Beveridge & Little,
2002; Edwards, 2005).

8
Urban wastewater-fed pond operations are generally considered very ecologically
sustainable. Most are relatively small-scale operations that provide poor families with
food security and income, and many are integrated fish-plant systems. Unfortunately, the
urbanization on which they depend often also leads to their displacement. As industry
grows in and around urban centers, toxic industrial waste mixed in with residential waste
renders the wastewater unsafe for fish cultivation. Further, as a more profitable land use,
growing industry often competes with farmers for land. Finally, farms are also
susceptible to the loss of their nutrient source when wastewater infrastructure
improvement or alteration changes the flow of the water by creating canals or moving the
point of discharge (Bunting, Pretty & Edwards, 2010; Edwards, 2005; Little & Bunting,
2005). As countries like China develop and urbanize, it is likely inevitable that
wastewater-fed pond culture will be replaced by higher-tech, intensive production
systems.
The development of recirculating aquaculture systems (RAS) is particularly
relevant for urban areas, because RAS is highly productive and can be located virtually
anywhere, independent of climate and water resource availability (Little & Bunting,
2005; Timmons, 2005). Whereas flow-through production systems (such as ponds and
raceways) require nearby sources of water, filtration allows RAS to recycle 90 to 99% of
its culture water (Lovelace, 2009; Pillay, 2004; Timmons, 2005). Thus, RAS discharges
minimal effluent, and filtered sludge can be used to generate biogas or applied as
fertilizer at nearby farms or gardens (Baulcomb, 2013). And while pond systems are open
and susceptible to disease and contamination, the RAS culture environment is contained
and highly controlled (Bunting & Little, 2005; Timmons, 2005). Further, pond

9
aquaculture may not be feasible in areas where demand favors marine fish, but freshwater
and marine cultures are both possible under RAS (Tal et al., 2009; Timmons, 2005). The
higher cost of urban land is a constraint to urban RAS, but this may be offset by favorable
policy instruments or tax breaks; reliable supply from consistent, year-round production;
improved feed conversion ratios; proximity to market and reduced transportation costs;
and price premiums for safe, environmentally friendly, and locally produced fish.
Another constraint is the relatively high capitalization cost, but RAS lends itself to
efficiencies from economies of scale (Little & Bunting, 2005; Timmons, 2005).
Aquaponics is an integrated form of RAS in which fish effluent that is rich in
dissolved nutrients is used as fertilizer for hydroponic plants. The plants remove nutrients
through their roots, and the filtered water returns to the fish tank. Thus, the filtration
process allows for the indefinite recycling of water while producing a marketable crop.
Aquaponics is a commercially viable production method capable of plant yields equal to
or greater than those under traditional field production (Bailey et al., n.d.; Lewis et al.,
1978; McMurtry et al., 1997; Rakocy, Bailey, Shultz, & Thoman, 2004a; Rakocy et al.,
2006; Rakocy et al., 2004b).
Ecological considerations for intensive aquaculture
The sustainability of intensive aquaculture on a large scale requires consideration
of the environmental resources on which it depends (inputs) and the ecological systems to
which it discharges wastes (outputs). Net pen production occurs within a host ecosystem
(e.g. coastal waters) with wastes from a high concentration of animals freely flowing out
of the production area and into the surrounding environment (Baucomb, 2013; Bunting,

10
2013). Flow-through raceway production systems receive a constant supply of water from
a river, spring or well and continuously discharge effluent as water leaves the farm
(Lovelace, 2009; Pillay, 2004). But RAS (including aquaponics) resolves the output or
pollution problems inherent in other forms of intensive aquaculture (Bunting, 2013;
Pillay, 2004). As a form of tank aquaculture RAS is independent of aquatic ecosystems.
This separation of production from the natural environment creates a point of intervention
that, if properly managed, virtually precludes the discharge of effluents as pollutants
(Baucomb, 2013; Bunting, 2013).
The question of sustainability of inputs remains relevant for RAS as it does for
other forms of intensive aquaculture. Due to filtration water usage is extremely low in
RAS and especially in aquaponics (Lovelace, 2009; McMurtry et al., 1997; Pillay, 2004;
Timmons, 2005; Rakocy et al., 2006). However, formulated aquafeeds are an input of
critical importance in terms of the sustainable growth of the aquaculture sector and the
health of the world’s fisheries (Deutsch et al., 2007; Naylor et al., 2000; Tacon et al.,
2011).
Fish farming alleviates pressure on fisheries to the extent that demand for fish is
met by aquacultural production. However, to the extent that aquaculture depends on
marine-captured fish as an input (as fishmeal and fish oil for formulated feeds), it may
contribute to overfishing, the degradation of marine food webs, and ultimately a limit on
the productive capacity of the aquaculture industry (Deutsch et al., 2007; Naylor et al.,
2000). Fishmeal is a major component of many aquafeeds, because it is easily digestible
with favorable amino acid and fatty acid profiles. Formulated aquafeeds for fish at higher
trophic levels (such as salmon) contain a larger proportion of fishmeal than the

11
cultivation of herbivorous or omnivorous fish such as carp and tilapia (Tacon et al.,
2011). Demand for fishmeal has increased while supplies have declined 1.7% per year
since 1995. As a result, prices have risen from 400-600 USD/tonne during the 1990s and
early 2000s to over 1,200 USD/tonne in 2009 (Olsen & Hasan, 2012; Tacon et al., 2011).
Much research effort, both academic and private, has focused on the development of
alternative protein sources from plants, microbes, and byproducts of meat production (El-
Sayed, 1999; El-Sayed, 2004; Olsen & Hasan, 2012). As a result the proportion of
fishmeal used in formulated aquafeeds has declined. Considering fishmeal’s decreasing
supply, increasing demand and prices, and the development of substitutes, the total use of
fishmeal in formulated aquafeeds is projected to decrease over the long term both in
absolute terms and relative to its proportion as an aquafeed ingredient: from 3.72 Mt (or
12.8% of aquafeed by weight) in 2008 to 3.49 Mt (or 4.9% of aquafeed by weight) in
2020 (Tacon et al., 2011).
Potential ecological benefits of urban aquaponic production
Aquacultural operations can be classified according to the culture environment
(marine, brackish, or freshwater) and setting (marine, coastal, or inland), intensity of
management (intensive, semi-intensive, or extensive), production format (pond, tank,
raceway, etc.), number and type(s) of species under cultivation, and level of integration
with other agricultural processes (Baulcomb, 2013; Bunting, 2013). In an urban setting, a
commercial aquaponics operation may be considered an intensive recirculating
polyculture tank production system.

12
The recirculating aquaculture format is associated with higher operating costs
(from filtration equipment and maintenance), but in aquaponics these costs are offset by
revenue generated from the crop yield (Bailey et al., n.d.; Bunting, 2013; Rakocy et al.,
2006). In an urban setting, integration with the urban waste stream may further increase
profitability while promoting ecological sustainability: Costly formulated feed may be
supplemented by duckweed, phytoplankton, algae or fodder fish produced in ponds or
tanks fertilized by treated wastewater (Bunting, 2013; El-Sayed, 2004). The fish diet may
also be supplemented by the on-farm production of black soldier flies that convert
compostable wastes to high-protein biomass. These wastes may include those generated
on-farm (e.g. filtered fish waste sludge, crop residues, and culled produce) as well as
urban food scraps (from local supermarkets and restaurants) (Allen, 2013; Baulcomb,
2013; Bunting, 2013). Thus, urban aquaponics can act as a net nutrient sink by
productively reducing the nutrient output to surrounding ecosystems, and address the
issue of food waste by recycling it into the local food production system.
Aquaponics is particularly efficient in its use of water, only requiring replacement
of water lost to evaporation and transpiration. Compared to other forms of recirculating
aquaculture, aquaponics can reduce water usage by 93% or more, with a daily
replacement rate as low as <1% (Lovelace, 2009; Masser et al., 1999; Rakocy,
Hargreaves, & Bailey, 1993). Further, due to higher plant density water use under
aquaponic crop production can be up to ten times more efficient than under irrigated field
production (Al-Hafedh, Alam, & Beltagi, 2008; McMurtry et al., 1997).
Because it does not depend on soil, hydroponics is arguably the most soil-
conserving method of crop production (Lal, 2013). As demand for food increases,

13
hydroponic production can relieve pressure to convert forested land to agriculture, just as
aquaculture relieves pressure on fisheries. In urban environments, aquaponics offers the
potential to return land with contaminated or infertile soil to highly productive
agriculture. Space efficiencies can be achieved through the vertical orientation or
arrangement of hydroponic components to multiply growing space and yield per area (N.
Storey, personal communication, January 2, 2014; Rakocy et al., 2006).
In order to compare the operational energy consumption of a commercial
aquaponic system with that of a fish-only RAS, we first consider a series of production
trials that spanned four years and were conducted with an experimental, commercial-
scale raft aquaponic system at the University of the Virgin Islands (UVI). The system’s
total water volume was 111,196 L; it occupied 500 m2 of land, and its operation
consumed 53.69 kWh per day. Rakocy et al. projected annual yields of approximately
4,780 kg of tilapia and 5,010 kg of basil (2004a). Thus, the operational energy
consumption estimate for the UVI aquaponic system is 4.10 kWh per kg of tilapia or 3.91
kWh per kg of basil. Next, we consider the energy consumption for a hypothetical
100,000 kg yr-1, fish-only RAS, estimated at 2.2 kWh per kg of tilapia by Eding et al.
(2009). Of course, drawing a direct comparison between these two estimates is difficult
considering the scale of the fish-only RAS (more than 20 times greater than that of the
UVI aquaponic system in terms of tilapia production). Further, the comparison is
complicated by the fact that energy input to the UVI system results in a crop yield in
addition to the tilapia yield. For a crude comparison of energy consumption between
systems in terms of tilapia yield, we may separate the energy inputs associated with fish
and crop production in the UVI system and consider only those inputs associated with

14
fish production. Energy inputs to the UVI system provide power to the water pump (373
W), the aeration blower for the fish tank (1,119 W), and the aeration blower for
hydroponic tanks (746 W). Thus, the water pump and fish tank blower consume 35.79
kWh per day, or 2.73 kWh per kg of tilapia, while the larger-scale fish-only RAS
consumes 2.2 kWh per kg of tilapia. Therefore it is possible that at a large scale similar to
that of the fish-only RAS, the UVI aquaponic system would achieve similar energy
efficiency in terms of tilapia production.
Structure and function of aquaponic systems
The essential structural components of any aquaponic system include the fish
tank, solids filter, bacterial biofilter, and hydroponic grow beds or towers. While various
configurations exist, water is generally pumped from the lowest component (fish tank or
sump) up to the highest component (filter) and flows gravitationally through the grow
bed on its return to the fish tank (Rakocy et al., 2006).
The bacterial biofilter is the basis of plant productivity in any aquaponic system,
because it converts ammonia in the fish waste to plant-available nitrate in a two-step
biological nitrification process. The biofilter is composed of naturally occurring nitrifying
bacteria that live on the system’s submerged surfaces, and it begins to develop as soon as
ammonia is present in the culture water. Ammonia, which may be highly toxic to fish, is
oxidized into nitrite (NO2-) by Nitrosomonas bacteria. Nitrospira and Nitrobacter
bacteria oxidize toxic nitrite into nitrate (NO3-), which is relatively safe for fish (Foesel et
al., 2008; Keuter, Kruse, Lipski, & Spleck, 2011). The nitrification process is described
by the formulas

15
NH + 1.5 O → NO + 2 H + H O + 84 kcal/mole of ammonia NO + 0.5 O → NO + 17.8 kcal/mole of nitrite
Thus, nitrification of one mole of ammonia consumes two moles of dissolved oxygen
(O2) and yields one mole of nitrate, one mole of water (H2O), and two moles of hydrogen
ions (H+) (Bernstein, 2011).
Two forms of hydroponic culture are common in aquaponics: deep-water culture
and media culture. In deep-water culture (DWC), also known as raft aquaponics, plants
are supported above a horizontally oriented trough, typically in individual net pots filled
with an inert substrate (such as pearlite or coconut coir) and held in place by a rigid sheet
(e.g. polystyrene). Roots are freely suspended in the culture water.
In media culture, the grow bed is filled with a soil substitute that may be
composed of an aggregate material (such as pea gravel or expanded clay pellets) or a
synthetic fibrous material (N. Storey, personal communication, January 2, 2014). The
media provides structural support for the plants as well as habitat for nitrifying bacteria.
Under a constant flow regimen, a steady volume of water is maintained in the grow bed.
Under a reciprocating flow regimen, a timer or siphon mechanism periodically floods and
drains the grow bed.
An advantage of media culture over DWC is that the grow bed doubles as a
biofilter, while DWC requires a separate nitrification component. Lennard and Leonard
observed significantly higher yields of Green Oak lettuce (Lactuca sativa) under media
culture than under DWC during a 21-day trial (2006). Further, in a separate 21-day trial, a
significantly higher yield of the lettuce, greater pH buffering capacity, and higher levels

16
of dissolved oxygen were observed under the constant flow regimen vs. the reciprocating
flow regimen (Lennard & Leonard, 2004).
Maintenance of water quality in aquaponic production
Water quality parameters including temperature, nitrogen levels, dissolved
oxygen (DO), and pH must be monitored and maintained for the proper functioning of an
aquaponic system. Water temperature is determined by the ambient temperature, and
smaller systems lose heat more quickly than larger systems. Fish are cold-blooded, and
each species has evolved to tolerate a certain range of temperatures. Within the wider
range that a species can tolerate, there is a narrower optimal range to promote growth and
health. Therefore, local climate is an important factor to consider when deciding which
fish species to cultivate (Bernstein, 2011). Because bacteria and most crops prefer
warmer water temperatures, greenhouse production is common in northern latitudes. A
common low-tech method of retaining heat in the greenhouse is the use of a heat sink
(e.g. a deep tank of water that warms up during the day and releases heat at night).
Another innovative approach involves composting organic wastes directly outside the
greenhouse (along and against the exterior walls) so that the heat generated by
decomposition is transferred inside (Allen, 2013). Other options include the use of a
wood furnace connected to a heat exchanger (N. Storey, personal communication,
January 2, 2014) or an electrical heater.
As indicated earlier, a well-functioning biofilter efficiently converts the ammonia
in fish waste to nitrate and keeps the concentration of ammonia near 0 mg/L. This
nitrification process is crucial, because ammonia in the un-ionized form (NH3) is toxic to

17
fish at low concentrations while nitrate is relatively non-toxic. Ionized ammonium (NH4+)
is also relatively non-toxic. In water the relative proportions of ionized and un-ionized
ammonia depend upon pH and temperature such that the concentration of toxic NH3 rises
with pH and with temperature. For example, given a water temperature of 20°C, 0.40%
and 1.24% of total ammonia is un-ionized at a pH of 7.0 and 7.5, respectively. At 25°C,
these values increase to 0.57% and 1.77%, respectively. Nitrite (NO2-), the intermediate
form of nitrogen in the nitrification process, is also toxic to many fish at low
concentrations. Nitrite poisoning or “brown blood” disease interferes with the transport of
oxygen by hemoglobin in the blood (Popma & Masser, 1999).
Filtration of solids is required to prevent the accumulation of organic matter (e.g.
solid fish waste, uneaten food, dead fish or plant material) that consumes oxygen when it
decomposes. A small amount of suspended solids can be beneficial, because bacteria
mineralize the nutrients contained therein and make them available to plants. But an
excess of solids may lead to anaerobic decomposition and the production of toxic
methane and hydrogen sulfide (Rakocy et al., 2006). Earthworms are a relatively
common means of degrading solids in media cultures, because they slowly convert
organic wastes to plant-available nutrients (N. Storey, personal communication, January
2, 2014). Removal of solids can be achieved through mechanical filtration components
such as conical settling tanks or mesh filters (Rakocy et al., 2006).
A high level of dissolved oxygen (6 mg/L or more) is required for the health of
the fish, plants, and bacteria that each consumes oxygen through aerobic respiration. The
saturation capacity of oxygen in water is inversely related to altitude, temperature, and
salinity (Bernstein, 2011). For example, at sea level fresh water at 30°C can dissolve up

18
to 7.53 mg O2/L, while fresh water at 20°C can dissolve up to 8.84 mg O2/L (Masser,
Rakocy, & Losordo, 1999). Oxygen is dissolved into a body of water whenever the
water’s surface is disturbed (through the mixing of atmospheric air with the water). In
aquaponics, maintenance of a high DO concentration is often easily achieved without
supplemental oxygen, and it is virtually impossible for the system to contain DO in
excess (Bernstein, 2011). A constant flow regimen generates the highest concentrations
of dissolved oxygen, because the constant movement of water continuously adds oxygen
to the system (Lennard & Leonard, 2004).
A near-neutral pH (6.5 to 7.5) is recommended for the health of the fish, plants,
and bacteria and for the optimal availability of nutrients to plants. Because nitrification
gradually acidifies the water by adding H+ ions, periodic supplements of a base (such as
potassium hydroxide or calcium carbonate) may be necessary to maintain the desired pH.
When plants uptake nitrate, however, their roots release hydroxide (OH-) or bicarbonate
(HCO3-) ions that offset acidification from nitrification (Lennard & Leonard, 2004). As
an aquaponic system matures, the development of buffering capacity has a stabilizing
effect on pH (Bernstein, 2011).
Environmental tolerances of tilapia
Tilapia are hardy warm-water fish with wider tolerance limits than most other
cultured freshwater fish. All tilapia tolerate brackish water, and Blue tilapia grows well in
salinities up to 20 parts per thousand. Prolonged exposure to concentrations of un-ionized
ammonia (NH3) above 0.2 mg/L can cause mortality, but tilapia can survive short-term
exposure (3 or 4 days) to concentrations up to 3.0 mg/L. Tilapia are exceptionally tolerant

19
of nitrite; toxicity occurs at concentrations of 27 mg/L or greater. Tilapia tolerate a pH
between 5 and 10 with an optimal pH range of 6 to 9. Blue tilapia tolerate temperatures
between 8° and 41°C and stop feeding at temperatures below 17°C; the optimal range is
29°–31°C. While a dissolved oxygen (DO) concentration of 1.0 mg/L is acceptable, a
concentration of at least 2.0 mg/L is optimal for growth (Popma & Masser, 1999).

20
CHAPTER III
METHODOLOGY
Design and setting of the aquaponic test units
Six aquaponic production units and a protective rain barrier were constructed and
established inside the shade house at the Florida International University’s Organic
Garden (Modesto Maidique campus). Each aquaponic unit consists of one fish tank
situated directly below one hydroponic grow bed containing Hydroton™ expanded-clay
gravel media. Total water volume per unit is approximately 150 L. Water lost to
evaporation is replaced by refilling the fish tank to a pre-measured 150 L mark in order to
maintain water volume. A submersible fountain pump (1 hp) inside the fish tank
continuously moves water through 1” PVC plumbing up to the grow bed. A nylon mesh
attached to the outlet of the hydroponic supply pipe collects solid wastes that are
routinely removed from the system. Water in the grow bed returns to the fish tank
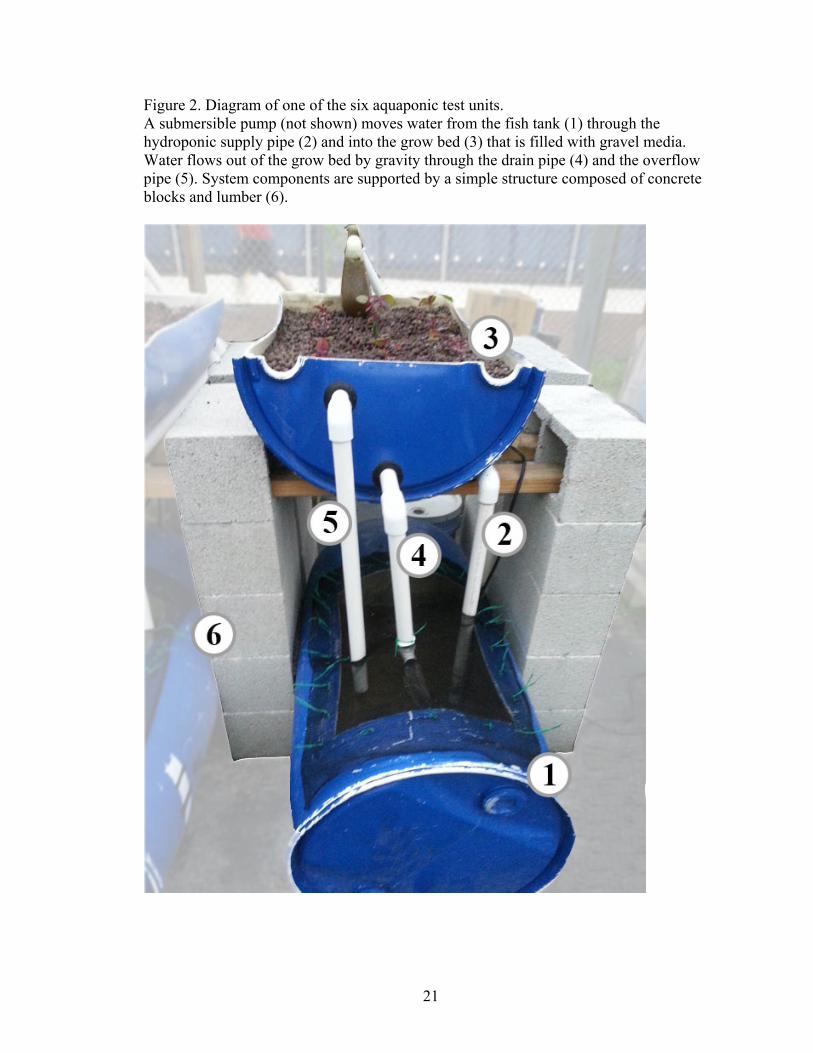
gravitationally via a 1” PVC drain pipe and an overflow pipe (Figure 2).
Each fish tank is a 55-gallon plastic rain barrel (approximately 60cm x 90cm) laid
lengthwise and kept in place with concrete blocks. A rectangular opening (approximately
35 cm by 45 cm) cut into the barrel facilitates feeding of fish and allows adequate space
for maintenance and for inflow and outflow pipes. An appropriately sized and secured
piece of shade cloth covers each of the fish tank openings in order to prevent entry by
predators, insects and other animals.
Each hydroponic grow bed is constructed from one-half of a rain barrel (cut and
laid lengthwise) and contains approximately 100 l of expanded clay gravel media. Grow
21
Figure 2. Diagram of one of the six aquaponic test units. A submersible pump (not shown) moves water from the fish tank (1) through the hydroponic supply pipe (2) and into the grow bed (3) that is filled with gravel media. Water flows out of the grow bed by gravity through the drain pipe (4) and the overflow pipe (5). System components are supported by a simple structure composed of concrete blocks and lumber (6).

22
bed surface area per replicate is approximately 0.5 m2. The grow beds are situated above
the fish tanks and are supported by a simple structure composed of 2.5 cm x 7.5 cm
lumber and concrete blocks. To summarize, the experimental aquaponics units can be
characterized as small-scale gravel media systems under a constant-flow regimen. The
aquaponic units were placed adjacent to each other and aligned in a single row along an
approximately north-south axis.
Blue tilapia (O. aureus) fingerlings were stocked to a density of approximately
2.40 kg of biomass (at harvest) per 100 L of water. Harvest weight of Blue tilapia is
approximately 450 g. Therefore, eight tilapia fingerlings are stocked into each 150 l
system. The initial masses of fingerlings per replicate (live weight) were 73.0 g, 65.0 g,
63.0 g, 65.0 g, 70.0 g, 68.0 g for Replicates 1 through 6, respectively.
Red amaranth (Amaranthus tricolor) seeds were allowed to germinate in
moistened rockwool media plugs outside of the aquaponic systems prior to the beginning
of the experimental trial. Fifteen seedlings were transplanted into each replicate. Initial
seedling mass per replicate was nominal (<1g). Plants were harvested 60 days after
transplantation.
Experimental treatments
Each aquaponic unit was assigned one of two experimental treatments in an
alternating sequence: Odd-numbered units (1, 3 and 5) received the control treatment, and
even-numbered units (2, 4, and 6) received the alternative treatment. Thus, each treatment
group consisted of three replicates. The treatments consisted of two commercially
available pelleted aquafeeds: Replicates in the control group received a common

23
fishmeal-based feed (Zeigler Finfish Silver feed), and replicates in the alternative group
received a plant-based feed (Advanced Biological Concepts Organic Fish Food). Crude
protein content of the control and alternative feeds were 40% and 32%, respectively.
Further details on the nutrient content of the feeds are included in Appendix I.
Table 1. Feeding rate schedule.
Trial days Feeding rate Number of days
1-7 0.10 7
8-14 0.09 7
15-21 0.08 7
22-30 0.07 9
31-35 0.06 5
36-42 0.05 7
43-60 0.04 18
Fish were fed 6 days per week during the 60-day trial period, with the exception
of the first week during which the fish were fed every day. The mass of feed applied to
replicates on a given day was calculated as the product of a feeding rate and an estimate
of fish mass per replicate on that day according to the equations = + ∙ ( − 1) = ∙
where b is fish biomass (g rep-1); t is the trial day: [1-60]; bt is the estimated fish biomass
per replicate on trial day t; b1 is the observed initial fish biomass per replicate (t=1); rG is
the fish growth rate (assumed to be 0.5 g fish-1 day-1, or 4 g rep-1 day-1); ft is the mass of

24
feed to be applied to a replicate (g rep-1) on trial day t; and rF is the feeding rate (g g-1).
The feeding rate schedule is shown in Table 1.
Data collection
The data are grouped into three categories: fish, plants, and water quality. Fish
data are based on the initial and final masses of live fish per replicate, measured on an
Ohaus Scout Pro digital balance. Plant data include initial and final masses of root, stem
and leaf biomass (wet weight) per replicate measured on an Ohaus Scout Pro digital
balance, the total heights of plants per replicate, and the number of leaves per replicate.
Water quality data include measurements of concentrations of total ammonia-N,
nitrate-N, and orthophosphate measured with the AQ2 Discrete Analyzer (according to
EPA methods EPA-129-A Rev. 8 for Ammonia-N, EPA-114-A Rev. 9 for Nitrate-N +
Nitrite-N, and EPA-146-A Rev. 0 for o-Phosphate-P). For each observation, samples
were taken from water entering the grow bed via the supply pipe. All samples were
promptly returned to the lab and run in the AQ2 instrument for analysis without the
addition of preservatives. Thirteen observations of total ammonia-N concentrations, 12
observations of nitrite-N and nitrate-N concentrations, and 11 observations of
orthophosphate concentrations were made over the course of the trial.
Other water quality data include measurements of temperature (°C), pH, dissolved
oxygen (DO, measured in parts per million and percent saturation), total dissolved solids
(TDS, measured in parts per million), and electroconductivity (EC, measured in micro
Siemens per centimeter or μS/cm). These measurements were taken on site in the fish
tank with the Thermo Scientific Orion Star A329 Portable Multiparameter Meter.

25
Fourteen observations of pH, 13 observations of TDS and EC, and 12 observations of DO
were made over the course of the trial.
Statistical analysis
All statistical analyses were conducted using SPSS v21.0 software. One-way
ANOVA was used to test for significant differences in fish and plant growth parameters
between treatment groups. In addition, one-way ANCOVA was used to test for
significant differences in plant growth parameters to control for a plumbing problem that
occurred during the trial. Repeated-measures ANOVA (rANOVA) was used to test for
significant differences in water quality parameters between treatment groups over the
course of the trial. Where appropriate and as noted in the results, data sets were
normalized to adjust for the effect of different quantities of feed applied to replicates.
Economic analysis
The economic analysis begins with the consideration of two commercial
aquaponic production scenarios based on the literature. The Bright Agrotech greenhouse
aquaponic system yields greens and herbs including lettuce and basil that are grown in
proprietary vertical grow towers. The tilapia that grow in the system are not harvested.
Production data for the high-value basil crop (Scenario 1a) and the low-value lettuce crop
(Scenario 1b) are considered for analysis (Storey, n.d.). The University of the Virgin
Islands (UVI) outdoor aquaponic system was an experimental commercial aquaponic
system that yielded both produce and tilapia (Scenario 2) (Bailey et al., n.d.). For each
scenario, six levels of increased crop production resulting from the adoption of an

26
alternative feed vs. a standard feed are considered: 0%, 10%, 20%, 30%, 40% and 50%.
Under Scenario 2, we also consider five levels of reduction in fish yield from the
alternative aquafeed: 80%, 60%, 40%, 20% and 0%.
For Scenario 2, whose total revenue involves interaction between changes in crop
and fish yields as a result of the alternative feed, we calculate the increase in crop yield
that would be required to compensate for the loss of revenue at each level of reduced fish
yield. Finally, results from the technical aspect of the study are applied to Scenario 2 to
determine the effects on revenue.
Limitations of the study
The dissolved nutrients under consideration include ammonia, nitrite and nitrate,
and orthophosphate. Concentrations of other nutrients such as potassium, calcium,
magnesium, and iron were not observed. Therefore, the impact of deficiencies or
overabundance of these nutrients on plant growth and water quality is not included in the
analysis.

27
CHAPTER IV
RESULTS AND DISCUSSION
Throughout this chapter, the fishmeal-based feed is referred to as the control
treatment, while the plant-based feed is referred to as the alternative treatment. Odd-
numbered replicates (1, 3, and 5) received the control treatment, and even-numbered
replicates (2, 4, and 6) received the alternative treatment.
The amount of daily feed applied to each replicate was based on the initial mass
of the replicate, with more feed applied to replicates with greater initial mass. For
example, on any given day Replicate 1 with an initial fish mass of 73 g received more
feed than Replicate 2 with an initial fish mass of 65 g. In order to account for these
differences in the amount of fish feed applied to replicates, we analyze the significance of
the statistics based on normalized values where appropriate.
Over the course of the trial, observations of water temperature across all replicates
ranged from 22.0°C to 27.3°C with a mean of 25.5°C.
Fish growth and feed conversion
There was zero fish mortality during the trial period. The observed fish growth
parameters include net growth, specific growth rate, and feed conversion ratio (Table 2).
Net growth per replicate is calculated as the difference between final and initial mass
(live weight) per replicate. Based on source data, the mean (±SD) net growth values for
the control and alternative treatment groups were 334.0 g (± 76.9 g) and 206.0 g (± 21.0
g), respectively. Higher net growth occurred in all control replicates despite greater

28
variability within the control group than the alternative group (Figure 3). At the 0.05 level
of significance, based on the source data the net fish growth was significantly higher
under the control treatment (p=0.0497).
Table 2. Fish biomass data per replicate (source data).
Replicate 1 2 3 4 5 6
Initial mass (g) 73 65 63 65 70 68
Final mass (g) 320 295 456 256 432 265
Net growth (g) 247 230 393 191 362 197
Specific growth rate (% day-1) 2.50 2.56 3.35 2.32 3.08 2.31
Feed conversion ratio 2.29 2.34 1.36 2.83 1.54 2.79
Figure 3. Net fish growth per treatment group (source data).
Based on the normalized data, the mean (±SD) net fish growth values for the
control and alternative treatment groups were 347.5 (±91.2) g and 217.6 (±23.5) g,
respectively. At the 0.05 significance level, based on the normalized data no significant
difference in net fish growth was observed between treatments (p=0.075). Statistical
power for this test was reduced by normalization of the data, to 0.445. The likelihood of a
Type II error is considerable.

29
Specific growth rate (SGR) is calculated as
= ln( ) − ln( )− ∙ 100
where m1 and m2 are initial and final fish biomass per replicate (g rep-1), respectively, and
t1 and t2 are trial days 1 and 60, respectively. Based on the source data, the mean (±SD)
SGR values for the control and alternative treatment groups were 2.98 (±0.43)% day-1
and 2.40 (±0.14)% day-1, respectively. No significant difference in specific growth rate
was observed between treatments (p=0.092>0.05). Based on the normalized data, the
mean (±SD) SGR values for the control and alternative treatment groups were 3.10
(±0.56)% day-1 and 2.53 (±0.17)% day-1, respectively. Based on the normalized data, no
significant difference in SGR was observed between treatments (p=0.173>0.05).
However, statistical power was low (0.249 and 0.394 for tests based on normalized and
source data, respectively), and the likelihood of a Type II error is high.
The feed conversion ratio (FCR) is the ratio of the total mass of feed applied (g
rep-1) to the net growth of fish mass (g rep-1). Based on the source data for net fish
growth, the mean (±SD) FCR values for the control and alternative treatments groups
were 1.73 (±0.50) and 2.66 (±0.27), respectively. At the 0.05 level of significance the
mean FCR of the control group was significantly less than the mean FCR of the
alternative group (p=0.046). Based on the normalized net growth data, the mean (±SD)
FCR values for the control and alternative treatments groups were 1.68 (±0.54) and 2.52
(±0.27), respectively, with no significant difference in FCRs observed (p=.075).

30
Plant growth and yield
Several plant growth and yield parameters were observed: the heights of plants at
harvest, the number of leaves on each plant at harvest, and biomass (including
measurements of roots, stems and leaves) of each plant at harvest. Table 3 summarizes
the data per replicate. The alternative treatment group experienced higher mean plant
growth in terms of all observed parameters except for shoot to root ratio (Table 4).
However, significant differences between treatments were not observed for any
parameters due to high variability within treatment groups.
Due to plumbing problems in Replicates 5 and 6 early in the experiment, the
water levels in the hydroponic grow beds of these replicates was substantially lower than
the water levels in the other four grow beds during much of the trial. As a result, the roots
of plants in Replicates 5 and 6 did not reach the culture solution as quickly as did the
plants in the other replicates, and they experienced delayed growth. By the end of the
trial, plants in Replicates 5 and 6 were of substantially smaller size than plants in other
replicates. Also, herbivory was observed among plants in Replicates 5 and 6, with two
plants in Replicate 5 not surviving to the end of the trial. With regard to the ANOVA
tests for significance, the variability within treatment groups due to the plumbing
problem increased the error term and reduced the power of each statistical test to less
than 0.20 (Table 5). Thus, it is highly likely that the lack of significance in the ANOVA
results was due to Type II error.
In order to estimate and analyze the effect of the plumbing problem on plant
growth, we may consider Replicates 1 through 4 as one treatment group (“high water
level”) and Replicates 5 and 6 a second treatment group (“low water level”). At the 0.05

31
significance level, Normalized values for both total plant biomass (p=0.027) and plant
height (p=0.020) are significantly higher under the “high water level” treatment.
Therefore, it is reasonable to conclude that the lack of significance in the plant growth
results was likely due to the plumbing problem.
Table 3. Normalized plant growth data per replicate.
Replicate 1 2 3 4 5 6
Combined height (cm) 532.8 621.8 498.1 589.7 245.7 400.2
Number of leaves 310.0 365.0 263.0 404.3 138.7 243.7
Root biomass (g) 115.59 122.09 103.93 168.87 24.33 85.11
Stem biomass (g) 211.92 274.49 191.91 291.36 36.58 117.34
Leaf biomass (g) 232.37 282.90 190.66 306.48 56.72 139.27
Shoot biomass (g) 444.29 557.39 382.57 597.84 93.30 256.61
Total biomass (g) 559.88 679.48 486.49 766.70 117.63 341.72
Shoot to root ratio 3.84 4.57 3.68 3.54 3.83 3.02
Table 4. Normalized mean plant growth data per treatment group.
Plant growth parameter Control group
(M ±SD) Alternative group
(M ±SD)
Height (cm rep-1) 425.54 ±156.72 537.24 ±119.80
Number of leaves per rep 237.24 ±88.51 337.67 ±83.72
Leaf biomass (g rep-1) 159.92 ±91.77 242.88 ±90.50
Shoot biomass (g rep-1) 306.72 ±187.38 470.61 ±186.43
Total biomass (g rep-1) 388.00 ±237.00 595.97 ±224.47
Shoot to root ratio 3.787 ±0.091 3.707 ±0.789

32
Table 5. P-values and statistical power given by one-way ANOVA, based on normalized plant growth data.
Plant growth parameter p power
Height (cm rep-1) 0.382 0.119
Number of leaves per rep 0.227 0.198
Leaf biomass (g rep-1) 0.326 0.141
Shoot biomass (g rep-1) 0.343 0.133
Total biomass (g rep-1) 0.332 0.138
Shoot to root ratio 0.870 0.052
Further, if we substitute plant growth data for Replicates 5 and 6 based on the data
for Replicates 1 through 4, we may estimate the significance level and statistical power
that might have been observed if the plumbing problem had not occurred. Analysis of this
altered data set indicates that, if not for the plumbing problem, high statistical power may
have been achieved and a significant difference between treatments may have been
observed for all plant growth parameters. For example, in terms of total plant biomass we
may substitute the average normalized values of Replicates 1 and 3 (523.19 g) for
Replicate 5 and the average normalized values of Replicates 2 and 4 (723.09 g) for
Replicate 6. With this substitution, the one-way ANOVA test achieves a statistical power
of 0.992 and shows strong evidence for a significant difference in total plant biomass in
favor of the alternative treatment (p=0.004). Further, for a more conservative
consideration we may substitute the higher normalized value of Replicates 1 and 3
(559.88 g) for Replicate 5 and the lower normalized value of Replicates 2 and 4 (679.48
g) for Replicate 6. With this substitution, the one-way ANOVA test achieves a power of
0.918 and shows strong evidence for a significant difference in total plant biomass in
33
favor of the alternative treatment (p=0.010). Similar results are achieved for plant height
and number of leaves.
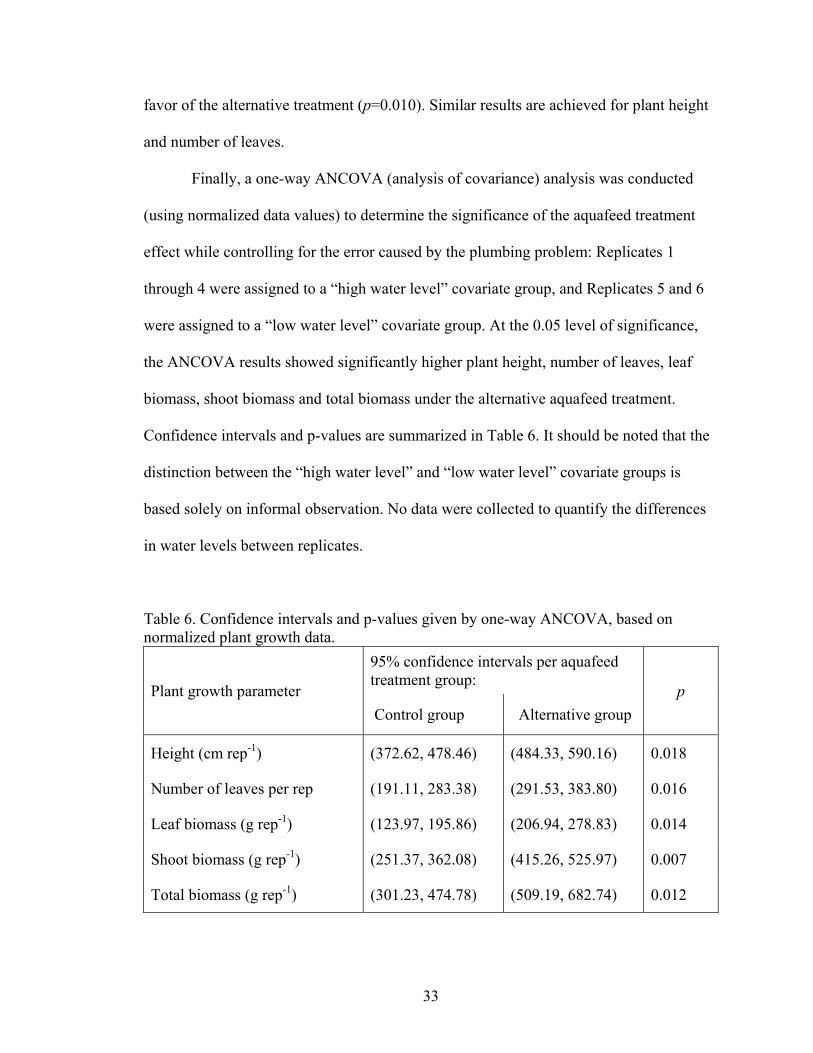
Finally, a one-way ANCOVA (analysis of covariance) analysis was conducted
(using normalized data values) to determine the significance of the aquafeed treatment
effect while controlling for the error caused by the plumbing problem: Replicates 1
through 4 were assigned to a “high water level” covariate group, and Replicates 5 and 6
were assigned to a “low water level” covariate group. At the 0.05 level of significance,
the ANCOVA results showed significantly higher plant height, number of leaves, leaf
biomass, shoot biomass and total biomass under the alternative aquafeed treatment.
Confidence intervals and p-values are summarized in Table 6. It should be noted that the
distinction between the “high water level” and “low water level” covariate groups is
based solely on informal observation. No data were collected to quantify the differences
in water levels between replicates.
Table 6. Confidence intervals and p-values given by one-way ANCOVA, based on normalized plant growth data.
Plant growth parameter
95% confidence intervals per aquafeed treatment group:
p
Control group Alternative group
Height (cm rep-1) (372.62, 478.46) (484.33, 590.16) 0.018
Number of leaves per rep (191.11, 283.38) (291.53, 383.80) 0.016
Leaf biomass (g rep-1) (123.97, 195.86) (206.94, 278.83) 0.014
Shoot biomass (g rep-1) (251.37, 362.08) (415.26, 525.97) 0.007
Total biomass (g rep-1) (301.23, 474.78) (509.19, 682.74) 0.012

34
Across all replicates, seedlings developed and grew slowly during the first 4
weeks of the trial and experienced very rapid growth during the final 3 to 4 weeks of the
trial (Appendix II). Seedlings had been transplanted before the appearance of true leaves.
Premature transplantation was likely the cause of the delayed growth observed during the
first 4 weeks.
Total ammonia-N (TAN) concentration
Figure 4. TAN concentration per replicate (source data). Observations below the detection limit are shown at the limit (0.02 mg/L).
Minute fluctuations in the concentration of total ammonia nitrogen (TAN) are to
be expected during normal operation of any aquaponic system. However, the
concentration should remain near zero. A concentration greater than 0.50 mg/L may
indicate a problem with the biological filter responsible for nitrification and may pose a

35
risk to the fish. Throughout the course of the trial, TAN concentrations remained very
low (below 0.300 mg/L) in all replicates (Figure 4). Often, TAN concentrations were
below the detection limit of the test (<0.02 mg/L). These results indicate that biological
nitrification functioned consistently well in each replicate. A statistically significant
difference in TAN concentrations was not observed between treatment groups (p>0.05).
Nitrate-N concentration
The detection method (EPA-114-A Rev. 9) detects both nitrate-N and nitrite-N,
and the resulting concentration includes both compounds. Nitrite-N concentrations are
assumed to be negligible, and the concentration results are attributed solely to nitrate-N.
The source data and normalized data for nitrate-N concentrations were each tested
for a difference between treatments. At the 0.05 level of significance, the nitrate-N
concentration was significantly higher under the fishmeal-based treatment (by an average
21.79 and 21.98 mg/L per observation based on the normalized and source data,
respectively) than under the alternative treatment (p=0.004 for each data set).
Considering the substantial difference in crude protein content between aquafeeds (40%
and 32% CP for the control and alternative feeds, respectively), the result is not
surprising.
Overall, concentrations of nitrate-N showed an increasing trend over the course of
the trial (Figure 5). The accumulation of nitrate implies that the amount of plants in each
system was inadequate to remove nitrate from the culture water given the amount of feed
applied per replicate. In order to stabilize the nitrate concentration, one would either

36
provide less feed to the fish or add more plants to the system. In the interest of
maintaining the experimental protocol, these adjustments were not made.
Figure 5. Normalized nitrate-N concentration per replicate.
Replicates 2 and 4 (under alternative treatment) each had greater plant
productivity than Replicates 1 and 3 (under control treatment), despite lower nitrate
concentrations in the culture water. This would seem to indicate that nitrate levels,
though lower, were adequate in these alternative replicates, and that some other limiting
factor was responsible for the inferior plant productivity observed in the control
replicates.
The relatively small decreases in nitrate concentrations observed in Replicates 1,
3 and 6 on Day 22 (November 1) were caused by substantial overflows and subsequent

37
replacements of water on Day 21 (October 31) that resulted from clogs in the main
drainage pipes of these replicates. This did not seem to have affected the overall results.
Of greater interest is the relative stabilization or decrease in nitrate concentrations
observed in all replicates between Days 37 and 45 (November 16-24). Because this effect
seems to have coincided with a period of rapid plant growth in all replicates, higher
nitrate removal by growing plants offers the simplest explanation. Since observations of
plant growth parameters were taken only on Days 1 and 60 of the trial, there is no data to
support this claim. However, the photos in Appendix II provide evidence of rapid plant
growth between Days 37 and 45, relative to growth during Days 1 through 36.
Orthophosphate concentration
Figure 6. Normalized orthophosphate concentration per replicate.

38
The source data and normalized data for orthophosphate concentrations were each
tested for a difference between treatments. The mean of observed orthophosphate
concentrations over the course of the trial is greater in the alternative treatment group
than in the control group (by an average 0.341 and 0.361 mg/L based on the source data
normalized data, respectively). However, there is insufficient evidence to claim that these
differences in orthophosphate concentrations are significant at the 0.05 level (p=0.142
and p=0.150 for the source data and normalized data, respectively). Over the course of
the trial, orthophosphate gradually accumulated in each replicate, with some minute
fluctuations (Figure 6).
Total dissolved solids (TDS) concentration and electroconductivity (EC)
The source data and normalized data for concentrations of TDS were each tested
for a difference between treatments. At the 0.05 level of significance, the TDS
concentration was significantly higher under the fishmeal-based treatment (by an average
86.8 and 83.3 mg/L per observation based on the source and normalized data,
respectively) than under the alternative treatment (p=0.011 and p=0.007 for source data
and normalized data, respectively).
Dissolved solids generally accumulated in each replicate over the course of the
trial, and the concentrations exhibited a clear divergence between groups as the trial
period progressed (Figure 7). The first observation indicates that Replicate 1 started with
a higher TDS concentration than each of the other replicates. It is likely that the storage
of the tilapia fingerlings (approximately 60) in Replicate 1 for one week leading up to
Day 1 of the trial led to an initial accumulation of dissolved solids. Interestingly, the TDS

39
Figure 7. Normalized TDS concentration per replicate.
Figure 8. Electroconductivity per replicate (source data).

40
concentration in Replicate 1 eventually converged with those of the other control
replicates. A significance test based on the normalized data, beginning from the first
observed point of convergence on November 1, agrees with the above conclusion that the
TDS concentration was significantly higher under the control treatment (p=0.003).
Electroconductivity levels show a similar trajectory to TDS concentrations
(Figure 8). At the 0.05 significance level, the conductivity level was significantly higher
under the control treatment (by an average 177.2 μS/cm per observation, based on source
data) than under the alternative treatment (p=0.011).
Figure 9. Normalized mean TDS and nitrate concentrations per treatment group.
The accumulation of dissolved solids other than nitrate is illustrated in Figure 9.
On average the proportion of nitrate in TDS increased throughout the trial, to 20% and
17% on Day 60 in the control and alternative replicates, respectively.

41
pH
Figure 10. pH per replicate.
An overall decline in the pH was observed in each replicate, representing a
gradual acidification of the culture water (Figure 10). The magnitude of the declining pH
was small: The pH values across replicates declined from initially slightly alkaline values
(ranging from 7.99 to 8.33) to near-neutral values (ranging from 6.94 to 7.44). This drop
in pH values across replicates is an expected effect of nitrification, and the small
magnitude of this effect is attributed to the buffering capacity associated with high
calcium carbonate content of the water. The pH ranges were acceptable for the uptake of
nutrients and for the health of plants, fish, and bacteria.
In order to test for a difference between treatments, the pH data were transformed
into hydronium ion concentrations (mol/L) via the inverse log function. No significant

42
difference in hydronium ion concentrations was observed between treatments over the
course of the trial (p=0.097>0.05).
Dissolved oxygen (DO) concentration and saturation level
Figure 11. Dissolved oxygen concentration per replicate.
The concentration of dissolved oxygen remained high in all replicates throughout
the trial, varying between 6.61 mg/L and 8.18 mg/L in terms of concentration and
between 80.0% and 94.4% in terms of saturation (Figures 11 and 12). Abundant oxygen
levels were maintained by the falling action of water with no need for supplementary
aeration. Based on source data, significant differences in DO levels were not observed
between treatments (p=0.48 and p=0.44 for concentration and saturation, respectively).

43
Figure 12. Dissolved oxygen saturation level per replicate.
Economic benefit from alternative aquafeeds
The economic analysis explores the effect of an alternative aquafeed on
aquaponic farm revenue. The alternative aquafeed is assumed to result in equal or greater
crop yield and equal or lower fish yield as compared to a standard aquafeed, such as the
fishmeal-based control aquafeed in the technical aspect of the study. The standard
aquafeed is one that would typically be used in a commercial aquaponic operation
although it is formulated for fish-only aquaculture.
First we consider Scenarios 1a and 1b that represent a commercial aquaponic farm
generating revenue solely from the sale of crops, with no harvest of fish. The percentage
increase in revenue generated through the adoption of the alternative aquafeed is equal to
the percentage increase in crop yield (Table 7). For example, Storey (n.d.) reports that

44
each grow tower at the Bright Agrotech aquaponic farm generates 60 pounds of basil or
62.4 pounds of lettuce per year. Under Scenario 1a we assume a price of $3 per ounce for
basil (high-value crop) and annual revenue of $2,880 per grow tower planted in basil.
Similarly, under Scenario 1b we assume a price of $3 per pound for lettuce (low-value
crop) and annual revenue of $187.20 per grow tower planted in lettuce. It is clear that for
a commercial aquaponic farm whose revenue relies solely on crop sales, an aquafeed that
improves crop yield will proportionally improve crop revenue.
Table 7. Additional revenue generated from improved crop yields from adoption of an alternative aquafeed, under Scenarios 1a and 1b.
Change in crop yield 0% +10% +20% +30% +40% +50%Additional revenue:
Scenario 1a $0 $288 $576 $864 $1,152 $1,440Scenario 1b $0 $18.72 $37.44 $56.16 $74.88 $93.60
Change in revenue 0% +10% +20% +30% +40% +50%
Next we consider Scenario 2, a slightly more complex situation based on data
from the experimental commercial aquaponic facility at the University of the Virgin
Islands (UVI). Bailey et al. (n.d.) estimate that each UVI unit generates $17,056.00 and
$36,400.00 in revenue from tilapia and lettuce production, respectively, per year. Thus,
tilapia and lettuce production contribute 31.91% and 68.09%, respectively, to the total
gross annual revenue per unit ($53,456.00). For this analysis, we consider the possibility
that adoption of the alternative aquafeed reduces fish yield while increasing crop yield as
compared to the standard aquafeed. The change in total revenue is given by
ΔTR = ΔY ∙ TR + ΔY ∙ TR

45
where TR is total revenue; YC and YF are yields of crops and fish, respectively; and RC
and RF are revenues from crops and fish, respectively. Thus, assuming no changes in
prices for fish and crops, the change in total revenue is calculated as the sum of the
products of the relative contribution of each source of revenue to the total and the
corresponding change in yield from adoption of the improved feed.
Table 8. Percentage change in total revenue as a function of changes in crop and fish yields from adoption of an alternative aquafeed, under Scenario 2. Change in crop yield (ΔYC) 0% +10% +20% +30% +40% +50%Change in fish yield (ΔYF)
-80% -25.5% -18.7% -11.9% -5.1% 1.7% 8.5%
-60% -19.1% -12.3% -5.5% 1.3% 8.1% 14.9%
-40% -12.8% -6.0% 0.9% 7.7% 14.5% 21.3%
-20% -6.4% 0.4% 7.2% 14.0% 20.9% 27.7%
0% 0.0% 6.8% 13.6% 20.4% 27.2% 34.0%
Based on the UVI model, the percentage change in total annual revenue at various
levels of change in fish and crop yields from adoption of the alternative aquafeed is
presented in Table 8. Under the least favorable condition, with no improvement in crop
yield and 80% reduction in fish yield, total revenue decreases by 25.5%; under the most
favorable condition, with no change in fish yield and 50% improvement in crop yield,
total revenue increases by 34.0%. Given reductions in fish yield of 80%, 60%, 40% and
20%, the percentage increases in crop yield required to maintain total revenue in the UVI
model are 37.49%, 28.11%, 18.74% and 9.37%, respectively.

46
Finally, we apply fish and crop yield results from the technical aspect of the study
to the UVI model, in which 31.91% and 68.09% of revenue is derived from fish and crop
sales, respectively. Given a 37.4% reduction in fish yield and a 51.9% increase in crop
yield (based on means of normalized net fish growth observations and normalized leaf
biomass observations during the experimental trial), the UVI model would see a
$6,378.94 decrease in revenue from tilapia sales per unit and an $18,891.60 increase in
revenue from lettuce sales per unit. Therefore, total revenue would increase by 23.4%, or
$12,512.66 per unit, by adopting the alternative feed. By removing experimental “outlier”
observations, we may consider more conservative estimates of changes to fish and crop
yields: 45.3% reduction in fish yield and 39.3% increase in crop yield. Combinations of
each of these percentage-change values and their effects on total revenue are presented in
Figure 13. Under the most conservative estimate (ΔYF=-45.3%; ΔYC=+39.3%) based on
the experimental results, total gross annual revenue for the UVI model increases by
12.3%, or $6,578.83 per unit.
Although aquafeed cost is not included in this analysis, we consider it likely that
an alternative feed could be produced at a lower cost than standard feeds, assuming
similar scales of production, since fishmeal is substantially more expensive than many
alternative protein sources (El-Sayed, 1999). A lower feed cost would further enhance
aquaponic farm profit by lowering feed costs. The results of this analysis suggest that the
development of aquafeeds specifically formulated to enhance crop yields at commercial
aquaponic farms would be worthwhile once the scale of commercial aquaponics is
adequate. The economic benefit from an alternative, crop-enhancing feed would likely be
shared between aquafeed producers (in the form of a higher price for aquafeed) and

47
aquaponic farmers (in the form of higher revenue from crop yields), depending on the
price elasticity of supply and demand for the feed.
Figure 13. Change in total revenue under Scenario 2, based on experimental results.

48
CHAPTER V CONCLUSION
The leaves and stems of Amaranthus tricolor provide an inexpensive and rich
source of protein, minerals, vitamins and fiber to people in Asia, Africa and the
Caribbean (O’Brien & Price, 1983; Prakash & Pal, 1991). The trial demonstrates that
aquaponic cultivation of A. tricolor, like many other leafy crops, is possible and
potentially highly productive. After a 60-day growing period, Replicates 1 through 4
yielded 1803.1 g of shoot biomass (stems and leaves) in approximately 2 m2 of growing
area, which translates to 901.5 g m-2 or 3648.2 kg acre-1. Data on A. tricolor yields under
field cultivation are extremely limited. However, Shukla et al. (2006) achieved a mean
yield of 1.80 kg m-2 under intensive field cultivation in subtropical India, with leaf
cuttings harvested every 15 days during a season of unspecified length (likely 4 months
or more). This suggests that yield from aquaponic cultivation of A. tricolor may meet or
exceed yield from field cultivation.
Total ammonia-N concentration, dissolved oxygen concentration, and pH
consistently remained within acceptable ranges with no significant differences observed
between treatments. Abundant oxygen levels were supplied by the falling action of water
with no need for supplementary aeration. TAN was often undetectable and remained
below 0.30 mg/L during the trial, indicating quick and effective biological nitrification by
the biofilter. The pH level decreased over the course of the trial but remained near
neutral. Over a longer term, periodic supplementation with a base such as potassium
hydroxide may have become necessary to raise the pH level.

49
Concentrations of nitrate and TDS in the culture water were significantly higher
under the control treatment (fishmeal-based aquafeed), and no significant difference in
orthophosphate concentrations was observed between treatments. The results suggest that
higher concentrations of nitrate and TDS in the culture water are not necessarily
associated with higher plant productivity and imply that the effluent produced from the
fishmeal-based aquafeed contains some unobserved limiting nutrient. Because fish add
nutrients to the culture water and plants remove nutrients from the culture water, a more
precise study of the nutrient dynamics would require additional replicates in which no
plants are cultivated. Thus the accumulation of nutrients under each feed treatment would
serve as a basis for comparison without the confounding effect of nutrient uptake by
plants.
Due to unanticipated plumbing problems in Replicates 5 and 6, plants in these two
replicates were substantially smaller than plants in the other four replicates by the end of
the trial. In order to remove the statistical error caused by these plumbing problems,
Replicates 5 and 6 were assigned to a separate covariate group. After this statistical
adjustment, amaranth crop yield was found to be significantly higher (p<0.05) under the
plant-based aquafeed treatment in terms of plant height, number of leaves, leaf biomass,
shoot biomass and total biomass. It should be noted, however, that the assignment of
replicates to covariate groups was based on informal observation of hydroponic water
levels without data to quantify the differences. Nonetheless, the results demonstrate that a
plant-based aquafeed can achieve similar, if not superior, aquaponic crop yields with
lower inputs of N and P as compared to a high-protein, fishmeal-based aquafeed.

50
The adoption of a lower-cost, low-protein aquafeed that improves crop yield
would clearly benefit aquaponic farmers who focus on crop production. However,
aquaponic farmers who depend upon fish revenue would face a trade-off if the low-
protein aquafeed extends the fish grow-out period or otherwise reduces fish yield. Based
on revenue projections from the experimental aquaponic facility at UVI, adoption of the
plant-based aquafeed tested in this study would increase total revenue by up to 23.4%
through improved crop yields that would more than compensate for the loss of revenue
from reduced fish yields.
Further research into the effect of aquafeed on aquaponic crop productivity could
provide insight into the nutritive quality of aquaponic crops by testing for differences in
the concentrations of vitamins, minerals and other nutrients in cultured crops between
feed treatments. These results could also be compared to nutrient levels in crops from
field and hydroponic cultivation.

51
LIST OF REFERENCES
Al-Hafedh, Y. S., Alam, A., & Beltagi, M. S. (2008). Food production and water conservation in a recirculating aquaponic system in Saudi Arabia at different ratios of fish feed to plants. Journal of the World Aquaculture Society, 39(4), 510-520. doi: 10.1111/j.1749-7345.2008.00181.x Allen, W. (2013, March). Growing the good food revolution. Presented at University of Miami, Miami, FL. Bailey, D. S., Rakocy, J. E., Cole, W. M., & Shultz, K. A. (n.d.). Economic analysis of a commercial-scale aquaponic system for the production of tilapia and lettuce. Unpublished manuscript, Agriculture Experiment Station, University of the Virgin Islands, St. Croix, U.S. Virgin Islands. Retrieved from https://images.indiegogo.com/medias/394863/files/20120818104616-Economic_Analysis_of_a_Commercial-Scale_Aquaponic_System.pdf Baulcomb, C. (2013). Aquaculture and ecosystem services: Reframing the environmental and social debate. In S. Wratten, H. Sandhu, R. Cullen & R. Costanza (Eds.), Ecosystem services in agricultural and urban landscapes (1st ed., pp. 58-82). West Sussex, United Kingdom: John Wiley & Sons, Ltd. Bernstein, S. (2011). Aquaponic gardening: A step-by-step guide to raising vegetables and fish together. Gabriola Island, Canada: New Society Publishers. Bunting, S. W. (2013). Principles of sustainable aquaculture: Promoting social, economic and environmental resilience. Oxfordshire, United Kingdom: Routledge. Bunting, S. W., & Little, D. C. (2005). The emergence of urban aquaculture in Europe. In B. Costa-Pierce, A. Desbonnet, P. Edwards & D. Baker (Eds.), Urban aquaculture (pp. 119-135). Oxfordshire, United Kingdom: CAB International. Bunting, S. W., Pretty, J., & Edwards, P. (2010). Wastewater-fed aquaculture in the East Kolkata Wetlands, India: anachronism or archetype for resilient ecocultures? Reviews in Aquaculture, 2(3), 138-153. doi: 10.1111/j.1753-5131.2010.01031.x Beveridge, M. C. M., & Little, D. C. (2002). The history of aquaculture in traditional societies. In Costa-Pierce, B. A. (Ed.). Ecological aquaculture: The evolution of the blue revolution. (pp. 3-29). Oxford, United Kingdom: Blackwell Science Ltd. Cho, C. Y., & Bureau, D. P. (2001). A review of diet formulation strategies and feeding systems to reduce excretory and feed wastes in aquaculture. Aquaculture Research, 32(s1), 349-360. doi: 10.1046/j.1355-557x.2001.00027.x

52
Cohen, M. J., & Garrett, J. L. IIED and UNFPA, (2009). The food price crisis and urban food (in)security. Retrieved from website: http://www.iied.org/pubs/display.php?o=10574IIED Deutsch, L., Gräslund, S., Folke, C., Troell, M., Huitric, M., Kautsky, N., & Lebel, L. (2007). Feeding aquaculture growth through globalization: Exploitation of marine ecosystems for fishmeal. Global Environmental Change, 17(2), 238-249. doi: 10.1016/j.gloenvcha.2006.08.004 Eding, E., Verdegem, M., Martins, C., Shlaman, G., Heinsbroek, L., Laarhoven, B., Ende, S., Verreth, J., Aartsen, E., Bierbooms, V. (2009). Tilapia farming using recirculating aquaculture systems (RAS): Case study in the Netherlands. In C. I. M. Martins, E. H. Eding, M. C. J. Verdegem, L. T. N. Heinsbroek, O. Schneider, J. P. Blancheton, E. Roque d’Orbcastel, J.A.J. Verreth (2010), New developments in recirculating aquaculture systems in Europe: A perspective on environmental sustainability. Aquacultural Engineering, 43(3), 83-93. doi: 10.1016/j.aquaeng.2010.09.002 Edwards, P. (2005). Development status of, and prospects for, wastewater-fed aquaculture in urban environments. In B. Costa-Pierce, A. Desbonnet, P. Edwards & D. Baker (Eds.), Urban aquaculture (pp. 45-60). Oxfordshire, United Kingdom: CAB International. El-Sayed, A. F.M. (1999). Alternative dietary protein sources for farmed tilapia, Oreochromis spp. Aquaculture and the Environment, 179(1), 149-168. doi: 10.1016/S0044-8486(99)00159-3 El-Sayed, A. F. M. (2004). Protein nutrition of farmed tilapia: Searching for unconventional sources. In R. B. Bolivar, G. C. Mair, & K. Fitzsimmons (Eds.), New dimensions on farmed tilapia: Proceedings of the sixth international symposium on tilapia in aquaculture (pp. 364-378). Manila, Philippines: ISTA Publications. Retrieved from http://ag.arizona.edu/azaqua/ista/ista6/ista6web/pdf/364.pdf El-Sayed, A. F. M. (2006). Tilapia culture. Wallingford, United Kingdom: CAB International. FAO Fisheries and Aquaculture Department, Statistics and Information Service FishStatJ: Universal software for fishery statistical time series. Copyright 2011 Food and Agriculture Organization of the United Nations. (2012a). Fishery and aquaculture statistics: 2010. Retrieved from http://www.fao.org/docrep/015/ba0058t/ba0058t.pdf

53
Food and Agriculture Organization of the United Nations. (2012b). The State of World Fisheries and Aquaculture: 2012. Retrieved from http://www.fao.org/docrep/016/i2727e/i2727e.pdf Foesel, B. U., Gieseke, A., Schwermer, C., Stief, P., Koch, L., Cytryn, E., de la Torré, J. R., van Rijn, J., Minz, D., Drake, H. L., & Schramm, A. (2008). Nitrosomonas Nm143-like ammonia oxidizers and Nitrospira marina-like nitrite oxidizers dominate the nitrifier community in a marine aquaculture biofilm. FEMS Microbiology Ecology, 63(2), 192-204. doi: 10.1111/j.1574-6941.2007.00418.x Keuter, S., Kruse, M., Lipski, A., & Spleck, E. (2011). Relevance of Nitrospira for nitrite oxidation in a marine recirculation aquaculture system and physiological features of a Nitrospira marina-like isolate. Environmental Microbiology, 13(9), 2536-2547. doi: 10.1111/j.1462-2920.2011.02525.x Lal, R. (2013, November). Beyond Intensification. Paper presentation at the ASA, CSSA, & SSSA International Annual Meetings, Tampa, FL. Lennard, W. A., & Leonard, B. V. (2004). A comparison of reciprocating flow versus constant flow in an integrated, gravel bed, aquaponic test system. Aquaculture International, 12(6), 539-553. doi: 10.1007/s10499-005-8528-x Lennard, W. A., & Leonard, B. V. (2006). A comparison of three different hydroponic sub-systems (gravel bed, floating and nutrient film technique) in an aquaponic test system. Aquaculture International, 14(6), 539-550. doi: 10.1007/s10499-006-9053-2 Lewis, W., Yopp, J. H., Schramm, Jr., H. L., & Brandenburg, A. M. (1978). Use of hydroponics to maintain quality of recirculated water in a fish culture system. Transactions of the American Fisheries Society, 107(1), 92-99. Retrieved from http://opensiuc.lib.siu.edu/cgi/viewcontent.cgi?article=1063&context=fiaq_pubs Little, D. C., & Bunting, S. W. (2005). Opportunities and constraints to urban aquaculture, with a focus on South and Southeast Asia. In B. Costa-Pierce, A. Desbonnet, P. Edwards & D. Baker (Eds.), Urban aquaculture (pp. 25-44). Oxfordshire, United Kingdom: CAB International. Losordo, T. M., Masser, M., & Rakocy, J. Southern Regional Aquaculture Center. (1992). Recirculating aquaculture tank production systems: An overview of critical considerations (Publication No. 451). Retrieved from http://university.uog.edu/cals/people/pubs/aquac/451recag.pdf Lovelace, J. K. United States Geological Survey. (2009). Methods for Estimating Water Withdrawals for Aquaculture in the United States, 2005 (Scientific Investigations Report 2009-5042). Retrieved from http://pubs.usgs.gov/sir/2009/5042/pdf/sir2009-5042.pdf

54
Masser, M. P., Rakocy, J. H., & Losordo, T. M. Southern Regional Aquaculture Center, (1999). Recirculating aquaculture tank production systems: Management of recirculating systems (Publication No. 452). Retrieved from http://aqua.ucdavis.edu/DatabaseRoot/pdf/452RFS.PDF McMurtry, M. R., Sanders, D. C., Cure, J. D., Hodson, R. G., Haning, B. C., & St. Amand, B. C. (1997). Efficiency of water use of an integrated fish/vegetable co-culture system. Journal of the World Aquaculture Society, 28(4), 420-428. doi: 10.1111/j.1749-7345.1997.tb00290.x Naylor, R. L., Goldburg, R. J., Primavera, J. H., Kautsky, N., Beveridge, M. C. M., Clay, J., Folke, C., Lubchenco, J., Mooney, H., & Troell, M. (2000). Effect of aquaculture on world fish supplies. Nature, 405, 1017-1024. doi: 10.1038/35016500 O'Brien, G. K., & Price, M. (1983). Amaranth: Grain & vegetable types. ECHO Technical Note. Retrieved from http://c.ymcdn.com/sites/www.echocommunity.org/resource/collection/E66CDFDB-0A0D-4DDE-8AB1-74D9D8C3EDD4/Amaranth_Grain_&_Vegetable_Types_[Office_Format].pdf Olsen, R. L., & Hasan, M. R. (2012). A limited supply of fishmeal: Impact on future increases in global aquaculture production. Trends in Food Science & Technology, 27(2), 120-128. doi: 10.1016/j.tifs.2012.06.003 Orsini, F., Kahane, R. C., Nono-Womdim, R., & Gianquinto, G. (2013). Urban agriculture in the developing world: A review. Agronomy for Sustainable Development, 33(4), 695-720. doi: 10.1007/s13593-013-0143-z Pillay, T. V. R. (2004). Aquaculture and the environment. (2nd ed.). Oxford, United Kingdom: Blackwell Publishing, Ltd. Popma, T., & Masser, M. Southern Regional Aquaculture Center, (1999). Tilapia: Life history and biology (Publication No. 283). Retrieved from website: https://srac.tamu.edu/index.cfm/event/getFactSheet/whichfactsheet/53/ Prakash, D., & Pal, M. (1991). Nutritional and anti nutritional composition of vegetable and grain amaranth leaves. Journal of the Science of Food and Agriculture, 57(4), 573-583. doi: 10.1002/jsfa.2740570410 Rakocy, J. E., Bailey, D. S., Shultz, R. C., & Thoman, E. S. (2004a). Update on tilapia and vegetable production in the UVI aquaponic system. In R. B. Bolivar, G. C. Mair, & K. Fitzsimmons (Eds.), New dimensions in farmed tilapia: Proceedings of the sixth international symposium on tilapia in aquaculture (pp. 676-690). Manila, Philippines: ISTA Publications. Retrieved from http://ag.arizona.edu/azaqua/ista/ista6/ista6web/pdf/676.pdf

55
Rakocy, J. E., Hargreaves, J. A., & Bailey, D. S. (1993). Nutrient accumulation in a recirculating aquaculture system integrated with hydroponic vegetable production. In J. Wang (Ed.), Techniques for modern aquaculture (pp. 148-158). St. Joseph, MI: American Society of Agricultural Engineers. Rakocy, J. E., Masser, M. P., & Losordo, T. M. Southern Regional Aquaculture Center, (2006). Recirculating aquaculture tank production systems: aquaponics—integrating fish and plant culture (Publication No. 454). Retrieved from website: https://srac.tamu.edu/index.cfm/getFactSheet/whichfactsheet/105/ Rakocy, J. E., Shultz, R. C., Bailey, D. S., & Thoman, E. S. (2004b). Aquaponic production of tilapia and basil: Comparing a batch and staggered cropping system. Acta Horticulturae (ISHS) 648:63-69. Retrieved from http://uvi.edu/files/documents/Research_and_Public_Service/AES/Aquaculture/Tilapia_and_Basil.pdf Shukla, S., Bhargava, A., Chatterjee, A., Pandey, A. C., & Kumar, A. R. A. (2010). Genetic interrelationship among nutritional and quantitative traits in the vegetable amaranth. Crop Breeding and Applied Biotechnology, 10(1), 16-22. Shukla, S., Bhargava, A., Chatterjee, A., Srivastava, A., & Singh, S. P. (2006). Genotypic variability in vegetable amaranth (Amaranthus Tricolor L.) for foliage yield and its contributing traits over successive cuttings and years. Euphytica, 151(1), 103-110. doi: 10.1007/s10681-006-9134-3 Storey, N. (n.d.). Zipgrow production estimates . Retrieved from http://brightagrotech.com/uploads/ZipGrow_Tower_Production_Estimates_Guide.pdf Tacon, A. G. J., Hasan, M. R., & Metian, M. (2011). Demand and supply of feed ingredients for farmed fish and crustaceans: Trends and prospects. In FAO fisheries and aquaculture technical paper no. 564. Retrieved from http://www.fao.org/docrep/015/ba0002e/ba0002e.pdf Tal, Y., Schreier, H. J., Sowers, K. R., Stubblefield, J. D., Place, A. R., & Zohar, Y. (2009). Environmentally sustainable land-based marine aquaculture. Aquaculture, 286(1-2), 28-35. doi: dx.doi.org/10.1016/j.aquaculture.2008.08.043 Timmons, M. B. (2005). Competitive potential for USA urban aquaculture. In B. Costa-Pierce, A. Desbonnet, P. Edwards & D. Baker (Eds.), Urban aquaculture (pp. 137-158). Oxfordshire, United Kingdom: CAB International. United Nations Department of Economic and Social Affairs. (2004). World population to 2300. Retrieved from http://www.un.org/esa/population/publications/longrange2/WorldPop2300final.pdf

56
United Nations Department of Economic and Social Affairs. (2011). World urbanization prospects, 2011 Revision: Percentage of population residing in urban areas, 1950-2050 [XLS file]. Retrieved from website: http://esa.un.org/unup/CD-ROM/Urban-Rural-Population.htm

57
APPENDICES
APPENDIX I
Nutrient content of fishmeal-based feed (control treatment):
Crude protein: Minimum 40% Crude fat: Minimum 10% Crude fiber: Maximum 4% Moisture: Maximum 12% Ash: Maximum 8% Phosphorus: Maximum 1.12% Ingredients include marine protein and oil products, processed grain and vegetable products, processed poultry by-products, vitamins (including stable vitamin-C), minerals and amino acids. (Source: Zeigler web site, http://www.zeiglerfeed.com/product_literature/aquaculture%20literature_finfish/Finfish%20Silver.pdf)
Nutrient content of plant-based feed (alternative treatment):
Crude protein: Minimum 32% Crude fat: Minimum 4.68% Crude fiber: Maximum 8.70% Moisture: Maximum 8.0% Lysine: Minimum 1.7% Calcium: Minimum 0.70%, Maximum 1.20% Phosphorus: Minimum 0.40% Ingredients: Organic Fabaceae, Organic Poaceae, Organic Rice Bran, Organic Canola Meal, Organic Corn, Organic Flax Meal, Dicalcium Phosphate, Lactobacillus Acidophilus Fermentation Product, Reed Sedge Peat, Monosodium Phosphate, Magnesium Oxide, Sodium Sulfate, Manganous Oxide, Folic Acid, Nacin, Choline Chloride, Biotin, Riboflavin, Vitamin A ACETATE, Vitamin B12, Vitamin D3, Vitamin E, Calcium Pantothenate, Ethylenediamine Dihydriodide, Beta Carotene, Pyridoxine Hydrochloride, Ascorbic Acid, Yeast Culture, Thiamine Mononitrate, Ferric Choline Citrate Complex, Organic Dried Kelp, Zinc Amino Acid Complex, Cobalt Choline Citrate Complex, Salt, Copper Choline Citrate Complex, Manganese Amino Acid Complex, Potassium Chloride, Attapulgite Clay, Organic Grape Seed Extract, Organic Lecithin, Enzyme Product, Organic Aloe Vera Juice, Calcium Carbonate, Sodium Selenite, Citric Acid, Calcium Hydroxide, Copper Sulfate Pentahydrate, Zinc Sulfate Monohydrate, Manganese Sulfate, Organic Garlic, Diatomaceous Earth, Organic

58
Dried Whole Milk, Organic Sugar, Potassium Citrate, Calcium Sulfate, Magnesium Sulfate, Activia Natural Source Mg, Fe, K, Organic Dry Whole Egg, Organic Tomato Powder, Organic Sources used (Orange Peel Powder, Cayenne Pepper, Dandelion Root, Dandelion, Cloves, Sage, Peppermint, Fennel, Hops, Parsley, Thyme, Lemon Grass, Elder Flowers, Chamomile Flowers, Licorice, Basil, and Ginger) for water extracts using Fermentation Acids, Organic Oat Groats, Yucca Schidigera Whole Plant Product, Organic Gelatin, Zinc Sulfate, Yeast, Granite Dust, Perfect Food Raw, Ferrous Sulfate, Zinc Oxide, Sulfur, Organic Rice Protein, Copper Sulfate, Cobalt Carbonate. (Source: The Aquaponic Store web site, http://www.theaquaponicstore.com/AquaOrganic-Fish-Feed-5-Pounds-p/affab001.htm)

59
APPENDIX II
Photos of replicates during trial.
Replicate 1 2 3 4 5 6 Day 8 (Oct 18)
Day 23 (Nov 2)
Day 29 (Nov 8)

60
Replicate
1
2
3
4
5
6
Day 37 (Nov 16)
Day 43 (Nov 22)
Day 53 (Dec 2)

61
Day 60 (Dec 9)