effect of cooling system on the polymer temperature and
TRANSCRIPT

HAL Id: hal-00509235https://hal.archives-ouvertes.fr/hal-00509235
Submitted on 11 Aug 2010
HAL is a multi-disciplinary open accessarchive for the deposit and dissemination of sci-entific research documents, whether they are pub-lished or not. The documents may come fromteaching and research institutions in France orabroad, or from public or private research centers.
L’archive ouverte pluridisciplinaire HAL, estdestinée au dépôt et à la diffusion de documentsscientifiques de niveau recherche, publiés ou non,émanant des établissements d’enseignement et derecherche français ou étrangers, des laboratoirespublics ou privés.
Effect of cooling system on the polymer temperatureand solidification during injection molding
Hamdy Hassan, Nicolas Regnier, Cedric Lebot, Cyril Pujos, Guy Defaye
To cite this version:Hamdy Hassan, Nicolas Regnier, Cedric Lebot, Cyril Pujos, Guy Defaye. Effect of cooling system onthe polymer temperature and solidification during injection molding. Applied Thermal Engineering,Elsevier, 2009, 29 (8-9), pp.1786. �10.1016/j.applthermaleng.2008.08.011�. �hal-00509235�

Accepted Manuscript
Effect of cooling system on the polymer temperature and solidification during
injection molding
Hamdy Hassan, Nicolas Regnier, Cedric Lebot, Cyril Pujos, Guy Defaye
PII: S1359-4311(08)00351-7
DOI: 10.1016/j.applthermaleng.2008.08.011
Reference: ATE 2604
To appear in: Applied Thermal Engineering
Received Date: 15 November 2007
Revised Date: 26 March 2008
Accepted Date: 19 August 2008
Please cite this article as: H. Hassan, N. Regnier, C. Lebot, C. Pujos, G. Defaye, Effect of cooling system on the
polymer temperature and solidification during injection molding, Applied Thermal Engineering (2008), doi:
10.1016/j.applthermaleng.2008.08.011
This is a PDF file of an unedited manuscript that has been accepted for publication. As a service to our customers
we are providing this early version of the manuscript. The manuscript will undergo copyediting, typesetting, and
review of the resulting proof before it is published in its final form. Please note that during the production process
errors may be discovered which could affect the content, and all legal disclaimers that apply to the journal pertain.

ACCEPTED MANUSCRIPT
EFFECT OF COOLING SYSTEM ON THE POLYMER TEMPERATURE AND
SOLIDIFICATION DURING INJECTION MOLDING
Hamdy HASSAN, Nicolas REGNIER, Cedric LEBOT, Cyril PUJOS, Guy DEFAYE,
Tel: 00330540006348
Fax: 00330540002731
Laboratoire TREFLE-Bordeaux1-UMR 8508, site ENSCPB, 16 av Pey Berland, 33607,
Pessac Cedex,
France
ABSTRACT
Cooling system design is of great importance for plastic products industry by injection
molding because it is crucial not only to reduce molding cycle time but also it significantly
affects the productivity and quality of the final product. A numerical modeling for a T-mold
plastic part having four cooling channels is performed. A cyclic transient cooling analysis
using a finite volume approach is carried out. The objective of the mold cooling study is to
determine the temperature profile along the cavity wall to improve the cooling system
design. The effect of cooling channels form and the effect their location on the temperature

ACCEPTED MANUSCRIPT
distribution of the mold and the solidification degree of polymer are studied. To improve
the productivity of the process, the cooling time should be minimized and at the same time
a homogeneous cooling should be necessary for the quality of the product. The results
indicate that the cooling system which leads to minimum cooling time is not achieving
uniform cooling throughout the mould.
Key words: Polymer; solidification; injection molding; cooling system.
NOMENCLATURE
CP Specific heat at constant pressure, J/kg.K
sf Solid fraction
h Heat transfer coefficient, W/m2.K
K Number of the internal iterations
L Latent heat of fusion, J/kg
n Number of the external iterations
N Normal direction
Sc Source term
T Temperature, K
t Time, s
Greek symbols

ACCEPTED MANUSCRIPT
λ Thermal conductivity, W/m.K
ρ Density, kg/m3
1Γ Interior surface of the cooling channels
2Γ Exterior surface of the mold
Subscripts
a Ambient air
c Cooling fluid
f Phase change
1. INTRODUCTION
Plastic industry is one of the world’s fastest growing industries, ranked as one of the
few billion-dollar industries. Demand for injection molded parts continues to increase every
year because plastic injection molding process is well known as the most efficient
manufacturing techniques for economically producing of precision plastic parts with
various shapes and complex geometry at low cost [1].The plastic injection molding process
is a cyclic process where polymer is injected into a mould cavity, and solidifies to form a
plastic part. There are three significant stages in each cycle. The first stage is filling the
cavity with melt hot polymer at an injection temperature (filling and post-filling stage). It is
followed by taking away the heat of the polymer to the cooling channels (cooling stage),
finally the solidified part is ejected (ejection stage). The cooling stage is of the greatest
importance because it significantly affects the productivity and the quality of the final

ACCEPTED MANUSCRIPT
product. It is well known that more than seventy percent of the cycle time in the injection
molding process is spent in cooling the hot polymer melt sufficiently so that the part can be
ejected without any significant deformation [2]. An efficient cooling system design of the
cooling channels aiming at reducing cycle time must minimize such undesired defects as
sink marks, differential shrinkage, thermal residual stress built-up and part warpage. During
the post-filling and cooling stages of injection molding, hot molten polymer touches the
cold mold wall, and a solid layer forms on the wall. As the material cools down, the solid
skin begins to grow with increasing time as the cooling continues until the entire material
solidifies. Over the years, many studies on the problem of the optimization of the cooling
system layout in injection molding and phase change of molding process have been made
by various researchers and ones which focused intensity on these topics and will used in
our system design and validations are [3-6]. The main purpose of this paper is to study the
effect of the cooling channels position and its cross section shape on the temperature
distribution of the mold and polymer, therefore, their effect on the solidification degree of
that polymer. A fully transient mold cooling analysis is performed using the finite volume
method for a T-shape plastic mold with similar dimensions to [5], as shown in figure 1.
Different cooling channels positions and forms are studied.
2. MATHEMATICAL MODEL
The heat of the molten polymer is taken away by forced convection to the coolant
moving through the cooling channels and by natural convection to the air around the
exterior mold surface. The coolant is flowing through the channels at a given flow rate and
ACCEPTED MANUSCRIPT
a given temperature which is considered constant throughout the length of the channel. In
this work, time-dependent two-dimensional model is considered which consists of an entire
computational domain of the cavity, mold and cooling channel surfaces. The cyclic
transient temperature distribution of the mold and polymer T-shape can be obtained by
solving the transient energy equation.
).( TtT
CP ∇∇=∂∂ λρ (1)
In order to take into account the solidification, a source term is added to the energy
equation corresponding to heat absorption or heat release [7], which takes in consideration
the absorption or the dissipation of the heat through phase change process. This technique
is applied on fixed nodes and the energy equation in this case is represented as follow:
cP STtT
C +∇∇=∂∂
).(λρ (2)
And the source term Sc is represented by:
tf
LS sfc ∂
∂= ρ (3)
Where )(Tf s =0.0 at fTT � ,(full liquid region) ,10 �� sf at fTT = (isothermal phase
change region) and, )(Tf s =1 at fTT � (full solid region).

ACCEPTED MANUSCRIPT
On the whole domain, the following boundary conditions are applied
1)( Γ∈−=∂∂− cc TThNTλ and, 2)( Γ∈−=
∂∂− aa TThNTλ (4)
.
3. NUMERICAL SOLUTION
The numerical solution of the mathematical model governing the behavior of the
physical system is computed by finite volume method. The equations are solved by an
implicit treatment for the different terms of the equations system. When we take in
consideration the solidification effect, the energy equation is solved with a fixed point
algorithm for the solid fraction. For each, iteration of that fixed point, we use discretization
with time hybrid explicit/implicit technique already validated in previous studies by Vincent
[8], and Le Bot [9] that is based on the technique « New Source » of Voller [10]. This
method proposes to maintain the nodes where phase change occurs to the melting
temperature. This solution is repeated until the convergence of the temperature with the
source term equals to the latent heat. The source term is discretized by:
tff
Ltf
LSn
sn
sf
sfc ∆
−=
∂∂
=+1
ρρ (5)
The solid fraction which is function of the temperature is linearized as:
ACCEPTED MANUSCRIPT
)()(11
K
kn
K
kn
K
kn
sK
kn
sK
kn
s TTdTdF
ff+
++++
++
−+= (6)
Then, we force the temperature to tend to the melting temperature where the source term is
not null by updating the source term:
t
TTCSS fpk
ck
c ∆−
+=+ )(1 ρ (7)
The energy equation is discretized as follow:
nPf
Kk
nfns
Kk
n
sfK
kn
Kk
nKk
nfP Tt
CT
dTdF
t
Lff
t
LTT
dTdF
t
L
tC
∆+
∆−−
∆=∇∇−
∆−
∆+
++
++
+++ ρρρ
λρρ
)()().())((111
(8)
With:
−∞→dTdF
if 10 �� Kk
n
sf+
and 0=dTdF
if 10 orf K
kn
s =+
(9)
This process allows differentiating the temperature field and solid fraction calculated at the
same instant and the linear system is solved by central discretization method [11]. For each
internal iteration, the resolution of that equation provides Kk
n
sf1++ and K
kn
T1++. The
convergence is achieved when the criteria of the solid fraction and temperature are verified
by:

ACCEPTED MANUSCRIPT
fKk
n
sK
kn
s ff ∈−+
++
�
1 and,
TKk
nK
kn
TT ∈−+
++
�
1 (10)
Further details on the numerical model and its validation are presented in [9].
4. RESULTS AND DISCUSSION
A full two dimensional time-dependent mold cooling analysis in injection molding
is carried out for a plate mould model with T-shape plastic mold and four cooling channels
as indicated in Fig. 1. Due to the symmetry, half of the mold is modeled and analyzed. All
the cooling channels have the same size and they have diameter of 10-mm each in case of
circular channels. The cooling operating parameters and the material properties are listed in
tables 1, and 2 respectively and they are considered constant during all numerical results
[5,7]. Each numerical cycle consists of two stages, cooling stage where the cavity is filled
with hot polymer initially at polymer injected temperature, the ejection stage where the
cavity is filled with air initially at ambient temperature. Figures 3, and 4 show the cyclic
transient variations of the mould temperature with time for 16 seconds mold cooling time at
locations; (P1,P2,P3,P4) beside the mould walls and P5 to P7 inside the mould walls
respectively (Fig.1) and that in case of applied the solidification and without applied
solidification. They are simulated for the first 30 cycles in case of circular cooling channels
position (A5, D3) as shown in Fig. 2. We find that, the simulated results are in good
agreement with the transient characteristic of the cyclic mold temperature variations
described in [5]. It is found that there is a slightly difference in temperatures values
ACCEPTED MANUSCRIPT
between the two results, thus due to the difference in numerical method used and the
accuracy in the numerical calculations. The figures show that, the relatively temperature
fluctuation is largest near the cavity surface and diminishes away from the cavity surface.
We find that the maximum amplitude of temperature fluctuation during the steady cycle
can reach 10 oC without applying solidification and 15 oC in case of applying the
solidification.
4.1 Effect of cooling channels form
An efficient cooling system design providing uniform temperature distribution
throughout the entire part during the cooling process should ensure product quality by
preventing differential shrinkage, internal stresses, and mould release problems. It also
should reduce time of cooling and accelerate the solidification process of the product to
augment the productivity of the molding process. To demonstrate the influence of the
cooling channels form on the temperature distribution throughout the mould and
solidification process of the product, we proposed three different cross sectional forms of
the cooling channels, circular, square, rectangular1 with long to width ratio of 0.5 and
rectangular2 with width to long ratio of 0.25. Two cases are studied; first case, all the
cooling channels have the same cross sectional area, and the second case, they have the
same perimeter. The comparison is carried out for the same cooling channels position (A5,
D3).

ACCEPTED MANUSCRIPT
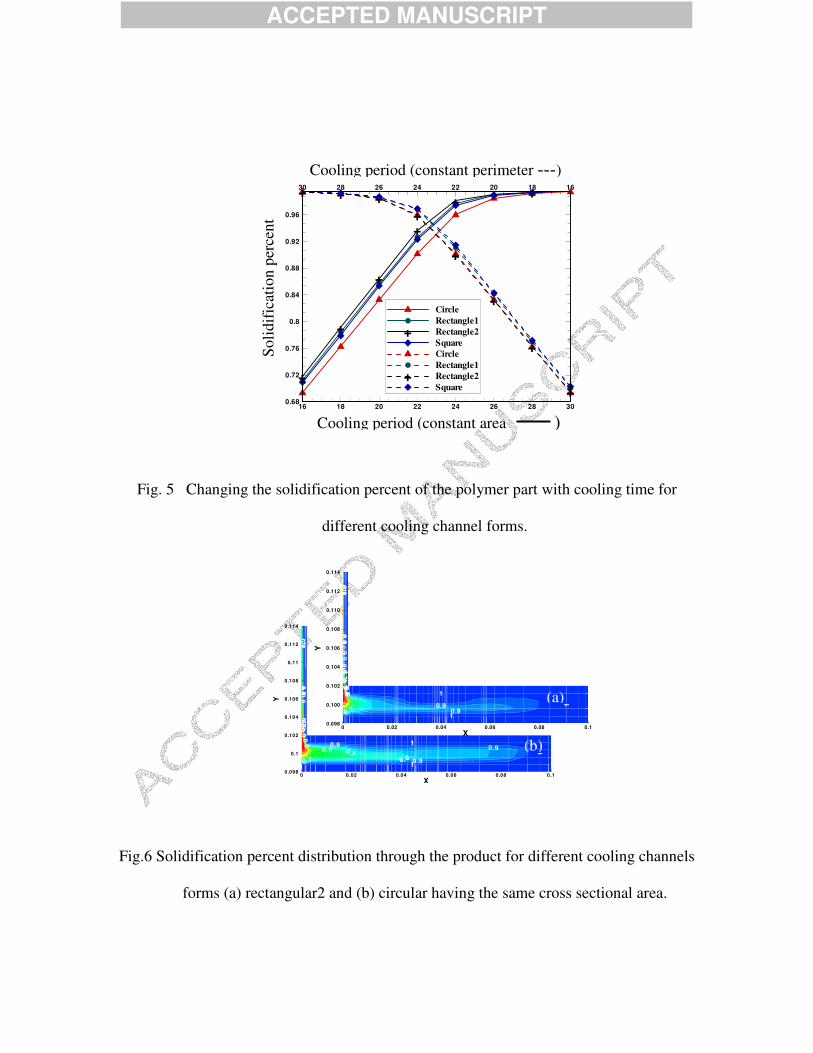
Figure 5 shows the solidification percent (calculated numerically as the summation of
the solid fraction of each element multiplied by the area of that element to total area of the
product) for different forms with different cooling time. The figure indicates that the effect
of cooling channels form on the cooling rate decreases with increasing the cooling time. It
also shows that the cooling channel form rectangle2 has the maximum solidification
percent for case1, and in case 2 the changing of the cooling channels form has not a
sensible effect on the solidification percent. The same results can be obtained when we
compared the solidification in the product and the temperature distribution though the
mould for different forms with the same cross sectional area at the end of the cooling stage
for cooling time 24 second for cooling cycle 25, as shown in Fig. 6 and Fig.7 respectively.
The results indicate that the cooling process is improved as the cooling channels tend to
take the form of the product.
4.2 Effect of cooling channels position
To investigate the effect of the cooling channels position, we divided the proposed
positions into four groups, group A, and B for different positions of the bottom cooling
channel , with a fixed position of the top cooling channel, and with vice versa for group C,
and D for the same cooling channel form (circular) as illustrated in Fig.2.
Figure 8 represents the effect of different cooling channel positions on the of
solidification percent at the end of 25th cooling cycle for groups A, B (lower cooling
channel effect) ,C, and D (upper cooling channel effect) with cooling time. It indicates that
ACCEPTED MANUSCRIPT
for lower cooling channel position effect, the cooling rate increases and hence the
solidification percent of the polymer increases as the cooling channel approaches the
polymer in the vertical direction (position B has solidification percent greater than position
A, and with the same position C and D). The figure shows also the most efficient cooling
rate is obtained as the cooling channel takes the position between 20% and 50% through the
product length for the horizontal direction (between positions B2, and B5 or positions A2
and A5 which have the maximum solidification percent). When we compare the
solidification percent for different locations of the upper position C and D, we find that as
the channel approaches to the product in the horizontal direction the solidification percent
increases, and the cooling rate increase rapidly compared with the effect of lower position.
We notice that, the effect of the cooling channel position on the temperature distribution
and solidification decreases as the cooling time augments to higher value and its effect on
the cooling rate of the product is not the same for different positions.
The solidification degree distribution through the product at the end of cooling stage at
the end of cooling time 24 seconds and 25th cooling cycle for different locations of cooling
channel is shown in Fig.9, and the temperature distribution throughout the mould and the
polymer at the same instant for different cooling channels position is shown in Fig. 10.
When we examine the solidification degree of the product and the temperature distribution
throughout the mold for different positions, we find that as the cooling channel position
moves toward the products, the homogeneity of the temperature distribution throughout the
polymer and the mold during the solidification process decrease for example positions (B2,
D3) and (B2,C3). The figure indicates that as the channel approaches the product in the

ACCEPTED MANUSCRIPT
horizontal direction and vertical direction, the temperature distribution throughout the
polymer divided into two regions during the cooling process (B7, D3), (B2, D3), (C5, B2),
(C3, B2) and thus has the same effect on the solidification process. These two areas of the
temperature distribution and that different cooling rate through the cooling process lead to
different severe warpage and thermal residual stress in the final product which affect on the
final product quality.
5. CONCLUSION
The variation of the temperature of the mould through a number of molding cycles
is carried out. The simulated results are in good agreement with the transient characteristic
of the cyclic mold temperature variations described in [5] and It is found that there is a
slightly difference in temperatures values between the simulated results and those described
in [5]. The effect of cooling channels form and the effect of its position on the temperatures
distribution throughout the polymer and the solidification of the product are studied. The
results indicate that as the cooling channels take the form of the product, the cooling rate is
improved. The position of cooling channels has a great effect on the cooling process and
temperature distribution through the mould and the polymer. The results show that the
cooling system layout which performs minimum cooling time not necessary achieves
optimum temperature distribution throughout the product, and the system layout must be
optimized to achieve the both goals.

ACCEPTED MANUSCRIPT
REFERENCES
[1] S.H. Tang, Y.M. Kong, and S.M. Sapuan, , Design and Thermal Analysis of Plastic
Injection Mould, J. of Materials Processing Technology, vol. 171, P. 259-267(2006).
[2] Li Q. Tang, C. Chassapis, and S. Manoochehri, , Optimum Cooling System Design for
Multi-Cavity injection Molding, Finite Elements in Analysis and Design vol.26. P.229-
251(1997).
[3] M.R. Barone and, D.A. Caulk, , Special boundary integral equations for approximate
solution of Laplace's equation in two-dimensional regions with circular holes, Q. J.
Mech. Appl. Math. 34(3),P.265-286(1981).
[4] J.C.Lin, Optimum Cooling System Design of a Free-Form Injection Mold Using an
Abductive Network, J. of Materials Processing Technology. Vol.120, P.226-236(2002).
[5] H. Qiao, Transient Mold Cooling Analysis Using the BEM with the Time- Dependent
Fundamental Solution, Int. Com. in Heat and Mass Transfer, vol. 32, P. 315-322(2005).
[6] C. S. Li, C.F.Hung, and Y;K; Shen, Finite Element Analysis for Phase Change problem
in Polymer processing, Int. Com. in Heat and Mass Transfer, vol.22, P. 167-177(1995).
[7] O. Bertrand , Phénomènes de ségrégation et contraintes thermomécaniques associés au
processus de changement de phase liquide - solide. Thèse de doctorat, Université
BordeauxI, 1999.
[8] S. Vincent, and E. Arquis, Numerical Modeling of Cooling and Solidification of Molten
Particles Impacting a Solid Substrate, Société française de thermique, vol.8, P.371-
375(2000).

ACCEPTED MANUSCRIPT
[9] Le. Bot, Impact et Solidification de Gouttes Métalliques sur un Substrat Solide. Thèse
de doctorat, Université Bordeaux I(2003).
[10] V.R. Voller, Fast Implicit Difference Method for the Analysis of Phase Change
Problems, Numerical Heat Transfer,vol. 17, part B, P 155-169(1990).
[11] S.V. Patanker, Numerical heat transfer and fluid flow. Hemisphere Publishing
Cooperation, New York (USA), 1980.

ACCEPTED MANUSCRIPT
Cooling operating
parameter
Cooling operating
parameter
Coolant fluid temperature 30 oC Ambient air temperature 30 oC
Polymer injected
temperature
220 oC Heat transfer coefficient of
ambient air
77 W/m2.K
Temperature of fusion of
polymer
110 oC Heat transfer coefficient
inside cooling channel
3650 W/m2.K
Latent heat 115 kJ/kg Mold opening time 4s
Table 1: Cooling operating parameters

ACCEPTED MANUSCRIPT
Material Density, kg/m3 Specific heat, J/kg.K Conductivity, W/m.K
Mould 7670 426 36.5
Polymer 938 1800 0.25
Air 1.17 1006 0.0263
Table 2: Material properties

ACCEPTED MANUSCRIPT
Fig. 1 Mold structure with a T-shape product and four cooling channels (Dim. In m).
Fig. 2 Different cooling channels positions (Dim. In m).
0.01 0.01 0.01 0.01 0.01 0.02
A1 A2 A3 A4 A5 A7
B1 B21
B3 B4 B5 B7
C1 C2 C3 C4 C5
D1 D2 D3 D4 D5
0.04
0.
02
0.01
0.
015 Po
lym
er
0.2
0.4
0 .2
0.00
4
0.03
0.004
P2 P3
P4
P1
P5
P6 P7
Exterior air, free convection, ha
Cooling channels, forced convection, hf

ACCEPTED MANUSCRIPT
Fig. 3 Temperature history of the first 30 cycles at locations P1 to P4 (a) without solidification
(b) with solidification.
Fig. 4 Temperature history of the first 30 cycles at locations P5 to P7 (a) without
solidification (b) with solidification.
Tem
pera
ture
, o C
Time, s
Tem
pera
ture
(C)
0 200 400 60030
35
40
45
50
55
60
65
P1P2P3P4
(a)
Time, s
Tem
pera
ture
, o C
0 100 200 300 400 500 60030
35
40
45
50
55
60
65
70
75
P1P2P3P4
(b)
Time, s
Tem
pera
ture
, o C
Time ( S )0 200 400 600
30
35
40
45
50
55
60
65
P5P6P7
(a)
Time, s
Tem
pera
ture
, o C
0 200 400 60030
35
40
45
50
55
60
65
70
75
P5P6P7
(b)
ACCEPTED MANUSCRIPT
Fig. 5 Changing the solidification percent of the polymer part with cooling time for
different cooling channel forms.
Fig.6 Solidification percent distribution through the product for different cooling channels
forms (a) rectangular2 and (b) circular having the same cross sectional area.
0.6
0.7
0.70.8
0 .8
0.9
0.90.9
1
1
1
0.10 .2
0.20 .3
0 .30 .4
0. 50 .5
0.60.6
0 . 70.7
0 .80.8
0. 91
1
X
Y
0 0.02 0.04 0.06 0.08 0.10.098
0.1
0.102
0.104
0.106
0.108
0.11
0.112
0.114
0.6
0.7
0.8
0.90.9
1
1
1
0.10.2
0.20 .3
0.30.4
0. 50 .5
0.60.6
0 .70.70.8
0.90.9
11
X
Y
0 0.02 0.04 0.06 0.08 0.10.098
0.100
0.102
0.104
0.106
0.108
0.110
0.112
0.114
(b)
(a)
Solid
ific
atio
n pe
rcen
t
Cooling period (constant perimeter ---)
Cooling period (constant area )
+
+
+
+
+ + +
+
+
+
+
++++
16 18 20 22 24 26 28 30
1618202224262830
0.68
0.72
0.76
0.8
0.84
0.88
0.92
0.96
CircleRectangle1Rectangle2SquareCircleRectangle1Rectangle2Square
+
+

ACCEPTED MANUSCRIPT
Fig.7. Temperature distribution through the mould for different cooling channels forms (a)
circular and (b) rectangular2 having the same cross sectional area.
38
40
40
40
42
42
45
45
45
45
45
50
50
50
55
55
60
60
6565 707080 8090 90
X
Y
0 0.05 0.1 0.15 0.20
0.05
0.1
0.15
0.2
(a)
35
35
37
37
38
38
38
40
40
40
40
42
42
42
42
42
45
45
45
45
45
50
50
55
55
60
6065 65 7070 80
80
90
90
X
Y
0 0.05 0.1 0.15 0.20
0.05
0.1
0.15
0.2
(b)

ACCEPTED MANUSCRIPT
Fig.8. Changing the solidification percent of the polymer part with cooling time for
different cooling channel positions(a) lower cooling channel positions A, and B and
(b) upper cooling channel positions C, and D.
Time, s
Solid
ific
atio
n pe
rcen
t
(a)
∗
∗
∗∗ ∗ ∗
+
+
+
+ + +
∗
∗
∗
∗ ∗ ∗
+
+
+
++ +
20 22 24 26 28 300.82
0.84
0.86
0.88
0.9
0.92
0.94
0.96
0.98
1
B1,D3B2,D3B3,D3B5,D3B7,D3A1,D3A2,D3A3,D3A5,D3A7,D3
∗+
∗+
Time, s
Solid
ific
atio
n pe
rcen
t (b)
∗
∗
∗∗
∗∗
∗
∗
∗∗
∗∗
20 22 24 26 28 300.82
0.84
0.86
0.88
0.9
0.92
0.94
0.96
0.98
1
B2,C1B2,C2B2,C3B2,C5B2,D1B2,D2B2,D3B2,D5
∗
∗

ACCEPTED MANUSCRIPT
Fig.9. Solidification percent distribution through the product for different cooling channels
positions for cooling time 24 seconds and 25th cooling period (a) B7, D3 (b) B2, D3, (c)
B2, C5, and (d) B2, C3.
0.6
0.7
0.7
0.80.9
0.9
1
11
0.10.2
0.20.3
0.30.4
0.50.5
0. 60.6
0. 70.7
0.80.8
0 .91
1
X
Y
0 0.02 0.04 0.06 0.08 0.10.098
0.1
0.102
0.104
0.106
0.108
0.11
0.112
0.114
0.2
0.70.8
0.90.9
0.91
1
11
0 .10.1
0.20 .3
0. 40.4
0.50.6
0. 70 .7
0.80.9 1
X
Y
0 0.02 0.04 0.06 0.08 0.10 .098
0.1
0.102
0.104
0.106
0.108
0.11
0.112
0.114
(a)
(b)
0 .2
0 . 50 . 6
0 .7
0 .8 0 . 9
0 .9
1
1 1
1
0.1 0 .20 .3
0.40.4
0.50.5
0.60.6
0.70.8
0.80 . 9
0.91
1
X
Y
0 0 .0 2 0 .0 4 0 . 0 6 0 .0 8 0 .10 . 0 9 8
0 . 1
0 . 1 0 2
0 . 1 0 4
0 . 1 0 6
0 . 1 0 8
0 .1 1
0 . 1 1 2
0 . 1 1 4
0.1
0.3
0 .5
0 .8 0.9
1 1
1
0.10.1
0 .20.2
0.30.3
0.30.4
0.40.5
0.50.6
0.60. 7
0.70.8
0.80. 9
0 .91
1
X
Y
0 0.02 0.04 0.06 0.08 0.10 .0 98
0 .1
0 .1 02
0.1 04
0.1 06
0.1 08
0.11
0.1 12
0.1 14
(c)
(d)

ACCEPTED MANUSCRIPT
Fig.10. Temperature distribution through the mould for different cooling channels positions
for cooling time 24 seconds and 25th cooling period (a) B2, D3 and (b) B7, D3.
37
37
38
38
38
40
40
40
42
42
42
42
42
45
45
45
45
45
45
50
50
50
50
6060 7070 8080 9090 100100 110110
X
Y
0 0.05 0.1 0.15 0.20
0.05
0.1
0.15
0.2
(a)
35
37
37
38
38
38
38
40
4040
42
42
45
45
45
50
50
50
55
55
55
60
60
65 65
65
70 70
7 0
75 75
75
8080 90
9 0
X
Y
0 0.05 0.1 0.15 0.20
0.05
0.1
0.15
0.2
(b)