effect of crab effluent and scent of damaged conspecifics
TRANSCRIPT

Hydrobiologia 193: 155-182, 1990.K. Johannesson, D. G. Raffaelli and C. J. Hannaford Ellis (eds), Progress in Littorinid and Muricid Biology. 155© 1990 Kluwer Academic Publishers. Printed in Belgium.
Effect of crab effluent and scent of damaged conspecifics on feeding,growth, and shell morphology of the Atlantic dogwhelk Nucella lapillus (L.)
A. Richard PalmerDepartment of Zoology, University of Alberta, Edmonton, Alberta T6G 2E9 and Bamfield Marine Station,Bamfield, British Columbia VOR IBO, Canada
Key words: gastropod, Cancer, phenotypic variation, plasticity, laboratory experiment, allometry, alarmresponse, norm of reaction, adaptation
Abstract
Juvenile Nucella lapillus of two different shell phenotypes, exposed shore and protected shore, weremaintained in running seawater under each of three experimental conditions for 94 d: a) laboratorycontrol, b) exposed to the effluent of crabs (Cancerpagurus) fed frozen fish ('fish-crab'), and c) exposedto the effluent of crabs fed live conspecific snails ('snail-crab'). Rates of barnacle consumption and ratesof body weight change varied significantly between phenotypes and among experimental conditions.Individuals from the protected-shore consumed consistently fewer barnacles and grew consistently lessthan those from the exposed shore. Body weight increases in the fish-crab treatments were from 25 to50% less than those in the controls and body weights in the snail-crab treatment either did not changeor actually decreased. The perceived risk of predation thus appears to have a dramatic effect on the ratesof feeding and growth of N. lapillus.
At the end of the experiment, size-adjusted final shell weights for both phenotypes were consistentlyhigher than controls (no crab) in both the fish-crab and snail-crab treatments. In addition, apertural toothheight, thickness of the lip, and retractability (i.e. the extent to which a snail could withdraw into its shell),with few exceptions all varied in an adaptive manner in response to the various risk treatments. Similarchanges in the shell form of starved snails exposed to the same stimuli suggest very strongly that themorphological responses of both phenotypes were not just due to differences in rates of growth. Thesedifferences, at least in part, represented a direct cueing of the shell form of Nucella lapillus to differencesin the perceived risk of predation. Somewhat surprisingly, the extent of phenotypic plasticity appearedto differ between the populations examined. Both field and laboratory evidence suggest that the exposed-shore population was much more labile morphologically than the protected-shore population.
In many instances, particularly among starved snails, the development of antipredatory shell traits wasgreater in the fish-crab treatment than in the snail-crab treatment. Because the scent of crabs was presentin both treatments, these results suggest a) that, at the frequency/concentration used in the experiments,the scent of damaged conspecifics may have been a supernormal stimulus and b) that the morphologicalresponse in these treatments might have been greater if the stimulus had been provided at a lower level.

156
Introduction
The shells of dogwhelks (Thaidinae) can varyenormously among populations within a singlespecies. This variability is a conspicuous featureof species from rocky shores of the northeasternPacific (Nucella canaliculata, N. emarginata,N. lamellosa and N. lima; Kincaid, 1957, 1964;Kitching, 1976; Spight, 1973), Australia(Dicathais aegrota; Phillips et al., 1973), NewZealand (Lepsiella albomarginata, L. scobina;Kitching & Lockwood, 1974), the North Atlantic(Nucella lapillus; Colton, 1916, 1922; Crothers,1985) and South Africa (Nucella dubia; Kilburn &Rippey, 1982) and includes variability in shellthickness, shape and sculpture. In Nucella lapillus,this variation has persisted at least since the LatePliocene (Cambridge & Kitching, 1982; Moore,1985).
Much of the intraspecific variation in the shellsof dogwhelks appears to be adaptive. Thickershells, or those with smaller apertures, are lessvulnerable to predation by shell-breaking crabs(Hughes & Elner, 1979; Kitching etal., 1966;Kitching & Lockwood, 1974; Palmer, 1985a).Thinner shells, on the other hand, are less expen-sive to produce energetically and less likely tolimit the maximum rate of growth (Palmer, 1981).Larger apertures are associated with propor-tionally larger feet which reduce the probability ofdislodgement by breaking waves (Etter, 1988;Kitching et al., 1966). Compared to smoothshells, spiral sculpture increases the force requiredto crush entire shells and may reduce the vulnera-bility of snails to attack by shell-crushing fish(Palmer, unpublished observations).
Although some of this morphological variationhas a genetic basis (Largen, 1971; Palmer,1985b), a sizeable fraction may also be ecopheno-typic (Etter, 1988; Palmer, 1985b; Spight, 1973).Nucella lamellosa of the northeastern Pacificexhibit a rather striking range of shell forms inresponse to environmental cues. In this species,the scents of crabs and of damaged conspecificsboth induce the development of larger aperturalteeth (Appleton & Palmer, 1988) and heaviershells (Palmer, unpublished observations) com-
pared to controls. Rates of feeding and growthalso declined substantially with increasing appar-ent risk (Appleton & Palmer, 1988). To determinethe generality of these responses in dogwhelks Iinitiated a similar experiment examining the effectof these environmental stimuli on the feeding,growth and shell morphology of the NorthAtlantic dogwhelk, Nucella lapillus (L.).
Materials and methods
Collection and measurement
Dogwhelks were collected from two sites on theshores of Anglesey, North Wales, UK. Because ofdifferent wave-exposure regimes these two sitesharbored different shell phenotypes. One site wasan exposed headland at the southwestern edge ofTrearddur Bay facing directly west into the IrishSea ('exposed'; 53° 16'00" N, 4° 37' 10" W,Ordnance Survey grid reference SH250779) andthe other a boulder and cobble beach towards thenorth end of the Menai Straits, Trwyn Y Penrhyn('protected'; 53° 17' 45" N, 4° 03' 10", O.S. gridreference SH631798).
Small preliminary samples were collected ini-tially on July 10, 1986 to determine the relation-ship between shell length and wet body weight foreach site. Based on this relationship, large num-bers of dogwhelks of approximately the same wetbody weight were collected from each site onJuly 20 and taken to the University College ofNorth Wales Marine Science Laboratory atMenai Bridge where they were held immersed inrunning seawater. Snails were identified individu-ally by writing a number on their shell with afine-tipped permanent marker and covering itwith a clear, cyanoacrylate glue to prevent abra-sion.
Prior to the experiment, shells were measuredfor total length, aperture length and width, bodywhorl diameter, and thickness of the apertural lip(Fig. 1) to the nearest 0.05 mm using Verniercalipers. Lip thickness was measured eitherbetween apertural teeth, if present, or at the loca-tion on the lip where the teeth would have devel-
157
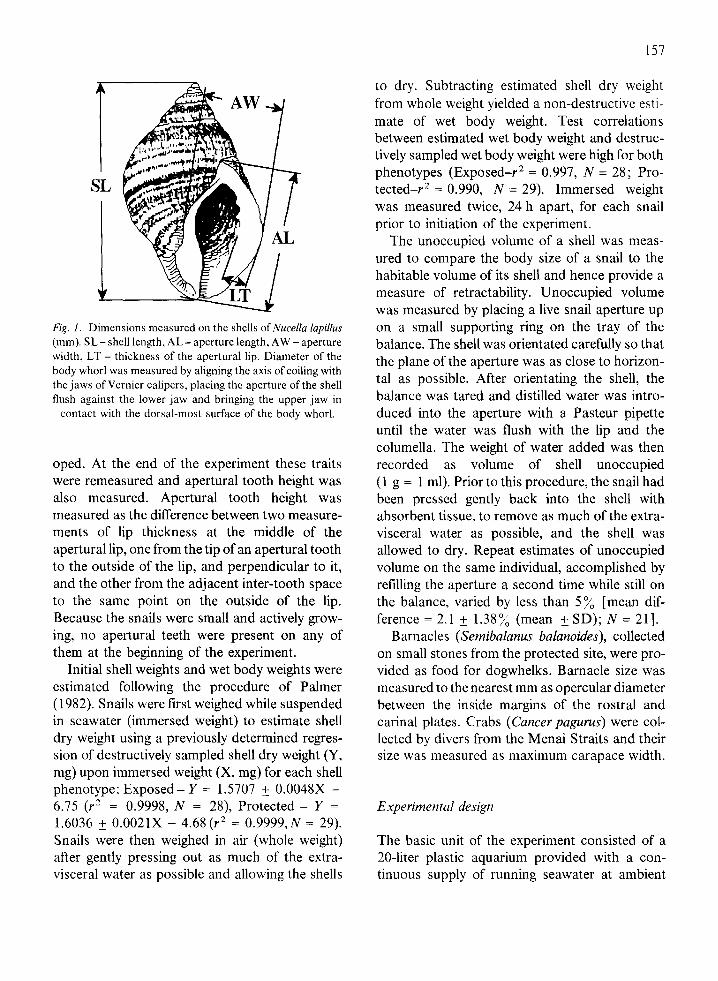
Fig. 1. Dimensions measured on the shells of Nucella lapillus(mm). SL - shell length, AL - aperture length, AW - aperturewidth, LT - thickness of the apertural lip. Diameter of thebody whorl was measured by aligning the axis of coiling withthe jaws of Vernier calipers, placing the aperture of the shellflush against the lower jaw and bringing the upper jaw in
contact with the dorsal-most surface of the body whorl.
oped. At the end of the experiment these traitswere remeasured and apertural tooth height wasalso measured. Apertural tooth height wasmeasured as the difference between two measure-ments of lip thickness at the middle of theapertural lip, one from the tip of an apertural toothto the outside of the lip, and perpendicular to it,and the other from the adjacent inter-tooth spaceto the same point on the outside of the lip.Because the snails were small and actively grow-ing, no apertural teeth were present on any ofthem at the beginning of the experiment.
Initial shell weights and wet body weights wereestimated following the procedure of Palmer(1982). Snails were first weighed while suspendedin seawater (immersed weight) to estimate shelldry weight using a previously determined regres-sion of destructively sampled shell dry weight (Y,mg) upon immersed weight (X, mg) for each shellphenotype: Exposed - Y = 1.5707 + 0.0048X -6.75 (r2 = 0.9998, N = 28), Protected - Y =1.6036 + 0.0021X - 4.68(r2 = 0.9999, N = 29).Snails were then weighed in air (whole weight)after gently pressing out as much of the extra-visceral water as possible and allowing the shells
to dry. Subtracting estimated shell dry weightfrom whole weight yielded a non-destructive esti-mate of wet body weight. Test correlationsbetween estimated wet body weight and destruc-tively sampled wet body weight were high for bothphenotypes (Exposed-r 2 = 0.997, N = 28; Pro-tected-r 2 = 0.990, N = 29). Immersed weightwas measured twice, 24 h apart, for each snailprior to initiation of the experiment.
The unoccupied volume of a shell was meas-ured to compare the body size of a snail to thehabitable volume of its shell and hence provide ameasure of retractability. Unoccupied volumewas measured by placing a live snail aperture upon a small supporting ring on the tray of thebalance. The shell was orientated carefully so thatthe plane of the aperture was as close to horizon-tal as possible. After orientating the shell, thebalance was tared and distilled water was intro-duced into the aperture with a Pasteur pipetteuntil the water was flush with the lip and thecolumella. The weight of water added was thenrecorded as volume of shell unoccupied(1 g = 1 ml). Prior to this procedure, the snail hadbeen pressed gently back into the shell withabsorbent tissue, to remove as much of the extra-visceral water as possible, and the shell wasallowed to dry. Repeat estimates of unoccupiedvolume on the same individual, accomplished byrefilling the aperture a second time while still onthe balance, varied by less than 5% [mean dif-ference = 2.1 + 1.38% (mean + SD); N = 21].
Barnacles (Semibalanus balanoides), collectedon small stones from the protected site, were pro-vided as food for dogwhelks. Barnacle size wasmeasured to the nearest mm as opercular diameterbetween the inside margins of the rostral andcarinal plates. Crabs (Cancer pagurus) were col-lected by divers from the Menai Straits and theirsize was measured as maximum carapace width.
Experimental design
The basic unit of the experiment consisted of a20-liter plastic aquarium provided with a con-tinuous supply of running seawater at ambient

158
Fig. 2. Patterns of water circulation through experimentalcages. Exp. - compartment containing snails from theexposed-shore population, Prot. - compartment containingsnails from the protected-shore population. Dashed linesindicate permeable partitions between adjacent compart-
ments.
temperature (Fig. 2). To this aquarium was addedeither a) nothing ('no crab' = laboratory control)or b) two crabs, one male and one female, whichwere fed frozen fish (= 'fish-crab') or c) twocrabs, one male and one female, fed live, intactN. lapillus (15-20 mm shell length) from theexposed site ( = 'snail-crab'). Each of these threerisk treatments was replicated twice. The fouraquaria containing crabs were subdivided withrigid, but perforated partitions to keep the twocrabs separate and to allow seawater to circulate
between compartments. They were also keptcovered with black plastic to minimize disturb-ance to the crabs. The C. pagurus were size-matched as much as possible among replicates(Table 1), however, some crabs moulted or diedover the course of the experiment. These werereplaced within 24 h.
From each experimental aquarium, seawaterflowed by gravity into two cages made from plas-tic freezer containers (20 x 16 x 7 cm) fromwhich the center of the lids had been removed andreplaced with 7 mm plastic mesh. Each cage wasfurther subdivided into two compartments by aplastic mesh partition (Fig. 2). The cages weretilted slightly so that seawater flowed in one sideand out the other. Each compartment contained10 N. lapillus from one of the source populations,and the adjoining compartment contained 10snails from the other. Both compartments of agiven cage were either loaded with stones coveredwith barnacles ('fed') or with bare stones('starved'). In this manner, snails in the 'starved'treatments were unable to sense food available inthe 'fed' treatments. Before placing them in thecage, the stones covered with barnacles wereinspected carefully and dead barnacles (i.e. thosemissing opercular plates) were removed. Uponsubsequent examination, all dead barnacles werethen assumed to have been eaten.
Table 1. Carapace widths and final wet weights of the crabs (Cancer pagurus) used over the course of the experiments(July 24-Oct. 26, 1986). Crabs that escaped, moulted or died were replaced as noted. Dashes indicate crabs that survived forthe entire experiment. Total snails eaten refers to the total number of N. lapillus eaten by both crabs in a particular replicate.Repl. - replicate, m - male, f- female.
Treatment Repl. Initial Replacement Final wet Totalweight snails
Carapace width Sex Dates Carapace width Sex Dates (g) eaten(mm) (mo/d) (mm) (mo/d)
Fish-crab 1 10779
2 101110
Snail-crab 1 7684
2 8298
m 7/24-9/16f 7/24-9/3m 7/24-8/26f 7/24-10/26
m 7/24-10/26f 7/24-10/13f 7/24-8/16m 7/24-10/26
104100125
m 9/16-10/26 167.3f 9/3-10/26 172.7m 8/26-10/26 285.5
-- 215.0
111105
f 10/13-10/26f 8/16-10/26
72.3154.9171.0153.7
544
703

159
Execution of the experiment
From the time of collection until initiation of theexperiment (4 d), snails were held continuouslyimmersed in cages without food in fresh runningseawater which, at least after entering the labora-tory seawater system, had no prior contact withcrabs. On July 24, following tagging and measure-ment, all snails were loaded into their respectivecages and then the cages were connected toaquaria containing the experimental stimuli.
Snails from the starved and fed treatmentswere monitored differently. To determine theeffect of risk treatments on the short-term rates ofshell deposition of starved snails, immersedweight was measured 24 h after initiation of theexperiment, at 48 h intervals for the next six days,at 72 h intervals for the subsequent six days, andwith declining frequency for the remainder of theexperiment. These weighings were conducted asquickly as possible to minimize disturbance.Snails of both phenotypes were removed from anindividual cage, held immersed in seawater in aplastic container, weighed and then returned torunning seawater in their respective cage within15 min. At the end of the experiment (October 26),snails were removed from their cages and meas-ured for shell length, lip thickness, apertural toothheight, immersed weight and whole weight.
Snails in the fed treatment were not monitoredas frequently to avoid disturbing them. At 10 to30 d intervals they were measured for shell lengthand immersed weight. Whole weight was notmeasured because it disrupted activity of thesnails for the subsequent 24-48 h. Barnacles werereplaced with fresh ones every 20-30 d. Botheaten and uneaten barnacles removed from thecages were counted and the opercular diametersof eaten barnacles measured.
Flow rates through the aquaria were measuredevery two to four days and adjusted if necessaryto a rate close to 1.7 liters min- (0.85 1 m cage- ). In addition, the aquariawere inspected daily to insure that the flow ofseawater had not been interrupted. Water tem-perature was also measured daily and rangedfrom 16 C at the beginning to 13 C at the end
of the experiment. At least once a day, the numberof snails eaten by crabs in the snail-crab treat-ments were recorded, and replacement snailswere added to bring the total up to five per crab.Over the 94 day duration of the experiment, morethan 250 snails were eaten per crab (Table 1).Crabs in the fish-crab treatment were fed roughly2-4 g of frozen fish (haddock or cod) every thirdor fourth day, and any uneaten fish was removedat the end of the day.
Statistical analyses
Statistical analyses were conducted using themicrocomputer statistical package Statview512 + TM (Abacas Concepts, Berkeley, CA).Because of the design of the experiment, F-valuesfrom analysis of variance (ANOVA) were com-puted according to the procedure suggested byHartley (1962) and Sokal & Rohlf (1981;p. 395-396) as follows. Sums of squares (SS)were computed via a three-way fully factorialANOVA (A = risk treatment x B = sourcepopulation x C = replicate). Because replicateswere nested within the main effects, and becausethe question to be answered was whether the var-iation among main effects exceeded that betweenreplicate cages rather than that among snailswithin cages, the mean squares (MS) for maineffects (A or B) and their interaction (AB) weretested over the MS for replicates. The appropriateMS for replicates was computed by summing theSS for three terms: a) the dummy main effect'replicate' (C), b) the two two-way interactionswhich included this dummy effect (AC and BC),and c) the three-way interaction term (ABC). Thissum was then divided by the sum of the degreesof freedom for these terms. This MS for replicateswas then tested over the error MS.
Because rates of growth varied among risktreatments, so did the final sizes of snails. Henceto compare morphological traits among groups ofdifferent average size the effect of size had to bescaled out. Analysis of covariance (ANCOVA)could not be conducted with confidence on thesedata for two reasons. First, because the final size

160
ranges of some experimental groups did not over-lap, adjusted means would have to have beenextrapolated outside the range for which I haddata. Second, because the size range withinexperimental groups was not very large slopeswithin groups could not be determined with muchconfidence. To circumvent these difficulties,reference samples of 100 snails each were col-lected near the end of the experiment (October 16,17). Both phenotypes were collected from thesame sites as those that had yielded the experi-mental snails. These samples included roughlyequal numbers of all sizes of snails from 10 mmshell length up through fully mature adults andwere used to define the size-dependence of thetraits of interest for each population.
To compare traits of experimental snails at theend of the experiment, the size of the trait inquestion for a given snail was transformed to thatof a standard-sized snail as follows:
log Vi = (log Oi - logEi) + log V,
where Vi = value of a trait for snail i scaled to thatof a standard-sized snail, Oi = original observedvalue of the trait for snail i, E = the expectedvalue of that trait for a snail of the same size asi determined from the regression obtained fromthe appropriate reference sample (see Table 2),and V, = the average expected value of that traitfor the standard-sized snail, also determined fromthe reference sample regression. For example, theobserved final shell weight of 1580 mg for a snailof the protected phenotype of 270 mg wet bodyweight was transformed to that for a snail of350 mg wet body weight as follows: Oi =log(1580), Ei = 0.921 (log(270)) + 1.013 (fromregression 6b, Table 2), and V, = 0.921(log(350)) + 1.013. Hence Vi = 2007 mg. Thistransformation assumes that both the varianceand the effects of the risk treatments were pro-portional to size. Although means and standarderrors of these size-scaled values were graphed inuntransformed units, statistical analyses [i.e.t-tests comparing adjusted means (V + SE) vs.expected means (V, + SE), and the relevant Pvalues of Figs. 12 and 13] were conducted on thelog-transformed variates.
Results
Morphological variation within and betweenpopulations
Field-collected snails of both phenotypes differedsubstantially in most traits examined. For shellsof a given length, the aperture was significantlylonger and significantly wider for the exposed-shore phenotype (Figs. 3a, b; Regressions la, b,and 2a, b in Table 2). Mature snails of bothphenotypes had equally thick lips (Fig. 3c) butbecause of their lower spires, lip thickness at agiven length was greater for the exposed-shore
a 24E
X, 20
a 16
< 12
EE
ra..
<
14
12
10
8
6
4.0
3.0
2.0
1.0
(o Exposed) a)
(. Protected. . . . . . . . . I . . . . I
F b)
t~.
' .. . .* · S*. I-*
F c)
10 20 30 40Shell Length (mm)
Fig. 3. Variation in aperture length, aperture width and lipthickness as a function of shell length for two populations ofNucella lapillus from shores of different wave exposure. SeeTable 2 for regression equations (of log-transformed values)
and statistics.
. . . .. , . . . . . . . .

161
Table 2. Regression equations (both variables log-transformed; slope and intercept + SE) describing morphological differencesbetween the exposed- and protected-shore populations of Nucella lapillus used in the experiments. See Figs. 3-5 for scatterplotsof these data §.
X Y Source Regression r2 Comparison of slopes
Allometry a) vs b)or c) vs d)
Ts P T, P
1) Shell Aperture a) ExplI Y = 0.991( ±0.017)X -0.078(+ 0.001) 0.972 0.53 0.60 6.58 < 0.001length length b) Protl Y = 0.792( ± 0.025)X + 0.120( ± 0.002) 0.910 8.32 < 0.001
2) Shell Aperture a) ExplI Y = 1.070( ± 0.035)X - 0.416( ± 0.002) 0.905 2.00 0.048 3.14 0.002length width b) Protll Y = 0.921(± 0.032)X -0.337(+ 0.003) 0.895 2.47 0.015
3) Shell Body whorl a) Expll Y = 1.014( 0.022)X -0.309( 0.001) 0.957 0.64 0.53 0.03 0.97length diameter b) ProtlI Y = 1.013( ± 0.020)X -0.345( + 0.002) 0.962 0.65 0.52
4) Shell Lip a) ExplI Y = 2.677( ± 0.126)X - 3.191( 0.008) 0.821 13.31 < 0.001 7.94 < 0.001length thickness b) ProtII* Y = 1.343(+ 0.111)X -1.619(+ 0.010) 0.601 3.09 0.003
b') ProtII** Y = 0.635( ± 0.144)X -0.695(± 0.010) 0.254 2.53 0.014
5) Shell Body a) ExpII Y = 2.948( ± 0.075)X - 1.227( 0.005) 0.941 0.69 0.49 5.38 < 0.001length wet wt. b) ProtIIl Y = 3.468( ± 0.061)X -2.291(± 0.006) 0.971 7.67 < 0.001
c) ExpI Y = 2.891(± 0.174)X- 1.153(+ 0.010) 0.911 0.63 0.53 0.09 0.93d) ProtI Y = 2.911( 0.144)X- 1.587(±+ 0.008) 0.938 0.62 0.54
6) Body Shell wt. a) ExpII Y = 1.275( 0.042)X -0.216( 0.008) 0.903 6.54 < 0.001 7.61 < 0.001wet wt. b) ProtlI Y = 0.921( ± 0.020)X - 1.013( ± 0.007) 0.955 3.95 < 0.001
c) ExpI Y= 1.134(±0.083)X -0.002(±0.015) 0.879 1.61 0.118 1.39 0.17d) ProtI Y = 0.979(± 0.075)X -0.899( _0.013) 0.864 0.28 0.78
7) Shell Shell wt. a) ExpIl Y = 3.974(± 0.092)X -2.056( + 0.006) 0.950 10.58 < 0.001 6.34 < 0.001length b) ProtI Y = 3.245( ± 0.069)X - 1.169( 0.006) 0.958 3.55 < 0.001
c) ExpI Y = 3.512(± 0.175)X- 1.588( 0.011) 0.939 2.92 0.007 1.93 0.059d) ProtI Y = 3.050( ± 0.163)X -0.916( ± 0.010) 0.928 0.31 0.76
8) Body Unocc. a) ExpII Y = 0.710( 0.040)X -2.427( ± 0.008) 0.769 7.25 < 0.001 0.75 0.45wet wt. volume b) ProtII Y = 0.745( + 0.026)X -2.317( ± 0.009) 0.892 9.77 < 0.001
9) Shell Unocc. a) ExpIIt Y = 2.251( 0.100)X -3.499( 0.007) 0.839 7.49 < 0.001 4.21 < 0.001length volume b) ProtIl Y = 2.643( + 0.086)X -4.108( + 0.008) 0.907 4.15 <0.001
§ Linear dimensions are in mm, weights in mg and volume in ml. All regression equations are for log-transformed values, eventhough some scatterplots are on linear axes. The SEs tabulated for intercepts actually correspond to the SE of the expectedY at the average X for the sample. N = 100 for both populations except for ExpI and Protl where N = 28. T, - either the valuefrom a T-test for allometry, computed as the difference between observed slopes and those expected theoretically for isometry(1.0 or 3.0 depending on dimensionality), or the value from a T-test comparing the slopes of the two populations sampled [a)vs b) or c) vs. d)], r2 - coefficient of determination, P = exact probability, Source - source population, Exp - exposed-shorephenotype, Prot - protected-shore phenotype. ExpI and Prot I were collected July 10, 1986, ExpII and ProtII were collectedfrom the field near the end of the experiment (Oct. 16/17; see methods).
* Relationship not linear even on log-log plot (see Fig. 3c).** Regression for linear region of scatter: snails < 28 mm shell length (N = 59); used to estimate adjusted lip thickness in Fig. 13.t One outlier removed prior to computing regression (see Fig. 5).

snails. In addition to aperture size, the bodyweight of the animal occupying a shell of a givenlength was significantly greater for the exposed-shore phenotype (Fig. 4a, Regressions 5a-d).Related to this latter difference, the weight of shellfor a given weight of animal was substantiallyhigher for the protected-shore phenotype (Fig. 4b,Regressions 6a-d). Ironically, because of the dif-
3.5
3.0
2.5
2.0
1.1
4.0
3.5
3.0
2.5
yC;. 16 aa)
July 10
Oct. 17
1.2 1.3 1.4 1.5log (Shell Length, mm)
1.5 2.0 2.5 3.0log (Body Wet Weight, mg)
4.0
3.0
1.1 1.2 1.3 1.4 1.5 1.tlog (Shell Length, mm)
Fig. 4. Relationships between log transformed shell length,wet body weight and shell weight for two populations ofNucella lapillus from shores of different wave exposure. Thesamples were collected on two different dates in 1986. SeeTable 2 for regression equations and statistics. Triangles -protected-shore population, circles - exposed-shore popula-tion. Note that points for the protected-shore populationhave been shifted up 0.5 log units in Fig. 4c to avoid over-plotting those of the exposed-shore population and should
thus be compared against the axis to the right of figure.
ference in shape, the shell weights of the twophenotypes overlapped broadly for a given shelllength (Fig. 4c, Regressions 7a-d). The twophenotypes did, however, differ in another inter-esting way: the volume of unoccupied shell, ameasure of retractability, was proportionallylarger for the protected- than the exposed-shorephenotype (Fig. 5; Regressions 8a, b). Thisassumes that the visceral mass extends equally farup the apex of both phenotypes, an assumptionwhich seems justified based upon an examinationof animals removed from fractured shells.Curiously, the diameter of the body whorl did notdiffer between populations for shells of the samelength (Regressions 3a, b).
Several traits exhibited significant allometrywithin populations, and the coefficients of allome-try themselves often differed between popu-lations. Aperture length, for example, becameproportionally smaller with increasing shell lengthfor the protected- but not the exposed-shorepopulation (Regressions 1 a, b, Table 2). Aperturewidth, on the other hand, became proportionallylarger with increasing length in the exposed popu-lation but proportionally smaller in the protectedone (Regressions 2a, b). In the protected but notthe exposed population, body weight increaseddisproportionally with increasing shell length(Regressions 5a, b), whereas shell weight in-creased disproportionally with length in bothpopulations (Regressions 7a, b). In contrast, shell
3.5
= -0.2
6 s 0g -0.6
e0Su
Protectedo Exposed .
.. .:o%>· o o .o
* 9......o .... ... ....
1.8 2.2 2.6 3.0log(Body Wet Weight, mg)
3.4
Fig. 5. The relation between unoccupied volume of the shelland wet body weight for two populations of Nucella lapillusfrom shores of different wave exposure. See Table 2 forregression equations and statistics. - this point was elimi-nated as an outlier prior to computing Regression 8a
(Table 2).
162
E
0
2a1o
9q
OD
ao
P
UZt
. A
n

163
weight increased disproportionally with respect tobody weight only for the exposed population,while it decreased with respect to body weight inthe protected population (Regressions 6a, b).These last two patterns were qualitatively thesame for the smaller preliminary samples col-lected from the same sites three months earlier(Regressions 6c, d and 7c, d), but were lessdramatic probably because of smaller samplesizes and narrower size ranges. Finally, the vol-ume of unoccupied shell decreased in proportionto body weight in both populations as sizeincreased (Regressions 8a, b, 9a, b).
The thickness of the apertural lip exhibited themost complicated variation with size (Fig. 3c). Inboth populations, lip thickness increased dis-proportionally with increasing shell length (Re-gressions 4a, b, Table 2), but even log-trans-formed values varied nonlinearly (most notablefor protected-shore snails; data not shown). Forboth populations, as snails approached maturity,lip thickness increased at a much more rapid rate(Fig. 3c).
Temporal change within natural populations
Rather unexpectedly, the field collections ofexposed-shore N. lapillus on two different dates(July 10 and Oct. 16) differed in relative shellweight. Snails collected in October had signifi-cantly heavier shells than those collected in Julyfor a given wet body weight (Fig. 4b) and also fora given shell length (Fig. 4c). Body weight for agiven shell length, however, did not differ betweendates (Fig. 4a) hence the variable that changedwas shell weight (compare Regressions 5a vs. 5c,6a vs. 6c and 7a vs. 7c, Table 2).
Of interest, no significant differences wereobserved for these traits between dates in snailsfrom the protected shore (Figs. 4a-c; compareRegressions 5b vs. 5d, 6b vs. 6d and 7b vs. 7d).
Variation among initial groups
Because of the many morphological differencesoutlined above, some attribute had to be used by
which animals of comparable size from the twopopulations studied could be selected for theexperimental groups. I chose wet body weight forthis purpose because it seemed the least biasedmeasure of overall animal size (see size scaling indiscussion for an expanded consideration of thisproblem). Snails from both populations weresorted by shell length and then individuals werechosen to be close to 195 mg wet weight based onRegressions 5a, b (Table 2). No significant dif-ferences in wet body weight were present amongrisk treatments or between source populations atthe beginning of the experiment for either starvedor fed snails (Tables 3, 4). Unfortunately, bychance, a significant difference did materializeamong replicates in the starved treatments(P = 0.02), but this did not occur in the fed treat-ments. Among the remaining traits (shell length,shell weight and lip thickness) no significant dif-ferences existed among risk treatments or repli-cates for either fed or starved snails, even though,as expected, differences between source popu-lations were highly significant (Tables 3, 4).
Short-term rates of shell deposition in starved snails
In the 24 h immediately prior to the experiment,the daily rate of shell deposition ranged from 5 to8 mg snail ' d - among groups in the starvedseries (Fig. 6). Although significant differencesexisted between the two source populations(P = 0.016), none appeared among risk treat-ments (P = 0.16, Table 5). In the first 24 h of theexperiment, however, some interesting differencesarose among risk treatments (Fig. 6). Comparedto baseline values, the daily rate of depositiondeclined dramatically in the snail-crab treat-ments: - 26 and -46% for the exposed- andprotected-shore phenotypes respectively. Thisdecline was less dramatic in the fish-crab treat-ments (- 13 and - 27% respectively). In theno-crab treatments the rate of shell depositioneither continued to increase ( + 19%) or declinedslightly (- 14 %) for the exposed- and protected-shore phenotypes respectively. These differencesamong risk treatments were highly significant(P = 0.008, Table 5).

oo V -C Cl '0 Cl'0
e > > m _ , 't 'I C-4 io
- -- - _ e _ _ _
N e 0 MC ID LCl C> '0 4 e
e -O l' ' E ON o N
0 0 000 -
o o 0 o o o o- o c-
N N N) N N en _ ' r Cl
CN O NE Cl -' _~ Cl m NS 0)
M M Af M X Xt t
aen en *en N 0 nC N 0
Cl Cl m) en o n t ON N Cl '0 '0- en N - O O en VN - ON _ _
U) en e n t e Ct en e
V X' '0 Cl ~- a, o T N Or Cl I
00 N - -00e Cl 00 ON N N No>
en e en Cl en en > n' n4C
ON Cl ID Cl ' ON o N 0 N 00
"C Cl' NO N4 Cl 4 O
'0- ~ ~ Cl 000 en en 0
000 Cl mC dC -N '0 N: -00 Clo
Cl > = C ,,C CD
0 _0 N N OC Xl 0 Cd 'O ) 0 Cl
X0 eon 00 en en _0 Cl C) -Cl
ON 0 ON 0000000000N N
- Cl - C - Cl - Cl - C o Cl
9. _ ) ' o _ -. C s , )C) - C) V)-V} _
_ _ _ _ _ _ 7 q ;
O *) 0 0 .: o'0 C)~~~~~~C
0 C - 2
C, 1= IDh C:> X, O X X o Cd 4 0 O ON 0 ON 0000 O 0
- - - - - -
00 M O M C N O N 000
Cl 1 'C en I= 00 0 0N ND
' ,NN It 'OCl l: 4Ci
M M r- C> OsZis08 Fo -
000 '0C1) 4 C) NS '0 N N 4 ON00 N N '0 N Ct) -d N -0-
'OCd) NI 0 X Cd) ON 000 CdC -- Cl -- - Cl X -
r- 00 '00 C 'IC r- N - - 4i
6 'd 0 Cd ) ON 4E 00 N '0 O
N 00 ee Cl 4 N o0 MC N O
-- enenO'° '0ONO)00
n n n en e en en 4 C I o )
C> CD 9 = 1= _, C ,t> 0 - N - - - N - --4 o N N 4 ) 0 C) C) _ _
Cl N 00 Ns 0 N '0' 0 Ns 00
'0Cd 4E C) -o en en Cl e - -x
X N Cl en ON Cl N '0 ' enL0000 ON 0 N 00 ON ON 0,
_' S - N Cl 00 en N_ _ N
Cl C Cl: Cd 0e en Cl en-
'0O ON ON 0 '0 enNO c-'-- l- l'C0
66666666666
00
a 0.
wZ
00t
164
0E
C.0
s
.a-el
00
s.2p00
.0
cn
3
s&b
E00
z00
EEsuoCn_0
s
w
20w
&n
M
00
CC
a C
wEn
r. 0a E
w0,c a
s SE
M0 0
;C Cw
0
r4
wC)
X
"a r
w
_
0
Id~
L 0r I
: 0 o
z
'I
C
2Co
Q
c
0
0 0.000, 0
M I5
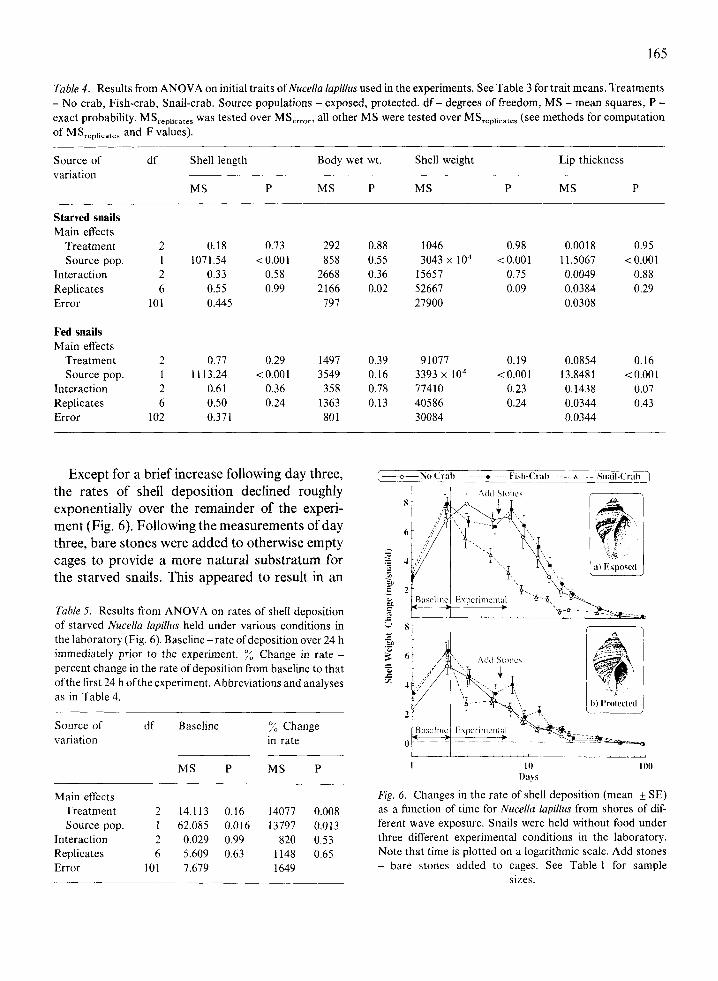
Table 4. Results from ANOVA on initial traits of Nucella lapillus used in the experiments. See Table 3 for trait means. Treatments - No crab, Fish-crab, Snail-crab. Source populations - exposed, protected. df - degrees of freedom, MS - mean squares, P - exact probability. MSreplicates was tested over MS,,,,,, all other MS were tested over MS,,,,,,,,,, (see methods for computation of MSreplicates and F values).
Source of df Shell length Body wet wt. Shell weight Lip thickness variation
MS P MS P MS P MS P
Starved snails Main effects
Treatment Source pop.
Interaction Replicates Error
Fed snails Main effects
Treatment Source pop.
Interaction Replicates Error
Except for a brief increase following day three, the rates of shell deposition declined roughly exponentially over the remainder of the experi- ment (Fig. 6). Following the measurements of day three, bare stones were added to otherwise empty cages to provide a more natural substratum for the starved snails. This appeared to result in an
Table 5. Results from ANOVA on rates of shell deposition of starved Nucella lapillus held under various conditions in the laboratory (Fig. 6). Baseline -rate of deposition over 24 h immediately prior to the experiment. Change in rate - percent change in the rate of deposition from baseline to that ofthe first 24 h ofthe experiment. Abbreviations and analyses as in Table 4.
Source of df Baseline % Change variation in rate
MS P MS P
Main effects Treatment 2 14.113 0.16 14077 0.008 Source pop. 1 62.085 0.016 13797 0.013
Interaction 2 0.029 0.99 820 0.53 Replicates 6 5.609 0.63 1148 0.65 Error 101 7.679 1649
(----no Crab ------~o~----- Fish-Crab ---*--- Snail-Cral) )
I J
I 10 LOO I h ) \
Fig. 6. Changes in the rate of shell deposition (mean & SE) as a function of time for Nucella lapillus from shores of dif- ferent wave exposure. Snails were held without food under three different experimental conditions in the laboratory. Note that time is plotted on a logarithmic scale. Add stones - bare stones added to cages. See Table 1 for sample
sizes.

166
Table 6. Results from ANOVA on final values and total change for traits of starved Nucella lapillus held under different conditionsin the laboratory (Fig. 7). Abbreviations and analyses as in Table 4.
Source of df Body weight Shell weight Final Lip thicknessvariation change change tooth ht. change
MS P MS P MS P MS P
Main effectsTreatment 2 348 0.18 12785 0.016 0.04812 0.044 0.2660 0.022Source pop. 1 4018 0.002 82530 <0.001 0.03733 0.085 0.9351 0.002
Interaction 2 704 0.061 11976 0.019 0.02781 0.11 0.1295 0.086Replicates 6 153 0.32 1451 0.50 0.00868 0.062 0.0343 0.26Error 101 128 1627 0.00417 0.0261
increase in the rate of shell deposition for bothphenotypes in the fish-crab treatments as well asfor the exposed phenotype in the no-crab treat-ment (Fig. 6).
Differences in final shell morphology among starvedsnails
Snails of the exposed-shore phenotype lost sig-nificantly more body weight over the 94 d of the
boU
>0-
To
o 0.1-
.l
v:
U
-~P
c)E
No Crab Fish-Crab Snail-Crab N
Risk Treatment
experiment than those of the protected-shorephenotype (Fig. 7a, Table 6). Risk treatment hadno overall effect on body weight loss, although theinteraction between source population and risktreatment was nearly significant (P = 0.061,Table 6). Shell weight gain, however, not onlyvaried significantly among risk treatment groups(P = 0.016) and between source populations(P < 0.001), but the interaction between thesemain effects was also significant (P = 0.019;Fig. 7b, Table 6). For both populations, the total
ExposedE3 Exposed
lo Crab Fish-Crab Snail-Crab
Fig. 7. Total change (A) in wet body weight, shell weight, apertural tooth height, and lip thickness of Nucella lapillus from shoresof different wave exposure (mean + SE). Snails were held without food under three different experimental conditions in thelaboratory for 94 d. All snails lacked apertural teeth at the beginning of the experiment, thus final tooth height is synonymous
with the change in tooth height. See Table 3 for sample sizes and initial and final values.

167
shell added was highest in the fish-crab treat-ments. Exposed-shore snails, however, addedconsistently more shell than those from the pro-tected shore.
The rank order of final apertural tooth heightand change in lip thickness of starved snailsparalleled that for total shell weight change amongrisk treatments (Fig. 7c, d). For both traits, risktreatment had a statistically significant effect, andsource population had a significant or nearly sig-nificant effect (Table 6). As observed for shellweight gain, the increase in tooth height and lipthickness was the greatest in the fish-crab treat-ments. Note, however, that the teeth which devel-oped in these immature snails were not very largefor either population in any treatment.
Differences in feeding and growth
Rates of barnacle consumption differed signifi-cantly between source populations and alsovaried substantially among risk treatments(Fig. 8, Table 7). In all risk treatments fewerbarnacles were consumed by the protected- thanthe exposed-shore snails. Among risk treatments,the rate of barnacle consumption was highest inthe no-crab treatment: 2.09 and 1.48 barnaclessnail- ' d ' for the exposed- and protected-shorephenotypes respectively. The feeding rate declinedby more than 25 % in the fish-crab treatment (to1.48 and 1.11 barnacles snail - d - ' respectively)
Nol
c
si
-
L
c
Et7E:
Z
801)d
600
20 2527 N- 169
250 e) D Replicate I ')
zF200 . D[ Replicate 2
150 _S. i l-
100
50 N- 56 1 N= 440
1 2 3 4 5 I 2 3 4 5
Barnacle Opercular Diameter (mm)
Fig. 8. Size-frequency distributions of barnacles eaten byNucella lapillus from shores of different wave exposure. Snailswere held under three different experimental conditions inthe laboratory for 94 d. See Table 3 for the number of snailsin each cage. Note the different scales of the vertical axesamong risk treatments. N - total barnacles eaten of all
sizes.
and by more than 75 % in the snail-crab treatment(to 0.50 and 0.24 barnacles snail-' d- ').
Not surprisingly, differences in the rates of
Table 7. Results from ANOVA on numbers of barnacles consumed by and % change in wet body weight of fed Nucella lapillusheld under various conditions in the laboratory (see Figs. 8, 9; see Table 3 for final body weights). Abbreviations and analysesas in Table 4. - not applicable.
Source of Total # barnacles eaten % Change in body weightvariation
df MS P df MS P
Main effectsTreatmentSource pop.
InteractionReplicatesError
2126
15005305724705729722800
< 0.0010.0020.16
2126
101
27970223567542118
17372693
<0.001< 0.001
0.0010.65
168
;.10
2o
r-
es
No Crab Fish-Crab Snail-Crab
Risk Treatment
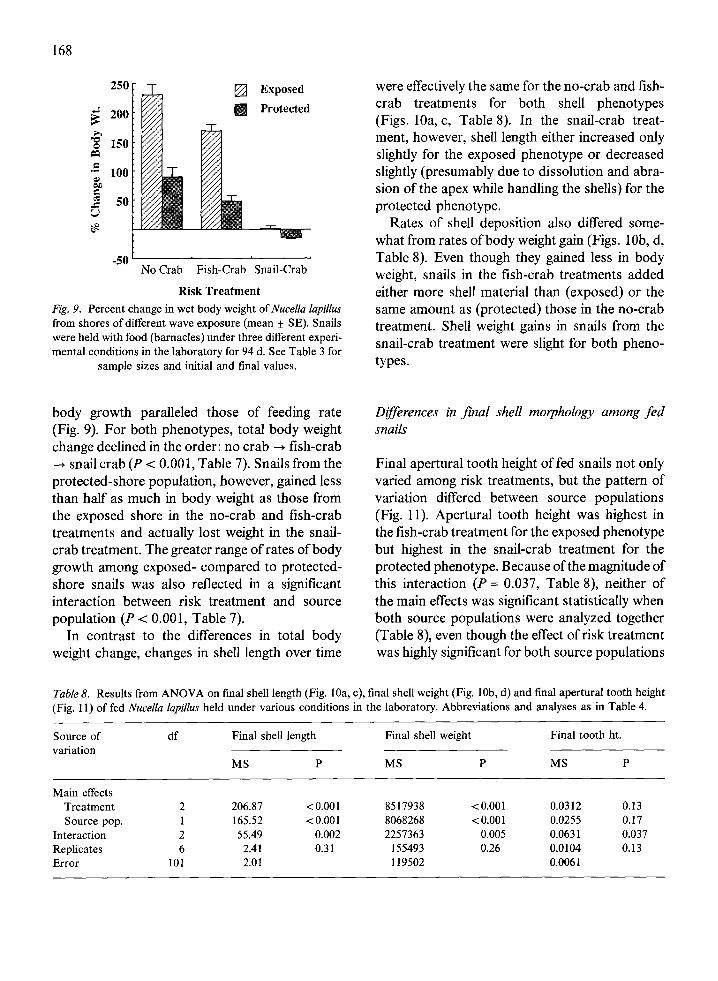
Fig. 9. Percent change in wet body weight of Nucella lapillusfrom shores of different wave exposure (mean + SE). Snailswere held with food (barnacles) under three different experi-mental conditions in the laboratory for 94 d. See Table 3 for
sample sizes and initial and final values.
body growth paralleled those of feeding rate(Fig. 9). For both phenotypes, total body weightchange declined in the order: no crab -* fish-crab-* snail crab (P < 0.001, Table 7). Snails from theprotected-shore population, however, gained lessthan half as much in body weight as those fromthe exposed shore in the no-crab and fish-crabtreatments and actually lost weight in the snail-crab treatment. The greater range of rates of bodygrowth among exposed- compared to protected-shore snails was also reflected in a significantinteraction between risk treatment and sourcepopulation (P < 0.001, Table 7).
In contrast to the differences in total bodyweight change, changes in shell length over time
were effectively the same for the no-crab and fish-crab treatments for both shell phenotypes(Figs. 10a, c, Table 8). In the snail-crab treat-ment, however, shell length either increased onlyslightly for the exposed phenotype or decreasedslightly (presumably due to dissolution and abra-sion of the apex while handling the shells) for theprotected phenotype.
Rates of shell deposition also differed some-what from rates of body weight gain (Figs. lob, d,Table 8). Even though they gained less in bodyweight, snails in the fish-crab treatments addedeither more shell material than (exposed) or thesame amount as (protected) those in the no-crabtreatment. Shell weight gains in snails from thesnail-crab treatment were slight for both pheno-types.
Differences in final shell morphology among fedsnails
Final apertural tooth height of fed snails not onlyvaried among risk treatments, but the pattern ofvariation differed between source populations(Fig. 11). Apertural tooth height was highest inthe fish-crab treatment for the exposed phenotypebut highest in the snail-crab treatment for theprotected phenotype. Because of the magnitude ofthis interaction (P = 0.037, Table 8), neither ofthe main effects was significant statistically whenboth source populations were analyzed together(Table 8), even though the effect of risk treatmentwas highly significant for both source populations
Table 8. Results from ANOVA on final shell length (Fig. 10a, c), final shell weight (Fig. 10b, d) and final apertural tooth height(Fig. 11) of fed Nucella lapillus held under various conditions in the laboratory. Abbreviations and analyses as in Table 4.
Source of df Final shell length Final shell weight Final tooth ht.variation
MS P MS P MS P
Main effectsTreatment 2 206.87 <0.001 8517938 <0.001 0.0312 0.13Source pop. 1 165.52 <0.001 8068268 <0.001 0.0255 0.17
Interaction 2 55.49 0.002 2257363 0.005 0.0631 0.037Replicates 6 2.41 0.31 155493 0.26 0.0104 0.13Error 101 2.01 119502 0.0061

169
( - No Crab -------. ---- Fish-Crab ----.---- Snail-Crab
24
E 22
c 20
= 18
1616
CL
E
.C
W
Z
0 20 40 60 80 100Days
0 20 40Day!
60 80 100
Fig. 10. Changes in shell length and shell weight as a function of time by Nucella lapillus from shores of different wave exposure.Snails were held with food (barnacles) under three different experimental conditions in the laboratory for 94 d. See Table 3 forsample sizes and initial and final values. Note that some points have been shifted slightly right or left to avoid overplotting. Theactual dates on which the measurements were taken lie underneath the points for the no-crab treatment (solid circles). Each
point represents a mean + SE. Where error bars are not present they are less than the diameter of the symbol.
when each was analyzed separately (P = 0.003and P < 0.001 for exposed and protected respec-tively from 1-way ANOVA).
Both relative shell weight and retractability
'iEE
0
0
0.20
0.15
0.10
0.05
ProtectedExposed
No Crab Fish-Crab Snail-CrabRisk Treatment
Fig. 11. Final apertural tooth height (mean + SE) of Nucellalapillus from shores of different wave exposure. Snails wereheld with food (barnacles) under three different experimentalconditions in the laboratory for 94 d. See Table 3 for sample
sizes.
varied consistently (with one exception) amongrisk treatments for both shell phenotypes(Fig. 12). Relative shell weight and retractabilitywere lowest in the no-crab, intermediate in thefish-crab and highest in the snail-crab treatments.The only exception to this pattern occurred inexposed-shore snails: retractability in the snail-crab treatment did not differ from controls (nocrab).
The precise pattern of variation, and the degreeof change relative to references shells collectedfrom the field at the beginning of the experiment,however, depended upon the metric used to stand-ardize 'size'. For shells of a standard length forboth phenotypes, shell weight increased signifi-cantly (or nearly so) in all groups relative to thereference samples (Fig. 12a). This increase inrelative shell weight was highest in the snail-crabtreatment, slightly less in the fish-crab treatmentand lowest in the no-crab treatment. For snails of
24
£ 23
=
=,22v:
-.... "" ...="
)
A.

170
s T T .< o w~LM
Cf
iz
.5
@ 20mm Shell Length c)
- 0.3 0.12 088
E 0.2 ZI
o 0.1
No Crab Fish-Crab Snail-CrabRisk Treatment
Fig. 12. Final shell weights (a,b), and unoccupied volume of shells (c,d) for Nucella lapillus from shores of different wave exposure(mean + SE). Snails were held with food (barnacles) under three different experimental conditions in the laboratory for 94 d.For each trait, the final values have been expressed for a standard-sized snail. The two figures for each trait show the resultsof using different size metrics (shell length or body weight) to standardize size. See Table 3 for sample sizes, and initial and finalvalues, and see methods for the procedure used to transform these values to those for a standard-sized snail. Arrows indicatethe values of these traits for reference shells collected from the field. Exposed I - exposed-shore snails collected in mid July,Exposed II - exposed-shore snails collected from the field in mid October, Protected - protected-shore snails collected in midOctober (see methods). Asterisks above bars indicate the significance level of the difference between the experimental groupand reference shells (Exposed I, or Protected) from T-tests (* - <0.05, ** - <0.01, *** - <0.001), otherwise exact P values are
given. Although means and SE are displayed on a linear scale, P values were computed from log-transformed values.
a standard wet body weight, however, althoughthe rank order of response among risk treatmentswas the same as that observed for snails of astandard shell length, the departures of relativeshell weight from that of the references shells weredifferent (Fig. 12b). Relative shell weight wasagain significantly higher than that of the referenceshells in the snail-crab treatment. In the fish-crabtreatment, relative shell weight also increased, butonly significantly so for the exposed-shore pheno-type. In contrast, relative shell weight in theno-crab treatment either did not change com-pared to reference shells (exposed-shore pheno-type) or actually decreased (protected-shorephenotype).
Because the shell weight of exposed-shore
snails collected from the field increased betweenthe time the experiment was started (mid July)and the time it ended (end of October; comparesolid vs. open circles Figs. 4b, c), the inter-pretation of change depended upon which field-collected sample was used as the frame ofreference. When compared to shells collected atthe end of the experiment (Exposed II), relativeshell weight did not change very much in thefish-crab and snail-crab treatments (Figs. 12a, b)whereas it was significantly lower in the no-crabtreatment. Hence, although the increase relativeto initial shell weight was rather dramatic in thefish-crab and no-crab treatments, this change waswithin the natural range of temporal variation inthe exposed-shore population.
-___ l_ A -11 T A
)

171
The effect of risk treatment on retractability(unoccupied volume of the shell) was ratherinsensitive to the method used to standard size(Fig. 12c, d). The main consequence of using dif-ferent metrics to standardize size was a change inthe ranking of the field reference values for the twopopulations (retractability relative to length washigher for exposed-shore snails whereas retracta-bility relative to body weight was lower). Forsnails of the exposed-shore phenotype, retracta-bility increased significantly in the fish-crabtreatment, remained the same in the snail-crabtreatment and decreased slightly in the no-crabtreatment. In contrast, retractability of the pro-tected-shore phenotype increased substantially inthe snail-crab treatment, whereas it did notchange in the fish-crab treatment and actuallydecreased significantly in the no-crab treatment.
Adjusted final lip thickness also varied rathersubstantially among groups (Fig. 13). Comparedto the no-crab treatment, the lip thickness ofboth phenotypes increased significantly in boththe fish-crab and snail-crab treatments. For theexposed-shore phenotype, this increase wasgreater in the snail-crab than the first-crab treat-ment whereas for the protected-shore phenotypethe increase was about the same in these twotreatments.
-
.5z_
.~I,@
I-- - c
_=1 E
,
No Crab Fish-Crab Snail-CrabRisk Treatment
Fig. 13. Final thickness (mean + SE) of the apertural lip ofshells of Nucella lapillus from shores of different wave expo-sure. Snails were held with food (barnacles) under threedifferent experimental conditions in the laboratory for 94 d.The final values have been expressed for a standard-sizedsnail. See Table 3 for sample sizes and initial and final values.See methods for the procedure used to transform thesevalues to those for a standard-sized snail, and Fig. 12 for an
explanation of symbols and abbreviations.
Trajectories of shell form over time
Because shell weights and shell lengths weremeasured repeatedly, the change in these traitsrelative to each other could be examined overtime. The exposed-shore groups exhibited themost interesting morphological trajectories(Fig. 14a). Individuals in the snail-crab treatmentincreased only slightly in shell length, but theirshell weight relative to length increased steadilyover the duration of the experiment and it wasconsistently higher than at the beginning. Of someinterest, among snails in both the fish-crab andno-crab treatments, shell weight relative to length
°t 3.2
.> 3.0
- 2.8t 2.6
t" 2.6
2.41
E
._
e-
tbc
1.31 1.32 1.33 1.34 1.35 1.36 1.37log (Shell Length, mm)
Fig. 14. Trajectories of shell weight vs. shell length forNucella lapillus from shores of different wave exposure. Snailswere held with food under three different experimental condi-tions in the laboratory. See Table 3 for sample sizes andinitial and final values. Each point corresponds to the averageshell length (+ SE) and average shell weight ( SE) on aparticular date, starting with those at the initiation of theexperiment. Solid lines describe the static relationshipbetween these variables for samples of reference shells col-lected from the field. Field I - snails collected in mid July,Field & Field II - snails collected from the field in mid
October.
\

172
actually decreased in the early portion of theexperiment and then increased towards the end sothat the final shell weights relative to shell lengthwere either not significantly different from (nocrab) or were significantly higher than (fish-crab)those initially. Curiously, compared to theheavier-shelled snails collected from the field atthe end of the experiment (e.g. see Fig. 4c), theshell weights from all risk treatments were lower.
Snails of the protected-shore phenotype grewconsiderably less than those of the exposed-shoreand consequently the within-group variation waslarge relative to the total change (Fig. 14b). Theshell weight of snails from all three risk treatmentsincreased relative to shell length over the durationof the experiment. This increase was greatest inthe snail-crab and fish-crab treatments and leastin the no-crab treatment. Unlike the exposed-shore population, the shell form of field-collectedsnails from the protected shore did not changebetween the beginning and end of the experiment,hence these experimental snails were only com-pared to a single reference sample.
Discussion
Morphological differences between field populations
The observation that the shells of Nucella lapillusvary with wave exposure is not new; this phe-nomenon is widespread and well documented(see Crothers, 1985 for a review). The differencesin shell shape and thickness between the twopopulations reported above are consistent withthose described by others (e.g. see Seed, 1978).N. lapillus from more wave-exposed shores havewider apertures, lower spires and relativelythinner shells than those from protected shores.This variation appears to be maintained by theopposing selection pressures of wave action onexposed shores and crab predation on protectedshores (Kitching et al., 1966).
Three aspects of the shell variation observed inthese natural populations seem worthy of note.First, because the wet body weight for a givenshell length was much lower for snails from the
protected shore (Fig. 4a), shell length will not bea reliable predictor of body size when comparingN. lapillus populations of different shell mor-phology (see size scaling below). Second, theunoccupied volume of the shell was larger bymore than 50% for snails of the same body weightfrom the protected shore. This difference seemslikely to be adaptive since animals from the pro-tected shore would thus be able to retract sub-stantially further into their shell than those fromthe exposed shore. For both populations, how-ever, the capacity to retract into the shell declinedallometrically with increasing size (Regressions8a, b, Table 2). This allometric shift may reflect anontogenetic increase in the amount of visceralmass relative to foot as animals approach andthen reach maturity.
Third, a number of traits exhibited interestingallometric variation within populations. Forexample, relative aperture width increased withincreasing size in the exposed-shore population,and both relative aperture width and lengthdeclined with increasing size in the protected-shore population (Regressions 1 and 2, Table 2).Hence, within each population, allometricchanges amplified the differences observedbetween populations which are known to be adap-tive (Etter, 1988; Kitching et al., 1966). Thesedata suggest that patterns of allometry themselvesmay be adaptive, although they do not revealwhether this allometric variation is genetically orenvironmentally determined. In addition, the sig-nificant positive allometry of shell weight relativeto length exhibited by both populations could beadaptive, or it could reflect a tradeoff betweengrowth rate and shell thickness. Heavier shellsmay be more advantageous to mature animals ifthey are long-lived. On the other hand, becausethe rate of shell production may limit the maxi-mum rate of body growth (Palmer, 1981),juveniles may have to sacrifice some of the addeddefense a heavier shell might provide to enablethem to grow more rapidly. The initial decline inshell weight relative to length during the period ofrapid growth, followed by the increase in shellweight relative to length in the same individuals asgrowth slowed towards the end of the experiment

173
(exposed-shore phenotype in both the no-craband fish-crab treatments; compare Figs. 10a and14a) illustrates nicely the dependence of relativeshell weight upon growth rate.
Short-term rates of shell deposition
The high initial rates at which starved, inter-mediate-sized N. lapillus deposited shell material(5-8 mg d - '; Fig. 6) permitted a detailed view ofshort-term patterns of temporal change. The two-to three-fold increase in the rate of depositionbetween the first and second day of the baselineperiod prior to the experiment, most likelyreflected a recovery from the trauma associatedwith obtaining estimates of wet body weight non-destructively (see methods). Although this patterndoes suggest that the animals were disturbed bythis procedure, it also reveals that this disturbancedid not last much more than 24 h (e.g. compareday three to day two for the no-crab treatmentsFigs. 6a, b).
In addition, the temporary increase in the rateof deposition observed in three of the six groupsfollowing the introduction of bare stones intootherwise empty experimental cages suggests thatrather subtle changes in the environment ofN. lapillus can influence their rate of shell depo-sition. One interpretation of this response is thatthe stones somehow improved the 'quality of thehabitat' as perceived by the snails. The ability tomeasure such changes on a daily basis wouldappear to provide a sensitive technique for assess-ing the impact of a variety of environmentalstimuli on rates of shell deposition.
Effect ofperceived risk on shellform of starved snails
The exposure of N. lapillus to various risk stimuliin the absence of food might seem like a curiousexperiment to conduct because these conditionswould be rather unlikely to occur in the field.These starved treatments, however, were neces-sary to distinguish between those morphologicaldifferences that were a byproduct of differences in
rates of growth and those that reflected a directmorphological response to risk stimuli. If I hadused only fed snails in these experiments, I wouldnot have been able to separate these effects andconsequently would not have been able to deter-mine if morphological differences in antipredatorytraits resulted from different levels of feedingactivity and growth rate, or from an amplificationof these antipredatory traits via a direct cueing onthe scents released by predatory crabs or dam-aged conspecific snails. The net result and hencethe adaptive significance is the same, of course,whether a snail produces a thicker shell directly inresponse to the scent of crabs or indirectly bygrowing less rapidly in response to the samestimulus. By using starving snails, however, I wasable to distinguish between these pathways oftransduction.
The morphological responses of starvedN. lapillus to the two risk treatments were not astraightforward function of perceived risk. Com-pared to controls, the scent of crabs alone resultedin significantly larger apertural teeth (Fig. 7c), asignificantly thicker apertural lip (Fig. 7d) andheavier shells overall, although this last differencewas not significant statistically (Fig. 7b, Table 6).Hence this form of perceived risk, which wouldsignal predators in the vicinity but not feeding onsnails, clearly resulted in adaptive morphologicalresponses. These results parallel rather closelythose reported by Appleton & Palmer (1988) forthe northeastern Pacific Nucella lamellosa[= Thais lamellosa]. They also provide con-vincing evidence that, although starvation alonemay lead to the production of apertural teeth(Crothers, 1971), the scent of crabs clearly ampli-fies this response. Hence the induction ofapertural teeth is at least in part a direct responseto the scent of crabs.
The responses of N. lapillus to the scent ofconspecifics being eaten by crabs, which wouldsignal predators in the vicinity that were also con-suming conspecific snails, were notably different,however. Although these stimuli should have indi-cated a higher immediate risk of predation, therate of shell deposition of both shell phenotypesdropped dramatically in the 24 h following ini-

174
tiation of the experiment, compared both to con-trols and to the fish-crab treatment (Figs. 6a, b;Table 5). Similarly, both the total change in shellweight and lip thickness were either not signifi-cantly different from (protected-shore), or weresignificantly less than (exposed-shore), those ofthe no-crab treatment (Figs. 7b, d; Table 6). Onlythe protected-shore phenotype exhibited a signifi-cant increase in the height of apertural teeth com-pared to the no-crab treatment. Hence, the scentof damaged conspecifics being eaten by crabs didnot appear to elicit a morphological responsewhich would reduce the risk of predation. On thecontrary, these stimuli together appeared to havea more profound effect on the level of physiologi-cal or behavioral activity (see supernormal stimu-lus below). The lack of response to bare stonesintroduced into the otherwise empty cages on daythree of the experiment suggests that, in contrastto nearly all of the remaining treatments, snails inthis treatment did not perceive the stones toimprove the 'quality' of their living conditions.
The reduced morphological response of starvedN. lapillus in the snail-crab treatment, comparedto controls (no crab) and compared to the fish-crab treatment, is difficult to explain with thepresent data, although it may reflect unrealisti-cally high stimulus concentrations (see super-normal stimulus below). If, as suggested byAppleton & Palmer (1988), the scent of con-specifics being eaten somehow induced a height-ened metabolic rate which burned up the energyreserves of these starving snails more quickly andhence resulted in less shell being produced, thensnails in the snail-crab treatment should have lostmore body weight over the course of the experi-ment than those in the fish-crab treatment. Nodifferences in body weight loss were apparent,however, between these treatments for either ofthe two shell phenotypes examined (Fig. 7a).Because of the duration of the experiment (94 d),the lack of differences in weight loss may be some-what of an artifact. For example, snails in thedifferent risk treatments may have lost weight atdifferent rates over the early part of the experi-ment, but ultimately declined asymptotically toroughly the same final body weight at the end of
the experiment. I cannot address this possibilitywith the present data.
Effect of perceived risk on rates of feeding andgrowth
Perceived risk had a dramatic effect on rates offeeding and growth in N. lapillus from both sourcepopulations (Figs. 8-10). The decline in feedingrate with increased risk parallels observationsreported for mosquito larvae in the presence ofpredatory notonectid water bugs (Sih, 1980,1984), and for sticklebacks in the presence of asimulated avian predator (Milinski & Heller,1978). Rather remarkably, the suppression offeeding by N. lapillus in the snail-crab treatmentwas so great (Fig. 8) that they either did not gainany body weight at all (exposed-shore) or actuallylost weight (protected-shore) over the 94 days ofthe experiment (Fig. 9) even though barnacleswere available ad libitum.
Three observations suggest that the dramati-cally reduced rates of feeding by N. lapillus in thesnail-crab treatments were a direct result of apredator-induced avoidance behavior as opposedto a generalized reduction in activity. First, whenthese cages were inspected or cleaned, snails ofboth phenotypes were almost always found aboutthe lower margins or undersides of the barnacle-covered stones. Second, a substantial majority ofthe barnacles eaten in these cages was restrictedto these same regions of the stones. Hence,although the snails may have been less activeoverall, they also appeared to restrict their move-ments to the regions of stones where they wouldhave been least likely to encounter a foragingcrab. Third, the size distribution of barnacleseaten was shifted towards smaller barnacles forsnails of both phenotypes compared to the no-crab and fish-crab treatments (compare Figs. 8e, fto 8a-d) This patterns suggests that N. lapillus inthe snail-crab treatment preferentially consumedprey with shorter handling times, another behav-ior which would reduce their exposure to foragingcrabs. Because no data were recorded on the sizesof barnacles on different surfaces of the stones,

175
however, the apparent preferential consumptionof smaller barnacles may have been a product ofthe reduced foraging ambit of the snails.Barnacles on the lower margins and undersides ofstones may have been smaller than those on theupper surfaces.
Rather curiously, although feeding activity waslower in the fish-crab treatments compared tocontrols (Fig. 8c, d), the distribution of barnaclemortality about the surface of stones did not sug-gest an obvious reduction in foraging ambit byN. lapillus of either shell phenotype. In addition,no differences were observed in the size distribu-tions of barnacles eaten compared to the no-crabtreatment. Needless to say, a closer examinationof the behavior of these snails when exposed tosuch risk-related stimuli would be very illumi-nating.
Effect of perceived risk on shell morphology of fedsnails: comparisons among laboratory treatments
The effects of perceived risk on the shell mor-phology of Nucella lapillus in these experimentsare most readily interpreted by comparing thefinal shell form of snails in the fish-crab and snail-crab treatments to that of snails in the no-crabtreatment which served as a control for laboratoryconditions. This comparison provides a measureof the effects of each treatment relative to eachother. As I will discuss below, however, the shellform of snails in the laboratory controls (no-crabtreatment) did differ in some cases from those ofreference shells collected from the field. Becausethese changes in shell form were in the oppositedirection in some cases from those in the two crabtreatments, laboratory conditions may haveheightened the differences observed amongexperimental groups. Nonetheless, with oneexception (lip thickness of the exposed-shorephenotype), the greatest departure of shell formfrom that of reference snails collected from thefield occurred in one of the two risk treatments(fish-crab or snail-crab).
The scent of crabs alone clearly influences shellform in an adaptive manner in N. lapillus. Com-
pared to controls (no crab), snails of both pheno-types in the fish-crab treatment exhibited a signifi-cantly greater expression of shell traits that wouldreduce vulnerability to shell-breaking crabs(Hughes & Elner, 1979; Palmer, 1985a; Seed,1978; Vermeij, 1978): apertural tooth height(+ 200 %, + 370 % for exposed- and protected-shore phenotypes respectively; Fig. 11), shellweight relative to length [ + 16% and + 4% (notsignificant for protected); Figs. 12a], shell weightrelative to body weight (+54% and +21%;Figs. 12b), and relative lip thickness (+ 31 % and+ 26%; Fig. 13). The response of exposed-shoresnails provided the most convincing evidence forthis. These snails grew substantially in both theno-crab and fish-crab treatments. The increase inlength of more than 50% (Fig. 10a) and theapproximate tripling in wet body weight (Fig. 9)transformed them from immature juveniles to thesize of mature adults over the course of the experi-ment. Hence the differences in final shell formreflected to a very large extent differences in newshell added. In other words, these differenceswere not diminished very much by the similarityof original juvenile shells at the beginning of theexperiment. By the same reasoning, however, thedifferences between the no-crab and fish-crabtreatments almost certainly lead to an under-estimate of the potential morphological responseof the protected-shore snails. A much greaterfraction of their shell at the end of the experimentwas already present at the beginning because theydid not grow nearly as much (Figs. 9, 10a, b).
Because of their reduced growth, the morpho-logical differences observed between the snail-crab and no-crab treatments must also be inter-preted with some caution. Even though providedwith food ad libitum, the body weight of snailseither did not change (exposed-shore) or actuallydecreased (protected-shore; Fig. 9), and notmuch new shell material was added (Fig. 10a, b).As a consequence, for example, the increasedshell weight for a given wet body weight in pro-tected-shore snails in the snail-crab treatment(Fig. 12b) was partly an artifact because they lostbody weight (Fig. 9). This nearly 30% increase inrelative shell weight, however, exceeded the 14%
176
loss in body weight experienced by these snailsand even when scaled by shell length theyexhibited an increase in shell weight and lip thick-ness relative to controls (Figs. 12a, 13). Hereagain, even though antipredatory traits of bothphenotypes in this treatment developed to thesame or greater extent than in the fish-crab treat-ment (except for apertural tooth height ofexposed-shore snails, see supernormal stimulusbelow), these increases probably also under-estimate the full impact of the scent of damagedconspecifics on shell morphology.
Effect of perceived risk on shell morphology of fedsnails: direction of change from field samples
Although the final shell form of snails in both thefish-crab and snail-crab treatments differed fromthat of the controls (no crab), these differencescould have resulted from either a) an amplifica-tion of antipredatory traits in the experimentalgroups or b) a reduced expression of anti-predatory traits in the controls. For example, ifthe control groups produced much less welldefended shells, as a product of holding theseintertidal snails continuously immersed in thelaboratory with superabundant food, then thegreater development of antipredatory traits in theexperimental groups would be an illusion. Thus,to assess the direction of change, the shells oflaboratory raised snails must be compared tothose collected directly from the field. Alterna-tively, when measuring phenotypic plasticity (seeplasticity below), the range of phenotypes ex-pressed under a particular range of conditions isthe variable of interest, not the direction ofchange.
The shells of protected-shore snails did notchange significantly when held under control con-ditions in the laboratory (no crab). At the end ofthe experiment, neither apertural teeth (Fig. 11),shell weight at a given length (Fig. 12a), nor lipthickness (Fig. 13) differed from field-collectedreference shells [the decrease in shell weight at agiven body weight (Fig. 12b) resulted from anincrease in the size of the snail relative to the
habitable volume of the shell (see retractabilitybelow)]. Both laboratory crab treatments thusresulted in shells that were more well defendedthan those of protected-shore snails from thefield.
In contrast, the shells of exposed-shore snailsdid change when held under control conditions inthe laboratory. Furthermore, the direction of mor-phological change depended upon which refer-ence shells were used for comparison, those col-lected at the beginning of the experiment(Exposed I) or those collected at the end(Exposed II). Relative to shells collected at thebeginning of the experiment (Exposed I), thoseproduced by snails in the no-crab treatment hadlarger apertural teeth [Fig. 11; most likelybecause they had nearly reached maturity by theend of the experiment (see Fig. 10a)] and wereconsiderably thinner at the lip (Fig. 13). The shellswere also heavier for a given length (Fig. 12a),although relative to body weight they did not dif-fer from those initial reference shells (Fig. 12b).Hence, with the exception of lip thickness, bothlaboratory crab treatments also appeared to resultin shells that were more well defended than thoseof exposed-shore snails from the field. Note, how-ever, that these changes were of the same magni-tude that occurred naturally at the exposed-shoresite over the duration of the experiment (compareExposed I to Exposed II reference values,Figs. 12a, b). Unfortunately, I cannot be surewhether lip thickness increased or decreased rela-tive to initial values for two reasons: a) lip thick-ness was not measured for the initial referencesample (Exposed I) and the shells were sub-sequently destroyed while developing shell weightand body weight calibrations, and b) the initialsnails used in the experiments did not span a largeenough size range to allow me to extrapolate withany confidence to shells of larger size.
In conclusion, the amplification of antipreda-tory traits in both crab treatments do appear torepresent changes in an adaptive direction; theywere not an artifact of reduced expression of anti-predatory traits in control snails.
177
Effect of perceived risk on retractability
The changes observed in unoccupied volume ofthe shell, a measure of the degree to which a snailmay retract into its shell, were rather intriguingand suggest another way in which snails mayreduce their vulnerability to predation by crabs.Considering only snails which exhibited signifi-cant growth over the duration of the experiment(no-crab and fish-crab treatments), the fraction ofthe internal volume of the shell actually occupiedby body tissue appeared to vary in an adaptivemanner. For example, the unoccupied volume ofthe shell of protected-shore N. lapillus decreasedin the absence of crabs but did not change in theirpresence (fish-crab, Fig. 12c, d) even though bothgroups grew (Fig. 9). In contrast, the unoccupiedvolume of the shell of exposed-shore snailsdecreased in the absence of crabs but increasedsignificantly in their presence (fish-crab,Fig. 12c, d). Hence, even though body weightincreased more than 150% in this latter group(Fig. 9), the snails expanded the internal volumeof their shell much more than required to accom-modate the increase in body size. As a con-sequence, they would have been able to retractfurther into their shell to avoid apertural probingby predatory crabs.
Of interest, these changes paralleled thoseobserved between field-collected snails of bothphenotypes. Dogwhelks from the protected shore,where the risk of crab predation was presumablyhigher, were able to withdraw further into theirshells than those from the exposed shore (Fig. 5).
Apertural tooth development in Nucella lapilluscompared to N. lamellosa
The development of apertural teeth in fedN. lapillus differed in only one notable respectfrom that of starved snails. When provided withfood, snails of the protected-shore phenotype inthe snail-crab treatment developed the largestteeth by more than a factor of two compared tothe fish-crab treatment (Fig. 11). When starved,no difference was observed between these two
treatments. Even though snails of the protected-shore phenotype lost weight (Fig. 9), these datasuggest that the availability of at least some foodwas essential to the development of moderate-sized apertural teeth. Note that snails in this treat-ment developed teeth that were at least twice aslarge as the largest teeth produced by any othergroup for this phenotype whether provided withfood or not (compare Fig. 11 with Fig. 7c). Rathercuriously, for the exposed-shore population, thepattern of development of apertural teeth by fedsnails did not differ from that of starved snailseither qualitatively or quantitatively (fish-crab >no crab snail-crab; Figs. 9, 11). Hence, theavailability of food appeared to have no effect onthe capacity of exposed-shore snails to produceteeth.
The development of apertural teeth in bothstarved and fed N. lapillus paralleled rather closelythat observed for N. lamellosa under similarexperimental conditions (Appleton & Palmer,1988). Among starved snails of both phenotypesthe largest teeth were developed in the fish-crabtreatment, whereas among fed snails the largestteeth were developed in the snail-crab treatment.The one notable difference between these speciesoccurred in fed, exposed-shore snails in the snailcrab treatment. N. lamellosa under these condi-tions produced the largest apertural teeth whereasthe teeth produced by N. lapillus under these con-ditions did not differ from those in the fed controls(Fig. 11).
Several observations suggest that some of themorphological responses of exposed-shoreN. lapillus were anomalous. For example, thequalitative responses of both phenotypes in thefish-crab treatment were very similar (Table 9). Inaddition, in the snail-crab treatment the responsesof the protected-shore phenotype was qualita-tively similar to those of both phenotypes in thefish-crab treatment. Hence, where snails in theremaining three groups exhibited increases in thedevelopment of antipredatory traits compared tocontrols, exposed-shore snails in the snail-crabtreatment exhibited no change or decreases. Withthe present data, however, I am not sure how toaccount for the seemingly anomalous response of

178
Table 9. Qualitative summary of the effects of three risk treatments on various aspects of the biology of Nucella lapillus.Retractability - ability of snail to withdraw into the shell (measured as the unoccupied volume of shell). Entries in each columnindicate the magnitude of the change compared to controls (no crab): (0) < 10 O difference compared to controls, ( - ) 10-25 %less than controls, ( - - ) 25-50 % less, ( - - - ) > 50 % less, ( + ) 10-25 % greater than controls, ( + + ) 25-50 % greater ( + + + )>50% greater.
Variable exhibiting response Fish-crab Snail-crab
Exposed Protected Exposed Protected
Starved snailsInitial daily rate of shell deposition (Fig. 6) - - -- - - -
Total body weight loss (Fig. 7a) 0 + + 0 + +Total shell weight gain (Fig. 7b) + + + --- +
Apertural tooth development Fig. 7c) + + + + t --- + + + tChange in lip thickness (Fig. 7d) + ++ + + + - - +
Fed snailsRate of feeding (Fig. 8) - - - - - -- -
Rate of body growth (Fig. 9) - - - - - -Apertural tooth development (Fig. 11) + ++ + + + 0 + + + tRelative shell weight (Fig. 12a) + 0 + 0Relative retractability (Fig. 12c) + + 0 + +§Relative lip thickness (Fig. 13) + + + + + + + +
t Teeth in no-crab treatment not significantly different from zero.§ Snails lost weight.
this group. Perhaps, because the snails fed tocrabs in the snail-crab treatment were collectedfrom the exposed-shore site, experimental snailsfrom this site were more sensitive to the stimulithan those from the protected-shore site.
Phenotypic plasticity in Nucella lapillus comparedto N. lamellosa
In the experiments with both N. lamellosa andN. lapillus, populations exhibiting two quite dif-ferent shell forms were examined for phenotypicplasticity. The patterns of variation exhibited bythese species suggests that the relative plasticitiesof the two phenotypes differ between species. ForN. lamellosa, the range of development of aper-tural teeth among experimental groups was simi-lar for both phenotypes (Appleton & Palmer,1988), although the range in relative shell weightamong these groups was greater in snails from theprotected shore (Palmer, unpublished). In
N. lapillus, on the other hand, exposed-shoresnails exhibited a broader range of final shell formthan those from the protected-shore for nearly alltraits examined, regardless of whether snails werestarved or fed. In addition, the protected-shorepopulation was the only one to exhibit changes inshell form over time in the field (Figs. 4b, c).Hence, although reasons exist for believing thatmorphological change in one direction may bemore likely than in another (Palumbi, 1984; Etter,1988), the evidence from dogwhelks suggests nosimple generalization will emerge about whichpopulations retain a greater capacity to modifytheir shells ecophenotypically.
Apparent differences in phenotypic plasticitybetween the populations of these two speciesmust be interpreted with caution because theexperiments were started with individuals thathad already spent one or more years in the field.The shells that they developed while in the fieldmay thus have limited their ability to respond inthe laboratory. To be sure that genetically based

179
differences in phenotypic plasticity exist amongpopulations, snails with a common history wouldhave to be compared.
Temporal morphological change in natural popu-lations
The increase in relative shell weight observedbetween July 10 and Oct. 14 in exposed-shoreN. lapillus collected from the field (Fig. 4, Table 2)was unexpected. Without additional data, littlecan be said with confidence about the reasons forthis variation. Two points, however, do seemworth mentioning. First, this temporal variationwas unlikely to have been due to bias during col-lection: a) the snails were collected from theidentical location on both occasions, and b) manyof the data points for the July collection lie welloutside the scatter of those for October (e.g.Fig. 4c). Second, no change of average shellweight was observed for the protected-shorepopulation over this same time interval (Fig. 4,Table 2). Furthermore the difference in the degreeof variation over time in the two field populationswas consistent with their response to experi-mental conditions in the laboratory: exposed-shore snails appeared to be more phenotypicallyplastic than those from the protected shore (e.g.Figs. 11, 14). I suspect that the increase in averageshell weight at the exposed-shore site may be anormal seasonal occurrence associated with adecline in the rate of growth over the course of thesummer and into the fall, because shell weighttends to increase with decreasing rate of growth(Wellington & Kuris, 1983; Vermeij, 1980).
Scaling out size differences in gastropod morphome-trics
Because of the substantial variation in shape, andthe partial ability of body size to change inde-pendent of the shell, the procedures used to scaleout differences in 'size' in species of gastropodswhose shell varies extensively are problematical,although they are hardly unique to the morphome-
trics of gastropod shells. Shell length is probablythe most commonly used index of size because ofits convenience. Shell length, however, is a verypoor predictor of wet body weight for N. lapilluswith shells of different shape (e.g. see Fig. 4a).Snails from protected shores have a relativelylonger apex than those from exposed shores,hence shell length substantially underestimatesbody weight. This contrasts with observations onN. lamellosa of the northeastern Pacific for whichshell length can be an accurate predictor of bodyweight for populations having shells of differentthickness (Palmer, 1985a). In addition, because oftheir different shapes, shells of protected- andexposed-shore N. lapillus have nearly the sameweight for a given length (Fig. 4c). Hence,although one might argue that shell length is there-fore a more accurate predictor of shell weight, thisgives a very misleading impression about theamount of shell material committed to defense,and also about the ability of the shell to resistpredation by shell breaking crabs (Currey &Hughes, 1982; Hughes & Elner, 1979), since theamount of shell per unit body weight is substan-tially different between these populations(Fig. 4b). When comparing differences in thecommitment of resources to defense, body weightwould seem to be a more relevant variable forscaling size than shell length.
For other comparisons, however, body weightmay yield a misleading impression about dif-ferences in shell form. For example, body weightmay either increase or decrease without anychange in shell weight or dimensions. More invidi-ously, the fraction of the habitable volume of theshell actually occupied by animal tissue may itselfvary in an adaptive manner (see retractabilityabove). Given the potentially confounding effectsof independent variation in body weight, shelllength would seem to be a better measure of sizefor shells of similar shape.
Perhaps the search for an idealized descriptorof 'size' is unwarranted. After all, normally one isinterested in the variation of one trait comparedto that in another. Hence the choice of the trait bywhich to scale size will depend upon the questionbeing asked. Where the energetics of defensive

180
morphologies or the relation of defensive mor-phologies to life history are concerned, bodyweight may be the most relevant basis for com-parison. On the other hand, if one is interested inthe geometric distribution of shell material shelllength may be a more relevant descriptor of size.Perhaps the safest tactic is to explore the variationin the trait of interest with respect to more thanone descriptor of size. In this manner, potentialbiases associated with any single descriptorshould become apparent.
Was the scent of damaged conspecifics a super-normal stimulus?
The dramatic inhibition of feeding and growthobserved in the snail-crab treatment (Figs. 9, 10),and the concomitant effects of reduced growth onshell morphology and on estimates of phenotypicplasticity, deserve some additional comment. Inthe experiments described above, and in thosedone previously with N. lamellosa (Appleton &Palmer, 1988), no attempt was made to controlthe experimental stimuli quantitatively. Theexperimental groups were exposed to stimuli ofarbitrary intensity to examine the presence/absence of morphological responses. If the stimu-lus I provided in the laboratory far exceeded anythat these snails would normally encounter, thiscould account for two observations: a) theresponses of starved dogwhelks in the snail-crabtreatment were often less than in the fish-crabtreatment (Fig. 7), and b) dogwhelks in the snail-crab treatment either did not grow or actually lostweight even in the presence of abundant food(Fig. 9). The number of snails eaten by crabs inthe experimental aquaria, for example, were 2.9and 3.7 snails crab-' day-' (5.8 and 7.5 snailstreatment - day- ). I think it rather unlikely thatindividual N. lapillus in the field are ever exposedto the scent of conspecifics being eaten con-tinuously at this rate by crabs for this long aperiod of time.
A priori, I would have expected the scent ofconspecifics being eaten by crabs, which shouldbe a more reliable predictor of increased risk to
predation, to have elicited a greater morphologicalresponse than the scent of crabs alone, since thescent of crabs in the vicinity but not feeding onsnails would seem to pose a lessor risk. At thevery least, because both contained the same levelof crab stimulus, the behavioral and morpho-logical responses of snails in the snail-crab treat-ment should have been the same as those in thefish-crab treatment. Compared to the fish-crabtreatments, several aspects suggest that the stimu-lus level in the snail-crab treatments was unna-turally high: a) among starved snails, the reduceddevelopment of apertural teeth, the smallerchange in shell weight and the smaller increase inlip thickness (Fig. 7b-d), and b) among snailsprovided with abundant food, the lack of bodygrowth or actual loss in body weight (Fig. 9). Toverify this conjecture, snails would have to be heldin the presence of crabs being fed conspecificsnails at different rates.
Adaptive behavioral and morphological variation inNucella lapillus
Despite the complexities of some of the patterns,two important conclusions may be drawn fromthe above experiments. First, both the scent ofcrabs and the scent of damaged conspecificsdramatically reduce the rates of feeding andgrowth of N. lapillus. Second, these stimuli canalso amplify the development of several differentantipredatory traits. Hence the effects of risk-related chemical cues in the environment must beconsidered when interpreting variation in behav-ior and shell morphology among natural popu-lations of gastropods.
Although numerous gastropods flee from slow-moving predators such as starfish and otherpredatory gastropods (Snyder & Snyder, 1971;Vermeij, 1978, 1987), examples of escaperesponses to more rapidly moving predators suchas crabs and fishes are rare. Nonetheless, the factthat such behaviors do occur (Geller, 1982) indi-cates that gastropods are capable of detectingchemical cues even from highly mobile predators.The reduced rates of feeding and growth in the

181
fish-crab compared to the no-crab treatmentreveal that, as observed for N. lamellosa from thenortheastern Pacific (Appleton & Palmer, 1988),N. lapillus can also recognize and respond adap-tively to the scent of predatory crabs.
The greater suppression of feeding activity ofdogwhelks in the snail-crab compared to the fish-crab treatments indicates that N. lapillus also havean alarm response. Other marine and freshwatergastropods exhibit alarm responses to the scent ofdamaged conspecifics (Snyder, 1967; Atema &Stenzler, 1977; Stenzler & Atema, 1977) andthese responses appear to be adaptive (Ashkenas& Atema, 1978; Hadlock, 1980). Both thereduced rates of feeding, and the tendency forsnails to remain about the lower margins andundersides of stones in the snail-crab treatments,would reduce the probability that individualN. lapillus were encountered by foraging crabs.Hence the alarm response in N. lapillus alsoappears to be adaptive.
Perhaps the most surprising aspect of thisstudy, and that of Appleton & Palmer (1988), isthat gastropods can also respond morphologi-cally to chemical cues released by predators anddamaged conspecific snails. Such morphologicalresponses are rare among solitary organisms(Harvell, 1986, but see Liveley, 1986). Further-more, the morphological responses are in an adap-tive direction - in the presence of these stimuli,N. lapillus produced heavier shells with thickerlips and more well-developed apertural teeth. Allof these traits reduce the vulnerability to attack byshell-breaking crabs (Kitching etal., 1966;Hughes & Elner, 1979; Palmer, 1985a; Vermeij,1987). Because these environmental stimuli canhave a significant effect on shell morphology,interpretations of morphological differencesobserved among natural populations must bedone with caution. Such differences may resultfrom either genetic or environmental effects, orsome combination of the two (e.g. Janson, 1982;Palmer, 1985b). Thus, for example, the changes inshell morphology observed in Littorina obtusata(Seeley, 1986) and N. lapillus (Vermeij, 1982) fol-lowing the introduction of Carcinus maenas maynot reflect microevolutionary change, since such
changes could equally likely have been an eco-phenotypic response to the scent of crabs.
Acknowledgements
I thank Roger Hughes for generously agreeing tohost my sabbatical visit to Wales and both he andJohn Davenport for assistance in numerous waysduring my stay. Gary Vermeij and LoisHammond offered useful comments on variousdrafts of the manuscript. This research was sup-ported by a Natural Sciences and EngineeringResearch Council of Canada travel grant T7684,and by operating grant A7245 whose sustainedfunding I acknowledge with gratitude.
References
Appleton, R. D. & A. R. Palmer, 1988. Water-borne stimulireleased by predatory crabs and damaged prey inducemore predator-resistant shells in a marine gastropod. Proc.nat Acad. Sci. U.S.A. 85: 4387-4391.
Ashkenas, L. & J. Atema, 1978. A salt marsh predator-preyrelationship: attack behavior of Carcinus maenas (L.) anddefenses of Ilyanassa obsoletus (Say). Biol. Bull. 155: 426.
Atema, J. & D. Stenzler, 1977. Alarm substance of themarine mud snail, Nassarius obsoletus: biological charac-terization and possible evolution. J. chem. Ecol. 3:173-187.
Cambridge, P. G. & J. A. Kitching, 1982. Shell shape in livingand fossil (Norwich Crab) Nucella lapillus (L.) in relationto habitat. J. Conch. Lond. 31: 31-38.
Colton, H. S., 1916. On some varieties of Thais lapillus in theMount Desert Island region. A study of individual ecologyProc. Acad. nat. Sci., Philad. 68: 440-454.
Colton, H. S., 1922. Variation in the dog whelk, Thais lapillus.Ecology 3: 146-157.
Crothers, J. H., 1971. Further observations on the occur-rence of 'teeth' in the dog-whelk Nucella lapillus. J. mar.biol. Ass. UK. 51: 623-639.
Crothers, J. H., 1985. Dog-whelks: An introduction to thebiology of Nucella lapillus (L.). Field Studies 6: 291-360.
Currey, J. D. & R. N. Hughes, 1982. Strength of the dog-whelk Nucella lapillus and the winkle Littorina littorea fromdifferent habitats. J. anim. Ecol. 51: 47-56.
Etter, R. J., 1988. Asymmetrical developmental plasticity inan intertidal snail. Evolution 42: 322-334.
Geller, J. B., 1982. Chemically mediated avoidance responseof a gastropod, Tegula funebralis (A. Adams); to a preda-tory crab, Cancer antennarius (Stimpson). J. exp. mar. Biol.Ecol. 65: 19-27.

182
Hadlock, R. P., 1980. Alarm response of the intertidal snailLittorina littorea (L.) to predation by the crab Carcinusmaenas (L.). Biol. Bull. 159: 269-279.
Hartley, O., 1962. Analysis of variance. In: MathematicalMethods for Digital Computers, Vol. 1. Ralston, A. &H. S. Wilf (eds). Wiley, New York. pp. 221-230.
Harvell, C. D., 1986. The ecology and evolution of inducibledefenses in a marine bryozoan: cues, costs, and con-sequences. Am. Nat. 128: 810-823.
Hughes, R. N. & R. W. Elner, 1979. Tactics of a predator,Carcinus maenas, and morphological responses of the prey,Nucella lapillus. J. anim. Ecol. 48: 65-78.
Janson, K., 1982. Genetic and environmental effects on thegrowth rate of Littorina saxatilis. Mar. Biol. 69: 73-78.
Kilburn, R. & E. Rippey, 1982. Sea Shells of Southern Africa.Macmillan South Africa, Johannesburg, 249 pp.
Kincaid, T., 1957. Local races and clines in the marinegastropod Thais lamellosa, a population study. CalliostomaCo., Seattle, 75 pp, 65 Plates.
Kincaid, T., 1964. Notes on Thais (Nucella) lima (Gmelin), amarine gastropod inhabiting areas in the North PacificOcean. Calliostoma Co., Seattle.
Kitching, J. A., 1976. Distribution and changes in shell formof Thais spp. (Gastropoda) near Bamfield, B.C. J. exp. mar.Biol. Ecol. 23: 109-126.
Kitching, J. A. & J. Lockwood, 1974. Observations on shellform and its ecological significance in Thaisid gastropodsof the genus Lepsiella in New Zealand. Mar. Biol. 28:131-144.
Kitching, J. A., L. Muntz & F. J. Ebling, 1966. The ecologyof Lough Ine, XV. The ecological significance of shell andbody forms in Nucella. J. anim. Ecol. 35: 113-126.
Largen, M. J., 1971. Genetic and environmental influencesupon the expression of shell sculpture in the dog whelk(Nucella lapillus). Proc. malac. Soc. Lond. 39: 383-388.
Lively, C., 1986. Predator induced shell polymorphism in theacorn barnacle Chthamalus anisopoma. Evolution 40:232-242.
Milinski, M. & R. Heller, 1978. Influence of a predator on theoptimal foraging behaviour of sticklebacks (Gasterosteusaculeatus L.). Nature 275: 642-644.
Moore, P. G., 1985. Shell shape in living and fossil ('25ft'beach) dog-whelks, Nucella lapillus (L.), from the Isle ofCumbrae, Scotland. Glasg. Nat. 21: 81-91.
Palmer, A. R., 1981. De carbonate skeletons limit the rate ofbody growth? Nature 292: 150-152.
Palmer, A. R., 1982. Growth in marine gastropods: a non-destructive technique for independently measuring shelland body weight. Malacologia 23: 63-73.
Palmer, A. R., 1985a. Adaptive value of shell variation inThais (or Nucella) lamellosa: effect of thick shells onvulnerability to and preference by crabs. Veliger 27:349-356.
Palmer, A. R., 1985b. Quantum changes in gastropod shellmorphology need not reflect speciation. Evolution 39:699-705.
Palumbi, S. R., 1984. Tactics of acclimation: morphologicalchanges of sponges in an unpredictable environment.Science 225: 1478-1480.
Phillips, B. F., N. A. Campbell & B. R. Wilson,, 1973. Amultivariate study of geographic variation in the whelkDicathais. J. exp. mar. Biol. Ecol. 11: 27-69.
Seed, R., 1978. Observations on the significance of shellshape and body form in the dogwhelk (Nucella lapillus (L.))from North Wales. Nature in Wales 16: 111-122.
Seeley, R. H., 1986. Intense natural selection caused a rapidmorphological transition in a living marine snail. Proc. nat.Acad. Sci., USA 83: 6897-6901.
Sih, A., 1980. Optimal behavior: Can foragers balance twoconflicting demands? Science 210: 1041-1043.
Sih, A., 1984. The behavioral response race between preda-tor and prey. Am. Nat. 123: 143-150.
Snyder, N. F. R., 1967. An alarm of aquatic gastropods tointraspecific extract. New York Agric. Experiment Sta.,Ithaca, Mem. 403: 1-122.
Snyder, N. F. R. & H. A. Snyder, 1971. Defenses of theFlorida apple snail, Pomacea paludosa. Behaviour 40:175-215.
Sokal, R. R. & F. J. Rohlf, 1981. Biometry, W. H. Freemenand Co., San Francisco.
Spight, T. M., 1973. Ontogeny, environment, and shape of amarine snail, Thais lamellosa (Gmelin). J. exp. mar. Biol.Ecol. 13: 215-228.
Stenzler, D. & J. Atema, 1977. Alarm response of the marinemud snail, Nassarius obsoletus: specificity and behavioralpriority. J. chem. Ecol. 3: 159-171.
Vermeij, G. J., 1978. Biogeography and Adaptation. Patternsof Marine Life. Harvard University Press, Cambridge. 332PP.
Vermeij, G. J., 1980. Gastropod shell growth rate, allometryand adult size: environmental implications. In: Rhoads,D. C. & R. A. Lutz, (eds.) Skeletal Growth of AquaticOrganisms. Plenum Press, New York: 379-394.
Vermeij, G. J., 1982. Phenotypic evolution in a poorly dis-persing snail after arrival of a predator. Nature 299:349-350.
Vermeij, G.J., 1987. Evolution and Escalation. An Eco-logical History of Life. Princeton University Press,Princeton.
Wellington, G. M. & A. M. Kuris, 1983. Growth and shellvariation in the tropical eastern Pacific intertidal gastro-pod genus Purpura: ecological and evolutionary implica-tions. Biol. Bull. 164: 518-535.