effect of diversification strategies on financial
TRANSCRIPT

EFFECT OF DIVERSIFICATION STRATEGIES ON FINANCIAL
PERFORMANCE OF DEPOSIT TAKING SAVINGS AND
CREDIT COOPERATIVE SOCIETIES IN NAIROBI COUNTY,
KENYA
CHARITY MWENDE MWANIA
A RESEARCH PROJECT SUBMITTED IN PARTIAL
FULFILLMENT OF THE REQUIREMENTS FOR THE AWARD
OF THE DEGREE OF MASTER OF BUSINESS
ADMINISTRATION, SCHOOL OF BUSINESS, UNIVERSITY OF
NAIROBI
2020

ii
DECLARATION

iii
ACKNOWLEDGEMENT

iv
DEDICATION

v
TABLE OF CONTENTS
DECLARATION.......................................................................................................... ii
ACKNOWLEDGEMENT ......................................................................................... iii
DEDICATION............................................................................................................. iv
LIST OF TABLES ................................................................................................... viii
LIST OF ABBREVIATIONS .................................................................................... ix
ABSTRACT .................................................................................................................. x
CHAPTER ONE: INTRODUCTION ........................................................................ 1
1.1 Background of the Study ...................................................................................... 1
1.1.1 Diversification Strategy ................................................................................. 2
1.1.2 Financial Performance ................................................................................... 3
1.1.3 Diversification Strategy and Financial Performance ..................................... 4
1.1.4 Deposit Taking Savings and Cooperative Societies in Kenya ....................... 6
1.2 Research Problem ................................................................................................ 7
1.3 Research Objectives ............................................................................................. 9
1.4 Value of the Study ................................................................................................ 9
CHAPTER TWO: LITERATURE REVIEW ......................................................... 10
2.1 Introduction ........................................................................................................ 10
2.2 Theoretical Framework ...................................................................................... 10
2.2.1 Modern Portfolio Theory ............................................................................. 10
2.2.2 Agency Theory............................................................................................. 11
2.2.3 Resource Based View Theory ...................................................................... 12
2.3 Determinants of Financial Performance ............................................................ 13
2.3.1 Diversification Strategy ............................................................................... 13
2.3.2 Liquidity ...................................................................................................... 14
2.3.3 Firm Size...................................................................................................... 15
2.3.4 Management Efficiency ............................................................................... 15

vi
2.3.5 Firm Age ...................................................................................................... 16
2.4 Empirical Review ............................................................................................... 16
2.4.1 Global Studies.............................................................................................. 16
2.4.2 Local Studies ............................................................................................... 18
2.5 Conceptual Framework ...................................................................................... 20
2.6 Summary of the Literature Review .................................................................... 21
CHAPTER THREE: RESEARCH METHODOLOGY ........................................ 22
3.1 Introduction ........................................................................................................ 22
3.2 Research Design ................................................................................................. 22
3.3 Population .......................................................................................................... 22
3.4 Data Collection .................................................................................................. 22
3.5 Diagnostic Tests ................................................................................................. 23
3.6 Data Analysis ..................................................................................................... 24
3.6.1 Analytical Model ......................................................................................... 24
3.6.2 Tests of Significance .................................................................................... 25
CHAPTER FOUR: DATA ANALYSIS, RESULTS AND FINDINGS ................ 26
4.1 Introduction ........................................................................................................ 26
4.2 Descriptive Analysis .......................................................................................... 26
4.3 Diagnostic Tests ................................................................................................. 27
4.3.1 Normality Test ............................................................................................. 27
4.3.2 Multicollinearity Test ................................................................................... 28
4.3.3 Heteroskedasticity Test ................................................................................ 28
4.3.4 Autocorrelation Test ..................................................................................... 29
4.5 Correlation Analysis .......................................................................................... 29
4.6 Regression Analysis ........................................................................................... 30
4.7 Discussion of Research Findings ....................................................................... 33

vii
CHAPTER FIVE: SUMMARY, CONCLUSION AND RECOMMENDATIONS
...................................................................................................................................... 36
5.1 Introduction ........................................................................................................ 36
5.2 Summary of Findings ......................................................................................... 36
5.3 Conclusion ......................................................................................................... 37
5.4 Recommendations .............................................................................................. 38
5.5 Limitations of the Study ..................................................................................... 39
5.6 Suggestions for Further Research ...................................................................... 40
APPENDICES ............................................................................................................ 46
Appendix I: Deposit-taking SACCOs in Nairobi County, Kenya ........................... 46
Appendix II: Research Data ..................................................................................... 47

viii
LIST OF TABLES
Table 4.1: Descriptive Statistics .................................................................................. 27
Table 4.2: Normality Test ............................................................................................ 27
Table 4.3: Multicollinearity Test ................................................................................. 28
Table 4.4: Heteroskedasticity Test ............................................................................... 29
Table 4.5: Autocorrelation Test ................................................................................... 29
Table 4.6: Correlation Analysis ................................................................................... 30
Table 4.7: Model Summary ......................................................................................... 31
Table 4.8: Analysis of Variance................................................................................... 31
Table 4.9: Model Coefficients ..................................................................................... 32

ix
LIST OF ABBREVIATIONS
ANOVA Analysis of Variance
DT-SACCO Deposit Taking Savings and Credit Cooperative
FP Financial Performance
GDP Gross Domestic Product
HHI Herfindahl-Hirschman Index
MPT Modern Portfolio Theory
NIM Net Interest Margin
NSE Nairobi Securities Exchange

x
ABSTRACT
Theories, for example the modern portfolio theory, the agency theory and the resource
based theory suggest that diversification has a close relation to the financial
performance of the diversifying institution. The modern portfolio theory suggests that
diversification improves returns while controlling risk. The agency theory confirms
that performance and diversification have a relation which is dependent on the
principal-agent relationship in the organization. The intent was to determine how
diversification impacts performance of DT-SACCOs in Nairobi County. The
population included 43 DT-SACCOs in the County. The predictor variables were
diversification given by Herfindahl Hirschman Index (HHI), management efficiency
given by the ratio of total revenue to total assets, age of a firm given by the number of
years in existence, firm size by natural log of total assets and liquidity given by liquid
assets to total assets. Financial performance was the response variable given by ROA.
Secondary data for 5 years was obtained annually. A descriptive cross-sectional
design and a regression model were used in analysis. SPSS version 23 was utilized for
this function. An R-square value of 0.455 which meant that 45.5 percent changes in
performance of DT-SACCOs in Nairobi result from the independent variables was
found while 54.5 percent variations were the result of additional factors not
considered. The independent variables had a substantial correlation with
value(R=0.674). ANOVA showed that F statistic was substantial at 5% with a
p=0.000, making the model appropriate. The findings also showed that diversification,
liquidity and firm size had positive substantial values in the study. Management
efficiency and age of the firm was insignificant to performance. The study
recommends the need for DT-SACCOs in Nairobi County, Kenya and other SACCOs
in general to diversify their revenue streams as this significantly influences their
financial performance.

1
CHAPTER ONE: INTRODUCTION
1.1 Background of the Study
Over a long period of time, researchers have attempted to interrogate why some
organizations achieve higher levels of performance than others. Organizational
performance is dependent on many factors among them; the strategy of the firm,
structure, resources and capabilities of the firm (Marcia, Otgontsetseg & Hassan,
2014). Diversification strategy among other strategy choices can influence the
performance of organizations (Purkayastha, 2013). The diversification decisions that a
firm makes is vital in firm’s efficiency hence making it effective in achieving its
goals. For a firm to be competitive and efficient it has to make diversification
decisions key to the business administration (Virlics, 2013). Loof and Heshmati
(2008) argue that diversification affects Financial Performance (FP) of firms
positively and significantly.
This study drew support from a number of theories for example the modern portfolio
theory, agency theory and the resource based view theory that have attempted to
elaborate the relationships between diversification and FP. The modern portfolio
theory by Markowitz (1952) encourages diversification to mitigate the risk from the
market as well as those risks that are attributable specifically to one company in
regards to expected returns. The agency theory by Jensen and Meckling (1976)
recognizes that the benefits of revenue diversification are variant, partly, due to the
agency issues within the firms. The managers may diversify out of their own interests
and not those of the shareholders. The Resource Based View (RBV) by Wernerfelt
(1984) stated that resources aid a firm in being competitive by promoting

2
diversification and thus firms should find ways of identifying and using resources to
develop and maintain competitive advantage that will improve performance.
The deposit-taking SACCOs in Kenya have been practicing diversification strategy in
a bid to achieve efficiency in operations and maximizing returns for the members. The
deposit-taking SACCOs have mostly invested in real estate, shares, government
securities and fixed deposits and therefore the need to conduct an empirical study
investigating whether these investments have a significant influence on their
efficiency. While undertaking all these investments, managers should ensure safety
and good returns for their money (Auka & Mwangi, 2013).
1.1.1 Diversification Strategy
Diversification is the entry of a firm into new business lines either by internal growth
and development or merger and acquisition, entailing change of the organization’s
systems and its administrative structure (Ramanujam & Varadarajan, 1989). The best
definition of diversification strategy is a firm entering into a new market or
introducing a new product or service that is different from its current activities (Anil
& Yigit, 2011). Baele, Jonghe and Vennet (2006) posits that diversification of income
involves generating income from a variety of activities which are distinct from each
other which essentially involves the shifting of reliance from interest income
associated with conventional intermediary activities to more innovative non-interest
income earning activities. The innovative non-interest income earning activities helps
the firm to diversify their risk and also perform better financially (Doumpos, Gaganis
& Pasiouras, 2013).
The benefits of diversification include; greater market power, risk minimization,
larger internal capital markets and scope economies (Jangili & Kumar, 2010).

3
Diversification enables firms to utilize their idle resources in new activities leading to
economies of scope. Furthermore, diversification allows firms to create and use large
internal capital market such as investing funds generated in one venture to expand the
other. The assertion is anchored on the notion that inefficiencies caused by
information asymmetric in internal capital markets are higher than those of the
external capital markets (Asetto, 2014).
According to Stiroh and Rumble (2006), measurement of diversification is done using
the Herfindahl-Hirschman Index (HHI) and the Entropy Index that explain the
components of net operating income such as interest and non-interest income. HHI
views diversification as measure that gives every income source equal exposure.
Furthermore it verifies and estimates the range of diversification and localization of
the firm’s income sources. The HHI is the measurement of banks’ and DT-SACCOs
diversified income sources such as interest income and non-interest income
generating functions. A low Herfindahl-Hirschman Index (HHI) implies that the firm
concentrates on a single income source as opposed to diversifying while a high HHI
index implies that the company engages in diversification and focuses on both interest
and non-interest income.
1.1.2 Financial Performance
This is defined by Almajali, Alamro and Al-Soub (2012) as a firm’s ability to achieve
the range of set financial goals such as profitability. FP is a degree of the extent to
which a firm’s financial benchmarks has been achieved or surpassed. It shows the
extent at which financial objectives are being accomplished. As outlined by Baba and
Nasieku (2016) FP show how a company utilizes assets in the generation of revenues
and thus it gives direction to the stakeholder in their decision making. Nzuve (2016)

4
asserts that the health of the bank industry largely depends on their FP which is used
to indicate the strengths and weaknesses of individual banks. Moreover, the
government and regulatory agencies are interested on how banks perform for the
regulation purposes.
The focus of FP is majorly on items that directly alter the statements of finance or the
firm’s reports (Omondi & Muturi, 2013). The firm’s performance is the main external
parties’ tool of appraisal (Bonn, 2000). Hence this explains why firm’s performance is
used as the gauge. The attainment level of the objectives of the firm describes its
performance. The results obtained from achieving objectives of a firm both internal
and external, is the FP (Lin, 2008). Several names are given to performance, including
growth, competitiveness and survival (Nyamita, 2014).
Measurement of FP can be done using a number of ratios, for instance, Net Interest
Margin (NIM) and Return on Assets (ROA). This is a measure that shows the
capability of the bank to make use of the available assets to make profits (Milinović,
2014). ROA is given by the quotient of operating profit and total asset ratio which is
used for calculating earnings from all company's financial resources. On the other
hand, NIM measures the spread of the paid out interest to the lenders of banks, for
instance, liability accounts, and the interest income that the banks generates in relation
to the value of their assets. Dividing the net interest income by total earnings assets
expresses the NIM variable (Crook, 2008).
1.1.3 Diversification Strategy and Financial Performance
Theories, for example the modern portfolio theory, the agency theory and the resource
based theory suggest that diversification has a close relation to the FP of the
diversifying institution. The modern portfolio theory suggests that diversification

5
improves returns while controlling risk (Brealey, Myers, & Allen, 2013). The agency
theory confirms the existence of a relation between performance and diversification
that depends on the principal-agent relationship in the organization (Jensen &
Meckling, 1976).
According to Perez (2015), the effect that income diversification has on FP remains
theoretical and has varying conclusions thereby resulting in scholarly debate. Perez
(2015) infers that those commercial banks which do have higher trading assets
proportion have with them higher risks. A similar argument is shared by Lins and
Servaes (2002) who assert that firms which have more diversified assets tend to have
less profit than focus firms. Muñoz and Sanchez (2011), while studying geographical
diversification, assert that a negative link exists between firm profitability and its
expansion for a greater geographical reach.
On the other hand, Ishak and Napier (2006) argue that diversification does not reduce
firm value, but rather, increases its value. Fama (1992) acknowledge that the
incremental revenues as a result of diversification are higher for less-capital stocks
compared to other asset forms. This is because small-cap stocks experience volatility
in their returns and their risk is easily diversified away, as they have low correlations
with other assets. Similar views were echoed by Chakrabarti et al., (2007) who stated
that diversification improves performance in an environment that is developing.
However, they note that diversification is associated with negative performance in
highly developed institutional environments. Matsusaka (2001) argues that businesses
can undertake diversification if the benefits of pursing higher organizational exceed
the drawbacks

6
1.1.4 Deposit Taking Savings and Cooperative Societies in Kenya
The Savings and Credit Cooperative societies (SACCOs) are one of the most visible
and important societies in Kenya. They are distinct and have unique traits as
compared to other cooperatives. Their purpose is to mobilize savings and give credit
facilities of their members. Delivering savings and credit is part of financial services.
SACCOs are grouped together with financial intermediating cooperatives which are
housing cooperatives and investments (SASRA, 2018). The SACCO subsector in
Kenya is legal. They are divided into two; SACCOs that are distinguished by the
nature of deposits and savings that the SACCOs mobilize from their membership and
SACCOs that are principally defined. The first segment consists of non-deposit taking
SACCOs and the second one consist of deposit taking SACCOs. There are 176
deposit taking SACCOs in Kenya. 43 are operational in operating in Nairobi
(SASRA, 2018).
Deposit-taking SACCOs’ financial performance has been affected recently by high
competition from similar institutions in Kenya, especially commercial banks (Mugo,
Muathe & Waithaka, 2019; Odhiambo, 2019). Banks have gone to an extent of
issuing unsecured loans to their clients and non-clients, this non-price competitive
tool has posed a challenge on SACCOs’ performance, to be efficiently sound,
SACCOs have opted venturing into other investments (Munene, Ndambiri &
Wanjohi, 2019). Some of the investments SACCOs have ventured into include real
estate, fixed deposits, shares and government securities. However it is not clear which
of these diversification decisions lead to desirable financial performance of these
SACCOs hence the study.

7
1.2 Research Problem
Central in the field of finance is performance. The need to explain how two firms
operating within the same environment perform differently is a concern and several
research works in finance have been devoted towards understanding this mystery.
This led to studies which focus on various internal factors as well as external issues
thought to be the cause of differing FP. Diversification out of the traditional interest-
based activities is conducted with the aim of improving the profitability of the
deposit-taking SACCOs where returns from interest-based activities are shrinking.
According to Tregenna (2009) the FP of a firm is dependent on the market structure
and how the firm diversifies its portfolio in response to emerging market conditions.
Stiroh (2004) noted that diversification helps in lowering firms’ dependency on a
single of income thereby lowering risk adjusted returns and improving the FP.
Deposit-taking SACCOs’ inefficiency has been witnessed recently; deposit-taking
SACCOs are continually facing high competition from similar institutions in Kenya,
especially commercial banks (Mugo, Muathe & Waithaka, 2019; Odhiambo, 2019).
Banks have gone to an extent of issuing unsecured loans to their clients and non-
clients, this non-price competitive tool has posed a challenge on SACCOs’ efficiency,
to be efficiently sound, SACCOs have opted venturing into other investments
(Munene, Ndambiri & Wanjohi, 2019). However it is not clear which of these
diversification decisions lead to desirable financial performance of these SACCOs
hence the study.
In spite of the many empirical studies done in both finance and strategic management,
the has not been a consensus on how income diversification and firm performance
relate, that is if firms will do better by having a single focus or diversifying into

8
different areas. McAllister and McManus (2013) also agree that if banks diversify,
they may experience lower risks and experience reduced probability of failure; and
more so if the returns of assets have relatively low or negative co-variance. Baele,
Jonghe and Vennet (2012); Chiarozza, Milani and Salvini (2013); Smith, Staikouras,
and wood (2013) show evidence from European banks that by diversifying sources of
income, banks face increased risk-return trade-off. Shawn (2012) posits that
developing nations are characterized by fragile financial sectors, volatility in interest
rates, investments with high risks and inefficiencies in intermediary processes. The
industry is further differentiated in terms structure of ownership, financial
liberalization level and accounting treatment of several income sources.
Locally, Abubakar (2017) sought to assess the impact of diversification of income on
FP of NSE-listed commercial banks and his conclusion was that income
diversification was significantly negatively related with FP. Kitisya and Ndegwa
(2017) investigated how income diversification and the FP of Kenyan banks relate
and confirmed the existence of a substantial positive relation between the two
variables. Nduati (2019) sought to determine how revenue diversification impacts
banks’ performance in Kenya and concluded that there exist a substantial positive
relation while Kebiro (2019) argued that diversification to fixed deposits does not
significantly influence efficiency of DT-SACCOS. The lack of consensus among
previous researchers is reason enough to conduct further study. Additionally, very few
studies have been done in Kenya before on diversification and FP of deposit-taking
SACCOs which is the gap the current study seeks to fill b answering; what is the
effect of diversification on financial performance of deposit-taking SACCOs in
Nairobi County, Kenya?

9
1.3 Research Objectives
1.4 Value of the Study
Findings are critical to other researchers since they will be a reference. Scholars and
researchers will also benefit since they will be able to point out study gaps on
additional topics, as well as review empirical literature that will expand into other
areas of research.
The stakeholders of the cooperatives sector will benefit as this study will generate
vital information in management of the industry. These stakeholders include
investors, managers in the sector and the legislative authorities in the sector. The
management of deposit-taking SACCOs will derive the most out of this since it
illuminates ways in which they can utilize investment decisions as a channel to
improve financial performance in their DT-SACCOs.
The study will benefit the government and other policy makers. Inferences made will
be useful in policy and guideline formulation that will aid deposit-taking SACCOs
and other institutions in the sector to adopt diversification decisions thereby
enhancing their FP and improve sector performance

10
CHAPTER TWO: LITERATURE REVIEW
2.1 Introduction
A review of theories under which this study is grounded was presented in this section.
Additionally, prior research work done on this subject area and similar areas are also
discussed. The determinants of FP, framework showing how the study variables relate
and a literature summary will be in other sections of this chapter.
2.2 Theoretical Framework
This section reviews relevant theories that explain how diversification and FP relate.
The theoretical reviews covered are modern portfolio theory, agency theory and
resource based view theory.
2.2.1 Modern Portfolio Theory
Harry Markowitz (1952) formulated the theory during his study on portfolio mixture.
The emphasis made by the theory was on how expected returns can be maximised
through the establishment of portfolios weighed using risk levels. He concluded that
institutions can form portfolios that would generate high returns for various levels of
risk. The theory attempts to maximize profits of a specific portfolio or lower the risk
to a specific level of expected returns through the selection of proportions of different
investments (Fabozzi, Gupta, & Markowitz, 2002).
This theory identified two types of risks which investors need to be conscious of, that
is, a systematic risk and unsystematic risks. Systematic risk is inherent in the volatility
of the entire market or some part of it, while unsystematic risk is associated with the
extent to which an individual investment is volatile. Investors are therefore instructed
to combine portfolios by guaranteeing that, specific risk carried by that specific

11
investment in the portfolio is offset by a lower specific risk in another investment
(Omisore, Yusuf & Nwufo, 2012).
The MPT has drawn a lot of criticisms for its unrealistic assumptions such as the
normal distribution of risk and return. Further, though relevant, the theory has been
found to have simplistic assumptions and its financial markets model does not reflect
the real world. More recently, the underlying presuppositions of the MPT have been
mainly challenged by behavioural finance (Kahneman & Tversky, 1979). However,
the MPT is relevant to this study because it explains the motivation for diversification.
DT-SACCOs will diversify to improve their returns while minimizing risk.
Alternatively, they will only take on higher risk where there is a higher return. As a
result, the position is that diversification should lead to better FP.
2.2.2 Agency Theory
Jensen and Meckling (1976) point that there exists a relation between the principals
(shareholders) and agents whose task is managing and executing operations of the
entity. Jensen and Meckling (1976) assumptions of the agency theory propose that
there should be a separation of ownership and management but it may cause agency
problems which is the problem being faced by many modern companies.
The principal, who is responsible for transferring some decision-making power to the
agent, incurs costs of agency which arises from the divergent interests of the
shareholders’ and of company managers. They stated that agency costs is the sum of
of bonding and monitoring cost, plus residual loss. In addition to the bonding costs
incurred, a residual loss is expected since the interests of stakeholders involved are
not fully aligned. An alignment of interests takes place when objectives of agents and
of the whole entity in an organization are in harmony (Jensen & Meckling, 1976).

12
Incentives like stock options, bonuses, and profit attached pay can be utilized as the
solution for the alignment of interests of the agent and the principal’s since they have
a direct relation to how useful management decisions are to the shareholders. The
theory calls for self-interest by all the staff. It requires the agents to perform duties
whilst being mindful of principals’ requirements. Agents are directed by policies
formulated by principals, which entail the maximization of the shareholders’ value.
The benefits of diversification are variant, partly, due to the agency issues within the
banks. The managers may diversify out of their own interests and not those of the
shareholders. The employees may not effectively manage the diversification strategy
since the success of the policy may not be beneficial to them though it may maximize
the wealth to the shareholders who are the principals. As a result the relationship
between diversification and FP of a DT-SACCO will depend on the manifestation of
the agency relationships.
2.2.3 Resource Based View Theory
This approach was introduced by Wernerfelt (1984) and the presuppositions
surrounding this theory state that management makes deliberate efforts so as to
maintain a competitive edge over their competition in the market. By having an edge
over their competitors, firms have the ability to diversify their activities and infiltrate
new markets thereby diversifying their sources of revenue resulting in income
diversification.
Barney (1991) states that diversification on the basis of resource capabilities results in
economies of scope since it enables the sharing of core competences and activities
and hence it enables sustainability of competitive advantage. The distinctness of a
resource is a key ingredient for a resource bundle in sustaining a competitive edge and

13
hence diversifying income. The reasoning behind this is that if all firms have the same
resources, a strategy useful to one firm would be applicable to all the firms with the
same resources in the market hence rendering the resource based theory a key factor
in the diversification of income (Cool & Dierickx, 2002).
The resource based theory is crucial because it gives ways of improving a firm’s FP
and also gives suggestions on how to diversify by expanding resource capability to
infiltrate new markets a mechanism called the sequential entry strategy (Wernerfelt,
1984). By diversifying their resource capabilities, firms will be able to diversify their
incomes by entering into new markets. Therefore, resource positioning by firms is
beneficial in two was; by erecting barriers to entry of new firms and also aiding in the
diversification of associated activities which will be beneficial and minimizing costs
incurred by businesses and eventually lead to diversification of the income earned.
2.3 Determinants of Financial Performance
The determination of the FP of a firm can be ascertained by a number of factors; these
factors are either internal or external. Internal factors differ from one firm to the next
and are within a firm’s scope of manipulation. These consist of diversification, labor
efficiency of management, asset base, and credit portfolio, policy of interest rate,
ownership and liquidity. External factors affecting a firm’s performance are mainly
inflation, GDP, political stability and the rate of interest (Athanasoglou, Brissimis &
Delis, 2005).
2.3.1 Diversification Strategy
Diversification out of the traditional interest-based activities is conducted with the
aim of improving the profitability of the banks and SACCOs where returns from
interest-based activities are shrinking. According to Tregenna (2009) the FP of a

14
financial institution is dependent on the market structure and how the institution
diversifies its portfolio in response to emerging market conditions. Stiroh (2004)
noted that diversification helps in reducing financial institutions’ dependency on
interest income and lowering risk adjusted returns thereby improving the FP.
2.3.2 Liquidity
This is the magnitude by which an entity can fulfil outstanding debt obligations that
are due in twelve months’ time using cash or its equivalents like assets which are
short term capable of being converted in the shortest time possible. It arises from the
ability of managers to meet commitments falling due without being forced to sell-off
financial assets (Adam & Buckle, 2003).
Liargovas & Skandalis (2008) stated that firms can utilize liquid assets to finance
their operations and investments in the event that external funding is unavailable.
Firms that have higher liquidity have the ability to meet unexpected contingencies and
meet obligations falling due. Almajali et al., (2012) stated that liquidity of a firm
impacts its efficiency greatly. He therefore recommended that firms should consider
increasing current assets while lowering liabilities. However, Jovanovic (1982) stated
that high liquidity may cause more harm than good in certain instances.

15
2.3.3 Firm Size
This factor determines the degree to which legal and financial factors impact the firm.
Firm size is closely linked to capital adequacy because it is possible for larger firms to
raise massive profits. It is positively related to ROA which is an indicator that large
firms have the ability to achieve economies of scales which will loer operational costs
hence improving their performance (Amato & Burson, 2007). Magweva & Marime
(2016) stated that this factor can be linked to capital rations stating that the two have a
positive relation and suggesting that profitability improves with an increase in size.
According to Amato and Burson (2007), the size of an organization is primarily
determined by the amount of assets it owns. An argument can be made that the larger
the assets a firm owns, the more its ability to undertake many projects with greater
returns in comparison with small firms with a smaller amount of assets. Additionally,
the bigger the firm, the larger the amount of collateral that can be pledged in a move
to access credit facilities in comparison to smaller competitors (Njoroge, 2014). Lee
(2009) concluded that the amount of assets in control of a firm has an influence on the
level of profitability of the said firm from one year to the next.
2.3.4 Management Efficiency
This is a crucial internal element that is qualitative in nature and determines a firm’s
operational efficiency. Management’s ability to effectively use firm resources,
maximize financing and engage in efficient allocation of such financing are examples
of ways in which efficiency in management is ensured (Kusa & Ongore, 2013).
This is a qualitative measurement, it determines operational efficiency and can
measured by staff quality, effectiveness and efficiency of internal controls, the
organizational discipline and management systems’ effectiveness (Athanasoglou et

16
al., 2009). The management’s quality influences the level of operational expenses
which impacts the firm’s bottom line hence it substantially affects performance (Kusa
& Ongore, 2013).
2.3.5 Firm Age
Firm age is referred to by the total years of operation for a given organization. The
age of a company is deemed to open new windows of research opportunity and
diversification and firms that are more experienced about the market, with better
environmental occurrences knowledge and better performance are the older ones
(Susanto, 2016). With greater age, firms experience a financial-expansion procedure
and a change in its equity composition. As a firm grows, diversity is raised with
advancement in age, committees expand in regards to the urge for control and
specialization through its members (Matar & Eneizan, 2018).
A company’s age can be used to show the firm’s supposed stability and symbolize
some features of financial performance. Older companies are better exposed and
enjoy the advantages of studying, aren’t likely to face new market entrance challenges
thus produce remarkable output. They can similarly enjoy the advantages of
reputation growth enabling them record more revenue (Deitiana & Habibuw, 2015).
2.4 Empirical Review
Local and international studies supporting the relationship between diversification and
FP have been done, however mixed results have been reduced from the studies
2.4.1 Global Studies
Yan, Talavera and Fahretdinova (2016) made an evaluation of product diversification
bank profitability in Azerbaijan and used data for six types of loans and four types of
deposits. Results from the study showed that a negative association exists between

17
loan-based portfolio diversification profitability. Additionally, results also showed
that deposit-based diversification had a marginal substantial positive relation with
bank profitability when bank specific and economic and institutional characteristics
were considered.
Elefachew and Hrushikesava (2016) conducted another research on the effect of
diversification on Ethiopian banks’ revenues generated. Their research investigated
the impact of industrial diversification on profitability of some few banks from
Ethiopia. The data covered 6 years period from 2008/09-2013/14 for 10 private and 2
government commercial banks. Their findings showed that the banks could be said to
have diversified their loan portfolios among different industries in Ethiopia. Fixed
model was used to determine the regression and the results revealed that, industrial
diversification had a negative significant effect on both ROA and ROE.
Brahmana, Kontesa and Gilbert (2018) studied the diversification impact on
performance of banks by the use of financial reports of Malaysian banks for a period
of ten years 2005 to 2015. Particularly, non-interest income relationship with risk-
adjusted performance was studied. The fixed effect panel regression findings reveal
that diversification of income have a positive relationship on performance of bank
affirming risk reduction hypothesis and resource-based view theory. In their view,
Malaysian banks are advantaged in achieving diversification gains because of the less
integrated financial market. Besides, the emerging of Islamic banking might enhance
the performance of income diversification.
Omet (2019) examined how income diversification impacts performance of Jordanian
banks using profitability and net interest margin. Selected period of study was from
2009 to 2017 thirteen Jordanian commercial banks were examined. Bank performance

18
was given by ROA and net interest margin. In measuring the income, a variety of
measurements were used such as net commission income-total assets, proportion of
bank credit to individuals, SME sector, corporate sector to total credit, and the real
estate sector. From the statistical analysis conducted, income diversification showed a
substantial positive impact on bank profitability. However, the impact came at the
expense of expanding net interest margins.
Ferreira, Zanini and Alves (2019) investigated the effect of revenue diversification on
the risk and return of Brazilian banks’. By use of dynamic panel data generalized
method of moments, a sample was analyzed for the period 2003 to 2014. The finding
reveal that diversification into non-interest income plays a big role in the performance
of the studied banks.; Financial intermediaries activities analysis in loans operations
revealed better results compared to trading operations. This confirmed the hypotheses
proposed a general positive impact between noninterest income and return and risk
adjusted returns for the banks in the study. However, Contrary to the expectation,
noninterest income and risk for the banks studied are positively related (although not
statistically significant).
2.4.2 Local Studies
Kitisya and Ndegwa (2017) analyzed the impact diversification on Kenyan
commercial banks’ financial performance. Mixed research design was used for the
survey where quantitative and descriptive research designs were employed. The
population was the 42 Kenyan banks. Both primary and secondary data was used. The
objective was to analyze the association that exists amongst the given variables. The
study established that industry diversification meaningfully affected how the
commercial banks performed. The exact effect was however found to be generally

19
dependent on bank-size. Business diversification suggestively enhanced performance
for banks. In the medium sized banks grouping, only location diversification
influenced their association to some degree. For big banks, all the four business
diversification techniques had no impact on their financial performance. Respondents
purported that corporate diversification undeniably affected the commercial banks’
financial performance to a moderate extent.
Abubakar (2017) studied NSE listed commercial banks listed during the period 2012
to 2016 to establish how diversified income had impacted the FP of the banks. By use
of descriptive research, a statistical analysis of the listed commercial banks at NSE
was conducted. Regression model was adopted to analyze the study. Herfindahl-
Hirshman index was used to measure income diversification and three control
variables were used, namely; capital adequacy size and liquidity. The finding was that
the exist a negative relation between income diversification and FP. It also found that,
capital adequacy and size had a positive effect which was statistically significant
while liquidity had a negative impact on FP and was not statistically significant.
Philita (2018) examined effects of portfolio diversification on FP of commercial
banks in Kenya. All the 40 commercial banks registered and licensed under the
Banking Act were the target population for the study. To achieve set objective of the
study secondary data was used. The conclusion of the study was that portfolio
diversification, bank size, interest rate spread and asset quality has influence on the
FP of commercials banks in Kenya and a positive correlation exists between these
variables and FP.
Nduati (2019) sought to determine how income diversification on influences
performance Kenyan banks. 42 banks in operation in Kenya at 31st December 2018

20
were the population of the study. Secondary data was acquired for 5 years (January
2014 to December 2018) annually. Research design was descriptive cross-sectional
design whereas association between variables was determined by multiple linear
regression model. Results demonstrated that income diversification, liquidity and
bank size were positively and statistically substantial values in the study. It was
discovered that capital adequacy, management efficiency and age have a statistically
insignificant impact on financial performance of banks.
Kebiro (2019) assessed how investment decisions impact the efficiency of deposit
taking SACCOs in Nairobi. The population was the 43 DT-SACCOs in Nairobi
County. The study utilized secondary data from 2014 to 2018 (5 years) on annual
basis. A descriptive cross-sectional design together with the regression model were
used for the analysis of the variables. The results showed that investment in real
estate, investment in government securities and investment in shares produced
positive substantial values while investment in fixed deposits, liquidity, firm size and
age were found to be statistically insignificant determiners of efficiency.
2.5 Conceptual Framework
The model blow illustrated the foreseen association existing between the variables.
The predictor variables was diversification as given by Herfindahl Hirschman Index.
The control variables included liquidity given by liquid assets divided by total assets,
management efficiency given as the ratio of total revenue to total assets, firm size
given as the natural log of total assets and age of the firm measured by years of firm
existence. Performance was the response variable given by ROA.

21
Independent variables Dependent variable
Diversification
• Herfindahl Hirschman
Index
Source: Author (2020)
Figure 2.1: The Conceptual Model
2.6 Summary of the Literature Review
Several frameworks have elaborated the expected relation existing between
diversification and FP of DT-SACCOs. The theories reviewed are; modern portfolio
theory, agency theory and resource based view theory. Key influencers of FP have
been explained in this section. Several studies have been done on diversification and
FP with the findings being presented. The minimal consensus among international and
local studies on how diversification affects FP of DT-SACCOs is the reason to
conduct additional studies. Additionally, studies done before in Kenya on
diversification are few which is the gap the current study was based ans sought to
answer; what is the effect of diversification on performance of DT SACCOs in
Nairobi County?
Financial Performance
• Return on Assets
(ROA)
Control Variables
Liquidity
• Liquid assets to
deposits ratio
Firm size
• Log total assets
Management efficiency
• Total revenue to total
expenses
Firm age
• Log number of years

22
CHAPTER THREE: RESEARCH METHODOLOGY
3.1 Introduction
To ascertain how the FP of DT- SACCOs in Nairobi County is affected by
diversification, a methodology was required in outlining how the research was done.
Sections included in this chapter are; design, data collection, diagnostic tests and
analysis.
3.2 Research Design
The research utilized a descriptive cross-sectional design in determining how
diversification and FP of deposit-taking SACCOs relate. It was sufficient since the
researcher sought to describe the nature of affairs (Khan, 2008). It was also
appropriate because the nature of the phenomenon being studied and how they relate
is of major interest to the researcher. Additionally, a descriptive research validly and
accurately represented the variables that aided in providing a response to the query
(Cooper & Schindler, 2008).
3.3 Population
This is the totality of observations of interest from a collection such as persons or
events as specified by a research investigator (Burns & Burns, 2008). This study’s
population comprised of the 43 DT SACCOs in Nairobi County as at 31st December
2019. Since the population was relatively small, a census of the 43 deposit taking
SACCOS was performed (see appendix I).
3.4 Data Collection
This study relied on secondary data. The source of the data was the published annual
financial reports by the deposit taking SACCOs between 2015 and 2019 and recorded

23
in a collection schedule. SASRA and individual deposit taking SACCOs annual
reports were used to derive the data. This resulted in annual information concerning
the predictor and the response variable for the 43 DT SACCOs in Nairobi. The
specific data collected included net interest income, non-interest income and total
income for diversification, net income and average total assets for financial
performance, liquid assets and total assets for liquidity, total revenue and total assets
for management efficiency, total assets for firm size and number of years in existence
for age of the deposit taking SACCO.
3.5 Diagnostic Tests
To determine the viability of the study model, the researcher carried out several
diagnostic tests, which included normality test, stationarity test, test for
multicolinearity, test for homogeneity of variances and the autocorrelation test.
Normality tests the presumption that the residual of the response variable have a
normal distribution around the mean. The test for normality was done by the Shapiro-
wilk test or Kolmogorov-Smirnov test. In the case where one of the variables is not
normally distributed it was transformed and standardized using the logarithmic
transformation method. Stationarity test was used to assess whether statistical
properties like mean, variance and autocorrelation structure vary with time and was
given by augmented Dickey Fuller test. In case, the data fails the assumption of
stationarity, the study used robust standard errors in the model (Khan, 2008).
Autocorrelation measures how similar a certain time series is in comparison to a
lagged value of the time series in between successive intervals of time. This was
measured by the Durbin-Watson statistic and incase the assumption is violated the
study employed robust standard errors in the model. Multicollinearity occurs when an

24
exact or near exact relation that is linear is observed between two or several predictor
variables. Variance Inflation Factors (VIF) and tolerance levels were employed. Any
multicolinear variable was dropped from the study and a new measure selected and
substituted with the variable which exhibits co-linearity. Heteroskedasticity tests if the
variance of the errors from a regression is reliant on the independent variables. The
study assessed for heteroskedasticity using the Levene test and incase, the data failed
the assumption of homogeneity of variances the study used robust standard errors in
the model (Burns & Burns, 2008).
3.6 Data Analysis
The study used SPSS version 23 in performing data analysis. Findings were then
quantitatively presented by way of graphs and tables. Descriptive statistics
summarized and explained the study variables that were observed among the banks.
3.6.1 Analytical Model
β1, β2, β3, β4, β5 =are the coefficient of the independent variables
X1 = Diversification given by HHI on an annual basis
X2 = Liquidity as given by total loans to total customer deposits ratio given
annually

25
X3 = Management efficiency given by total revenue to total expenses given
annually
X4 = Firm size given by the natural log of the total assets
X5 = Firm age given as the natural log of No. of years the deposit taking
SACCO has been in existence
ε =error term
The HHI was calculated as:
1- (SH2NET +SH2
NON)
Where:
SHNON = Proportion of net non-interest income to total net income
HHI gives the diversification of banks and DT-SACCOs from interest income to non-
interest income earning activities. HHI ranges from 0 to 1 with the highest value of 1
denoting full diversification whereas 0 denotes full concentration. This formula has
been used before by Abubakar (2017).
3.6.2 Tests of Significance
Parametric tests were done by the researcher to determine the model’s and variables’
statistical significance. The F-test assessed the model’s significance and was given by
ANOVA while a t-test determined the significance of individual variables.

26
CHAPTER FOUR: DATA ANALYSIS, RESULTS AND FINDINGS
4.1 Introduction
This section presents the analysis, findings and interprets the secondary data collected
from SASRA and individual deposit taking Sacco’s financial reports. The research
studied how diversification strategy impacts performance of DT SACCOs in Kenya
and specifically those operating in Nairobi County. Independent variables included
diversification, liquidity, management efficiency, size and firm age while the
performance was the dependent variable given by ROA. Regression was adopted to
determine how the variables related in relation to the study’s objectives. ANOVA
tested the goodness of fit of the analytical model. The results were presented in tables
and figures.
4.2 Descriptive Analysis

27
Table 4.1: Descriptive Statistics
N Minimum Maximum Mean Std. Deviation
ROA 215 -.327 .365 .07535 .120471
Diversification 215 .571 1.000 .88660 .079082
Liquidity 215 .007 3.296 1.09529 .550741
Management
efficiency 215 .016 11.384 1.79839 1.435892
Firm size 215 6.072 8.730 7.77254 .576136
Firm age 215 1 100 28.12 18.662
Valid N (listwise) 215
Source: Research Findings (2020)
4.3 Diagnostic Tests
The data collected was subjected to diagnostic tests. The study presumed a 95%
confidence interval or 5% level of significance so as to make variable deductions on
the data adopted. Diagnostic tests were useful for ascertaining the falsity or truth of
the data. Therefore, the nearer to 100% the confidence interval, the more accurate the
data used is presumed to be. In this case, the tests conducted were normality test,
Multicollinearity test, heteroskedasticity tests and autocorrelation.
4.3.1 Normality Test
The normality test of the data was done using the Kolmogorov-Smirnov test. The
threshold was 0.05. A probability greater than this meant that data had a normal
distribution.
Table 4.2: Normality Test
Kolmogorov-Smirnova
Statistic df Sig.
ROA 0.486 215 0.234
Diversification 0.326 215 0.112
Liquidity 0.408 215 0.207
Management efficiency 0.394 215 0.179
Firm size 0.272 215 0.063
Age 0.124 215 0.057
Source: Research Findings (2020)

28
The findings above indicated that data was normality distributed since the p values
were greater than 0.05. Therefore, the null hypothesis of normal distribution was
accepted meaning the researcher failed to reject the null hypotheses.
4.3.2 Multicollinearity Test
William et al. (2013), defined this property as the existence of correlations among
predictor variables. VIF tested this property. Field (2009) noted that VIF values above
10 indicate the presence of this property.
Table 4.3: Multicollinearity Test
Variable VIF 1/VIF
Diversification 1.30 0.771
Liquidity 1.27 0.785
Management efficiency 1.02 0.978
Firm size 1.20 0.833
Firm age 1.32 0.758
Source: Research Findings (2020)
The results in Table 4.3 illustrates the results of the VIF test which were found to be
lower than 10 and therefore according to Field (2009) multicollinearity does not exist.
4.3.3 Heteroskedasticity Test

29
Table 4.4: Heteroskedasticity Test
4.3.4 Autocorrelation Test
T
able 4.5: Autocorrelation Test
4.5 Correlation Analysis
This is critical in the establishment of a relation between two variables that lies
between a perfect positive and strong negative correlation. Pearson correlation was
useful to this end in determining the relation between performance of DT-SACCOs
and the independent variables for this study (diversification, age, management
efficiency, firm size and liquidity).
A weak positive correlation (r = .114, p = .095) was found between diversification
and performance. The research also found a substantial positive correlation between

30
liquidity and performance of DT-SACCOs as evidenced by (r = .654, p = .000). Firm
size had a weak positive relationship with performance as shown by (r = .249, p =
.000). Management efficiency and age of the firm were found to have an insignificant
positive association with performance of DT-SACCOs in Nairobi County, as
evidenced by p values greater than 0.05.
Table 4.6: Correlation Analysis
RO
A
Diversificatio
n
Liquidit
y
Managemen
t efficiency
Fir
m
size
Fir
m
age
ROA
1
Sig. (2-
tailed)
Diversificatio
n
Pearson
.11
4 1
Sig. (2-
tailed)
.09
5
Liquidity
Pearson
Correlation
.65
4** .108 1
Sig. (2-
tailed)
.00
0 .113
Management
efficiency
Pearson
Correlation
.11
2 .088 .011 1
Sig. (2-
tailed)
.10
3 .199 .872
Firm size
Pearson
Correlation
.24
9** .036 .388** .057 1
Sig. (2-
tailed)
.00
0 .599 .000 .409
Firm age
Pearson
Correlation
.04
5 .041 .084 .057 .060 1
Sig. (2-
tailed)
.50
9 .546 .219 .404 .384
4.6 Regression Analysis
Performance was regressed against five variables; diversification, age, management
efficiency, firm size and liquidity. The regression was performed at 5% significance.
The summary statistics are illustrated in table 4.7 below.

31
Table 4.7: Model Summary
Source: Research Findings (2020)
The coefficient of determination which showed deviations in the variable caused by
changes in the predictor variables gave a value of 0.455, which meant that 45.5
percent changes in performance of DT-SACCOs, results from changes in
diversification, management efficiency, age, firm size and liquidity. Additional
variables outside the model justify for 54.5 percent changes in performance of DT-
SACCOs. Also, the outcomes show a strong relation between independent variables
and performance given by the correlation coefficient (R) equal to 0.674.
ANOVA was conducted to establish significance of the model. The significance value
obtained is 0.000 that is lower than p=0.05. Implying that it was significant in
explaining how diversification, age, firm size and liquidity affect financial
performance of DT-SACCOs
Table 4.8: Analysis of Variance
32
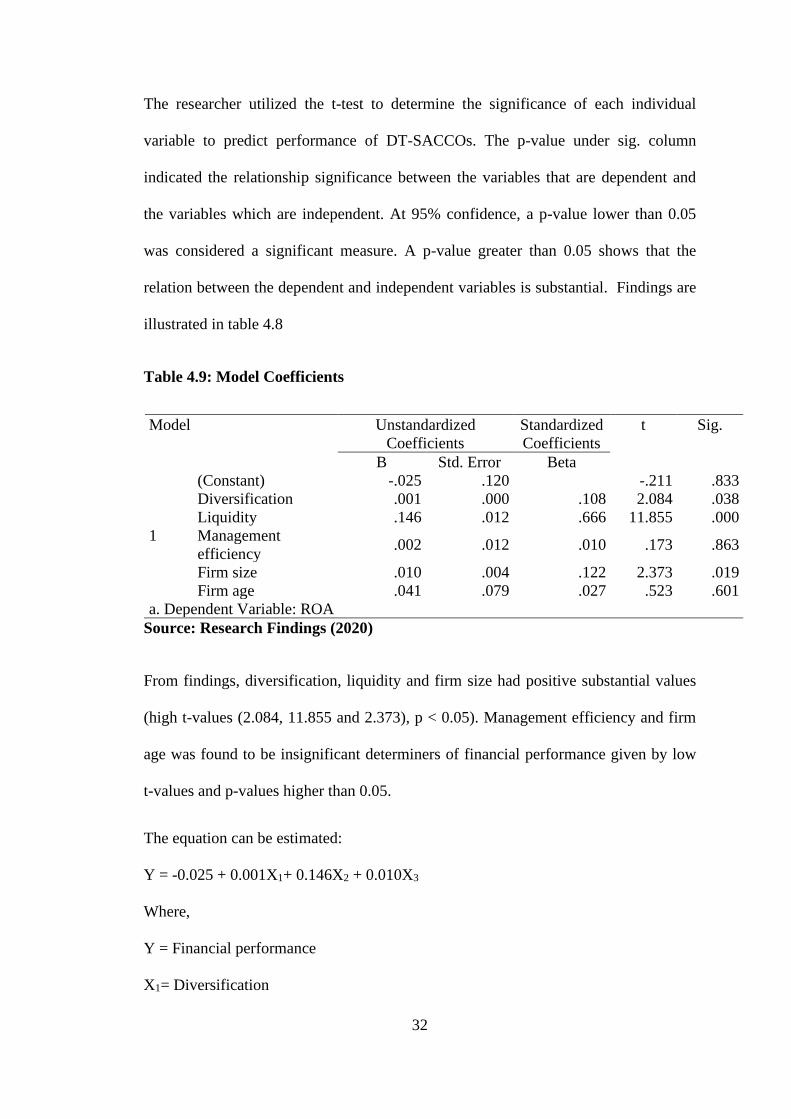
The researcher utilized the t-test to determine the significance of each individual
variable to predict performance of DT-SACCOs. The p-value under sig. column
indicated the relationship significance between the variables that are dependent and
the variables which are independent. At 95% confidence, a p-value lower than 0.05
was considered a significant measure. A p-value greater than 0.05 shows that the
relation between the dependent and independent variables is substantial. Findings are
illustrated in table 4.8
Table 4.9: Model Coefficients
Model Unstandardized
Coefficients
Standardized
Coefficients
t Sig.
B Std. Error Beta
1
(Constant) -.025 .120 -.211 .833
Diversification .001 .000 .108 2.084 .038
Liquidity .146 .012 .666 11.855 .000
Management
efficiency .002 .012 .010 .173 .863
Firm size .010 .004 .122 2.373 .019
Firm age .041 .079 .027 .523 .601
a. Dependent Variable: ROA
Source: Research Findings (2020)
From findings, diversification, liquidity and firm size had positive substantial values
(high t-values (2.084, 11.855 and 2.373), p < 0.05). Management efficiency and firm
age was found to be insignificant determiners of financial performance given by low
t-values and p-values higher than 0.05.
The equation can be estimated:
Y = -0.025 + 0.001X1+ 0.146X2 + 0.010X3
Where,
Y = Financial performance
X1= Diversification

33
X2 = Liquidity
X3 = Firm size
From the model, the constant = -0.025 means that if the independent variables had a
zero value, performance of DT-SACCOs would be -0.025. An increase in
diversification by one unit would increase performance of DT-SACCOs by 0.001
while an increase in firm size by a unit would increase performance of DT-SACCOs
in Nairobi by 0.010. Increasing liquidity by 1 unit would increase performance of
DT-SACCOs by 0.146.
4.7 Discussion of Research Findings
The research pursued in finding out how diversification impacts performance of DT-
SACCOs in Nairobi. Diversification as measured by HHI, management efficiency
given by total revenue to total assets, age given by the natural log of the years a firm
has existed, size of firm given by natural log of total assets, and liquidity given by
current ratio while performance given by ROA was the explained variable. Effect of
every independent variable on the dependent was measured in on strength and
direction.
The Pearson correlation coefficients showed a weak positive correlation exists
between diversification and performance of DT-SACCOs in Nairobi. The study also
showed existence of a substantial positive relationship between size of firm and
financial performance whereas liquidity was established to have a substantial positive
relation with performance which is significant. The association between management
efficiency and firm age with performance was weak, insignificant and positive.
The model summary showed that independent variables: diversification, management
efficiency, firm age, firm size and liquidity explains 45.5% variations in the dependent

34
variable shown by the performance of R2 implying that there exists other factors
outside the model are responsible for 54.5% variations in performance of DT-
SACCOs. The model was sufficient at 95% confidence with a p-value lower than
0.05. This indicated that the mdel is significant statistically, and it is appropriate
forecast model for enlightening how the independent variables selected impact of
performance of DT-SACCOs in Nairobi.
The findings of this research are in resemblance with a study done by Omet (2019)
who examined Jordanian banks and studied how diversification of income impacts
their performance. The study was done from 2009 to 2017 using thirteen Jordanian
banks, in which an estimation of econometric models were made using Seemingly
The study also agrees with Brahmana, Kontesa and Gilbert (2018) who studied the
diversification impact on performance of banks by the use of financial reports of
Malaysian banks for a period of ten years 2005 to 2015. Particularly, non-interest
income relationship with risk-adjusted performance was studied. The fixed effect
panel regression findings reveal that diversification of income have a positive
relationship on performance of bank affirming risk reduction hypothesis and resource-
based view theory. In their view, Malaysian banks are advantaged in achieving
diversification gains because of the less integrated financial market. Besides, the
emerging of Islamic banking might enhance the performance of income

35
diversification.
The study also concurs with Omet (2019) who examined how income diversification
impacts performance of Jordanian banks. Selected period of study was from 2009 to
2017 thirteen Jordanian commercial banks were examined. Bank performance was
given by ROA. In measuring the income, a variety of measurements were used such
.

36
CHAPTER FIVE: SUMMARY, CONCLUSION AND
RECOMMENDATIONS
5.1 Introduction
The aim of this section is to provide a summary of the findings from the prior chapter,
conclusion, and limitations faced. It also highlights the recommendations in terms of
policy that will be useful to policy makers in enhancing financial performance of DT-
SACCOs in Nairobi County. Lastly suggestions for additional future studies will be
made.
5.2 Summary of Findings
The study investigated the effect of diversification strategy on financial performance
of DT-SACCOs. Independent variables included diversification, management
efficiency, age, firm size and liquidity. A descriptive cross-sectional design was
useful to this end. Secondary data from SASRA was collected and analyzed using
SPSS version 23. Annual data for 43 DT-SACCOs in Nairobi for a five year period
from January 2015 to December 2019 was used.
From the correlation, a weak positive association exists between diversification and
performance of DT-SACCOs in Nairobi County. The study also showed a
statistically substantial positive relationship between size of firm and performance
whereas liquidity was established to have a strong positive relationship with financial
performance that is significant. The association between management efficiency and
firm age with financial performance was weak, substantial and positive.
The R-square value was 0.455 which implied that the predictor variables chosen
explain 45.5% variations in dependent variable. This meant that other factors outside
the model explain 54.5% of changes in financial performance of DT-SACCOs. The

37
model was appropriate at 95% confidence since the p-value of 0.000 was lower than
0.05. This affirms that the regression model is substantial, since it clarifies how the
independent variables selected impacts performance of DT-SACCOs in Nairobi
County.
The regression indicates that when all independent variables have zero value,
financial performance of DT-SACCOs in Nairobi would be -0.025. An increase in
diversification by one unit would increase performance of DT-SACCOs in Nairobi
County by 0.001 while an increase in firm size by a unit would increase performance
of DT-SACCOs in Nairobi by 0.010. An increase in liquidity by 1 unit would increase
performance of DT-SACCOs in Nairobi by 0.146.
5.3 Conclusion
Through the findings, the research concludes that performance of DT-SACCOs in
Nairobi County, is impacted upon by diversification, liquidity and size of the firms.
Diversification had a positive substantial effect on performance of DT-SACCOs in
Nairobi. The research therefore concludes that diversification by DT-SACCOs in
Nairobi County, leads to an increase in firm performance. Size of firm had a positive
significant effect on financial performance and therefore it is concluded by increasing
firm assets, an increase in firm performance is observed. Liquidity had a substantial
positive effect on performance and so it can be concluded that an increase in liquidity
increases financial performance of a firm. Management efficiency and age of a firm
was observed to have a positive but weak effect on performance of DT-SACCOs in
Nairobi County and therefore this study concludes that management efficiency and
age of a firm does not significantly influence financial performance of DT-SACCOs
in Nairobi County.

38
The conclusion is that independent variables; diversification, management efficiency,
age, firm size and liquidity impact performance of DT-SACCOs in Nairobi County. It
can hence be concluded that these variables substantially impact performance given
by p value in ANOVA summary. Because 45.5% variations in performance are
attributed to the independent variables, 54.5% of changes in performance are caused
by other factors outside the model.
The findings of the current study agree with Nduati (2019) who sought to determine
how income diversification on influences financial performance of banks in Kenya.
42 banks in operation in Kenya as at 31st December 2018 were the population of the
study. Secondary data was acquired for 5 years (January 2014 to December 2018)
annually. Research design was descriptive cross-sectional design whereas association
between variables was determined by multiple linear regression model. Results
demonstrated that income diversification, liquidity and bank size were positively and
statistically substantial values in the study. The study discovered that capital
adequacy, management efficiency and age have a weak impact on performance of
banks.
5.4 Recommendations
The study found a positive impact of diversification on financial performance of DT-
SACCOs. It is recommended that policy makers should prioritize diversification when
crafting policies to enhance FP. It can also be recommended to DT-SACCOs in
Nairobi County, Kenya and their boards that investing in non-interest income such as
real estate should be considered when carrying out strategic management practices to
boost performance.

39
The study revealed a positive relation between performance of DT-SACCOs in
Nairobi County, Kenya and firm size. This study recommends that DT-SACCOs
management should increase their asset base by formulating policies that will enlarge
the firms’ assets as this will directly impact performance of the DT-SACCOs. From
findings, firms with a bigger asset base can perform better than smaller ones hence
firms should increase their assets.
Liquidity of a DT-SACCO in Nairobi County, Kenya also had a significant positive
impact on performance and implying that the more liquid a firm is, the better the
financial performance. A thorough assessment of DT-SACCOs’ liquidity should be
done to ensure the DT-SACCOs operate at appropriate liquidity levels that will
improve performance. This is critical since it impacts an entity’s current operations.
5.5 Limitations of the Study
The research scope was five years, 2015-2019. This is not proof that similar results
will be found with a longer study period. Additionally it is not certain that the same
findings will hold beyond 2019. A longer period would be more reliable since it will
consider major events not catered for in this study.
One of these study limitations is data quality. It cannot be ascertained from the
investigation whether findings show accurate facts from the situation. An assumption
is made that the data is accurate. The measurements may change from a year to the
next based on current conditions. The research used secondary data, which was in the
public domain had already been obtained, unlike the first-hand information associated
with primary data. The study considered selected determinants and not every factor
that determines performance of DT-SACCOs in Nairobi County, primarily due to
unavailable data.

40
For analyzing the data, the regression model was used. Because of the limitations of
the model like erroneous and misleading results when performance changes, it is
impossible for the researcher to generalize the findings with certainty. With the
addition of more data in the model, the expected relation between the variables may
fail to hold.
5.6 Suggestions for Further Research
This study concentrated on diversification and performance of DT-SACCOs in
Nairobi and utilized secondary data. A study that takes into account all the DT-
SACCOs in Kenya or other non-deposit taking SACCOs using primary data need to
be carried out to on firm or disapprove the findings.
The study did not exhaust all the independent variables influencing of performance of
DT-SACCOs in Nairobi County, Kenya and a recommendation is given that more
variables like capital adequacy, growth opportunities, corporate governance, industry
practices, and other macro-economic variables. Establishing how every variable
impacts performance of DT-SACCOs in Nairobi County, Kenya will enable policy
formulators know the tools that maximize shareholder wealth.
The study only focused on the latest five years because it consisted of only recent
data. Additional studies may utilize a wider range which will be useful in confirming
or disapproving the results. Finally, because of the limitations of the regression
models, alternative models like the Vector Error Correction Model (VECM) can be
used in explaining the relation between variables.

41
REFERENCES

42

43

44

45

46
APPENDICES
Appendix I: Deposit-taking SACCOs in Nairobi County, Kenya

47
Appendix II: Research Data
DT-SACCO Year ROA
Diversi
fication
Liquidi
ty
Managem
ent
efficiency
Firm
size
Firm
age
AFYA
SACCO
SOCIETY
LTD 2015 0.0826 0.727 0.753
0.997 8.216 26
2016 0.1139 0.889 0.779
1.010 8.218 27
2017 0.1465 0.900 0.900
1.078 8.251 28
2018 0.1945 0.900 1.219
0.449 8.269 29
2019 0.1736 0.900 0.781
2.591 8.317 30
AIRPORTS
SACCO
SOCIETY
LTD 2015 0.2410 0.944 1.535
11.384 8.338 3
2016 0.1590 0.944 1.254
7.477 8.424 4
2017 0.0644 0.944 1.855
3.995 8.414 5
2018 0.0604 0.944 1.632
3.394 8.456 6
2019 0.0310 0.889 3.296
1.694 8.486 7
ARDHI
SACCO
SOCIETY
LTD 2015 0.0279 0.875 0.621
1.521 8.207 15
2016 0.0248 0.875 0.612
1.521 8.288 16
2017 -0.0139 0.875 1.114
1.506 8.377 19
2018 0.0019 0.875 1.036
1.562 8.425 18
2019 -0.1050 0.875 1.537
3.597 8.452 19
ASILI
SACCO
SOCIETY
LTD 2015 0.0840 0.889 1.493
4.861 7.558 54
2016 0.1331 0.714 1.101
5.024 7.620 55
2017 0.1709 0.714 0.751
3.654 7.588 56

48
DT-SACCO Year ROA
Diversi
fication
Liquidi
ty
Managem
ent
efficiency
Firm
size
Firm
age
2018 0.0574 0.714 0.879
4.945 7.565 57
2019 0.1230 0.714 1.135
2.781 7.541 58
CHAI
SACCO
SOCIETY
LTD 2015 0.0887 0.714 0.590
3.045 8.058 53
2016 0.0937 0.818 0.620
3.027 8.124 54
2017 0.0986 0.818 0.599
2.598 8.166 55
2018 0.0999 0.818 0.708
2.513 8.229 56
2019 0.1514 0.833 0.524
1.527 8.329 57
CHUNA
SACCO
SOCIETY
LTD 2015 0.0609 0.833 1.824
1.604 8.577 33
2016 0.2966 0.833 1.577
1.507 8.628 34
2017 0.2323 0.833 1.112
1.437 8.651 35
2018 0.2298 0.833 1.275
1.025 8.699 36
2019 0.1657 0.833 1.344
0.839 8.730 37
COMOCO
SACCO
SOCIETY
LTD 2015 0.0105 0.833 0.983
0.744 8.002 40
2016 0.0572 0.857 1.062
0.800 8.051 41
2017 0.0125 0.857 1.740
0.704 8.049 42
2018 0.0912 0.857 1.201
0.821 8.143 43
2019 -0.0185 0.857 0.941
1.147 8.160 44
ELIMU
SACCO
SOCIETY
LTD 2015 0.1863 0.867 1.321
1.152 7.982 18
2016 0.0950 0.867 0.760
1.249 8.026 18

49
DT-SACCO Year ROA
Diversi
fication
Liquidi
ty
Managem
ent
efficiency
Firm
size
Firm
age
2017 0.1526 0.867 0.688
1.203 8.077 20
2018 0.1072 0.875 0.992
1.701 8.189 21
2019 -0.0096 0.875 1.070
1.715 8.282 22
FUNDILIM
A SACCO
SOCIETY
LTD 2015 0.0175 0.875 0.268
1.642 8.020 21
2016 0.0041 0.875 0.349
1.700 8.044 22
2017 0.1415 0.875 0.332
1.744 7.973 23
2018 0.1548 0.875 0.266
1.185 7.974 24
2019 0.1681 0.889 0.312
1.129 7.995 25
HARAMBE
E SACCO
SOCIETY
LTD 2015 0.0296 0.889 1.118
1.461 8.188 42
2016 0.0382 0.889 1.110
3.765 8.236 43
2017 0.0419 0.889 0.990
2.261 8.271 44
2018 -0.0275 0.889 0.850
2.311 8.329 45
2019 0.0570 0.889 1.061
2.047 8.351 46
HAZINA
SACCO
SOCIETY
LTD 2015 -0.0402 0.889 0.853
2.040 8.390 44
2016 0.0415 0.889 0.936
2.061 8.480 45
2017 0.2296 0.889 0.141
0.016 8.528 46
2018 0.2144 0.889 0.104
0.134 8.572 47
2019 0.1606 0.889 1.153
0.217 8.626 48
JAMII
SACCO
SOCIETY
LTD 2015 0.1440 0.889 0.262
1.031 7.206 62

50
DT-SACCO Year ROA
Diversi
fication
Liquidi
ty
Managem
ent
efficiency
Firm
size
Firm
age
2016 0.1219 0.889 0.223
0.308 7.199 63
2017 0.0957 0.889 0.248
0.672 7.224 64
2018 0.2794 0.889 0.287
1.051 7.319 65
2019 0.2788 0.899 0.280
1.088 7.355 66
KENPIPE
SACCO
SOCIETY
LTD 2015 0.1096 0.899 0.853
1.808 7.723 25
2016 0.0593 0.899 0.936
1.827 7.677 26
2017 0.2438 0.899 1.153
1.937 7.537 27
2018 0.1236 0.899 0.599
1.976 7.499 28
2019 0.1261 0.899 0.833
1.890 7.479 29
KENVERSI
TY SACCO
SOCIETY
LTD 2015 0.1169 0.900 0.912
1.456 7.687 2
2016 0.0870 0.900 1.041
1.076 7.724 3
2017 0.0850 0.900 0.697
0.825 7.561 4
2018 0.0769 0.900 1.042
1.066 7.625 5
2019 0.0621 0.900 0.905
1.214 7.619 6
KENYA
BANKERS
SACCO
SOCIETY
LTD 2015 0.0665 0.909 0.593
1.008 8.216 23
2016 0.0515 0.909 1.153
1.202 8.218 24
2017 0.0227 0.909 0.694
0.972 8.251 25
2018 0.0227 0.909 0.715
0.809 8.269 26
2019 -0.2837 0.909 0.576
1.184 8.317 27
KENYA 2015 0.0015 0.909 1.174 7.392 23

51
DT-SACCO Year ROA
Diversi
fication
Liquidi
ty
Managem
ent
efficiency
Firm
size
Firm
age
POLICE
SACCO
SOCIETY
LTD
1.349
2016 0.0337 0.909 0.983
1.423 7.391 24
2017 -0.1402 0.909 1.327
1.148 7.427 25
2018 -0.0819 0.909 1.191
1.216 7.495 26
2019 -0.3061 0.909 1.296
1.364 7.609 27
KINGDOM
SACCO
SOCIETY
LTD 2015 0.1685 0.909 2.606
1.387 7.709 1
2016 -0.2919 0.909 1.987
1.324 7.793 2
2017 -0.2136 0.909 1.757
1.388 7.796 3
2018 -0.0041 0.909 1.574
2.000 7.809 4
2019 -0.0041 0.909 1.555
2.000 7.739 5
MAGEREZ
A SACCO
SOCIETY
LTD 2015 -0.1179 0.909 1.307
1.623 8.142 21
2016 -0.2618 0.917 1.222
1.445 8.216 22
2017 0.1030 0.917 2.680
1.107 8.248 23
2018 0.1341 0.917 2.262
1.109 8.287 24
2019 0.0918 0.917 0.631
1.088 8.293 25
MAISHA
BORA
SACCO
SOCIETY
LTD 2015 -0.0045 0.917 1.251
2.399 7.027 15
2016 0.0527 0.923 1.057
2.446 7.000 16
2017 0.0538 0.923 1.244
1.494 6.977 17
2018 0.0737 0.923 0.942 6.937 18

52
DT-SACCO Year ROA
Diversi
fication
Liquidi
ty
Managem
ent
efficiency
Firm
size
Firm
age
1.472
2019 0.0201 0.923 1.048
1.672 6.934 19
METROPOL
ITAN
NATIONAL
SACCO
SOCIETY
LTD 2015 0.0475 0.935 1.013
1.517 6.858 2
2016 0.0879 1.000 1.156
1.091 6.861 3
2017 0.1244 1.000 1.596
0.874 6.961 4
2018 0.0180 1.000 1.315
0.992 7.039 5
2019 0.0180 1.000 1.081
2.880 7.118 6
MWALIMU
NATIONAL
SACCO
SOCIETY
LTD 2015 0.1605 1.000 1.153
2.137 8.338 29
2016 0.1071 1.000 0.784
1.830 8.424 30
2017 -0.0045 1.000 1.019
1.955 8.414 31
2018 -0.0225 1.000 0.853
2.840 8.456 32
2019 0.0400 1.000 0.936
1.492 8.486 33
MWITO
SACCO
SOCIETY
LTD 2015 0.0397 1.000 1.116
1.279 8.338 42
2016 0.0421 1.000 0.007
1.256 8.424 43
2017 0.1185 1.000 1.299
1.876 6.761 44
2018 0.0468 1.000 1.110
1.959 6.794 45
2019 0.0662 1.000 0.801
1.819 8.288 46
NACICO
SACCO
SOCIETY
LTD 2015 0.1105 0.714 0.987
1.997 8.207 33

53
DT-SACCO Year ROA
Diversi
fication
Liquidi
ty
Managem
ent
efficiency
Firm
size
Firm
age
2016 0.0800 0.818 0.748
1.846 8.288 34
2017 0.0468 0.818 0.757
0.727 8.377 35
2018 0.0759 0.818 0.702
0.863 8.425 36
2019 0.2283 0.818 0.698
1.002 8.452 37
NAFAKA
SACCO
SOCIETY
LTD 2015 0.2214 1.000 0.677
1.128 8.486 8
2016 0.3650 1.000 0.992
1.051 8.338 9
2017 -0.0561 1.000 0.856
1.174 8.424 10
2018 0.0168 0.917 0.321
1.177 6.072 11
2019 0.1243 0.917 1.153
1.113 6.505 12
NATION
SACCO
SOCIETY
LTD 2015 0.1145 0.917 2.576
1.151 7.511 21
2016 0.1364 0.917 2.284
1.006 7.538 22
2017 -0.0400 0.917 0.254
1.089 7.508 23
2018 0.0199 0.917 0.226
1.078 7.640 24
2019 -0.0111 0.917 0.206
1.090 7.651 25
NSSF
SACCO
SOCIETY
LTD 2015 -0.2872 0.857 0.853
2.133 8.390 27
2016 -0.0267 0.875 0.936
1.999 8.480 28
2017 -0.0035 0.875 0.753
1.895 8.528 29
2018 -0.1599 0.875 2.074
1.840 8.572 30
2019 -0.1599 0.857 0.853
1.492 8.626 31
NYATI
SACCO 2015 -0.1966 0.875 1.327
1.279 7.673 12

54
DT-SACCO Year ROA
Diversi
fication
Liquidi
ty
Managem
ent
efficiency
Firm
size
Firm
age
SOCIETY
LTD
2016 -0.2632 0.938 1.191
1.256 7.797 13
2017 0.0323 0.938 1.296
1.457 7.617 14
2018 0.0706 0.923 2.606
1.226 7.675 15
2019 0.1038 0.938 1.987
2.443 7.686 16
SAFARICO
M SACCO
SOCIETY
LTD 2015 0.1004 0.857 1.757
2.058 7.125 5
2016 0.0773 0.929 1.153
1.743 7.092 6
2017 0.0718 0.929 1.146
1.815 7.102 7
2018 -0.0745 0.889 1.306
1.816 7.169 8
2019 0.0365 0.889 1.568
0.897 7.165 9
SHERIA
SACCO
SOCIETY
LTD 2015 0.0635 1.000 1.642
0.233 7.469 39
2016 0.0277 1.000 1.486
0.510 7.421 40
2017 -0.0882 1.000 0.912
1.251 7.434 41
2018 -0.0327 1.000 0.796
1.230 7.441 42
2019 -0.0327 1.000 0.619
1.292 7.458 43
SHIRIKA
SACCO
SOCIETY
LTD 2015 -0.2284 0.900 1.049
1.025 7.102 48
2016 -0.3270 0.900 0.796
1.271 7.097 49
2017 0.2227 0.900 0.650
1.211 7.090 50
2018 0.2210 0.900 0.685
1.028 7.118 51
2019 0.2283 0.900 0.827
1.856 7.125 52

55
DT-SACCO Year ROA
Diversi
fication
Liquidi
ty
Managem
ent
efficiency
Firm
size
Firm
age
SHOPPERS
SACCO
SOCIETY
LTD 2015 0.2175 0.800 0.621
1.588 7.198 14
2016 0.2715 0.800 1.249
1.517 7.279 15
2017 0.2842 0.800 0.998
1.827 7.338 16
2018 0.2461 0.800 1.424
1.555 7.416 17
2019 0.2692 0.800 1.520
1.557 7.426 18
STIMA
SACCO
SOCIETY
LTD 2015 0.3188 0.909 0.553
1.877 6.505 15
2016 0.3282 0.909 0.735
1.559 7.511 16
2017 0.3134 0.909 0.548
1.703 7.538 17
2018 0.0600 0.909 0.832
1.785 7.508 18
2019 0.0642 0.909 1.234
0.548 7.640 19
TAQWA
SACCO
SOCIETY
LTD 2015 0.0383 1.000 0.853
0.465 7.651 19
2016 0.0409 1.000 0.936
0.259 8.390 20
2017 0.1052 1.000 0.704
2.737 8.480 21
2018 0.1249 1.000 1.576
4.314 8.528 22
2019 0.1203 1.000 1.539
1.332 8.572 23
TEMBO
SACCO
SOCIETY
LTD 2015 0.2358 0.750 2.212
1.173 8.626 23
2016 0.1874 0.750 2.227
1.059 7.673 24
2017 0.1596 0.750 2.267
0.894 7.797 25
2018 0.1253 0.750 3.011
0.941 7.617 26

56
DT-SACCO Year ROA
Diversi
fication
Liquidi
ty
Managem
ent
efficiency
Firm
size
Firm
age
2019 0.1372 0.833 1.263
0.534 7.675 27
UFANISI
SACCO
SOCIETY
LTD 2015 0.0661 0.714 1.153
1.092 7.686 49
2016 0.0758 0.714 1.068
1.024 7.125 50
2017 0.0722 0.818 0.722
1.035 7.092 51
2018 0.0795 0.818 0.520
1.126 7.102 52
2019 0.0795 0.818 1.152
2.223 7.169 53
UKRISTO
NA
UFANISI
WA
ANGLICAN
A SACCO
SOCIETY
LTD 2015 0.0868 0.818 0.998
2.311 7.165 96
2016 0.0940 0.800 0.828
2.120 7.469 97
2017 0.0215 0.875 0.831
1.720 7.421 98
2018 0.0961 0.875 0.625
1.737 7.434 99
2019 0.0562 0.875 0.904
0.997 7.441 100
UKULIMA
SACO
SOCIETY
LTD 2015 0.0812 0.875 0.695
1.010 7.458 24
2016 0.0910 0.875 0.759
1.078 7.102 25
2017 0.0507 0.571 1.151
0.449 7.097 26
2018 0.0743 0.571 0.499
2.591 7.090 27
2019 0.0581 0.571 0.616
11.384 7.118 28
UNAITAS
SACCO
SOCIETY
LTD 2015 0.0650 0.571 0.918
7.477 7.125 23

57
DT-SACCO Year ROA
Diversi
fication
Liquidi
ty
Managem
ent
efficiency
Firm
size
Firm
age
2016 0.0540 0.714 1.343
3.995 7.198 24
2017 0.0468 0.889 1.610
3.394 7.279 25
2018 0.0138 0.889 1.804
1.694 7.338 26
2019 0.0138 0.889 1.646
1.521 7.416 27
UNITED
NATIONS
SACCO
SOCIETY
LTD 2015 0.3482 0.889 1.357
1.521 7.426 5
2016 0.2536 0.889 0.588
1.506 8.216 6
2017 0.0833 0.889 1.054
1.562 8.248 7
2018 0.0851 0.889 1.592
3.597 8.287 8
2019 0.0991 0.889 2.182
4.861 8.293 9
USHIRIKA
SACCO
SOCIETY
LTD 2015 0.2214 0.941 1.610
5.024 7.027 20
2016 0.3650 0.933 1.804
3.654 7.000 21
2017 -0.0561 0.933 0.853
4.945 6.977 22
2018 0.0168 0.933 0.936
2.781 6.937 23
2019 0.1243 0.933 1.111
3.045 6.934 24
WANA –
ANGA
SACCO
SOCIETY
LTD 2015 0.0912 0.938 1.424
3.027 6.858 14
2016 0.1378 0.938 1.520
2.598 6.861 15
2017 0.1111 0.938 0.553
2.513 6.961 16
2018 0.0781 0.938 0.735
1.527 7.039 17
2019 0.0672 0.938 0.548
1.604 7.118 18

58
DT-SACCO Year ROA
Diversi
fication
Liquidi
ty
Managem
ent
efficiency
Firm
size
Firm
age
WANANDE
GE SACCO
SOCIETY
LTD 2015 0.0664 0.917 0.832
1.507 8.338 15
2016 0.0664 0.917 1.234
1.437 8.424 16
2017 0.0673 0.923 0.853
1.025 8.414 17
2018 0.0547 0.938 0.936
0.839 8.456 18
2019 0.0547 0.941 0.704
0.744 8.486 19
WAUMINI
SACCO
SOCIETY
LTD 2015 0.0420 0.909 1.576
0.800 8.338 19
2016 0.2936 0.909 1.539
0.704 8.424 20
2017 0.1131 0.909 2.212
0.821 6.761 21
2018 0.1881 0.909 2.227
1.147 6.794 22
2019 0.2053 0.909 2.267
1.152 8.288 23