effect of experiential marketing strategy on brand …
TRANSCRIPT

EFFECT OF EXPERIENTIAL MARKETING STRATEGY ON
BRAND EQUITY OF INFILL ACADEMY, NAIROBI COUNTY,
KENYA
BY
JULIA THITAI
UNITED STATES INTERNATIONAL UNIVERSITY – AFRICA
SUMMER 2018

EFFECT OF EXPERIENTIAL MARKETING STRATEGY ON
BRAND EQUITY OF INFILL ACADEMY, NAIROBI COUNTY,
KENYA
BY
JULIA THITAI
A Research Project Submitted to the School of Chandaria Business in
Partial Fulfillment of the Requirement for the Degree of Masters in
Business Administration. (MBA)
SUMMER 2018

i
DECLARATION
I, the undersigned, declare that this is my original work and has not been submitted to any
other college, institution or university other than the United States International
University in Nairobi for academic credit.
Signed: __________________________ Date: _____________________________
Julia Thitai (ID No.625711)
This project has been presented for examination with my approval as the appointed
supervisor.
Signed: __________________________ Date: _____________________________
Dr. Peter Kiriri
Signed: __________________________ Date: _____________________________
Dean, Chandaria School of Business

ii
COPYRIGHT
No part of this work may be reproduced, stored in a retrieval system or transmitted in any
form or by any means, electronic, mechanical, photocopying, recording or otherwise
without the express written authorization from the writer.
Julia Thitai © 2018

iii
ACKNOWLEDGEMENTS
I would like to thank the Lord God Almighty for enabling me to undertake this
remarkable learning experience. I dedicate this research proposal to my fellow students of
higher learning to uphold the power bestowed upon them and to create positive and
meaningful impact within their industry and to the community at large. I would also like
to acknowledge the support of my Professors, the Dean and institution at large for the
motivation and immense knowledge given to me. Most importantly is to acknowledge the
support of my family members Alarica Thitai, Dr. W. Thitai, Dr G. Thitai, Dr. J. Thitai,
Rahab Thitai,Julian Mucoki in encouraging me throughout this research.
iv
TABLE OF CONTENTS
DECLARATION................................................................................................................. i
COPYRIGHT ..................................................................................................................... ii
ACKNOWLEDGEMENTS ............................................................................................ iii
TABLE OF CONTENTS ................................................................................................. iv
LIST OF TABLES ........................................................................................................... vii
LIST OF FIGURES ....................................................................................................... viii
ABSTRACT ....................................................................................................................... ix
CHAPTER ONE ................................................................................................................ 1
1.0 INTRODUCTION........................................................................................................ 1
1.1 Background of the Study ............................................................................................... 1
1.2 Statement of the Problem ............................................................................................... 3
1.3 Purpose of the Study ...................................................................................................... 4
1.4 Research Questions ........................................................................................................ 4
1.5 Significance of the Study ............................................................................................... 4
1.6 Scope of the Study ......................................................................................................... 5
1.7 Definitions of Terms ...................................................................................................... 6
1.8 Chapter Summary .......................................................................................................... 6
CHAPTER TWO ............................................................................................................... 7
2.0 LITERATURE REVIEW ........................................................................................... 7
2.1 Introduction .................................................................................................................... 7
2.2 Experiential Marketing and Brand Associations ........................................................... 7
2.3 Experiential Marketing and Brand Loyalty ................................................................. 11
2.4 Experiential Marketing and Perceived Quality ............................................................ 15
2.5 Chapter Summary ........................................................................................................ 19

v
CHAPTER THREE ......................................................................................................... 20
3.0 RESEARCH METHODOLOGY ............................................................................. 20
3.1 Introduction .................................................................................................................. 20
3.2 Research Design........................................................................................................... 20
3.3 Population and Sampling Design ................................................................................. 20
3.4 Data Collection Methods ............................................................................................. 22
3.5 Research Procedures .................................................................................................... 23
3.6 Data Analysis Methods ................................................................................................ 23
3.7 Chapter Summary ........................................................................................................ 24
CHAPTER FOUR ............................................................................................................ 25
4.0 RESULTS AND FINDINGS ..................................................................................... 25
4.1 Introduction .................................................................................................................. 25
4.2 Response Rate .............................................................................................................. 25
4.3 Respondents’ Demographic Information ..................................................................... 25
4.4 Descriptive Statistics Analysis ..................................................................................... 27
4.5 Inferential Statistics Analysis ...................................................................................... 30
4.6 Chapter Summary ........................................................................................................ 34
CHAPTER FIVE ............................................................................................................. 35
5.0 DISCUSSION, CONCLUSIONS AND RECOMMENDATIONS ........................ 35
5.1 Introduction .................................................................................................................. 35
5.2 Summary ...................................................................................................................... 35
5.3 Discussion .................................................................................................................... 36
5.4 Conclusion ................................................................................................................... 41
5.5 Recommendations ........................................................................................................ 42
REFERENCES ................................................................................................................. 43

vi
APPENDICES .................................................................................................................. 50
Appendix I: Cover Letter ................................................................................................ 50
Appendix II: Questionnaire for Annual Events Participants ...................................... 51
vii
LIST OF TABLES
Table 3.1: Sampling Frame ................................................................................................20
Table 3.2: Sample Size Distribution ..................................................................................22
Table 4.1: Response Rate ...................................................................................................25
Table 4.2: Brand Associations’ Descriptive Results ..........................................................28
Table 4.3: Brand Loyalty Descriptive Results ...................................................................28
Table 4.4: Perceived Quality Descriptive Results .............................................................29
Table 4.5: Experiential Marketing Descriptive Results .....................................................30
Table 4.6: Experiential Marketing and Brand Equity Factors Correlation Coefficients ...31
Table 4.7: Influence of Experiential Marketing on Brand Association at Infill Academy 32
Table 4.8: Influence of Experiential Marketing on Brand Loyalty at Infill Academy ......33
Table 4.9: Experiential Marketing on Perceived Quality Regression Results ...................34

viii
LIST OF FIGURES
Figure 4.1: Gender Distribution of Participants .................................................................. 26
Figure 4.2: Age Distribution of Participants ....................................................................... 26
Figure 4.3: Education Levels among Participants .............................................................. 27

ix
ABSTRACT
The study examined the effect of experiential marketing strategy on brand equity of Infill
Academy, Nairobi County, Kenya. The study aimed to answer three research questions;
what was the effect of experiential marketing on brand associations? What was the effect
of experiential marketing on brand loyalty? What was the effect of experiential marketing
on perceived quality? The study adopted a descriptive research design. The target
population for the study was parents with children at Infill Academy who participated in
the annual events and school activities. The target population was 689 respondents.
Stratified random sampling technique which involved dividing the population into
different categories was distributed among a sample size of 139 respondents. A self-
structured questionnaire was used to collect data. Descriptive statistics was the first phase
of analysis for the data. The second phase of analysis involved inferential statistics which
included Pearson’s (r) correlation and linear regression analysis. A positive and
significant association was established between experiential marketing and brand
association of Infill Academy which was confirmed by linear regression which showed a
positive effect on brand association of Infill academy. A positive and significant
association was established between experiential marketing and brand loyalty of Infill
Academy which was confirmed by linear regression which showed a positive effect on
brand loyalty .Positive and significant associations were found between experiential
marketing and perceived quality of Infill Academy which was confirmed by linear
regression which showed a positive effect on brand loyalty. The findings show that
participants moderately agreed with the Infill Academy brand association; that
respondents were agreeable to the brand loyalty of Infill Academy; and that participants
were moderately agreeable to the perceived quality of Infill Academy. This means that
participants were more loyal to the Infill Academy brand equity. This finding suggests
that participants were more likely to enroll their children and recommend others to enroll
their children to Infill Academy. The study therefore concludes that experiential
marketing has an effect on brand associations of Infill Academy; that experiential
marketing has an effect on brand loyalty of Infill Academy; and that experiential
marketing has an effect on perceived quality of Infill Academy. The study recommends
for the management of Infill Academy to involve parents in school activities and events
as this increases their levels of association with the brand. The study recommends that
Infill Academy should involve and continually engage parents and other stakeholders in
decision making processes to increase the association of these parties to the academy .The
study also recommends that management of Infill Academy should continue to develop
and innovate events that promote and reinforce parents’ experiences with the academy as
this will have a positive outcome on their loyalty to the school. The study recommends
for innovative marketing experiential events such as sporting events, entertainment
events, and talent shows to enhance their brand loyalty. The study recommends that
management of Infill Academy should design and come up with innovative experiential
marketing strategies that show the distinction between the services offered by the
Academy in comparison to other players in the industry.
1
CHAPTER ONE
1.0 INTRODUCTION
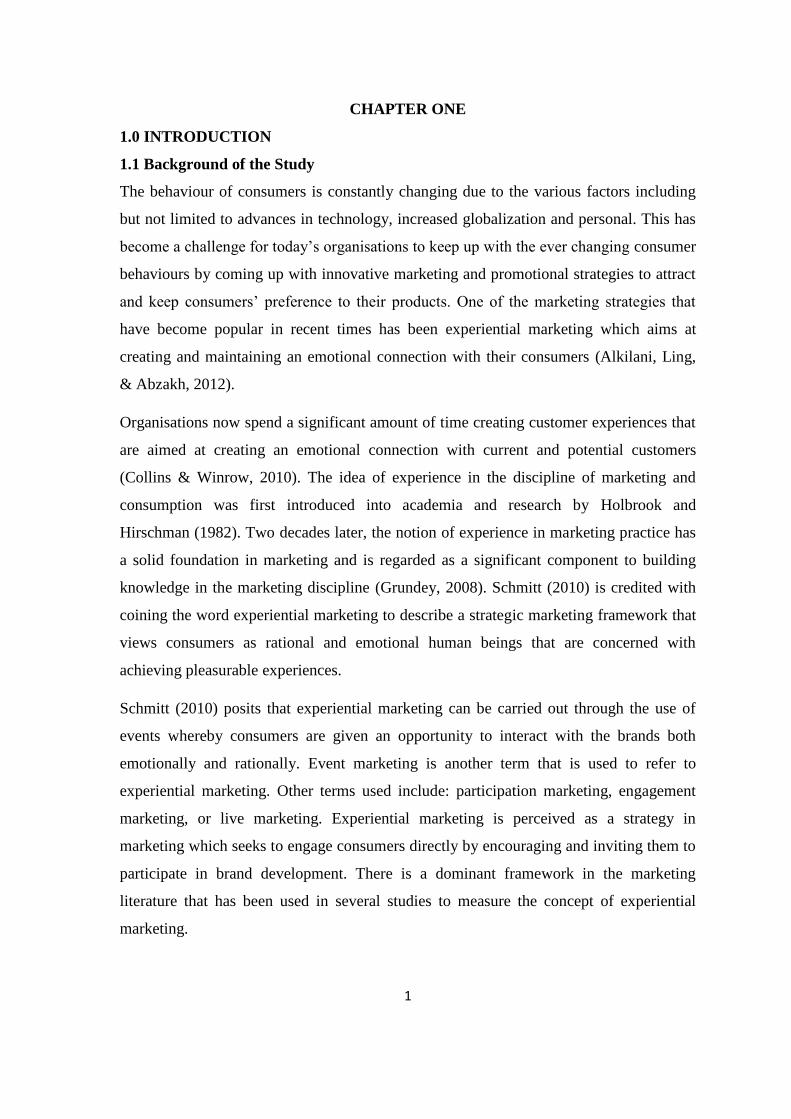
1.1 Background of the Study
The behaviour of consumers is constantly changing due to the various factors including
but not limited to advances in technology, increased globalization and personal. This has
become a challenge for today’s organisations to keep up with the ever changing consumer
behaviours by coming up with innovative marketing and promotional strategies to attract
and keep consumers’ preference to their products. One of the marketing strategies that
have become popular in recent times has been experiential marketing which aims at
creating and maintaining an emotional connection with their consumers (Alkilani, Ling,
& Abzakh, 2012).
Organisations now spend a significant amount of time creating customer experiences that
are aimed at creating an emotional connection with current and potential customers
(Collins & Winrow, 2010). The idea of experience in the discipline of marketing and
consumption was first introduced into academia and research by Holbrook and
Hirschman (1982). Two decades later, the notion of experience in marketing practice has
a solid foundation in marketing and is regarded as a significant component to building
knowledge in the marketing discipline (Grundey, 2008). Schmitt (2010) is credited with
coining the word experiential marketing to describe a strategic marketing framework that
views consumers as rational and emotional human beings that are concerned with
achieving pleasurable experiences.
Schmitt (2010) posits that experiential marketing can be carried out through the use of
events whereby consumers are given an opportunity to interact with the brands both
emotionally and rationally. Event marketing is another term that is used to refer to
experiential marketing. Other terms used include: participation marketing, engagement
marketing, or live marketing. Experiential marketing is perceived as a strategy in
marketing which seeks to engage consumers directly by encouraging and inviting them to
participate in brand development. There is a dominant framework in the marketing
literature that has been used in several studies to measure the concept of experiential
marketing.

2
The five (5) strategic dimension of experiential marketing consists of feel, relate, act,
sense, and think. These five experiential frameworks include sensory, affective, cognitive,
physical, behavior experiences, and social identity experiences (Schmitt, 2010).The study
and interest of brand equity has become highly popular as researchers have arrived to the
conclusion that brands are the most valuable asset that a firm possesses. A higher brand
equity level contributes to a higher customer purchase intentions and preferences and also
leads to higher returns in stock. Other benefits of a higher brand equity include: creation
of barriers to competitive entry, resilience against competitors promotional pressures, and
successful extensions (Chieng & Lee, 2011).
Brand equity is defined from the standpoint of consumers as the differential effect of
knowledge of a brand on the consumer’s response to the marketing of that particular
brand. There are two major viewpoints to brand equity: the first viewpoint is based on the
Consumer Based Brand Equity (CBBE) which reflects the customers’ reactions to brands.
The second viewpoint is based on the Firm-Based Brand Equity (FFBE) and involves the
financial value of a brand (Chirani, Taleghani1, & Moghadam, 2012). Brand equity is the
collection of brand liabilities and assets that are associated with a brand, its symbol, its
name which subtract or add up to the value given by a service or product to an
organisation (Aaker, 1996).
Different scholars have proposed frameworks to measure the concept of brand equity.
Keller (1993) proposed that there are three main parts in defining brand equity, these are:
differential effect, brand knowledge and the customer’s response. Aaker (1996) identified
five components of brand equity: brand awareness; brand associations; perceived quality;
brand loyalty; and other proprietary assets such as patents, trademarks, and channel
relationships. On the other hand, Chieng and Lee (2011) developed a framework to
measure brand equity which consisted of four components of brand equity derived from
earlier definitions of brand equity: brand awareness; brand associations; perceived
quality, and brand loyalty.
Scholars have investigated the link between experiential marketing and brand equity. In
The United States, Zarantonello and Schmitt (2013) explored the relationship between
brand equity and event marketing and the mediating role of brand attitudes and brand
experience and established that marketing events had an effect on brand equity both

3
indirectly and directly via brand experiences and for some event marketing via brand
attitudes.
In Malaysia, Qader and Omar (2013) found that brand experience had a positive effect on
brand equity in their study on the evolution of experiential marketing and effects of brand
experience among the millennial generation. In Taiwan, Liao, Wu, Amaya Rivas, & Ju
(2016) analysed the influences of experiential, cognitive and marketing factors on brand
personality and brand equity and found that experiential marketing factors influenced
brand equity. Mukiira, Musau and Munyao (2017) research on effect of experiential
marketing in building brand equity in Tanzania found that experiential marketing
practices have a positive effect on consumers and overall brand equity.
In January 1993, Infill Academy was started as a kindergarten at Komarock Estate,
Nairobi City County with a population of 85 pupils. This population has grown to over
600 pupils at the end of 2017 from primary and pre-primary classes. The academy offers
8-4-4 system of education and is a member of the Kenya Certificate Primary Education
(KCPE) Examination Center. In line with the ministry of education syllabus which
includes: Mathematics, Social Studies, Science, Kiswahili, and English; Infill Academy
offers other options in pursuit of enriching the lives of pupils. These include music
lessons, computer studies, and French classes (Infill Academy, 2018).
1.2 Statement of the Problem
The role of marketers is to reach out to prospects, customers, investors and/or the
community, and create an overarching image that represents your company in a positive
light-that is, your brand. Brand equity is a concept that each organisation operating in a
competitive environment should strive to achieve. Brand equity is described as the
consumers’ definition and preference for a brand in comparison with other competitive
brands. The experiential marketing approach has been opined to be a marketing strategy
that effectively contributes to brand equity and is being used today by marketers to
improve brand perceptions among consumers (Kanopaitė, 2015).The private primary
education sector in Kenya has seen tremendous growth since the inception of Free
Primary Education (FPE) in 2002. The private primary education sector has seen the rise
in the number of academies. In order to improve the association, loyalty, and perceived
quality of Infill Academy; the school’s management conducts event marketing strategy
4
through annual events to improve the school’s brand equity in the current competitive
environment to improve its position as a premier primary education academy in Nairobi
County.
There was evidence of several studies that have been conducted on experiential marketing
in Kenya. Mutua (2016) conducted a study on effect of experiential marketing on brand
perception at Coca Cola Kenya. The study aimed at establishing the influence of
experiential marketing on brand awareness, brand association, and brand loyalty. This
study was conducted among marketing employees and concluded that experiential
marketing contributed to positive attitudes towards Coca Cola brands. Kinyanjui (2016)
conducted research on the effectiveness of experiential marketing strategy on graduate
student’s retention in selected universities in Kenya. Wangui (2016) explored the
relationship between events marketing, brand orientation and performance of commercial
banks in Kenya and found that event marketing as used by commercial banks does not
significantly contribute to the performance of the banks that use it as a marketing
strategy. There is no evidence of studies that have explored the relationship between
experiential marketing and brand equity among primary education institutions a research
gap that this study filled by examining the effect of experiential marketing strategy on
brand equity of Infill Academy in Nairobi County.
1.3 Purpose of the Study
The purpose of the study was to examine the effect of experiential marketing strategy on
brand equity of Infill Academy in Nairobi County.
1.4 Research Questions
1.4.2 What is the effect of experiential marketing on brand associations?
1.4.3 What is the effect of experiential marketing on brand loyalty?
1.4.4 What is the effect of experiential marketing on perceived quality?
1.5 Significance of the Study
1.5.1 Top Management of Infill Academy
The study will lead to information on the effect of experiential marketing on brand equity
of Infill Academy and will make recommendations if adopted will lead to brand
awareness, brand associations, brand loyalty and perceived quality of services offered by
Infill academy. This study will provide management of infill academy with information

5
that will assist them to identify and implement experiential marketing strategies in the
future.
1.5.2 Private School
The findings of the study are of consequence to private schools as the recommendations
of the study if adopted can empower private schools to enhance marketing of their
institutions through innovative experiential marketing strategies which means more
enrolment in an environment which faces high competition.
1.5.3 Marketing Practitioners
This study is of importance to marketing practitioners as it explores the use of
experiential marketing in promoting brand equity for primary education institutions. Most
of the studies conducted on experiential marketing have been conducted on corporate
organisations and as far as to the researchers’ knowledge none has been done in the
context of primary education institutions. The study is of significance as it will contribute
to knowledge on experiential marketing for marketing professionals.
1.5.4 Scholars and Academia
This study will be of significance to scholars and academia as it investigates the effect of
experiential marketing on brand equity. The study will be of importance as it contributes
to the body of knowledge by building literature on experiential marketing and brand
equity in Kenya. The study is also of significance to scholars and future researchers as it
will suggest areas of further study on experiential marketing effect on brand equity.
1.6 Scope of the Study
This study limited its investigation to Infill Academy. The study collected data from
parents of Infill Academy students in Class One to Class Eight. The study limited
investigation to influence of experiential marketing on brand equity dimensions (brand
associations, brand loyalty, and perceived quality). This study targeted consumers who
are participating or have participated in experiential marketing activities through the
annual events at Infill Academy. The research relied on quantitative methods of data
collection and analysis. Specifically, the study used questionnaires to collect data from
respondents. The data for the study was collected from the month of June to July 2018.
6
1.7 Definitions of Terms
1.7.1 Experiential marketing
This refers to the creation of a memorable experience or memory that goes deep into the customer
or prospect’s minds about a product or service (Lee, Hsiao, & Yang, 2011).
1.7.2 Brand equity
This refers to the added value to a product or service by a customer’s perceptions and associations
with a specific brand name (Chieng & Lee, 2011).
1.7.3 Brand associations
This refers to the manner in which consumers think or perceive a specific service, product, or
brand when they think of an activity that is related to the product, service or brand (O’Cass &
Lim, 2001).
1.7.4 Perceived quality
This refers to the customer’s judgment over a firm’s service or product out of all the superiority or
excellence to other firms’ product or service (Saleem, Ghafar, Ibrahim, Yousuf, & Ahmed, 2015).
1.7.5 Brand loyalty
Brand loyalty refers to a consumer’s reliable repurchase of a favoured brand. Brand loyalty is a
measure of the attachment that a customer has to a brand (Nawaz & Usman, 2010).
1.8 Chapter Summary
This chapter introduced the study to the reader; it presented the background of the study,
statement of the problem, purpose of the study, research questions, and significance of the
study, scope of the study and a definitions of terms.
Chapter two of the study will present the study literature review and research methods and
techniques that the study will adopt answers to the research questions.
Chapter three of the study will present the research methods and techniques that the study will
adopt to conduct within the study.
Chapter four of the study will present the results and findings of the study in charts and tables and
researcher’s own interpretation.
Chapter five of the study will present the discussion of findings, conclusion and recommendations
for improvement and further study.

7
CHAPTER TWO
2.0 LITERATURE REVIEW
2.1 Introduction
This chapter of the study consists of a review of literature from journals, student papers,
and student research projects. The chapter contains three sections that reflect the
relationship between independent and dependent variables of the study. In each of this
sections, there are two subsections that comprise of literature on the dependent variables
and the other, presents empirical literature on the relationship between these variables.
2.2 Experiential Marketing and Brand Associations
In Ethiopia, Salelaw and Singh (2015) evaluated the effects of event sponsorship and
advertising spending on brand equity in the Ethiopian Brewery Sector. An exploratory
approach research design was adopted for the study to explore the relationship between
Consumer-Based Brand Equity (CBBE) and spending on advertising. The study was
conducted among 600 beer consumers. The study used questionnaires to collect data from
study participants. The study revealed that outdoor advertising has a positive effect on
brand associations.
In China, Xixiang, Gilal, and Gilal (2016)conducted a study on brand experience as a
source of brand equity for organisations in the 21st century. A descriptive research design
was used which involved the use of a structured questionnaire to gather data from a
sample of 135 shoppers. The data was analysed using the Structural Equation Modeling
(SEM). The results of the study revealed evidence to show a direct impact of brand
experiences on brand association which supported the theory that brand experience is
related to brand association.
Keller (2008) argues sponsorships can be adopted to develop new criteria for brand
associations. These associations may in the future create a new or changed image of a
brand. Brand associations can be created from different sources such as information
associations and sources with other bodies including events. Brand Association is
important for organizations’ competitive positioning and has also been in focus of
previous marketing communications. Thus, it may be argued that they are not transferred
8
from the event but rather that these associations are established in the minds of consumers
previous to the event (Kårhus, 2012).
Qader and Omar (2013) opined that experiential marketing is able to create brand
associations like perceptions, experiences, attitudes, beliefs, feelings, images, and
thoughts. Brand association involves depiction of image dimensions that are exclusive,
positive, and favorable to a brand. A favorable, unique, and strong brand association
creates differential effects that assist a consumer decision making and has a positive
influence on the perception of a consumer on a brand and its quality.
Brand association is something which is deeply rooted in a consumer’s mind about a
brand, therefore, before styles, promotions, advertisements, and unique selling
propositions are not sufficient to capture a special place in a customer’s mind. Therefore,
marketers should seek to associate their brands with something positive (Xixiang et al.,
2016).
2.2.1 Brand Associations
Brand association would help consumers search and deal with information (Boisvert,
2011). Brand associations can give consumers a purchasing reason as most brand
associations are linked to brand attributes, consumer benefit needs, target consumer
markets, so that they form the basis of consumers’ purchasing decisions and brand
loyalty. Therefore, brand association has a very significant role in the purchase decision
making process of a consumer (Boisvert & Burton, 2011).
Keller (1993) classifies brand associations into three distinct groups: attitudes, benefits,
and attributes. Attributes refer to the descriptive characteristics of a service or product and
are further classified into non-product and product related categories. Non-product
attributes are the outside features of a product such as usage imagery, price, and
packaging. On the other hand, product attributes, are those that necessary ingredients for
the optimum performance of the service or good sought by the user (Gordon, James, &
Yoshida, 2016).
Benefits are the personal value that a customer attaches to the service or product attributes
and are further classified into three groups: symbolic, experiential, and functional.

9
Experiential benefits are the associated feelings that come with the use of a product which
are often linked to pleasure seeking and are related to hedonic values. Functional benefits
are those that are internal advantages of a product which are related to product attributes.
Symbolic benefits are the external benefits such as prestige and social status which are
related to the service or product (Keller, 1993).
Attitudes refer to a customer’s general evaluation of a brand whether bad or good (Low &
Lamb, 2000). Attitudes are mostly recognized by their uniqueness, strength, and
favorability. Strength level is determined by extent of brand image and is sustained in the
user’s mind. Favorability defines the extent to which a product satisfies the wants and
needs of the consumer (Keller, 1993).
Personal experiences through detailed activations at the point of purchase where
teams of marketers can reach consumers easily and create individual experiences
through real interactions with the brand. Thereafter the consumer is able to relate,
or more importantly to identify with the particular brand on a personal level.
Consumers will create positive brand associations that will elicit positive responses
in them towards the brand by creating strong feelings within the consumer
(Mukiira et al., 2017).
2.2.2 Empirical Literature on Experiential Marketing and Brand Associations
In China, Liu, Zhang, and Keh (2017)investigated the link between experiential
marketing, company revenue, and brand value. The research was a comparative study
aiming to compare the differential effects of advertising expenditures and event-
marketing. A longitudinal descriptive study using a sample of 74 real-estate firms from
2006-2013 in China was used. The findings indicated that both advertising and event-
marketing had a positive impact on brand value and company revenue through increases
in brand associations with customers.
In Kenya, Mutua (2016) conducted a study on the effect of experiential marketing on
brand perception on the Coca Cola Kenya brand. An objective of the study was to
investigate the influence of experiential marketing on brand association. A cross-sectional
descriptive research design using questionnaires to collect data from Coca Cola
employees was adopted. The findings showed that use of media was one of the strategies

10
that have been used to increase the publicity of the company in experiential marketing
through celebrity promotion.
In Malaysia, Qader and Omar (2013) conducted a conceptual study on the history and
development of experiential marketing and its impact on brand experience among
millennials. The study concluded that the idea of experiential marketing in the realm of
psychology is often distinguished. Brand association like feeling, experiences,
perceptions, thoughts, attitudes, and beliefs become tied to the brand from the experiential
marketing.
In Egypt, El Naggar and Bendary (2017) analysed the effects of experience on brand
loyalty while also measuring the mediating role of brand equity dimensions. The sample
of the study consisted of subscribers of Egyptian mobile phone operators. A self-
administered questionnaire was distributed to 384 mobile users. The results did support
the direct relationship of brand experience and brand associations.
Salelaw and Singh (2015) evaluated the effects of event sponsorship and advertising
spending on brand equity in the Ethiopian Brewery Sector. An exploratory approach
research design was adopted for the study to explore the relationship between Consumer-
Based Brand Equity (CBBE) and spending on advertising. The study was conducted
among 600 beer consumers and found that outdoor advertising has a positive effect on
brand association.
In the United States, Mathews (2013) looked at experiential marketing best practice in a
sample of popular beverage firms. The research aimed to establish the use of experiential
marketing strategies among three beverage companies. The study found that the most
popular experiential marketing strategies used were: sponsorships, event marketing,
social media outlets which led to continue to growth through brand association.
Kårhus (2012) conducted a study on sponsorship as experiential marketing explored how
firms can create positive brand experiences and sponsorship responses through event
sponsorships. The responses of the sponsorships were operationalized as brand evaluation
and brand association. The results indicated that direct experience with the sponsor
creates more positive brand evaluation and higher scores on important brand associations.

11
Xixiang et al. (2016) examined conducted a study on brand experience as a source of
brand equity for organisations in the 21st century. A descriptive research design was used
which involved the use of a structured questionnaire to gather data from a sample of 135
shoppers. The data was analysed using the Structural Equation Modelling (SEM). The
sample consisted of 135 shoppers living in Wuhan and Beijing. The findings showed that
brand experience has significant positive relationship with brand association.
Lundqvist, Liljander, Gummerus, and van Rie (2014) examined the influence of
storytelling on brand experience of consumers. The study explored how organisation-
originated stories influence brand experiences of consumers by taking a comparison of
two groups of customers. One group wasn’t exposed to the story while the other was. A
brand that existed but was not launched in the country of the study was used and the
findings showed that brand stories may be useful to reinforce and create positive brand
associations.
Alberto, García, Galindo, and Suárez (2018) investigated the impact of offline and online
experiential marketing on brand equity in the hotel industry. The study examined the link
between offline experiential marketing (during guest stay) and online experiential
marketing (during the purchasing process which involved booking and information
search) with hotel brand equity. The findings showed that during the stay experiences had
an impact of brand associations unlike the non-significant relationship between online
experiential marketing and brand association.
2.3 Experiential Marketing and Brand Loyalty
Moreover, because experiences result from stimulations and lead to pleasurable
outcomes, we expect consumers to want to repeat these experiences. That is, brand
experience should affect not only past-directed satisfaction judgments but also future-
directed consumer loyalty. Consumers should be more likely to buy a brand again and
recommend it to others and less likely to buy an alternative brand (Brakus, Schmitt, &
Zhang, 2008).
12
Maheshwari, Lodorfos, and Siril (2014) conducted a study on the determinants of brand
Loyalty. The study investigated a connection between brand experience and brand loyalty
as far as automotive sector. The study was conducted among luxury car owners in Oslo
who were selected conveniently. The findings of the study confirmed that positive brand
experiences contributed to brand loyalty.The study recommended that organisations
should therefore rather focus on creating positive brand experiences for the consumer.
Pricewell, Chima, and Azubuike (2013) examined the effect of four flagship events in
Nigeria: ‘Star Quest’, ‘Guilder Ultimate Search,’ ‘Who Wants to be a Millionaire’ (TV
game show), and the ‘Next Nigerian Music Idol’ on consumers’ brand loyalty and
patronage. The study found that events create positive emotions, brand attitude, and
positive buying intentions on consumers. Consumers’ participation and active
involvement in event marketing activity positively affect their patronage of host’s brand.
Rajumesh (2014) conducted a study the impact of consumer experience on brand loyalty
in India. The study involves in selecting fast moving consumer goods category as the
sample product. The study used convenient sampling techniques to collect the data. A
total of 280 questionnaires distributed to the randomly selected participants from 232
questionnaires. Multiple regression analyses were conducted to assess each component of
the proposed mediation model. Findings show brand experience was positively associated
brand loyalty.
In Ethiopia, Salelaw and Singh (2015)Salelaw and Singh (2015) evaluated the effects of
event sponsorship and advertising spending on brand equity in the Ethiopian Brewery
Sector. An exploratory approach research design was adopted for the study to explore the
relationship between Consumer-Based Brand Equity (CBBE) and spending on
advertising. The study was conducted among 600 beer consumers. The study revealed
that outdoor advertising has a positive effect on brand loyalty.
2.3.1Brand Loyalty
Loyalty as is a deeply held commitment to rebut or repatronize a preferred
product/service consistently in the future, theory causing repetitive same-brand or same
brand-set purchasing, despite situational influences and marketing efforts having the
potential to cause switching behavior. In marketing literature the term loyalty has often
been used interchangeably with its operational (measurement) definition to refer to;

13
repeat purchase, preference, commitment and allegiance. In addition, loyalty has been
referred to in a variety of market-specific contexts: service, store and vendor loyalty, and
contexts that reflect the unit of measurement; customer and brand loyalty (Sahin, Zehir, &
Kitapç, 2011).
Loyalty means customers purchase a product or service repeatedly. Brand loyalty is the
commitment and positive attitude to purchase the same brand in a durable manner in their
future purchase situation (Liu, 2007). Aaker (1991) discussed the vital role of the brand
loyalty in the brand equity process which produces some marketing advantages such as
less marketing costs, more new customer base, and greater trade leverage. The
organizations’ success depends on its ability to attract and make loyal customer. This is to
create organization to have the ability to keep its current customers and make them loyal
to its brand for long run (Rajumesh, 2014).
Brand loyalty is the heart and the major component of brand equity and defined as the
attachment the customer has to a brand (Aaker, 1991). Developing and maintaining
loyalty should be placed at the heart of marketing plans, especially in the face of highly
competitive markets with increasing unpredictability and decreasing brand differentiation
(Delgado-Ballester & Munuera-Aleman, 2001).Brand loyalty is a sort of commitment
towards the brand that induces a re-buy behavior into the customer in spite of the
potential marketing attempts by competitors to break up the coalition between the brand
and the consumer. Brand loyalty is considered to provide greater leverage to trade,
condensed marketing costs and building an augmented market share (Awan & Rehman,
2014).
Brand loyalty is composed of two different components namely attitudinal (focusing on
personal commitment to a set of unique values related to the brand) (Chaudhuri &
Holbrook, 2001) and the tendency to be loyal to a brand (prioritizing the brand as the first
choice for purchase) (Yoo et al., 2001); and behavioral (focusing on product purchasing
repetition or repeat buying behavior) (Taylor, Celuch, & Goodwin, 2004).
2.3.2 Empirical literature on Experiential Marketing and Brand loyalty
In Indonesia, Sugiyarti and Hendar (2017) conducted a study in an effort to develop a
model of marketing conceptual on creative experiential marketing in order to boost brand
loyalty. The main objective of the study was to empirically test creative influence on
14
experiential marketing. Purposive sampling technique is applied in the study to collect
data. Samples are taken as many as 171 respondents of the users of perfume for body sold
in Indonesia. Data in this study is collected by interview. Data collection is using the
combination of open questions and closed questions which are given to respondents.
Managerial finding in this study is developing creative experiential marketing to enhance
brand loyalty.
In Kenya, Mutua (2016) conducted a study on the effect of experiential marketing on
brand perception on the Coca Cola Kenya brand. An objective of the study was to
investigate the influence of experiential marketing on brand loyalty. A cross-sectional
descriptive research design using questionnaires to collect data from Coca Cola
employees was adopted. The study found that experiential marketing events allow the
company to interact with consumers at a more personal level. The results further revealed
that the company has loyal customers and spend less on marketing their products.
In Indonesia, Dewanti, Chu, and Wibisono (2011) examined the influence of experiential
marketing, emotional branding, and brand trust towards brand loyalty. The study adopted
a descriptive research design, using questionnaires to collect data from a conveniently
selected sample of 100 restaurant customers. The findings indicated that variable
experiential marketing had a significant contribution towards variable brand loyalty.
Veasman (2015) investigated the effects of expected and unexpected experiential
marketing promotions on brand image and brand loyalty among a sample of 387
respondents. The study found that unexpected versus expected experiential marketing
techniques had a positive influence on brand loyalty.
In China, Xixiang et al. (2016) assessed brand experience as a contemporary source of
brand equity in 21st century. The study adopted a descriptive research design which used
a structured questionnaire to collect data from 135 shoppers. Structural equation modeling
was used to analyse the data. The results showed that that brand experience is positively
related to brand loyalty. The findings suggest that it is fruitful for marketers to gain brand
loyalty by creating their brands highly experiential.
Shieh and Lai (2017) study aimed to understand the contribution of the experiential
events and how they influence brand loyalty. The study applies convenient sampling
method and collects data through online questionnaire. According to Brakus, Schmitt and

15
Zarantonello (2009), definition, brand experiences are actual sensations, feelings,
cognitions, and behavioral responses. The study established that there was a positive
relationships between brand experience and brand loyalty.
In India, Rajput and Dhillon (2013) research aimed to conduct a critical study to examine
strategies and effects of sensory and experiential marketing on consumer behavior and
increasing company’s sales. The study was entirely based on secondary research, where
literature relating to the subject is reviewed. The study found that experiential marketing
is found highly effective in influencing consumer behavior for companies, particularly in
terms of realizing the target of increasing sales and achieving brand loyalty. Rajumesh
(2014) examined the impact of consumer experience on brand loyalty. The study was
conducted among 253 randomly selected participants residing in Jaffna, Sri-Lanka. The
study found that brand experience was positively associated brand loyalty.
In a study on lingerie brand experience study in the Pune market in India, Singh (2014)
conducted an empirical study was designed to test the research framework and relation of
positive brand experience on lingerie buying behavior of customers. Data was collected
through random questionnaires answered by consumers. The study was based on the
development and administration of a self-administered survey. Sample was randomly
drawn from the population of consumers who reside within the metropolitan area of Pune
and found that experiential marketing influenced brand loyalty of lingerie consumers.
Mohammad (2017) aimed to determine the effect of brand equity, brand experiences, and
corporate branding on brand loyalty. A sample of 413 staff from 10 Jordanian companies
formed the target population of the study. A structured questionnaire was used to collect
data from the participants. Brand affective experiences, brand sensory experience, and
brand cognitive experience were the brand experiences sub-variables. The findings
established that the three sub-variables had positive and significant effects on except
sensory, brand loyalty, and cognitive experiences.
2.4 Experiential Marketing and Perceived Quality
In Ethiopia, Salelaw and Singh (2015) evaluated the effects of event sponsorship and
advertising spending on brand equity in the Ethiopian Brewery Sector. An exploratory
approach research design was adopted for the study to explore the relationship between
Consumer-Based Brand Equity (CBBE) and spending on advertising. The study was
16
conducted among 600 beer consumers. The study used questionnaires to collect data from
study participants. The study revealed that outdoor advertising had a positive impact on
perceived quality.
Hendrasaputra and Lunarjanto (2009) studied the impact of popularity, brand
endorsement, and event sponsorship on pre-purchase attitudes of consumers in Jakarta.
The study aimed to measure the collective and individual effects of event sponsorship,
popularity, and brand endorsement on manufacturer esteem, uniqueness, perceived
quality, and corporate citizenship. The findings supported previous studies that have
found a positive effect of event sponsorship on perceived quality of brands.
Tsordia, Papadimitriou, & Parganadecors (2017) studied the relationship between
purchase behaviour and sport sponsorship. The aim of the study was to examine how
sport sponsorship influence purchase behaviour and brand equity of a sponsor’s product.
The sample consisted of 222 participants with Structural Equation Modelling (SEM)
techniques used to analyse the data. The findings proved that brand engagement and
perceived quality had an impact on purchase behaviour and brand loyalty of sponsors’
product.
In China, Xixiang et al. (2016) assessed brand experience as a contemporary source of
brand equity in 21st century. The study adopted a descriptive research design which used
a structured questionnaire to collect data from 135 shoppers. Structural equation modeling
was used to analyse the data. The results showed that that brand experience is positively
related to brand loyalty. The study revealed that brand experience had a significant
positive impact on perceived quality. The memorable and rich brand experience would
create long lasting impression in customers’ minds for the brands perceived quality.
2.4.1 Perceived Quality
Another significant dimension of brand equity is perceived quality. Marketers in all
product groups agree that perceived quality has a social importance to brand decisions
(Aaker, 1996). Perceived quality implies a customer’s subjective judgment over a
product’s general superiority or excellence (Zeithaml, 1988). In this case, quality is seen
as a consumer-based equity variable which combines experiences and perceptions of a
customer (Mutsikiwa, Dhliwayo, & Basera, 2013). The opinion of a consumer on the
quality of a brand and its attributes with relation to the performance expectations forms
17
the measurement scale indicators of the brand’s quality which is perceived by consumers
(Villarejo-Ramos & Sanchez-Franco, 2005).
Perceived quality refers to the consumers’ perception on the complete superiority of a
service or product in regard to its intended purpose. If customers are satisfied with the
overall quality of the product, they will be motivated to purchase products of the same
brand. Consumer perceptions vary with different product information and category,
thereby affecting perceived quality. Perceived quality is the customer’s perception of
brand superiority in performing compared to other products (Aaker, 1996).
Perceived performance is closely related to quality perception. Consequently, trial and
experience with a product does affect its overall quality assessment (El Naggar &
Bendary, 2017).Consumers’ perceived quality is often a subjective opinion of a product
and may well vary with the product attributes and categories. A higher brand awareness
contributes to a higher complete evaluation of the product and an enhanced perceived
quality. The extrinsic factors often have a huge impact on consumer’s perceived quality
and in the long term increase value (Hsu & Hsu, 2015).
There are many measurements used for perceived quality. There is the measurement that
used the five dimensions of service as tangibility, reliability, responsiveness and
assurance and empathy (Parasuraman, Zeithaml, & Berry, 1988). This measure includes
22 items. Grönroos (1995) proposed other model that included only two dimensions,
technical performance which is related to the customer’s perception of the service
delivery process and functional performance which is related to the customer perception
of the service. Gournais, Dimitriadis, & Stathakopoulos, (2003) constructed six
dimensions other than the ones previously mentioned, staff competence, service
reliability, physical evidence, convenience as of place and time, innovation and value for
money for retail banking.
2.4.2 Empirical literature on Experiential Marketing and Perceived Quality
In Ethiopia, Salelaw and Singh (2015) Salelaw and Singh (2015) evaluated the effects of
event sponsorship and advertising spending on brand equity in the Ethiopian Brewery
Sector. An exploratory approach research design was adopted for the study to explore the
relationship between Consumer-Based Brand Equity (CBBE) and spending on

18
advertising. The study was conducted among 600 beer consumers. The findings indicated
that outdoor advertising has a positive effect on perceived quality.
Several studies (Ryu and Han, 2011; Kim & Moon, 2009) have been conducted to
examine the influence of interior design and décor on the customer’s perception of overall
experience and behaviour restaurant businesses context. These studies revealed that
interior design and décor can be used as a strong marketing tool which can affect
customers’ attitude, emotions, value perceptions, perceived quality, satisfaction, and
behaviour.
Soitiriadis (2017) conducted an evaluation on the dimensions of experiential marketing
and their impact on behavioural intentions in nature-based tourism. The study used an
explanatory approach to research that measured the four dimensions’ influence on
perceived service quality, satisfaction, and behavioural intentions. The results show that
the experiential dimensions influencing perceived quality were aesthetics and escapism.
In Egypt, El Naggar and Bendary (2017) analysed the effects of experience on brand
loyalty while also measuring the mediating role of brand equity dimensions. The sample
of the study consisted of subscribers of Egyptian mobile phone operators. A self-
administered questionnaire was distributed to 384 mobile users. The results did support
the direct relationship of brand experience with brand awareness, brand associations and
perceived quality.
In Lithuania, Kanopaitė (2015) explored the effects of customer perceived values and
experiential marketing on satisfaction among a sample of Lithuanian restaurants. The
study adopted a quantitative approach to collecting data. The findings showed the sense
experience had positive effects on each variable of consumer perceived values. Moreover,
the findings indicated that there existed a two-way association between customer
perceived quality and experiential marketing
Naggar and Bendary (2017) conducted a study the factors that enhance brand loyalty in
mobile operations service in Egypt. The brand experience along with brand associations,
brand association and perceived quality were considered as antecedents in supporting the
relationship development concept that is based on trust leading to loyalty. The study was
conducted among 600 respondents selected through quota sampling by a self-

19
administered questionnaire. The results supported a direct relationship of brand
experience with perceived quality.
Kim and Moon (2009) examined the psychological processes whereby services cape
influenced perceive service quality, revisit intentions, situational factors, and pleasure-
feeling. The study aimed to answer the questions whether the services cape had an effect
on customers’ perceived service quality and pleasure-feeling and whether customers’
perceived service quality and pleasure-feeling positively influenced revisit intention. The
findings suggested that thematic restaurant’s services cape has a significant impact on
perceived quality and pleasure-feeling, which lead to revisit intentions. Evidence has
revealed that interior design and décor can be used as a strong marketing tool which can
affect customers’ perceived quality (Ryu & Han, 2010).
Yuan and Wu (2008) explored the idea of experiential marketing in the tourism and
hospitality sector in Taiwan. The study developed ten hypotheses that were used in
examining the association between customer satisfaction, experiential value, and
experiential marketing. The sample consisted of four Starbucks in Taipei and self-
administered questionnaires were used to collect the data. The findings revealed that
experiential marketing induced perceived quality through emotional and functional values
provided by feel perception, think perception, and service quality.
Wangui (2016) explored the relationship between events marketing, brand orientation and
performance of commercial banks in Kenya. The aim of the study was to establish how
the use of event marketing and branding affected the performance of commercial banks.
The study adopted a descriptive survey research design. The study targeted the 42
commercial banks. Marketing managers provided the information required through
completing a self-administered questionnaire. The results revealed that event marketing
as used by commercial banks does not significantly contribute to the performance of the
banks that use it as a marketing strategy.
2.5 Chapter Summary
This chapter presented the literature review which consisted of defining the concepts used
in the study. The chapter also consists of the empirical literature review on the
relationship between the independent and dependent variables. The next chapter of the
study presents and justifies the research methods proposed to be used in this study.

20
CHAPTER THREE
3.0 RESEARCH METHODOLOGY
3.1 Introduction
This chapter presents, discusses, and rationalizes the research techniques that the study
will employ to answer the research questions. The chapter is presented in sections of
research design population and sampling design, data collection methods, research
procedures, and data analysis methods.
3.2 Research Design
The study adopted the descriptive research design. The aim of descriptive research is to
gain familiarity with a particular subject or phenomenon (Salaria, 2012). In this study, the
researcher aimed to establish the influence of experiential marketing on brand equity.
Descriptive research can be distinguished between longitudinal survey and cross-sectional
survey designs. A cross-sectional survey design was selected for this study as the data
was collected from participants after their experience of annual events activities. The
independent variable for the study was experiential marketing and the dependent
variables were brand associations, brand loyalty, and perceived quality.
3.3 Population and Sampling Design
3.3.1 Population
De Vos (2001) defines a population as an aggregate or totality of all the objects, subjects
or members that conform to a set of specifications. The population for the study was
parents with children at Infill Academy who participated in the annual events at Infill
Academy. The target population for the study is 689 respondents as shown in Table 3.1.
Table 3.1: Population Distribution Class Number of Pupils Percentage Percentage
Kindergarten 31 4.4
Nursery 67 9.7
Pre-Unit 71 10.3
Class 1 82 11.9
Class 2 76 11.0
Class 3 61 8.9
Class 4 84 12.2
Class 5 61 8.9
Class 6 64 9.3
Class 7 45 6.5
Class 8 47 6.9
Total 689 100.0

21
Source: Infill Academy (2018)
3.3.2 Sampling Design
3.3.2.1 Sampling Frame
A sampling frame is whatever is being used to identify the elements in each sampling
unit. The sampling frame could be anything at all provided that it exhausts the total
population and provides access to the individual elements of the population under study
(Rahi, 2017). The sampling frame for the study was the total number for one parent each
for the 689 pupils at Infill Academy.
3.3.2.2 Sampling Technique
The aim of sampling is to save time and effort, but also to obtain consistent and unbiased
assessments of the population status in terms of whatever is being investigated (Salaria,
2012). The study used stratified random sampling technique which involves dividing the
population into different categories. This approach was selected owing to the nature of the
information of the population based on the number of parents in each of the classes as
shown in Table 3.1. The respondents were selected randomly from each of the classes.
3.3.2.3 Sample Size
A sample size refers to the number of units that were chosen from which data were
gathered. The Yamane (1967) sampling formula was used to calculate the sample size.
n= N
1+N (e2)
Where;
n = sample size
N = study population
e = tolerance at the preferred level of confidence
α = 0.05 at 95% confidence level
Using the formula the sample size is 253 respondents.
n = 689/ 1 + 689 (0.05)2
= 689 / 2.7225
= 253

22
The different classes have different population and it is important to select an adequate
sample from each of these strata. The study used probability proportionate sampling
(PPS) method to determine the sample size for the study for each of the strata (classes) in
the population. This meant that for each of the class sample size, the population was
divided by the total population and multiplied to the desired sample size as presented in
Table 3.2.
Table 3.2: Sample Size Distribution
Class Population Sample size
Kindergarten 31 11
Nursery 67 25
Pre-Unit 71 26
Class 1 82 30
Class 2 76 26
Class 3 61 22
Class 4 84 31
Class 5 61 22
Class 6 64 23
Class 7 45 17
Class 8 47 18
Total 689 253
3.4 Data Collection Methods
The study adopted quantitative data. Quantitative data relies on numbers in contrast to
qualitative data which relies on words and explanations. The study utilized a
questionnaire to collect the data. A structured questionnaire was appropriate for this study
as it seeks to gather information from a relatively large sample in a standardized
approach. Another advantage of using the questionnaire was the ability to gather standard
information from a sample. The questionnaire was based on a 5 point likert scale items
where respondents were asked to indicate to what extent they agree or disagree with
statements. The likert scale items were selected for the questionnaire as they have been
extensively used in previous studies on experiential marketing on brand equity.

23
The questionnaire items were borrowed from: Brand associations (Gordon et al., 2016;
Low & Lamb, 2000; Schivinski & Dabrowski, 2014), Brand loyalty (Bisschoff & Moolla,
2014; Punniyamoorthy & Raj, 2007; Schivinski & Dabrowski, 2014), perceived quality
(Yoo et al., 2000; Schivinski & Dabrowski, 2014), and experiential marketing (Maghnati,
Ling, & Nasermoadeli, 2012; Zena & Hadisumarto, 2012).
3.5 Research Procedures
Research procedures refer to the process and steps that the researcher will undertake to
conduct the fieldwork. First, the researcher sought a letter authorizing the data collection
stage of the study from the university. The researcher then conducted a pre-test of the
questionnaire among 5 persons that were not included in the final sample. The aim of a
pre-test is to measure whether a survey instrument adequately convey the intended
research questions, measure the intended attitudes, and values (Willis, 2016). The
researcher modified, edited, and formatted the instrument according to the outcome and
experience of the pre-test. Third, the researcher engaged two research persons in a two
day training session on the aim, objectives of the study, and the instrument. The fieldwork
was conducted after completion of each annual event during the prize giving ceremony.
The questionnaires were administered to willing participants who were informed on
voluntary participation, guaranteed anonymity and confidentiality of information
provided to the study.
3.6 Data Analysis Methods
Data analysis as the process of bringing order, structure and meaning to the mass of
collected data (Marshall, & Rossman, 2006). The first step of data analysis was ensuring
that the gathered questionnaires are duly filled. Data was then entered into a statistical
software for analysis. In this case, the Statistical Package for the Social Sciences (SPSS)
Version 22 was used to analyze the data. Descriptive statistics was the first phase of
analysis for the data. These analysis consisted of summarizing trends in the data based on
percentages, frequencies, mean, and standard deviation. The second phase of analysis
involved inferential statistics. Inferential statistics used were Pearson’s (r) correlation and
linear regression analysis. The data was presented in tables and figures.
24
3.7 Chapter Summary
This chapter presented the research methods that were used to conduct the study. The
sections in this chapter presented, discussed and justified the research design, population,
sampling techniques, data collection methods, research procedures, and data analysis
methods that were used. The next chapter of the study consists of the results and findings.
25
CHAPTER FOUR
4.0 RESULTS AND FINDINGS
4.1 Introduction
This chapter presents the findings of the study which are presented in charts (respondent
information) and tables (research questions). The analysis is presented in three sections,
the respondents’ demographic information, descriptive analysis of research question, and
inferential statistics of research questions. The response rate of the study is also presented
therein.
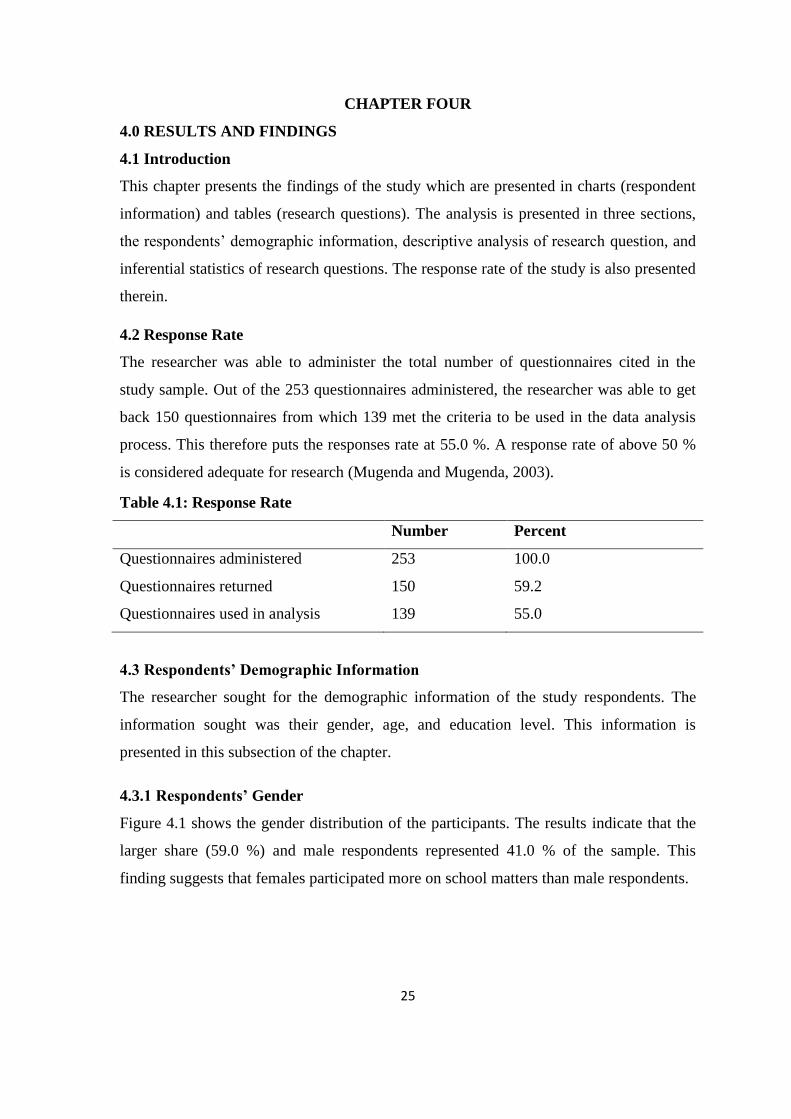
4.2 Response Rate
The researcher was able to administer the total number of questionnaires cited in the
study sample. Out of the 253 questionnaires administered, the researcher was able to get
back 150 questionnaires from which 139 met the criteria to be used in the data analysis
process. This therefore puts the responses rate at 55.0 %. A response rate of above 50 %
is considered adequate for research (Mugenda and Mugenda, 2003).
Table 4.1: Response Rate
Number Percent
Questionnaires administered 253 100.0
Questionnaires returned 150 59.2
Questionnaires used in analysis 139 55.0
4.3 Respondents’ Demographic Information
The researcher sought for the demographic information of the study respondents. The
information sought was their gender, age, and education level. This information is
presented in this subsection of the chapter.
4.3.1 Respondents’ Gender
Figure 4.1 shows the gender distribution of the participants. The results indicate that the
larger share (59.0 %) and male respondents represented 41.0 % of the sample. This
finding suggests that females participated more on school matters than male respondents.

26
Figure 4.1: Gender Distribution of Participants
4.3 2 Respondents’ Age
The findings indicate that respondents between 35-44 years accounted for 41.7 %
followed by 30.9 % who were in ages 25-34 years, 16.5 % were in the age’s group of 45-
55 years, 8.6 % were in age 18-24 years, and those above 55 years represented 2.2 % of
the sampleas shown in Figure 4.2.
Figure 4.2: Age Distribution of Participants
41.0%
59.0%
Male Female
8.6%
30.9%
41.7%
16.5%
2.2%
0.0%
5.0%
10.0%
15.0%
20.0%
25.0%
30.0%
35.0%
40.0%
45.0%
18-24 25-34 35-44 45-55 Above 55 years

27
4.3.3 Respondents’ Education Level
In terms of their education level, the findings show that most of the participants had a
college level of education (51.8 %), Bachelor’s degree (23.0 %), Postgraduate degree
(11.5 %), Vocational training (8.6 %), no formal schooling (3.6 %), and 0.7 % had
primary and secondary level of education respectively as presented in Figure 4.3.
Figure 4.3: Education Level among Participants
4.4 Descriptive Statistics Analysis
This section presents the descriptive analysis of each of the study research questions. The
mean and standard deviation for each of the variable is presented and interpreted
according to a 5 point scale (strongly disagree – strongly agree).
4.4.1 Brand Associations
The study presented ten brand associations statements on infill academy. The respondents
were asked to indicate their level of agreement with these statements. The results show
that the overall mean score was 3.89 with a standard deviation of 1.009. This suggests
that participants moderately agreed with the Infill Academy brand association. The
highest mean score was observed for I have good associations with Infill Academy
(M=4.13, SD=1.013) and the least mean score was I feel some sympathy for Infill
Academy (M=2.62, SD=1.315) as shown in Table 4.2.
0.7%3.6%
0.7%
51.8%
8.6%
23.0%
11.5%
0.0%
10.0%
20.0%
30.0%
40.0%
50.0%
60.0%
Primary school No formal schooling Secondary school
College Vovational training Bachelors degree
Postgraduate degree

28
Table 4.2: Brand Associations’ Descriptive Results
Statements N Mean Std.
Deviation
I am able to name a few characteristics of Infill Academy 139 3.71 0.965
I associate good feelings with Infill Academy 139 4.14 0.949
I feel some sympathy for Infill Academy 139 2.62 1.315
I have good associations with Infill Academy 139 4.13 1.013
I have good memories linked to Infill Academy 139 4.01 0.925
I have good memories of Infill Academy 139 4.00 0.940
I think that Infill Academy has a strong image 139 4.11 1.075
I think that Infill Academy has character 139 4.12 0.959
Somehow I feel personal affection for Infill Academy 139 3.99 0.982
The memories I have of Infill Academy influence my decision
to purchase their service
139 4.04 0.962
Overall mean score 3.89 1.009
4.4.2BrandLoyalty
The study presented ten brand loyalty statements on infill academy. The respondents were
asked to indicate their level of agreement with these statements. The results show that the
overall mean score was 4.06 with a standard deviation of 0.969. This suggests that
participants agreed with the Infill Academy brand loyalty. The highest mean score was
observed for I will continue to support Infill Academy (M=4.30, SD=0.888) and the least
mean score was If Infill Academy were to raise their prices, I would continue to buy their
services (M=3.23, SD=1.157) as shown in Table 4.3.
Table 4.3: Brand Loyalty Descriptive Results
Statements N Mean Std. Deviation
I will recommend Infill Academy someone who seeks my advice 139 4.17 0.945
I will bring my child to Infill Academy for their primary education 139 4.28 0.860
I consider myself a fan of Infill Academy 139 4.16 0.879
I am attached to Infill Academy 139 4.09 0.967
I think I am loyal to Infill Academy 139 4.20 0.949
I will continue to support Infill Academy 139 4.30 0.888
I don’t bother looking at alternative academies; Infill Academy is
good enough for me!
139 3.96 1.145
I say positive things about Infill Academy to other people 139 4.24 0.865
If Infill Academy were to raise their prices, I would continue to buy
their services
139 3.23 1.157
I consider Infill Academy is my first choice in the category of
academies
139 3.98 1.032
Overall mean score 4.06 0.969

29
4.4.3Perceived quality
The study presented ten perceived quality statements on infill academy. The respondents
were asked to indicate their level of agreement with these statements. The results show
that the overall mean score was 3.82 with a standard deviation of 0.944. This suggests
that participants moderately agreed to Infill Academy’s perceived quality. The highest
mean score observed was Infill Academy offers reliable education (M=4.21, SD=0.838)
and the least mean score was Infill Academy appears to be of very poor quality (M=2.02,
SD=1.219) as shown in Table 4.4.
Table 4.4: Perceived Quality Descriptive Results
N Mean Std.
Deviation
Infill Academy is of high quality 139 4.06 0.934
The likely quality of Infill Academy is extremely high 139 3.99 0.855
The likelihood that would be functional is very high 138 3.93 0.953
The likelihood that Infill Academy is reliable is very
high
139 3.96 0.855
Infill Academy must be of very good quality 139 3.99 0.967
Infill Academy appears to be of very poor quality 139 2.02 1.219
Infill Academy is of better quality than other
alternatives
139 3.83 0.970
Although other academies are good, I still think that
Infill Academy is better
139 4.06 0.954
Infill Academy offers good quality education 139 4.16 0.895
Overall mean score 3.82 0.944
4.4.4 Experiential Marketing
The independent variable for the study was experiential marketing. The study asked
respondents to indicate their level of agreement to annual events experience on their
brand equity perceptions of Infill Academy. The overall mean score was 5.66 and a
standard deviation of 1.312. This finding suggests that participants strongly agreed that
the participation in Infill Academy annual events had an influence on their perceptions of
the Infill Academy brand.

30
Table 4.5: Experiential Marketing Descriptive Results
N Mean Std.
Deviation
The idea of Infill Academy is refreshing 139 3.95 0.958
The concept of Infill Academy is very special 139 3.96 0.924
I am more interested in learning about Infill Academy 139 4.10 0.958
The extra-curricular activities offered make me think of
Infill Academy quality
139 3.88 0.996
The interaction with the staff makes me think more about
Infill Academy
139 4.01 0.909
I will think more of Infill Academy after this experience 139 4.07 0.882
Participating in school events makes me feel a part of
Infill Academy community
139 4.00 1.000
The information I have accessed during the annual events
makes me feel to want to know more about Infill
Academy
139 4.06 0.844
The annual activities make me feel emotional about Infill
Academy
139 3.68 1.117
The services provided by Infill Academy make me closer
to this school
139 4.04 0.912
The features of Infill Academy make me want to
associate with the school
139 3.99 0.909
I can relate with other people by participating in Infill
Academy activities
139 4.10 0.879
I will bring my other children to Infill Academy 139 4.12 0.941
I spread the word about Infill Academy 139 4.26 0.887
Overall mean score 5.66 1.312
4.5 Inferential Statistics Analysis
This subsection presents the inferential statistical analysis of the study. The researcher
conducted a Pearson (r) correlation analysis and linear regression analysis between the
independent and dependent variables.
4.5.1 Correlation Analysis
Table 4.6 shows the correlation coefficient results between the study independent and
dependent variables. The findings show positive and significant association between
experiential marketing and brand associations at infill academy (r = 0.641, p = 0.000),
experiential marketing and brand loyalty to Infill Academy (r = 0.862, p = 0.000), and
experiential marketing and perceived quality of Infill Academy (r = 0.764, p = 0.000).

31
This finding implies that an increase in experiential marketing is associated with a linear
increase in brand equity (brand associations, brand loyalty, perceived quality) of Infill
Academy.
Table 4.6:Experiential Marketing and Brand Equity Factors Correlation
Coefficients
Brand
Associations
Brand
Loyalty
Perceived
quality
Brand
Associations
Pearson Correlation 1
Sig. (2-tailed)
N 139
Brand
Loyalty
Pearson Correlation .662** 1
Sig. (2-tailed) .000
N 139 139
Perceived
quality
Pearson Correlation .491** .736** 1
Sig. (2-tailed) .000 .000
N 139 139 139
Experiential
Marketing
Pearson Correlation .641** .862** .764**
Sig. (2-tailed) .000 .000 .000
N 139 139 139
**. Correlation is significant at the 0.01 level (2-tailed).
4.5.2 Linear Regression Analysis
The study conducted a linear regression analysis for each of the research questions. This
subsection presents the findings for each of these linear regressions and the results are
summarized into one table which includes the model summary, ANOVA, and regression
coefficient results.
4.5.2.1 Experiential Marketing and Brand Association at Infill Academy
The second research question the study sought to answer was the influence of experiential
marketing on brand associations at Infill Academy. The results (Table 4.7) show that
experiential marketing influenced 41.1 % (R2= 0.411) of variation in brand association of
Infill Academy. The ANOVA results indicate that the influence of inferential marketing
to brand association was statistically significant with a p value of 0.000. The regression
coefficient result indicates that an increase in experiential marketing leads to a 0.629
increase in brand associations and this is statistically significant (p = 0.000).

32
Table 4.7: Effect of Experiential Marketing on Brand Association at Infill Academy
Model Summary
Mod
el
R R Square Adjusted R Square Std. Error of the
Estimate
1 .641a .411 .407 .54732
a. Predictors: (Constant), Experiential Marketing
ANOVAa
Model Sum of
Squares
df Mean
Square
F Sig.
1 Regression 28.690 1 28.690 95.773 .000b
Residual 41.040 137 .300
Total 69.729 138
a. Dependent Variable: Brand Associations
b. Predictors: (Constant), Experiential Marketing
Coefficientsa
Model Unstandardized
Coefficients
Standardized
Coefficients
t Sig.
B Std.
Error
Beta
1 (Constant) 1.362 .262 5.197 .000
Experiential Marketing .629 .064 .641 9.786 .000
a. Dependent Variable: BrandAssociations
4.5.2.2 Experiential Marketing and Brand Loyalty at Infill Academy
The second research question the study sought to answer was the influence of experiential
marketing on brand loyalty at Infill Academy. The results (Table 4.8) show that
experiential marketing influenced 74.3 % (R2 = 0.743) of variation in brand loyalty of
Infill Academy. The ANOVA results indicate that the influence of inferential marketing
to brand loyalty was statistically significant with a p value of 0.000. The regression
coefficient result indicates that an increase in experiential marketing leads to a 0.886
increase in brand loyalty and this is statistically significant (p = 0.000).

33
Table 4.8: Influence of Experiential Marketing on Brand Loyalty at Infill Academy
Model Summary
Mod
el
R R Square Adjusted R
Square
Std. Error of the Estimate
1 .862a .743 .741 .37946
a. Predictors: (Constant), Experiential Marketing
ANOVAa
Model Sum of
Squares
df Mean Square F Sig.
1 Regression 56.948 1 56.948 395.497 .000b
Residual 19.727 137 .144
Total 76.674 138
a. Dependent Variable: Brand Loyalty
b. Predictors: (Constant), Experiential Marketing
Coefficientsa
Model Unstandardized
Coefficients
Standardized
Coefficients
t Sig.
B Std.
Error
Beta
1 (Constant) .502 .182 2.761 .007
Experiential Marketing .886 .045 .862 19.887 .000
a. Dependent Variable: Brand Loyalty
4.5.2.3 Influence of Experiential Marketing on Perceived Quality at Infill Academy
The third research question the study sought to answer was the influence of experiential
marketing onperceived at Infill Academy. The results (Table 4.9) show that experiential
marketing influenced 58.4 % (R2 = 0.584) of variation in brand loyalty of Infill Academy.
The ANOVA results indicate that the influence of inferential marketing on perceived
quality was statistically significant with a p value of 0.000. The regression coefficient
result indicates that an increase in experiential marketing leads to a 0.672 increase in
brand loyalty and this is statistically significant (p = 0.000).

34
Table 4.9: Experiential Marketing on Perceived Quality Regression Results
Model Summary
Mod
el
R R Square Adjusted R Square Std. Error of the
Estimate
1 .764a .584 .581 .41308
a. Predictors: (Constant), Experiential Marketing
ANOVAa
Model Sum of Squares df Mean
Square
F Sig.
1 Regression 32.773 1 32.773 192.062 .000b
Residual 23.377 137 .171
Total 56.150 138
a. Dependent Variable: Perceived quality
b. Predictors: (Constant), Experiential Marketing
Coefficientsa
Model Unstandardized
Coefficients
Standardized
Coefficients
t Sig.
B Std.
Error
Beta
1 (Constant) 1.123 .198 5.675 .000
ExperientialMarketing .672 .049 .764 13.859 .000
a. Dependent Variable: Perceived quality
4.6 Chapter Summary
This chapter presented the findings of the study. The findings show positive and
statistically significant associations with experiential marketing and brand associations,
brand loyalty, perceived quality of Infill Academy. The linear regression analysis further
confirms that experiential marketing influenced infill academy brand equity (brand
associations, brand loyalty, and perceived quality. The next chapter of the study presents
the discussion, conclusions and recommendations of the study.

35
CHAPTER FIVE
5.0 DISCUSSION, CONCLUSIONS AND RECOMMENDATIONS
5.1 Introduction
This chapter presents a summary, a discussion of the study findings, conclusions of the
findings, and recommendations for improvement. These sections are presented in line
with the study research questions. Recommendations for further research are also
highlighted.
5.2 Summary
The study examined the effect of experiential marketing strategy on brand equity of Infill
Academy, Nairobi County, Kenya. The study aimed to answer three research questions;
what is the effect of experiential marketing on brand associations? What is the effect of
experiential marketing on brand loyalty? What is the effect of experiential marketing on
perceived quality? The target population for the study was parents with children at Infill
Academy who participated in the annual events. The target population was 689
respondents. Stratified random sampling technique which involved dividing the
population into different categories was distributed among a sample size of 253
respondents. The study adopted quantitative methods of data collection. A self-structured
questionnaire was used to collect data. Descriptive statistics was the first phase of
analysis for the data. The second phase of analysis involved inferential statistics which
included Pearson’s (r) correlation and linear regression analysis. The data was presented
in charts and tables and supported by the researcher’s interpretation.
Research question one of the study was to determine the effect of experiential marketing
on band association at Infill Academy. The respondents were asked to indicate their level
of agreement with ten statements associated with brand association of Infill Academy.
The results show that the overall mean score was 3.89 with a standard deviation of 1.009.
This suggests that participants moderately agreed with the Infill Academy brand
association. The correlation coefficient findings show positive and significant association
between experiential marketing and brand associations at infill academy (r = 0.641, p =
0.000). Experiential marketing explained 41.1 % of change in brand associations of Infill
Academy and an increase in experiential marketing resulted to a 0.629 increase in Infill
Academy brand associations.
36
Research question two of the study was to determine the effect of experiential marketing
on brand loyalty at Infill Academy. The respondents were asked to indicate their level of
agreement with ten statements associated with brand loyalty of Infill Academy. The
results show that the overall mean score was 4.06 with a standard deviation of 0.969. This
finding suggests that respondents agreeable to the brand loyalty of Infill Academy. The
results from the correlation analysis indicate positive and significant association between
experiential marketing and brand loyalty at infill academy (r = 0.862, p = 0.000). Linear
regression results showed that experiential marketing explained 74.3 % of change in
brand loyalty of Infill Academy and an increase in experiential marketing resulted to a
0.886 increase in Infill Academy brand loyalty.
Research question three of the study was to determine the effect of experiential marketing
on perceived at Infill Academy. The respondents were asked to indicate their level of
agreement with ten statements associated with perceived quality of Infill Academy. The
respondents were asked to indicate their level of agreement with these statements. The
results show that the overall mean score was 3.82 with a standard deviation of 0.944. The
findings implied that participants were moderately agreeable to the perceived quality of
Infill Academy. The results from the correlation analysis revealed a positive and
significant association between experiential marketing and perceived quality at infill
academy (r = 0.764, p = 0.000). The results from the linear regression indicated that
Experiential marketing explained 58.4 % of change in perceived quality of Infill
Academy and an increase in experiential marketing resulted to a 0.672increase in Infill
Academy brand associations.
5.3 Discussion
5.3.1 Effect of Experiential Marketing on Brand Associations
In terms of the relationship between experiential marketing and brand associations, the
correlation coefficients showed a positive and significant association between experiential
marketing and brand associations at infill academy (r = 0.641, p = 0.000). Experiential
marketing explained 41.1 % of change in brand associations of Infill Academy and an
increase in experiential marketing resulted to a 0.629 increase in Infill Academy brand
associations.The finding of the study indicate that respondent participation at Infill
Academy annual events contributed to association with the brand. A look at the item
37
responses show that respondents agreed to associating good feelings with Infill Academy,
that Infill Academy had a strong image, that Infill Academy has character, and memories
that participants had for Infill Academy influenced their decision to purchase their
services.
Brand association would help consumers search and deal with information (Boisvert,
2011). Brand associations can give consumers a purchasing reason as most brand
associations are linked to brand attributes, consumer benefit needs, target consumer
markets, so that they form the basis of consumers’ purchasing decisions and brand
loyalty. Therefore, brand association has a very significant role in the purchase decision
making process of a consumer (Boisvert & Burton, 2011).
This finding agrees with previous studies which have found that there exists a positive
effect of experiential marketing and brand association. According to Boisvert, (2011),
brand association would help consumers search and deal with information Brand
association would provide consumers with a purchasing reason, because most brand
associations are related to brand attributes, the target consumer market, and the benefits
that consumers need, so that they form the foundation of brand loyalty and consumers’
purchasing decisions. Consequently, brand association plays a very important role in
consumers’ purchase decision making.
Several studies have also found a relationship between brand association and experiential
marketing. Liu et al. (2017) study on event-marketing and advertising expenditures and
compared the differential effects of event-marketing and advertising expenditures on
brand value and company revenue in China found that both event-marketing had positive
impacts on company revenue and brand value by increasing brand associations with
consumers. Kårhus (2012) conducted a study on sponsorship as experiential marketing
explored how to create positive sponsorship responses and brand experience through
event sponsorships. The sponsorship responses are operationalized as brand associations
and brand evaluation. The results indicated that direct experience with the sponsor creates
more positive brand evaluation and higher scores on important brand associations.
Xixiang et al. (2016) study also found that that brand experience has significant positive
relationship with brand association.Lundqvist et al. (2014) examined the influence of
storytelling on brand experience of consumers and found that brand stories may be useful

38
to reinforce and create positive brand associations. One group wasn’t exposed to the story
while the other was. Alberto et al. (2018) study which examined the link between offline
experiential marketing (during guest stay) and online experiential marketing (during the
purchasing process which involved booking and information search) with hotel brand
equity. The findings showed that during the stay experiences had an impact of brand
associations unlike the non-significant relationship between online experiential marketing
and brand association.
5.3.2 Effect of Experiential Marketing on Brand Loyalty
In regard to the effect of experiential marekting on brand loyalty, the results from the
correlation analysis indicate positive and significant association between experiential
marketing and brand loyalty at infill academy (r = 0.862, p = 0.000). Linear regression
results showed that experiential marketing explained 74.3 % of change in brand loyalty of
Infill Academy and an increase in experiential marketing resulted to a 0.886 increase in
Infill Academy brand loyalty. A further look at the items from the brand loyalty construct
indicate that respondents agreed to most of the statements. Study participants agreed that
they would recommend Infill Academy to someone who seeks my advice, I would bring
my child to Infill Academy for their primary education, I consider myself a fan of Infill
Academy, I am attached to Infill Academy, I think I am loyal to Infill Academy, I will
continue to support Infill Academy, and that they saidpositive things about Infill
Academy to other people.
Brand loyalty is the heart and the major component of brand equity and defined as the
attachment the customer has to a brand. Developing and maintaining loyalty should be
placed at the heart of marketing plans, especially in the face of highly competitive
markets with increasing unpredictability and decreasing brand differentiation. Brand
loyalty is composed of two different components namely attitudinal (focusing on personal
commitment to a set of unique values related to the brand) and the tendency to be loyal to
a brand (prioritizing the brand as the first choice for purchase) and behavioral (focusing
on product purchasing repetition or repeat buying behavior) (Taylor et al., 2004).Brand
loyalty is the heart and the major component of brand equity and defined as the
attachment the customer has to a brand (Aaker, 1991). Developing and maintaining
loyalty should be placed at the heart of marketing plans, especially in the face of highly
39
competitive markets with increasing unpredictability and decreasing brand differentiation
(Delgado-Ballester & Munuera-Aleman, 2001).
The findings from the study agree with previous studies that found positive effects of
experiential marketing on brand loyalty. Dewanti’s et al. (2011) study on influence of
experiential marketing, emotional branding, and brand trust towards brand loyalty in
Indonesia found that variable experiential marketing had a significant contribution
towards variable brand loyalty.
Rajput and Dhillon (2013) examined strategies and effects of sensory and experiential
marketing on consumer behavior and increasing company’s sales in India and established
that experiential marketing is found highly effective in influencing consumer behavior for
companies, particularly in terms of realizing the target of increasing sales and achieving
brand loyalty.
Dewanti et al. (2011) examined the influence of experiential marketing, emotional
branding, and brand trust towards brand loyalty and found that experiential marketing had
a significant contribution towards variable brand loyalty. Veasman (2015) study on
expected and unexpected experiential marketing promotions on brand image and brand
loyalty found that unexpected versus expected experiential marketing techniques had a
positive influence on brand loyalty. In China, Xixiang et al. (2016) found that brand
experience is positively related to brand loyalty. The findings suggest that it is fruitful for
marketers to gain brand loyalty by creating their brands highly experiential. Mohammad
(2017) study on effect of brand equity, brand experiences, and corporate branding on
brand loyalty and the findings established that the three sub-variables (Brand affective
experiences, brand sensory experience, and brand cognitive experience) had positive and
significant effects on except sensory, brand loyalty, and cognitive experiences.
5.3.3 Effect of Experiential Marketing on Perceived Quality
The results from the correlation analysis revealed a positive and significant association
between experiential marketing and perceived quality at infill academy (r = 0.764, p =
0.000). The results from the linear regression indicated that Experiential marketing
explained 58.4 % of change in brand associations of Infill Academy and an increase in
experiential marketing resulted to a 0.672 increase in Infill Academy brand
associations.A look at the item descriptions for perceived quality reveals that participants

40
agreed that Infill Academy offers good quality education, and although other academies
are good, participants perceived Infill Academy was better, and respondents perceived
Infill Academy as of high quality.
Perceived quality refers to “the consumer’s subjective judgment about a product’s overall
excellence or superiority. In this instance, quality is considered as consumer-based brand
equity variables which integrate perceptions and experiences of a consumer (Mutsikiwa et
al., 2013). Perceived quality refers to the consumer’s opinion about the brand’s quality
and its attributes with respect to its expected performance forms the measurement scale
indicator of the brad quality perceived by individuals (Villarejo-Ramos & Sanchez-
Franco, 2005). The findings suggested that respondents had positve reviews about
services offered at Infill Academy thereby indicating a positive perceived quality.
This finding corroborates previous studies which have found positive effects of
experiential marketing on brand equity dimensions, in this case, perceived quality.
Soitiriadis (2017) study experiential dimensions on behavioral intentions in nature-based
tourism found that the experience framework constitutes a valid tool for the study of
wildlife experiences. In the context of nature-based tourism the experiential dimensions
which influence the perceived service quality and customers’ satisfaction are escapism
and esthetics. Kanopaitė (2015) exploration on the impact of experiential marketing on
the customer perceived value and satisfaction in restaurants located in the cities of
Lithuania confirmed that the relationship between experiential marketing and customer
perceived value showed that sense experience had a positive impact on each variable of
the customer perceived value. Further analysis showed that there was a two-way
relationship between experiential marketing and customer perceived value.
Kim and Moon (2009) examined the psychological processes whereby services cape
influenced perceive service quality, revisit intentions, situational factors, and pleasure-
feeling. The findings suggested that thematic restaurant’s services cape has a significant
impact on perceived quality and pleasure-feeling, which lead to revisit intentions. Yuan
and Wu (2008) exploration of experiential marketing in the tourism and hospitality sector
in Taiwan revealed that experiential marketing induced perceived quality through
emotional and functional values provided by feel perception, think perception, and
service quality. In Kenya, Wangui (2016) investigation on the relationship between

41
events marketing, brand orientation and performance of commercial banks in Kenya and
found that event marketing as used by commercial banks does not significantly contribute
to the performance of the banks that use it as a marketing strategy.
5.4 Conclusion
5.4.1 Effect of Experiential Marketing On Brand Associations
The first research question of the study was to determine the effect of experiential
marketing on brand associations at Infill Academy. The descriptive statistics indicated an
overall mean of 3.89 which suggests that most of the respondents moderatley agreed with
the brand association statements. A positive and significant association was established
between experiential marketing and brand association of Infill Academy which was
confirmed by linear regression which showed a positive effect on brand association of
Infill academy. The study therefore concludes that experiential marketing has an effect on
brand associations of Infill Academy.
5.4.2 Effect of Experiential Marketing On Brand Loyalty
The second research question of the study was to determine the effect of experiential
marketing on brand loyalty at Infill Academy. The descriptive statistics indicated an
overall mean of 4.06 which suggests that most of the respondents agreed with the
brandloyaltystatements. A positive and significant association was established between
experiential marketing and brand loyalty of Infill Academy which was confirmed by
linear regression which showed a positive effect on brand loyalty. The study therefore
concludes that experiential marketing has an effect on brand loyalty of Infill Academy.
5.4.3 Effect of Experiential Marketing On Perceived Quality
The third research question of the study was to determine the effect of experiential
marketing on perceived quality of Infill Academy. The descriptive statistics indicated an
overall mean of 3.82 which suggests that most of the respondents moderately agreed with
perceived quality of Infill Academy statements. Positive and significant associations were
found between experiential marketing and perceived quality of Infill Academy which was
confirmed by linear regression which showed a positive effect on brand loyalty. The
study therefore concludes that experiential marketing has an effect on perceived quality of
Infill Academy.
42
5.5 Recommendations
5.5.1 Recommendations for Improvements
5.5.1.1Effect of Experiential Marketing On Brand Associations
The findings indicated that study participants moderately agreed to the statements on
brand association with Infill Academy. The study therefore recommends for the
management of Infill Academy to involve parents in school activities and events as this
increases their levels of association with the brand. The study recommends that Infill
Academy should involve and continually engage parents and other stakeholders in
decision making processes to increase theassociation of these parties to the academy.
5.5.1.2Effect of Experiential Marketing on Brand Loyalty
The results revealed that experiential marketing had the greatest effect on the participants
brand loyalty to Infill Academy. The study therefore recomends that the management of
Infill Academy to continue developing and innovating events that promote and reinforce
parents’ experiences with the academy as this will have a positive outcome on their
loyalty to the school. The study recommends for innovative marketing experintial events
such as sporting events, entertainment events, and talent shows to enhance their brand
loyalty.
5.5.1.3 Effect of Experiential Marketing on Perceived Quality
The findings of this research showed that parents’ moderately agreed that experiential
marketing on the perceived quality of Infill Academy services. The study, therefore
recommends that management of Infill Academy should design and come up with
innovative experiential marketing strategies that show the distinction between the services
offered by the Academy in comparison to other players in the industry.
5.5.2 Recommendations for Further Research
This study was limited to investigating the influence of experiential marketing to brand
equity. The dimensions of brand equity considered were brand associations, brand
loyalty, and perceived quality. There is need for further study on the influence of
experiential marketing on brand awareness in the education sector.

43
REFERENCES
Aaker, D. A. (1991). Managing Brand Equity. New York, N.Y: The Free Press.
Aaker, D. A. (1996). Measuring brand equity across products and markets, California
Management Review, 38 (3), 102-120.
Alberto, J., García, C., & Galindo, A. V., & Suárez, M. (2018). The effect of online and
offline experiential marketing on brand equity in the hotel sector, Spanish Journal
of Marketing - ESIC, 22 (1), 22-41.
Alkilani, K., Ling, K. C., & Abzakh, A. A. (2012). The Impact of Experiential Marketing
and Customer Satisfaction on Customer Commitment in the World of Social
Networks, Asian Social Science, 9 (1), 262-270.
Awan, A. G., & Rehman, A. (2014). Impact of customer satisfaction on brand loyalty- an
empirical analysis of home appliances in Pakistan, British journal of marketing
studies, 2 (8), 18-32,
Boisvert, J. (2011). Conceptualization and modelling of the process behind brand
association transfer, International Journal of Market Research, 53 (4), 541-556.
Boisvert, J., & Burton, S. (2011). Towards a better understanding of factors affecting
transfer of brand associations, Journal of Consumer & Marketers, 28 (1), 57-66
Brakus, J. J., Schmitt, B. H., & Zhang, S. (2008). Experiential Attributes and Consumer
Judgments,” in Handbook on Brand and Experience Management, Bernd H.
Schmitt and David Rogers, eds. Northampton, MA: Edward Elgar.
Chao, R-F. (2015). The Impact of Experimental Marketing on Customer Loyalty for
Fitness Clubs: Using Brand Image and Satisfaction as the Mediating Variables,
The journal of international management studies, 10 (2), 52-60.
Chaudhuri, A., & Holbrook, M. B. (2001). The chain of effects from brand trust and
brand affect to brand performance: the role of brand loyalty, Journal of
Marketing, 65, 81-93.
Chieng F. Y. L., & Lee, G. C. (2011). Customer-based brand equity: a literature review,
Journal of Arts Science & Commerce, 2 (1), 33-42.
Chirani, E., Taleghani1, M., & Moghadam, E. N. (2012). Brand Performance and Brand
Equity, Interdisciplinary journal of contemporary research in business, 3 (9),
1033-1036.
Collins, M. K., & Winrow, B. (2010). Porter's generic strategies as applied toward
e‐tailers post‐Leegin, Journal of Product & Brand Management, 19 (4), 306-311.
De Vos, A. S. (2001). Research at grass roots. (3rd ed). Pretoria: Van Schaik.
44
Delgado-Ballester, E., & Munuera-Aleman, J. L. (2001). Brand trust in the context of
consumer loyalty, European Journal of Marketing, 35 (11/12), 1238–1258.
Dewanti, R., Chu, T. F., & Wibisono, S. (2011). The influence of experiential marketing,
emotional branding, brand trust towards brand loyalty, Binus business review, 2
(2), 1110-1117.
El Naggar, R. A. A., & Bendary, N. (2017). The Impact of Experience and Brand trust on
Brand loyalty, while considering the mediating effect of brand Equity dimensions,
an empirical study on mobile operator subscribers in Egypt, The business and
management review, 9 (2), 16-25.
Gordon, B. S., James, J. D., & Yoshida, M. (2016). The Development of Brand
Association Measures in Multiple Product Categories: New Findings and
Implications for Goods and Service Brands, International Journal of Business
Administration, 7 (3), 140-152.
Gounaris, S., Dimitriadis, S., & Stathakopoulos, V. (2005). Antecedents of perceived
quality in the context of Internet retail stores, Journal of Marketing Management,
21 (7), 669-682.
Grönroos, C. (1994). From marketing mix to relationship marketing: towards a paradigm
shift in marketing, Management Decision, 32 (2), 4-20.
Grundey, D. (2008). Experiential Marketing vs. Traditional Marketing: Creating Rational
and Emotional Liaisons with Consumers, The Romanian Economic Journal, 29,
133-151.
Hendrasaputra, D., & Lunarjanto, A. (2009). The effects of brand endorsement,
popularity, and event sponsorship on consumer pre-purchase attitudes in Jakarta,
Journal of Business Strategy and Execution, 1 (2), 194 – 215.
Hsu, Y., & Hsu, Y-T. (2015). The influence of brand awareness and experiential quality:
Taking manufacturer brands and private labels as examples, International Journal
of Business and Commerce, 4 (6), 84-98.
Kanopaitė, V. (2015). The Impact of Experiential Marketing Use on Customer Perceived
Value and Satisfaction in Lithuanian Restaurants. Vilnius: ISM University of
Management and Economics.
Kårhus, M. L. (2012). Sponsorship as Experiential Marketing: A natural experiment on
how event experiences transfer to the brand. Bergen: Norwegian School of
Economics
Keller, K. L. (1993). Conceptualizing, Measuring, and Managing Customer Based Brand
Equity, Journal of Marketing, 57 (1), 1-22.

45
Keller, K. L. (2008). Strategic brand management: building, measuring and managing
brand equity (3rd ed.). New Jersey: Prentice Hall.
Kim, W. G., & Moon, Y. J. (2009). Customers’ cognitive, emotional, and actionable
response to the servicescape: A test of the moderating effect of the restaurant type,
International Journal of Hospitality Management, 28, 144-156.
Kinyanjui, N. S. (2016). Effectiveness of experiential marketing strategy on graduate
student’s retention in selected universities in Kenya. Dissertation. Master in
Business Administration. KCA University. Nairobi. Kenya.
Lee, M. S., Hsiao, H. D., & Yang, M. F. (2011). The study of the relationship among
experiential marketing, service quality, customer satisfaction and customer
loyalty, The international journal of organizational innovation, 3 (2), 353-379.
Lekstutytė, A. (2016). Experiential marketing practices leading to consumer loyalty in
restaurant business. Lisbon: University Institute of Lisbon
Liao, Y., Wu, W., Amaya Rivas, A., & Ju, T. (2017). Cognitive, experiential, and
marketing factors mediate the effect of brand personality on brand equity, Social
Behavior and Personality: An international journal, 45, 1-18.
Liu, L., Zhang, J., & Keh, H. T. (2017). Event-marketing and advertising expenditures the
differential effects on brand value and company revenue, Journal of advertising
research, 1-12.
Liu, Y. (2007). The long-term impact of loyalty programs on consumer purchase behavior
and loyalty, Journal of Marketing, 71 (4), 19-35.
Low, G. S., & Lamb, C. W. (2000). The measurement and dimensionality of brand
associations, Journal of Product & Brand Management, 9 (6), 350-370.
Lundqvist, A., Liljander, V., Gummerus, J., & van Rie, A. (2014). The impact of
storytelling on the consumer brand experience: The case of a firm-originated
story, Journal of Brand Management, 20, 283-297.
Maghnati, F., Ling, K. C., & Nasermoadeli, A. (2012). Exploring the Relationship
between Experiential Marketing and Experiential Value in the Smartphone
Industry, International Business Research, 5 (11), 169-177.
Maheshwari, V., Lodorfos, G., & Siril, J. (2014). Determinants of Brand Loyalty: A
Study of the Experience-Commitment-Loyalty Constructs, International Journal
of Business Administration, 5 (6), 13-23.
Marshall, C., & Rossman, G. B. (2006). Designing Qualitative Research (4th ed.).
Thousand Oaks, CA: Sage.
46
Mathews, T. (2013). An Examination of the Best Practices of Experiential Marketing in
Selected Popular Beverage Companies. San Luis Obispo. California Polytechnic
State University,
Mohammad, A. A. S. (2017). The Impact of Brand Experiences, Brand Equity and
Corporate Branding on Brand Loyalty: Evidence from Jordan, International
journal of academic research in accounting, finance and management sciences, 7
(3), 58–69.
Moolla, A. I., & Bisschoff, C. A. (2013). An Empirical Model that Measures Brand
Loyalty of Fast- Moving Consumer Goods, Journal of Economics, 4 (1), 1-9.
Mukiira, E. M., Musau, C., & Munyao, J. (2017) Effect of experiential marketing in
building brand equity: A case of selected Unilever Tanzania brands, International
Journal of Supply Chain Management, 2 (1), 1-31
Mutsikiwa, M., Dhliwayo, K., & Basera, C. H. (2013). The Impact of Advertising on
Building Brand Equity: A Case of Zimbabwean Universities, European Journal of
Business and Management, 5 (9), 197-210.
Naggar, R. A. A. E., & Bendary, N. (2017). The Impact of Experience and Brand trust on
Brand loyalty, while considering the mediating effect of brand Equity dimensions,
an empirical study on mobile operator subscribers in Egypt, The Business and
Management Review, 9 (2), 16-25.
Nawaz, N-U-I., & Usman, A. (2010++). What Makes Customers Brand Loyal: A Study
on Telecommunication Sector of Pakistan, International Journal of Business and
Social Science, 2 (14), 213-221.
O’Cass, A., & Lim, K. (2001). The Influence of Brand Associations on Brand Preference
and Purchase Intention: An Asian Perspective on Brand Association, Journal of
International Consumer Marketing, 14 (2/3), 41-71.
Parasuraman, A., Zeithaml, V. A., & Berry, L. (1988). SERVQUAL: A multiple-item
scale for measuring consumer perceptions of service quality, Journal of Retailing,
64, 12-40.
Pricewell, A. N., Chima, P. N., & Azubuike, N. C. (2013). The Effect of Event Marketing
Techniques Employed by Nigerian Firms on Consumers Brand’ Loyalty and
Patronage, International Journal of Science and Research, 4 (8), 243-251.
Punniyamoorthy, M., & Raj, P. M. (2007). An empirical model for brand loyalty
measurement, Journal of Targeting, Measurement and Analysis for Marketing, 15
(4), 222–233.

47
Qader, I. K. A., & Omar, A. B. (2013). The Evolution of Experiential Marketing: Effects
of Brand Experience among the Millennial Generation, International Journal of
Academic Research in Business and Social Sciences, 3 (7), 331-340.
Rahi, S. (2017). Research Design and Methods: A Systematic Review of Research
Paradigms, Sampling Issues and Instruments Development, International Journal
of Economics & Management Sciences, 6 (2), 1-5.
Rajput, N., & Dhillon, R. (2013). Frontiers of the Marketing Paradigm for the Third
Millennium: Experiential Marketing, Global Journal of Management and
Business Studies, 3 (7), 711-724.
Rajumesh, S. (2014). The Impact of Consumer Experience on Brand Loyalty: The
Mediating Role of Brand Attitude, International Journal of Management and
Social Sciences Research, 3 (1), 73-79.
Rajumesh, S. (2014). The Impact of Consumer Experience on Brand Loyalty: The
Mediating Role of Brand Attitude, International Journal of Management and
Social Sciences Research, 3 (1), 73-79.
Ryu, K., & Han, H. 2011. New or repeat customers: how does physical environment
influence their restaurant experience? International Journal of Hospitality
Management, 30, 599-611.
Ryu, K., & Han, S. (2010). Influence of the Quality of Food, Service, and Physical
Environment on Customer Satisfaction and Behavioral Intention in Quick- Casual
Restaurants: Moderating Role of Perceived Price, Journal of Hospitality &
Tourism Research, 34 (3), 310-329.
Sahin, A., Zehir, C., & Kitapç, B. (2011). The Effects of Brand Experiences, Trust and
Satisfaction on Building Brand Loyalty: An Empirical Research on Global
Brands, Procedia Social and Behavioral Sciences, 24, 1288–1301.
Salaria, N. (2012). Meaning of the term- descriptive survey research method,
International Journal of Transformations in Business Management, 1 (1), 1-7.
Saleem, A., Ghafar, A., Ibrahim, M., Yousuf, M., & Ahmed, N. (2015). Product
Perceived Quality and Purchase Intention with Consumer Satisfaction, Global
journal of management and business research: E-Marketing, 5 (1), 21-28.
Salelaw, G. T., & Singh, A. (2015). The Effects of Advertising Spending and Event
Sponsorship on Brand Equity in the Ethiopian Brewery Industry, Global Journal
of Management and Business Research: E-Marketing, 15 (10), 15-29.
Schivinski, B., & Dabrowski, D. (2014). The consumer-based brand equity inventory:
scale construct and validation. Working Paper Series A (Economics,
Management, Statistics). Poland. Gdansk University of Technology.

48
Schmitt, B. (2010). Experience Marketing: Concepts, Frameworks and Consumer
Insights, Foundations and trends in marketing, 5 (2), 55–112.
Shieh, H-S., & Lai, W-H. (2017). The relationships among brand experience, brand
resonance and brand loyalty in experiential marketing: Evidence from smart
phone in Taiwan, Journal of Economics and Management, 28 (2), 58-73.
Singh, N. (2014). Lingerie brand experience study in the Pune market, International
Journal of Business and Administration Research Review,1 (5), 70-84.
Sotiriadis, M. (2017). Experiential dimensions and their influence on behavioral
intentions within the context of nature-based tourism, Tourism and hospitality
management, 23 (1), 35-50.
Sugiyarti, G., & Hendar, G. (2017). Experiential Marketing Creative Antecedence for
Success of Brand Loyalty (A Study on the Users of Perfume for Body in
Indonesia), International Review of Management and Marketing, 7 (1), 529-536.
Taylor, S. A., Celuch, K., & Goodwin, S. (2004). The importance of brand equity to
customer loyalty, Journal of product & brand management, 13 (4), 217-227.
Tsordia, Ch., Papadimitriou, D., & Parganas, P. (2017) studied the influence of sport
sponsorship on brand equity and purchase behavior, Journal of Strategic
Marketing, 26 (1), 85-105.
Veasman, C. (2015). The Effects of Expected and Unexpected Experiential Marketing
Promotions on Brand Image and Brand Loyalty. Columbia. University of
Missouri.
Villarejo-Ramos, A., & Sanchez-Franco, M. (2005). The impact of marketing
communication and price promotion on brand equity, Journal of Brand
Management, 12, 431–444.
Wangui, M. W. (2016). Events marketing, brand orientation and performance of
commercial banks in Kenya. Research Project. Master of Science in Marketing.
University of Nairobi. Nairobi. Kenya.
Willis, G. B. (2016). Questionnaire pretesting. In C. Wolf, D. Joye, T.W. Smith, & Y. Fu
(Eds.), The SAGE handbook of survey methodology. Thousand Oaks, CA: Sage.
Xixiang, S., Gilal, R., & Gilal, G. (2016). Brand Experience as a Contemporary Source of
Brand Equity in 21st Century: Evidence from the Chinese Consumer Market,
International Journal of Education and Research, 4 (9), 63-76.
Yamane, T. (1967). Statistics: An Introductory Analysis. (2nd Ed.). New York, NY:
Harper and Row.

49
Yoo, B., Donthu, N., & Lee, S. (2000). An examination of selected marketing mix
elements and brand equity, Journal of the Academy of Marketing Science, 28,
195-209.
Yuan, Y-H., & Wu, C. (2008). Relationships among Experiential Marketing, Experiential
Value, and Customer Satisfaction, Journal of Hospitality & Tourism Research, 32
(3), 387-410.
Zarantonello, L., & Schmitt, B. H. (2013). The impact of event marketing on brand
equity: the mediating roles of brand experience and brand attitude, International
journal of advertising, 32 (2), 255-280.
Zeithaml, V. A. (1988). Consumer Perceptions of Price, Quality, and Value: A Means-
End Model and Synthesis of Evidence, Journal of Marketing, 5, 22-22.
Zena, P. A., & Hadisumarto, A. D. (2012). The Study of Relationship among Experiential
Marketing, Service Quality, Customer Satisfaction, and Customer Loyalty, Asean
Marketing Journal, 4 (1), 37-46.

50
APPENDICES
Appendix I: Cover Letter
Dear Respondent,
I am a Masters student at the United States International University - Africa pursuing a
Global Master’s in Business Administration (MBA). In partial fulfillment for being
awarded this reward, I am conducting a study on Effect of Experiential Marketing
Strategy on Brand Equity of Infill Academy, Nairobi County, Kenya. As a manager at
at Infill Academy, I humbly request you to assist me by answering the questions in the
questionnaire as accurately as you can.
Kindly note that any information provided will be treated with utmost confidentiality and
at no time will it be used for any other purpose other than for this project. Your name or
any personal identification will not be used in this research. Your assistance is highly
appreciated. I look forward to your favorable response. Please tick as appropriate.
Yours Faithfully,
Julia Thitai
Email: [email protected]
Phone No: 0708492581

51
Appendix II: Questionnaire for Annual Events Participants
Section A: Background Information
1. What is your gender?
Male [ ]
Female [ ]
2. What is your age group?
18-24 years old [ ]
25-34 years old [ ]
35-44 years old [ ]
45-54 years old [ ]
55 and above years old [ ]
3. What is your highest education level?
No schooling completed [ ]
Trade/technical/vocational training [ ]
College [ ]
Bachelor’s degree [ ]
Postgraduate degree [ ]
Other (Specify) …………………………….
Section B: Brand Association
5. Please indicate the extent to which you agree or disagree with the following brand
associations statements. Where 1=strongly disagree, 2=disagree, 3=moderately, 4=agree,
5=strongly agree
Brand association statements 1 2 3 4 5
a I am able to name a few characteristics of Infill Academy
b I associate good feelings with Infill Academy
c I feel some sympathy for Infill Academy
d I have good associations with Infill Academy
e I have good memories linked to Infill Academy
f I have good memories of Infill Academy
g I think that Infill Academy has a strong image
h I think that Infill Academy has character
i Somehow I feel personal affection for Infill Academy
j The memories I have of Infill Academy influence my decision to
purchase their service

52
Section D: Brand Loyalty
6. Please indicate the extent to which you agree or disagree with the following brand
loyalty statements. Where 1=strongly disagree, 2=disagree, 3=moderately, 4=agree,
5=strongly agree
Brand Loyalty statements 1 2 3 4 5
a I will recommend Infill Academy someone who seeks my advice
b I will bring my child to Infill Academy for their primary education
c I consider myself a fan of Infill Academy
d I am attached to Infill Academy
e I think I am loyal to Infill Academy
f I will continue to support Infill Academy
g I don’t bother looking at alternative academies; Infill Academy is
good enough for me!
h I say positive things about Infill Academy to other people
i If Infill Academy were to raise their prices, I would continue to buy
their services
j I consider Infill Academy is my first choice in the category of
academies
Section E: Perceived Quality
7. Please indicate the extent to which you agree or disagree with the following brand
awareness statements. Where 1=strongly disagree, 2=disagree, 3=moderately, 4=agree,
5=strongly agree
Perceived quality statements 1 2 3 4 5
a Infill Academy is of high quality
b The likely quality of Infill Academy is extremely high
c The likelihood that would be functional is very high
d The likelihood that Infill Academy is reliable is very high
e Infill Academy must be of very good quality
f Infill Academy appears to be of very poor quality
g Infill Academy is of better quality than other alternatives
h Although other academies are good, I still think that Infill Academy
is better
i Infill Academy offers good quality education
j Infill Academy offers reliable education

53
Section F: Experiential Marketing
8. Please indicate the extent to which you agree or disagree with the following brand
awareness statements. Where 1=strongly disagree, 2=disagree, 3=moderately, 4=agree,
5=strongly agree
Experiential marketing factors 1 2 3 4 5
Sense experience
The idea of Infill Academy is refreshing
The concept of Infill Academy is very special
I am more interested in learning about Infill Academy
Think experience
The extra-curricular activities offered make me think of Infill Academy
quality
The interaction with the staff makes me think more about Infill
Academy
I will think more of Infill Academy after this experience
Feel experience
Participating in school events makes me feel a part of Infill Academy
community
The information I have accessed during the annual events makes me
feel to want to know more about Infill Academy
The annual activities make me feel emotional about Infill Academy
Relate experience
The services provided by Infill Academy make me closer to this school
The features of Infill Academy make me want to associate with the
school
I can relate with other people by participating in Infill Academy
activities
Act experience
I will bring my other children to Infill Academy
I spread the word about Infill Academy