effect of fasting in the digestive system: histological study of the small intestine in house...
TRANSCRIPT

Accepted Manuscript
Title: Effect of fasting in the digestive system: Histologicalstudy of the small intestine in house sparrows
Author: Samanta Celeste Funes Veronica Palmira FilippaFabricio Damian Cid Fabian Mohamed EnriqueCaviedes-Vidal Juan Gabriel Chediack
PII: S0040-8166(14)00056-1DOI: http://dx.doi.org/doi:10.1016/j.tice.2014.06.007Reference: YTICE 875
To appear in: Tissue and Cell
Received date: 31-8-2013Revised date: 27-5-2014Accepted date: 20-6-2014
Please cite this article as: Funes, S.C., Filippa, V.P., Cid, F.D., Mohamed, F.,Caviedes-Vidal, E., Chediack, J.G.,Effect of fasting in the digestive system:Histological study of the small intestine in house sparrows, Tissue and Cell (2014),http://dx.doi.org/10.1016/j.tice.2014.06.007
This is a PDF file of an unedited manuscript that has been accepted for publication.As a service to our customers we are providing this early version of the manuscript.The manuscript will undergo copyediting, typesetting, and review of the resulting proofbefore it is published in its final form. Please note that during the production processerrors may be discovered which could affect the content, and all legal disclaimers thatapply to the journal pertain.

Page 1 of 27
Accep
ted
Man
uscr
ipt
1
Effect of fasting in the digestive system: Histological study of the small intestine in house
sparrows.
Samanta Celeste Funes1, Verónica Palmira Filippa3, Fabricio Damián Cid1,2, Fabián
Mohamed3, Enrique Caviedes-Vidal1,2 and Juan Gabriel Chediack1,2*
1Laboratorio de Biología Integrativa. Instituto Multidisciplinario de Investigaciones
Biológicas de San Luis (IMIBIO-SL). CCT-San Luis. CONICET. San Luis, Argentina; 2Área
de Biología; 3Área de Morfología. Departamento de Bioquímica y Ciencias Biológicas.
Facultad de Química, Bioquímica y Farmacia. Universidad Nacional de San Luis. San Luis,
Argentina.
Figures: 6, tables: 2
Running title: Histological changes of intestine during fasting
*Correspondence to: Juan Gabriel Chediack. Postal address: Chacabuco 917, post code:
D5700HHW, San Luis, Argentina. Telephone number: 54-0266 4423789 ext. 6259. Fax
number: 54-0266 4430224 E-mail: [email protected].
Grant sponsor. Consejo Nacional de Investigaciones Científicas y Técnicas; Grant number
998 PIP2010-2012 CONICET and Grant number 0110, Ciencia y Técnica – Universidad
Nacional de San Luis to Juan Gabriel Chediack. Grant number 9502, Ciencia y Técnica –
Universidad Nacional de San Luis to Enrique Caviedes-Vidal.

Page 2 of 27
Accep
ted
Man
uscr
ipt
2
ABSTRACT
In birds and mammals the metabolic response to fasting has been studied and can be
characterized by three consecutive phases reflecting metabolic and physiological adjustments.
An effective way to minimize energy expenditure during food scarcity is to decrease the mass
of the organs. As the digestive system is metabolically expensive to maintain, the small
intestine and the liver are the most affected organs. We evaluated the effects of phase III
starvation on the mass of the different organs and histological parameters on house sparrows,
a small non-migrant bird. In a short period of time (34 hours) we observed a larger reduction
in the digestive organ mass when compared to the mass of the body and non-alimentary
tissues. Furthermore, the intestinal mass was proportionally more reduced than its length and
nominal surface area. A reduction on the intestinal mucosal layer also resulted in a shortening
of villus (length and thickness) and crypt depth. Moreover, the morphology of the enterocytes
changed from cylindrical to cubical, suggesting that the surface exposed to the lumen was
conserved. This may indicate an adaptive response to the moment of refeeding. The nominal
surface area/body mass remained constant in both groups and several histological parameters
were reduced, suggesting that starving induces the atrophy of the small intestine. However,
the goblet cells were conserved after fasting indicating a protective tendency.
Keywords: Starvation, gastrointestinal tract, histological parameters, non-migrant birds.

Page 3 of 27
Accep
ted
Man
uscr
ipt
3
INTRODUCTION
In birds and mammals the effects of fasting can be described by three consecutive phases.
These phases can be defined by progressive metabolic and physiological changes (Chediack
et al., 2012; McCue, 2010; Wang et al., 2006). Phase I occurs immediately after the last food
has been absorbed by the small intestine. It is characterized by the use of the liver glycogen
stores and a significant reduction in body mass in a short period of time. Phase II is
characterized by energy preservation and lipid oxidation. Since lipids have a high amount of
energy, weight loss is slow during this stage. Finally, during phase III, when lipid deposits are
almost depleted, muscle protein catabolism begins combined with a decrease in protein
synthesis. During this phase, there is a remarkable reduction in body and organ mass (Wang
et al., 2006) resulting from starvation combined with the energy demands required to maintain
the body homeostasis (Bauchinger et al., 2005). Thus, an effective way to minimize energy
expenditure during food scarcity is to decrease the mass of certain organs.
The digestive system is metabolically expensive to maintain, the regulation of its
physiological functions requires about 17-25% of the whole body oxygen consumption (Cant
et al., 1996 ). It has been found that the small intestine and the liver are the most affected
organs during fasting (Chediack et al., 2012; Ferraris and Carey, 2000; Starck, 2003).
Throughout starvation animals display morphological changes in the gastrointestinal tract.
These include a decrease in the length and mass of the small intestine, a decrease in mucosal
weight, changes in villus length and thickness, and phenotypic changes in the enterocytes
(Dunel-Erb et al., 2001; Karasov et al., 2004; Zeng et al., 2012). In rats and birds the
generative components (crypts) of the mucosa are preferentially preserved in comparison with
the absorptive part (villi) during fasting (Dunel-Erb et al., 2001; Karasov et al., 2004). The
effects of fasting on the muscular layer are important in rats (Dou et al., 2002), while absent
in fish and passerine wild birds (Karasov et al., 2004; Zeng et al., 2012). Several factors

Page 4 of 27
Accep
ted
Man
uscr
ipt
4
including body mass affect the rate at which starving animals (birds and mammals) lose body
mass, making it highly variable. On a comparative level, mammals and birds with similar
body mass, such as sparrows and mice (~ 25 g each), have a notable difference in their fasting
tolerance times, 3-4 days for the mouse (Sokolovic et al., 2007; Wang et al., 2006) and 31-36
hours for the sparrow (Chediack et al., 2012; Khalilieh et al., 2012). This disparity between
mammals and birds may be explained by the higher basal metabolic rate of the latter, between
30 to 40% higher than that of mammals (McNab, 2009). In mice there are controversial
observations about the significance of the structural changes observed during starvation,
mainly in the third phase, where some researchers found varied histological changes while
others did not (Chappell et al., 2003; Nian et al., 2002; Shin et al., 2005; Sokolovic et al.,
2007). In birds, observations in a migrant passerine wild bird (Sylvia atricapilla) showed a
significant effect of fasting in the reduction of the structure of the gastrointestinal tract
(Karasov et al., 2004). Despite, previous studies in house sparrows reports changes in organ
morphology during fasting (Chediack et al, 2012), this is the first exhaustive analysis of
intestinal histology changes on a non-migrant adult passerine bird undergoing fasting.
Our objectives were to evaluate the effects of long-term starvation on organ mass loss,
and show how starvation affects the histology of the small intestine (perimeter, muscular
layer, mucosal layer, villus length, crypt size, enterocyte morphology and goblet cell).

Page 5 of 27
Accep
ted
Man
uscr
ipt
5
MATERIALS AND METHODS
1.1. Animal care and housing
Adult house sparrows (Passer domesticus) were captured with a live trap near the
Universidad Nacional de San Luis campus (San Luis, Argentina). The birds were housed in
cages (40 x 25 x 25 cm) indoors under relatively constant environmental conditions (23 ± 1
°C and 40 ± 10% of relative humidity) on a photoperiod of 14:10 hours (Light:Dark) with
food and water ad libitum (seeds supplied with vitamins and minerals). Animals were
acclimatized to laboratory conditions for at least two weeks prior experimentation. Animal
care and trial protocols (protocol number N° B69/09) were approved by the committee of
Universidad Nacional de San Luis (CICUA).
1.2. Experimental design
1.2.1. Experiment: Effect of long-term fasting on organ mass and intestinal
morphometric parameters.
Adults house sparrows (n=22) were randomly assigned to either the feeding or long-term
fasting group with water ad libitum (n=11 for each experimental group). The mean body
mass of both groups was similar at the beginning of the experiment (25.66 ± 0.88; 25.56 ±
0.40, p>0.92). On the fasted group, food was removed 2 hours after lights turned on (8:00
h). 24 hours later the bird’s body mass was measured every 2–3 hours until phase III of
fasting, when animals lost more than 15% of their body mass (~31–34 hours). At the end
of the experiment, birds were anesthetized using ketamine and xilacyne (Paul-Murphy and
Fialkowski, 2001), the abdominal cavity opened and the entire gastrointestinal tract
removed and chilled in ice-cold avian saline buffer. The small intestine, stomach,
pancreas, heart and liver were removed, cleaned of extraneous tissue and weighed. The
small intestine lumen was washed with ice-cold avian saline buffer to remove digesta and

Page 6 of 27
Accep
ted
Man
uscr
ipt
6
measured. For histological procedures four animals were used in each group, the
remaining animals were used for another experiment.
1.2.2. Enterocytes isolation
Enterocytes were isolated using a modification of a classical chemical method
adjusted for birds (MacDonal et al., 2008). Briefly, small intestinal segments were washed
with ice-cold Hanks' balanced salt solution supplemented with mannitol (HBSS–mannitol, pH
7.2). Intestinal segments were submerged in 1 mL of ice-cold chelation buffer containing: 30
mM EDTA, 1.94 mM DL-dithiothreitol, 52 mM NaCl, 4.39 mM KCl, 10 mM L-1N-2-
hydroxyethylpiperazine-N′-2- ethanosulfonic acid (HEPES), 60 mL/L HCl 1 N (pH 7.1) for
75 min at 4 °C without shaking. After that the chelation buffer was gently discarded and 1 mL
of HBSS–mannitol added and cells vigorously shaken for 30 s. Cells were collected and
centrifuged at 100g during 5 min at 4 °C. The pellet was washed three times by successive
resuspension in 1 mL of HBSS–mannitol. The cells were dispersed by passing them several
times through a hypodermic needle and centrifugation at 100g for 5 min at 4 °C. The protein
concentrations of the enterocytes samples in the three intestinal portions were estimated using
the Bradford protocol.
1.3. Analytical procedures
1.3.1. Histological procedure
Proximal, medial and distal intestinal portions were placed in individual vials
containing fresh Bouin solution (saturated solution of picric acid, with glacial acetic acid and
formol 40%) and allowed to fix for 6 to 12 hours at room temperature, for posterior
processing. The intestinal pieces were dehydrated in increasing ethanol
concentrations, cleared in xylene, embedded in paraffin and five-µm thick sections were
obtained with a microtome (Microm HM 325). Sections were mounted on slides, stained with
hematoxylin-eosin or Periodic acid-Schiff (PAS) methods and covered with cover glasses.

Page 7 of 27
Accep
ted
Man
uscr
ipt
7
A computer-assisted image analysis system was used to measure the percentage of
area of PAS-positive vesicles and the number of cells per reference area, circumference of the
serosal surface, length and width of villi, width of the crypts, length and width of enterocytes.
The system consisted of an Olympus BX-40 binocular microscope interfaced with a host
computer, image processing and recording system. The images were captured by a Sony SSC-
DC5OA camera (Sony Corp., Tokyo, Japan) and processed with Image-Pro Plus 5.0 software
(Media Cybernetics Inc., Bethesda, MD, USA) under control of a Pentium IV computer. The
software allowed the following processes: image acquisition, automatic analogous
adjustment, thresholding, background subtraction, distance calibration, area and diameter
measuring, and disk data logging. The image was displayed on a color monitor, and the
parameters were measured with the image analysis system. Before counting, a standard area
of 18,200 µm2 (reference area, RA) was defined on the screen, and distance calibration was
done using a slide with a micrometric scale for microscopy (Reichert, Austria).
• Percentage of area of PAS-positive vesicles (% AV) was calculated using the
formula % AV=∑Av/∑RA×100, where ∑Av is the sum of the area of PAS-positive vesicles
and ∑RA is the sum of the small intestine area of every microscopic field.
• The number of goblet cells (No. cell/RA) with a visible nucleus was counted in 10
microscopic fields per section. The result was expressed as number of cells per RA.
• In each section the circumference of the serosal surface, length and width of villi,
width of the crypts and length and width of enterocytes was measured. At least 30
measurements per section were taken, resulting in more than 90 measurements per individual.
Only villi that were cut in their midline, from tip to base, were measured, as verified by
observations of similarly sized and shaped enterocytes. These data were used to estimate the
surface area enlargement factor (SEF) by a simple method (Kisielinski et al., 2002). To avoid

Page 8 of 27
Accep
ted
Man
uscr
ipt
8
inflation of degrees of freedom by repeated measurements within individuals, means and
standard deviation were calculated for individual birds. These means were used in statistical
analyses.
1.4. DATA ANALYSIS
Results are given as means ± 1 SE, the number of individuals (n) was 11 for the
morphological and 4 for the histological study. Morphological (body mass, intestine,
pancreas, liver, stomach and heart mass) and histological (perimeter, muscular layer, mucosal
width, villus, crypts, enterocytes, goblet cells and PAS-positive vesicles) parameters were
analyzed by T-tests for independent samples. Repeated measures analysis of variance (RM-
ANOVA) followed by Tukey post-hoc test was used to examine the effect of fasting on
histological parameters at different intestinal positions. If required, data were first
transformed to achieve homogeneity of variances and normality of distribution, using natural
logarithm or square root transformations. Normality of data was checked by Shapiro-Wilk
test, and Homoscedasticity by Levene´s test and homocedasticity of the covariance tested
with the Box M test. The significance level selected to accept a difference for all statistical
analyses performed was α<0.05. Association between histological parameters (perimeter,
muscular layer, mucosal width, villus, crypts and enterocytes) was analyzed by Pearson
product-moment correlation coefficient.
2. RESULTS
2.1. Variation in organ masses
The mass of all the measured organs (g) was reduced after prolonged fasting (liver
0.82 ± 0.066 vs. 0.45 ± 0.023; pancreas 0.13 ± 0.011 vs. 0.10 ± 0.005; stomach 0.78 ± 0.060
vs. 0.59 ± 0.025; heart 0.37 ± 0.015 vs. 0.28 ± 0.016). The length (cm) and mass (g) of the
small intestine was significantly reduced (~14% and ~40% respectively) compared to non-

Page 9 of 27
Accep
ted
Man
uscr
ipt
9
fasted animals (length 17.23 ± 0.742 vs. 14.83 ± 0.505; mass 1.08 ± 0.150 vs. 0.65 ± 0.048),
in all cases p<0.05, see Table 1A).
When normalized to body mass, fasted animals showed no difference in intestine
length, heart, pancreas, and stomach mass compared to controls (small intestine cm/g 0.66 ±
0.069 vs. 0.70 ± 0.022; heart g/g 0.0153 ± 0.0006 vs. 0.0136 ± 0.0007; pancreas g/g: 0.0051 ±
0.0004 vs. 0.0048 ± 0.0003; stomach g/g: 0.0305 ± 0.0019 vs. 0.0282 ± 0.001). However, the
differences in liver and intestine mass were still significant after normalization to body mass
(liver g/g: 0.0301 ± 0.0035 vs. 0.021 ± 0.001; small intestine g/g: 0.0413 ± 0.0044 vs. 0.030 ±
0.022). Similarly, the ratio between intestinal mass and length was decreased in fasting
animals (0.062 ± 0.006 vs. 0.043 ± 0.003) (see Table 1B for p-values).
Moreover, the nominal surface area (cm2) shrank (12.82 ± 0.773 vs. 9.65 ± 0.859;
unpaired t-test p<0.018) and the protein concentration (µg per mg of enterocytes) decreased
35% between the control and fasted groups when looking at the whole intestine (0.114 ±
0.0149 vs. 0.073 ± 0.0104, unpaired t-test p<0.028).
2.2. Intestinal morphologic observations
Fasting reduced the mucosal layer thickness in the whole intestine, and in the proximal
portion this reduction was more noticeable (Figure 1). The connective tissue (lamina propria)
decreased in the center of the villi in fasting birds, concomitantly with decreased villi
thickness (Figure 2b and c). The intestinal epithelium conserved its characteristic
morphology; however, less developed lacteal ducts and enterocyte height reduction were
observed after fasting (Figure 3). Also, Lieberükhn crypts and the number of mitotic cells
were reduced in fasting birds compared to controls (Figure 2).
Goblet cells were studied by the technique of PAS. The abundance of goblet cells
increased from the proximal to the distal portions of the small intestine in both groups (Table
2, Figure 4). There was no quantitative difference between the abundance of goblet cells on

Page 10 of 27
Accep
ted
Man
uscr
ipt
10
control and fasted groups (Table 2). Big PAS-positive vesicles were observed “moving” from
crypts to intestinal lumen in both groups in different intestinal portions (Figure 5). The
abundance (%) of PAS-positive vesicles was higher in fasted than in the control group (Table
2).
2.3. Intestinal morphometric parameters
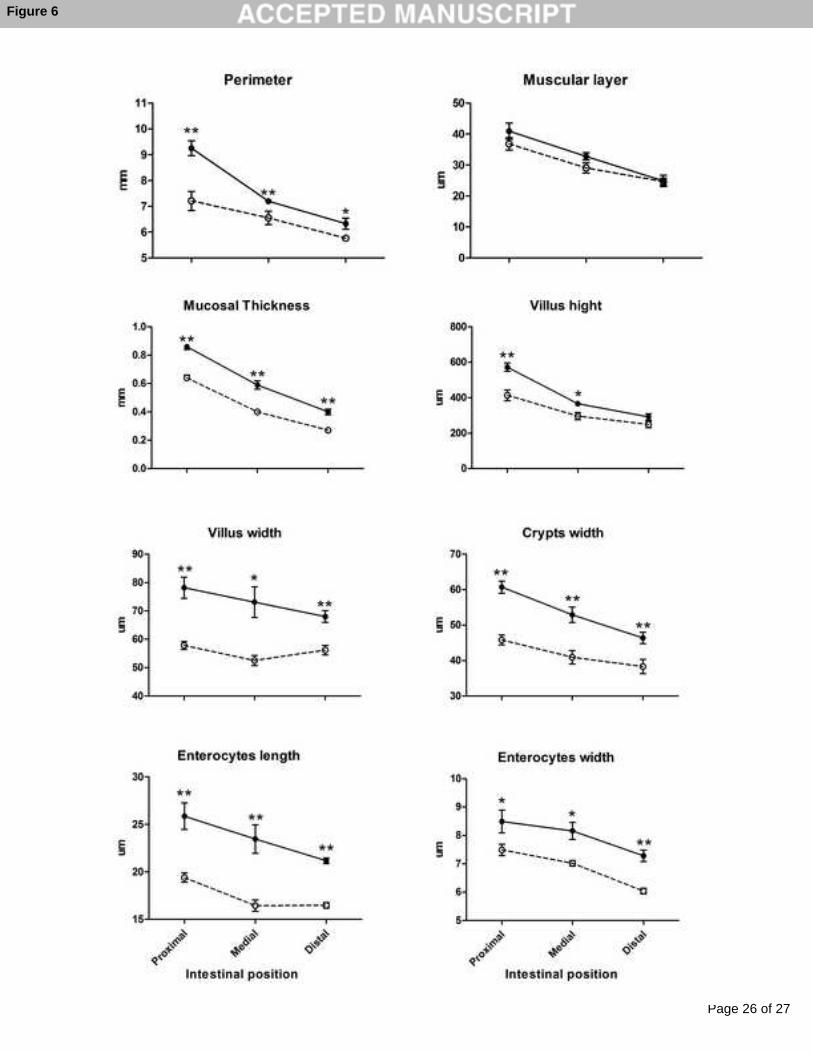
The perimeter (mm) of the intestine of fasted animals was significantly reduced in all
portions (Proximal: 9.25 ± 0.289 vs. 7.61 ± 0.369; Medial 7.20 ± 0.100 vs. 6.55 ± 0.256;
Distal: 6.33 ± 0.219 vs. 5.76 ± 0.087). However, the muscular layer thickness (µm) did not
show significant differences after fasting (Proximal: 40.93 ± 2.628 vs. 36.813 ± 1.999; Medial
32.80 ± 1.163 vs. 29.06 ± 1.636; Distal: 24.86 ± 1.811 vs. 24.64 ± 1.122) in contrast to
observations in mucosal layer thickness (mm) where a significant reduction was observed
(Proximal: 0.865 ± 0.02 vs. 0.638 ± 0.018; Medial 0.586 ± 0.026 vs. 0.404 ± 0.014; Distal:
0.402 ± 0.019 vs. 0.273 ± 0.010). In fasting animals, villus size (µm) showed a significant
reduction in length (Proximal: 572.48 ± 23.805 vs. 413.66 ± 30.084; Medial 366.05 ± 14.859
vs. 296.49 ± 19.929; Distal: 291.76 ± 18.146 vs. 249.33 ± 18.091) and width (expressed in
µm Proximal: 78.18 ± 3.653 vs. 57.84 ± 1.410; Medial 73.09 ± 5.444 vs. 52.51 ± 1.781;
Distal: 68.03 ± 2.083 vs. 56.17 ± 1.732). Crypth width (µm) was reduced in all intestinal
portions compared to fed controls (Proximal: 60.71 ± 1.718 vs. 45.81 ± 1.443; Medial 52.94 ±
2.196 vs. 40.91 ± 1.893; Distal: 46.38 ± 1.581 vs. 38.33 ± 2.037). Also the enterocytes
parameters changed after fasting, length (Proximal: 25.86 ± 1.420 vs. 19.39 ± 0.519; Medial
23.45 ± 1.519 vs. 16.43 ± 0.558; Distal: 21.17 ± 0.265 vs. 16.47 ± 0.331) and width
(Proximal: 8.49 ± 0.401 vs. 7.49 ± 0.206; Medial 8.16 ± 0.345 vs. 7.019 ± 0.151; Distal: 7.28
± 0.195 vs. 6.04 ± 0.075) were significantly reduced (Figure 6 to see p-values). The surface
area enlargement factor or SEF did not show differences on fasted animals compared to

Page 11 of 27
Accep
ted
Man
uscr
ipt
11
controls (Proximal: 9.97 ± 0.357 vs. 9.65 ± 0.762; Medial 7.44 ± 0.309 vs. 7.90 ± 0.664;
Distal: 6.73 ± 0.289 vs. 6.90 ± 0.273), p > 0.4 in all cases.
2.4. Correlations among parameters
We performed correlations among histological parameters (perimeter, nominal surface
area, muscular layer, mucosal width, villus, crypt width, length and width of enterocytes and
enlargement mucosal factor). We found some interesting correlations between perimeter with
muscular layer, mucosal width, villus length and width of enterocytes (r > 0.85; p < 0.05);
villus length is more correlated with width of enterocytes (r=0.86; p < 0.05) than length of
enterocytes (r=0.7; p < 0.05).

Page 12 of 27
Accep
ted
Man
uscr
ipt
12
DISCUSSION
The digestive system is energetically extremely expensive. The regulation of its
physiological functions requires about 17-25% of the total oxygen consumption of the body
(Cant et al., 1996) and a high cellular turnover rate of the intestinal epithelium (Secor, 2005).
The intestinal structure and function have the ability to adaptively respond to changes in food
intake and energy requirement. Here we show that when adult house sparrows undergo long
term fasting their intestinal mass is drastically reduced, -44% after 34 hours of fasting
(corresponding with phase III). These results are consistent with what has been previously
described in the migrating passerine bird Sylvia atricapilla, -45% after 48 hours of fasting
(Karasov et al., 2004), and mice, -50% after 72 hours of fasting (corresponding with phase
III) (Sokolovic et al., 2007). The reduction in the mass of the digestive organs (-40% small
intestine and -46% liver) was larger compared to the decline in the body mass and non-
alimentary tissues such as the heart (around 24%), in agreement with the high-energy
requirements necessary for the maintenance of the digestive organs (Table 2). The ratio of
organ to body mass remained unchanged when comparing intestine length, heart mass,
pancreas mass and stomach mass with controls. Interestingly, the intestinal mass was reduced
~40% but its length declined by only ~14% compared to control animals. Consistent with this,
we observed a ~30% reduction of the intestinal mucosal layer, resulting in a shortening of
about 20% in villus length (28% in proximal portion to 15% in distal portion), a similar value
(19%) was obtained by Karasov (Karasov et al., 2004). The results obtained so far in mice are
controversial; some researchers found that villus height and crypt depth remained unchanged
during fasting (Chappell et al., 2003; Sokolovic et al., 2007), while others found a marked
effect (Nian et al., 2002; Shin et al., 2005). However, the muscle layer thickness remained
unchanged in birds and mammals, indicating no effect of fasting (Dou et al., 2002; Karasov et
al., 2004; Sokolovic et al., 2007)

Page 13 of 27
Accep
ted
Man
uscr
ipt
13
In starved animals the intestinal enterocyte width and length was reduced in different
proportions (~14% and ~26% respectively) resulting in a phenotypic change. Interestingly,
the cell morphology changed from cylindrical to cubic, suggesting that the surface exposed to
the lumen space is conserved. Accordingly, we found no changes in the surface area
enlargement factor (SEF) following long term fasting. The relation SEF/intestinal mass was
significantly increased (~69%), indicating that the food contact surface remained constant
despite the changes in the intestinal weight and length. This is supported by a 19% increase in
the nominal surface area/intestine mass ratio, suggesting an adaptive response in preparation
to refeeding. A reduction in the mucosal layer could affect the biochemical digestive capacity.
However, we found that the sparrows increased their digestive function and intestinal
enzymatic activities (sucrase-isomaltase and aminopeptidase-N) during fasting (Chediack et
al., 2012). Yet, the decrease in several parameters (e.g., lacteal ducts, Lieberükhn crypts)
suggests that the small intestine atrophied in response to starving, but the goblet cells
preservation may indicate a protective mechanism (Specian and Oliver, 1991) of the intestine.
ACKNOWLEDGEMENTS
Samanta Funes is a doctoral fellowship from CONICET. The authors thank to Dr. Jöel
Walicki and Dr. Yanina Ditamo for their thorough and critical reading of the manuscript.
References
Bauchinger, U., Wohlmann, A., Biebach, H., 2005. Flexible remodeling of organ size during
spring migration of the garden warbler (Sylvia borin). Zoology 108, 97-106.
Cant, J., McBride, B., Croom, W.J., 1996 The regulation of intestinal metabolism and its
impact on whole animal energetics. J Anim Sci 74, 2541-2553.

Page 14 of 27
Accep
ted
Man
uscr
ipt
14
Chappell, V.L., Thompson, M.D., Jeschke, M.G., Chung, D.H., Thompson, J.C., Wolf, S.E.,
2003. Effects of incremental starvation on gut mucosa. Digest Dis Sci 48, 765-769.
Chediack, J.G., Funes, S.C., Cid, F.D., Filippa, V., Caviedes-Vidal, E., 2012. Effect of fasting
on the structure and function of the gastrointestinal tract of house sparrows (Passer
domesticus). Comp Bioch Phys A 163, 103-110.
Dou, Y., Gregersen, S., Zhao, J., Zhuang, F., Gregersen, H., 2002. Morphometric and
biomechanical intestinal remodeling induced by fasting in rats. Digest Dis Sci 47, 1158-1168.
Dunel-Erb, S., Chevalier, C., Laurent, P., Bach, A., Decrock, F., Le Maho, Y., 2001.
Restoration of the jejunal mucosa in rats refed after prolonged fasting. Comp Bioch Phy A
129, 933-947.
Ferraris, R.P., Carey, H.V., 2000. Intestinal transport during fasting and malnutrition. Annu
Rev Nutr 20, 195-219.
Karasov, W., Berry Pinshow, Starck, Matthias J., Daniel Afik, 2004. Anatomical and
histological changes in the alimentary tract of migrating blackcaps (Sylvia atricapilla): A
comparison among fed, fasted, food restricted, and refed birds. Physiol Biochem Zool 77,
149-160.
Khalilieh, A., McCue, M.D., Pinshow, B., 2012. Physiological responses to food deprivation
in the house sparrow, a species not adapted to prolonged fasting. Am J Physiol - Reg I 303,
R551-R561.
Kisielinski, K., Willis, S., Prescher, A., Klosterhalfen, B., Schumpelick, V., 2002. A simple
new method to calculate small intestine absorptive surface in the rat. Clin Exp Med 2, 131-
135.
MacDonal, O., Chediack, J., Caviedes-Vidal, E., 2008. Isolation of epithelial cells, villi and
crypts from small intestine of pigeons (Columba livia). Biocell 32, 219-227.
Page 15 of 27
Accep
ted
Man
uscr
ipt
15
McCue, M.D., 2010. Starvation physiology: Reviewing the different strategies animals use to
survive a common challenge. Comp Biochem Phys A 156, 1-18.
McNab, B.K., 2009. Ecological factors affect the level and scaling of avian BMR. Comp
Biochem Phy A 152, 22-45.
Nian, M., Gu, J., Irwin, D.M., Drucker, D.J., 2002. Human glucagon gene promoter
sequences regulating tissue-specific versus nutrient-regulated gene expression. Am J Physiol -
Reg I 282, R173-R183.
Paul-Murphy, J., Fialkowski, J., 2001. Injectable anesthesia and analgesia of birds: Recent
advances in veterinary anesthesia and analgesia: Companion animals. International Veterinary
Ithaca, New York, USA.
Secor, S.M., 2005. Evolutionary and cellular mechanisms regulating intestinal performance of
amphibians and reptiles. Integr Comp Biol 45, 282-294.
Shin, E.D., Estall, J.L., Izzo, A., Drucker, D.J., Brubaker, P.L., 2005. Mucosal adaptation to
enteral nutrients is dependent on the physiologic actions of glucagon-like peptide-2 in mice.
Gastroenterology 128, 1340-1353.
Sokolovic, M., Wehkamp, D., Sokolovic, A., Vermeulen, J., Gilhuijs-Pederson, L., van
Haaften, R., Nikolsky, Y., Evelo, C., van Kampen, A., Hakvoort, T., Lamers, W., 2007.
Fasting induces a biphasic adaptive metabolic response in murine small intestine. BMC
Genomics 8, 361.
Specian, R.D., Oliver, M.G., 1991. Functional biology of intestinal goblet cells. Am J Physiol
- Cell Ph 260, C183-C193.
Starck, M.J., 2003. Shaping up: how vertebrates adjust their digestive system to changing
environmental conditions. Anim biol 53, 245-257.
Wang, T., Hung, C.C.Y., Randall, D.J., 2006. The comparative physiology of food
deprivation: From feast to famine. Annu Rev Physiol 68, 223-251.

Page 16 of 27
Accep
ted
Man
uscr
ipt
16
Zeng, L.-Q., Li, F.-J., Li, X.-M., Cao, Z.-D., Fu, S.-J., Zhang, Y.-G., 2012. The effects of
starvation on digestive tract function and structure in juvenile southern catfish (Silurus
meridionalis Chen). Comp Biochem Phy A 162, 200-211.

Page 17 of 27
Accep
ted
Man
uscr
ipt
17
Figure legends
Figure 1. Proximal portion of small intestine of control (a-b) and long-term fasting (c)
groups. a Section showing mucosal (m), submucosal (sm), and muscular layers (mu); and
serosal surface (se). Scale bar 500 µm. b and c Images that show a reduction of the mucosal
layer thickness (m) and villi length (v). Scale bar 250 µm. Hematoxylin-eosin staining.
Figure 2. Medial portion of small intestine of control (a, b, d, e) and fasting birds (c, f, g). a
Lower magnification of medial portion. Scale bar 500 µm. b and c Photographs of the villi
center showing a reduction of the lamina propia thickness (lm) and the enterocyte height (e).
Scale bar 25 µm. d-g Lieberükhn crypts (L) and the number of mitotic cells (arrows) were
reduced in fasting birds compared with controls. d and f Scale bar 100 µm. e and g Scale bar
25 µm. Hematoxylin-eosin staining.
Figure 3. Distal portion of small intestine of feeding (a-c) and starving (d) birds. a Lower
magnification of distal portion. Scale bar 500 µm. b Parts of the mucosal epithelium (ep) and
the connective tissue core (lm) of villus. Inset Columnar epithelium with a prominent brush
border (*) and a globet cell (arrow). Scale bar 25 µm. c Developed lacteal ducts (ld) in the
connective tissue core of villi; d the length of the lacteal ducts (ld) declined in fasted birds.
Scale bar 25 µm. Hematoxylin-eosin staining.
Figure 4. The number of globet cells (arrows) in the mucosal epithelium increase from
proximal to distal portions of small intestine in feeding (a-c) and long-term fasting (d-e)
groups. a and d Proximal portions; b and e Medial portions; c and f Distal portions. Scale bar
25 µm. Periodic acid-Schiff (PAS) staining.

Page 18 of 27
Accep
ted
Man
uscr
ipt
18
Figure 5. Vesicles PAS-positive are moving from crypts to intestinal lumen in the control (a-
c) and fasted (d-f) groups. a and d Vesicles at the proximal portion (arrows). Scale bar 250
µm. b, c, e and f Images of medial portions, the vesicles PAS-positive are numerous in the
fasted birds. Scale bar 25 µm. Periodic acid-Schiff (PAS) staining.
Figure 6. Mean histological parameters (± SE) in all intestinal regions and treatments (Fed
group: filled circle, solid line; Fasting group: open circle, dotted line). Asterisk represent
significantly different between treatments in each intestinal portion (p < 0.05 by ANOVA). *
(p < 0.05) ** (p < 0.01).

Page 19 of 27
Accep
ted
Man
uscr
ipt
Table I: Effect of fasting on morphological parameters (table A) and morphological parameters relativized by body mass (table B) of sparrows
(n=11 en both experimental groups).
Control Fasted p-value
Small intestine wet mass (g) 1.08 ± 0.15 0.65 ± 0.05 0.017
Small intestine length (cm) 17.23 ± 0.74 14.83 ± 0.51 0.02
Liver wet mass (g) 0.86 ± 0.067 0.45 ± 0.02 0.0001
Pancreas wet mass (g) 0.13 ± 0.01 0.10 ± 0.005 0.016
Stomach wet mass (g) 0.78 ± 0.06 0.59 ± 0.02 0.0018
Heart wet mass (g) 0.37 ± 0.015 0.28 ± 0.016 0.001
Nominal surface area (cm2) 12.82 ± 0.77 9.65 ± 0.86 0.018
Control Fasted p-value
Small intestine wet mass/body mass 0.0413 ± 0.0044 0.030 ± 0.022 0.041
Small intestine length/body mass 0.70 ± 0.02 0.66 ± 0.07 0.319
Liver wet mass/body mass 0.0301 ± 0.0035 0.021 ± 0.001 0.001
Pancreas wet mass/body mass 0.0051 ± 0.0004 0.0048 ± 0.0003 0.52
Stomach wet mass/body mass 0.0305 ± 0.0019 0.0282 ± 0.001 0.31
Heart wet mass/body mass 0.0153 ± 0.0006 0.0136 ± 0.0007 0.76
Nominal surface area (cm2) /body mass 0.49 ± 0.17 0.45 ± 0.38 0.79
Table A
Table B
Table I

Page 20 of 27
Accep
ted
Man
uscr
ipt
Table II: Abundance of goblet cells and vesicles PAS-positive on small intestine in control and fasted groups.
The values are expressed as mean ± SEM (n= 4). * represent significant differences between control and fasted groups in each intestinal region p
< 0.05. RM-ANOVA followed by Tukey test was used to comparisons between intestinal regions in each group; a p < 0.05;
b p < 0.001.
Control Group Fasted Group
Small intestine position Proximal Medial Distal Proximal Medial Distal
Nº goblet cells/AR 1.72 ± 0.46 7.62 ± 1.24a 22.19 ± 1.36b 2.27 ± 0.53 7.85 ± 0.54a 21.59 ± 1.89b
Area of vesicles PAS-positive (% AV)
0.71 ± 0.12 1.23 ± 0.25 0.24 ± 0.11a 2.36 ± 0.64* 2.09 ± 0.21* 0.49 ± 0.23a
Table II

Page 21 of 27
Accep
ted
Man
uscr
ipt
Figure

Page 22 of 27
Accep
ted
Man
uscr
ipt
Figure

Page 23 of 27
Accep
ted
Man
uscr
ipt
Figure 3

Page 24 of 27
Accep
ted
Man
uscr
ipt
Figure 4

Page 25 of 27
Accep
ted
Man
uscr
ipt
Figure 5
Page 26 of 27
Accep
ted
Man
uscr
ipt
Figure 6

Page 27 of 27
Accep
ted
Man
uscr
ipt
21
Research Highlights
We evaluated intestinal histology changes on a non-migrant bird undergoing fasting.
Starvation induces small bowel atrophy.
Starvation induced a decrease in the mass of the digestive organs around 40%.
Histological parameters of small intestine decrease after starvation.
Goblet cells were conserved after fasting indicating a protective tendency.