effect of geometry on the mechanisms for off bottom solids
TRANSCRIPT

1
Effect of Geometry on the Mechanisms for Off-Bottom
Solids Suspension in a Stirred Tank
Inci Ayranci1*
, Márcio B. Machado1, Adam M. Madej
2, Jos J. Derksen
1,
David S. Nobes2, and Suzanne M. Kresta
1
1 Department of Chemical and Materials Engineering, University of Alberta, Edmonton,
Alberta, Canada, T6G 2V4
2 Department of Mechanical Engineering, University of Alberta, Edmonton, Alberta,
Canada, T6G 2G8
* Corresponding author: Email: [email protected] Telephone: 1-780-492-9221
Fax: 1-780-492-2881 Mailing address: Department of Chemical and Materials
Engineering, University of Alberta, 7th
Floor ECERF, 9107-116 Street, Edmonton,
Alberta, CANADA, T6G 2V4
Abstract
This paper probes solids suspension mechanisms in stirred tanks. The hypothesis is
that at the point where solids are just suspended a critical flow condition exists close to
the bottom of the tank for a fixed solids content and similar geometries. The critical flow
condition may be dominated by the turbulence or by the mean flow. Two Lightnin A310
impellers with diameters of D=T/3 and D=T/2 were tested at varying off-bottom
clearances. The mean and the turbulent fluctuating velocities close to the bottom of the
tank were determined using both PIV and LES. The results showed that the mechanism of
solids suspension is different for the two impeller diameters. Turbulence is the dominant
mechanism for the T/3 impeller. For the T/2 impeller some combination of turbulence
and mean flow is required. A comparison between the two impeller diameters in terms of
power consumption suggests that solids suspension is more efficient when the turbulence
mechanism dominates.
Keywords: solids suspension mechanisms, multiphase flow, turbulence, mean flow,
impeller diameter, mixing
* Corresponding author email [email protected]
2
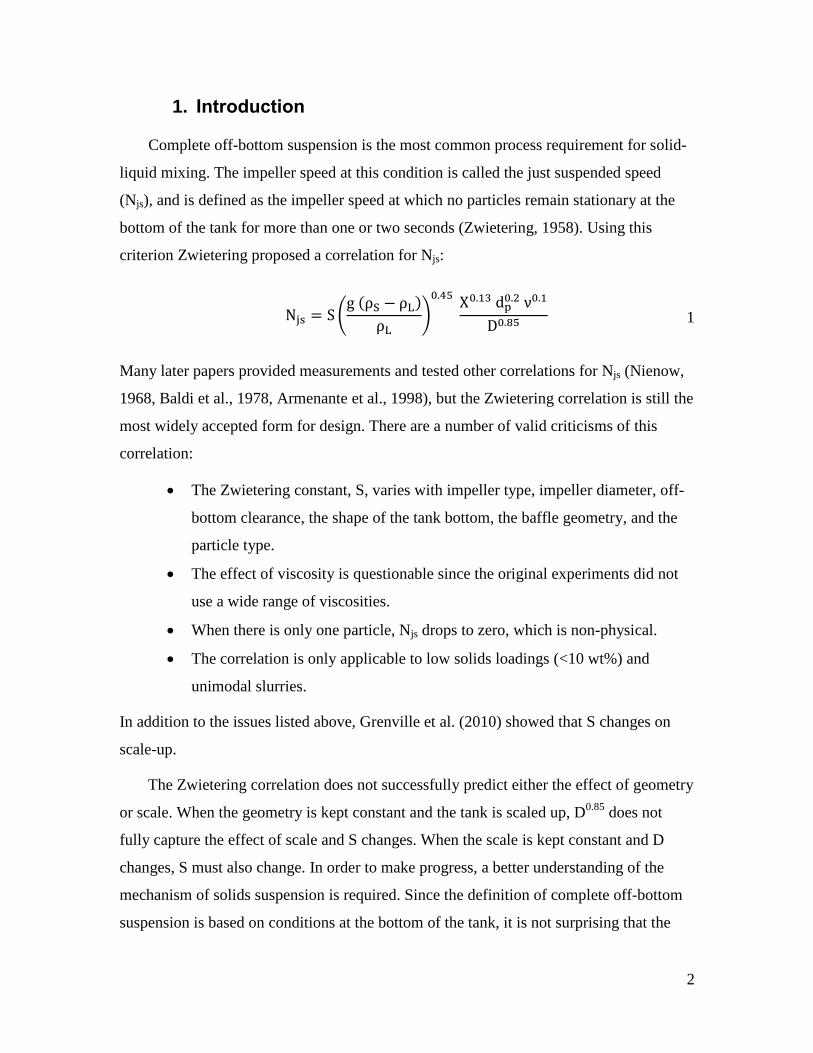
1. Introduction
Complete off-bottom suspension is the most common process requirement for solid-
liquid mixing. The impeller speed at this condition is called the just suspended speed
(Njs), and is defined as the impeller speed at which no particles remain stationary at the
bottom of the tank for more than one or two seconds (Zwietering, 1958). Using this
criterion Zwietering proposed a correlation for Njs:
( ( )
)
1
Many later papers provided measurements and tested other correlations for Njs (Nienow,
1968, Baldi et al., 1978, Armenante et al., 1998), but the Zwietering correlation is still the
most widely accepted form for design. There are a number of valid criticisms of this
correlation:
The Zwietering constant, S, varies with impeller type, impeller diameter, off-
bottom clearance, the shape of the tank bottom, the baffle geometry, and the
particle type.
The effect of viscosity is questionable since the original experiments did not
use a wide range of viscosities.
When there is only one particle, Njs drops to zero, which is non-physical.
The correlation is only applicable to low solids loadings (<10 wt%) and
unimodal slurries.
In addition to the issues listed above, Grenville et al. (2010) showed that S changes on
scale-up.
The Zwietering correlation does not successfully predict either the effect of geometry
or scale. When the geometry is kept constant and the tank is scaled up, D0.85
does not
fully capture the effect of scale and S changes. When the scale is kept constant and D
changes, S must also change. In order to make progress, a better understanding of the
mechanism of solids suspension is required. Since the definition of complete off-bottom
suspension is based on conditions at the bottom of the tank, it is not surprising that the

3
impeller diameter alone does not provide enough information. Additional variables such
as power number and the off-bottom clearance of the impeller provide more information,
but they are not necessarily good predictors of the critical flow condition at the bottom of
the tank. To make progress, more information is needed about the critical conditions at
the bottom of the tank at the just suspended point and how the tank geometry affects
solids suspension.
Baldi et al. (1978) suggested that turbulent eddies are the cause of solids suspension
in a stirred tank. Eddies have a range of sizes and energies. Eddies that are close to the
particle size are most likely to suspend the particles. This is often generalized to the idea
that more solids can be suspended if there is more turbulence or the idea that constant
power per volume is a reasonable scale-up rule. Both of these statements are flawed. To
illustrate the problem consider two impellers: the Rushton turbine and the A310 impeller.
The Rushton turbine is a radial impeller which provides intense turbulence, and the A310
is an axial impeller which provides mostly flow (Zhou and Kresta, 1996). The A310,
however, is known to be better for solids suspension with a much lower Pjs than the
Rushton turbine (Ayranci and Kresta, 2011). There are two reasons for the failure of the
Rushton turbine in suspending solids. First is the location of the turbulence. The Rushton
turbine generates turbulence around the impeller, not at the tank bottom. The A310
directs all of the turbulence it generates towards the bottom. Second is the direction of the
flow. The Rushton turbine discharges the fluid radially towards the walls where it divides
into two circulation loops one above and one below the impeller. The loop below the
Rushton turbine reaches the tank bottom and flows towards the centre of the tank where
the particles tend to drop out with no means of resuspension. The discharge of the A310
goes directly to the tank bottom and then turns outwards towards the walls. Once it
reaches the walls, the baffles direct the fluid and solids upwards, making the solids
suspension more efficient.
Next consider two tanks, both with A310 impellers, but different shapes of tank
bottom: one has a flat bottom and one has a dished bottom. With the flat bottomed tank,
the last point of suspension is at the tank walls, as described above, while with a dished
bottom it is in the centre. If the baffles are profiled to fit close to the tank bottom in the
dished tank, Njs is much higher than if they are left as rectangular baffles (Myers and

4
Fasano, 1992). The just suspended speed is clearly sensitive to both the overall flow
patterns and the details of the flow close to the bottom of the tank.
Important outcomes of these examples can be summarized as:
Njs depends on the conditions at the bottom of the tank.
Changing the impeller geometry completely changes the bottom conditions.
Details of the flow close to the bottom can make a large difference to Njs.
These outcomes highlight an important point also emphasized by Thorpe and Stevenson
(2003): if the turbulence is not sufficient for solids suspension and other parameters such
as the flow pattern have an effect, then some mechanism in addition to turbulence must
also play a role in solids suspension.
The hypothesis is further developed using an example with a much simpler
geometry. First, the turbulent velocity is broken into two components: the mean velocity
and the root mean square of the turbulent fluctuating velocity. Some combination of the
velocity components provides the required conditions for solids suspension. To form a
better hypothesis of which mechanisms might determine the solids suspension condition,
the contribution from each of these velocity components should be well understood.
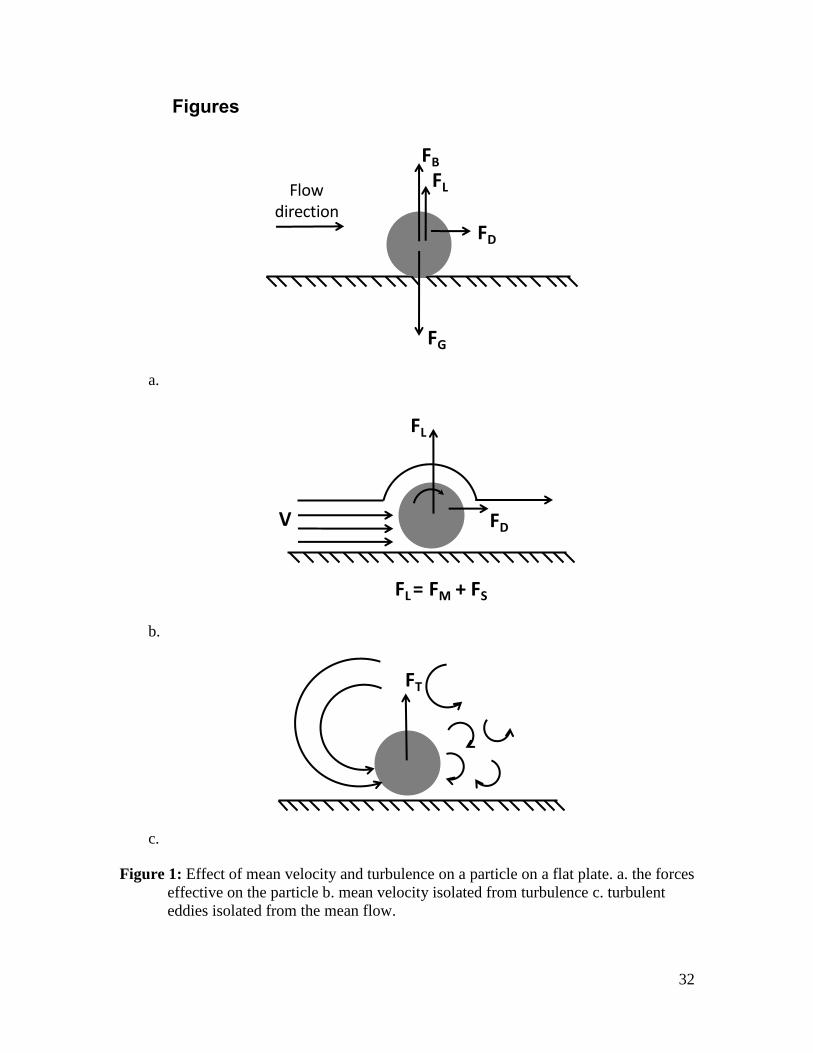
Consider flow over a smooth flat plate with a single particle. When the particle is
sitting on the plate as shown in Figure 1a the forces acting on the particle are gravity
(FG), buoyancy (FB), drag (FD), and lift (FL). The effect of friction on a rough surface is
discussed later in the paper. In Figure 1b the mean flow on the particle is isolated from
the turbulence. The mean flow needs to go over the sphere. This imposes both boundary
layer and form drag on the particle and it starts to roll or slide along the plate. A pressure
difference will develop between the top and bottom of the particle due to the asymmetry
of the flow. The pressure difference applies a lift force on the particle. If FL>FG, the
particle lifts off the plate. The lift forces that are caused by the shear and rotation of the
particle are known as the Saffman force, FS, and the Magnus force, FM, respectively. In
Figure 1c the turbulence is isolated from the mean flow. The eddies formed in a turbulent
flow have different energies and sizes. The smallest eddies will not affect the particle.
The largest eddies have a convective effect and will act similarly to the mean flow. A
range of intermediate sized eddies will have sufficient energy to suspend the particle

5
when they hit it, and will also have a size that is similar to the particle size (Baldi et al.,
1978). This is shown as the turbulence force, FT in Figure 1c. In this simple case,
illustrated with a single particle on a flat plate, both the mean flow and the turbulence can
play a role in suspending the sphere.
In a stirred tank with an axial impeller, the solids are carried towards the walls by the
mean radial velocity where they meet baffles and the associated vertical wall jets which
work as elevators for the particles at the tank walls (Bittorf and Kresta, 2003). The
particles that are carried towards the walls are easier to suspend and circulate in the tank,
which explains the importance of selecting an axial flow impeller for solids suspension.
At the same time as the mean radial velocity convects particles toward the walls, the axial
component of fluctuating velocity lifts the particles off the bottom of the tank and into the
strong circulating flow. In a hypothetical case where only turbulence is present in the tank
without any mean flow, the turbulent eddies can suspend the particles; however, this is a
short term suspension since the particles are suspended only slightly from the bottom by
the intermediate sized eddies. Each particle settles quickly and is resuspended at some
later time, failing on average to lift all particles from the bottom of the tank. Since there is
no mean flow the particles are not carried towards the walls and they are not circulated
throughout the tank.
Now consider a second hypothetical case where there is only mean flow and no
turbulence. The particles are easily carried towards the walls. They are slightly lifted as a
result of the combination of drag and lift forces; however, this does not provide complete
suspension at the bottom. The particles pile up at the periphery of the tank in low velocity
regions. At the walls the radial mean flow is redirected into axial mean flow. This
suspends many particles that are at the top layer of the pile; however, a significant
fraction of the particles remain stationary at the periphery since there is no turbulence to
push them up and out of the stagnant zone they are in. These thought experiments suggest
that the complete off bottom suspension condition in a stirred tank could easily require
contributions from both velocity components.
Solids suspension has been extensively studied in two other research areas: slurry
pipeline flow and river sediment transport. In both flows, the effects of mean flow,

6
turbulence, and near wall lift have been considered. These results are considered next and
their applicability to stirred tanks is discussed.
Thorpe and Stevenson (2003) compared solids suspension in stirred tanks and slurry
pipeline flow in terms of the definition of suspension and the form of the correlations.
The deposition velocity, the minimum solid transport rate below which the particles start
accumulating at the pipe wall, is analogous to Njs in stirred tanks. The main mechanisms
for solids suspension in slurry pipelines are turbulent diffusivity (fluctuating velocity) and
near wall lift. In the core region turbulent diffusion provides solids suspension. Near the
wall, the turbulence is diminished in the viscous sub-layer. In the horizontal plane close
to the viscous sub-layer there is a downwards flux of particles; however, there is no
upward flux of particles caused by the turbulence since it is not effective in the viscous
sub-layer. In this sub-layer, the balance of the flux of particles is supported by another
mechanism which is the near wall lift (Wilson, 2005). This is where the Saffman and
Magnus forces become important vertical forces. Recently, Wilson et al. (2010) reported
the importance of the ratio of the particle size to the thickness of the viscous sub-layer.
When the particle size is small the particles are submerged in the viscous sub-layer. For
larger particles, no particles remain in the viscous sub-layer. The thickness of the viscous
sub-layer changes according to the mean flow. Higher mean flow results in a thinner
viscous sub-layer. This affects the importance of near wall lift, since the ratio of the
particle size to viscous sub-layer thickness changes. Turbulence, near wall lift, and the
mean flow are all active in providing solids suspension for slurry pipeline flows.
Molerus and Latzel (1987) reported boundary layer effects in stirred tanks. Based on
the wall friction on pipeline flow they related a shear Reynolds number for the boundary
layer to the Archimedes number (Ar), and defined limits on Ar to determine whether the
particle is submerged in the viscous sub-layer.
(
)
2
Molerus and Latzel showed that the particles are submerged in the viscous sub-layer if
Ar<40. Larger particles extend beyond the viscous sub-layer, and therefore, different

7
mechanisms apply for these particles. It seems that the Ar does not include a velocity
term. The thickness of the viscous sub-layer, however, decreases with an increase in
velocity. To test the validity of the argument of a limit on Ar to determine the position of
the particle with respect to the viscous sub-layer the details of the Ar should be analyzed.
Ar is the ratio of gravitational forces to viscous forces.
(
)
3
The velocity, U, is present in this initial form of the Ar, but not in the final form, so it
cancels out in the derivation. Since the focus is on the viscous sub-layer, the length scale,
x, can be assumed to be the thickness of the viscous sub-layer, , and the velocity, U,
becomes U*, the shear velocity. If , then the particle is submerged in the viscous
sub-layer. The limiting point is when . Applying this limit and the assumptions to
Equation 3 gives
(
)
4
The U* is still present in the equation. In slurry pipeline flow a dimensionless particle
diameter, d+
is used to determine whether the particle is submerged in the viscous sub-
layer (Wilson et al., 2010).
5
If d+<9, then the particle is completely submerged in the viscous sub-layer, and if d
+>27,
then the particle is significantly larger than the viscous sub-layer and starts to protrude
into the logarithmic layer. The near wall lift applies when 9<d+<27. This is a limit given
for the slurry pipeline transport. Since d+ is dimensionless, it can be interpreted as some
ratio of the particle diameter to . In general, for flow close to a solid surface it is known
that the viscous sub-layer is located at y+ 5 (Davies, 1972):
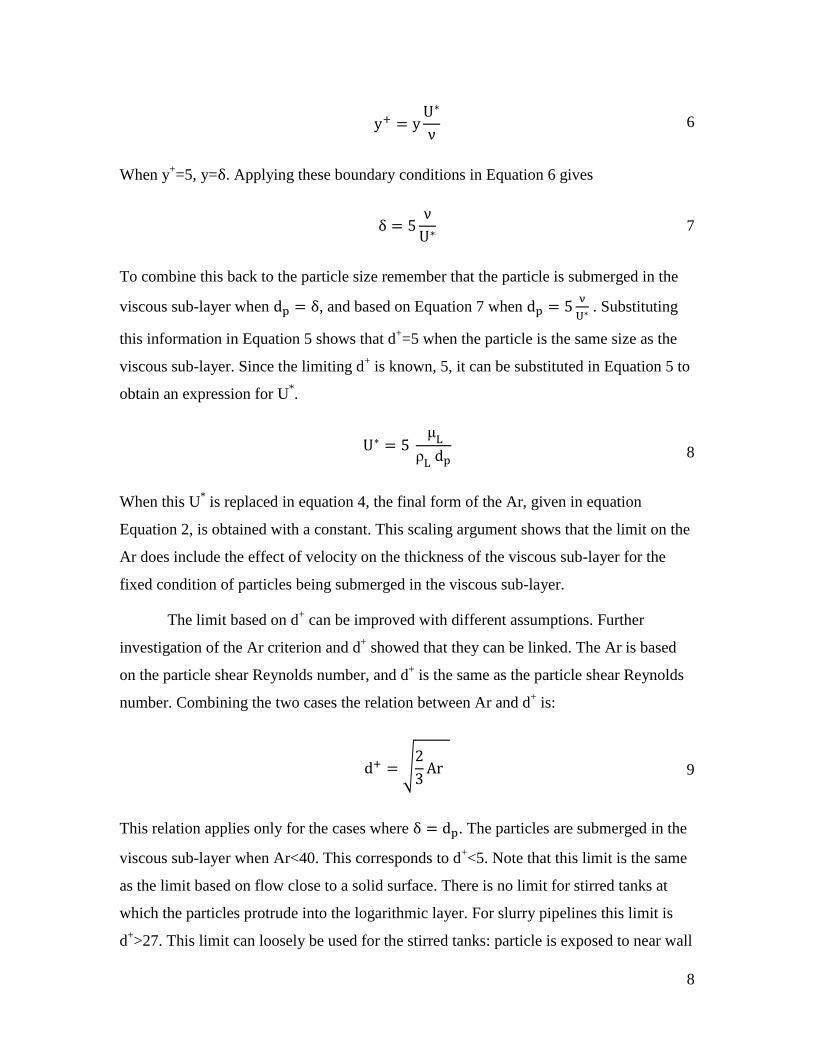
8
6
When y+=5, y= . Applying these boundary conditions in Equation 6 gives
7
To combine this back to the particle size remember that the particle is submerged in the
viscous sub-layer when , and based on Equation 7 when
. Substituting
this information in Equation 5 shows that d+=5 when the particle is the same size as the
viscous sub-layer. Since the limiting d+ is known, 5, it can be substituted in Equation 5 to
obtain an expression for U*.
8
When this U* is replaced in equation 4, the final form of the Ar, given in equation
Equation 2, is obtained with a constant. This scaling argument shows that the limit on the
Ar does include the effect of velocity on the thickness of the viscous sub-layer for the
fixed condition of particles being submerged in the viscous sub-layer.
The limit based on d+ can be improved with different assumptions. Further
investigation of the Ar criterion and d+ showed that they can be linked. The Ar is based
on the particle shear Reynolds number, and d+ is the same as the particle shear Reynolds
number. Combining the two cases the relation between Ar and d+ is:
√
9
This relation applies only for the cases where . The particles are submerged in the
viscous sub-layer when Ar<40. This corresponds to d+<5. Note that this limit is the same
as the limit based on flow close to a solid surface. There is no limit for stirred tanks at
which the particles protrude into the logarithmic layer. For slurry pipelines this limit is
d+>27. This limit can loosely be used for the stirred tanks: particle is exposed to near wall

9
lift when 5<d+<27, and it protrudes into the logarithmic layer when d
+>27. An exact
quantitative upper limit cannot be given for stirred tanks because of the complexity of
boundary layer development at the bottom of a stirred tank.
River sediment transport is another area where solids suspension has been widely
discussed. The motion of solids is caused by the mean flow over a bed of sediment. At
very low velocities no sediment moves. At higher velocities individual particles start
rolling and sliding intermittently along the bed. As the velocity is further increased the
drag and lift on the particles increases; some particles start to make short jumps, leave the
bed for a short time and return either to come to rest or to continue in motion on the bed
and undergo further jumps. If the mean velocity increases slightly, the particles jump
more frequently and some of the grains are incorporated into the main body of the flow
by the upward components of the turbulence. They may then stay in suspension for
appreciable lengths of time (Vanoni, 2006).
The size of the unsuspended sediment particles determines the surface roughness of
the bed, which in turn affects the flow velocity distribution and its sediment transport
capacity. If the bottom boundary is smooth, turbulence will be suppressed in the viscous
sub-layer near the bed and the capacity of turbulence to suspend solids will be
dramatically decreased. This is rarely the case in rivers. Most boundaries in alluvial rivers
are hydraulically rough; therefore, there is no viscous sub-layer formation. Turbulence
becomes the main mechanism in solids suspension from the bed (Garcia, 2008). The
effect of bottom roughness on Njs in a stirred tank was studied by Ghionzoli et al. (2007).
Their study showed that the Njs of particles which have a diameter smaller than 10 η,
where η is the Kolmogoroff length scale, is reduced on a rough bottom while the Njs for
larger particles stays the same. The bottom roughness determines the turbulent eddy size
and allows the turbulence to be the controlling mechanism for solids which are well
matched to the defining eddies.
This analysis of related research areas shows that mean flow and turbulence are the
main mechanisms for solids suspension. It seems that both of these mechanisms are
necessary for solids suspension: either one of them acting alone may not be sufficient to
suspend the solids throughout the volume of a stirred tank In some cases one of the

10
mechanisms may dominate. At the larger scale, the mean flow carries the particles
towards the walls. In the boundary layer, the velocity gradient due to the mean flow rolls
and/or slides the particles and lifts them out of the viscous sub-layer so that they can be
carried towards the walls by the bulk flow. At the same time turbulent eddies of a similar
size and inertial energy of the particles lift particles for short periods of time, again
exposing them to the bulk flow. We hypothesize that both the mean flow and the
turbulent eddies are necessary for solids suspension, but if there is sufficient turbulence
with the required eddy size, then the eddies will be the main mechanism that suspend the
particles. If there is sufficient mean flow, the turbulence will still contribute to solids
suspension, but the mean flow will dominate.
To test this hypothesis, experiments were designed to apply gradual changes to
the flow field using constant solid species and solids concentration to compare the critical
flow conditions at the just suspended speed. The desired changes are small enough to
keep the circulation pattern the same, but large enough to observe a difference in the
decay of the impeller discharge stream. Varying the off-bottom clearance of an A310
impeller was chosen as the best way to achieve this objective. If convection across the
tank bottom (mean flow) is the dominant mechanism for solids suspension, then all of the
mean radial velocity profiles, properly scaled to Njs, should collapse onto a single profile
for all clearances. In this case the turbulent eddies are still necessary, but their
contribution is not sufficient to obtain complete off-bottom suspension. If it is the
turbulent eddies which dominate, then the axial rms (root mean square) velocity profiles
should collapse onto a single profile for all clearances, and the mean flow profiles will
most likely be scattered. The dominant mechanism is tested for two impeller diameters.
The analysis of the dominant mechanism requires the analysis of a collapse in the
velocity profiles. This collapse is based on the differences between the single phase
velocity profiles and the velocity profiles scaled to Njs. The analysis can be done by
visual inspection and by inspecting the change in standard deviation. Both these analyses
are done to test the hypothesis. An additional analysis based on the particle-eddy
interactions is also included.

11
2. Experimental Procedures
To test the hypothesis stated above a three-step plan was prepared. First, the Njs of
four slurries (three at low and one at high solids loading) was measured at varying off-
bottom clearances. Second, single phase velocity profiles, the mean radial velocity and
the axial fluctuating velocity, were measured using PIV (particle image velocimetry) and
calculated with LES (large eddy simulations) over a horizontal plane close to the tank
bottom for the same range of geometries. Third, the velocity profiles were scaled to the
just suspended condition at every clearance to identify whether a single critical flow
condition exists at the bottom of the tank.
2.1. Njs experiments
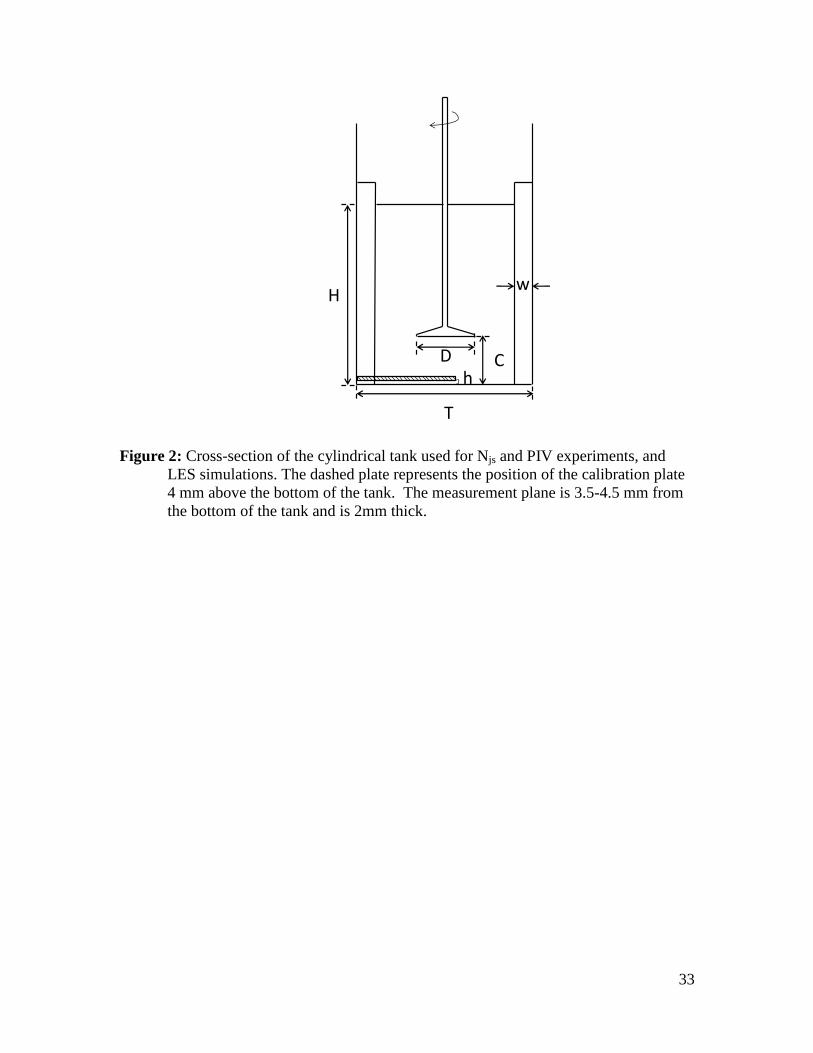
Njs was measured as a function of off-bottom clearance in a flat bottomed cylindrical
tank with an inner diameter of 0.24 m, shown in Figure 2. The tank was equipped with
four baffles (W=T/10). The liquid level in the tank was equal to the tank diameter (H=T).
Two Lightnin A310 impellers with diameters D=T/3 and D=T/2 were used. The A310
was chosen for this study because it generates a purely axial flow and is efficient for
solids suspension in terms of the power consumption at Njs. The off-bottom clearance,
C/T, was varied from 0.15 to 0.358 for the T/3 impeller, and from 0.125 to 0.333 for the
T/2 impeller to ensure that the impeller stream reached all the way to the tank bottom in
all cases. The liquid phase was tap water in all experiments. The cylindrical tank was
placed in a square tank in order to minimize the optical distortion, and these two tanks
were bolted onto a platform which is open in the middle, in order to leave the bottom of
the tank visible from below. More details about the experimental setup and the procedure
are given in Ayranci and Kresta (2011).
The just suspended speed, Njs, is determined visually by watching the bottom of the
tank. Njs is the impeller speed at which no particle remains stationary at the bottom of the
tank for more than 1 or 2 seconds (Zwietering, 1958). The impeller speed was increased
gradually, and after the system reached steady state (1 to 2 minutes) the bottom of the
tank was observed. Four slurries were used in the experiments; unimodal slurries of small
glass beads (SG), large glass beads (LG), and bronze (B) at low solids loadings and a
mixture of small glass beads with bronze at high solids loadings. The specifications of the
12
particles are given in Table 1. The solids loadings of the unimodal slurries of SG, LG and
B were 1.5 wt%, and the SG+B mixture loading was 26 wt% SG with 1.3 wt% B. The
mixture is at a high solids loading where the presence of particles may start to affect the
flow field so the single phase velocity data should be considered with some caution. The
data for the B slurry is available only for the T/3 impeller, because air entrainment was
excessive with the T/2 impeller.
2.2. PIV experiments
A stereoscopic PIV system was used to measure velocity profiles close to the tank
bottom. The PIV was composed of two high-resolution cameras (14bit, 2048×2048
pixels) which capture images of a seeded flow field illuminated with the double pulse of
an Nd:YAG laser (532nm, 10Hz, 400mJ of energy per pulse). The flow facility is a 240
liter glass walled holding tank (1200 mm length × 500 mm height × 400 mm width) in
which a 240mm diameter glass cylinder served as the mixing tank. The cameras viewed
the region-of-interest from below.
The PIV measurements followed a procedure outlined by Madej et al. (2011). The
water in the holding tank was evenly seeded with tracer particles (hollow glass spheres,
Potters Industries). The mean particle size of the tracer particles was 11 m and their
specific gravity was 1.1. They were sufficiently small and light to perfectly follow the
flow, so the measured particle velocities match the liquid velocity. The light sheet had a
thickness of ~2mm to capture the out-of-plane component of the flow. The stereoscopic
PIV system hence resolved the three components of the flow over a 2mm thick, two
dimensional plane. For each operating condition, 2 000 image pairs were recorded and
the time interval between the two images was set between 700 s and 1000 s, depending
on the off bottom clearance of the impeller. The lower time interval was used for lower
clearances, since the velocities at the bottom were higher when the clearances were
lower. The sampling frequency between each image pair was between 1.6 Hz and 2.5 Hz.
In order to determine the camera scaling and the image overlap a target was placed 4
mm above the bottom of the tank. Using the target data the images were dewarped and
the camera scaling was calibrated. This allowed the positioning of the 2mm thick
measurement plane 3.5-4.5 mm above the bottom of the tank. Image overlap was further

13
enhanced using a self-calibration of the data to locate the position of the laser sheet as it
overlaps with the target. The calibration plate had a diameter of 20 cm and, as shown in
Figure 2, it was positioned such that images can be taken from the centre of the tank to
the tank wall. Here, only data from the mid-baffle plane is reported.
A three-dimensional cross-correlation PIV algorithm was used to determine the
particle displacement over the time interval between the two images. From these
displacement vectors, velocity vectors were calculated using commercial software (Davis
7.4, LaVision). The resulting data field is an instantaneous snap-shot of the three
components of velocity over the measurement plane. Velocity data processing was
carried out using interrogation cell sizes of 64x64 pixels for the preliminary step and
32x32 pixels with 50 % overlap for the final step. At this final interrogation window size,
the determined velocity vector is an average over a physical region of 1.116 mm x 1.116
mm in plane by the thickness of the light sheet of ~ 2mm.
The glass tank used for the PIV measurements has the same dimensions as the tank
used for the Njs experiments, with the same ranges of off bottom clearances.
Measurements were carried out at a fixed Reynolds number of 48000.
e 2
10
A fixed rotational speed was used at all clearances: 200 rpm for the A310 T/2 and
450 rpm for the A310 T/3 impeller. This avoided shaft vibration and air entrainment at
high rotational speeds which would have made the PIV experiments more difficult. The
single phase velocities that were measured with PIV are referred to as “measured
velocities” throughout the paper. These are the only velocities that were measured. The
measured velocities were then scaled to complete off bottom suspension conditions using
the Njs determined for each off-bottom clearance.
measured
js
11

14
The Njs of the each solid species at each off-bottom clearance was used to scale the
measured velocities to the conditions where solids are present in the tank. These
velocities are referred to as “scaled velocities” throughout the paper.
Several authors have shown that velocity profiles below the impeller scale exactly
with the tip speed (ND) (Nouri et al, 1987, Zhou and Kresta, 1996). The range of
clearances used here falls within a range where this scaling can also be applied at the
bottom of the tank (Kresta and Wood, 1993). This was validated through some test
experiments.
2.3. LES simulations
A lattice-Boltzmann method was used to discretize the Navier-Stokes equations and
a force-field technique was employed to represent the effect of impeller, shaft, baffles and
tank wall on the fluid. In the lattice-Boltzmann method, the fluid flow can be considered
as a many-particle system where all the particles follow the laws of conservation of mass
and momentum (Derksen and Van den Akker, 1999). The particles reside on a uniform
cubic lattice. At every time step, particles move to neighboring lattice sites, collide, and
exchange momentum.
LES was chosen because of its flexibility in adapting to complex geometries,
providing detailed information and using less computer resources compared to DNS
(direct numerical simulations). In LES, small scale eddies are filtered out and the large
scale eddies are resolved. The effect of the small scale eddies on the large scale is
modeled using a subgrid-scale model. For this modeling, the Smagorinsky model with a
constant of cs = 0.1 was used.
A force-field technique was used to represent the cylindrical tank wall, rectangular
baffles, and revolving impeller and shaft in the cubic lattice. These are defined by points
on the surface. These points do not need to coincide with the lattice sites. The forces
acting on the flow are calculated in such a way that the fluid has prescribed velocities
(Derksen and Van den Akker, 1999) at these surface points. Applying the boundary
conditions results in the desired curved surface for the tank wall, the rectangular baffles,
and the rotating impeller and shaft.

15
A computational domain with 2003 grid nodes was used. The Reynolds number was
48000, which is the same as in the PIV experiments. The simulations were performed for
an A310 impeller with a diameter of D=T/3 at C/D=0.45, 0.675, 0.75, and 0.9. The entire
tank was simulated and the three velocity components were computed. The averages were
taken for several horizontal planes.
3. Results and Discussion
The results are presented in five major sections. First the effect of particle properties,
solids loadings and geometry (impeller diameter and off-bottom clearance) on Njs are
presented. Next the velocity profiles for the T/3 and the T/2 impeller are evaluated to
determine the solids suspension mechanism for each impeller and to examine whether the
dominant mechanism depends on the impeller diameter. After the analysis of the
experimental data, the hypothesis and the conclusions are compared with the LES results.
Finally, the power consumed by the two impellers is compared to better understand the
interaction between the observed mechanisms and power consumption.
3.1. Njs results
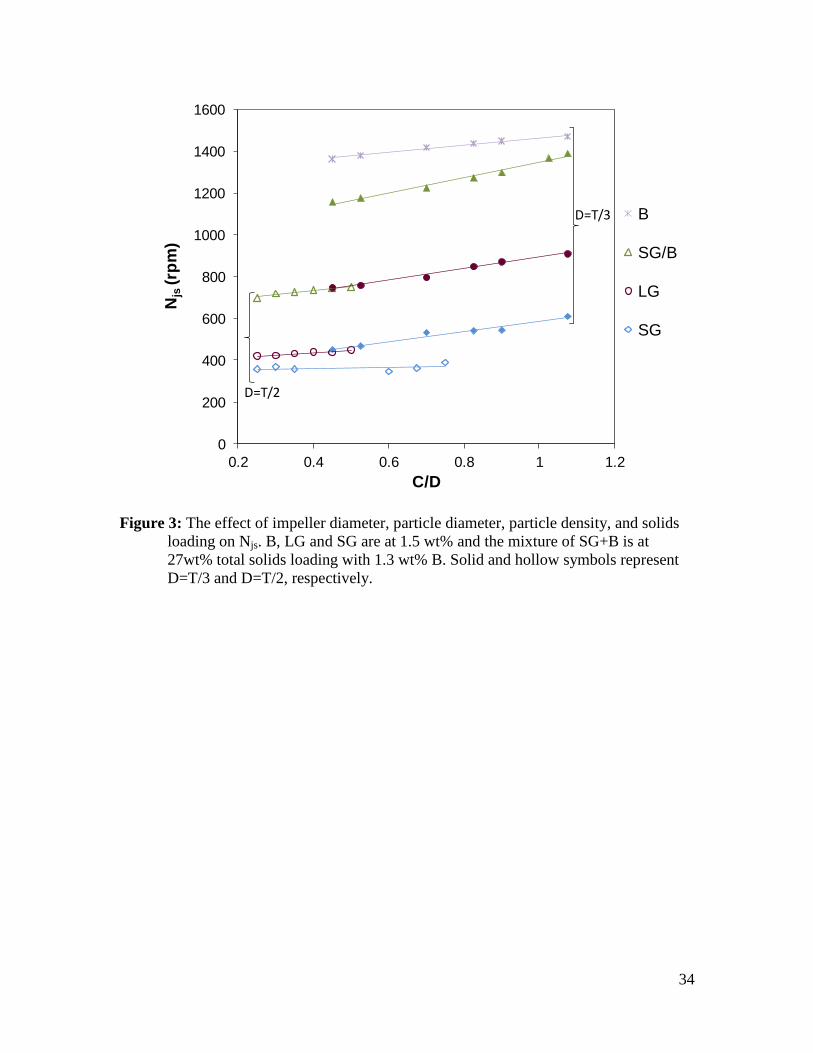
Figure 3 shows the Njs results for the T/2 and T/3 impellers for unimodal slurries of
B, LG and SG at 1.5 wt% and the mixed slurry of 26 wt% SG with 1.3 wt% B, all at
varying off-bottom clearances. Within the unimodal slurries the B has the highest density
and also the highest Njs. The LG and SG have the same density, but LG has a higher Njs
since it is 7 times larger than the SG. The mixed slurry has the highest solids loading, so
it has a higher Njs than the LG and the SG, but lower than the B because of particle-
particle interactions as explained in Ayranci and Kresta (2011). These trends are
consistent for both impeller diameters, and as expected, Njs is smaller for the larger
impeller diameter. As predicted by the Zwietering equation, an increase in the particle
density, particle size or solids loading - in the absence of particle-particle interactions -
results in an increase in Njs .
The effect of off-bottom clearance on Njs is more complex, as shown in Figure 4. At
off-bottom clearances, C/D, larger than 0.35, the particles collect close to the tank walls,
and are suspended from there when Njs is reached. At off-bottom clearances smaller than

16
0.35 the particles collect in the centre of the tank as well as at the tank walls. This is
because the A310 impeller cannot develop purely axial flow below the hub at low C/D
and the discharge of the impeller is quickly deflected to produce a swirling radial flow.
Figure 4 shows sample experimental observations of this behaviour for a slurry of
1.5wt% SG with 1.5wt% B with the D=T/2 impeller. At C/D=0.25 the particles collect
both in the centre and at the periphery of the tank, but when the off-bottom clearance is
increased to C/D=0.5 there is no accumulation in the centre: all the particles are at the
periphery of the tank. These two deposition patterns will be helpful for understanding
some of the later results.
3.2. Solids suspension mechanisms with the T/3 impeller
The evaluation of dominant solids suspension mechanism is based on a hypothesis
that the solids suspension occurs as a result of a combination of both mean flow and
turbulent eddies, and at the complete off-bottom suspension condition one of these
mechanisms, either the turbulence or the mean flow, should dominate for a fixed set of
particles. For a purely axial impeller, the flow pattern stays the same as the off-bottom
clearance is increased and thus the velocity component which is dominant at the point of
off-bottom suspension should also remain the same. If this hypothesis holds, a set of
velocity profiles should collapse onto a single curve for all off-bottom clearances when
the measured profiles are scaled to Njs at the respective clearances. This hypothesis is
evaluated based on both the visual inspection of scaled velocity profiles for mean radial
velocities, Vr, and axial rms velocities, vz , and the reduction in normalized standard
deviation for scaled Vr or vz over the range of clearances at each point in the profile. A
comparison of estimated eddy sizes with particle sizes was also made to further probe the
mechanisms. The analysis starts with the measured velocity profiles.
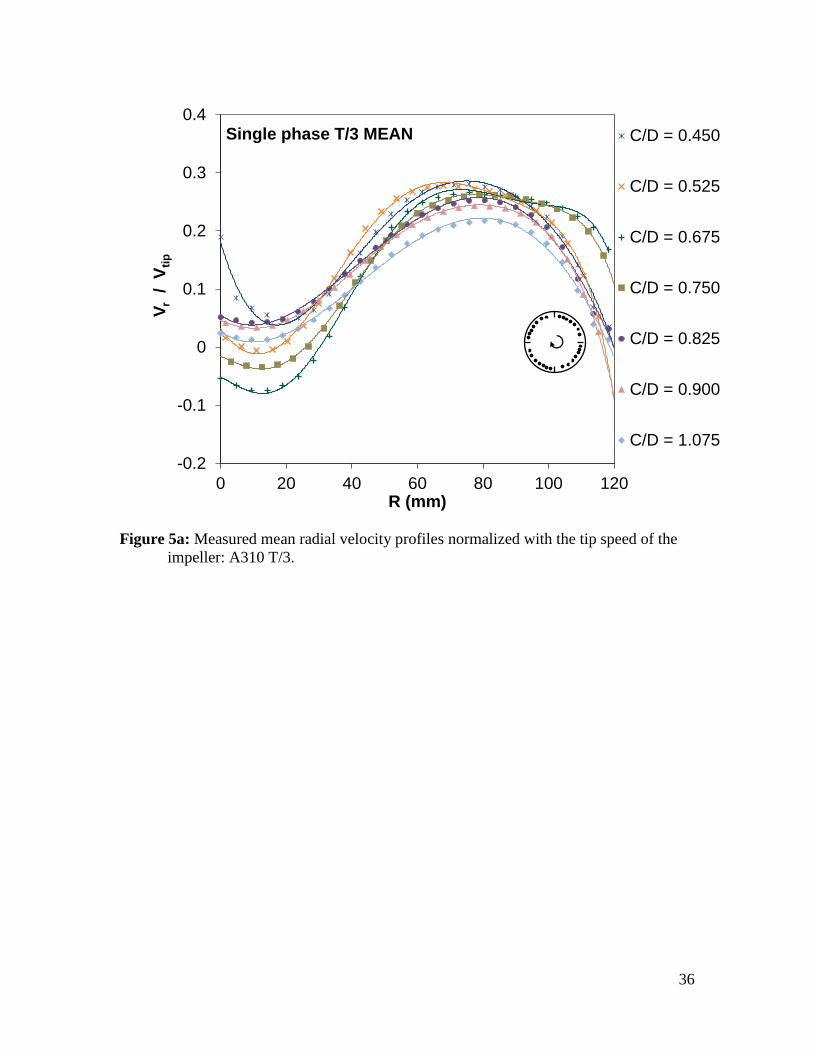
The measured Vr and vz at seven off-bottom clearances were normalized with the tip
speed of the impeller and are shown in Figure 5 a and b. The profiles in each graph show
similar trends for increasing off-bottom clearances, but they do not follow a definite
order. In Figure 5a the Vr profile for the highest clearance, C/D=1.075, is 12 % lower
than the other clearances in the 40-100 mm area. This is because the discharge of the
impeller loses a significant amount of momentum by the time it reaches the bottom of the

17
tank when the impeller is more than one impeller diameter away from the tank bottom.
While the data for this clearance in the centre blends in with the rest, it cannot sustain
similar level of velocities in the 40-100 mm area. This clearance was eliminated from the
rest of the figures because it violates the basic assumption of having a constant
circulation pattern. In Figure 5a another irregularity is seen for C/D=0.675 and C/D=0.75
in the 95-120 mm area. While the circulation pattern remains to be the same as the rest of
the clearances tested, a transition is seen. The maximum radial velocity can be sustained
longer at these off-bottom clearances. In Figure 5b for these two clearances the position
of the peak velocity is slightly shifted, and after 40 mm vz is slightly higher than the rest
of the data. The remaining profiles for both Vr and the vz are quite close to each other at
varying off-bottom clearances when normalized with tip speed. This indicates that the
expected collapse with either one of the velocity profiles may be difficult to determine by
inspection when the profiles are scaled. To allow a more objective assessment, the
collapse was also analyzed in terms of ∆σ, the point by point difference between the
standard deviation of the scaled velocity profiles and the measured velocity profiles for
each slurry.
The measured velocity profiles were scaled to Njs for four slurries: SG, LG, B, and
the mixture of SG with B. For all four slurries the last point of suspension is at the tank
walls. The SG slurry results were representative and are reported here. The scaled Vr
profiles in Figure 6a are scattered over most of the profile but collapse from 40-65 mm,
which is right after the tip of the blade, for all clearances when compared to the measured
velocities in Figure 5a. The scaled vz profiles in Figure 6b are scattered over the first 40
mm, which is the area below the impeller blades. From 40 mm to the tank walls the vz
profiles collapse, and the collapse becomes more significant after 80 mm. The vz profiles
collapse over most of the radius and the collapse is more significant than the small part in
Vr. This shows that some level of mean flow is necessary, but a certain level of
turbulence is required for solids suspension. The turbulence is the dominant mechanism
for solids suspension with the T/3 impeller.
While we categorize some parts of these figures as collapsed, the collapse is not
perfect and the measured profiles are quite close to each other for varying clearances, so

18
it is prudent to analyze the data from another perspective to verify that this initial
conclusion is correct.
The normalized standard deviation (σ) of the velocities for all six clearances was
calculated at each radial position for both velocity components (Vr and vz ).
√∑ (
)
12
Here n signifies the off-bottom clearance. For each impeller there are six off-bottom
clearances. xn is either Vr or the vz at the n
th off-bottom clearance, xmean is the mean of the
velocities at all off-bottom clearances. This calculation is repeated for every radial
position and the difference between the normalized standard deviation of the measured
and the scaled results, ∆σ, is calculated as:
[ √∑ (
)
]
[ √∑ (
)
]
13
The change in normalized standard deviation, ∆σ, is reported in Figure 7a and b for
Vr and vz and for all four particle species. Values above zero indicate that the profiles are
more scattered, and values below zero indicate that profiles have collapsed. The results
confirm the conclusions made from Figure 6. Turbulence is clearly the dominant
mechanism for all four slurries for the T/3 impeller. The collapse of the mean radial
velocity is erratic, actually becoming more scattered in the area immediately below the
impeller blades (0-40 mm) where very large or very small ∆σ are seen. This is not
surprising because the mean Vr over all clearances is close to zero in this area, and in the
∆σ calculations the velocities are divided by the mean of the velocities. The profiles show
more agreement over the middle region (40-80 mm), increasing again from 80-120 mm.
This shows that the hypothesis holds true for the T/3 impeller: both the mean flow and
the turbulent eddies are necessary for solids suspension, but the turbulent eddies
19
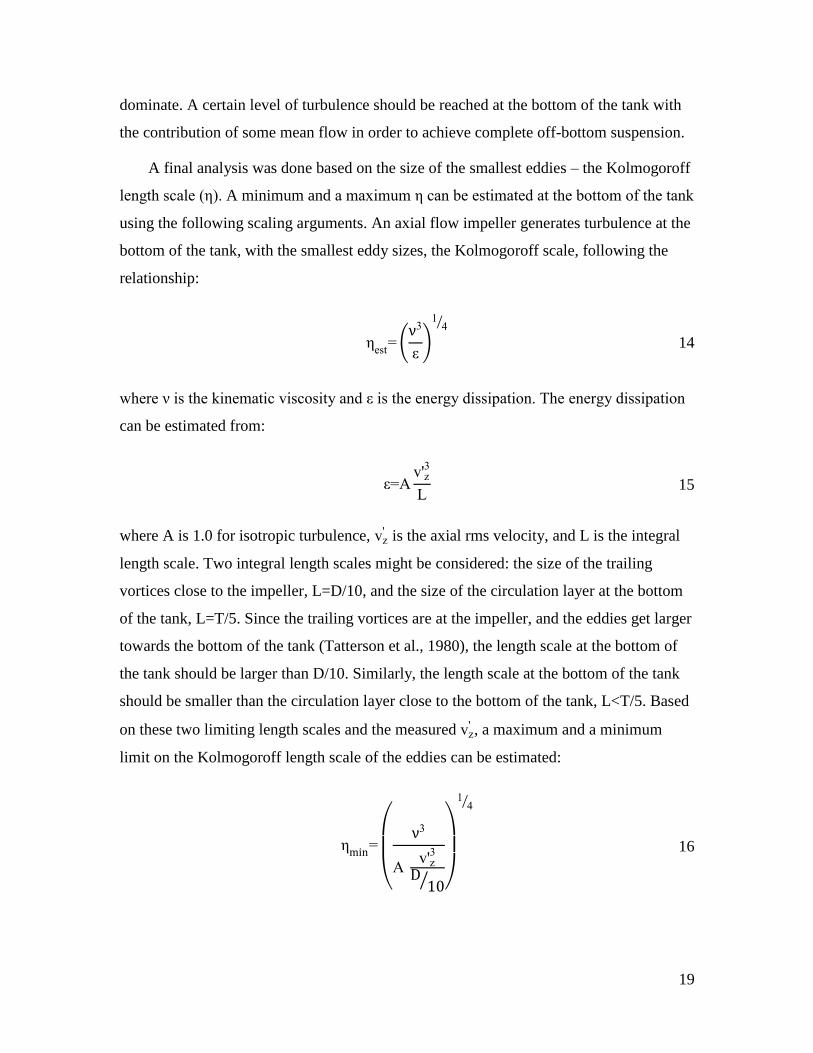
dominate. A certain level of turbulence should be reached at the bottom of the tank with
the contribution of some mean flow in order to achieve complete off-bottom suspension.
A final analysis was done based on the size of the smallest eddies – the Kolmogoroff
length scale (η). A minimum and a maximum η can be estimated at the bottom of the tank
using the following scaling arguments. An axial flow impeller generates turbulence at the
bottom of the tank, with the smallest eddy sizes, the Kolmogoroff scale, following the
relationship:
ηest ( 3
)
14⁄
14
where ν is the kinematic viscosity and is the energy dissipation. The energy dissipation
can be estimated from:
v z3
15
where A is 1.0 for isotropic turbulence, vz is the axial rms velocity, and L is the integral
length scale. Two integral length scales might be considered: the size of the trailing
vortices close to the impeller, L=D/10, and the size of the circulation layer at the bottom
of the tank, L=T/5. Since the trailing vortices are at the impeller, and the eddies get larger
towards the bottom of the tank (Tatterson et al., 1980), the length scale at the bottom of
the tank should be larger than D/10. Similarly, the length scale at the bottom of the tank
should be smaller than the circulation layer close to the bottom of the tank, L<T/5. Based
on these two limiting length scales and the measured vz , a maximum and a minimum
limit on the Kolmogoroff length scale of the eddies can be estimated:
η
(
3
v z3
⁄ )
14⁄
16

20
η
(
3
v z3
⁄ )
14⁄
17
The vz in Equations 16 and 17 was determined from the scaled velocity profiles for
each particle. Over the sections where the profiles collapsed the maximum vz was used in
Equation 16 to estimate ηmin, and the minimum vz was used in Equation 17 to estimate
ηmax. Table 2 shows the results. For SG, the range of smallest eddy sizes overlaps the
range of particle sizes so the particles are much smaller than the most energetic eddies
and will be swept up mainly by turbulent convection from eddies much larger than the
particles. For LG, the particles are much larger than the smallest eddies (about 10x) but
substantially smaller than the integral scale (10-80x), so the particle-eddy interaction at
the particle scale may be expected to be quite strong. For B, the particles are 3-4 times η,
and again the potential for particle-eddy interaction is quite strong.
3.3. Solids suspension mechanisms with the T/2 impeller
Following the same procedure that was used for the T/3 impeller, the collapse of the
scaled velocity profiles for the D=T/2 A310 was first evaluated visually, and then using
∆σ. Figure 8a and b show the measured Vr and the vz for six clearances, normalized with
the tip speed of the impeller. There are two groups in both figures: a low clearance group,
C/ ≤0.35, and a high clearance group, C/D>0.35. In terms of C/D, the clearances in the
high-clearance group are comparable to the clearances used for the T/3 profiles. In the
high clearance group the particles collect around the periphery of the tank, and in the low
clearance group the particles settle out in the centre of the tank as well as around the
periphery. While this initially suggests that the mean radial flow must be small at the
centre of the tank for low clearances Figure 8a shows that the normalized mean radial
flow is actually larger than what it is in the high clearance group. Some other effect is
dropping particles out in the centre of the tank at low clearances.
This additional effect is a strong rotational flow below the impeller. This swirl
diminishes when there is sufficient distance between the impeller and the tank bottom,

21
but when the impeller is close to the tank bottom, C/D≤0.35, the swirl is contained
between the impeller and the tank bottom causing particles to drop out. This requires the
analysis of the theta velocities. The profiles are not shown here, but an analysis is
provided. From 0-30 mm along the radial traverse a forced vortex is evident in the theta
velocity profiles, followed by a free vortex which extends towards the tank walls. In the
0-30 mm area the theta velocities normalized with the tip speed of the impeller increase
up to 0.12 with a steep slope. This high velocity causes the particles drop out in the centre
immediately below the 20 m diameter hub. As the off-bottom clearance increases,
C/D>0.35, the theta velocity drops showing free vortex behaviour all along the radius.
The measured velocities were scaled to Njs for three slurries: SG, LG, and the
mixture of SG with B. For all of the slurries the last point of suspension at low clearances
is both at the centre of the tank and at the tank walls, and at high clearances it is only at
the tank walls. The LG slurry results are representative and are shown in Figure 9 a and b.
Visual inspection indicates that with the T/2 impeller the contribution of both mean flow
and turbulent eddies is necessary, but neither of them dominates. The data does not show
any collapse in either the low clearance or the high clearance group. This indicates that
the hypothesis does not hold true for the T/2 impeller.
The ∆σ results are shown in Figure 10a and b. ∆σ is always negative for Vr, and is
always positive for vz , suggesting that mean flow is the principle mechanism for the T/2
impeller, but this does not agree with the visual inspection of the velocity profiles, which
are nearly unchanged. The same conflicting result was observed for LG, SG and the
mixture of SG with B.
The two impellers can be directly compared by plotting the velocity profiles for the
T/3 mean and rms scaled for Njs of the LG directly on top of the plots for the T/2
impeller. This is shown in Figure 9a and b as dashed lines. Considering first the mean
velocity profiles, the T/3 result falls above the two results for the D=T/2 impeller at both
high and low clearances. The drop in Vr close to the centre of the tank is much smaller for
the T/3 impeller, extending out to only 8 mm, while the T/2 impeller retains this trend out
to 40 mm. This is a direct effect of the change in impeller diameter. For both impellers,
the maximum radial velocity occurs at about 80 mm, but for the T/2 impeller this is a

22
sharp peak, while for the T/3 impeller, it is a broad peak which extends from roughly 60-
100 mm. Again, this is a direct effect of the impeller geometry. The larger impeller has
less space to reach the peak, so the slope of the profile on either side must be steeper.
Overall, the mean radial velocities are of a similar magnitude, with the T/2 impeller
having a significantly less favorable configuration for removing solids from the bottom of
the tank. The more surprising results are found by comparing the fluctuating velocity
profiles. The LG particles can be suspended when the scaled fluctuating velocities are in
the 0.8-1.8 range and there is some mean flow present with the T/3 impeller. For the T/2
impeller, the rms velocity is 3-4 times larger than the required rms velocity. This is
because of the shape of the radial velocity profiles with the T/2 impeller and proves that
the contribution of mean flow is certainly important. In order to achieve the required
minimum convective effect with the mean velocity, the T/2 impeller generates much
more turbulence as a secondary effect.
As a last note, consider the high and low clearance cases. The low clearance case,
where particles tend to collect at the centre of the tank, has a higher mean velocity and a
lower rms velocity in this group. This suggests that some other mechanism is drawing
particles into the centre of the tank, and the mean velocity has to be increased to
compensate for this effect. The rms velocity cannot convect the particles away from the
centre, so it plays a less critical role for this particular configuration.
An estimation of the size of the smallest Kolmogoroff eddies was also made for the
T/2 impeller, as given in Table 2. There is no significant collapse of the velocity profiles
for this impeller, so the minimum and maximum vz were taken close to the tank walls,
from 100-120 mm. The SG particles are similar in size to the smallest eddies, while the
LG particles fall in the centre of the most energetic eddy size range. Note that the
maximum Kolmogoroff eddy size is smaller than for the T/3 impeller due to the increase
in the rms velocity. This will lead to an increase in power consumption with no
improvement in solids suspension conditions.
The mean and rms velocity results reveal several things: solids suspension for the
T/3 impeller is determined by the rms velocity limit, and the profiles collapse nicely to
show this. The T/2 impeller, on the other hand, is limited by an unfavorable mean radial
23
velocity profile. Overcoming the limitations of this profile requires a significant increase
in the rms velocity beyond what is required to suspend the particles. For the low
clearance case, some additional three dimensional effect is driving particles toward the
centre of the tank, and this effect has to be overcome by further increasing the mean
velocity. These results show that the solids suspension mechanism changes when the
impeller diameter is changed for a fixed set of particles. This is because the flow close to
the tank bottom changes, and the particles have to respond to the change in flow.
3.4. LES results
In the final stage of analysis, single phase velocity profiles were obtained using LES
at the same conditions as the PIV experiments for the T/3 impeller. The advantage of
LES is that the flow field in the entire tank is calculated and the data for every grid point
is stored. This allows us to investigate the velocity profiles at different horizontal
measurement planes. In this section, the critical flow condition hypothesis is tested for a
final time using the LES results, and the LES and the PIV results are compared. Second,
the sensitivity of the velocities to the position of the measurement plane was analyzed
using the high resolution LES data.
3.4.1. Solids suspension mechanisms with the T/3 impeller and
comparison of the LES and PIV data
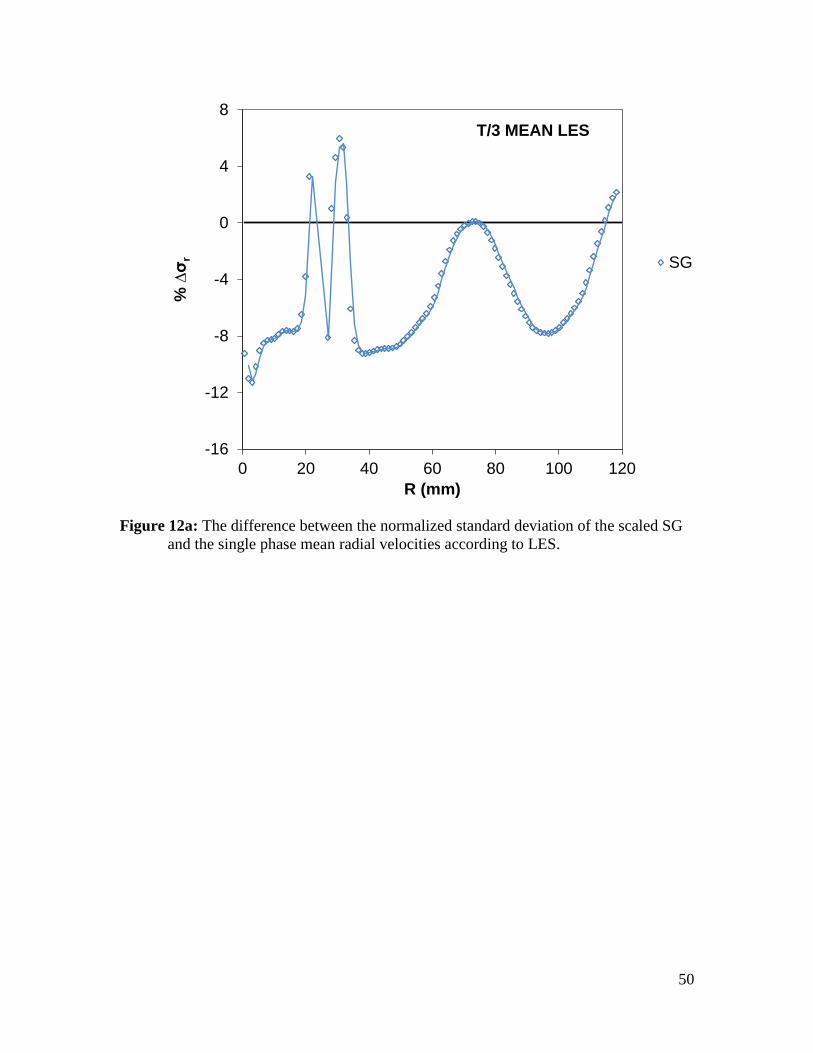
Figure 11a and b show the scaled Vr and for the T/3 impeller. Both the Vr and the
profiles are scattered; there is no visible collapse of the profiles. The visual inspection
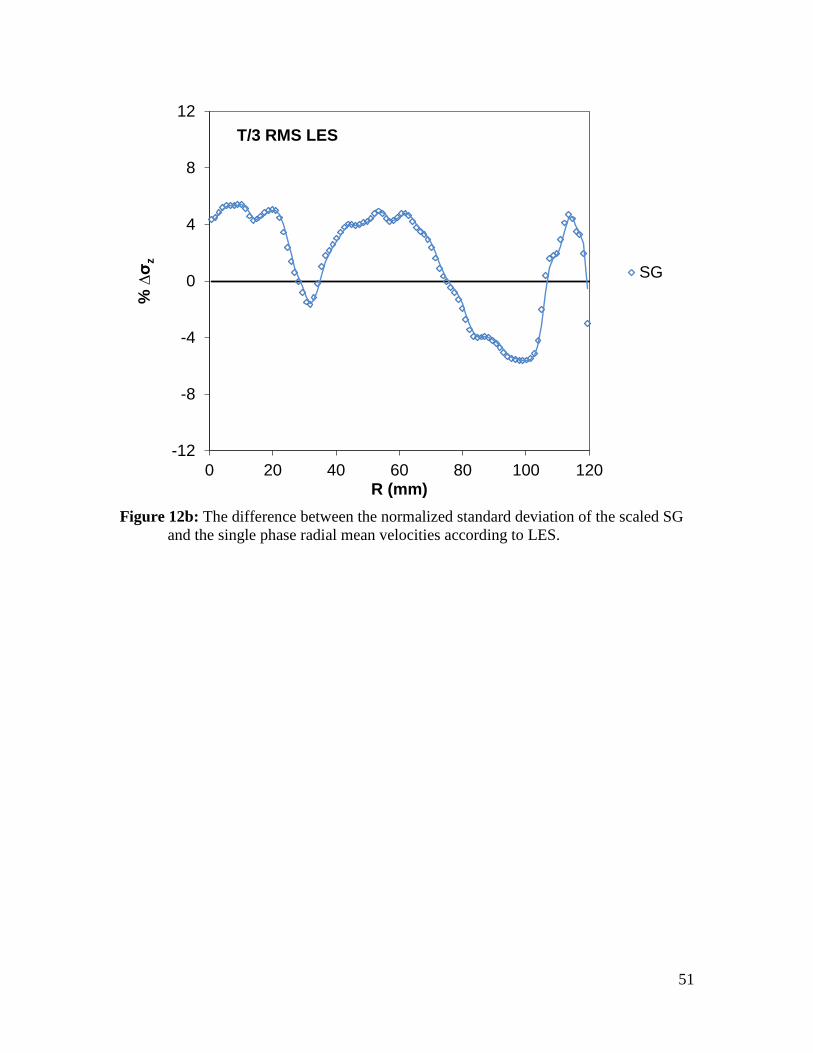
does not show a clear trend for a dominant solids suspension mechanism. Figure 12a and
b show the ∆σ for Vr and . The ∆σ for Vr is mostly negative, while the ∆σ for
is
negative only from 75-105 mm. This suggests that the mean flow is the dominant
mechanism for the T/3 impeller. The ∆σ analysis leads to a different conclusion than
both the visual inspection and the PIV results.
The shapes of the scaled velocity profiles with LES, Figure 11a and b, are similar to
the PIV profiles, Figure 6a and b, but there are some differences in both the flow details
and in the magnitude of the velocities. In Figure 11a, Vr calculated using LES is zero in
the centre of the tank while it is between -0.1 and 0.2 m/s in the PIV measurements,

24
giving a mean of zero. In a mathematical sense Vr must approach zero at the bottom
centre of the tank because there is no point source of mass at R=0. Capturing an exact
zero velocity at the centre of the tank would require measurements with a longer time
average as well as high resolution in both time and space close to the centre of the vessel,
and a thoughtful consideration of the best time averaging scheme to apply if a slow
precessing vortex structure is present in this region. This detailed flow analysis is beyond
the scope of work considered here.
In the LES results, the magnitude of Vr is under-predicted, and the magnitude of vz is
over-predicted. The LES profiles are located 4.2 mm above the bottom of the tank, which
is a region where wall effects may have a substantial impact on the accuracy of LES
predictions.
3.4.2. The effect of distance from the bottom of the tank on velocities
The LES profiles in Figure 11a and b were taken 4.2 mm above the bottom of the
tank. In the PIV experiments the axial position of the measurement plane was 3.5 to 4.5
mm above the bottom of the tank, and the thickness of the plane was 2 mm. Close to the
bottom of the tank the velocities may vary significantly, so it is interesting to consider
how sensitive the results may be to small errors in positioning. This analysis cannot be
done with the PIV data since it was only at one vertical position, but LES data was
recorded for all horizontal planes along the vertical axis.
Figure 13a shows the scaled mean radial velocity profiles at a fixed impeller off-
bottom clearance, C/D=0.75, at various distances from the bottom of the tank. As the
plane moves away from the bottom of the tank the radial velocities vary slightly close to
the centre of the tank and close to the tank walls, but they all collapse on to a single
profile at around the maximum Vr.
Figure 13b shows the scaled axial rms velocity profiles at a fixed off-bottom
clearance, C/D=0.75, for a T/3 impeller. As the plane is pulled away from the bottom of
the tank the trend of the profiles remains the same, but the magnitude of the velocities
increases. Between the first plane, i=1.8 mm, and the second plane, i=2.4 mm, the
magnitude of the velocities increases significantly, showing that the position of the

25
measurement plane makes a significant difference in the velocities. Starting from 3.6 mm
the profiles collapse onto each other, indicating that from 3.6 mm to 5.4 mm the axial rms
velocities do not change significantly. This analysis shows that the velocities are not a
strong function of the position of the measurement plane in the 3.5-4.5 mm range.
3.5. Comparison between the T/3 and the T/2 impellers
Solid-liquid mixing is a power intensive operation; therefore, the power consumption
is an important criterion in choosing an impeller. The power consumption at just
suspended conditions (Pjs) can be calculated from:
18
Figure 14 shows the comparison of power consumption between the T/3 and the T/2
impellers for the SG and the LG slurries at 1.5 wt% and SG+B mixture at 27wt% at
varying off-bottom clearances. For all slurries the power consumption with the T/3
impeller is significantly lower than the T/2 impeller. Referring back to Figure 3 we see
that Njs is higher for the T/3 impeller than the T/2 impeller for both the SG and the LG
slurries. From an operational point of view, the power consumption is a better criterion
than Njs for choosing an impeller
A comparison of the two impellers in terms of the solids suspension mechanisms
shows two different trends. For the T/2 impeller some combination of the mean flow and
turbulent eddies provides solids suspension, and neither of these mechanisms dominate..
For the T/3 impeller a single mechanism, turbulence, dominates and the required level of
turbulence with the small impeller is approximately one third the levels observed for the
T/2 impeller. The T/3 impeller is also less power intensive. It can be concluded that the
T/3 impeller is more efficient because the convective flow is more efficient, which in turn
minimizes the amount of turbulence energy dissipation required to suspend the solids.
Conclusions
The goal of this study was to investigate the mechanisms that drive solids suspension
in stirred tanks. The analysis was based on the hypothesis that at complete off-bottom
suspension a critical flow condition exists close to the bottom of the tank at every

26
clearance for fixed solids, tank geometry, and constant circulation pattern. The flow
condition might be dominated by either the mean flow in a convective mechanism, or the
turbulence in an eddy-lifting mechanism.
Data was collected using visual observations of the tank bottom, PIV, and LES. The
PIV measurements were collected at a single rotational speed. The data was analyzed
using three separate methods. First the velocity profiles were scaled with Njs and plotted
together to determine whether the profiles collapsed to a single critical flow condition at
Njs. Second, the degree of collapse was quantified using the change in normalized
standard deviation from the raw measured profiles to the scaled velocity profiles. Last,
the size of the smallest eddies was estimated and compared with the size of the particles
to determine the most likely type of particle-eddy interactions for each particle species.
The results led to the following conclusions:
Solids suspension occurs as a result of the combination of mean flow and
turbulent eddies. Complete off-bottom suspension cannot be obtained in the
absence of one of these mechanisms.
When the impeller diameter is changed the solids suspension mechanism
changes. The solids deposition pattern changes when the off-bottom
clearance is changed. This data provides two clear demonstrations of the
dramatic effect of geometry on solids suspension.
o For the T/3 impeller the hypothesis holds true. The critical flow
condition is dominated by the level of turbulence and convection
plays a secondary role.
o For the T/2 impeller the hypothesis does not hold true. Both
mechanisms play an active role, but neither mechanism dominates.
The shape of the radial velocity profile is unfavourable for solids
suspension so a larger impeller speed is needed to achieve the same
amount of convective flow and this results in a significant amount of
additional turbulence and power consumption at the point of solids
suspension.
27
The solids suspension mechanism also depends on the type of the particle,
because the particle-eddy interactions are different for each particle species.
o The SG is submerged in the viscous sub-layer and it is significantly
smaller than the most energetic eddies.
o The LG lies in the middle of the spectrum with highly energetic
particle-eddy interactions all along the tank bottom.
o The B lies somewhere in between: it is larger than the viscous sub-
layer and the smallest eddy sizes, but the particle-eddy interactions
are not as strong as for LG. This suggests that the B is moved away
from the tank bottom as a result of both turbulent eddies and near wall
lift.
The T/3 impeller is more efficient for solids suspension because less energy
is lost to excess turbulent energy dissipation.
Acknowledgements
The authors would like to thank Lightnin, NSERC, and CNPq, Brazil for funding this
research.
Nomenclature
Roman characters
A constant in equation 15, 16, and 17
C off-bottom clearance of the impeller (m)
cs Smagorinsky model constant
D impeller diameter (m)
dp particle diameter (m)
d+ dimensionless particle diameter (-)
FB buoyancy force (N)
FD drag force on the sphere (N)
FG gravity force (N)
FL lift force (N)
FM Magnus force (N)
FS Saffman force (N)
FT turbulence force (N)
g acceleration due to gravity (m/s2)
H liquid height (m)
h height of the calibration plate from the tank bottom (mm)

28
i the distance of the horizontal plane from the bottom of the tank for LES data(mm)
L integral length scale (m)
N impeller rotational speed (rpm)
Nexpt impeller speed for the PIV experiments (rpm)
Njs just suspended speed (rpm)
Np power number (-)
n clearance index in equation 13
Pjs power consumption at the just suspended speed (W)
R radial position in the tank (mm)
S Zwietering’s js constant
T tank diameter (m)
U velocity in Equation 3 (m/s)
U* shear velocity (m/s)
Vmeasured measured velocity (m/s)
Vr mean radial velocity (m/s)
Vscaled scaled mean radial or axial rms velocity (m/s)
Vtip tip velocity (m/s)
vz axial rms velocity (m/s)
W baffle width (m)
X solids loading (mass of solid/mass of liquid*100)
x the length scale (m)
xn velocity at the nth
off-bottom clearance
xmean the mean velocity over all six clearances
y distance from the solid surface (m)
y+ dimensionless distance from the solid surface (-)
Greek characters ν kinematic viscosity of liquid (m
2/s)
dynamic viscosity of the liquid (kg/m.s)
liquid density (kg/m3)
solid density (kg/m3)
slurry density (kg/m3)
σ normalized standard deviation (Equation 12)
∆σ difference between the normalized standard deviations of the scaled and measured
velocities (Equation 13)
∆σr ∆σ for mean radial velocities
∆σz ∆σ for axial rms velocities
η Kolmogoroff length scale
ηest estimated Kolmogoroff length scale
rate of dissipation of turbulent kinetic energy per unit mass (m2/s
3)
viscous sub-layer thickness (m)
Abbreviations Ar Archimedes number
A310 axial impeller provided by Lightnin
B bronze
DNS direct numerical simulations

29
LES large eddy simulations
LG large glass beads
min minimum
max maximum
PIV particle image velocimetry
Re Reynolds number
rms root mean square
SG small glass beads
wt% weight percent
References
Armenante, P.M., Nagamine, E.U., Susanto, J., 1998. Determination of correlations to
predict the minimum agitation speed complete solid suspension in agitated vessels.
The Canadian Journal of Chemical Engineering, 76, 413-419.
Ayranci, I., Kresta, S.M., 2011. Design rules for suspending concentrated mixtures of
solids in stirred tanks. Chemical Engineering Research and Design, 89, 1961-1971.
Baldi, G., Conti, R., Alaria, E.,1978. Complete suspension of particles in mechanically
agitated vessels. Chemical Engineering Science, 33, 21-25.
Bittorf, K.J., Kresta, S.M., 2003. Prediction of cloud height for solid suspension in stirred
tanks. Trans IChemE, 81(A), 568-577.
Davies, J.T., 1972, Turbulence Phenomena, An introduction to the eddy transfer of
momentum, mass, and heat, particularly at interfaces, Chapter 3, Academic Press, New
York.
Derksen, J., Van den Akker, H.E.A., 1999. Large eddy simulations on the flow driven by
a Rushton turbine. AIChE Journal, 45, 209-221.
Garcia, M.H., 2008. Sedimentation engineering: processes, management, modeling, and
practice. American Society of Civil Engineers, 21-306.
Ghionzoli, A., Bujalski, W., Grenville, R.K., Nienow, A.W., Sharpe, R.W., Paglianti, A.,
2007. The effect of bottom roughness on the minimum agitator speed required to just
fully suspend particles in a stirred vessel. Trans. IChemE., 85 (A5), 685-690.
Grenville, R.K., Mak, A.T.C., Brown, D.A.R., 2010. An improved correlation to predict
“just suspension” speed for solid-liquid mixtures with axial flow impellers in stirred
tanks. North American Mixing Forum, Victoria, BC, Canada, June 20-June 25.
Kresta, S.M., Wood, P.E., 1993. The mean flow field produced by a 45º pitched blade
turbine: changes in the circulation pattern due to off bottom clearance. The Canadian
Journal of Chemical Engineering, 71, 42-53.
Madej, A.M., Babazadeh, H., Nobes, D.S., 2011. The effect of chamber length and
Reynolds number on jet precession. Experiments in Fluids, 51(6), 1623-1643.
Molerus O., Latzel, W., 1987. Suspension of solid particles in agitated vessels. Particulate
Science and Technology, 5(3), 235-260.

30
Myers, K.J., Fasano, J.B., 1992. The influence of baffle off-bottom clearance on the
solids suspension of pitched-blade and high-efficiency impellers. The Canadian
Journal of Chemical Engineering, 70, 596-599.
Nienow, A.W., 1968. Suspension of solid particles in turbine agitated baffled vessels.
Chemical Engineering Science, 23, 1453-1459.
Nouri, J. M., Whitelaw, J. H., Yianneskis, M., 1987. The scaling of the flow field with
impeller size and rotational speed in a stirred reactor. 2nd International Conference
on Laser Anemometry-Advances and Applications, Strathclyde, UK.
Tatterson, G.B., Yuan, H.H.S., Brodkey, R.S., 1980. Stereoscopic visualization of the
flows for pitched blade turbines. Chemical Engineering Science, 35 (6), 1369-1375.
Thorpe, R.B., Stevenson, P., 2003. Suspension of particles from the bottom of pipes and
stirred tanks by gassed and ungassed flows. The Canadian Journal of Chemical
Engineering, 81, 351-359.
Vanoni, V.A., 2006. Chapter II: Sediment Transportation Mechanics, Sedimentation
Engineering. ASCE Manuals and Reports on Engineering Practice, 2nd
ed., vol. 54,
11-189.
Wilson, K.C., 2005. Slurry transport using centrifugal pumps. Springer, New York, pp.
123-151.
Wilson, K.C., Sanders, R.S., Gillies, R.G., Shook, C.A., 2010. Verification of the near-
wall model for slurry flow. Powder Technology, 197, 247-253.
Zhou, G., Kresta, S.M., 1996. Impact of tank geometry on the maximum turbulence
energy dissipation rate for impellers. AIChE Journal, 42, 2476-2490.
Zwietering, Th.N., 1958. Suspending of solid particles in liquid by agitators. Chemical
Engineering Science, 8, 244-253.

31
Tables
Table 1: Specifications of the particles used in the Njs experiments
Type Density (kg/m3) Size (μm) Ar Shape
Small glass beads (SG) 2500 74-125 14.7 Spherical
Bronze (B) 8855 150-297 820.5 Spherical
Large glass beads (LG) 2500 595-841 5378.7 Spherical
Table 2: The range of Kolmogoroff length scales for each particle species as observed
for two impeller diameters
Particle
type
Impeller
diameter
Minimum
(m/s)
Maximum
(m/s)
Lmin
(m)
Lmax
(m)
ηmin
(μm)
ηmax
(μm)
SG T/3 0.04 0.10
0.008 0.048
53 165
LG T/3 0.07 0.10 53 115
B T/3 0.10 0.30 23 83
SG T/2 0.10 0.28 0.012 0.048
27 83
LG T/2 0.33 0.10 24 83
32
Figures
a.
b.
c.
Figure 1: Effect of mean velocity and turbulence on a particle on a flat plate. a. the forces
effective on the particle b. mean velocity isolated from turbulence c. turbulent
eddies isolated from the mean flow.
FD
FB
FLFlowdirection
FG
FDV
FL
FL = FM + FS
FT
33
Figure 2: Cross-section of the cylindrical tank used for Njs and PIV experiments, and
LES simulations. The dashed plate represents the position of the calibration plate
4 mm above the bottom of the tank. The measurement plane is 3.5-4.5 mm from
the bottom of the tank and is 2mm thick.
D
T
H
C
w
h
34
Figure 3: The effect of impeller diameter, particle diameter, particle density, and solids
loading on Njs. B, LG and SG are at 1.5 wt% and the mixture of SG+B is at
27wt% total solids loading with 1.3 wt% B. Solid and hollow symbols represent
D=T/3 and D=T/2, respectively.
0
200
400
600
800
1000
1200
1400
1600
0.2 0.4 0.6 0.8 1 1.2
Njs
(rp
m)
C/D
B
SG/B
LG
SG
D=T/3
D=T/2

35
a. b.
Figure 4: The effect of off-bottom clearance on the solids suspension pattern for the
A310 D=T/2 a. C/D=0.25 b. C/D=0.5
36
Figure 5a: Measured mean radial velocity profiles normalized with the tip speed of the
impeller: A310 T/3.
-0.2
-0.1
0
0.1
0.2
0.3
0.4
0 20 40 60 80 100 120
Vr
/ V
tip
R (mm)
C/D = 0.450
C/D = 0.525
C/D = 0.675
C/D = 0.750
C/D = 0.825
C/D = 0.900
C/D = 1.075
Single phase T/3 MEAN

37
Figure 5b: Measured axial rms velocity profiles normalized with the tip speed of the
impeller: A310 T/3.
0
0.01
0.02
0.03
0.04
0.05
0.06
0.07
0 20 40 60 80 100 120
vz' / V
tip
R (mm)
C/D = 0.450
C/D = 0.525
C/D = 0.675
C/D = 0.750
C/D = 0.825
C/D = 0.900
C/D = 1.075
Single phase T/3 RMS

38
Figure 6a: Scaled mean radial velocity profiles for 1.5 wt% SG with the A310 T/3.
-0.3
-0.1
0.1
0.3
0.5
0.7
0 20 40 60 80 100 120
Vr
* N
js/ N
(m
/s)
R (mm)
C/D = 0.450
C/D = 0.525
C/D = 0.675
C/D = 0.750
C/D = 0.825
C/D = 0.900
SG T/3 MEAN

39
Figure 6b: Scaled axial rms velocity profiles for 1.5 wt% SG with the A310 T/3.
0
0.02
0.04
0.06
0.08
0.1
0.12
0.14
0.16
0 20 40 60 80 100 120
vz' *
Njs
/ N
(m
/s)
R (mm)
C/D = 0.450
C/D = 0.525
C/D = 0.675
C/D = 0.75
C/D = 0.825
C/D = 0.900
SG T/3 RMS

40
Figure 7a: The difference between the normalized standard deviation of the scaled and
the measured mean radial velocity for each particle species with the A310 T/3.
-50
-40
-30
-20
-10
0
10
20
30
40
50
0 20 40 60 80 100 120
% ∆
σr
R (mm)
SG
LG
B
SG+B
T/3 MEAN

41
Figure 7b: The difference between the normalized standard deviation of the scaled and
the measured axial rms velocity for each particle species with the A310 T/3.
-10
-8
-6
-4
-2
0
2
4
6
8
10
0 20 40 60 80 100 120
% ∆
σz
R (mm)
SG
LG
B
T/3 RMS

42
Figure 8a: Measured mean radial velocities normalized with the tip speed of the
impeller: A310 T/2.
0
0.05
0.1
0.15
0.2
0.25
0.3
0.35
0 20 40 60 80 100 120
Vr
/ V
tip
R (mm)
C/D = 0.25
C/D = 0.30
C/D = 0.35
C/D = 0.40
C/D = 0.45
C/D = 0.50
Single phase T/2 MEAN

43
Figure 8b: Measured axial rms velocities normalized with the tip speed of the impeller:
A310 T/2.
0
0.02
0.04
0.06
0.08
0.1
0.12
0.14
0.16
0.18
0 20 40 60 80 100 120
vz' /
Vti
p
R (mm)
C/D = 0.25
C/D = 0.30
C/D = 0.35
C/D = 0.40
C/D = 0.45
C/D = 0.50
Single phase T/2 RMS

44
Figure 9a: Scaled mean radial velocity profiles for 1.5 wt% LG with the A310 T/2.
-0.2
0
0.2
0.4
0.6
0.8
1
0 20 40 60 80 100 120
Vr
* N
js/ N
(m
/s)
R (mm)
C/D = 0.25
C/D = 0.30
C/D = 0.35
C/D = 0.40
C/D = 0.45
C/D = 0.50
T/3
LG T/2 MEAN
T/3

45
Figure 9b: Scaled axial rms velocity profiles for 1.5 wt% LG with the A310 T/2.
0.0
0.1
0.2
0.3
0.4
0.5
0.6
0 20 40 60 80 100 120
vz' *
Njs
/ N
(m
/s)
R (mm)
C/D = 0.25
C/D = 0.3
C/D = 0.35
C/D = 0.4
C/D = 0.45
C/D = 0.5
T/3
LG T/2 RMS
T/3

46
Figure 10a: The difference between the normalized standard deviation of scaled and the
measured mean radial velocity profiles for each particle species: A310 T/2.
-4.5
-3.5
-2.5
-1.5
-0.5
0.5
1.5
0 20 40 60 80 100 120
% ∆
σr
R (mm)
SG
LG
SG+B
T/2 MEAN

47
Figure 10b: The difference between the normalized standard deviation of scaled and the
measured axial rms velocity profiles for each particle species: A310 T/2.
0
1
2
3
4
5
6
0 20 40 60 80 100 120
% ∆
σz
R (mm)
SG
LG
SG+B
T/2 RMS

48
Figure 11a: LES results for the scaled mean radial velocity profiles for 1.5 wt% SG:
A310 T/3.
-0.10
0.00
0.10
0.20
0.30
0.40
0 20 40 60 80 100 120
Vr*
Njs
/ N
(m
/s)
R (mm)
C/D=0.450
C/D=0.675
C/D=0.750
C/D=0.900
SG T/3 MEANLES

49
Figure11b: LES results for the scaled axial rms velocity profiles for 1.5 wt% SG: A310
T/3.
0.00
0.05
0.10
0.15
0.20
0.25
0 20 40 60 80 100 120
vz' *
Njs
/ N
(m
/s)
R (mm)
C/D=0.450
C/D=0.675
C/D=0.750
C/D=0.900
SG T/3 RMSLES
50
Figure 12a: The difference between the normalized standard deviation of the scaled SG
and the single phase mean radial velocities according to LES.
-16
-12
-8
-4
0
4
8
0 20 40 60 80 100 120
% ∆
σr
R (mm)
SG
T/3 MEAN LES
51
Figure 12b: The difference between the normalized standard deviation of the scaled SG
and the single phase radial mean velocities according to LES.
-12
-8
-4
0
4
8
12
0 20 40 60 80 100 120
% ∆
σz
R (mm)
SG
T/3 RMS LES

52
Figure 13a: The effect of the position of the measurement plane on radial mean
velocities. Mean radial velocities were obtained with LES and scaled with Njs data
for 1.5 wt% SG with the A310 T/3 at C/D = 0.75.
-0.1
0
0.1
0.2
0.3
0.4
0 20 40 60 80 100 120
Vr*
Njs
/ N
(m
/s)
R (mm)
i=1.8 mm
i=2.4 mm
i=3.0 mm
i=3.6 mm
i=4.2 mm
i=4.8 mm
i=5.4 mm
T/3 MEAN

53
Figure 13b: The effect of the position of the measurement plane on axial rms velocities.
Axial rms velocities were obtained with LES and scaled with Njs data for 1.5 wt%
SG with the A310 T/3 at C/D = 0.75.
0
0.05
0.1
0.15
0.2
0.25
0 20 40 60 80 100 120
vz' *
Njs
/ N
(m
/s)
R (mm)
i=1.8 mm
i=2.4 mm
i=3.0 mm
i=3.6 mm
i=4.2 mm
i=4.8 mm
i=5.4 mm
T/3 RMS

54
Figure 14: The comparison of power consumption between the A310 T/3 and the T/2.
The power consumption was calculated for the SG and the LG slurries at 1.5 wt%,
and for the mixture at 26 wt% SG with 1.3 wt% B. Solid and hollow symbols
represent D=T/3 and D=T/2, respectively.
0
2
4
6
8
10
12
14
16
18
20
0 0.2 0.4 0.6 0.8 1 1.2
Pjs
(W)
C/D
SG+B
LG
SGD=T/3
D=T/2