effect of green supply chain management …
TRANSCRIPT

EFFECT OF GREEN SUPPLY CHAIN MANAGEMENT PRACTICES ON
PERFORMANCE OF MANUFACTURING FIRMS IN NAIROBI COUNTY, KENYA
BY
CHRISTINE BAHATI NYAKUNDI
A Research Project Submitted to Graduate School in Partial Fulfilment of the
Requirements for the Award of the Degree of Master in Business Administration of
Egerton University
EGERTON UNIVERSITY
APRIL 2017

ii
DECLARATION AND RECOMMENDATION
Declaration
I declare that this research project is my original work and has not been submitted for
examination in this or any other university, college or institution of higher learning other than
Egerton University.
Signed ……………………………. Date …………………………………….
Christine Bahati Nyakundi
CM16/0159/12
Recommendation
This Research project has been submitted for examination with my approval as the University
Supervisor.
Signed……………………………………. Date ……………………………………
Dr. Justus Tari
Department of Business Administration
Egerton University
Signed……………………………………. Date …………………………………….
Ms. Lydia K. Mbura
Department of Business Administration
Egerton University

iii
COPYRIGHT
© 2016 Christine B. Nyakundi
All rights reserved. No part of this project may be reproduced, stored in a retrieval system,
transmitted in any form or by any means, electronic, mechanical, photocopying, recording or
otherwise, or translated in any language, without the prior written permission of the author or
Egerton University on that behalf except in the case of brief quotations embodied in reviews,
articles and research papers.

iv
DEDICATION
This work is dedicated first to God who has given me strength, wisdom and direction from
the beginning of this project to the end, to Him be the Glory. It is also dedicated to my family
who have always given me continuous support and encouragement during my studies.

v
ACKNOWLEDGMENT
My special thanks to the Almighty God the provider of the knowledge and wisdom for seeing
me through my studies.
I am highly indebted to Egerton University for providing valuable information and guidance
which helped me in completing this task through various stages.
I wish to express my thanks to my supervisors Ms Lydia Kwamboka and Dr. J. Tari who
were very supportive. Their professional advice, corrections, guidance and encouragement
throughout the time of project writing is appreciated. I would also like to thank Dr. H.
Kombo for his generous advice and support.
This project would have not been possible without the kind support and help of many
individuals and organizations. I would like to extend my sincere thanks to all of them.
Finally, to my family, my husband Geoffrey Omwenga, my children Ian Minara and Stacy
Mora for their sacrifices and moral support during the study period. Thank you and May God
bless you. There are other people who assisted me in various ways, I am unable to mention
all of them here, but I am sincerely grateful for the help and encouragement they offered to
make the study a success.

vi
ABSTRACT
In today‟s global turbulences and increasing competition, organisations cannot do well in
isolation as collaborations between different organisations have become the major input in
achieving organisational goals and objectives. Green Supply Chain Management (GSCM)
refers to management of activities that attempts to improve the environmental performance of
purchased inputs, or of the suppliers who provide them. The purpose of the study was to
determine the effect of GSCM practices on the performance of manufacturing firms in
Nairobi Kenya. The specific objectives included; to establish the effect of green purchasing,
green reverse logistics, green marketing, and green risk management on the performance of
manufacturing firms in Nairobi Kenya. This study was carried out through a cross sectional
descriptive survey. The target population of this study constituted 453 manufacturing firms in
Nairobi Kenya. The study sought information from 208 procurement officers whose roles fall
on the supply chain. This study made use of questionnaires which contained both structured
and non-structured questions. On the other hand, the study used descriptive and inferential
statistics to analyse the quantitative data. This study utilized the SPSS software to perform
regression analysis on the collected data. The study revealed that adoption of GSCM
practices led to improved overall quality, there is more strategic focus on reverse logistics
and that efficiency, accuracy and timeliness in reverse supply chains activities are a priority.
The study findings also show that manufacturing firms are able to meet customer
expectations which led to new relations across the supply chain. It was clear from the study
findings that the primary driving force to green risk management is an urge to meeting
regulations. In conclusion, there is increased percentage of environmental innovations and
green purchasing can improve a firm's economic position. On the other hand, there is a
reduction in the waste of resources and promotion of environmental innovation is achieved.
As a result of green marketing, manufacturing firms are able to meet customer expectations
which lead to new relations across the supply chain. It is recommended that managers should
embrace GSCM practices because they are designed to help organizations analyze and
improve each element in their operations, from the selection of suppliers through to sales and
distribution. The government needs to ensure that there is continuing coordination between
the different administrative levels to implement the green supply chain.

vii
TABLE OF CONTENTS
DECLARATION AND RECOMMENDATION ................................................................. ii
COPYRIGHT ......................................................................................................................... iii
DEDICATION........................................................................................................................ iv
ACKNOWLEDGMENT .........................................................................................................v
ABSTRACT ............................................................................................................................ vi
LIST OF FIGURES .................................................................................................................x
LIST OF TABLES ................................................................................................................. xi
LIST OF ABBREVIATIONS .............................................................................................. xii
CHAPTER ONE: INTRODUCTION ....................................................................................1
1.1 Background to the Study ......................................................................................................1
1.1.1 The Manufacturing Sector in Kenya .................................................................................4
1.2 Statement of the Problem .....................................................................................................6
1.3 Research Objectives .............................................................................................................7
1.4 Research Hypotheses ...........................................................................................................8
1.5 Justification of the Study .....................................................................................................8
1.6 Scope of the Study ...............................................................................................................9
1.7 Limitations of the Study.......................................................................................................9
1.8 Operational Definition of Terms ........................................................................................10
CHAPTER TWO: LITERATURE REVIEW .....................................................................12
2.1 Introduction ........................................................................................................................12
2.2 Theoretical Perspective ......................................................................................................12
2.3 Green Supply Chain Management Practices......................................................................15
2.4 Organizational Performance ..............................................................................................17
2.5 Green Supply Chain Management Practices and Organizational Performance .................17
2.5.1 Green Purchasing and Organizational Performance .......................................................18
2.5.2 Green Reverse Logistics and Organizational Performance ............................................20
2.5.3 Green Marketing and Organizational Performance ........................................................22
2.5.4 Green Risk Management and Organizational Performance ............................................24
2.5.5 Government Legislation and Organizational Performance .............................................25
2.6 Research Gaps ....................................................................................................................25
2.7 Conceptual Framework ......................................................................................................26

viii
CHAPTER THREE: RESEARCH METHODOLOGY ....................................................29
3.1 Introduction ........................................................................................................................29
3.2 Research Design.................................................................................................................29
3.3 Population of the Study ......................................................................................................29
3.4 Sampling Technique and Sample Size ...............................................................................29
3.5 Data Collection ..................................................................................................................31
3.6 Pre-testing of the Data Collection Instruments ..................................................................32
3.6.1 Reliability and Validity ...................................................................................................32
3.7 Data Analysis and Presentation .........................................................................................33
CHAPTER FOUR: DATA ANALYSIS, PRESENTATION AND
INTERPRETATION .............................................................................................................34
4.1 Introduction ........................................................................................................................34
4.1.1 Response Rate .................................................................................................................34
4.2 Demographic Information ..................................................................................................35
4.2.1 Distribution of Respondents by Age ...............................................................................35
4.2.2 Level of Education ..........................................................................................................35
4.2.3 Number of Years in Service ............................................................................................36
4.2.4 Gender Distribution ........................................................................................................37
4.3 Green Purchasing ...............................................................................................................38
4.4 Green Reverse Logistics ....................................................................................................39
4.5 Green Marketing ................................................................................................................41
4.6 Green Risk Management....................................................................................................43
4.7 Performance of Manufacturing Firms ................................................................................44
4.8 Test of Hypotheses .............................................................................................................45
4.8.1 Green Purchasing and Performance of Manufacturing Firms ........................................45
4.8.2 Green Reverse Logistics and Performance of Manufacturing Firms ..............................46
4.8.3 Green Marketing and Performance of Manufacturing Firms .........................................47
4.8.4 Green Risk Management and Performance of Manufacturing Firms .............................48
4.9 GSCM Practices and Performance of Manufacturing Firms .........................................49
CHAPTER FIVE: SUMMARY, CONCLUSIONS AND RECOMMENDATIONS .......51
5.1 Introduction ........................................................................................................................51
5.2 Summary of the Findings ...................................................................................................51
5.3 Conclusions ........................................................................................................................54

ix
5.4 Recommendations of the Study .........................................................................................55
5.4.1 Recommendations for Policy and Practice .....................................................................55
5.4.2 Recommendations for Further Studies............................................................................56
REFERENCES .......................................................................................................................57
APPENDICES ........................................................................................................................64
Appendix I : Questionnaire ......................................................................................................64
Appendix II: Manufacturing Firms in Nairobi County ............................................................68

x
LIST OF FIGURES
Figure 2.1: Conceptual Framework .............................................................................27
Figure 4. 1: Distribution of Respondents by Age ........................................................35
Figure 4. 2: Level of education ....................................................................................36
Figure 4. 3: Number of years in service .......................................................................37
Figure 4. 4: Gender distribution ...................................................................................37

xi
LIST OF TABLES
Table 3.1: Population and Sample by Sector ........................................................................... 31
Table 3. 2: Reliability Analysis ............................................................................................... 32
Table 4.1: Response Rate ......................................................................................................... 34
Table 4.2: Distribution of Green Purchasing ........................................................................... 38
Table 4.3: Distribution of Reverse Logistics ........................................................................ 40
Table 4.4: Distribution of Green Marketing ....................................................................... 42
Table 4.5: Distribution of Green Risk Management ................................................................ 43
Table 4.6: Distribution of Organizational Performance .................................................... 44
Table 4.7: Effect of green purchasing on Performance of manufacturing firms in Nairobi .... 45
Table 4.8: Effect of Green reverse logistics on Performance of manufacturing firms ............ 46
Table 4.9: Relationship between green marketing and performance of manufacturing firms. 47
Table 4.10: Relationship between Green risk management and performance of manufacturing
firms in Nairobi ........................................................................................................................ 48
Table 4.11: Model Summary ................................................................................................... 49
Table 4.12: ANOVA Results ................................................................................................... 49
Table 4.13: Coefficients ........................................................................................................... 50

xii
LIST OF ABBREVIATIONS
AGOA African Growth Opportunity Act
COMESA Common Market for Eastern and Southern Africa
CSR Corporate Social Responsibility
EPZ Export Processing Zones
GDP Gross Domestic Product
GoK Government of Kenya
GSCM Green Supply Chain Management
HRM Human Resource Management
ICT Information and communications technology
JIT Just in Time
MNCs Multinational Corporations
SCM Supply Chain Management

1
CHAPTER ONE
INTRODUCTION
1.1 Background to the Study
In today‟s global turbulences and increasing competition organisations cannot do well in
isolation as collaborations between different organisations have become the major input in
achieving organisational goals and objectives. Supply Chain Management (SCM) was born in
the manufacturing industry in the 1990‟s with the Just In Time (JIT) delivery system
implemented in Toyota (Vrijhoef & Koskela, 2009). The main aim of SCM was reducing
inventories and regulating suppliers‟ interaction with the production lines. Nevertheless, since
its inception SCM has evolved into a full range of disciplines that involves closer customer-
supplier relationships. The supply chain encompasses all activities associated with the flow
and transformation of goods from raw materials (including extraction), through the end user,
as well as information flows (Handfield & Nichols, 2009). Materials and information flows
both up and down the supply chain. In other words, SCM can be defined as the integration of
suppliers and customers into the decision-making processes, focusing on the planning,
implementation and control of the logistics operations to pull materials through the supply
chain (Kannan & Tan, 2005).
Green supply chain entails the use of recycled content products, energy efficient products and
standby power devices, alternative fuel efficient vehicles, bio based products, non-ozone
depleting substances and environmental protection, priority chemical and reduction of carbon
dioxide emissions (source). Efficient production may be enhanced through suppliers‟ use of
cleaner technologies, process innovation and waste reduction (Zhu & Sarkis, 2007).
Green Supply Chain Management (GSCM) refers to management of activities that attempts
to improve the environmental performance of purchased inputs, or of the suppliers who
provide them (Bowen et al., 2011). This is what gives rise to greening of product chains
which in turn led to an emphasis on managing supply chains, an idea which was first
postulated by Taylor (2005) in his argument that solutions to waste (environmental problem)
would be found in the development of a new skill for purchasing.
Green et al., (2006) defines GSCM as the way in which innovation in supply chain
management and industrial purchasing may be considered in the context of the environment.
GSCM is a broader term than sustainable procurement (Bowen et al., 2001). However, this

2
concept is also related with GSCM practices and can be defined as the process whereby
organizations meet their needs for goods, services, works and utilities in a way that achieves
value for money on a whole-life basis in terms of generating benefits not only to the
organization, but also to society and the economy, whilst minimizing damage to the
environment (Purchasing & Supply Agency, 2006).
The supply chain processes influence the quantities and types of resources acquired and
select the source of key products and suppliers. These activities are directly connected to the
degree of negative impacts on the environment and indirectly connected with economic and
social growth within a community (Morton et al., 2012). Conversely, GSCM is related with
any attempt of improving the environmental performance of the purchased products/services
or the suppliers that provide them (Bowen et al., 2001). The main aims of GSCM are to
identify benefits, costs and risks associated with environmental performance (Hanfield et al.,
2005). A typical starting point in considering the inclusion of the supply chain is by
implementing ISO 14001, which recommends the inclusion of policies to ensure that the
suppliers are aware of their environmental practices and liabilities (Rao, 2005). GSCM helps
organizations look critically into the role played by each channel member in the effort to
meet customer needs and at the same time meet desired environmental standards. Thus, it is
not enough for a firm to be ISO14000 certified or to have NEMA certificate for the Kenyan
situations, but there should be another practice for environmental sustainability
(Environmental Management & Health, 2012).
The desired results of environmental performance according to Roberts (2008) is the process
of minimizing the environmental impacts of ones‟ organization by controlling the aspects of
the firms‟ operations that cause, or could cause, impacts to that environment. Thus, in order
to meet the demand for environmental conscious products, the need for GSCM which
incorporates green purchasing, green manufacturing and green marketing should be embraced
as a corporate strategy (Burgess, 2007).
Environmental design has implications for industrial design of products, for example, solar-
electric equipment, wind electricity generators or even innovative automobiles which would
serve as alternatives for energy. A firm that employs GSCM will include in its decisions;
screening of suppliers for environmental performance, working collaboratively with them on

3
green design initiatives and providing training and information to build suppliers
environmental management capacity (Amemba, 2013).
Firm performance can be evaluated both environmentally and economically. In terms of
environmental performance, Theyel (2011) identifies cleaner production, innovative
approaches in design phase as well as environmental management and waste minimization as
the possible benefits. In terms of economic performance, Zhu and Sarkis (2004) distinguish
between positive and negative economic impacts. Positive economic impacts such as
decreased costs of purchasing materials decrease in costs of energy consumption, decrease of
waste treatment or decrease in fines for environmental accidents.
Finally, negative economic impacts such as investment in technology or training, increase of
operational cost or increase of costs for purchasing environmentally friendly products, given
the availability and relatively cheap costs of virgin materials in the construction industry.
However, GSCM can be considered as a relatively new topic, so with current data sources
and experiences it is difficult to assess if in practice GSCM is delivering better results to the
companies involved (Zhu & Sarkis, 2004). The extent in which SMEs will respond to these
requirements will depend on a case-by-case basis and the commercial benefit identified for
these companies (Lamming & Hampson, 2006). This research study aims at determining the
factors that influence the implementation of GSCM in manufacturing industries in Kenya.
Increasingly organizations in Africa in general and Kenya in particular have realized that
environmental management is an important strategic issue to comply with mounting
environmental regulations, to address the environmental concerns of their customers, and to
enhance their competitiveness (Awino, 2007). In supply chain management, one of the most
important corporate strategies related to environmental improvement is the adoption of green
supply chain (GSC). The GSC strategy has become one of the most important initiatives for
many organizations to achieve competitive advantages and corporate sustainable
development. Much of the literature assumed that the GSC strategy adoption is only driven
by rationalistic and deterministic orientation guided by economic and political goals.
However, because supply chain management involves the cooperation and interaction among
multiple stakeholders, the decision to adopt the GSC strategy may have more to do with the
institutional environment in which a firm is situated (Burgess, 2007).

4
1.1.1 The Manufacturing Sector in Kenya
UNIDO (2012) and Awino (2007) point out that Kenya has the biggest formal manufacturing
sector in East Africa and that this sector has grown over time both in terms of its contribution
to the country‟s Gross Domestic Product (GDP) and employment. In terms of employment
generation, the sector is estimated to employ an average of 13 per cent of the labour force in
the Kenyan formal sector. Manufacturing is one of the key activities of the economy that
accounts for about 10 per cent of the GDP. It is evident from this trend that the sector makes
an important contribution to Kenya‟s economy (KAM, 2012). The average size of this sector
for tropical Africa is 8 percent. Despite the importance and size of this sector in Kenya, it is
still very small when compared to that of the industrialized nations (UNIDO, 2012; KIRDI,
2011). KAM (2012) statistics for Kenya‟s economic performance according to sector
(Appendix III) show that the sector contributes to a lesser extent to the GDP as opposed to
the other sectors, hence confirming UNIDO (2012) and KIRDI (2011).
The manufacturing sector contributes about 10 percent of the gross domestic product (GDP)
(Economic Survey, 2013; UNIDO, 2012; Munyoki, 2007; KIRDI, 2009). During the year
2012, the manufacturing sector registered a growth rate of 3.1 percent which was a slower
growth of 3.5 percent registered in 2011. The sector continued experiencing challenges that
included high production costs, high costs of credit competition from imported goods and
also uncertainties related to the 2013 general elections (Economic Survey, 2013). The total
formal employment in the manufacturing sector increased by 2.3 per cent from 271.5
thousand persons in 2011 to stand at 277.9 thousand persons in 2012. The value of the output
increased by 2.6 per cent to Kshs. 1,042.2 billion during the review period. Total value added
on the other hand increased by 8.3 per cent from Kshs. 292.4 billion in 2011 to Kshs. 316.7
billion in 2012. Industrial credit to the sector increased from Kshs. 270.8 million to Kshs.
473.3 million (Economic Survey, 2013; UNIDO, 2012).
Further, Economic Survey (2012) shows that the overall sector posted mixed performance
with majority of the sub-sectors showing positive growths. Key sub-sectors that registered
positive growths included production of tobacco products; motor vehicles, trailers and semi-
trailers, paper and paper products; basic pharmaceutical products; textiles; leather and related
products; electrical equipment and machinery and equipment. The food industry which forms
a major component of the sector registered a marginal decline. This was a result of reduced
production of a number of products like processed milk and tea. Sales from Export

5
Processing Zones (EPZ) on the other hand rose by 12.0 per cent to Kshs. 47.5 billion in 2012
while capital investment in EPZ rose by 28.7 per cent to stand at 34.1 billion in 2012
(Economic Survey, 2013).
Kenya Association of Manufacturers (2012) and the Economic Survey, (2013), point out that
the removal of price controls, foreign exchange controls and introduction of investment
incentives have, however, not resulted in major changes in the overall economy. In particular,
they have not improved the manufacturing performance. Therefore, it has been suggested that
to build a self-sustaining industrial sector, it is necessary to establish strategic linkages within
the domestic economy (Munyoki, 2007). Some efforts have to be made to promote strategic
options among supply chains so as to enhance spread effects of industrial growth and to
facilitate transfer of technology, skills and growth of small and medium scale sub-contractors
(Awino, 2007; Kandie, 2009). Growth in the sector was, however, impeded by depressed
domestic demand, increased oil prices and transport costs. Rising operating costs mainly as a
result of higher power costs coupled with deteriorating road and rail networks further
dampened growth in the sector. The growth in manufacturing sector was mainly attributed to
the rise in output of the agro-processing industries. These included sugar, milk, grain milling,
fish, tea, oils and fats processing sub-sectors. Other key sub-sectors of manufacturing that
performed well in the 2009/2010 financial year were: manufacture of cigarette, cement
production, battery (both motor vehicle and dry cells), motor vehicle assembly and
production of galvanized sheets (KAM, 2009).
Awino (2007) and Kandie (2009) argue that, in 2005 the sector showed signs of recovery and
that a growth of 2.7 percent in 2004 was recorded compared to 1.4 percent in 2003
(Economic Survey, 2005). The recovery is attributed to government imposing legislation to
curb restructuring practices that disadvantaged local manufacturers and zero rating excise
duty and related taxes. In addition, the African Growth Opportunity Act (AGOA) initiative
and the Common Market for Eastern and Southern Africa (COMESA) trading arrangements
continue to impact positively on the manufacturing sector (Economic Intelligent Unit, 2007).
The sector grew by 6.9 percent in 2006 against 5.5 percent in 2005 and grew by 10 percent in
2007 (Economic Survey, 2010). The main components of this sector include food processing
such as cereal milling, meat, dairy, sugar, fruits and vegetables; chemicals, beverages,
tobacco, textile, paper, metal and electronic. The Manufacturing activities in Kenya are

6
mainly concentrated in the main urban centres of Nairobi, Thika, Mombasa, Nakuru, Eldoret
and Kisumu due to good infrastructure and markets (Kandie, 2009; Economic Survey, 2008;
KAM, 2009).
The manufacturing industry in Kenya can be classified under three main sectors, namely, the
agro-based industrial sector, engineering and construction industrial sector and the chemical
and mineral industrial sector (KAM, 2012; Awino, 2007; GOK Vision 2030). However,
K‟Obonyo and Odera, (1995) and K‟Obonyo, (1999) categorize the three major
classifications into two: agro-based and non-agro-based. The agro-based industrial sector had
45% of the firms in the industry while agro-based industrial sector contribute 55%. This
study found that the agro-based industrial sector in Kenya consists of seven sub-sectors and
provides the bulk (68 per cent) of value added from the manufacturing industry while the
32% was from the non-agro based industry. K‟Obonyo (1999) argue that the agro-based
industrial sector has developed on the basis of traditional domestic resource activities. The
major challenges faced by this sector are related to the quantity, quality and price of raw
materials mostly produced by small scale farmers (K‟Obonyo & Odera, 1995; K‟Obonyo,
1999). The seven sub-sectors that form the agro-based industrial sector are food processing,
animal feeds, beverages and tobacco, miscellaneous food products, tanneries and leather
products, woods and wood products and pulp and paper (Economic Survey, 2010; K‟Obonyo
and Odera, 1995; KAM, 2012; Awino, 2007; Kandie, 2009).
1.2 Statement of the Problem
The manufacturing industry is an important sector in Kenya as it makes a substantial
contribution to the country‟s economic development (Economic Survey, 2013).
Unfortunately, extractive and manufacturing firms have been cited as the leading culprits in
environmental degradation since they are at the heart of the supply chain, as large volumes of
products originate and flow through them. Thus, the concept of green GSCM is now gaining
importance since it can help to minimize negative impact of the industrial processes while
enhancing the competitive advantage of the manufacturing industries (Awino, 2007). Further,
with an increasingly knowledgeable population, manufacturing companies are facing ever
increasing demands for environmental accountability and quality products.
Various researchers have been done on this topic including Qinghua et al. (2007), who
carried out a study on green supply chain management, pressures, practices and performance

7
within the Chinese automobile industry. Despite its increasing popularity in industrialized
countries, GSCM is a relatively new concept in developing countries, Kenya included,
although a number of manufacturing firms have already begun to implement these practices,
as demonstrated by various green studies done locally (Amemba, 2013; Andebe, 2013).
Preuss (2012) however observe that implementation of GSCM practices is more often in
response to demand for environmentally sustainable products and services as well as to
governmental environmental regulations. This observation concurs with Andebe‟s (2013)
findings, which revealed that the textile industry in Kenya has adopted GSCM practices to a
minimum extent and solely for compliance with the green regulation put forward by the
government.
According to Korir (2014) green supply chain practices among manufacturing firms in Kenya
are still in the early stages, lagging behind practices in developed countries. Most firms have
not adopted it fully due to lack of awareness and lack of knowledge on the green supply chain
management concept. The need for GSCM in Kenya calls for exploration considering the
current state of affairs where the country has experienced a lot of environmental degradation
due to unsustainable practices from manufacturing firms.
Although diverse literature suggests the many possible benefits of GSCM practises to firms,
empirical work testing the relationship between GSCM and performance of manufacturing
firms are scarce. While the above studies have touched on GSCM concept they were carried
out in other countries and time has elapsed on their findings. It is also clear that there exists a
knowledge gap that the current study would fill. This therefore, sets the stage for current
study. Little has been done in Kenya on GSCM issues and it is in this regard that the current
research sought to determine the effect of GSCM practices on the performance of
manufacturing firms in Nairobi, Kenya.
1.3 Research Objectives
The overall objective of the study was to determine the effect of GSCM practices on the
performance of manufacturing firms in Nairobi, Kenya. The specific objectives of this study
were to:
i. Determine the effect of green purchasing on the performance of manufacturing firms
in Nairobi Kenya.

8
ii. Determine the effect of green reverse logistics on the performance of manufacturing
firms in Nairobi Kenya.
iii. Determine the effect of green marketing on the performance of manufacturing firms
in Nairobi Kenya.
iv. Establish the effect of green risk management on the performance of manufacturing
firms in Nairobi Kenya.
v. Determine the combined effect of green purchasing, green reverse logistics, green
marketing and green risk management practices on the performance of manufacturing
firms in Nairobi Kenya.
1.4 Research Hypotheses
The studies sought to test the following hypotheses:
HA1 Green purchasing has a positive effect on the performance of manufacturing firms in
Nairobi Kenya.
HA2 Green reverse logistics positively affects the performance of manufacturing firms in
Nairobi Kenya.
HA3 Green marketing had a positive effect on the performance of manufacturing firms in
Nairobi Kenya.
HA4 Green risk management affects the performance of manufacturing firms in Nairobi
Kenya.
HA5 Green purchasing, green reverse logistics, green marketing and green risk management
combined positively affect the performance of manufacturing firms in Nairobi Kenya.
1.5 Justification of the Study
The study intended to shed more light on GSCM practices by manufacturing firms and its
effect on their performance. The results of this study could be used to reinforce the
operations of manufacturing firms in relation to their products and the environment. It would
show them how important it is to manufacture environmentally friendly products that can be
recycled and not dangerous to the users of those products. This might also improve the
image of manufacturing companies in the public‟s eye and help them be more prepared on
the concept of GSCM practices. The findings of this study would help manufacturing firms‟
management in setting strategies that embrace GSCM in their operations which makes them
have a competitive advantage on their competitors. This would in return help the industries

9
gain preference from their competitors hence more profitable and from possibilities of losing
revenue.
The findings of this study might also be useful to consumers of manufactured goods on the
selection of what to buy because of effects of harmful products. As well, the findings would
be useful in informing the significance of Corporate Social Responsibility (CSR) of
manufacturing firms by manufacturing environmentally friendly products. The study would
assist consumers in their choice of green suppliers and their products and other benefits that
may accrue from and environmentally guided decision. This study would help the formulate
policies relating to green issues in the country. This study would be useful to scholars
because it is expected to contribute their knowledge in the supply chain process. It would also
be useful as a guide for further exploratory and confirmatory research into SCM practices in
Kenya‟s chemical and mining firms.
1.6 Scope of the Study
This study was limited to an assessment of the effect of GSCM practices on the performance
of manufacturing firms in Nairobi Kenya. This specifically focused on material sourcing,
processing, packaging, storage and selling. The study covered 453 manufacturing firms in
Nairobi and its environments targeting 208 officers whose roles fall on the supply chain. The
study lasted for a period of six months.
1.7 Limitations of the Study
While this study was expected to produce critical findings, it did, however, have certain
limitations. The study findings were limited to the sample size of the population selected. The
research was conducted in manufacturing firms within Nairobi. As a result, it was doubtful
whether or not the findings could be applied more broadly to other firms outside Nairobi.
Another limitation was that the study was based on a cross-section survey, and the study
contained the typical limitations associated with this kind of methodology (Inability to
uncover the exact nature of the theoretical linkages being investigated). To access
information from the organization and respondents targeted the researcher the respondents
were not willing to engage in this study due to related reasons such as privacy and busy
schedules at work place. However, the researcher liaised with the Human Resource
Management (HRM) to facilitate the study. Another limitation was that some respondents

10
were unwilling to participate due to fear of victimization in the event the findings displayed a
negative image of their organizations. However, the study emphasized that the research was
purely academic and that the responses were treated with utmost confidentiality.
1.8 Operational Definition of Terms
Green Marketing: Refers to activities aimed at promoting the taking advantage of the
changing consumer attitudes towards a brand. The firm‟s policies and practices influence the
said changes affecting the quality of the environment and hence, reflect the level of its
concern for community. Efforts companies use, including corporate social responsibility
plans and sustainability efforts (Shane, 2013)
Green Purchase: Refers to the procurement of products and services that have a reduced
effect on human health and environment when compared with competing products or services
that serve the same purpose. It is also known as environmentally preferred purchasing (Rao,
2012).
Green Reverse Logistic: It is all operations related to the reuse of products and materials. It
is the process of planning, implementing and controlling the efficient, cost effective flow of
raw materials, in-process inventory, finished goods and related information from point of
consumption to the point of origin for the purpose of recapturing value or proper disposal. It
includes the management and the sale of surplus as well as returned equipment and machines
(Preuss, 2005).
Green Risk Management: this is a way of managing the risks and capturing the
opportunities associated with climate change and other environmental issues by identifying
environmentally focused investments and risk mitigation strategies intended to enhance the
risk-adjusted returns of the overall company portfolio (Min & Galle, 1997).
Supply Chain Management: This is defined as the integration of suppliers and customers
into the decision-making processes, focusing on the planning, implementation and control of
the logistics operations to pull materials through the supply chain (Mentzer, 2001).

11
Green Supply Chain Management: this refers to management of activities that attempts to
improve the environmental performance of purchased inputs, or of the suppliers who provide
them (Stonebraker& Liao, 2006).

12
CHAPTER TWO
LITERATURE REVIEW
2.1 Introduction
The literature reviewed various studies and theories in support of the adoption of GSCM by
manufacturing chemical industries by exploring practices employed by organizations in an
attempt to overcome environmental challenges.
2.2 Theoretical Perspective
This study is guided by stakeholder theory of organizational management and business ethics
that addresses morals and values in managing an organization. It was originally detailed by
Freeman (1994) in the book Strategic Management: A Stakeholder Approach, and identifies
and models the groups which are stakeholders of a corporation, and both describes and
recommends methods by which management can give due regard to the interests of those
groups. In short, it attempts to address the “Principle of Who or What Really Counts.”
In the traditional view of the firm, the shareholder MH (Majority Holder) view (the only one
recognized in business law in most countries), the shareholders or stockholders are the
owners of the company, and the firm has a binding fiduciary duty to put their needs first, to
increase value for them. In older input-output models of the corporation, the firm converts the
inputs of investors, employees, and suppliers into usable (salable) outputs which customers
buy, thereby returning some capital benefit to the firm. By this model, firms only address the
needs and wishes of those four parties: investors, employees, suppliers, and customers.
However, stakeholder theory argues that there are other parties involved, including
governmental bodies, political groups, trade associations, trade unions, communities,
associated corporations, prospective employees, prospective customers, and the public at
large. Sometimes even competitors are counted as stakeholders.
The stakeholder view of strategy is an instrumental theory of the corporation, integrating both
the resource-based view as well as the market-based view, and adding a socio-political level.
This view of the firm is used to define the specific stakeholders of a corporation (the
normative theory (Donaldson) of stakeholder identification) as well as examine the
conditions under which these parties should be treated as stakeholders (the descriptive theory
of stakeholder salience). These two questions make up the modern treatment of Stakeholder
Theory (Hassan, 2013).

13
There have been numerous articles and books written on stakeholder theory. Recent scholarly
works on the topic of stakeholder theory that exemplify research and theorizing in this area
include Donaldson and Preston and Mitchell, Agle and Wood (2007), Friedman and Miles
(2002) and Phillips (2003).
Donaldson and Preston (2003) argue that the normative base of the theory, including the
identification of moral or philosophical guidelines for the operation and management of the
corporation, is the core of the theory. Mitchell et al.,(2007) derive a typology of stakeholders
based on the attributes of power (the extent a party has means to impose its will in a
relationship), legitimacy (socially accepted and expected structures or behaviors), and
urgency (time sensitivity or criticality of the stakeholder‟s claims).
The political philosopher Charles Blattberg has criticized stakeholder theory for assuming
that the interests of the various stakeholders can be, at best, compromised or balanced against
each other. Blattberg argues that this is a product of its emphasis on negotiation as the chief
mode of dialogue for dealing with conflicts between stakeholder interests. GSCM is
increasingly becoming critical for success in manufacturing industries. Yet, like the
management of any other input, process and output, SCM requires configuration with
business strategy and structure, without which the organization is unlikely to be competitive.
The stakeholder theory will be important for this study because the theory emphasises on
organizational management and business ethics that addresses morals and values in managing
an organization.
The theoretical underpinnings for this study are grounded in the coordination-theoretic
perspective in SCM. Research has separately investigated internal and external characteristics
when investigating the supply chain and inter-organizational performance (Wong et al.,
2009). In a survey of 100 randomly selected supply chain management research articles, it
was found that inter-organizational construct investigations were well represented in the
literature, but studies in intra-organizational construct relationships and SCM were the
subject of „very few studies‟ (Burgess, 2007, Singh et al.,2007). Only one publication was
found that investigated both inter-and intra-organizational constructs (McAdam & Brown,
2001).
Coordination theory argues that enterprises should integrate activities along their supply
chain (Malone & Crowston, 1994). Coordination theory states that dependencies exist among

14
activities and need to be managed properly. The theory has been used to analyze inter-
organizational dependencies (Gosain et al., 2004), coordination of product information in the
supply chain (Legner & Schemm, 2008), and bundling of digitized logistics activities (Lai et
al., 2010). Organizational practices such as GSCM are coordinated through the networks of
communications and relationships that exist among organizational actors, and the strength of
those networks predicts superior performance (Shah et al., 2008).
In the 1990‟s, strategic supply chain management grew out of the recognition that increased
reliance on improved relationships, collaborations, and information exchange with supply
chain partners (Gunasekaran et al., 2008), was needed with the aim to operate as cooperative
value chains rather than as independent organizations seeking individualized pecuniary goals
(Koufteros et al., 2007). Both internal and external organizational changes were required for
successful supply chain management (Lai & Cheng, 2009). Greater cooperation and
coordination across the supply chain, both intra- and inter-organizational, through long-term
and strategic relationships have led to improved financial and organizational performance (da
Silveira and Arkader 2007, Lai et al., 2005).
Investigation of internal and external coordinating mechanisms collectively amongst
organizational and inter-organizational networks has rarely been studied. External
cooperation amongst organizations may not provide significant performance nor be
successful without proper internal cooperation. It has been found that manufacturers with
well-developed internal and external interfaces perform better than their counter parts only
with sound internal interfaces (Koufteros et al., 2005). Innovation (GSCM practices can be
viewed as environmental organizational innovations) is typically an outcome of interaction
between a firm and various outside entities (Yeung et al., 2007). Both, internal and external
issues and relationships come into play in this type of innovation development (Yeung et al.,
2007).
Although both intra- and inter-organizational coordination are researched in the management
literature, they are typically addressed using distinct analytical frameworks. Organization
design, extended from internal units to external organizations, can strengthen inter-
organizational coordination networks and align them with those for intra-organizational
coordination (Mota & de Castro, 2004). Failure to carefully coordinate between the inter- and
intra-organizational levels can cause poor performance as well as high coordination cost (e.g.,

15
delay, re-handling). Organizational change without considering the dependency among the
coordination elements can lead to inferior performance than the expected outcomes.
The impact of external relationships with suppliers and customers on performance is often
mediated by internal coordination (Wong et al., 2009). This one way relationship was
extended to and investigated as a possible two way mediation between customer coordination
investments, supplier coordination investments, and delivery performance (da Silveira &
Arkader, 2007). Such two-way mediation theoretical supposition argues that the relationship
between customer coordination investments and delivery performance were mediated by
supplier coordination investments, and that the relationship between supplier coordination
investments and delivery performance were mediated by customer coordination investments.
These supply chain mediation investigations focused on external investments and
coordination. None considered the joint internal coordination mechanisms and their
relationships to external mechanisms.
It has been found that manufacturers with well-developed internal and external interfaces
perform better than their counter parts only with sound internal interfaces. Innovation GSCM
practices can be viewed as environmental organizational innovations thus typically an
outcome of interaction between a firm and various outside entities. This being the case the
current study will benefit from this theory for coordinated networks of communications and
relationships that exist among organizational actors, and the strength of those networks
predicts superior performance by the firm.
2.3 Green Supply Chain Management Practices
According to Azzorne et al. (2007), environmental practices within profit organizations may
be considered as a set of guidelines that the firm define to respond to the current internal
and/or external pressures and /or to anticipate future evolution of the competitive
environment, of regulators and of the customer‟s needs. Thus each firm according to its own
strategic orientation decides whether to include environmental factors into the overall process
of strategy formation. Consequently the company‟s environmental strategies, which depends
on the company‟s history, the fields where it operates and the country in which it has the
headquarters or it plants.
Pun (2006) posits that there are various tools and methods practitioners and researchers use to
implement environmentally responsible operations with environmental management in

16
industry. The tools and methods were developed to help understand what and how to address
environmental concerns and for practitioners to identify opportunities and translate
understandings into unambiguous strategies directed to improve and sustain eco-performance
of products and operations. Some of them include green supply chain (which is the main area
of concern in this study), green purchasing, life cycle assessment, green quality function
deployment and recycling and remanufacturing.
Green et a.l (2008) indicated that GSC is a method to design and/or redesign the supply
chain that incorporates recycling and remanufacturing into the production process and it
involves minimization of the firm‟s total environmental impact from start of the supply chain
and also from beginning to end of the product life cycle.
The Brundtland Report „Our Common Future‟ (WCED, 2007) clearly spelled out that
sustainable development would only be achieved if society in general, and industry in
particular, learned to produce more goods and services with less of the world‟s resources
(including energy) and less pollution and waste (White et al., 2005). Further research by
Octavio BarrerioTrigos (2007) established the adoption of Green Supply Management and
the performance of companies in the construction industry in the United Kingdom. Octavio
BarrerioTrigos found that companies that had embraced GSCM in their operations were
found to perform better than those which had not (source). He concluded that the adoption of
GSCM by a company is more likely to generate benefits to it.
Harris (2012) observed that green organizational culture values upon which firms may be
positioned include; the need for firms to incorporate environmental considerations throughout
the entire organization, such concerns should be considered throughout the value chain,
economic goals should be tempered, spirituality, morality, smallness and futurity should be
embraced and the environment should be afforded intrinsic valuation and respect. The U.S
environmental protection agency for example offers assistance within their green supplier‟s
network- aiming at suppliers and manufacturers to help them eliminate waste, save money
and reduce their eco-impact. Thus, the increasing consciousness of sustainable development
and reconciling of production with ecosystem conservation have fostered the adoption and
implementation of GSCM (Pun et al., 2012).

17
2.4 Organizational Performance
The key operational variables for performance evaluation are sales and profitability. The
extent to which you achieved the sales volume predicted in your planning and how it changes
in your sales volume as compared to the changes at your competitors are the accurate
measures of Organizational Performance. The percent profit margin indicates how much of
each dollar earned from sales your company keeps as profit and is a good indicator of overall
performance. The business world will always require management to be creative in an effort
to improve their performance; they should have the ability and can take advantage of any
opportunities to improve Organizational Performance. It is important to improve the
Organizational Performance is to create strategies, techniques and business tools are
appropriate and suitable for the company. Accounting statements provide different
measurements to measure the firm performance, such as net income, return on assets or return
on equity. The firm performance as a barometer of the success of the company will be seen as
a benchmark for investors to invest their funds. High the firm performance will push the
company‟s stock market price increases, as investors will respond positively as a signal to
invest funds (Murphy, 2003).
2.5 Green Supply Chain Management Practices and Organizational Performance
Green Supply Chain Management (GSCM) is a kind of sustainable strategic development for
enterprises in today‟s competitive workplace, which has emerged as a new innovative
approach to achieve both financial and environmental benefits simultaneously, by reducing
environmental risk and impact (Vrijhoef & Koskela, 2009). Due to increasing flow of
environmental degradation in recent decades, organizations have been forced to pay more
attention to their ecological footprint by changing their strategic viewpoints and adopting
green initiatives in their production line. With increasing competition in today‟s global
market, the firms have to look to the modern strategic manners, in order to gain sustainable
organization and competitive advantage.
GSCM is a highly important element of organizational success. The economic growth
increases the level of energy and material consumption, which contribute to the
environmental issues and resource depletion problems. It has become increasingly significant
for organizations facing competitive, regulatory, and community pressures to balance
economic and environmental performance. Nowadays, most organizations are starting to go

18
green in their business as a concern to environmental sustainability. They have realized the
greater benefit of the green technology adoption in business operation, which also affect
suppliers and customers (Morton et al., 2012). This section will focus on the effect of green
purchasing, green reverse logistics, green marketing and green risk management practices on
the performance of manufacturing firms.
2.5.1 Green Purchasing and Organizational Performance
Green purchasing is defining as environmentally conscious purchasing practice that reduces
sources of waste and promotes recycling and reclamation of purchased materials without
adversely affecting performance requirements of such materials (Pun, 2006). It is being
argued that purchasing professionals in the buying firms need to understand their recycling
policy involving collection, separation, storage, transportation, reprocessing, and
remanufacturing as part of supplier selection procession which ultimately affects performance
of the organisation (Min & Galle, 2006). From an environmental lifecycle and quality
perspective, it is important to consider the sources of materials from which products are
made. From the inbound perspective of the supply chain it is argued that greening the supply
chain has numerous benefits to an organization, ranging from cost reduction, to integrating
suppliers in a participative decision-making process that promotes environmental innovation
(Rao, 2012). This is to say that a large part of the inbound function essentially comprises of
green purchasing strategies adopted by organizations in response to the increasing global
concerns of environmental sustainability.
Purchasing activity is the key starting point of eliminating waste, so a key factor of the
successful green purchasing is the condition of company recycling and reusing waste. Hokey
et al., (2001) proposed that reducing the emissions of exhaust and sewage and so on, not only
is the premise of ensuring the implementation of green procurement system, but also is the
important way to promote the development of green procurement. The type of companies‟
resources can influence both the purchasing practice, the technology, equipment and facilities
of separating waste can impact the purchasing practice. Stock (1992) thought that green
purchasing can improve a firm‟s economic position, by reducing disposal and liability costs,
conserving resources, and improving an organization‟s public image. Min and Galle, (2001)
found that the two most highly rated obstacles to effective implementing green purchasing
was cost and revenue. In the process of implementing green procurement, the enterprise is

19
bound to increase investment, training staff costs and the communication costs with suppliers
which hence cause the loss of other investment opportunities (Liu, 2009).
Qinghai et al. (2004) found the suppliers stress had greater impact on the implementation of
green supply chain through research. Hou (2007) pointed out that the close cooperation of
suppliers and buyers would promote the successful completion of green purchasing activities.
Carter et al. (1996) defined green purchasing as: in order to facilitate reusing and recycling
resource reduction, the purchasing department should participate in every activity of supply
chain management and should more concretely purchase reused, recycled materials so as to
reduce the use of resources as much as possible. Zsidisin and Siferd defined that green
purchasing is a set of principles, methods under premise of full considering the impact on the
environment. Qinghua et al. (2002) considered green purchasing as: every department in the
enterprise consults decision-making to improve business performance by decreasing the using
materials cost and end treatment cost, protecting resources and enhancing the enterprise
reputation, among others.
Turner (2010) pointed out the potential aim of green procurement is to eliminate waste, and
purchasing department will focus on value by comprehensive considering the total cost in the
process of eliminating waste, which should focus on the business of waste disposal activities.
Usually, it can save more cost in the source of supply chain to prevent waste than at the end
of supply chain. The availability, characteristics, knowledge, ambitions, equipment and
actions of the suppliers can have an impact on purchasing (Knudsen, 2003) and green
purchasing. To achieve an effective environmental performance, the purchaser must take, and
be given, the responsibility and resources for educating suppliers and demonstrate ongoing
commitment (Murray, 2000).
Drumwright (1994) classified the enterprise according to the company leader‟s different view
on environment responsibility through the research of 10 enterprises, provided a framework
for the design of business organizational structure and the implementation of green
procurement, and but also found the environmental awareness of senior leaders had a great
influence on the success of the enterprise green purchasing. The relationship formed with
customers described in terms of communication patterns, cooperation and dependency is
addressed in the purchasing literature, and in the environmental purchasing literature. Carter
et al (1998) describe customers as having a direct impact on firms‟ environmental purchasing

20
activities and Walker et al (2008) investigates how customers‟ influence drives green supply
chain management. The priorities of the customers can influence the environmental
management and environmental purchasing.
Companies can greatly improve business performance by working with suppliers, shippers,
distributors, and customers to better coordinate logistics activities. Green purchasing enables
better compliance with existing norms, improvement of brand image for consumers and
better ranking by non-financial notation organizations. Large and Thomsen (2011) study on
drivers of GSCM Performance found that the degree of green supplier assessment and green
collaboration has direct influence on environmental performance.
Zhu and Sarkis (2011) further observed that under rigorous green purchasing quality control,
organizations can improve their environmental practice by learning from experiences of their
quality management programs. By receiving “green” certificates such as the ISO series of
environmental management systems and standards, organizations are able to create structured
mechanisms for continuous improvement in environmental performance.
2.5.2 Green Reverse Logistics and Organizational Performance
According to Preuss (2005), the link between supply chain management and environmental
protection also needs to be considered from the opposite perspective. Whereas design for
environment technique is dependent on the availability of materials and technical capabilities
of the supply chain, product take-up requires well-honed logistics operations. Managing the
reverse flow of product is an important ability for any company, since the product lifecycle
offers a valuable source of insight about the changing needs of marketing and logistics over
the life of a product. Recycling is a technique that is used to reduce the solid waste stream
volume, though the reverse logistics channels used seem to have received minimal attention
(Lembke, 2012).
Efficiency, accuracy and timeliness in reverse supply chains activities are a priority for
leading manufacturers (www.suppl-chainservices.com). Products that are traded –in are
usually of value. Failure to address the reverse supply chain can lead to lost revenues and
additional expenses. Helms (2012) asserts that, with all the attention to the forward action of
the supply chain, manufacturers are now considering how this supply chain can work in
reverse to reclaim products at the end of their life cycle and return them through the supply
chain for decomposition, disposal, or re-use of key comments. Strategic factors to consider in

21
reverse logistics include costs, overall quality, customer service, environmental concerns and
legislative concerns.
More companies have increasingly altered their company policies with more strategic focus
on reverse logistics (Janse et al., 2009). Reverse logistics has played an increasingly critical
role in overall corporate business (Daugherty et al., 2002) and been examined strategically
within broader supply chain strategy. The more powerful customers, the increasing
multichannel retailers, and the growing enforcement of laws have direct impacts on the
movement of goods throughout supply chain of European electronics industry, and
particularly on the reverse flows (Verweij et al., 2008). Reverse logistics activities require
adequate knowledge management in all phases of returning the product to help solve the
problems it faces in these processes (Wadhwa & Madaan, 2007). In this sense, it will be
essential for the organization to have the ability to generate new knowledge to reduce the
high uncertainty of reverse logistics activities (Arrow, 1962; Galbraith & Kazanjian, 1986)
giving it greater flexibility to expand its capacity to respond to the continuous changes that
occur in these activities.
Reverse Logistics is the opposite of traditional or forward logistics (Beamon, 1999).
Dowlatshahi (2000) and Carter and Ellram (1998) define reverse logistics as a process where
a manufacturer accepts previously shipped products from the point for consumption for
possible recycling and re-manufacturing. Sorting and Recycling are also an important
mechanism when sorting reusable products. Cairncross (1992) and Srivastava (2007) suggest
that collection schemes should be classified according to materials whether separated by the
consumer (separation at source) or centralized (mixed waste). The goal is to sort products that
can be reused to reduce costs of making new products.
The importance of reverse logistics programmes and the process of their development and
implementation have also been described in the literature (Poist, 2000). Redesigning logistics
networks to accommodate product returns and remanufacturing and re-use of such parts and
components can often be profitable (Tibben- Lembke, 2002). The physical location of
facilities and transportation links need to be chosen to convey used products from their
former users to a producer and to future markets again to enhance efficiency and performance
(Fleischmann et al., 2001).

22
Companies need to realize the hidden value in reverse logistics and start to focus in this area
(Mollenkopf & Closs, 2005). They need to understand the financial impact of reverse
logistics strategies. Srivastava and Srivastava (2005) develop a hierarchical decision-making
framework to find the feasibility of profit-driven reverse logistics networks. They find
reverse logistics activities profitable for their select category of products. Nowadays,
information and communication technologies (ICT) are likely to play a key role in the co-
ordination and integration of GSCM activities (Dekker et al., 2004). Problems related to the
integration of reverse logistics activities within an organization have been dealt by Chouinard
et al. (2005), while Daugherty et al. (2002) find that resource commitment to information
technology leads to superior reverse logistics which subsequently improve performance.
2.5.3 Green Marketing and Organizational Performance
Green marketing supports green manufacturing since it is customer or demand focused as
opposed to product oriented manufacturing strategy. Through green marketing initiatives
firms are able to develop their own positive efforts to be more socially responsible and to
meet customer expectations for more environmentally conscious products (Shane, 2013).
According to Iles (2006), chemical manufacturers can green chemistry as a sustainable tool to
reduce toxicity, resource and energy use, and pollution of chemicals. To market green
chemistry companies, need to generate more information internally, build new relations
across the supply chain and provide more information externally.
Without green marketing initiatives, manufacturers of products that have negative impact on
the health of the consumers, like tobacco and beer would render such producers out of
business since even the adverts are restricted and retail prices are regulated by the
government. For Kenyan East, African Breweries and BAT are some of the most profitable
firms in the country despite the challenges. Thus, green marketing may be viewed as a means
by which producers respond in meeting the requirements to become a sustainable market with
the potential to grow and gain competitive advantage.
Fox (2007) argues that firms are recognizing that outputs from the production process should
be viewed under scrutiny of climate change as well. Savvy management recognizes that
everything coming out of a production facility is a product, by-product, or waste. Green
products are recognized nationally or internationally through certification and eco-labeling.
They conclude that business firms need to change their mind set from traditional marketing

23
practices to green marketing practices with a huge investment in technology, R and D and
through Green marketing elements such as eco-design of a product, eco-labeling, eco-
packaging, green logo in order to survive in the green competitive world and to have a
positive impact on the environment.
According to Ottaman (1993) and Ken Peattie (1993), the concept of green marketing is in
and the concept of conventional marketing is out. Azhagaiah and Ilangovan (2006) found out
that the environmental issues have a significant impact on the modern society and observed
the impact of green marketing and the environment protection. Thakur (2009) in his study on
customer awareness with reference to green marketing of automobiles concluded that green
marketing of automobiles is attracting both from urban and rural people. This clearly
indicates that people are shifting to the eco-friendly products to have a positive impact on the
natural environment rather than traditional products. Welling and Chavan (2010), while
analyzing the feasibility of green marketing in small and medium enterprises in Suburban
Mumbai, concluded that both the State and Central governments should take necessary steps
and encourage the SME`s to manufacture green products.
Brady (2010) argues that due to the diminishing availability of natural resources, such as
water, oil, this green interest is also creating a concern for conservation. With the viability of
the planet a growing concern many consumers are willing to do their part. Ramakrishna
(2012), in his study on green marketing in India, the researcher analysed the eco-issues in
green marketing through the 4p`s of green marketing mix and concluded that awareness to be
created among the people about green marketing benefits and eco-friendly products and also
concluded that the firms need to give more attention towards the green culture in order to
survive in the tough market.
According to Hall (2003), greening the marketing process has numerous benefits to an
organization, ranging from cost reduction, to integrating suppliers in a participative decision-
making process that promotes environmental innovation. Korir (2014) study on green supply
chain implementation practices and supply chain performance of battery manufacturing firms
in Kenya found that that green marketing practices are important in the supply chain
performance. Likewise, Chege (2012) study on green supply chain management practices and
performance of private hospitals in Nairobi, Kenya found that green marketing practices
revealed a significantly positive relationship with the performance parameters. Since GSCM

24
practices affected performance in this regard, implementing GSCM practices improves
organizations‟ capacity to handle the supply chain disruption.
2.5.4 Green Risk Management and Organizational Performance
Walton et al. (1998), examined the integration of supply chain risk management team into
environmental management processes, and observed two evolving trends. They firstly
suggest that environmental issues are becoming an intrinsic part of supply chain risk
management as it is in strategic planning in organisations due to stricter regulations and the
demands of environmental accountability. They also observe a second trend amongst their
case examples, that organisations are integrating their supply chains risk management
department to reduce operating costs and improve their customer service.
The concepts pertaining to supply chain environmental management (SCEM) or greening the
supply chain are usually understood by industry as screening suppliers for environmental
performance and then doing business with only those that meet regulatory standards through
effective supply chain risk management practices (2002). The driving forces for introducing
and implementing the concept into the company operations are numerous and comprise a
range of reactive regulatory reasons to proactive strategies and competitive advantage
reasons. Approaches such as cleaner production, environmental management systems and
eco-efficiency have been implemented for green management practices. The factors driving
the competitive advantage through environmental performance have been identified as
market expectations, risk management, regulatory compliance and business efficiency.
Min and Galle (1997) conducted an empirical survey of US risk management managers with
regard to green supply chain risk management and have found that that the primary driving
force to green risk management is an urge to meeting regulations rather than environmental
monitoring or partner- ships. The effectiveness of green purchasing also depends on whether
the firm has centralised or decentralised decision-making, which determines the extent of
flexibility in the green purchasing process. Environmentally sustainable (green) supply chain
management (GSCM) has emerged as an important organizational philosophy to achieve
corporate profit and market share objectives by reducing environmental risks and impacts
while improving ecological efficiency of these organizations and their partners (van Hock &
Erasmus, 2000).

25
Stevels (2002) demonstrated the benefits of green risk management to different roles of
supply chain including environment and society in terms of different categories: material,
immaterial, and emotion. For material, green risk management helps lower environmental
load for environment, lower cost prices for supplier, lower cost for producer, lower cost for
ownership for customer, and less consumption of resources for society. In terms of
immaterial, green risk management helps overcome prejudice and cynicism foe environment,
less rejects for supplier, easier to manufacture for producer, convenience and fun for
customer, and better compliance for society. For emotion, green risk management helps
motivation of stakeholder for environment, better image for supplier and producer, feel good
and quality of life for customer, and make industry on the right track for society
2.5.5 Government Legislation and Organizational Performance
Government legislation is law which has been promulgated by a legislature or other
governing body or the process of making it. Before an item of legislation becomes law it may
be known as a bill, and may be broadly referred to as legislation, while it remains under
consideration to distinguish it from other business. Legislation can have many purposes: to
regulate, to authorize, to proscribe, to provide (funds), to sanction, to grant, to declare or to
restrict. It may be contrasted with a non-legislative act which is adopted by an executive or
administrative body under the authority of a legislative act or for implementing a legislative
act (Wim, 2009).
According to Wim (2009), the policy and legislative actions of any government, at national,
state, and local levels, have significant impacts on the management and how various
industries operate. Some of these impacts do not arise through actions directed toward the
individual industry itself, but through actions directed toward associated or competing
industries, such as agriculture, tourism, or recreation. Whether a given bill will be proposed
and is generally a matter of the legislative priorities of government.Legislation is regarded as
one of the three main functions of government, which are often distinguished under the
doctrine of the separation of powers.
2.6 Research Gaps
GSCM is increasingly becoming critical for success in manufacturing industries. Yet, like the
management of any other input, process and output, SCM requires configuration with
business strategy and structure, without which the organization is unlikely to be competitive.

26
Various other researchers have been done on the this topic including Qinghua et al. (2007)
who carried out a study on green supply chain management, pressures, practices and
performance within the Chinese automobile industry. They found out that the enterprises
have experienced high and increasing regulatory and market pressures and at the same time
have strong internal drivers for GSCM practice adoption. Hamner (2012) studied and
proposed the involvement of senior leaders can strengthen cooperation with its suppliers and
promote the implementation of green supply chain.
Hokey et al. (2011) proposed that reducing the emissions of exhaust and sewage and so on,
not only is the premise of ensuring the implementation of green procurement system, but also
is the important way to promote the development of green procurement. Zhu et al. (2009)
found that external GSCM practice has grown in importance, an argument also supported by
Zsidisin and Hendrick (2008) who investigated purchasing managers in Germany, the UK
and the USA. This study found out that for effective environmental purchasing there needs to
be design specifications for suppliers that include environmental requirements for purchased
items, cooperation with suppliers that include environmental objectives, environmental audit
for suppliers‟ internal management and suppliers ISO14001 certification.
While the above studies have touched on GSCM concept they were carried out in other
countries and time has elapsed on their findings. It is also clear that there exists a knowledge
gap that the current study would fill. This therefore, set the stage for current study. What then
was the effect of GSCM Practices on the performance of manufacturing firms in Nairobi
Kenya?
2.7 Conceptual Framework
In this study, the independent variables are green purchasing, green reverse logistics, green
marketing and green risk management while the dependent variable is organizational
Performance. These variables are related as shown in Figure 2.1.

27
Independent Variable Moderating Variable
Figure 2.1: Relationship between GSCM Practices Government Legislation and
Organizational Performance
The study sought to establish the relationship that exists between the independent variables,
moderating and the dependent variable. In the current study the independent variables include
green purchasing, reverse logistics, green marketing and green risk management. These
variables were considered against Organizational Performance as the dependent variable. On
the other hand, the study sought to establish the relationship that exists when a moderating
variable of government legislation is added to the relationship. As shown in Figure 2.1 above,
there exists a relationship between independent and dependent variables in the study.
Application of GSCM practices is expected to have an impact on organizational performance.
Green Purchasing will lead to reduced short procurement distance and inventory costs
ultimately leading to timely delivery of materials, products and improved service to
customers. Green Purchasing ensures that purchased items possess desirable ecological
attributes such as reusability, recyclability and non–toxic materials. Additionally, green
purchasing can also address issues of waste reduction, material substitution through proper
sourcing of raw materials and waste minimization of hazardous materials. Supplier
involvement is crucial to achieving environmental goals.
Green Reverse logistics will reduce space and time; this is expected to have an impact in
GSCM Practices
Green Purchasing
-Reduction of waste sources
-% environmental innovations
Green Reverse Logistics
-Improved overall quality
-Management of reverse flow
Green Marketing
-Social Responsibility
Meeting customer expectations
Green Risk Management
-Improved risk management
-Reduced payment of fines
Government
legislation
Organizational Performance
-Customer Satisfaction
-Profitability
-Market share
Dependent Variable

28
reliability and responsiveness. Green Reverse Logistics is the task of recovering discarded
products and may also include packaging and shipping materials and backhauling them to a
central collection point for either recycling or remanufacturing. Handling the mechanics of
reverse logistics require significant attention by logistics professionals. Product recall
requires organization to be able to reverse the normal logistics flow from suppliers to
customers so that inventory deemed unsuitable can be located by customers and returned to
suppliers in a timely and cost effective manner.
Green marketing involves all the activities required to deliver the final product to the
consumer. It may involve packaging, transportation, location analysis, and warehousing and
inventory management. The firms have to consider a mode of transport with less carbon print,
better packaging methods like recyclable containers, well designed warehouses and improved
inventory management skills. Green marketing focuses on the green products like hybrid
vehicles and the greening of processes like reducing carbon prints. These practices are geared
towards reducing the impact of the product to the environment
Green risk management networks have some generic characteristics related to the
coordination requirement of two markets, improved risk management, reduced payment of
fines, supply uncertainty, returns disposition decisions, postponement and speculation. While
the emphasis was initially on technical improvements that can be undertaken to both products
and processes with an aim of reducing environmental costs, environmentally proactive
organizations adopting green risk management have now recognized that it is critical to
develop a healthy working relationship with consumers, suppliers and government authorities
in order for design for environment to truly become an integral part of Green Supply Chain
initiatives.

29
CHAPTER THREE
RESEARCH METHODOLOGY
3.1 Introduction
This chapter briefly explained the design of the study, target population and sample design,
data collection methods, data processing, analysis, interpretation and reporting procedures
that were used in the study.
3.2 Research Design
Across sectional survey design was used to study the relationship between Green Supply
Chain Management Practices and firm performance at a single point in time. According to
Cooper and Schindler (2003), a cross sectional survey is done at only one point in time or
over a short period, collecting of data pertaining to the variables in a population or sample is
done at a point in time. For this study a cross sectional design was appropriate so as to
determine the effect of GSCM practices on the performance of manufacturing firms in
Nairobi Kenya. Cross-sectional research design uses different groups of respondents to study
a variable at various levels and its effects on another variable that can be divided into various
levels as given in factorial design (KIM, 2000). The design has the ability to allow for data
collection, analysis and reporting within the prescribed duration for academic purposes.
Similar studies have successfully used this design. A common goal of survey research was to
collect data representative of a population. The researcher uses information gathered from the
survey to generalize findings from a drawn sample back to a population, within the limits of
random error.
3.3 Population of the Study
The population of this study constituted all manufacturing firms in Nairobi Kenya. There
were 453 manufacturing firms in Nairobi area which the study targeted (Kenya Association
of Manufacturers, 2013). The population under study have homogeneous characteristics.
Homogeneity has been described as the complete set of individuals, organizations or items
with the same common observable characteristics (Mugenda & Mugenda, 2003).
3.4 Sampling Technique and Sample Size
Owing to the fact the number of firms in Nairobi was large and the time and resources
available were not sufficient to collect data from all of them a representative sample was
therefore needed for this study. A probability sampling technique was employed where a

30
sample size of 208 firms were selected from each sector. The firms were clustered according
to sector and a proportionate stratified random sample of the firms were picked from each
cluster according to the sectors or their area of specialization such as those dealing energy,
food, beverages and chemical formed same clusters. The respondents were chosen based on
proportionate sampling where each cluster or sector is further subdivided into sub population
and then using a simple random sampling to get the actual respondents from each sector.
To determine the sample size, the following formula suggested by Kothari (2003) was used.
N =X2Npq/{d
2(N-1)+X
2pq}
Where
n=Desired sample size
N=Target population
P=population proportion
q =1-p
d = corresponding to significance level which was the degree of accuracy reflected by
amount of error that was associated with the sample size of the population
X2 = chi square value for one degree of freedom relative confidence at 95% confidence
level X=1.96
n =1.962x453x0.5x0.5/{0.05
2(453-1)+ 1.96
2 x0.5x0.5
= 435.0612/2.0904
n =208 respondents
The manufacturing firms in Nairobi were divided into different sector depending on the
product or service they dealt with as shown in Table 3.1.

31
Table 3.1: Population and Sample by Sector
Sector Population Sample
Energy Sector 42 19
Chemical Sector 60 27
Food and Beverage Sector 102 46
Plastic and Rubber 51 24
Building Sector 6 3
Paper Sector 48 22
Textile Sector 39 18
Timber and Wood Products Sector 22 10
Metals and Allied Sector 38 18
Pharmaceutical and Medical Equipment 20 9
Leather Products and Footware 8 4
Motor Vehicle Assembly and Accessories 17 8
Total 453 208
Source: KAM (2013)
3.5 Data Collection
The study used primary data. Primary data consists of original data gathered by the researcher
for specific purpose study at hand (Mugenda and Mugenda, 1999). Data was collected by the
use of questionnaires administered by the researcher. As the name suggests, questionnaires
are a set of questions that have been structured down for the respondent either to be
structured or semi-structured, to be used by the interviewer while interviewing the respondent
(Mugenda & Mugenda, 1999).
The questionnaires contained both structured and non-structured questions, designed to
gather maximum data to achieve each objective of the study. Both quantitative and qualitative
data was collected by the use of the mentioned instrument. Section one of the questionnaire
capture the general information about the selected manufacturing industries while section two
focused on the GSCM practices comprising of green purchasing, green risk management,
reverses logistics and green marketing. Subsequent sections focused on performance
measures of the firms. One questionnaire was used to collect data from each firm and the
respondents was Procurement Officers in Supply Chain Management because they are
directly involved in the subject of study.

32
3.6 Pre-testing of the Data Collection Instruments
Pre-testing is a small-scale trial of a particular research component (Cooper & Schindler,
2003). The researcher subjected the draft questionnaire to a pilot test on ten manufacturing
firms in Nairobi that were not part of the selected sample. One questionnaire was
administered to each of the organizations in some sectors of the manufacturing industry. The
purpose was to test for validity and reliability.
3.6.1 Reliability and Validity
The study used content validity which draws an inference from test scores to a large domain
of items similar to those on the test. Content validity was concerned with sample-population
representativeness. Robson (2002) stated that the knowledge and skills covered by the test
items should be representative to the larger domain of knowledge and skills. Expert opinion
was requested to comment on the representativeness and suitability of questions and gave
suggestions of corrections to be made to the structure of the research tools. This helped to
improve the content validity of the data that was collected. Content validity was obtained by
asking for the opinion of the supervisor, lecturers and other professionals on whether the
questionnaire was adequate.
Reliability focuses on the degree of consistency in assignment of similar words, phrases or
other kinds of data to the same pattern or theme by different researchers (Hussey & Collis,
2009). It also means the degree of consistency that the same researcher assigns similar
observations and interpretations at different points in time. The study used the Cronbach‟s
Alpha that is widely used to assess internal consistency reliability and was used for three,
four, or five point likert scale items with 0.7 being the cut-off point (Oncu, 1994). The results
are as shown in the Table 3.2.
Table 3. 2: Reliability Analysis
Variable Cronbach’s Alpha Number of Items Comment
Green purchasing 0.846 5 Reliable
Green reverse logistics 0.785 5 Reliable
Green marketing 0.831 5 Reliable
Green risk management 0.962 5 Reliable

33
According to Oncu (1994), an Alpha value greater than 0.7 is a desirable threshold for
benchmarking the internal consistency of the data collection tool. A Cronbach Alpha was
determined for every objective which formed a scale in the research. Table 3.2 shows that
green risk management had the highest reliability (α=0.962), followed by green purchasing
(α=0.846), then green marketing (α=0.831) and finally reverse logistics (α=0.785) evidently,
all the four variables were reliable and their reliability values exceeded the prescribed
threshold of 0.7.
3.7 Data Analysis and Presentation
Once data had been collected it was recorded, edited and cleaned before analysis for both
quantitative and qualitative data using the appropriate tools. On the other hand, the study used
descriptive and inferential statistics to analyse the quantitative data. This study utilized the
SPSS software to perform correlation and regression analysis on the collected data.
The following multivariate regression analysis model on the effect of green supply chain
management on performance of manufacturing firms was adopted and analysed using the
SPSS software. The prediction equation was as shown below:
Y= β0 + β1Χ1 + β2 Χ2+ β3 Χ3+ β4Χ4+ ε
Where Y= performance of selected manufacturing firms at time (t).
X1= Green purchasing
X2=Green Reverse logistics
X3= Green marketing
X4= Green risk management
β0: Y intercept; and reflects the constant of the equation.
β1 – β4= Regression coefficients.
ε = error term.
The analysed data was presented using statistical and graphical techniques. Statistical
techniques used involved measures of central tendency including the mean, median and
mode. The study also used measures of dispersion such as standard deviation and variance.
Graphical techniques involved the diagrammatic representation by use of tables and charts.

34
CHAPTER FOUR
DATA ANALYSIS, PRESENTATION AND INTERPRETATION
4.1 Introduction
This chapter presents data analysis of the findings obtained from the field. It presents the
background information of the respondents, findings of the analysis based on the objectives
of the study. Descriptive statistics have been used to discuss the findings of the study.
4.1.1 Response Rate
The study targeted a sample size of 208 respondents from which 180 responded which
constituted 86.5%. This response rate was satisfactory to make conclusions for the study. The
response rate was representative. According to Mugenda and Mugenda (2003), a response
rate of 50% is adequate for analysis and reporting; a rate of 60% is good and a response rate
of 70% and over is excellent. Based on the assertion, the response rate was considered to
excellent.
Table 4.1: Response Rate
Sector Questionnaires
Administered
Questionnaires
filled & Returned
Percentage
Energy Sector 19 16 84.2
Chemical Sector 27 23 85.2
Food and Beverage Sector 46 42 91.3
Plastic and Rubber 24 21 87.5
Building Sector 3 2 66.7
Paper Sector 22 19 86.4
Textile Sector 18 17 94.4
Timber and Wood Products Sector 10 9 90.0
Metals and Allied Sector 18 14 77.8
Pharmaceutical and Medical Equipment 9 8 88.9
Leather Products and Footware 4 3 75.0
Motor Vehicle Assembly and Accessories 8 6 75.0
Total 208 180 86.5
As illustrated in the Table 4.1 majority of the respondents were from the food and beverage
sector in line with the number of respondents targeted.
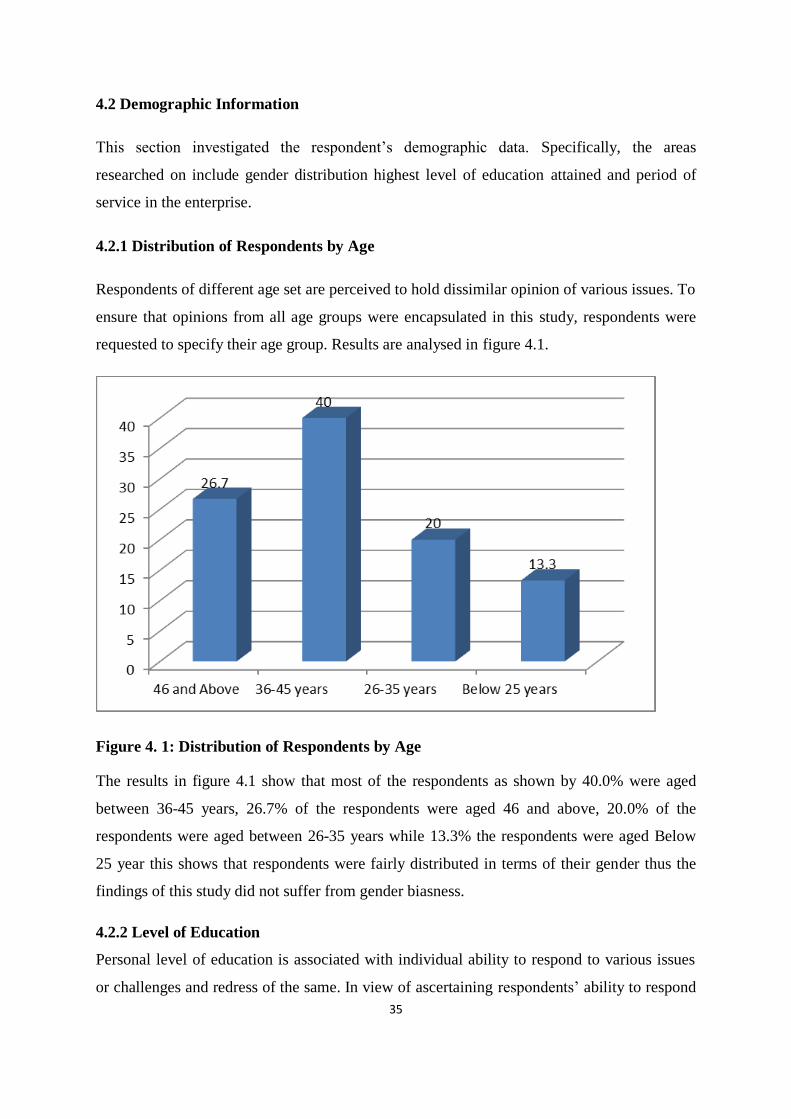
35
4.2 Demographic Information
This section investigated the respondent‟s demographic data. Specifically, the areas
researched on include gender distribution highest level of education attained and period of
service in the enterprise.
4.2.1 Distribution of Respondents by Age
Respondents of different age set are perceived to hold dissimilar opinion of various issues. To
ensure that opinions from all age groups were encapsulated in this study, respondents were
requested to specify their age group. Results are analysed in figure 4.1.
Figure 4. 1: Distribution of Respondents by Age
The results in figure 4.1 show that most of the respondents as shown by 40.0% were aged
between 36-45 years, 26.7% of the respondents were aged 46 and above, 20.0% of the
respondents were aged between 26-35 years while 13.3% the respondents were aged Below
25 year this shows that respondents were fairly distributed in terms of their gender thus the
findings of this study did not suffer from gender biasness.
4.2.2 Level of Education
Personal level of education is associated with individual ability to respond to various issues
or challenges and redress of the same. In view of ascertaining respondents‟ ability to respond

36
to research questions and responders were requested to indicate their highest level of
education achieved. Results are analysed in figure 4.2.
Figure 4. 2: Level of education
Figure 4.2 shows that most of the respondents as shown by 36.7 % held undergraduate level
33.3% of the respondents indicated diploma, 16.7 % of the respondents indicated certificate
while 13.3% of the respondents indicated certificate. This implies that respondents were well
educated which means that they were in a position to respond to research questions with ease.
4.2.3 Number of Years in Service
Employee period of service is highly associated with employee knowledge on organisational
internal operations. Therefore, to gauge the quality of information that respondents were
likely to offer, respondents were requested to specify the Number of years they had served for
in manufacturing industry. Results are analysed in Figure 4.3.

37
Figure 4. 3: Number of Years in Service
The results in figure 4.3 show that majority of the respondents as shown by 50.0% have
worked with manufacturing firms for a period of 10 to 19 years 30.0% have worked with
manufacturing firms for a period of 1 to 9 years while 20.0% have worked with
manufacturing firms for a period of over 20 years. This implies that majority of the
respondents had worked with manufacturing firs for a considerable period of time which
mean that they were in a position to give credible information relating to this study.
4.2.4 Gender Distribution
Respondents were requested to indicate their gender category. This was sought in view of
ensuring gender involvement in this study. Results are analysed in figure 4.4.
Figure 4. 4: Gender Distribution
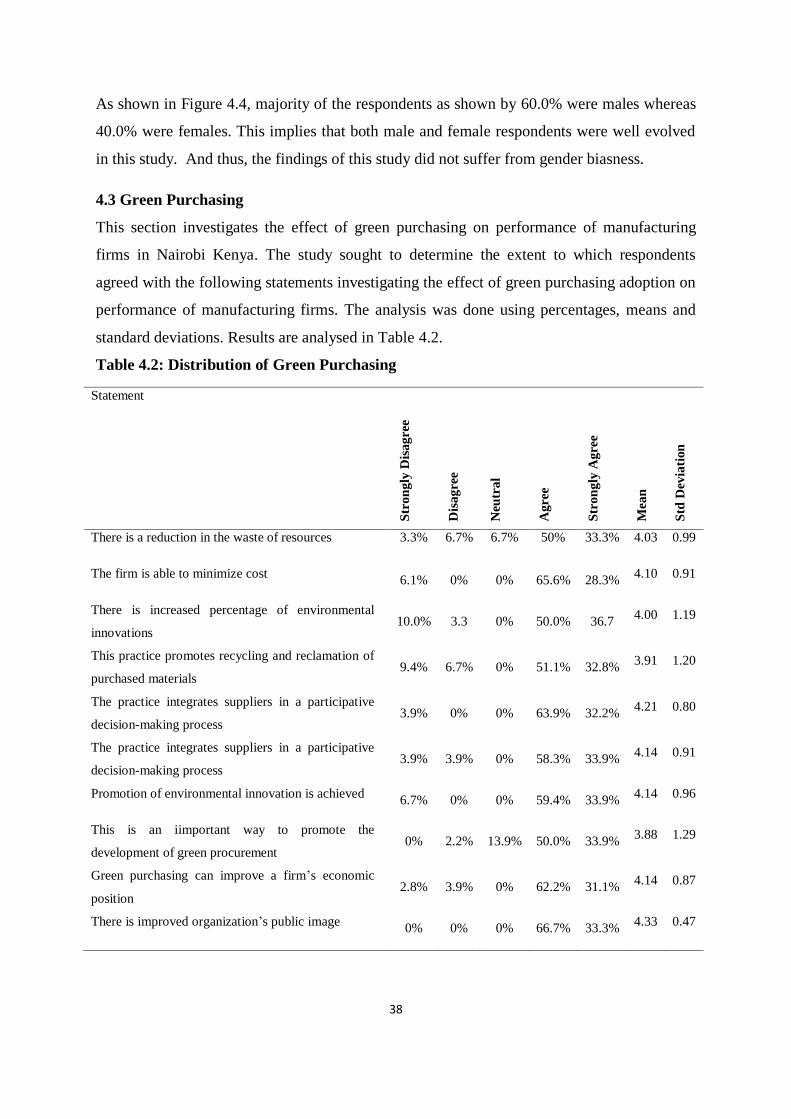
38
As shown in Figure 4.4, majority of the respondents as shown by 60.0% were males whereas
40.0% were females. This implies that both male and female respondents were well evolved
in this study. And thus, the findings of this study did not suffer from gender biasness.
4.3 Green Purchasing
This section investigates the effect of green purchasing on performance of manufacturing
firms in Nairobi Kenya. The study sought to determine the extent to which respondents
agreed with the following statements investigating the effect of green purchasing adoption on
performance of manufacturing firms. The analysis was done using percentages, means and
standard deviations. Results are analysed in Table 4.2.
Table 4.2: Distribution of Green Purchasing
Statement S
tron
gly
Dis
agre
e
Dis
agre
e
Neu
tral
Agre
e
Str
on
gly
Agre
e
Mea
n
Std
Dev
iati
on
There is a reduction in the waste of resources 3.3% 6.7% 6.7% 50% 33.3% 4.03 0.99
The firm is able to minimize cost 6.1% 0% 0% 65.6% 28.3%
4.10 0.91
There is increased percentage of environmental
innovations 10.0% 3.3 0% 50.0% 36.7
4.00 1.19
This practice promotes recycling and reclamation of
purchased materials 9.4% 6.7% 0% 51.1% 32.8%
3.91 1.20
The practice integrates suppliers in a participative
decision-making process 3.9% 0% 0% 63.9% 32.2%
4.21 0.80
The practice integrates suppliers in a participative
decision-making process 3.9% 3.9% 0% 58.3% 33.9%
4.14 0.91
Promotion of environmental innovation is achieved 6.7% 0% 0% 59.4% 33.9%
4.14 0.96
This is an iimportant way to promote the
development of green procurement 0% 2.2% 13.9% 50.0% 33.9%
3.88 1.29
Green purchasing can improve a firm‟s economic
position 2.8% 3.9% 0% 62.2% 31.1%
4.14 0.87
There is improved organization‟s public image 0% 0% 0% 66.7% 33.3%
4.33 0.47

39
As shown in Table 4.2, majority of the respondents agreed that green purchasing practice
integrates suppliers in a participative decision-making process (Mean = 4.21 std deviation =
0.80) green purchasing has resulted to improved organization‟s public image(Mean = 4.33,
std deviation = 0.47), green purchasing integrates suppliers in a participative decision-making
process, Promotion of environmental innovation is achieved through green purchasing, Green
purchasing improves a firm‟s economic position (Mean = 4.14 std deviation = 0.91), through
green purchasing, the firm is able to minimize operational cost (Mean = 4.10 std deviation =
0.91) and that There is a reduction in the waste of resources (Mean = 4.03 std deviation
=0.99). The finding is in line with the research by Pun, (2006). These findings concur with
that of Jumadi and Zailani (2010) who depicts that a reduction in the product environmental
impact may be achieved not only through an appropriate product design, but also a proper use
by consumers.
The study also revealed that green purchasing has resulted to increased environmental
innovations (mean =4.00 std deviation =1.19) green purchasing promotes recycling and
reclamation of purchased materials (mean = 3.91, std deviation = 1.20), this is an iimportant
way to promote the development of green procurement (mean = 3.88, std deviation =1.29).
These findings correspond with those of Colicchia et al, (2011) who states that initiatives to
minimize environmental impact in inbound supply chain, according to the “green
procurement” approach include eco-labeled product purchase, adoption of environmental
criteria into the supplier assessment system environmental and collaboration with suppliers.
4.4 Green Reverse Logistics
This section investigates the effect of reverse logistics on performance of manufacturing
firms in Nairobi Kenya. The study sought to determine the extent to which respondents
agreed with the following statements investigating the effect of reverse logistic adoption on
performance of manufacturing firms. Results are presented in Table 4.3.

40
Table 4.3: Distribution of Reverse Logistics
Str
on
gly
Dis
agre
e
Dis
agre
e
Neu
tral
Agre
e
Str
on
gly
Agre
e
Mea
n
Std
Dev
iati
on
There is improved overall quality 0% 0% 3.3% 63.3% 33.3% 4.30 0.53
The organization has management of
reverse flow 0% 0% 56.7% 56.7% 43.3% 4.43 0.50
Product lifecycle offers a valuable source of
insight about the changing needs 0% 6.7% 0% 60.0% 33.3% 4.27 0.58
There are more powerful customers 0% 0% 10% 60.0% 20% 4.40 0.49
There is increased multichannel retailers 0% 0% 3.3% 53.3% 43.3% 4.40 0.56
The reverse logistics channels used seem to
have received minimal attention 3.3% 3.3% 0% 56.7% 36.7 4.27 0.68
Efficiency, accuracy and timeliness in
reverse supply chains activities are a
priority
0% 0% 0% 66.7% 33.3% 4.33 0.47
There is more strategic focus on reverse
logistics 0.1% 3.3% 3.3% 63.3% 30% 4.20 0.66
Sorting and Recycling are an important
mechanism 0% 3.3% 6.7% 50.0% 40.0% 4.27 0.73
Ccollection schemes should be classified
according to materials 3.3% 3.3% 0% 60.0 33.3 4.23 0.67
As shown in Table 4.3, majority of the respondents agreed that reverse logistic adoption
resulted to better organisation management of reverse flow (mean = 4.43 std deviation
=0.50), escalation of more powerful customers, there is increased multichannel retailers
(mean = 4.40 std deviation = 0.56), reverse logistic adoption has promoted efficiency,
accuracy and timeliness in reverse supply chains activities are a priority(mean = 4.33 std
deviation = 0.47), and that reverse logistic adoption resulted to improved overall quality in
supply operations (mean = 4.30 std deviation =0.53). the study also revealed that reverse
logistics allows a manufacturing to receive products back from the consumer or send unsold
merchandise back to the manufacturer to be taken apart, sorted, reassembled or recycled;
minimising overall costs for an organisation. These findings are in line with the research by

41
Lembke (2012) that reverse logistics can be valuable in increasing product lifecycles, supply
chain complexity, maintainable practices and consumer preferences; which have to be
improved on to maintain productivity and growth.
The study also revealed that product lifecycle offers a valuable source of insight about the
changing needs, the reverse logistics channels used seem to have received minimal attention,
sorting and recycling are an important mechanism (mean = 4.27 std deviation = 0.73),
ccollection schemes should be classified according to materials (mean =4.23 std deviation =
0.67), there is more strategic focus on reverse logistics (mean = 4.20 std deviation = 0.66).
The finding is in line with the research by Helms, (2012) reverse logistic gains include;
increasing speed of production, reducing costs (transportation, administrative, and
aftermarket maintenance, repair and replacement), retaining customers by improving service
goals and meeting sustainability goals. Reverse logistics can include gaining feedback to
make improvements and to improve the understanding of real reasons for product returns.
More value can be extracted from used/returned goods instead of wasting manpower, time
and costs of raw materials involved in the original supply chain and that improved customer
satisfaction and loyalty by paying more attention to faulty goods, and repairs of merchandise.
4.5 Green Marketing
This section investigates the effect of green marketing on performance of manufacturing
firms in Nairobi Kenya. The study sought to determine the extent to which respondents
agreed with the following statements investigating the effect of green marketing adoption on
performance of manufacturing firms. The results are Presented in Table 4.4.

42
Table 4.4: Distribution of Green Marketing
Str
on
gly
Dis
agre
e
Dis
agre
e
Neu
tral
Agre
e
Str
on
gly
Agre
e
Mea
n
Std
Dev
iati
on
The organization has a social responsibility 0% 6.7% 0% 56.7% 36.7%
4.23 0.76
The firm is able to meet customer expectations 6.7% 20.0% 8.9% 34.4% 30.0%
3.61 1.28
The practice provides more information externally 0% 0% 0% 66.7% 33.3%
4.33 0.47
The practice builds new relations across the supply
chain 3.3% 8.3% 8.9% 44.4% 35.0
3.99 1.04
The firm is able to survive in the green competitive
world 3.9% 15.0% 2.8% 49.4% 28.9% 3.84 1.12
Green marketing supports green manufacturing
since it is customer/demand focused 1.7% 10.6% 0% 43.3% 44.4%
4.18 0.99
Firms are able to develop their own positive efforts
to be more socially responsible
3.3% 20% 5% 38.3% 3.3% 3.78 1.20
The firm is able to meet customer expectations for
more environmentally conscious products
1.7% 13.9% 3.3% 47.8 33.3% 3.97 1.04
This practice has led to new relations across the
supply chain
1.7% 7.2% 5.6% 58.9% 26.7% 4.02 0.87
Government should take necessary steps and
encourage the manufacture of green products.
1.7% 11.1% 3.3% 65% 18.9% 3.88 0.90
As shown in Table 4.4, majority of the respondents agreed that green marketing provides
more information externally (mean = 4.33 std deviation = 0.47), the organization has a social
responsibility (mean = 4.23 std deviation = 0.76), green marketing supports green
manufacturing since it is customer or demand focused (mean = 4.18 std deviation = 0.99),
green marketing has led to new relations across the supply chain (mean =4.02, std deviation
=0.87), green marketing practice builds new relations across the supply chain (mean = 3.99,
std deviation =1.04). The findings are in line with the research by Iles (2006), that green
marketing can help companies reduce operating and production costs, specifically by
lowering energy usage.
The study also revealed that through green marketing manufacturing firms have developed
new relations across the supply chain (mean = 3.99, std deviation =1.04) manufacturing firms
are able to meet customer expectations for more environmentally conscious products (mean =

43
3.97 std deviation = 1.04) ggovernments should take necessary steps and encourage the
manufacture of green products. (Mean = 3.88 std deviation =0.90) through green marketing
manufacturing firms are able to survive in the green competitive world (mean = 3.84 std
deviation = 1.12) manufacturing firms have developed their own positive efforts to be more
socially responsible (mean = 3.78 std deviation = 1.20) and that manufacturing firms are able
to meet customer expectations (mean = 3.61 std deviation =1.28). The findings concur with
the research by Fox (2007) that environmentally sensitive companies are more attractive to
potential employees who seek to become part of a positive corporate culture.
4.6 Green Risk Management
This section investigates the effect of green risk management on performance of
manufacturing firms in Nairobi. The study sought to determine the extent to which
respondents agreed with statements investigating the effect of green risk management
adoption on performance of manufacturing firms. Results are analysed in Table 4.5.
Table 4.5: Distribution of Green Risk Management
Statement
Str
ongly
Dis
agre
e
Dis
agre
e
Neu
tral
Agre
e
Str
ongly
Agre
e
Mea
n
Std
Dev
iati
on
The firm is able to survive in the green competitive
world
7.8% 7.8% 10.6% 36.7% 37.2% 3.88 1.22
Environmental issues are becoming an intrinsic part
of supply chain risk management 2.2% 0% 8.3% 60.6% 28.9%
4.14 0.75
Organizations are integrating their supply chains risk
management department to reduce operating costs 7.8% 10.0% 5.0% 36.7% 40.6%
3.92 1.25
Organizations are integrating their supply chains risk
management department to improve their customer
service.
2.2% 5% 8.9% 51.1% 32.8% 4.07 0.90
The primary driving force to green risk management
is an urge to meeting regulations
5.6% 6.1% 2.8% 45.6% 40% 4.08 1.08
The effectiveness of green purchasing depends on
whether the firm has centralized or decentralized
decision-making.
7.8% 2.8% 0.6% 43.3% 45.6% 4.16 1.12

44
The results in Table 4.5 show that, majority of the respondents agreed that effectiveness of
green purchasing depends on whether the manufacturing firm has centralized or decentralized
decision-making, (mean = 4.16 std deviation = 1.12), environmental issues are becoming an
intrinsic part of supply chain risk management (mean =4.14 std deviation =0.75), the primary
driving force to green risk management is an urge to meeting regulations (mean = 4.08 std
deviation = 1.08). The finding is in line with the research by Min and Galle (2007) that green
risk management provides framework for identifying, evaluating and mitigating the
challenges arising at the intersection of risk and sustainability.
The study also revealed that organizations are integrating their supply chains risk
management department to improve their customer service, (mean = 4.07 std deviation
=0.90) organizations are integrating their supply chains risk management department to
reduce operating costs (mean = 3.92 std deviation =1.25), the firm is able to survive in the
green competitive world (mean = 3.88 std deviation =1.22). The findings concur with the
research by Hock and Erasmus (2000) that green building green risk management in supply
chain design and operations directly mitigate risks and provide significant protection against
exposure for enterprises of all types
4.7 Performance of Manufacturing Firms
The study sought to establish the firm‟s performance in the following aspects of performance.
Results are analysed in Table 4.6.
Table 4.6: Distribution of Organizational Performance
Statement
Hig
hly
Dec
rease
d
Dec
rease
d
Not
chan
ged
Incr
ease
d
Ver
y
mu
ch
incr
ease
d
Mea
n
Std
Dev
iati
on
Customer satisfaction 0% 3.3% 6.7% 46.7% 43.3% 4.30 0.74
Profitability 0% 0% 3.3% 50.0% 46.7% 4.43 0.56
Market share 0% 0% 3.3% 60.0% 36.7% 4.33 0.54
Sales volume 3.3% 20% 5% 38.3% 3.3% 3.78 0.42
As shown in table 4.6, majority of the respondents agreed that most of the manufacturing the
firm‟s performance had realised great improvement on profitability (mean =4.43 std deviation
=0.56), customer satisfaction (mean = 4.30 std deviation =0.74), market share (Mean = 4.33

45
std deviation = 0.54) and sales volume (Mean = 3.78, std deviation = 0.42). The study also
found that inventory control and Security of stocks in most of the manufacturing companies
was up to standard. Companies ensure quality products are produced and distributed to the
customers there is flexibility in the ordering process supply chain decisions in the company
are always made in time, in case of a complaint from the customer, the appropriate actions
are taken in time, deliveries to customers are always made in time, accuracy of orders
delivered is highly maintained and that there is accurate and timely information dissemination
within the company and the customers. The findings concur with the research findings by
Ayodele (2011) that adoptions of GSCM practices are key to achieving positive performance
in profitability.
4.8 Test of Hypotheses
This section presents analysis and results of the tests of hypotheses using inferential statistics.
The section presents the results of statistical analyses and interpretations of the results in
relation to the research hypotheses.
4.8.1 Green Purchasing and Performance of Manufacturing Firms
The focus of hypothesis one was to determine the relationship between green purchasing and
performance of manufacturing firms in Nairobi. It was hypothesised that green purchasing
has a positive effect on the performance of manufacturing firms in Nairobi Kenya. This
hypothesis was tested using Pearson‟s Moment Correlation. To test the first hypothesis, the
index of performance of manufacturing firms in Nairobi as index of dependent variable was
correlated upon green purchasing as a composite of independent variable. The results were
shown in Table 4.7.
Table 4.7: Effect of green purchasing on Performance of manufacturing firms in
Nairobi
Variable Performance of
manufacturing firms
Green purchasing
Performance of
manufacturing
firms
Pearson Correlation 1 .598
Sig. (1-tailed) .046
N 180 180
Green purchasing
Pearson Correlation .598 1
Sig. (1-tailed) .046
N 180 180

46
Table 4.7 displays the results of correlation test analysis between the dependent variable
(performance of manufacturing firms in Nairobi) and the independent variable (green
purchasing). The study found a strong correlation coefficient between performance of
manufacturing firms in Nairobi and green purchasing as shown by correlation factor of 0.598.
This strong relationship was found to be statistically significant as the significant value was
0.046 which is less than 0.05 thus the null hypothesis one, which stated that there is no
relationship between green purchasing and performance of manufacturing firms in Nairobi, is
not accepted. The implication is that there exists a significant positive relationship between
green purchasing and performance of manufacturing firms in Nairobi. This reveals that any
positive change in green purchasing would enhance performance of manufacturing firms in
Nairobi. This corresponds with Colicchia et al, (2011) who indicated that initiatives to
minimize environmental impact in inbound supply chain, according to the “green
procurement” approach include eco-labeled product purchase, adoption of environmental
criteria into the supplier assessment system environmental and collaboration with suppliers.
4.8.2 Green Reverse Logistics and Performance of Manufacturing Firms
The aim of hypothesis two was to establish the relationship between green reverse logistics
and performance of manufacturing firms in Nairobi. To test the second hypothesis, the index
of Performance of manufacturing firms in Nairobi as index of dependent variable was
correlated upon green reverse logistics a composite of independent variable using Pearson‟s
Moment Correlation. The results were shown in Table 4.8.
Table 4.8: Effect of Green reverse logistics on Performance of manufacturing firms
Variable Performance of
manufacturing firms
Green reverse logistics
Performance of
manufacturing firms
Pearson Correlation 1 .843
Sig. (2-tailed) .016
N 180 180
Green reverse
logistics
Pearson Correlation .843 1
Sig. (2-tailed) .016
Table 4.8 displays the results of correlation test analysis between the dependent variable
(performance of manufacturing firms in Nairobi) and the independent variable (green reverse
logistics). The study found a strong positive correlation coefficient between Performance of

47
manufacturing firms in Nairobi and green reverse logistics as shown by correlation factor of
0.843. The P- value was 0.016 which is less than 0.05 and therefore the null hypothesis two
which stated that there is no relationship between green reverse logistics and performance of
manufacturing firms in Nairobi, is not accepted. The implication is that there exists a
significant positive relationship between green reverse logistics and performance of
manufacturing firms in Nairobi. This reveals that any positive change in green reverse
logistics practices would enhance performance of manufacturing firms in Nairobi. The
findings are in line with the research by Lembke (2012) that reverse logistics can be valuable
in increasing product lifecycles, supply chain complexity, maintainable practices and
consumer preferences; which have to be improved on to maintain productivity and growth.
4.8.3 Green Marketing and Performance of Manufacturing Firms
The main objective of hypothesis three was to establish the relationship between green
marketing and performance of manufacturing firms in Nairobi. To test the third hypothesis
Karl Pearson‟s Moment Correlation was used with performance of manufacturing firms in
Nairobi being the dependent variable while green marketing was the independent variable.
The findings are displayed in Table 4.9.
Table 4.9: Relationship between green marketing and performance of manufacturing
firms
Variable Performance of
manufacturing firms
Green marketing
Performance of
manufacturing firms
Pearson Correlation 1 .802
Sig. (1-tailed) 001
N 180 180
Green marketing Pearson Correlation .802 1
Sig. (1-tailed) .001
N 180 180
The results in Table 4.9 shows a positive correlation coefficient between Performance of
manufacturing firms in Nairobi and green marketing as shown by correlation factor of 0.802.
This relationship was found to be statistically significant as the probability value was 0.001
which is less than 0.05, thus we reject the null hypothesis three which stated that there is no
relationship between top green marketing and performance of manufacturing firms in
Nairobi. This implies that any positive change in green marketing practice would enhance

48
performance of manufacturing firms in Nairobi. The findings further concur with Iles (2006)
who indicated that green marketing can help companies reduce operating and production
costs, specifically by lowering energy usage. In addition, Fox (2007) observed that
environmentally sensitive companies are more attractive to potential employees who seek to
become part of a positive corporate culture.
4.8.4 Green Risk Management and Performance of Manufacturing Firms
The fourth objective sought to find out the effect of green risk management on performance
of manufacturing firms in Nairobi. It was then hypothesized that green risk management had
a positive significant effect on performance of manufacturing firms in Nairobi. The
hypothesis was tested using Pearson‟s moment correlation. This test was used to establish
whether there was a positive relationship between the independent variable (green risk
management) and the dependent variable (performance of manufacturing firms in Nairobi).
The results are shown in Table 4.10.
Table 4.10: Relationship between Green risk management and performance of
manufacturing firms in Nairobi
Variable
Performance of
manufacturing firms
green risk
management
Performance of
manufacturing firms
Pearson Correlation 1 .722
Sig. (2-tailed) .008
N 180 180
Green risk
management
Pearson Correlation .722 1
Sig. (2-tailed) .008
N 180 180
Table 4.10 shows that there was a positive correlation (0.722) between green risk
management and performance of manufacturing firms in Nairobi. The p-value was 0.008 and
thus, less than the alpha level of 0.05 hence establishing a positive significant relationship
between these variables. This implies that green risk management had a positive significant
effect on performance of manufacturing firms in Nairobi. Therefore, based on these findings,
the null hypothesis that there is no relationship between green risk management and
performance of the firm is therefore rejected. This depicts that any positive change in green
risk management practices would enhance performance of manufacturing firms in Nairobi.
The findings are consistent with Min and Galle (2007) findings that green risk management

49
provides framework for identifying, evaluating and mitigating the challenges arising at the
intersection of risk and sustainability. The findings also concur with the research by Hock
and Erasmus (2000) that green building green risk management in supply chain design and
operations directly mitigate risks and provide significant protection against exposure for
enterprises of all types.
4.9 GSCM Practices and Performance of Manufacturing Firms
In this study, a multiple regression analysis was conducted to test the influence among
predictor variables. The research used statistical package for social sciences (SPSS V 22.0) to
code, enter and compute the measurements of the multiple regressions. The model summary
is presented in the Table 4.11.
Table 4.11: Model Summary Model R R Square Adjusted R Square Std. Error of the Estimate
1 .818a .669 .652 .37290
The study used coefficient of determination to evaluate the model fit. The adjusted R2, also
called the coefficient of multiple determinations, is the percent of the variance in the
dependent explained uniquely or jointly by the independent variables. The model had an
average adjusted coefficient of determination (R2) of 0.652 and which implied that 65.2% of
the variations on performance of manufacturing firms in Nairobi are explained by the
independent variables understudy (green purchasing, reverse logistics, green marketing and
green risk management).
The study further tested the significance of the model by use of ANOVA technique. The
findings are tabulated in Table 4.12.
Table 4.12: ANOVA Results
Model Sum of Squares df Mean Square F Sig.
1
Regression 8.552 4 2.138 5.717 .000b
Residual 65.45 175 0.374
Total 74.002 179
From the ANOVA statics, the regression model was found to be valid (F = 5.717, P < 0.05).
This implies that the variables green purchasing, reverse logistics, green marketing and green
risk management are good predictors of performance of manufacturing firms in Nairobi.

50
In addition, the study used the coefficient table to determine the study model. The findings
are presented in theTable 4.13.
Table 4.13: Coefficients
Model Unstandardized
Coefficients
Standardized
Coefficients
t Sig.
B Std. Error Beta
1
(Constant) 0.176 0.067 2.627 .0121
Green purchasing 0.571 0.166 0.532 3.442 .0013
Green reverse logistics 0.817 0.238 0.767 3.431 .0014
Green marketing 0.782 0.301 0.694 2.590 .0132
Green risk management 0.674 0.202 0.613 3.337 .0018
As per the SPSS generated output as presented in table above, the equation becomes:
Y= 0.176+ 0.571X1+ 0.817X2 + 0.782X3+ 0.674X4
From the regression model obtained above, a unit change in green purchasing holding the
other factors constant would positively change performance of manufacturing firms in
Nairobi by a factor of 0.571; a unit change in reverse logistics while holding the other factors
constant would positively change performance of manufacturing firms in Nairobi by a factor
of 0.817, a unit change in green marketing while holding the other factors constant would
positively change performance of manufacturing firms in Nairobi by a factor of 0.782 while
a unit change in green risk management while holding the other factors constant would
positively change performance of manufacturing firms in Nairobi by a factor of 0.674.
The findings above conform to findings by March (2011), that green purchasing strategies are
directly related to performance of organisations. The findings also concur with the research
by Hock and Erasmus (2000) that green building green risk management in supply chain
design and operations directly mitigate risks and provide significant protection against
exposure for enterprises of all types. The findings concur with Franks and Curswoth (2003)
who found out that green risk management is positive relationship with performance of
organisations. The findings further agree with Ayodele (2011) that reverse logistics was key
to achieving positive performance in profitability.

51
CHAPTER FIVE
SUMMARY, CONCLUSIONS AND RECOMMENDATIONS
5.1 Introduction
This chapter presented the discussion of key data findings, conclusion drawn from the
findings highlighted and recommendation made there-to, the conclusions and
recommendations drawn were focused on addressing the objectives of the study. Finally, the
chapter discusses implications of the study to the management theory and directions for
further studies.
5.2 Summary of the Findings
In line with the first objective the study investigated the relationship between green
purchasing and performance of manufacturing firms in Nairobi Kenya. Prediction results
obtained from the regression showed that a unit change in green purchasing holding the other
factors constant would positively change performance of manufacturing firms in Nairobi.
The study also noted that green purchasing practice integrates suppliers in a participative
decision-making process green purchasing has resulted to improved organization‟s public
image green purchasing integrates suppliers in a participative decision-making process,
Promotion of environmental innovation is achieved through green purchasing, Green
purchasing improves a firm‟s economic positionthrough green purchasing, the firm is able to
minimize operational cost and that There is a reduction in the waste of resources The finding
is in line with the research by Pun (2006). These findings concur with that of Jumadi and
Zailani (2010) who depicts that a reduction in the product environmental impact may be
achieved not only through an appropriate product design, but also a proper use by consumers
The study also revealed that green purchasing has resulted to increased environmental
innovations green purchasing promotes recycling and reclamation of purchased materials this
is an iimportant way to promote the development of green procurement. These findings
correspond with those of Colicchia et al. (2011) who states that initiatives to minimize
environmental impact in inbound supply chain, according to the “green procurement”
approach include eco-labeled product purchase, adoption of environmental criteria into the
supplier assessment system environmental and collaboration with suppliers. The findings
further concur with the study findings by Bowen et al. (2011) who argued that Green Supply
Chain Management practices attempts to improve the environmental performance of
purchased inputs, or of the suppliers who provide them.

52
The second objective of the study was to determine the effect of Green reverse logistics
adoption on performance of manufacturing firms. Results obtained show that a unit change in
green reverse logistics while holding the other factors constant would positively change
performance of manufacturing firms in Nairobi , further the study revealed that that reverse
logistic adoption resulted to better organisation management of reverse flow, escalation of
more powerful customers, there is increased multichannel retailers, reverse logistic adoption
has promoted efficiency, accuracy and timeliness in reverse supply chains activities are a
priority, and that green reverse logistic adoption resulted to improved overall quality in
supply operations. The study also revealed that green reverse logistics allows a
manufacturing to receive products back from the consumer or send unsold merchandise back
to the manufacturer to be taken apart, sorted, reassembled or recycled; minimising overall
costs for an organisation. The findings are in line with the research by Lembke (2012) that
reverse logistics can be valuable in increasing product lifecycles, supply chain complexity,
maintainable practices and consumer preferences; which have to be improved on to maintain
productivity and growth.
The study also revealed that product lifecycle offers a valuable source of insight about the
changing needs, the reverse logistics channels used seem to have received minimal attention,
sorting and recycling are an important mechanism ccollection schemes should be classified
according to materials, there is more strategic focus on reverse logistics.The finding is in line
with the research by Helms (2012) reverse logistic Gains include; increasing speed of
production, reducing costs (transportation, administrative, and aftermarket maintenance,
repair and replacement), retaining customers by improving service goals and meeting
sustainability goals. Reverse logistics can include gaining feedback to make improvements
and to improve the understanding of real reasons for product returns. More value can be
extracted from used/returned goods instead of wasting manpower, time and costs of raw
materials involved in the original supply chain and that improved customer satisfaction and
loyalty by paying more attention to faulty goods, and repairs of merchandise.
The third objectives were to determine the effect of green marketing on performance of
manufacturing firms and the results show that unit change in green marketing while holding
the other factors constant would positively change performance of manufacturing firms in
Nairobi. Green marketing provides more information, the organization has a social
responsibility, green marketing supports green manufacturing since it is customer or demand

53
focused, green marketing has led to new relations across the supply chain, green marketing
practice builds new relations across the supply chain. The findings are in line with the
research by Iles (2006), that green marketing can help companies reduce operating and
production costs, specifically by lowering energy usage.
The study also revealed that through green marketing manufacturing firms have developed
new relations across the supply chain, manufacturing firms are able to meet customer
expectations for more environmentally conscious products, ggovernments should take
necessary steps and encourage the manufacture of green products, through green marketing
manufacturing firms are able to survive in the green competitive world, manufacturing firms
have developed their own positive efforts to be more socially responsible, and that
manufacturing firms are able to meet customer expectations, The findings concurs with the
research by Fox (2007) that Environmentally sensitive companies are more attractive to
potential employees who seek to become part of a positive corporate culture.
The fourth objective of the study was to determine the effect of Green risk management on
performance of manufacturing firms. The regression results revealed a unit change in green
risk management while holding the other factors constant would positively change
performance of manufacturing firms in Nairobi. Further the study noted that effectiveness of
green purchasing depends on whether the manufacturing firm has centralized or decentralized
decision-making, environmental issues are becoming an intrinsic part of supply chain risk
management, the primary driving force to green risk management is an urge to meeting
regulations. The finding is in line with the research by Min and Galle (2007) that green risk
management provides framework for identifying, evaluating and mitigating the challenges
arising at the intersection of risk and sustainability.
The study also revealed that organizations are integrating their supply chains risk
management department to improve their customer service, organizations are integrating their
supply chains risk management department to reduce operating costs, the firm is able to
survive in the green competitive world. The findings concurs with the research by Hock and
Erasmus (2000) that green building green risk management in supply chain design and
operations directly mitigate risks and provide significant protection against exposure for
enterprises of all types

54
The fifth objective of the study was to determine the combined effect of green purchasing,
green reverse logistics, green marketing, and green risk management on the performance of
manufacturing firms in Nairobi. The regression analysis established that the combination of
the objectives had a positive effect on the performance of manufacturing firms. Most of the
manufacturing the firm‟s performance had realised great improvement on profitability,
customer satisfaction, market share and sales volume. Companies ensure quality products are
produced and distributed to the customers there is flexibility in the ordering process supply
chain decisions in the company are always made in time, in case of a complaint from the
customer, the appropriate actions are taken in time, deliveries to customers are always made
in time, accuracy of orders delivered is highly maintained and that there is accurate and
timely information dissemination within the company and the customers.
5.3 Conclusions
The study concludes that green procurement affects supply chain performance to a great
extent. Green procurement affects the supply chain performance by ensuring production with
low environmental impacts, products which are using environmental friendly processes,
environmental collaboration with the suppliers, eco-labelled products and adoption of
environmental criteria into the supplier assessment systems.
The study also concludes that implementation of green reverse logistics promoted the
performance of manufacturing firms in Nairobi Kenya. Among the benefits realised include
reduced administrative, transportation and aftermarket support costs, increased velocity,
increased service market share, higher achievement of sustainability goals, greater customer
service, higher retention levels and recovery of capital investments in assets.
The study further concludes that green marketing supports performance of manufacturing
firms since it is customer or demand focused as opposed to product oriented manufacturing
strategy. Through green marketing initiatives firms are able to develop their own positive
efforts to be more socially responsible and to meet customer expectations for more
environmentally conscious products. Without green marketing initiatives, manufacturers of
products that have negative impact on the health of the consumers.
The study concludes that the green risk management practice enables firms to build new
relations across the supply chain and that the primary driving force to green risk management
is an urge to meeting regulations and that green risk management provides framework for

55
identifying, evaluating and mitigating the challenges arising at the intersection of risk and
sustainability.
5.4 Recommendations of the Study
This study was based on the determination the effect of green purchasing, green reverse
logistics, green marketing and green risk management. The findings of this study which were
conducted in manufacturing firms in Nairobi County have implications for strategic
management theory and management policy and practice as explained below.
5.4.1 Recommendations for Policy and Practice
It is recommended that continuous studies on the GSCM practices on the performance of
manufacturing firms should be carried out. This is necessitated by today‟s business
environment that requires organizations to meet the requirements of various standards which
provide quality environmental observance systems that are of real benefit to them to help
manage their business effectively and put in place best practice methodology. Knowledge on
this topic is important in that in today‟s volatile environment, with the rate of change
accelerating, organizations that successfully implement such practices save more money and
are poised to gain an advantage over their competitors through continuous research.
Managers must embrace GSCM practices because they are designed to help organizations
analyze and improve each element in their operations, from the selection of suppliers through
to sales and distribution. The standard will also come in handy in that it helps organizations
to improve customer satisfaction levels, internal efficiency and employee involvement.
In the light of this research it is recommended that manufacturing firms need to strive to
implement GSCM practices so as to improve on their performance. Reducing the emissions
of exhaust and sewage and so on, not only is the premise of ensuring the implementation of
green procurement system, but also is the important way to promote the development of
green procurement. With this in place organizations can competitively participate in the
market place.
Manufacturing firm leaders need embrace GSCM practices fully because for effective
environmental purchasing there needs to be design specifications for suppliers that include
environmental requirements for purchased items, cooperation with suppliers that include

56
environmental objectives, environmental audit for suppliers‟ internal management and
suppliers ISO:14001 certification.
The government needs to ensure that there is continuing coordination between the different
administrative levels to implement the green supply chain, in order to achieving the highest
level of quality in this area, trying to find the friendliest for environmental raw materials
which its used in the manufacturing industry. It should also ensure that there is continues
safety environmental design and packaging, create an annual training plan according to the
workers training needs related to the green supply chain, increased the budget allocated for
scientific research in the field of green supply chain, and finally activated the governmental
rules and regulations to be more careful about the safety of the environment.
5.4.2 Recommendations for Further Studies
The study sought to establish the effect of GSCM practices on the performance of
manufacturing firms in Nairobi Kenya. A study should be conducted on the challenges in
using green supply chain management practices at manufacturing firms. Further studies
should be conducted on the effect of green supply chain management practices on
performance of manufacturing companies in other counties to allow for generalization of
results. Another study should be conducted on effect of green supply chain management
practices in the service sector such as in banks and insurance companies for comparison
purposes.

57
REFERENCES
Amemba, C. S. (2013). Green Supply Chain Best Practices in Hospitality Industry in Kenya.
Global Journal of Commerce and Management Perspective, 2(3),7-18.
Andebe, E. O. (2013). Green supply chain management practices of the textile industry in
Kenya. Unpublished MBA project, University of Nairobi.
Arrow, K. J. (1962). The Economic Implications of Learning by Doing. Review of Economic
Studies, 29(6), 155-73.
Bowen, F. E., Cousins, P. D., Lamming, R. C & Faruk, A. C. (2001). The role of supply
management capabilities in green supply, Production and Operations Management,
10, 2, 174-189.
Burgess, K., Singh, J. & Koroglu, R., (2006). Supply chain management: a structured
literature review and implications for future research. International Journal of
perations & Production Management, 26(7),703-729.
Burt, D. N., Dobler, D. W. & Starling, S. L. (2003). World Class Supply Management: The
Key to Supply Chain Management, 7th
Edition, McGraw-Hill Irwin, New York.
Cagno, E., Guido, M. J. L., Perotti, S & Zorzini, M. (2011). The impact of green supply chain
practices on company performance: the case of 3PLs, Lancaster University
Management School Working Paper, pp 1-31.
Carter, C. R. & Ellram, L. M. (1998). Reverse Logistics: A review of the literature
andframework for future investigation, Journal of Business Logistics, 19(1),85-102.
Cavinato, J. L. (1992). A total cost/value model for supply chain competitiveness, Journal of
Business Logistics, 13, 2, 285-301.
Chege, T. (2012). The effect of environmental impact consideration on Procurement
Decisions of Kenya Electricity Generating Company. International Journal of Social
Sciences and Entrepreneurship, 1 (12) 317-339.
Chouinard, M., D., Amours, S. & Ait-Kadi, D. (2005). Integration of reverse logistics
activities within a supply chain information system. Computers in Industry, 56, 105–
124.
Cooper, R. K. (1997). Applying emotional intelligence in the workplace. Training and
Development Journal 51, 31-3

58
Da Silveira, G. J. C. & Arkader, R. (2007). The direct and mediated relationships between
supply chain coordination investments and delivery performance. International
Journal of Operations & Production Management, 27(2),140-158.
Daugherty, P., Matthew B. M. & Richey, R. G. (2002). Information Support for Reverse
Logistics: The influence of Relationship Commitment. Journal of Business Logistics,
23, 85-106.
Dekker, R., Fleischmann, M., Inderfurth, K. & Van Wassenhove, L. N. (2004). Reverse
Logistics: Quantitative Models for Closed-Loop Supply Chains. Berlin: Springer.
DiMaggio, P. J. & Powell, W. W. (2011). The Iron Cage Revisited: InstitutionalIsomorphism
and Collective Rationality in Organizational Fields, American Sociological Review
48(2): 147-60.
Donaldson, T. & Preston, L. E. (2003). The Stakeholder Theory of the Corporation:
Concepts, Evidence, and Implications. Academy of Management Review 20(l): 65-91.
Drumwright, M. (1994). Socially Responsible Organisational Buying: Environmental
Concern as a Noneconomic Buying Criterion, Journal of Marketing 58.8: 1-19.
Fleischmann, M., Beullens, P., Bloemhof-Ruwaard, J. M. & Van Wassenhove, L. N. (2001).
The impact of product recovery on logistics network design. Production &
Operations Management, 2(3),7-18.
Friedman, A. L. & Miles, S. (2002). Developing Stakeholder Theory. Journal of
Management Studies, 39(1), 1-21.
Gosain, S., Malhotra, A. & El Sawy, O. A., (2004). Coordinating for flexibility in eBusiness
supply chains, Journal of Management Information Systems, 21(3), 7-45.
Government of Kenya (2007). The Kenya Vision 2030. Nairobi: Government Printer.
Green, K., Morton, B & New, S. (2006). Purchasing and environmental management:
interactions, policies and opportunities. Business Strategy and the Environment, 5(3),
188-197
Gunasekaran, A., Lai, K. H. & Cheng, T. C. E. (2008). Responsive supply chain: a
competitive strategy in the networked economy, Omega, 36 (4), 549-564.
Hall, J. (2003). Environmental supply chain innovation, Greening of the Supply Chain,
Greenleaf.

59
Hamner, R., Oremus, M., Constantine, R. & Baker, C.S. (2012). Estimating the abundance
and effective population size of Maui’s dolphins using microsatellite genotypes:
2010–11. Report to Auckland Conservancy, Department of Conservation.
Handfield, R., Sroufe, R. & Walton, S. (2005). Integrating environmental management and
supply chain strategies business strategy and environment. Journal of Business
Logistics, 14(1),1 -19.
Handfield, R. B. & Nichols, E. L. (2009). Supply chain redesign: transforming supply chains
into integrated value systems. Upper Saddle River, NJ: Financial Times Prentice Hall.
Helms, J. E., Lewis, R., Mobilio, L., Perry, D. & Raman, N. (2002). Viral marketing or
electronic word-of-mouth advertising: Examining consumer responses and
motivations to pass along email. Journal of Advertising Research, 44(2), 333–348.
Hokey, M. & William, G. (2011). Green purchasing practices of US firms International,
Journal of Operations & Production Management, 21(9), :1222-1238.
Jansen, B. J., Booth, D., & Spink, A. (2009). Determining the informational, navigational,
and transactional intent of Web queries. Information Processing & Management
Journal, 44(3), 1251–1266.
K‟obonyo, P. (1999). Complying with Business Regulation in Kenya. University ofNairobi:
Institute for Development Studies Occasional Paper No. 64.
KIM. (2000). Fundamental of Management Research Methods. Nairobi: Moran (E.A)
Publishers Limited
Knudsen, H. K. (2003). Absorptive capacity and organizational innovation: Results from the
National Treatment Center Study. Presentation at the annual meeting of the Southern
Sociological Society. New Orleans, LA, March 28.
Korir, T. (2014). International Tourism in Kenya: Development, Problems and Challenges.
Eastern Africa Social Science Research Review, 16 (2): 49-70.
Kothari C. R. (2008). Research Methodology. Methods and Techniques (2nd ed.). NewDelhi:
New Age International.
Koufteros, X., Cheng, T. C. E. & Lai, K. H. (2007). Black-box and gray box supplier
integration in product development; antecedents, consequences and the moderating
role of firm size, Journal of Operations Management, 25 (4), 847-870.
Koufteros, X., Vonderembse, M. & Jayaram, J., (2005). Internal and external integration for
product development: Journal of Operations Management, 25 (4), 847-870.

60
Kruger, D. J. (2003). Integrating quantitative and qualitative methods in community
Research, The Community Psychologist, 36,18-19.
Lai, K. H., Wong, C. W. Y. & Cheng, T. C. E. (2010). Bundling digitized logistics ctivities
and its performance implications, Journal Industrial Marketing Managment, 39 (2),
273-286.
Lai, K. H.. & Cheng, T. C. E. (2009). Just-in-Time Logistics, Gower Publishing, Farnham,
England.
Lamming, R & Hampson, J. (2006). The environment as a supply chain managementissue,
British Journal Management, 7(2), 45-62.
Large, O. & Thomsen, G., (2011). Drivers of green supply management performance:
Evidence from Germany, Journal of Purchasing & Supply Management, Vol. 17,
No.3, pp. 176- 184.
Legner, C. & Schemm, J. (2008). Toward the inter-organizational product information upply
chain –evidence from the retail and consumer goods industries. Journal of the
Association for Information Systems, 9(3/4), 119-150.
Lembke, B., Hu, M. & Cheng, J. (2012). Opinion observer: Analyzing and comparing
opinions on the Web. In A. Ellis & T. Hagino (Chairs), Proceedings of the 14th
International Conference on World Wide Web (WWW ‟05)( 342–351). NewYork:
ACM Press
Malone, T. W. & Crowston, K. (1994). The interdisciplinary study of coordination. ACM
Computing Surveys,26(1),87-120.
Mentzer, J. T. (2001). Managing Channel Relations in the 21st Century, Journal of Business
Logistics, Vol. 14, No. 1, 27-42.
Meyer, J. W. & Rowan, B. (2007). Institutionalized organizations: Formal structure as myth
and ceremony. American Journal of Sociology, 83, 340–363.
Min, H. & Galle, P. W. (2006). Green Purchasing Strategies :Trends and Implications,
International Journal of Purchasing and Materials Management, 33(2),11-17.
Mollenkopf, D. A. & Closs, D. J. (2005). The hidden value in reverse logistics. Supply Chain
Management Review, 9, 34–43.
Morton, J., Meehan, K. & Richards, A. (2012). Corporate social responsibility: the 3C-SR
model, International Journal of Social Economics, 33 (5/6), 386-98.

61
Mota, J. & de Castro, L. M. (2004). A capabilities perspective on the evolution of firm
boundaries: acomparative case example from the Portuguese moulds industry. Journal
of Management Studies,41(2),295-316
Mugenda, O. M. & Mugenda A. G. (1999). Research methods and quantitative and
qualitative approaches. Nairobi: African Center for Technology studies
(ACTS) press.
Obong‟o S. O. (2009). Implementation of Performance Contracting in Kenya.International
Public Management Review, 10(2), 19-45.
Octavio, B. T. (2007). An investigation of green supply chain management in the
construction industry in the UK. School of Environmental Sciences University of East
Anglia.
Oncu, H. (1994). Egitimdeoclmevedegerlendirme (Measurement and evaluation in
education). Ankara: MatserBasim
Orodho, A. J. & Kombo D. K. (2002). Research Methods. Nairobi: Kenyatta University,
Institute of Open Learning.
Ottaman, J. A. (1993). Green Marketing: Challenges and Opportunities. NTC: Lincolnwood.
Phillips, R. & Freeman, R. E. (2003). Stakeholder Theory and Organizational Ethics:Berrett-
Koehler Publishers.
Poist, R. F. (2000). Development and implementation of reverse logistics programs.
Transportation Journal, 39, 54
Preuss, L. L. (2012). Green light for greener supply, Business Ethics: A European Review, 11
(4), 308-17.
Qu X. D., Tang, T., Xie, Z. C. Ye, L. Li D. F. & Cai, Q. H. (2007). Distribution of the macro-
invertebrate communities in the Xiangxi River system and relationships with
environmental factors. Journal of Freshwater Ecology, 20(2): 233-238.
Rao, P & Holt, D. (2005). Do green supply chains lead to competitiveness and economic
performance? Journal of Operations & Production Management. 25, 9 898 –916.
Robert, K. (2008). Rede ning innovation: Eco-innovation research and the contribution from
ecological economic. Ecological Economics, 32, 319 332.
Robson, C. (2002). Real World Research. Blackwell, 2nd
edition
Scott, W. R. (2001). Institutions and Organizations. Thousand Oaks, CA: Sage.

62
Simchi-Levi, D., Kaminsky, P. & Simchi-Levi, E. (2009). Designing and managing the
supply chain: concepts, strategies, and case studies. 3rd ed. Mc Graw Hill, New
York. 498 p.
Singh, N., Lai, K. H. & Cheng, T. C. E., (2007). Intra-organizational perspective on IT-
enabled supply chains, Journal on Communications of the ACM, 50 (1), 59-65
Srivastava, S. K. & Srivastava, R. K. (2005). Profit driven reverse logistics. International
Journal of Business Research, 4, 53–61.
Stevels, M. (2002). An integrated logistics operational model for green supply chain
management. Transportation Research, 41 (4), 287-313.
Stock, J. R. (1998). Development and Implementation of Reverse Logistics
Programs.Council of Logistics Management Journal, 4(1),295-316.
Stonebraker, P. W. & Liao, J. (2006). Supply chain integration: exploring product and
environmental contingencies, Supply Chain Management: An International Journal,
11(1), 34-43.
Tan, K. C., & Kannan, J. D. (2005). A study of operations management constructs andtheir
relationships. International Journal of Operations & Production Management,
23(12), 1300-1325.
Theyel, G. (2011). Management practices for environmental innovation andperformance.
International Journal of Operations & Production Management, 20(2), 249-266.
Thierry, M., Salomon, M., Nunnen, J. & Wassenhove, L. (1995). Strategic issues inProduct
Recovery Management. California Management review, 37(2), 114-135.
Tibben-Lembke, R. S. (2002). Life after death: reverse logistics and the product life cycle.
International Journal of Physical Distribution & Logistics Management, 32, 223–
244.
United Nations Development Programme – UNDP (2008). Country Programme Action Plan
of the Government of Kenya 2006 Annual Work Plan
Wadhwa, S., & Madaan, J. (2004). Role of Quality Management Self-Assessment Model to
Promote Reverse LogisticsOperations. Bangkok: International Conventions on
Quality Control Circles, 9, 34–43.
Welling, B. & Chavan, A. S. (2010). Analyzing the Feasibility of Green Marketing in SME`s,
Asia-Pacific Journal of Research in Business Management, 1, (2).

63
Wong, C. W. Y., Lai, K. H. & Cheng, T. C. E. (2009). Complementarities andalignment of
information systems management and supply chain management, International
Journal of Shipping and Transport Logistics, 1 (2), 156-171.
Yeung, A. C. L, Lai, K. H. & Yee, R. W. Y. (2007). Organizational learning, nnovativeness
and organizational performance: a qualitative study, International Journal of
Production Research, 45 (11), 2459-2477.
Zhu, Q. & Sarkis, J. (2011). An inter-sectorial comparison of green supply chain management
in China: drivers and practices. Journal of Cleaner Production, 14(5), 472-86.
Zhu, Q., Sarkis, J., & Geng, Y. (2009). Green supply chain management in China:pressures,
practices and performance, International Journal of Operations and Production
Management, 25, pp 449–468.
Zsidisin, G. A. and Hendrick, T. E. (1998). Purchasing`s involvement in environmental
issues: a multi-country perspective. Industrial Management & Data Systems, 7, 313-
320

64
APPENDICES
Appendix I : Questionnaire
Introduction
I am an MBA (Strategic Management) student at Egerton University. The purpose of this
questionnaire is to gather the information on the Effect of Green Supply Chain Management
on Manufacturing Firms in Nairobi County.The information provided for this research will be
purely for academic purposes and will be treated with utmost confidentiality. The reaserch
will be carried out from March 2014 to March 2015.
Part A: Background Information
1. Name of the organization...................................................................................
2. Sector ...................................................................................
3. Designation ...................................................................................
4. Age (Yrs.)
46 and Above 36-45
26-35 Below 25
5. Level of education
Postgraduate Undergraduate
Diploma Certificate
Any other, specify...........................................................................................
6. Number of years in service (specifically in manufacturing firms)
Over 20 10-19
1-9 Below 1
7. Gender
Male Female
Part B: Green Purchasing
1. Please indicate the extent to which you agree that each of the statements describes your
Firm by ticking (√) in the appropriate box from 1-5 where, 1=Strongly disagree, 2= Disagree,
3= Neutral, 4= Agree and 5= Strongly agree

65
1 2 3 4 5
i There is a reduction in the waste of resources
ii The firm is able to minimize cost
iii There is increased percentage of environmental innovations
iv This practice promotes recycling and reclamation of purchased
materials
v The practice integrates suppliers in a participative decision-
making process
vi The practice integrates suppliers in a participative decision-
making process
vii Promotion of environmental innovation is achieved
viii This is an iimportant way to promote the development of green
procurement
ix Green purchasing can improve a firm‟s economic position
x There is improved organizational public image
Part C: Green Reverse Logistics
1. Please indicate the extent to which you agree that each of the statements describes your
Firm by ticking (√) in the appropriate box from 1-5 where, 1=Strongly disagree, 2= Disagree,
3= Neutral, 4= Agree and 5= Strongly agree
1 2 3 4 5
i There is improved overall quality
ii The organization has management of green reverse flow
iii Product lifecycle offers a valuable source of insight about the
changing needs
iv There are more powerful customers
v There is increased multichannel retailers
vi The reverse logistics channels used seem to have received
minimal attention
vii Efficiency, accuracy and timeliness in reverse supply chains
activities are a priority

66
viii There is more strategic focus on reverse logistics
ix Sorting and Recycling are an important mechanism
x Collection schemes should be classified according to materials
Part D: Green Marketing
4. Please indicate the extent to which you agree that each of the statements describes your
Firm by ticking (√) in the appropriate box from 1-5 where, 1=Strongly disagree, 2= Disagree,
3= Neutral, 4= Agree and 5= Strongly agree
1 2 3 4 5
i The organization has a social responsibility
ii The firm is able to meet customer expectations
iii The practice provides more information externally
iv The practice builds new relations across the supply chain
v The firm is able to survive in the green competitive world
vi Green marketing supports green manufacturing since it is
customer or demand focused
vii Firms are able to develop their own positive efforts to be more
socially responsible
viii The firm is able to meet customer expectations for more
environmentally conscious products
ix This practice has led to new relations across the supply chain
x Governments should take necessary steps and encourage the
manufacture of green products.
Part E: Green Risk Management
1. Please indicate the extent to which you agree that each of the statements describes your
Firm by ticking (√) in the appropriate box from 1-5 where, 1= Strongly disagree, 2=
Disagree, 3= Neutral, 4= Agree and 5= Strongly agree
1 2 3 4 5
i The organization has a social responsibility
ii The firm is able to meet customer expectations

67
iii The practice provides more information externally
iv The practice builds new relations across the supply chain
v The firm is able to survive in the green competitive world
vi Environmental issues are becoming an intrinsic part of supply
chain risk management
vii Organizations are integrating their supply chains risk
management department to reduce operating costs
viii Organizations are integrating their supply chains risk
management department to improve their customer service.
Ix The primary driving force to green risk management is an urge
to meeting regulations
x The effectiveness of green purchasing depends on whether the
firm has centralized or decentralized decision-making,
Part F: Organizational Performance
Please indicate how each of the following aspects of performance have changed in your
organization by ticking (√) in the appropriate box from 1-5 where, 1= Very much decreased,
2= Decreased, 3= Not changed, 4= Increased 5= Very much increased
1 2 3 4 5
i Customer satisfaction
ii Profitability
iii Market share
Iv Sales volume
Thank you for your participation.

68
Appendix II: Manufacturing Companies in Nairobi County
Energy Sector
1. East Africa Cables 2. Kenwest Cables Ltd 3. Virtual City Ltd
4. Miesec Ltd 5. International Energy
Technik Ltd
6. Tea Vac Machinery
Ltd
7. Mecer East Africa Ltd 8. Holman Brothers
(E.A) Ltd
9. Specialized Power
10. Systems Ltd
11. Metlex Industries Ltd 12. IberaAfrica Power (E.
A) Ltd
13. Synergy-pro
14. Marshall Fowler
15. (Engineers) Ltd
16. Frigorex East Africa
Ltd
17. Sollatec Electronics
Ltd
18. Manufacurers and
19. suppliers Ltd
20. Eveready East Africa
Ltd
21. Socabelec E. A
22. Digitech East Africa
Ltd
23. Power Engineering
24. International Ltd
25. Sanyo Armo K Ltd
26. Centurion Systems
Ltd
27. Pentagon Agencies 28. Reliable Electricals
29. Engineers Ltd
30. Assabloy E.A Ltd 31. PCTL Automation
Ltd
32. Power Technics Ltd
33. A.I Records Kenya
Ltd
34. Optimum Lubricants 35. Libya Oil Kenya Ltd
36. Amedo Centre Kenya
Ltd
37. nationwide Electricals
38. Industries Ltd
39. Kenya Shell Ltd
40. Aucma Digital
Technology Ltd
41. Mustek East Africa 42. Kenya Scale Co. Ltd
43. Avery (EA) Ltd 44. Modulec Engineering
Systems Ltd
45. Kenya Power
46. Baumann Engineering
Ltd
47. Kenwestal Works Ltd 48. Assabloy East Africa
ltd
Chemical Sector
1. Anffi Kenya Ltd 2. Maroo Polymers ltd 3. Imaging solutions ltd
4. Basco Products Ltd 5. Match masters ltd 6. Interconsumer
products
7. Bayer E.A Ltd 8. United chemicals
Industries ltd
9. Odex chemicals
10. Continental Products
Ltd
11. Oasis Ltd 12. Osho Chemicals
13. industries ltd
14. Cooper Brands Ltd 15. Romorth E.A ltd 16. Polychem E.A ltd
17. Cooper Kenya Ltd 18. Sadolin Paints E.A
ltd
19. Procter and gamble E.
A
20. Beiersdorf E.A Ltd 21. Sara Lee Kenya ltd 22. PZ Cussons ltd
23. Blue ring products ltd 24. Saroc ltd 25. Rayal trading co.ltd
26. BOC Kenya ltd 27. Superform ltd 28. Reckitt Benckiser E.
A
29. Buyline industries ltd 30. Henkel Kenya Ltd 31. Reolutions stores co.
ltd

69
32. Carbacid (CO2) Ltd 33. Crown berger Kenya
ltd
34. Strategic Industries
Ltd
35. Chemicals and
solvent E. A
36. Crown gases ltd 37. SupaBrite Ltd
38. Coates and brothers
E. A
39. Decase chemicals ltd 40. Unilever Kenya Ltd
41. Magadi soda co.ltd 42. Deluxe inks ltd 43. Murphy chemicals E.
A
44. Coils product K Ltd 45. E.A heavy chemicals
ltd
46. Syngenta E.A Ltd
47. Colgate Palmolive E.
A
48. Elex products ltd 49. Synresins Ltd
50. Johnsons Diversy E.
A
51. European perfumes
and
52. cosmetics
53. Tri- Clover Industries
K
54. Ltd
55. Keel chemicals ltd 56. Galaxy paints and
coatings ltd
57. Twiga chemicals
industries ltd
58. Kemia international
ltd
59. Grand paints 60. Vita form products
Ltd
61. Kennat Ink
&chemicals ltd
62. Desbro Kenya Ltd 63. Soilex chemicals Ltd
Food and Beverage Sector
1. Africa spirits ltd 2. Annum trading
company
3. Premier Flour mills ltd
4. Agriners Agricultural
Devt Ltd
5. Aquamist Ltd 6. Premier foods
industries
7. ltd
8. Belfast Millers 9. Brookside Diary ltd 10. Proctor & Allan E. A
11. Bidco Oil refineries 12. Candy Kenya ltd 13. Promasidor Kenya ltd
14. Bio foods products
ltd
15. Capwell industries 16. Trufoods ltd
17. Breakfast cereal co.
ltd
18. Carlton products E.
A
19. UDV Kenya ltd
20. British American
tobacco
21. Chirag Kenya ltd 22. Unga group ltd
23. Broadways Bakery 24. E & A industries 25. Usafi services ltd
26. C. Czarnikow Sugar
E.A
27. Kakuzi ltd 28. Uzuri foods ltd
29. Cadbury Kenya ltd 30. Erdemann co. ltd 31. Value pak foods ltd
32. Centro Food
industries
33. Excel chemicals 34. W.E Tilly Muthaiga
ltd
35. Coca cola E.A Ltd 36. Kenya wine agencies
ltd
37. Kevian Kenya ltd
38. Confec industries Ltd 39. Highlands canners 40. Koba waters ltd
41. Corn products Kenya
ltd
42. Supa bakery ltd 43. Kwality candies &
sweets ltd
44. Crown foods ltd 45. Sunny processor ltd 46. Lari dairies alliance ltd

70
47. Cut tobacco ltd 48. Spin knit dairy ltd 49. London distillers
Kenya ltd
50. Deepa industries 51. Highlands mineral
water co. Ltd
52. Mafuko industries
53. Deepa industries
Monte
54. Kenya ltd
55. Home oil 56. Manji food industries
ltd
57. East Africa breweries
ltd
58. Insta products (EPZ)
Ltd
59. Melvin Marsha
international
60. East Africa food ltd 61. Jumbo biscuits K ltd 62. Kenya tea
development
63. Agency
64. Eastern produce
Kenya ltd
65. Jetlag foods ltd 66. Mini bakeries Nbi ltd
67. Farmers choice ltd 68. Mariana estates ltd 69. Martini Kenya ltd
70. Frigorex ltd 71. Kenafric industries
Ltd
72. Mount Kenya bottlers
73. Giloil co. ltd 74. Kenblest Ltd 75. Nairobi bottlers
76. Glacier products ltd 77. Kenya breweries ltd 78. NAS airport services
79. Global allied
industries ltd
80. Kenya nut co. ltd 81. Rafiki millers
82. Global beverages ltd 83. Kenya sweets ltd 84. Razco Ltd
85. Global fresh ltd 86. Nestle Kenya 87. Re- sun spices ltd
88. Gonas best ltd 89. Nicola farms ltd 90. Smash industries
91. Hail & cotton
distillers ltd
92. Palm house dairies 93. Softa bottling co. ltd
94. Al- mahra industries
ltd
95. Patco industries 96. Spice world ltd
97. Alliance one tobacco
ltd
98. Pearl industries 99. Nairobi flour mills
100. Alpha fine
foods ltd
101. Pembe Flour
mills ltd
102. Wrigley
company E. A
103. Alpine
coolers ltd
Plastic and Rubber
1. Betatrad K ltd 2. Prestige Packaging
ltd
3. Haco industries ltd
4. Blowpost Ltd 5. Prosel Ltd 6. Hi- plast ltd
7. Bobmil industries ltd 8. Qplast Industries 9. Jamlam industries ltd
10. Complast industries
ltd
11. Sumaria industries
ltd
12. Kamba manufacturing
Ltd
13. kentainers ltd 14. Treadsetters tyres ltd 15. Nairobi plastics
industries
16. King plastic
industries
17. Super manufacturers
ltd
18. Nav plastics
19. Kings way tyres &
Automart ltd
20. Uni-plastics ltd 21. Ombi rubber

71
22. L.G Harris & co. Ltd 23. Wonderpac industries
ltd
24. Packaging masters ltd
25. Laneeb plastics
industries
26. ltd
27. ACME containers ltd 28. Plastics electronics
29. Metro plastics ltd 30. Afro plastics Kenya
ltd
31. Raffia bags k ltd
32. Ombi rubber rollers
ltd
33. Alanker industries ltd 34. Rubber products ltd
35. Packaging industries
ltd
36. Dune packaging ltd 37. Safepak ltd
38. Plastic & rubber
industries
39. ltd
40. Elgitread Kenya ltd 41. Sameer Africa ltd
42. Polyblend ltd 43. Elgon Kenya ltd 44. Sanpac Africa ltd
45. Poly flex industries
ltd
46. Eslon plastics of
Kenya Ltd
47. Silpack industries ltd
48. Polythene industries
ltd
49. Five star industries
ltd
50. Solvochem E. A
51. Premier industries ltd 52. General plastics ltd 53. Springbox Kenya ltd
Building Sector
1. Central Glass
Industries Ltd
2. Kenbro Industries
Ltd
3. Manson Hart Kenya
Ltd
4. Karsanmurji& Co
Ltd
5. Kenya Builders &
Concrete Ltd
6. Mombasa Cement Ltd
Paper Sector
1. Ajit Clothing Factory
Ltd
2. Paper House of
Kenya Ltd
3. Green Printers Ltd
4. Associated Paper &
5. Stationery Ltd
6. Paper Bags Ltd 7. Graphics & Allied Ltd
8. Autolitho Ltd 9. Primex Printers Ltd 10. Guaca Stationers
11. Bag & Envelop
Converters
12. Print Exchange Ltd 13. Icon Printers
14. Bags & Balers
15. Manufacturers
16. Printpak Multi
Packaging Ltd
17. Interlabels Ltd
18. Brand Printers 19. Printwell Industries 20. Jomokenyatta
Foundation
21. Business Forms And
22. Systems Ltd
23. Prudential Printers 24. Karatasi Industries
25. Carton
Manufacturers
26. Punchline Ltd 27. Kenafic Diaries
Manufacturers
28. Cempack Ltd 29. Conventional
Franciscan Friers
Kolbe Press
30. Kitabu Industries
31. Chandaria Industries 32. Creative Print House 33. Kul Graphics Ltd

72
34. Colour Labels 35. D.L Patel Press K
Ltd
36. Modern Lithographic
Ltd
37. Colour Packaging
Ltd
38. Dodhia Packaging 39. Pan African Paper
Millers
40. Colour Print Ltd 41. EA Packaging
Industries Ltd
42. Ramco Printing Works
43. Kenya Stationers Ltd 44. Elite Offset Ltd 45. Regal Press Ltd
46. Kim Fay E. A 47. Ellams Products Ltd 48. Sig
Combiblocsobeikan
49. Kenya
50. Paper Converters K
Ltd
51. English Press Ltd 52. Label Converters
Textile Sector
1. Africa Apparels Epz 2. Kenya Trading Epz
Ltd
3. Spinners and Spinners
Ltd
4. Fulchandmanek&
Bros
5. Ltd
6. Kikoy Co Ltd 7. Storm Apparel
8. Manufacturers
9. Image Apparels 10. Le Stud Ltd 11. Straightlineentrprises
12. Alltex Epz Ltd 13. Metro Impex Ltd 14. Sunfalg Textile &
15. Knitwear Mills Ld
16. Alpha Knits Ltd 17. Midco Textiles E.A
Ltd
18. Tarpo Industries Ltd
19. Apex Apparels Epz 20. Mirage Fashion
Ware Epz
21. Teita Estates Ltd
22. Baraka Apparels Epz 23. Mrc Nairobi Epz 24. Thika Cloth Mills
25. Bhupco Textiles
Mills Ltd
26. Ngeecha Industries 27. United Aryan Epz
28. Blue Plus Ltd 29. Premier Knit Wear 30. Upanwasana Epz
31. Bogani Industries
Ltd
32. Protex Kenya Epz 33. Vaja Manufacturers Ltd
34. Brother Shirts
Factory Ltd
35. Riziki
Manufacturers Ltd
36. Yoohan Kenya Epz
37. Embellishments Ltd 38. Rolex Garments
Epz Ltd
39. Yu-Un Kenya Epz Ltd
40. Jar Kenya Epz 41. Silver Star
Manufacturers
Timber and Wood Products Sector
1. Economic Housing
Group
2. Ltd
3. Tran Paper Kenya
Ltd
4. Wood Makers Kenya
Ltd
5. Eldema Kenya Ltd 6. Twiga Stationers and
Printers Ltd
7. Woodtex Kenya Ltd
8. Fine Wood Works
Ltd
9. Uchumi Quick
Suppliers
10. United Bags
Manufacturers‟ Ltd
73
11. Furniture
International Ltd
12. Rosewood Office
Systems Ltd
13. Statpack Industries
14. Hwan Sung
Industries
15. Shah Timber Mart
Ltd
16. Taws Ltd
17. Kenya Wood Ltd 18. Slumber Land Kenya
Ltd
19. Tetrapak Ltd
20. Newline Ltd 21. Timsales Ltd 22. Shamco Industries Ltd
23. PG Bison Ltd
Metals and Allied Sector
1. Allied and Metal
Services
2. Ltd
3. Morris & Co Ltd 4. Khetshidharamshi& Co
5. Ltd
6. Alloy Street Castings
Ltd
7. Nail and Steel
Products
8. Nampak Kenya Ltd
9. Apex Street Ltd-
Rolling
10. Mill Division
11. Orbit Engineering
Ltd
12. Napro Industries Ltd
13. ASL Ltd 14. Rolmil Kenya Ltd 15. Specialized Engineers
EA Ltd
16. ASP Company Ltd 17. Sandvik Kenya Ltd 18. Steel Structures Ltd
19. E.A Foundary Works
Ltd
20. Sheffield Steel
Systems Ltd
21. Steel Makers Ltd
22. Elite Tools Ltd 23. Booth Extrusions Ltd 24. Steel Wool Africa Ltd
25. Friendship Container
26. Manufacturers
27. City Engineering
Works Ltd
28. Tononoka Steel Ltd
29. General Aluminum
30. Fabricators Ltd
31. Crystal Industries
Ltd
32. Welding Alloys Ltd
33. Gopitech Kenya Ltd 34. Davis &Shirtliff Ltd 35. Wire Products Ltd
36. Heavy Engineering
Ltd
37. Devki Steel Mills 38. Vikings Industries Ltd
39. Insteel Ltd 40. East Africa Spectre
Ltd
41. Warren Enterprises Ltd
42. Metal Crown Ltd 43. Kens Metals
Industries Ltd
Pharmaceutical and Medical Equipment
1. Alpha Medical
Manufacturers
2. Madivets Products
Ltd
3. KAM Industries
4. Beta Healthcare
5. International Ltd
6. Novelty
Manufacturing Ltd
7. KAM Pharmacy Ltd
8. Biodeal Laboratories
Ltd
9. Oss Chemie K 10. Pharmaceutical
11. Manufacturing Co
12. Bulks Medical
Equipment
13. Dawa Ltd 14. Regals Pharmaceutical
15. Cosmos Ltd 16. Elys Chemical
Industries
17. Universal Corporation
Ltd

74
18. Laboratory & Allied
Ltd
19. Gesto
Pharmaceuticals
20. Pham Access Africa
Ltd
21. Manhar Brothers K
Ltd
22. GlaxoSmithKline
Kenya Ltd
Leather Products and Footwear
1. Alpharama Ltd 2. C & P Shoe
Industries Ltd
3. East Africa Tanners K
Ltd
4. Bata Shoe Co. Ltd 5. CP Shoes 6. Leather Industries Of
7. Kenya Ltd
8. New Market Leather
9. Factory
10. Dogbobes Ltd
Motor Vehicle Assembly and Accessories
1. Auto Ancillary Ltd 2. General Motors‟ East
Africa
3. Megh Cushion
Industries
4. Varsanibrakeling Ltd 5. Impal Glass
Industries
6. Mutsimoto Motor Co.
Ltd
7. Bhachu Industries 8. Kenya Grange
Vehicle Industries
9. Pipe Manufacturers
Ltd
10. Chui Auto Springs
11. Industries Ltd
12. Kenya Vehicle
Manufactures Ltd
13. Sohansons Ltd
14. Toyota East Africa 15. Labh Singh Harman
Singh
16. Theevan Enterprises
Ltd
17. Unifilters 18. Mann Manufacturing 19.