effect of hardness, residual stress and grain size on the...
TRANSCRIPT

Effect of hardness, residual stress and grain size on the fatigue life of ultra-clean bainitically
hardened bearing steel
by
TOBIAS MEYER
Diploma work No. 87/2012 at Department of Materials and Manufacturing Technology
CHALMERS UNIVERSITY OF TECHNOLOGY Gothenburg, Sweden
Diploma work in the Master programme Advanced Engineering Materials Performed at: SKF Group Manufacturing Development Center SE-415 50 Gothenburg Supervisors: Walter Datchary Staffan Larsson SKF Group Manufacturing Development Center SE-415 50 Gothenburg Examiner: Johan Ahlström Department of Materials and Manufacturing Technology
Chalmers University of Technology SE-412 96 Gothenburg

Effect of hardness, residual stress and grain size on the fatigue life of ultra-clean bainitically hardened bearing steel TOBIAS MEYER © TOBIAS MEYER, 2012. Diploma work no 87/2012 Department of Materials and Manufacturing Technology Chalmers University of Technology SE-412 96 Gothenburg Sweden Telephone + 46 (0)31-772 1000 Chalmers Reproservice Gothenburg, Sweden 2012

i
Effect of hardness, residual stress and grain size on the fatigue life of ultra-clean bainitically hardened bearing steel TOBIAS MEYER Department of Materials and Manufacturing Technology Chalmers University of Technology
Abstract Ultra clean, high carbon, bainitically hardened steel grades are used in large sized bearings where demands on fatigue properties are very high. The circumstances under which these bearings operate can be extremely harsh but still the fatigue life of the bearing must be kept at the highest level possible. The most important means to reach a high fatigue life are the heat treatment of the bearings and the choice of bearing steel and its manufacturing route. Within the area of heat treatment, which has been studied in some detail in this work, there is potential of increasing bearing fatigue properties by means of careful modification of heat treatment parameters and its sequences. Selected bainite heat treatments were carried out on samples of an ultra-clean, high carbon steel used by SKF in the production of large bearings. Heat treatment parameters such as normalizing, soft annealing and hardening were combined and modified to find ways of improving the fatigue properties of the steel. The fundamental properties affecting fatigue life such as hardness, residual stress and grain size were measured, documented and used to model fatigue life in the framework of design of experiments (DoE). Efforts were also made to document the variation in fatigue properties over the cross section of the material. Results suggest that there are possibilities for improvement of the fatigue properties of the studied steel by adjusting heat treatment parameters. Increased hardness and smaller grain size anticipated to result in improved fatigue life can be achieved by relatively small heat treatment parameter modifications. This was also verified by a series of rotating bending fatigue testing. Furthermore, impact testing exemplified the importance of a careful choice of the steel and heat treatment manufacturing route. This fact was also supported by the carried out modeling of fatigue life. Keywords: ultra clean steel, high carbon steel, bearing, fatigue strength, rotating bending fatigue, impact toughness testing, heat treatment, design of experiments, bainite.

ii
iii
Effect of hardness, residual stress and grain size on the fatigue life of ultra-clean bainitically hardened bearing steel TOBIAS MEYER Department of Materials and Manufacturing Technology Chalmers University of Technology
Sammanfattning Ultrarena, högkolhaltiga, bainithärdade stål används i framställningen av stora rullager där kraven på utmattningshållfasthet är mycket höga. Omständigheterna under vilka dessa kullager verkar kan vara extremt hårda vilket innebär att utmattningshållfastheten hos lagren måste hållas på högsta möjliga nivå. Två av de viktigaste produktionsstegen för att åstadkomma hög utmattningshållfasthet är värmebehandling och val av lagerstål och produktionsprocesser. Inom värmebehandlingen, som har studerats i detta arbete, finns utvecklingspotential genom modifiering av de sekvenser och parametrar som utgör värmebehandlingen. Utvalda bainitvärmebehandlingar testades på ett ultrarent, högkolhaltigt stål som används av SKF vid produktion av stora rullager. Värmebehandlingsparametrar såsom normalisering, mjukglödgning och härdning kombinerades och modifierades på ett antal olika vis för att hitta sätt att förbättra utmattningsegenskaperna hos stålet. De fundamentala egenskaper hos stålet som påverkar utmattningshållfastheten såsom hårdhet, restspänningar och kornstorlek mättes, dokumenterades och användes för att modellera utmattningshållfasthet. Ansträngningar gjordes också för att dokumentera variationen i utmattningsegenskaper över provmaterialens tvärsnitt. Resultaten från värmebehandlingsexperimenten visar på att det finns utrymme för förbättring av utmattningshållfastheten genom modifiering av värmebehandlingsparametrarna. Ökad hårdhet och förfinad kornstorlek, vilket leder till förbättrade utmattningsegenskaper kan uppnås genom relativt små förändringar i de undersökta värmebehandlingsprocedurerna. Detta verifierades också genom en testserie roterande böjutmattning. Vidare visar resultaten från ett flertal slagprovserier på vikten av att välja rätt stål och värmebehandlingsprocedur. Nyckelord: ultrarent stål, rullager, utmattningshållfasthet, värmebehandling, bainit.

iv

v
Preface This report is the result of a master thesis carried out at SKF during the spring 2012. I would like to thank everyone at SKF who offered their help and support during the project, making it a great learning experience. I would also like to thank Johan Ahlström, my examiner at Chalmers, for always supporting my work and taking time to discuss and answer questions, both quickly and with great enthusiasm!

vi
vii
Contents Abstract .................................................................................................................................................... i Sammanfattning ...................................................................................................................................... iii Preface ...................................................................................................................................................... v Contents ................................................................................................................................................. vii Definitions ............................................................................................................................................... ix 1 Background and aim ......................................................................................................................... 1 2 Theory ............................................................................................................................................... 3
2.1 Bearing steel .............................................................................................................................. 3 2.2 Phase transformations ............................................................................................................... 3
2.2.1 The iron-carbon phase diagram .......................................................................................... 3 2.2.2 Kinetics of phase transformations ...................................................................................... 4
2.3 Heat treatment .......................................................................................................................... 5 2.3.1 Normalizing ......................................................................................................................... 5 2.3.2 Soft annealing ..................................................................................................................... 5 2.3.3 Bainite hardening ................................................................................................................ 6
2.4 Grain size .................................................................................................................................... 6 2.5 Mechanical property evaluation ................................................................................................ 7
2.5.1 Hardness measurement ...................................................................................................... 7 2.5.2 Residual stress measurement ............................................................................................. 7 2.5.3 Impact toughness testing ................................................................................................... 8 2.5.4 Fatigue and Rotating Bending Fatigue testing .................................................................... 8
3 Method ........................................................................................................................................... 11 3.1 Material .................................................................................................................................... 11 3.2 Design of Experiment ............................................................................................................... 11 3.3 Heat treatment ........................................................................................................................ 13
3.3.1 Normalizing ....................................................................................................................... 13 3.3.2 Soft annealing ................................................................................................................... 15 3.3.3 Hardening ......................................................................................................................... 16 3.3.4 Pearlitization treatment.................................................................................................... 18 3.3.5 Preparatory heat treatment for grain size measurements .............................................. 19 3.3.6 Heat treatment of the impact testing samples ................................................................ 20 3.3.7 Heat treatment of rotating bending fatigue samples ....................................................... 21
3.4 Residual stress measurements ................................................................................................ 21 3.4.1 Electrochemical etching .................................................................................................... 22 3.4.2 X-ray measurements ......................................................................................................... 22
3.5 Sample preparation ................................................................................................................. 22 3.6 Hardness measurements ......................................................................................................... 24 3.7 Grain size measurements ........................................................................................................ 25 3.8 Strength profiling ..................................................................................................................... 26 3.9 Minitab analysis ....................................................................................................................... 27

viii
3.10 Impact testing ........................................................................................................................ 27 3.11 Rotating bending fatigue testing ........................................................................................... 28
4 Results ........................................................................................................................................... 29 4.1 Discs ......................................................................................................................................... 29
4.1.1 Microstructure .................................................................................................................. 29 4.1.2 Surface hardness ............................................................................................................... 33 4.1.3 Microindentation hardness .............................................................................................. 34 4.1.4 Residual stress .................................................................................................................. 34 4.1.5 Grain size ........................................................................................................................... 36 4.1.6 Strength profile ................................................................................................................. 37 4.1.7 Minitab analysis ................................................................................................................ 38
4.2 Impact testing samples ............................................................................................................ 41 4.2.1 Impact testing ................................................................................................................... 41 4.2.2 Hardness ........................................................................................................................... 41 4.2.3 Microstructure .................................................................................................................. 43
4.3 Rotating bending fatigue testing ............................................................................................. 45 4.3.1 Rotating bending testing................................................................................................... 45 4.3.2 Examination of the RBF bars ............................................................................................. 46 4.3.3 Hardness and residual stress ............................................................................................ 46 4.3.4 Microindentation hardness testing .................................................................................. 46 4.3.5 Micrographs ...................................................................................................................... 47
5 Discussion ....................................................................................................................................... 49 5.1 Discs ......................................................................................................................................... 49
5.1.1 Grain size ........................................................................................................................... 49 5.1.2 Hardness ........................................................................................................................... 49 5.1.3 Residual stress and strength profile ................................................................................. 49 5.1.4 Other observations ........................................................................................................... 50
5.2 Impact testing samples ............................................................................................................ 50 5.2.1 Impact testing ................................................................................................................... 50 5.2.2 Hardness ........................................................................................................................... 50 5.2.3 Microstructure .................................................................................................................. 51
5.2 Rotating bending fatigue testing ............................................................................................. 51 6 Conclusions ..................................................................................................................................... 53 7 Recommendations .......................................................................................................................... 55 References ............................................................................................................................................. 57
ix
Definitions ASTM American Society for Testing and Materials Bs Bainite start temperature Bf Bainite finish temperature CCT Continuous Cooling Transformation Cp Carbon potential DoE Design of Experiment
Fe3C Cementite HRC Rockwell hardness (C-scale) Ms Martensite start temperature RBF Rotating bending fatigue TTT Time Temperature Transformation ISO International Organization for Standardization XRD X-ray diffraction γ Austenite

x

1
1 Background and aim Steels used in large bearings which operate under harsh conditions are subject to very high demands. The customers of SKF are expecting a bearing which can be trusted during the entire service life. A key factor when improving steel fatigue properties is the different heat treatments used. Great efforts are being made by SKF to develop heat treatments that will render improved material properties and products that can meet the high demands of the customers. In this project, several heat treatment procedures were investigated that could potentially increase the fatigue properties of an ultra-clean, high-carbon steel, currently used by SKF for large bearings in extremely demanding applications. The work in the project is divided into three parts and aims at improving the properties of the ultra-clean steel by means of optimizing heat treatment parameters used in production:
1. Heat treatment and examination of discs In this part of the project, heat treatments were designed and carried out based on existing process parameters during the following three heat treatment steps used in the manufacturing of bearings: normalizing, soft annealing and hardening. With two alternative process alternatives of each parameter, eight unique modified heat treatments as well as a reference treatment (emulating the current treatment) were carried out. The resulting material was then analyzed with the aim of finding ways of improving the current heat treatment used in production of bearings made out of the steel. Profiling of the strength was also carried out on selected samples using a theory developed by Ando et al. [8] that relates hardness, residual stress and grain size to the fatigue life of the steel.
2. Heat treatment for impact testing Impact testing is a fast testing method, and it could potentially become a good candidate for early material screening in future development projects. In the experiment, six different heat treatment procedures were executed on blunt notch samples which were then tested for impact toughness, hardness and microstructure.
3. Heat treatment for rotating bending fatigue testing The most promising heat treatment from the disc experiment (part 1) was used for preparing beams for rotating bending fatigue testing. The idea was to see if the sample with the best theoretical results also would produce good results in physical testing.

2

3
2 Theory This chapter gives a brief introduction of bearing steels and a theoretical background to applicable heat treatment procedures and describes the test methods that were used for evaluation of bearing steel properties.
2.1 Bearing steel Bearings are the machine components that allow relative movement between parts with a minimal amount of energy loss. There is a vast amount of applications in which bearings are used and there are several types of bearings for various purposes. The most commonly used material in bearing manufacturing is a low alloyed Carbon-Chromium steel with about 1.5 wt% Cr. It is a relatively affordable material, and from a manufacturing standpoint it is favorable as it is easy to cast, forge, heat treat to the desired mechanical properties and machine to the final shape. High carbon steel (in the range 0.8-1.1 wt% C) with a low total amount of substitutional solute, normally less than 5 wt%, is the type of steels dominating the market for bearings [1]. These types of steels are suitable for bearing manufacturing due to their hardenability (ability to form martensite). Bearings may have to serve in rough environments where loads, both static and cyclic, are high. Demands are therefore high on the steel from which bearings are manufactured, and careful consideration and selection of steel and manufacturing parameters is a key when choosing material for a specific application. Both the manufacturing of rolling elements (e.g. balls and rollers) and rings are exposed to high reduction rates in the hot forming operations (rolling, forging etc.). This is done because the deformation leads to a better structure suitable for the subsequent heat treatment as it closes porosities and breaks up the cast structure [1]. It also reduces the fatigue initiation sensitivity for certain inclusion types (mainly manganese sulphides).
2.2 Phase transformations
2.2.1 The iron-carbon phase diagram The iron-carbon diagram is a representation of the stable fields of the three iron allotropes (α-, γ- and δ-iron (alpha-Ferrite, Austenite and delta-Ferrite respectively)) at different carbon contents and temperatures; a constant pressure is generally assumed. Although it describes the thermodynamically stable states after infinitely slow cooling, it still is of great help for judging microstructure development during heat treatment. As can be seen in the diagram (Figure 2.1), there is a large difference in solid solubility of carbon in austenite and ferrite which is one of the reasons behind the versatile behavior of the ferrous alloys (steels and cast irons) during heat treatment and processing. This difference in solubility is easily understood if the different iron crystals are reviewed. Since carbon is occupying the interstitial vacancies in the crystal lattice, its solubility in the different iron phases is dependent on the size of the interstitial positions in the unit cell of the crystal. In the body centered cubic (BCC) unit cell (the unit cell of α-iron (ferrite)), there is less room for the interstitial carbon atom compared to the face centered cubic (FCC) unit cell (the unit cell of γ-iron (austenite)), which explains the lower solid solubility of carbon in ferrite compared to austenite. The material investigated in this project is a hypereutectoid steel, meaning that the chemical composition lies to the right of the eutectoid carbon content (ca 0.8 wt% C) in the Fe-C diagram. In practice, this can lead to, among other things, the development of pro-eutectoid microconstituents (cementite) during cooling from the austenite region down through the austenite + Fe3C region. Remaining cementite films in grain boundaries may lower fatigue life and must be eliminated in the heat treatment.

4
Figure 2.1. Fe-C diagram, for a constant pressure of 101325 Pa.
2.2.2 Kinetics of phase transformations To represent transformation kinetics of steels, time-temperature-transformation (TTT) diagrams are used. A TTT diagram, which is a plot of temperature versus time, shows what happens when an austenitized steel is held at constant temperature for a prolonged period of time. In the diagram, the times until start (usually 1%) and finish (usually 99%) of phase transformations are depicted. Each diagram is valid for one specific steel composition and grain size, controlled by the austenitisation temperature etc. It assumes a constant transformation temperature and rapid quenching to that temperature. In Figure 2.2, a bainitic transformation process is represented by the dashed line. The process starts with a rapid cooling to transformation temperature. The temperature is then held constant for the duration of bainitic transformation. After complete transformation, which is represented by the right c-shaped curve denoted Bf, the temperature is lowered to ambient.
Austenite + Ferrite
Ferrite
Ferrite + Fe3C
Acm
Austenite + Fe3C
Austenite

5
Figure 2.2. Schematic Isothermal transformation diagram (TTT-diagram). P=pearlite transformation region,
B=bainite transformation region, A=austenite region. Dashed lines represent: 1; quenching to bainite transformation temperature, 2; holding at bainite transformation temperature until 99 % transformation
(right C-shaped curve), 3; cooling to ambient temperature.
2.3 Heat treatment Different classes of microstructures are achievable by means of heat treatment. Depending on the steel composition (amount of carbon and other alloying elements) heat treatments can be designed in an almost infinite number of ways depending on what results the manufacturer is aiming for in terms of microstructure and material properties. Some of the most crucial heat treatments related to this project are discussed in this subchapter.
2.3.1 Normalizing Normalizing is generally done to steels after hot forming as a grain refining operation. In the first step, the austenitization, the steel is brought into the austenitic region of the Fe-C diagram by heating at least 55°C above the upper critical temperature (Acm for hyper-eutectoid steels). After complete austenite transformation, the steel is air cooled resulting in a refined, pearlitic microstructure. In this context it is important to not overheat since grain boundary cementite may re-precipitate when dealing with high carbon steels.
2.3.2 Soft annealing As the name implies, soft annealing, or spheroidization, is a heat treatment that will soften the steel by having the hot formed structure (often pearlite with various contents of ferrite and grain boundary cementite depending on steel composition) transform into spherical particles. The driving force for transformation is the lowering of surface energy in ferrite/cementite interfaces (the ferrite/cementite interfacial area is much smaller in a microstructure consisting of spherical carbides than in one consisting of pearlite). Steels that will experience extensive plastic deformation (e.g. turning and forming) in subsequent manufacturing steps are given this treatment to facilitate easier machining. The basic principle of a soft annealing process of a high carbon steel is that the steel is brought into the γ + Fe3C region of the phase diagram and is then controlled cooled, typically 5°C-20°C/hour until all austenite has transformed into ferrite. This results in a soft structure of spherical carbides in a ferrite matrix.
1
A
2
3
6
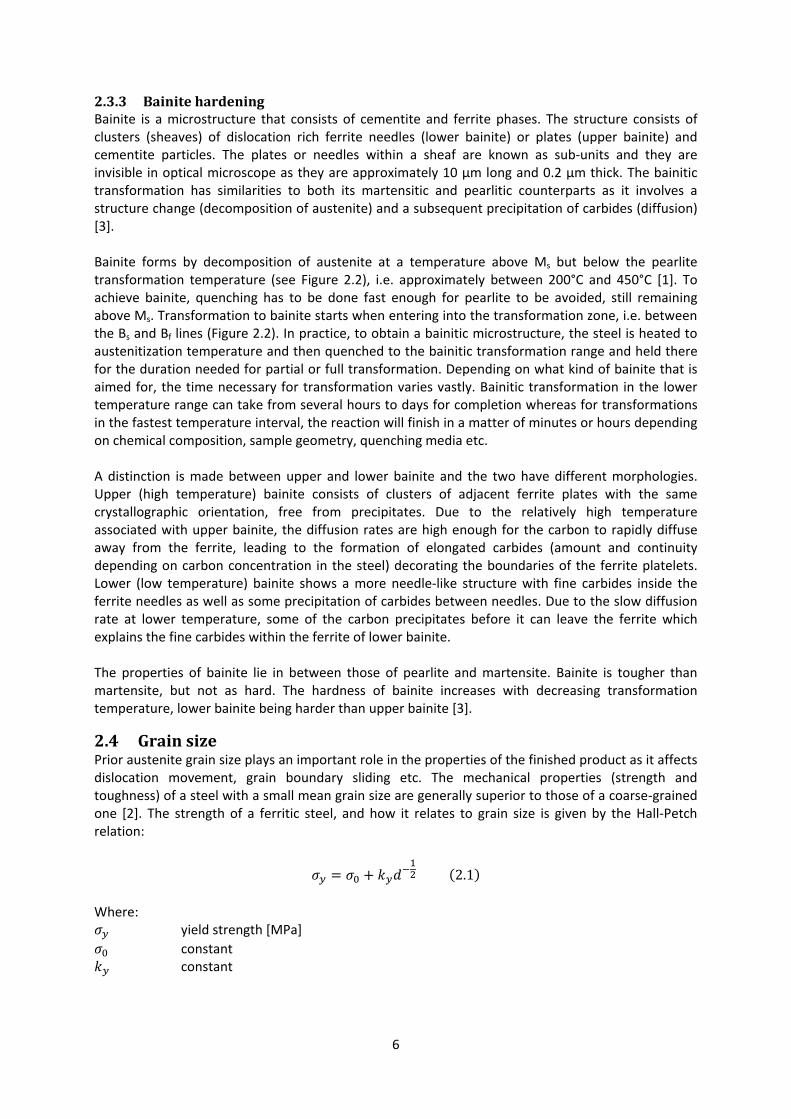
2.3.3 Bainite hardening Bainite is a microstructure that consists of cementite and ferrite phases. The structure consists of clusters (sheaves) of dislocation rich ferrite needles (lower bainite) or plates (upper bainite) and cementite particles. The plates or needles within a sheaf are known as sub-units and they are invisible in optical microscope as they are approximately 10 µm long and 0.2 µm thick. The bainitic transformation has similarities to both its martensitic and pearlitic counterparts as it involves a structure change (decomposition of austenite) and a subsequent precipitation of carbides (diffusion) [3]. Bainite forms by decomposition of austenite at a temperature above Ms but below the pearlite transformation temperature (see Figure 2.2), i.e. approximately between 200°C and 450°C [1]. To achieve bainite, quenching has to be done fast enough for pearlite to be avoided, still remaining above Ms. Transformation to bainite starts when entering into the transformation zone, i.e. between the Bs and Bf lines (Figure 2.2). In practice, to obtain a bainitic microstructure, the steel is heated to austenitization temperature and then quenched to the bainitic transformation range and held there for the duration needed for partial or full transformation. Depending on what kind of bainite that is aimed for, the time necessary for transformation varies vastly. Bainitic transformation in the lower temperature range can take from several hours to days for completion whereas for transformations in the fastest temperature interval, the reaction will finish in a matter of minutes or hours depending on chemical composition, sample geometry, quenching media etc. A distinction is made between upper and lower bainite and the two have different morphologies. Upper (high temperature) bainite consists of clusters of adjacent ferrite plates with the same crystallographic orientation, free from precipitates. Due to the relatively high temperature associated with upper bainite, the diffusion rates are high enough for the carbon to rapidly diffuse away from the ferrite, leading to the formation of elongated carbides (amount and continuity depending on carbon concentration in the steel) decorating the boundaries of the ferrite platelets. Lower (low temperature) bainite shows a more needle-like structure with fine carbides inside the ferrite needles as well as some precipitation of carbides between needles. Due to the slow diffusion rate at lower temperature, some of the carbon precipitates before it can leave the ferrite which explains the fine carbides within the ferrite of lower bainite. The properties of bainite lie in between those of pearlite and martensite. Bainite is tougher than martensite, but not as hard. The hardness of bainite increases with decreasing transformation temperature, lower bainite being harder than upper bainite [3].
2.4 Grain size Prior austenite grain size plays an important role in the properties of the finished product as it affects dislocation movement, grain boundary sliding etc. The mechanical properties (strength and toughness) of a steel with a small mean grain size are generally superior to those of a coarse-grained one [2]. The strength of a ferritic steel, and how it relates to grain size is given by the Hall-Petch relation:
𝜎𝑦 = 𝜎0 + 𝑘𝑦𝑑−12 (2.1)
Where: 𝜎𝑦 yield strength [MPa] 𝜎0 constant 𝑘𝑦 constant

7
In bainitic and martensitic steels, the lath width is an important factor for determining the hardness and strength. The strength follows the Hall-Petch relation also for these microstructures, and this explains why finer structures (lower bainite) show a better performance than coarser structures [3].
2.5 Mechanical property evaluation The following chapter gives a background to the test methods used in the project.
2.5.1 Hardness measurement Two methods of measuring hardness were used in this project, macroindentation hardness testing (Rockwell hardness test, HRC) and microindentation hardness testing (Vickers, HV). Macroindentation hardness testing In the Rockwell hardness test, a diamond indenter is pressed into the sample at two different loads, and the depth of the indent is monitored. First a minor load is applied, and a zero level is established (this increases the accuracy of the test as it nullifies the effects of surface roughness). A major load is applied during a specified dwell time and then the depth reading is done. The major and minor loads are removed, and the difference in penetration depth is read. The Rockwell hardness number corresponds this difference and is represented by a combination of the symbol HR and a scale designation ranging from A to N. In this project, scale designation C is used which prescribes the usage of a diamond indenter with a spheroconical shape with a 120° cone angle and a spherical tip radius of 200 µm and an applied load of 150 kgf [4].
Microindentation hardness testing In Vickers microindentation hardness tests, a pyramid-shaped diamond indenter with an angle of 136° between opposite faces is used. The indenter is pressed into the test specimen and held for approximately 10-15 seconds and the load is then removed. The diagonals of the resulting indentation are measured, the mean value for the two diagonals is calculated and the following relation is used to calculate the Vickers hardness.
𝐻𝑉 ≈2000 × 𝑃 × sin(𝛼 2⁄ )
𝑑2 (2.2)
Where HV Vickers hardness [HV] d mean diagonal [µm] P applied load [gf] α face angle [rad]
2.5.2 Residual stress measurement Residual stresses may arise in a material in several different production steps such as rolling, machining or heat treatment. In components, compressive stresses in the surface are often desired due to their positive effect on fatigue resistance as they impede fatigue crack growth. When measuring residual stresses in a material using X-ray diffractometry, X-rays with a specific wave length, λ, are emitted from the X-ray source and the angle, θ, of these rays when entering and exiting the material is measured. Bragg’s law is then used to calculate d, the distance between lattice planes:
𝜆 = 2 × 𝑑 × sin𝜃 (2.3)

8
By knowing the distance between lattice planes in an undeformed crystal, d0, the strain, ε, can be calculated using equation 2.4:
𝜀 =𝑑 − 𝑑0𝑑0
(2.4)
The (residual) stress is then calculated using Hooke’s law of elasticity:
𝜎 = 𝐸 × 𝜀 (2.5) Where 𝜎 stress [MPa] 𝐸 modulus of elasticity [MPa]
2.5.3 Impact toughness testing The test standard ASTM E23 describes impact toughness testing of a notched sample, often called Charpy test. The notched specimen, normally 10 x 10 x 55 mm is supported on both ends and broken by a single blow of a pendulum that strikes the specimen at the center of the unnotched side [4]. As the pendulum swings (with a minimal amount of friction) and passes the anvil holding the sample, the difference in height of fall and height of rise is measured and from these measurements the absorbed energy from breaking the sample is calculated.
2.5.4 Fatigue and Rotating Bending Fatigue testing Fatigue can occur when a material is subjected to cyclic loading also when maximum stresses are below the yield strength of the material. The fatigue process basically consists of two steps; crack initiation and crack propagation. When a material is subjected to cyclic loads, microcracks are likely to start at defects due to stress concentration giving local plastic deformation. In low cycle fatigue (LCF), such defects can be scratches or other stress raisers at the surface. In high cycle fatigue (HCF), the initiation often takes place inside the material and the defects are typically non-metallic inclusions such as sulphides, oxides, nitrides etc. The most common type of failure for the bearing steels examined in this project is the internally initiated one. Surface initiated cracks are prevented in some applications by means of the introduction of compressive residual stresses in the surface. The residual stress field is superimposed on the service stresses and can thus lower the peak tensile stress so that the effective stress amplitude becomes insufficient for initiating and propagating cracks. Fatigue properties of the steel in this experiment were analyzed by means of rotating bending fatigue (RBF) testing. In this kind of test a static bending load is applied to a test specimen. Rotation of the test bar results in a sinusoidal stress variation with the stress ratio R=-1 (ratio of minimum stress to maximum stress). The result from a RBF test is plotted in a S-N (or Wöhler-) curve which gives the relation between applied stress and number of revolutions until fracture, see Figure 2.3. As fatigue processes are stochastical in nature, a statistic approach is often used and the S-N data is represented by a distribution.

9
Figure 2.3. Schematic S-N curve for a material with a fatigue limit.
The horizontal part of the S-N curve represents the fatigue limit, i.e. the stress amplitude level at which the sample will virtually never fail. This limit is not an absolute level, but certain materials exhibit a lower stress amplitude level where normal testing cannot proceed long enough to initiate fracture. The fatigue limit is usually found by running a test at a certain stress amplitude level relevant to that material (for example based on previous runs) and defining a number of cycles where the test will be stopped if fracture has not occurred, the “run-out” (in this project, two million cycles). If run-out is reached, the stress level is increased for the next sample/test. If run-out is not reached (sample breaks before run-out), the stress level is decreased for the next sample. This iteration eventually leads to defining the fatigue limit, provided there is a large enough number of test samples to statistically secure the results.
Stre
ss a
mpl
itude
, σ [M
Pa]
Number of cycles to failure, Nf (log scale)

10

11
3 Method This chapter describes the methods and procedures involved in preparing and analyzing the steel used in the experiment.
3.1 Material The material used in this project is an ultra clean, high carbon steel used by SKF for manufacturing of large bearings. The steel is delivered to SKF in a soft annealed condition and its chemical composition is given in Table 3.1.
Table 3.1. Chemical composition of ISO 683-17 steel (low and high values are min and max limits of the alloying elements).
Weight % ppm C Si Mn P S Cr Ni Mo Cu As+Sn+Sb Pb Al O Ti Ca
0.90 0.40 0.80 - - 1.80 - 0.50 - - - - - - - 1.05 0.60 1.10 0.025 0.015 2.05 0.25 0.60 0.30 0.075 0.002 0.050 10 30 10
3.2 Design of Experiment To evaluate how different heat treatments affect material parameters such as hardness, residual stress and grain size, a Design of Experiment (DoE) was set up. In a DoE, a number of factors (two or more) exist that can alter the experimental outcome, each having one of two possible values (levels), high (1) or low (0). In this case the factors are the three different heat treatment steps; normalizing, soft annealing and hardening, and the values are the two variants available in each of the treatments. For an experiment having three factors (as in this case), where each of the factors have two variants, the number of possible outcomes becomes eight. The purpose of the DoE was to run and analyze these eight heat treatment variants/routes and try to see whether or not the current heat treatment route for the steel could be modified to increase the fatigue properties of the steel. The current heat treatment route was emulated with a reference sample denoted R. The test matrix is presented in Table 3.2 and contains the following parameter variants: Normalizing, N
• 0: Normalizing at high temperature. • 1: Normalizing at low temperature.
Soft annealing, SA • 0: One cycle soft annealing. • 1: Two cycle soft annealing.
Hardening, H • 0: SKF Explorer bainite hardening • 1: Carbonitriding + SKF Explorer bainite hardening

12
Table 3.2. DoE, test matrix.
Sample
Nor
mal
izin
g
Soft
anne
alin
g
Har
deni
ng
1 0 0 0 2 0 0 1 3 0 1 0 4 0 1 1 5 1 0 0 6 1 0 1 7 1 1 0 8 1 1 1 R - 1 0
A 0 B 0 0
C 0 1 D 1
E 1 0 F 1 1
In order to be able to assess the microstructure of the steel after each individual step (normalizing and soft annealing), extra samples were made by cutting a disc into smaller pieces, samples A-F and R. These extra specimens were run at the same time as the discs, but taken out after normalizing and soft annealing respectively (see Table 3.2).
Figure 3.1. Steel disc and extra specimen.
13
3.3 Heat treatment All heat treatments in the experiment and their specifics are described in the following section. The furnaces and salt bath used in the heat treatment experiments at SKF were:
• Ipsen RT-1-EM furnace for the hardening, carbonitriding and grain size preparation treatments.
• Nabertherm N 17/HR furnace for the normalizing and soft annealing treatments.
• Nabertherm N 60/45HA furnace for the tempering treatments.
• Snijstaal B70E salt bath for quenching and bainitic transformations.
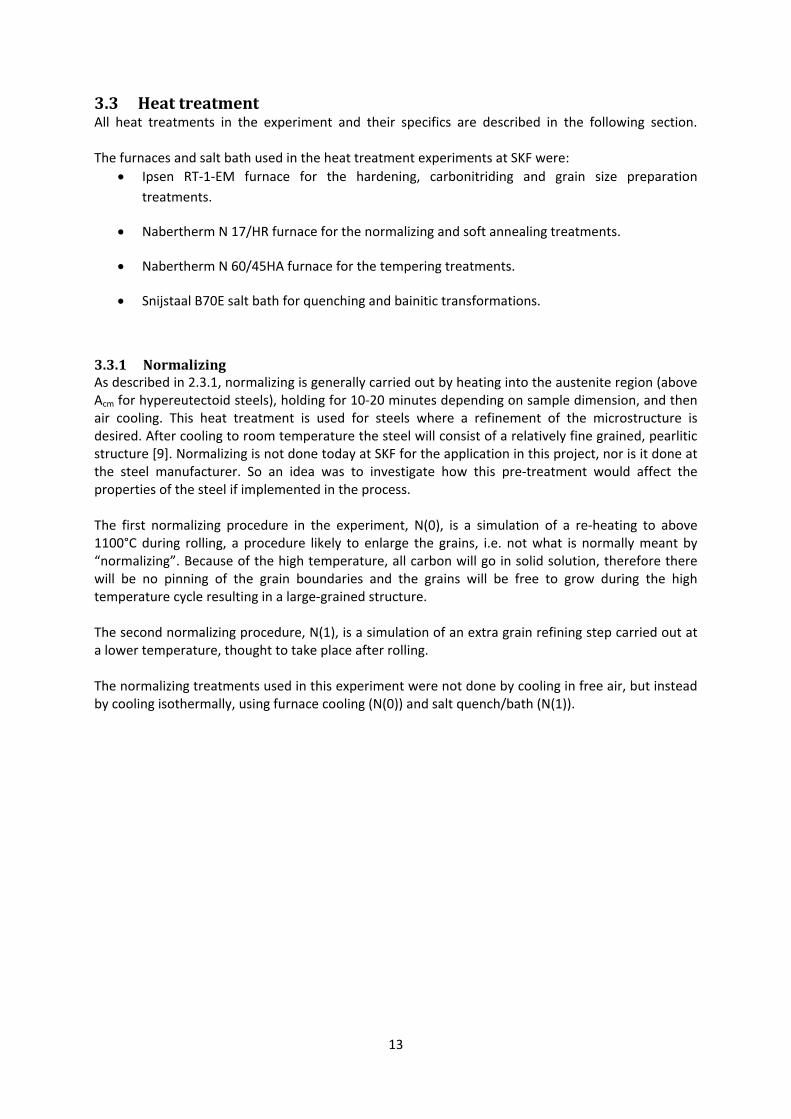
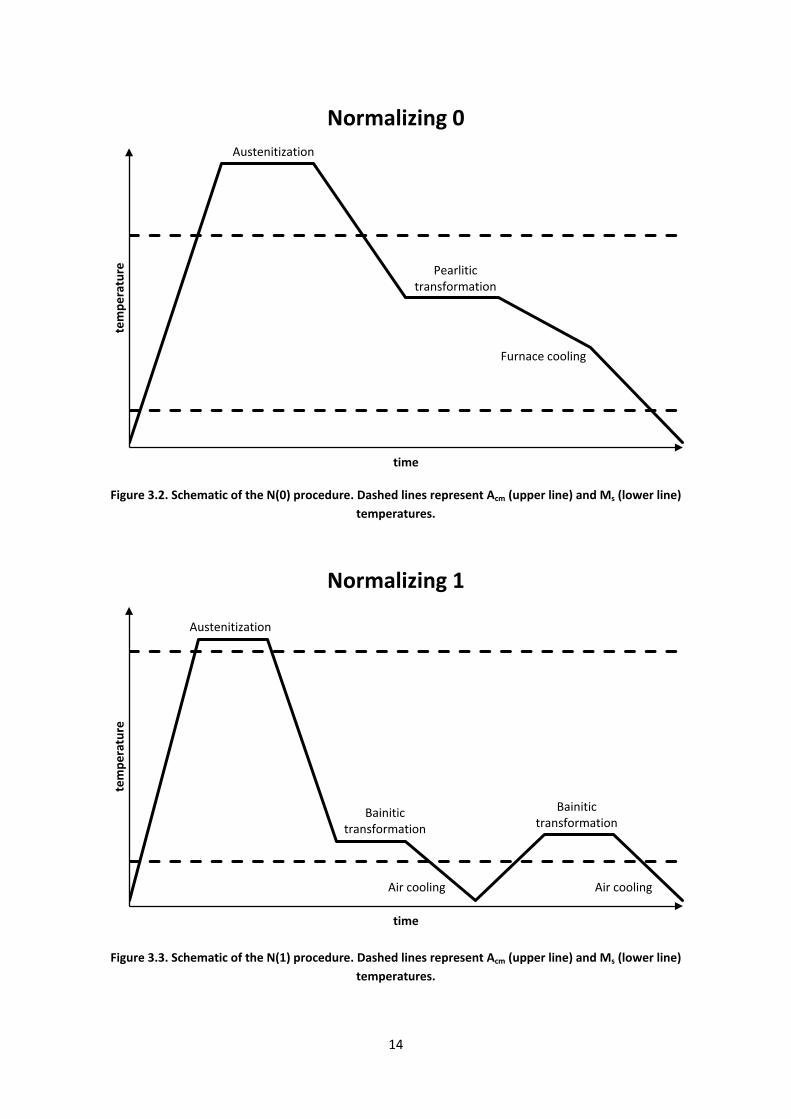
3.3.1 Normalizing As described in 2.3.1, normalizing is generally carried out by heating into the austenite region (above Acm for hypereutectoid steels), holding for 10-20 minutes depending on sample dimension, and then air cooling. This heat treatment is used for steels where a refinement of the microstructure is desired. After cooling to room temperature the steel will consist of a relatively fine grained, pearlitic structure [9]. Normalizing is not done today at SKF for the application in this project, nor is it done at the steel manufacturer. So an idea was to investigate how this pre-treatment would affect the properties of the steel if implemented in the process. The first normalizing procedure in the experiment, N(0), is a simulation of a re-heating to above 1100°C during rolling, a procedure likely to enlarge the grains, i.e. not what is normally meant by “normalizing”. Because of the high temperature, all carbon will go in solid solution, therefore there will be no pinning of the grain boundaries and the grains will be free to grow during the high temperature cycle resulting in a large-grained structure. The second normalizing procedure, N(1), is a simulation of an extra grain refining step carried out at a lower temperature, thought to take place after rolling. The normalizing treatments used in this experiment were not done by cooling in free air, but instead by cooling isothermally, using furnace cooling (N(0)) and salt quench/bath (N(1)).
14
Figure 3.2. Schematic of the N(0) procedure. Dashed lines represent Acm (upper line) and Ms (lower line)
temperatures.
Figure 3.3. Schematic of the N(1) procedure. Dashed lines represent Acm (upper line) and Ms (lower line)
temperatures.
Austenitization
Pearlitic transformation
Furnace cooling
tem
pera
ture
time
Normalizing 0
Austenitization
Bainitic transformation
Air cooling
Bainitic transformation
Air cooling
tem
pera
ture
time
Normalizing 1
15
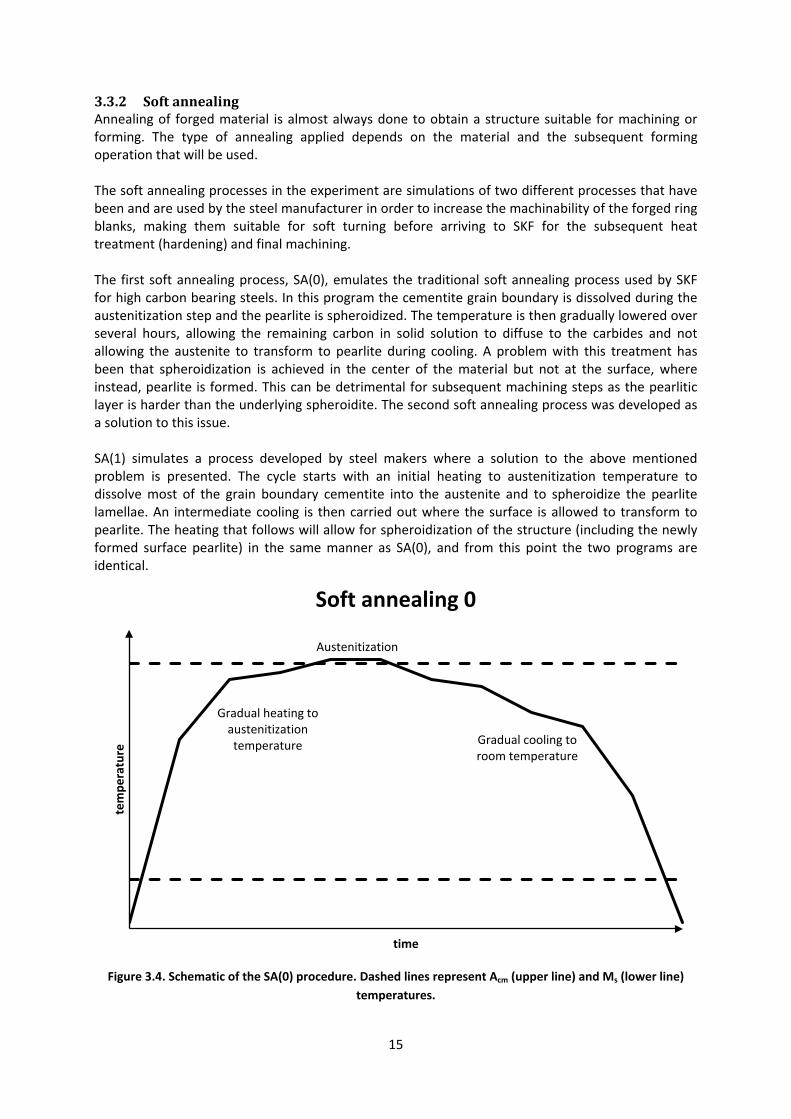
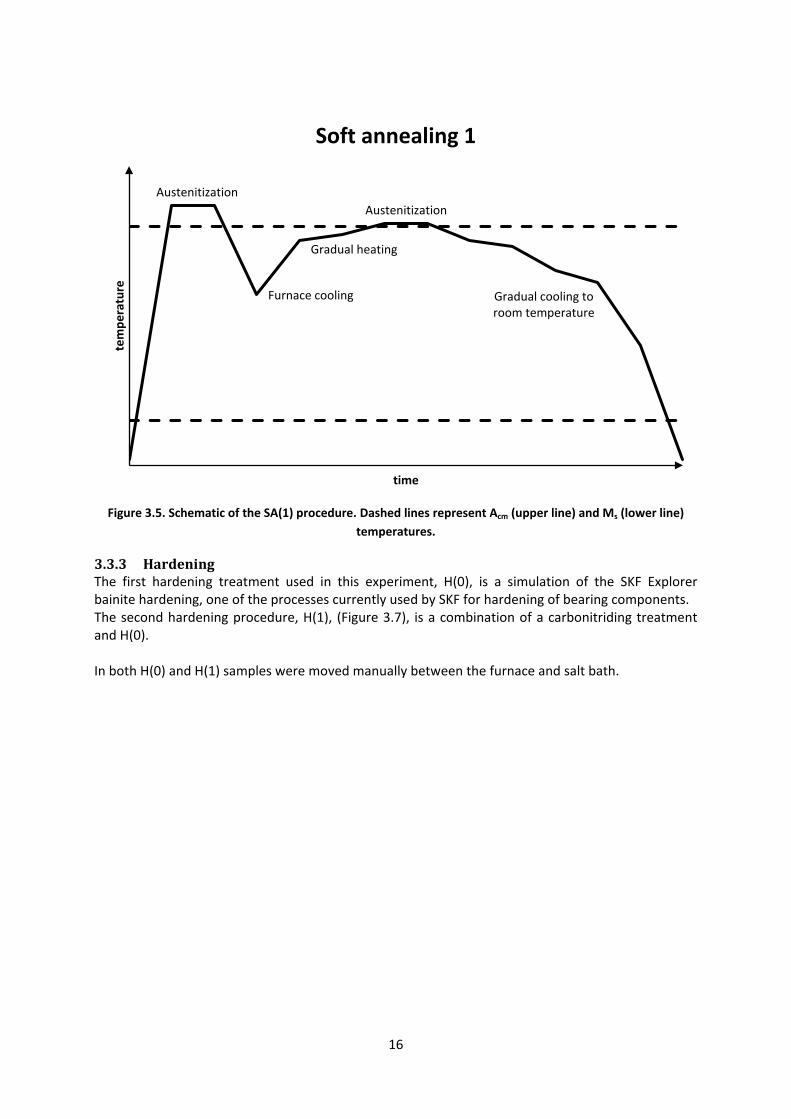
3.3.2 Soft annealing Annealing of forged material is almost always done to obtain a structure suitable for machining or forming. The type of annealing applied depends on the material and the subsequent forming operation that will be used. The soft annealing processes in the experiment are simulations of two different processes that have been and are used by the steel manufacturer in order to increase the machinability of the forged ring blanks, making them suitable for soft turning before arriving to SKF for the subsequent heat treatment (hardening) and final machining. The first soft annealing process, SA(0), emulates the traditional soft annealing process used by SKF for high carbon bearing steels. In this program the cementite grain boundary is dissolved during the austenitization step and the pearlite is spheroidized. The temperature is then gradually lowered over several hours, allowing the remaining carbon in solid solution to diffuse to the carbides and not allowing the austenite to transform to pearlite during cooling. A problem with this treatment has been that spheroidization is achieved in the center of the material but not at the surface, where instead, pearlite is formed. This can be detrimental for subsequent machining steps as the pearlitic layer is harder than the underlying spheroidite. The second soft annealing process was developed as a solution to this issue. SA(1) simulates a process developed by steel makers where a solution to the above mentioned problem is presented. The cycle starts with an initial heating to austenitization temperature to dissolve most of the grain boundary cementite into the austenite and to spheroidize the pearlite lamellae. An intermediate cooling is then carried out where the surface is allowed to transform to pearlite. The heating that follows will allow for spheroidization of the structure (including the newly formed surface pearlite) in the same manner as SA(0), and from this point the two programs are identical.
Figure 3.4. Schematic of the SA(0) procedure. Dashed lines represent Acm (upper line) and Ms (lower line)
temperatures.
Gradual heating to austenitization temperature
Austenitization
Gradual cooling to room temperature
tem
pera
ture
time
Soft annealing 0
16
Figure 3.5. Schematic of the SA(1) procedure. Dashed lines represent Acm (upper line) and Ms (lower line)
temperatures.
3.3.3 Hardening The first hardening treatment used in this experiment, H(0), is a simulation of the SKF Explorer bainite hardening, one of the processes currently used by SKF for hardening of bearing components. The second hardening procedure, H(1), (Figure 3.7), is a combination of a carbonitriding treatment and H(0). In both H(0) and H(1) samples were moved manually between the furnace and salt bath.
Austenitization
Furnace cooling
Gradual heating
Austenitization
Gradual cooling to room temperature
tem
pera
ture
time
Soft annealing 1
17
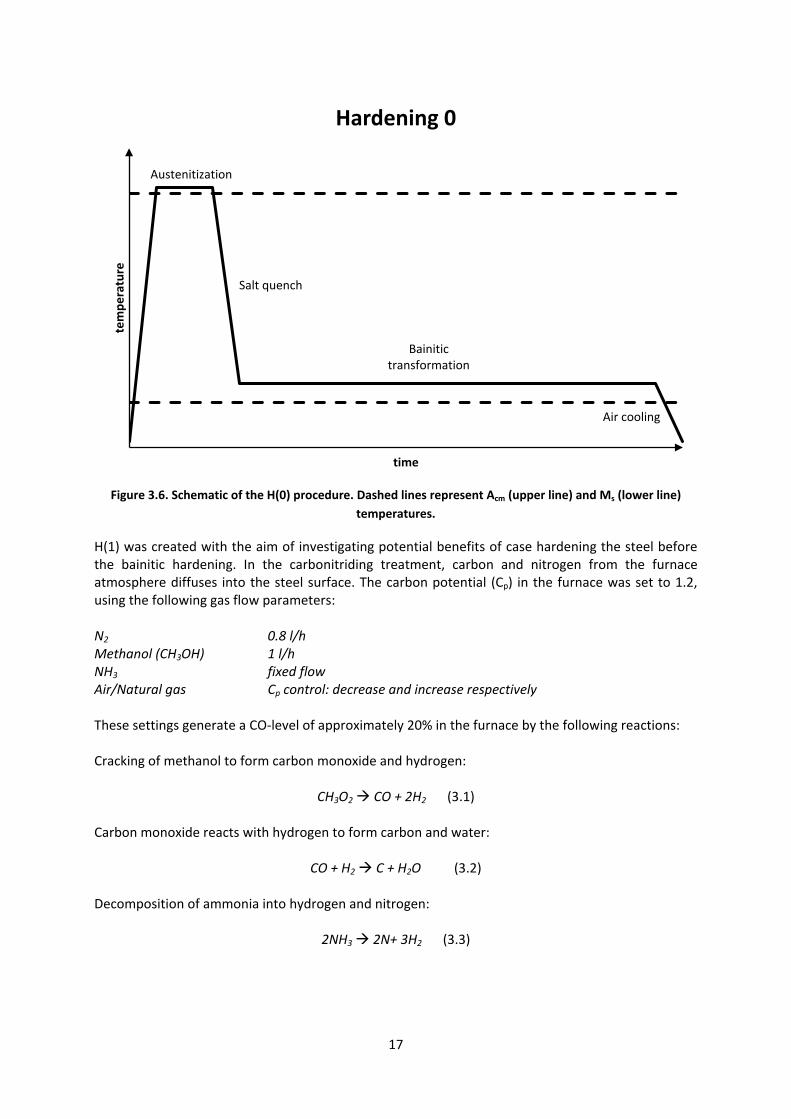
Figure 3.6. Schematic of the H(0) procedure. Dashed lines represent Acm (upper line) and Ms (lower line)
temperatures.
H(1) was created with the aim of investigating potential benefits of case hardening the steel before the bainitic hardening. In the carbonitriding treatment, carbon and nitrogen from the furnace atmosphere diffuses into the steel surface. The carbon potential (Cp) in the furnace was set to 1.2, using the following gas flow parameters: N2 0.8 l/h Methanol (CH3OH) 1 l/h NH3 fixed flow Air/Natural gas Cp control: decrease and increase respectively These settings generate a CO-level of approximately 20% in the furnace by the following reactions: Cracking of methanol to form carbon monoxide and hydrogen:
CH3O2 CO + 2H2 (3.1)
Carbon monoxide reacts with hydrogen to form carbon and water:
CO + H2 C + H2O (3.2)
Decomposition of ammonia into hydrogen and nitrogen:
2NH3 2N+ 3H2 (3.3)
Austenitization
Salt quench
Bainitic transformation
Air cooling
tem
pera
ture
time
Hardening 0

18
Figure 3.7. Schematic of the H(1) procedure. Horizontal dashed lines represent Acm (upper line) and Ms (lower line) temperatures. Vertical dashed line separates the carbonitriding and the bainitic hardening procedures.
3.3.4 Pearlitization treatment Because the discs were received in the soft annealed condition, an initial heat treatment was done to obtain pearlitic structure. This would “reset” the soft annealing and emulate the state of the material after rolling in the steel plant, the logical starting point for the experiments. The heating sequence used to obtain pearlitic structure in the discs and small pieces was executed as follows:
• Heating from room temperature to austenitization temperature in one hour and holding for 30 minutes.
• Cooling to 600 °C and holding for five hours to obtain complete pearlitic transformation. • Cooling to room temperature in two steps.
Carbonitriding cycle H(0) cycle
tem
pera
ture
time
Hardening 1
19
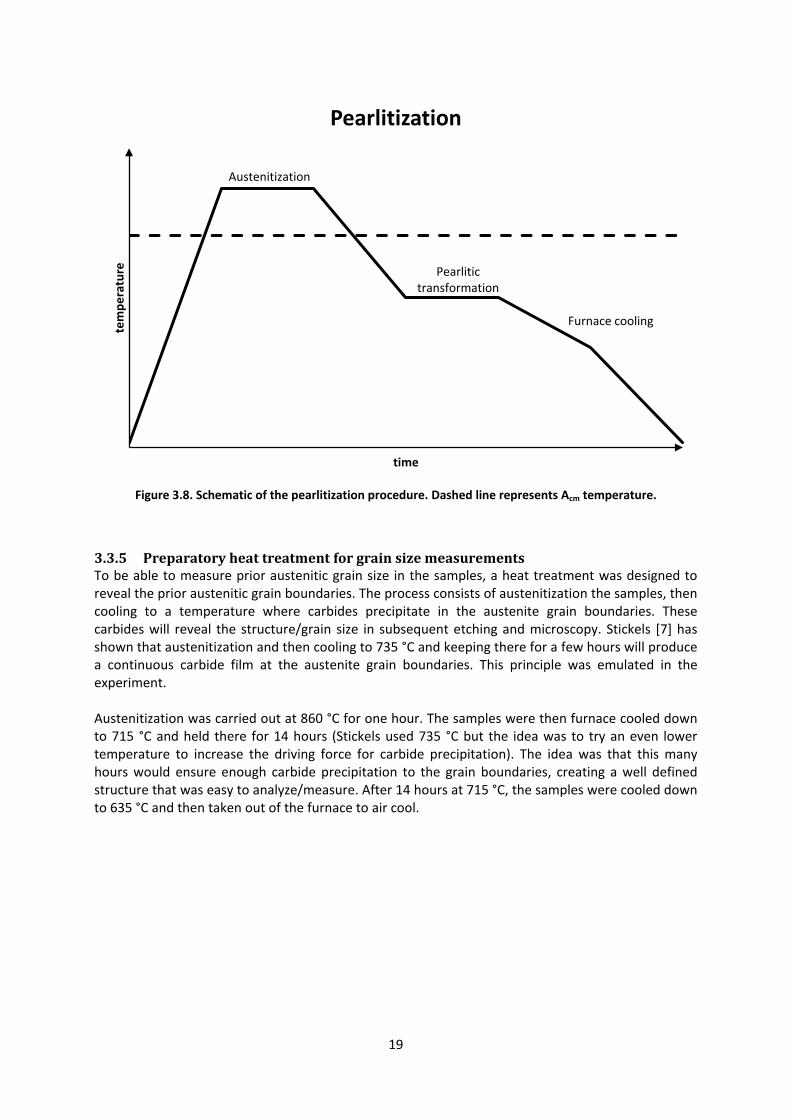
Figure 3.8. Schematic of the pearlitization procedure. Dashed line represents Acm temperature.
3.3.5 Preparatory heat treatment for grain size measurements To be able to measure prior austenitic grain size in the samples, a heat treatment was designed to reveal the prior austenitic grain boundaries. The process consists of austenitization the samples, then cooling to a temperature where carbides precipitate in the austenite grain boundaries. These carbides will reveal the structure/grain size in subsequent etching and microscopy. Stickels [7] has shown that austenitization and then cooling to 735 °C and keeping there for a few hours will produce a continuous carbide film at the austenite grain boundaries. This principle was emulated in the experiment. Austenitization was carried out at 860 °C for one hour. The samples were then furnace cooled down to 715 °C and held there for 14 hours (Stickels used 735 °C but the idea was to try an even lower temperature to increase the driving force for carbide precipitation). The idea was that this many hours would ensure enough carbide precipitation to the grain boundaries, creating a well defined structure that was easy to analyze/measure. After 14 hours at 715 °C, the samples were cooled down to 635 °C and then taken out of the furnace to air cool.
Austenitization
Pearlitic transformation
Furnace cooling tem
pera
ture
time
Pearlitization

20
Figure 3.9. Schematic of the heat treatment used to reveal prior austenite grain boundaries in samples
prepared from the discs. Dashed line represents Acm temperature.
3.3.6 Heat treatment of the impact testing samples Six different heat treatment procedures were carried out on Charpy V samples to test how they would affect impact toughness, hardness and microstructure of the tested material. The following section lists and describes the heat treatment procedures used in the experiment.
1. High temperature normalizing. In this heat treatment procedure, the samples were normalized at high temperature, air cooled and hardened by means of SKF Explorer bainite hardening.
2. High temperature normalizing with extended soaking time. This procedure included the same high temperature normalizing but with 10 hour soaking time at high temperature before air cooling and SKF Explorer bainite hardening.
3. SKF Explorer bainite hardening. See Chapter 3.3.3 for the description of this hardening procedure which was used as a reference.
4. Normalize before hardening. In this heat treatment procedure, normalizing procedure N(1) from the disc experiment was carried out on samples before SKF Explorer bainite hardening.
5. Two cycle normalizing. Two normalizing cycles were carried out (see Figure 3.10) before SKF Explorer bainite hardening to achieve grain refinement.
6. Extended bainite transformation time. In this procedure, the bainite transformation temperature was lowered (relative to SKF Explorer bainite hardening) and the time at temperature was extended in an attempt to achieve a fine, low temperature bainite.
Austenitization
Carbide precipitation
Air cooling
tem
pera
ture
time
Preparatory heat treatment for grain size measurement

21
Heat treatment procedures 1 and 2 were performed at Bodycote Värmebehandling AB in Värnamo (except for the SKF Explorer bainite treatment) and procedures 3 through 6 were performed at SKF.
Figure 3.10. Two cycle normalizing. Dashed lines represent Acm (upper line) and Ms (lower line) temperatures.
3.3.7 Heat treatment of rotating bending fatigue samples A pre-test was run to investigate the hardness, potential scaling and geometrical distortions after carbonitriding. In an atmosphere of 10% NH3, 20% CO and Cp=1.2, two samples were heated to austenitization temperature and held for 30 minutes. The samples were then cooled in the furnace vestibule for five minutes until approximately 250°C (measured with handheld pyrometer) and then transferred into a at 215°C tempering furnace for 24 hours and 96 hours respectively. The sample held for 24 hours reached a hardness of 50 HRC and the one kept for 96 hours measured 61 HRC (showing that the longer furnace time allowed for more bainitic transformation, hence higher hardness). After the initial test, the conclusion could be made that there were no scaling or geometrical distortions and the samples could therefore be heat treated according to H(1) (carbonitriding and hardening).
3.4 Residual stress measurements X-ray diffraction (XRD) was used to measure the residual stresses of the discs and rotating bending beams. The measurements were done at SKF using an XSTRESS 3000 diffractometer. Important here is that these measurements were carried out before the material was cut so that the built in stresses were kept intact.
Austenitization #1
Tempering #1
Austenitization #2
Tempering #2
tem
pera
ture
time
Two cycle normalizing

22
3.4.1 Electrochemical etching The etching of the measuring holes was done using a NaCl electrolyte at 200 mA current. The etching depth was calculated using the following relation: etching depth (µm) ≈ [etching time (sec)*0.5] (3.4) This means that for each 50 seconds of etching, a 25 µm deep hole is produced, or, 25 µm depth is added to an existing hole. Between each etching (50 seconds), the etched surface was cleaned with ethanol and the used electrolyte was discarded and replaced. To reach 400 µm depth, 8 rounds of etching had to be carried out, though these had to be alternated with X-ray measurements since all measurements were done in the same hole.
3.4.2 X-ray measurements The initial measurements were done at 150 µm depth with a 3 mm collimator, on all discs. The measurements for the strength profiles (see Chapter 3.8) on samples one and six were done with 3 mm collimator for the first three depths (50, 100 and 150 µm), 2 mm collimator for the fourth depth (200 µm) and 1 mm collimator for the final two depths (300 and 400 µm). The reason for using collimators with smaller diameters for the deeper holes is that the flatness of the bottom surface will decrease the deeper the hole is. Hence, a finer collimator is needed to be able to obtain an X-ray beam narrow enough for the holes with the more hemispherical bottom that is produced when etching as deep as 300-400 µm. Also, when decreasing the diameter of the collimator, the exposure time (the time that the shutter is open and the sample is exposed to X-rays) has to be increased in order to get satisfactory results, i.e. a sufficiently high intensity level. For the measurements with the 3 mm collimator, an exposure time of 10 to 15 seconds was sufficient to produce a satisfactory intensity level. For the 2 mm collimator the exposure time had to be increased to 30 seconds to produce the same intensity values and for the final two measurements/depths using the 1 mm collimator, the exposure time had to be increased to 130 seconds before satisfactory results could be obtained.
3.5 Sample preparation Small pieces of the steel discs for metallography were cut from half radius position using a Struers Discotom-6 cutting machine. The discs were first cut in half. After that, strips, approximately 15 mm wide were cut from one of the halves. Out of these strips, two small pieces, approximately 15 mm wide were cut at each half radius, one intended for microindentation hardness measurements and the other for grain size measurements.
23
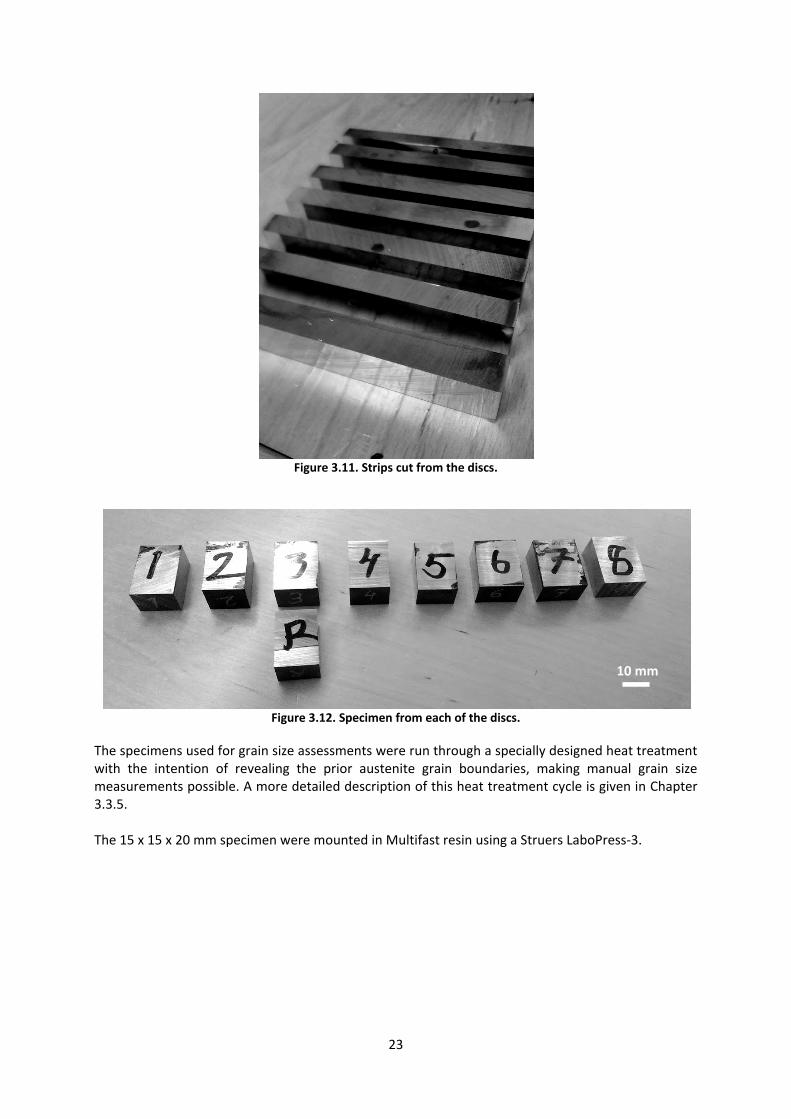
Figure 3.11. Strips cut from the discs.
Figure 3.12. Specimen from each of the discs.
The specimens used for grain size assessments were run through a specially designed heat treatment with the intention of revealing the prior austenite grain boundaries, making manual grain size measurements possible. A more detailed description of this heat treatment cycle is given in Chapter 3.3.5. The 15 x 15 x 20 mm specimen were mounted in Multifast resin using a Struers LaboPress-3.
10 mm

24
Figure 3.13. Mounted sample.
To prepare the samples for microscopy and microhardness testing, they were ground and polished to a mirror like surface. This was done using a Struers Tegra-Pol-31 grinding-/polishing machine using the following sequence of grinding-/polishing discs:
1. plane grinding, abrasive particle size: 220 µm 2. fine grinding, abrasive particle size: 9 µm 3. polishing, abrasive particle size: 3 µm 4. polishing, abrasive particle size: 1 µm
In order to be able to see the prior austenite grain boundaries in the microscope, the samples were etched using the following procedure: A mixture of 100 ml picric acid, 2 ml Tepol and 10-12 drops of hydrochloric acid were mixed in a glass container and filtered twice. The samples were immersed in the mixture, kept for ten minutes and then rinsed in water with high agitation, held under pouring water for a short while before cleaning with ethanol and finally polishing manually using a polishing disc with 1 µm abrasive particles. The samples that were prepared from the impact test bars, the extra steel pieces from the disc experiment and the piece from the carbonitrided rotating bending beam were all etched with Nital 1.5 % nitric acid in ethanol.
3.6 Hardness measurements The microindentation hardness was measured using a Clemex CMT.HD micro hardness testing system with an applied load of 500 gf. The tested specimens were prepared from discs one and six and also one of the rotating bending beams was tested. The disc hardness was measured at six different depths from the surface; 50, 100, 150, 200, 300 and 400 µm. At each depth, four measurements were made and the arithmetic mean value was calculated. The hardness values of the RBF specimens were measured at 150 µm depth (same depth as the residual stress measurement for the sample).

25
Figure 3.14. Micro hardness indent.
To compensate for the deviation from a flat surface when carrying out Rockwell hardness testing on the RBF beams, 1 HRC was added to all measured values according to literature data on compensation for small radii [13]
3.7 Grain size measurements All microscopy in this project was carried out at SKF using a Nicon Eclipse L150 microscope at 500x and 1000x magnification. The images were analyzed at SKF using the manual method described in this chapter. The standard ASTM E 112 was used for measuring the prior austenite grain size, the method is described here. Three concentric circles with a total line length of 500 mm are placed over an image of the grain structure to be measured. The number of grains intersected, N, is then counted. This number is divided by the true line length, L (total line length divided by the magnification at which the image was taken), and inverted to obtain l, the mean lineal intercept length, which is a measure of the grain size. To exemplify this method, the procedure of measuring the grain size in sample two is described here, step by step. First, three concentric circles measuring 249.7, 150.2 and 99.9 mm respectively was drawn over the image of the grain structure to be measured.

26
Figure 3.15. Three concentric circles drawn on the grain structure of sample 2, 500x magnification.
The next step is to count all grains intercepted by the lines. In this case the number of grains intercepted is 106. Hence N=106 and the equations become as follows:
NL = 106/1 mm =106/mm (3.5)
l = NL-1 = 0.009434 mm= 9.4 µm (3.6)
Where L = true line length = 500 mm/500 x = 1 mm
For each sample, this measurement and calculation was repeated five times (as recommended in ISO 643, who uses an almost identical procedure for grain size measurements), on five different areas, and an arithmetic mean value from those five results was then calculated and used in all subsequent calculations where grain size was a variable.
3.8 Strength profiling Two strength profiles were constructed to visualize how the strength varies along the depth of a heat treated component. Ando et al. have shown that there exists a relation between the yield stress, the maximum compressive residual stress and the mean grain size and the fatigue limit of gears produced from mild- and medium carbon steels [8]. The relation is given below:

27
σup = 0.478 x ( σY + σr max ) + 1.363 dγ-1/2 – 894 (3.7)
Where: σup fatigue limit σY yield stress σr max maximum compressive residual stress dγ mean grain diameter This relation was used to predict the (theoretical) fatigue limit of two of the steel discs at different depths. Preliminary measurements were made for screening, in order to sort out the sample with the best and the one with the worst theoretical fatigue life. Hardness measurements were carried out on all of the discs as well as residual stress measurements at 150 µm depth from surface. The hardness values measured in Rockwell (HRC) were converted to Vickers (HV10) values using ASTM 140 conversion.
3.9 Minitab analysis As part of analyzing the results from the disc experiment, Minitab 16 (Minitab Inc.), a statistical software/tool was used. A factorial design was created and analyzed and several plots were generated to visualize effects and interactions of the different heat treatment parameters. These are presented in Chapter 4.1.7.
3.10 Impact testing For the purpose of impact testing, 40 samples were manufactured according to ASTM E23 standard (except for the SKF specific notch) at Metalock Engineering Sweden AB and machined (fine grinding) at Carl Larssons Mekaniska Verkstad AB. The samples were divided into 8 groups with 5 samples in each. These groups were then heat treated according to the recipes discussed in Chapter 3.3.6.
Figure 3.16. Unnotched impact testing bars.

28
3.11 Rotating bending fatigue testing The samples for the rotating bending fatigue (RBF) testing were machined and heat treated at SKF using carbonitriding and SKF Explorer bainite hardening.
Figure 3.17. RBF beam drawing.
In addition to the actual rotating bending testing of the samples, one beam was analyzed for hardness and residual stress. This additional analysis was carried out to see how well the theoretical fatigue value calculated using Equation 3.7 would match with stair case tests in future projects. The measurements (microhardness and residual stress) on these extra RBF samples were done at 150 µm depth and the grain size was estimated to 10 µm.

29
4 Results In this chapter, results of the experiments are presented. The chapter is divided into three parts. The first part is a presentation of the results of the disc experiment. The second part gives the results from the impact testing and in the third part, results from RBF testing are presented.
4.1 Discs The following is a presentation of the results from the heat treatment experiment with the steel discs described in Chapter 3.3.
4.1.1 Microstructure Micrographs of the disc samples as well as the extra samples are shown in Figures 4.1 to 4.9. Let us first take a look at the disc samples, seen in Figures 4.1-4.4. It is difficult to tell difference between samples 1-8 as they have all been hardened (using H(0) or H(1)) before examination. However, some differences can be seen between the carbonitrided and the non-carbonitrided samples. In all of the samples which are not carbonitrided (samples 1, 3, 5 and 7), white areas that are small and round, can be seen in the micrographs. These are carbides, both primary and secondary, whose presence will be discussed in Chapter 5.1.4. Figure 4.4, samples 7 and 8 serve as a good illustration of this. Both primary and secondary carbides can be seen in the micrograph of sample 7 whereas in the micrograph for sample 8, no such carbides are visible.
Figure 4.1. Samples 1 (left) and 2 (right).
Figure 4.2. Samples 3 (left) and 4 (right).

30
Figure 4.3. Samples 5 (left) and 6 (right).
Figure 4.4. Samples 7 (left) and 8 (right). In the left image, A points to a secondary carbide and B points to a primary carbide.
Figure 4.5. Sample R, reference material.
The reference sample (Figure 4.5), shows the acicular microstructure typical of bainite as well as the same kind of carbides described earlier for samples 1, 3, 5 and 7.
In the micrographs of samples A-F, the effect on the microstructure from each process step, i.e. normalizing, soft annealing and hardening, is clearly seen. Additionally, the micrograph of sample G shows the microstructure after the initial pearlitization treatment (that preceded the experiment).
A
B

31
Figure 4.6. Samples A (left) and B (right).
Table 4.1. Figures and DoE.
Sam
ple
Nor
mal
izin
g
Soft
ann
ealin
g
Hard
enin
g
Figure 1 0 0 0 4.1 (left) 2 0 0 1 4.1 (right) 3 0 1 0 4.2 (left) 4 0 1 1 4.2 (right) 5 1 0 0 4.3 (left) 6 1 0 1 4.3 (right) 7 1 1 0 4.4 (left) 8 1 1 1 4.4 (right)
R - 1 0 4.5 (right)
A 0 4.6 (left)
B 0 0 4.6 (right)
C 0 1 4.7 (left)
D 1 4.7 (right)
E 1 0 4.8 (left) F 1 1 4.8 (right)
In the micrograph of sample A, it is obvious that the high-temperature normalizing has had a significant effect on the grain size. The continuous white areas in the image are cementite which has precipitated in the grain boundaries upon cooling from 1140°C. Since the sample was air cooled, pearlite has had time to form which can also be seen in the image (the lamellar appearance of the grains). In sample B, the effect of soft annealing can be seen. Small circular carbides are continuously distributed inside the ferrite matrix (white). Sample C (Figure 4.7) is interesting to compare to sample B as it has been through the modified soft annealing process, SA(1). Due to the higher temperature

32
at which the spheroidization has been carried out, the carbides in sample C has grown larger than those in sample B, which has been spheroidized at a lower temperature (higher temperature means higher diffusion rate). Also, in sample B, the size of the spheroidized carbides seems to be more homogeneous compared to sample C, where there seems to exist both small and large carbides. The large carbides come from the first cycle in the program, where at high temperature and fast diffusion rates they have been allowed to grow large in size. The smaller (more spherical) carbides come from the second cycle, where the cementite lamellae from the pearlite (formed during the cooling in between cycles) have been spheroidized.
Figure 4.7. Samples C (left) and D (right).
The micrograph from sample D (Figure 4.7) shows the bainitic microstructure after the N(1) treatment.
Figure 4.8. Samples E (left) and F (right).
The results of spheroidization methods SA(0) (left) and SA(1) (right) are very similar when preceded by N(1), as can be seen in Figure 4.8.

33
Figure 4.9. Microstructure of sample from the pearlitization treatment.
Figure 4.9 shows a micrograph of a sample subjected to the initial pearlitization treatment described in Chapter 3.3.4. The typical pearlitic appearance (lamellar structure of the individual grains) can be clearly seen.
4.1.2 Surface hardness The surface hardness of the discs was measured before cutting and preparing samples for microindentation hardness measurements and microscopy. These initial hardness measurements were used in combination with the results from the residual stress measurements on the same samples (see Chapter 4.1.4) as a screening for further investigation and profiling. The hardness results are presented in Figure 4.10.
Figure 4.10. Surface hardness of discs.
After the initial screening, using the hardness values from Figure 4.10 in combination with the residual stress values given in Chapter 4.1.4, samples were prepared (as described in Chapter 3.5),
1 2 3 4 5 6 7 8 R 58.5
59.0
59.5
60.0
60.5
61.0
61.5
62.0
62.5
63.0
63.5
Hard
ness
, [HR
C]
Disc
Surface hardness of discs

34
and the microhardness was measured on samples one and six (the samples with the best and worst estimated fatigue limit).
4.1.3 Microindentation hardness The microindentation hardness was measured at six different depths on samples one and six and is given in Figure 4.11 below. The values are mean values calculated from four different measurements at each depth. Error bars show the standard deviation.
Figure 4.11. Microhardness data for samples 1 and 6.
As can be seen in Figure 4.11, there is some variation of the hardness with depth from the surface. This variation as well as the variation in residual stress is discussed in Chapter 5.1.3.
4.1.4 Residual stress The residual stress was measured at 150 µm depth from the surface for all discs. The results from these measurements are given in Figure 4.12.
715.0
720.0
725.0
730.0
735.0
740.0
745.0
750.0
755.0
760.0
765.0
50µm 100µm 150µm 200µm 250µm 300µm 350µm 400µm
Hard
ness
, [HV
0.5]
Depth from surface
Microhardness, discs 1 and 6
Disc 1
Disc 6

35
Figure 4.12. Residual stress data for discs 1-8 and R.
The second round of measurements was carried out on discs one and six, on the same depths as for the microhardness measurements (50, 100, 150, 200, 300 and 400 µm). The results from these measurements are given in Figure 4.13. Error bars show the standard deviation.
Figure 4.13. Residual stress data for discs 1 and 6.
1 2 3 4 5 6 7 8 R
-300.00
-250.00
-200.00
-150.00
-100.00
-50.00
0.00
Resi
dual
stre
ss, [
MPa
]
Disc
Residual stress of discs
-350.0
-300.0
-250.0
-200.0
-150.0
-100.0
-50.0
0.050µm 100µm 150µm 200µm 250µm 300µm 350µm 400µm
Resi
dual
stre
ss, [
MPa
]
Depth from surface
Residual stress, discs 1 and 6
Disc 1
Disc 6
36
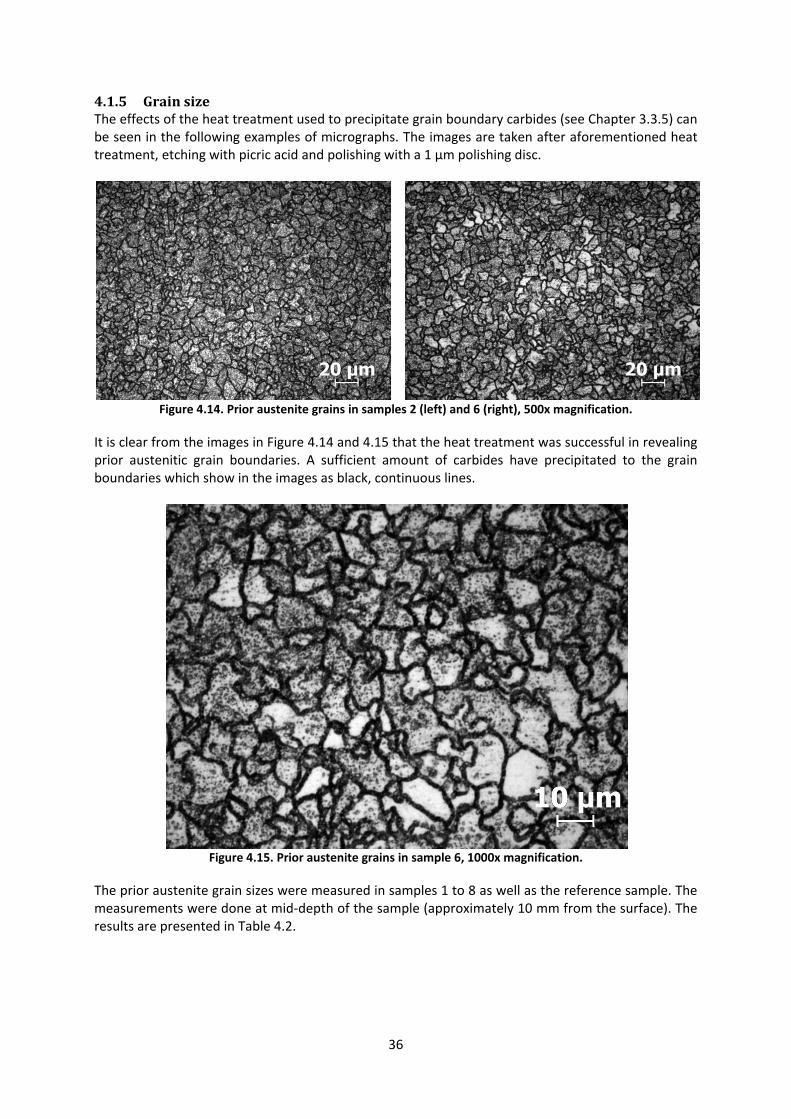
4.1.5 Grain size The effects of the heat treatment used to precipitate grain boundary carbides (see Chapter 3.3.5) can be seen in the following examples of micrographs. The images are taken after aforementioned heat treatment, etching with picric acid and polishing with a 1 µm polishing disc.
Figure 4.14. Prior austenite grains in samples 2 (left) and 6 (right), 500x magnification.
It is clear from the images in Figure 4.14 and 4.15 that the heat treatment was successful in revealing prior austenitic grain boundaries. A sufficient amount of carbides have precipitated to the grain boundaries which show in the images as black, continuous lines.
Figure 4.15. Prior austenite grains in sample 6, 1000x magnification.
The prior austenite grain sizes were measured in samples 1 to 8 as well as the reference sample. The measurements were done at mid-depth of the sample (approximately 10 mm from the surface). The results are presented in Table 4.2.
37
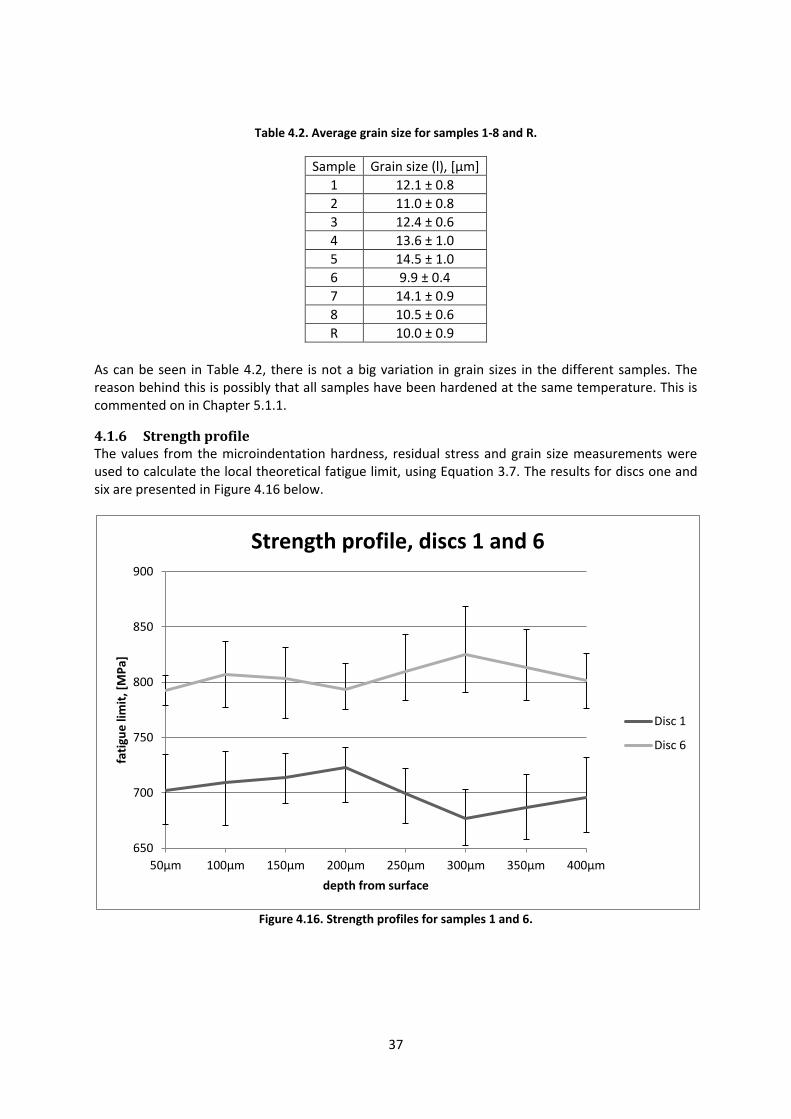
Table 4.2. Average grain size for samples 1-8 and R.
Sample Grain size (l), [µm] 1 12.1 ± 0.8 2 11.0 ± 0.8 3 12.4 ± 0.6 4 13.6 ± 1.0 5 14.5 ± 1.0 6 9.9 ± 0.4 7 14.1 ± 0.9 8 10.5 ± 0.6 R 10.0 ± 0.9
As can be seen in Table 4.2, there is not a big variation in grain sizes in the different samples. The reason behind this is possibly that all samples have been hardened at the same temperature. This is commented on in Chapter 5.1.1.
4.1.6 Strength profile The values from the microindentation hardness, residual stress and grain size measurements were used to calculate the local theoretical fatigue limit, using Equation 3.7. The results for discs one and six are presented in Figure 4.16 below.
Figure 4.16. Strength profiles for samples 1 and 6.
650
700
750
800
850
900
50µm 100µm 150µm 200µm 250µm 300µm 350µm 400µm
fatig
ue li
mit,
[MPa
]
depth from surface
Strength profile, discs 1 and 6
Disc 1
Disc 6
38
4.1.7 Minitab analysis The following chapter includes the results from the Minitab analysis of the DoE.
4.1.7.1 Main effects plots The main effects plots show how the different heat treatments and their variations affect the material properties (i.e. hardness, residual stress and grain size) individually.
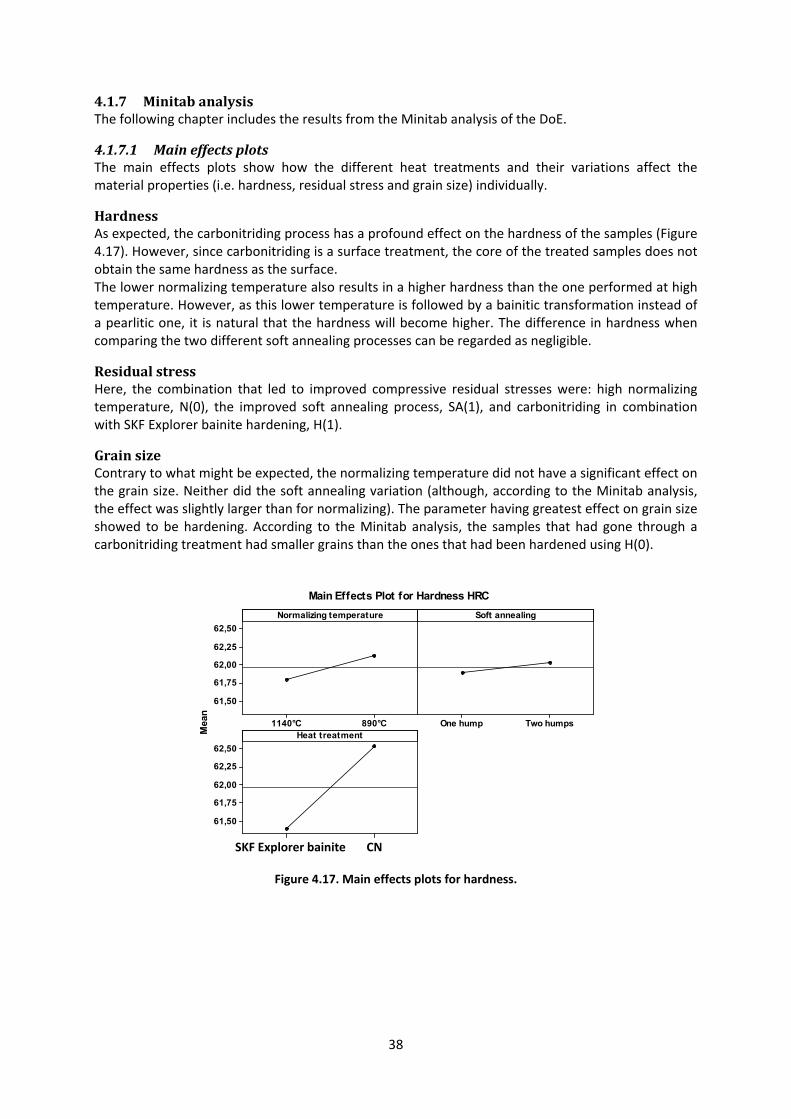
Hardness As expected, the carbonitriding process has a profound effect on the hardness of the samples (Figure 4.17). However, since carbonitriding is a surface treatment, the core of the treated samples does not obtain the same hardness as the surface. The lower normalizing temperature also results in a higher hardness than the one performed at high temperature. However, as this lower temperature is followed by a bainitic transformation instead of a pearlitic one, it is natural that the hardness will become higher. The difference in hardness when comparing the two different soft annealing processes can be regarded as negligible.
Residual stress Here, the combination that led to improved compressive residual stresses were: high normalizing temperature, N(0), the improved soft annealing process, SA(1), and carbonitriding in combination with SKF Explorer bainite hardening, H(1).
Grain size Contrary to what might be expected, the normalizing temperature did not have a significant effect on the grain size. Neither did the soft annealing variation (although, according to the Minitab analysis, the effect was slightly larger than for normalizing). The parameter having greatest effect on grain size showed to be hardening. According to the Minitab analysis, the samples that had gone through a carbonitriding treatment had smaller grains than the ones that had been hardened using H(0).
SKF Explorer bainite CN
Figure 4.17. Main effects plots for hardness.
890°C1140°C
62,50
62,25
62,00
61,75
61,50
Two humpsOne hump
62,50
62,25
62,00
61,75
61,50
Normalizing temperature
Mea
n
Soft annealing
Heat treatment
Main Effects Plot for Hardness HRC

39
SKF Explorer bainite CN
Figure 4.18. Main effects plots for residual stress.
SKF Explorer bainite CN
Figure 4.19. Main effects plots for grain size.
4.1.7.2 Cube plots A cube plot visualizes how all three parameters interact. Each corner of the cube represents a combination of the different parameter settings (the eight possible variants in the DoE).
Hardness For maximum hardness, the following parameter settings was the best combination; the low normalizing temperature (N(1)), one cycle soft annealing (SA(0)) and carbonitriding + SKF Explorer bainite hardening (H(1)). Here the carbonitriding is the dominating factor (only small variations when varying the other parameters, as can be seen when reviewing the different corners of the far side of the cube (Figure 4.20).
890°C1140°C
- 180
- 190
- 200
- 210Two humpsOne hump
- 180
- 190
- 200
- 210
Normalizing temperature
Mea
n
Soft annealing
Heat treatment
Main Effects Plot for Residual stress
890°C1140°C
13,0
12,5
12,0
11,5
11,0Two humpsOne hump
13,0
12,5
12,0
11,5
11,0
Normalizing temperature
Mea
n
Soft annealing
Heat treatment
Main Effects Plot for Grain size

40
Figure 4.20. Cube plot for hardness.
Residual stress The best combination of parameter variants to attain maximum compressive residual stress is; High normalizing temperature (N(0)), the two cycle soft annealing (SA(1)) and standard SKF Explorer bainite hardening (H(0)).
Figure 4.21. Cube plot for residual stress.
C
41
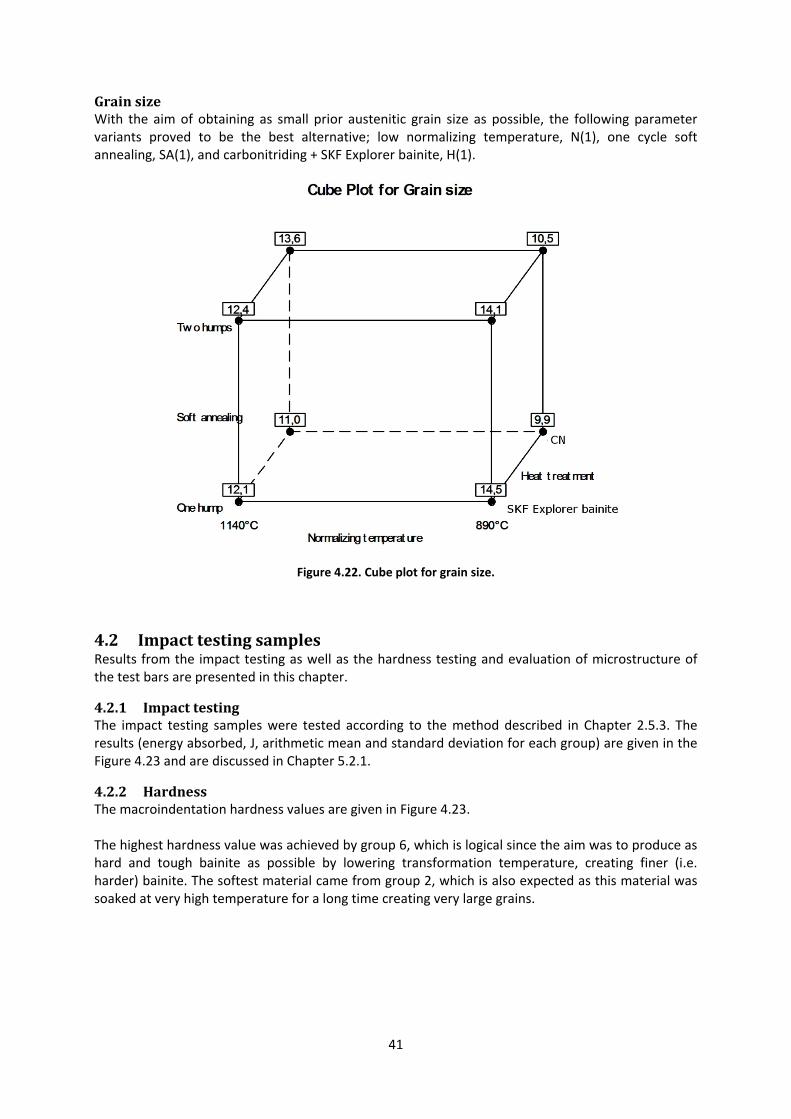
Grain size With the aim of obtaining as small prior austenitic grain size as possible, the following parameter variants proved to be the best alternative; low normalizing temperature, N(1), one cycle soft annealing, SA(1), and carbonitriding + SKF Explorer bainite, H(1).
Figure 4.22. Cube plot for grain size.
4.2 Impact testing samples Results from the impact testing as well as the hardness testing and evaluation of microstructure of the test bars are presented in this chapter.
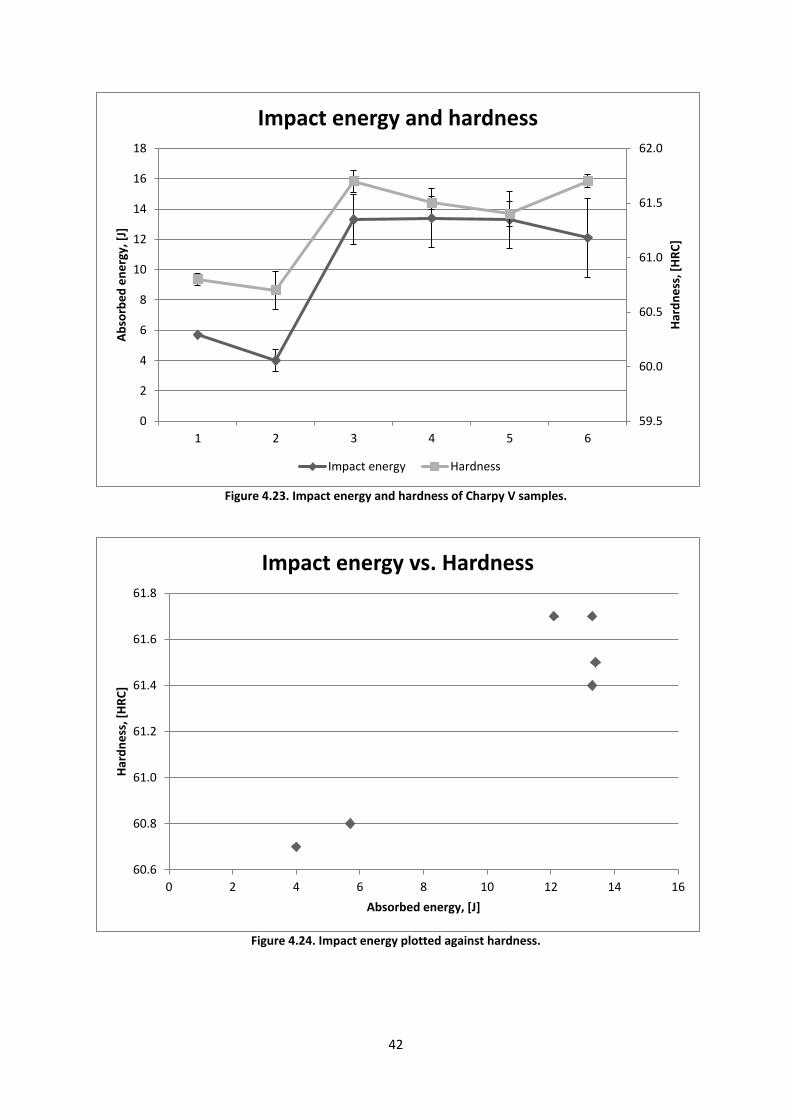
4.2.1 Impact testing The impact testing samples were tested according to the method described in Chapter 2.5.3. The results (energy absorbed, J, arithmetic mean and standard deviation for each group) are given in the Figure 4.23 and are discussed in Chapter 5.2.1.
4.2.2 Hardness The macroindentation hardness values are given in Figure 4.23. The highest hardness value was achieved by group 6, which is logical since the aim was to produce as hard and tough bainite as possible by lowering transformation temperature, creating finer (i.e. harder) bainite. The softest material came from group 2, which is also expected as this material was soaked at very high temperature for a long time creating very large grains.
42
Figure 4.23. Impact energy and hardness of Charpy V samples.
Figure 4.24. Impact energy plotted against hardness.
59.5
60.0
60.5
61.0
61.5
62.0
0
2
4
6
8
10
12
14
16
18
1 2 3 4 5 6
Hard
ness
, [HR
C]
Abso
rbed
ene
rgy,
[J]
Impact energy and hardness
Impact energy Hardness
60.6
60.8
61.0
61.2
61.4
61.6
61.8
0 2 4 6 8 10 12 14 16
Hard
ness
, [HR
C]
Absorbed energy, [J]
Impact energy vs. Hardness

43
4.2.3 Microstructure The microstructure of the impact test bars are showed in the following section. Figure 4.25 shows micrographs of samples from groups 1 and 2. Interesting here are the images of sample 2 (Figures 4.25 and 4.26) showing that the sample has obtained very large grains during its pre-treatment (heating to 1140°C and holding for 11 hours). Because of the long time at high temperature, the grains have been allowed to grow to extremely large sizes. A result of these large grains is, naturally, a small total grain boundary area, which in turn leads to that the grain boundaries are very rich in solute (i.e. more solute per grain boundary area unit). The same effect could not be seen in sample one, which had been heated to the same temperature but had been cooled directly, not allowing for the same amount of grain enlargement and grain boundary segregation.
Figure 4.25. Samples 1 (left) and 2 (right).
Figure 4.26. Sample 2, 50x magnification, showing the very large (prior austenitic) grains.
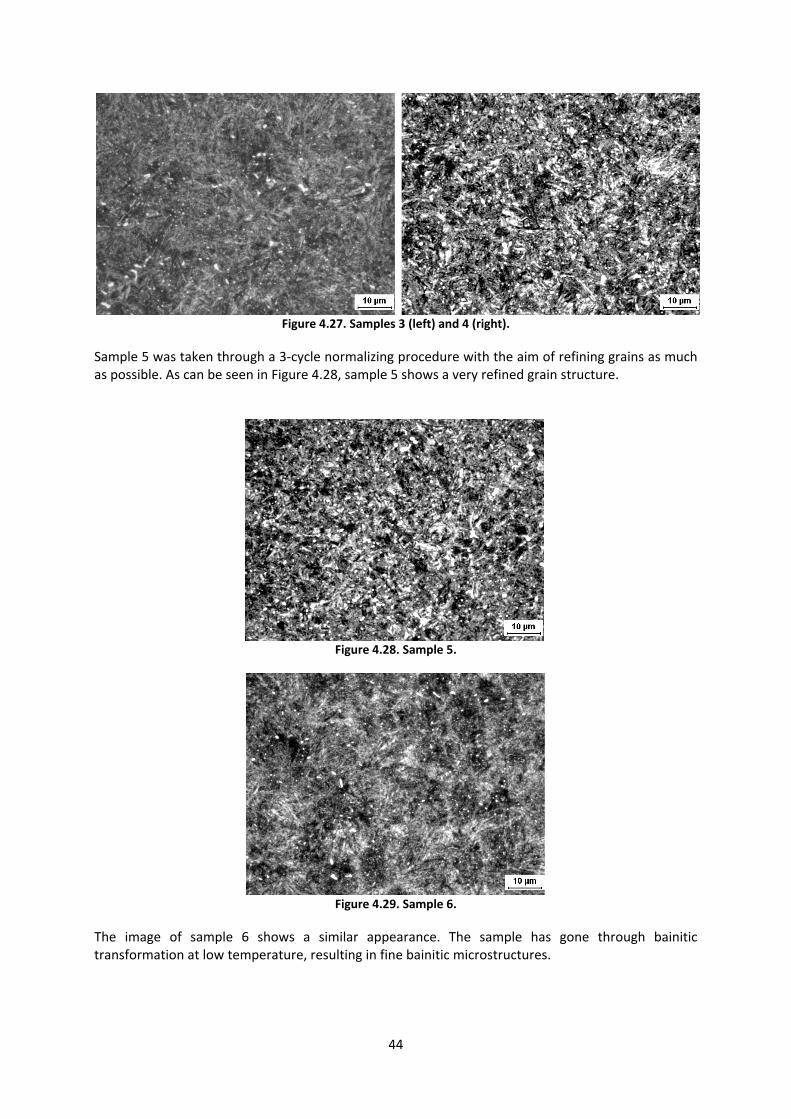
Sample 3 (Figure 4.27) was hardened by means of SKF Explorer bainite treatment, without any pre-treatments. Sample 4 (Figure 4.27) was run through an extra normalizing step (N(1)) before hardening with the ambition of refining the grain size. The micrograph of sample 4 appears to show somewhat finer structure than that of sample 3.
44
Figure 4.27. Samples 3 (left) and 4 (right).
Sample 5 was taken through a 3-cycle normalizing procedure with the aim of refining grains as much as possible. As can be seen in Figure 4.28, sample 5 shows a very refined grain structure.
Figure 4.28. Sample 5.
Figure 4.29. Sample 6.
The image of sample 6 shows a similar appearance. The sample has gone through bainitic transformation at low temperature, resulting in fine bainitic microstructures.

45
4.3 Rotating bending fatigue testing The results from testing of the RBF beams are presented in the following chapter.
4.3.1 Rotating bending testing The RBF beams were run two million revolutions at 1060 MPa and only 1 out of 10 failed during the test. The result is impressive, showing a considerable increase in survival rate when comparing to previously run samples of the same steel grade [17].
Figure 4.30. RBF comparison between CN and SKF Explorer bainite samples. 9 out of 10 carbonitrided
samples were run 2 million revolutions without fracturing. Fatigue data for SKF Explorer bainite from [17].
Figure 4.31. Failure probability plot based on 10 samples from each group. Fatigue data for SKF Explorer
bainite from [17].
0
1
2
Revo
lutio
ns, [
Mre
vs]
Carbonitrided
SKF Explorer bainite
0
20
40
60
80
100
0 0.5 1 1.5 2
Prob
abili
ty o
f fai
lure
, [%
]
Cycles to failure, [Mrevs]
Probability of failure at 1060MPa based on ten RBF samples for each series
SKF Explorer bainite
CN + SKF Explorer bainite
runout for 9 out of 10 samples

46
4.3.2 Examination of the RBF bars Evaluation of hardness, residual stress and microstructure was carried out on a reference RBF beam. The results are listed in the following sections.
4.3.3 Hardness and residual stress The beam was tested for surface hardness and residual stress to be able to calculate the theoretical fatigue limit using Equation 3.7. The result from the measurements is given in Table 4.3.
Table 4.3. Hardness and residual stress values for RBF beam.
Hardness, [HRC] #1 60.1 #2 60.7 #3 62.0
mean 60.9 Residual stress, [MPa]
#1 -239 #2 -248
mean -243
With an estimated grain size set to 10 µm, the theoretical fatigue limit becomes 779 MPa using Equation 3.7.
4.3.4 Microindentation hardness testing A hardness profile was constructed for the carbonitrided test beam. The resulting graph (Figure 4.32) illustrates the high hardness at the surface of the sample and that hardness decreases with increasing distance from the surface.
Figure 4.32. Hardness profile for RBF beam.
675
680
685
690
695
700
705
710
715
720
725
50 550 1050 1550 2050 2550
Hard
ness
, [HV
0.5]
Depth from surface, [µm]
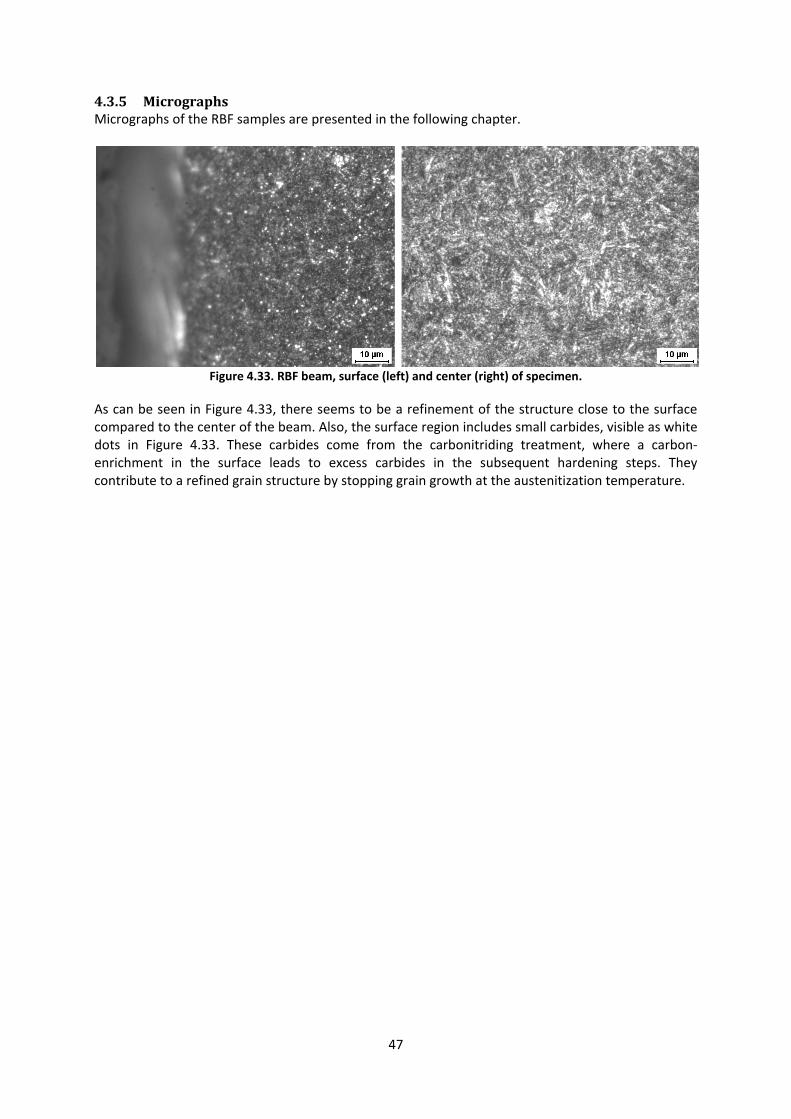
47
4.3.5 Micrographs Micrographs of the RBF samples are presented in the following chapter.
Figure 4.33. RBF beam, surface (left) and center (right) of specimen.
As can be seen in Figure 4.33, there seems to be a refinement of the structure close to the surface compared to the center of the beam. Also, the surface region includes small carbides, visible as white dots in Figure 4.33. These carbides come from the carbonitriding treatment, where a carbon-enrichment in the surface leads to excess carbides in the subsequent hardening steps. They contribute to a refined grain structure by stopping grain growth at the austenitization temperature.

48

49
5 Discussion 5.1 Discs
5.1.1 Grain size As expected, the normalizing procedure thought to emulate reheating during rolling at the steel plant, N(0), produced very large grains. However, in real production, the deformation during rolling will lead to recrystallization and thus not end up in large grains. In the present case, the average grain size of the finished steels (measured after the complete heat treatment sequence) was not larger than the median size for the steels that had gone through the low-temperature normalizing N(1). This implies that the heat treatments carried out after normalizing, namely soft annealing and hardening, will nullify the increase in grain size from normalizing. The hardening methods used was found to have an impact on grain size, therefore also on the fatigue life of the bearing steel. The carbonitrided samples had a smaller average grain size compared to the samples that were hardened using standard SKF Explorer bainite hardening. This has to do with the higher amount of nucleation points (carbides and nitrides) in the carbonitrided samples. Similar results have been attained by Ooki et al. [14]. The variation in grain sizes in samples 1-8 was rather low, ranging from 9.9 µm (sample 6) to 14.5 µm (sample 5). The reason behind this is most likely that all of the samples have gone through the same hardening treatment, with the same, relatively high, austenitization temperature. If, for future experiments, this temperature could be modified to lower levels, the grain size could possibly be decreased as well. The potential strength increase in further reducing the grain size can be estimated by using Equation 3.7. For example, if grain size of sample 6 were to be decreased from 9.9 µm to 5.0 µm, not changing hardness and residual stress data (using values from Figures 4.11 and 4.13, at 50 µm depth from surface), the estimated fatigue limit would increase from 792 MPa to 969 MPa, a significant increase. The heat treatment method described in Chapter 3.3.5 used to prepare samples for grain size measurements was very successful. In the micrographs taken after etching with picric acid, the prior austenite grain boundaries were clearly visible and grains could easily be measured.
5.1.2 Hardness The average surface hardness of the carbonitrided samples compared to the non-carbonitrided ones increased by approximately 1 HRC. All of the carbonitrided samples reached a surface hardness exceeding 62 HRC. No significant difference in hardness was reported for the other parameter variations.
5.1.3 Residual stress and strength profile When measuring residual stresses as far from the surface as in this experiment, it is difficult to know whether or not the desired depth has been reached by the etching operation. This is mainly due to the many variables and factors of uncertainty involved in etching, such as uneven etching of material (e.g. due to the different reactions of different microconstituents to the etchant, repeated manual positioning of the etching equipment etc.). This will not affect the fact that fatigue properties vary, however it may produce data which is not valid for the depth specified. There are other ways of performing residual stress measurements where the depth of the measuring hole can be defined more precisely although no such methods are described nor used in this work. The difference in hardness along the measured distance (for the strength profile) is due to a number of factors, some examples are listed here:

50
• Size and distribution of carbides (an indentation made in a carbide-rich area is likely to register a higher hardness value than if made in a area of softer matter, for example ferrite).
• Dislocation density. • Morphology of pearlite/bainite/martensite. With varying morphology of the
microconstituents comes varying properties in terms of strength, hardness etc. • Relative amount of microconstituents. With varying amounts of the different
microconstituents (having different properties) in different regions, this factor will play a large role in the measured data.
The variation in residual stress over the cross section of a heat treated material can be due to uneven heating and/or cooling and is also very dependent on the geometry of the heat treated sample which has a great impact on the temperature gradient during heating/cooling. Also, different microconstituents have different densities which make residual stress dependent on the relative amount of the different microconstituents in the volume (which in turn is dependent on the heating/cooling cycles used). Due to the large measurement errors (accumulated from the hardness-, residual stress- and grain size measurements) in the strength profile (Figure 4.16), it is difficult to draw any conclusions about the variation of strength over the measured depth of the discs. More accurate measurement methods are required for the construction of a reliable strength profile.
5.1.4 Other observations Primary and secondary carbides can be seen in figures 4.1 to 4.5. The temperature has not been high enough during austenitization to put all carbon in solid solution and at the austenitization temperature used for the hardening cycle in this experiment (H(0)), a portion of the carbon will not go into solid solution but will remain as carbides. These carbides, called secondary carbides, are the small and circular areas in the micrographs. In the carbonitriding cycle, the temperature is high enough to force almost all carbon into solid solution which is why carbides are not seen in the micrographs of carbonitrided samples (figures 4.1 to 4.4) to the same extent. Primary carbides can also be seen in the images. They are characterized by a more uneven geometry and are larger than the secondary carbides. This type of carbide is formed during the primary production stage (i.e. in steel manufacturing). It is very stable and does not dissolve into the matrix upon heat treatment.
5.2 Impact testing samples
5.2.1 Impact testing For groups 3 to 6, there is no greater variation in absorbed energy with results ranging from 12 to 13 Joules (Figure 4.23). The toughness is not higher for test bars with finer bainite (group 6). However, for groups 1 and 2 there is a significant decrease in toughness compared to groups 3 to 6 which is most likely due to the increased grain size and grain boundary segregation of those samples. As can be seen in Figure 4.23 and 4.24, there seems to be no linear relationship between hardness and absorbed energy of the test bars. Also, for increased hardness, there is no substantial decrease in toughness.
5.2.2 Hardness The ambition of increasing the hardness of group 6 by using prolonged bainitic transformation times at lower temperature (relative to SKF Explorer bainite treatment) showed unsuccessful. While exhibiting relatively high hardness, the samples of this group are not harder than those of the reference group (treated according to SKF Explorer bainite hardening). The tested samples from groups 1 and 2 have the lowest hardness values in the experiment with number 2. The sample from

51
group 2 also exhibited very large grains which points to the well known fact that with increasing prior austenite grain size, the hardness decreases (Hall-Petch relation [16]).
5.2.3 Microstructure As mentioned earlier, sample 2 exhibited extremely large grains (on the mm-scale) and substantial grain boundary segregation. This is due to the prolonged time at high temperature where austenite grains have been allowed to grow without the effect of grain boundary pinning (all carbon is in solid solution at the temperature used in the heat treatment of group 2, no excess carbides will stop austenite growth by pinning the grain boundaries). The same effects cannot be seen in the micrographs of sample 1 which has been heated to the same temperature but was cooled directly afterwards. This shows that time at temperature plays an important role in deciding material properties.
5.2 Rotating bending fatigue testing The idea of confirming the results from the disc experiment (where the carbonitrided discs exhibited significantly increased theoretical fatigue lifes) via RBF testing of carbonitrided beams showed successful. The fact that 9 out of 10 beams survived all 2 million cycles at the high load applied (1060 MPa) indicates that carbonitriding can potentially be used for this steel/application with good results.

52

53
6 Conclusions The main conclusions after the different heat treatment experiments, testing and evaluation are presented in the following list:
• Carbonitriding increases surface hardness, hence fatigue life of treated specimens. This was also confirmed with the RBF test.
• The heating cycles involved in carbonitriding also seem to have an effect on grain size of steel, decreasing it slightly.
• Further reduction of grain size would increase fatigue life of the steel substantially. • Austenitization temperatures in the hardening treatments of the experiments were too high
to obtain a really small grain size, hence limiting the potential of reaching very high fatigue limits.
• Normalizing at high temperature for extended periods of time (as was done with one of the impact testing samples) is detrimental to material properties such as hardness and impact toughness.
• The heat treatment method described in Chapter 3.3.5 reveals prior austenite grain boundaries clearly and is a good method for measuring grain size.
• None of the heat treatments used for the impact testing bars produced higher hardness values than the reference.
• Impact toughness is not compromised when increasing hardness of bainite. • Bainite toughness does not increase with refinement of the bainitic microstructure.

54

55
7 Recommendations The following is a list of suggestions for future work.
• Carry out hardening treatments with reduced austenitization temperatures to decrease grain size hence increasing fatigue life.
• Since some of the samples from the impact testing experiment appeared to have obtained very fine-grained structures and relatively high hardness values, it would be interesting to measure prior austenite grain size and residual stress on selected samples. If this is done, strength profiling can be carried out on these specimens as well.
• The constants in the equation that was used for strength profiling were derived from experiments with another type of steel than the one used in this project. It would therefore make sense to construct a similar equation but with SKF specific (or steel grade specific) constants, derived from experiments on the steel in question.
• Carry out staircase testing on RBF samples of the same type as in this work. Produce a Wöhler-curve from these results and compare the fatigue life to the one obtained from the theoretical model used in this project.
• Carry out measurements of residual stress using a more precise method to reduce the error of the subsequent strength profile.

56
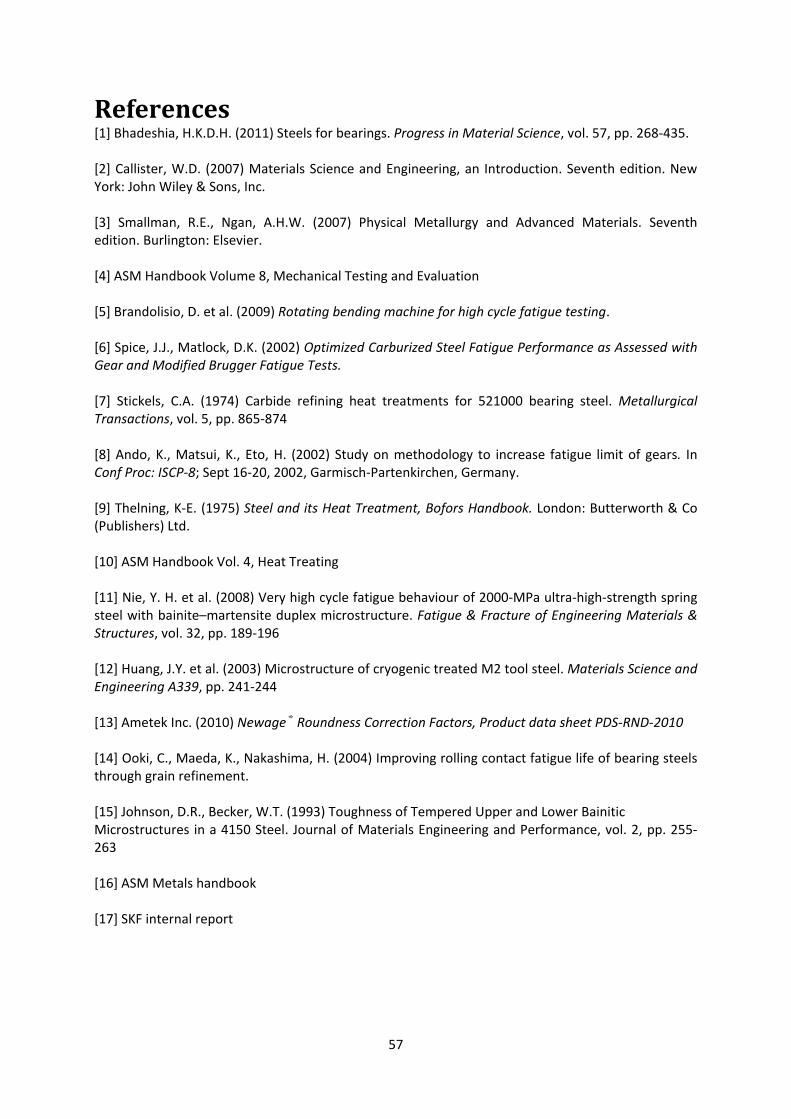
57
References [1] Bhadeshia, H.K.D.H. (2011) Steels for bearings. Progress in Material Science, vol. 57, pp. 268-435. [2] Callister, W.D. (2007) Materials Science and Engineering, an Introduction. Seventh edition. New York: John Wiley & Sons, Inc. [3] Smallman, R.E., Ngan, A.H.W. (2007) Physical Metallurgy and Advanced Materials. Seventh edition. Burlington: Elsevier. [4] ASM Handbook Volume 8, Mechanical Testing and Evaluation [5] Brandolisio, D. et al. (2009) Rotating bending machine for high cycle fatigue testing. [6] Spice, J.J., Matlock, D.K. (2002) Optimized Carburized Steel Fatigue Performance as Assessed with Gear and Modified Brugger Fatigue Tests. [7] Stickels, C.A. (1974) Carbide refining heat treatments for 521000 bearing steel. Metallurgical Transactions, vol. 5, pp. 865-874 [8] Ando, K., Matsui, K., Eto, H. (2002) Study on methodology to increase fatigue limit of gears. In Conf Proc: ISCP-8; Sept 16-20, 2002, Garmisch-Partenkirchen, Germany. [9] Thelning, K-E. (1975) Steel and its Heat Treatment, Bofors Handbook. London: Butterworth & Co (Publishers) Ltd. [10] ASM Handbook Vol. 4, Heat Treating [11] Nie, Y. H. et al. (2008) Very high cycle fatigue behaviour of 2000-MPa ultra-high-strength spring steel with bainite–martensite duplex microstructure. Fatigue & Fracture of Engineering Materials & Structures, vol. 32, pp. 189-196 [12] Huang, J.Y. et al. (2003) Microstructure of cryogenic treated M2 tool steel. Materials Science and Engineering A339, pp. 241-244 [13] Ametek Inc. (2010) Newage® Roundness Correction Factors, Product data sheet PDS-RND-2010 [14] Ooki, C., Maeda, K., Nakashima, H. (2004) Improving rolling contact fatigue life of bearing steels through grain refinement. [15] Johnson, D.R., Becker, W.T. (1993) Toughness of Tempered Upper and Lower Bainitic Microstructures in a 4150 Steel. Journal of Materials Engineering and Performance, vol. 2, pp. 255-263 [16] ASM Metals handbook [17] SKF internal report