effect of hydrogen on the benefit of warm prestressing · effect of hydrogen on the benefit of warm...
TRANSCRIPT

SINTAP/TWI/2188269/2/98
SEPTEMBER 1998
EFFECT OF HYDROGEN ON THEBENEFIT OF WARM
PRESTRESSING
For: SINTAP

Report No: 88269/2/98Copyright © TWI 1998
EFFECT OF HYDROGEN ON THE BENEFIT OF WARMPRESTRESSING
TWI REPORT NO: 88269/2/98SEPTEMBER 1998
Prepared for: SINTAP
Contact: Dr R A AinsworthNuclear Electric Ltd
Prepared by: Dr A MuhammedStructural Integrity Department

EFFECT OF HYDROGEN ON THE BENEFIT OF WARM PRESTRESSING
Report No: 88269/2/98Copyright © TWI 1998
NOMENCLATURE
CTOD Crack tip opening displacement
K Stress intensity factor
Kc Baseline fracture toughness in the absence of warm prestressing
Kf Predicted final fracture toughness after warm prestressing
Kmat Final fracture toughness after warm prestressing
K1 Pre-load K
SENB Single edge notch bend specimen
WPS Warm prestressing
σY1 Yield strength at pre-load temperature
σY2 Yield strength at final fracture temperature

EFFECT OF HYDROGEN ON THE BENEFIT OF WARM PRESTRESSING
Report No: 88269/2/98Copyright © TWI 1998
CONTENTS
EXECUTIVE SUMMARY iBackground iWork Undertaken iMain Conclusions i
1. INTRODUCTION 1
2. EXPERIMENTAL PROGRAMME 1
2.1. G ENERAL 1
2.2. M ATERIALS 2
2.3. S PECIMEN PREPARATION AND HYDROGEN CHARGING 22.3.1. Tests at -100 °C 22.3.2. Tests at -170 °C 3
2.4. S PECIMEN PRELOADING 3
2.5. F RACTURE TOUGHNESS TESTING 3
2.6. H YDROGEN ANALYSIS 4
3. ANALYSIS OF TEST DATA 4
4. RESULTS AND DISCUSSION 5
4.1. H YDROGEN CONTENT 5
4.2. B ASE FRACTURE TOUGHNESS AND HYDROGEN EFFECT 5
4.3. C OMBINED EFFECT OF WARM PRESTRESS AND HYDROGEN 6
5. CONCLUSIONS 7
6. REFERENCES 8
TABLES AND FIGURESAPPENDICES

EFFECT OF HYDROGEN ON THE BENEFIT OF WARM PRESTRESSING
Report No: 88269/2/98 Page iCopyright © TWI 1998
EXECUTIVE SUMMARY
Background
The beneficial effect of warm prestressing (WPS) on subsequent fracture behaviourhas been extensively investigated. However, much of the investigations do notconsider the effect of in-service degradation such as hydrogen embrittlement. It isknown that hydrogen has the effect of reducing fracture resistance, but theinteraction of this effect with warm prestressing is not clear. The primary objectiveof this work is to determine the effect of hydrogen embrittlement on the benefit ofwarm prestressing.
Work Undertaken
Fracture toughness tests were carried out on specimens prepared from A533Bpressure vessel steel. Some of these were tested in the as-received condition, whileothers were tested after hydrogen charging or proof loading or both. The testsconducted without proof loading were used to establish the baseline toughness,which was then compared with the corresponding results after proof loading. Thegeneral trends of experimental results were established. Also, the measuredtoughness values were compared with those obtained from theoretical WPSpredictive models.
Main Conclusions
The following conclusions were drawn from comprehensive analyses of the testresults:
• Hydrogen charging reduced the baseline fracture toughness of the material. TheCTOD was on average reduced by 35% while the reduction in K was smaller atabout 9%, for tests carried out at -100°C.
• Significant benefit of warm prestressing was observed in both uncharged andcharged specimens at -170°C. The results suggest that most of the WPS benefit(up to 90% of Kmat in these tests) is retained after hydrogen charging. However,the proof load levels used in the tests carried out at -100°C were too low to giveany significant residual benefit after hydrogen charging.
• The accuracy of WPS predictive models appears to be slightly affected byhydrogen charging. In general, the level of conservatism in the predictions wereless for charged specimens than for uncharged ones. However, the predictionsfor both uncharged and hydrogen-charged specimens were on averageconservative.
• Overall, the results suggest that existing theoretical models may be used topredict fracture toughness even after exposure to hydrogen. However, it shouldbe recognised that the margins on these predictions may be slightly reducedcompared to the cases without hydrogen effects. Using reduced baselinetoughness values and the appropriate yield properties for the hydrogen-embrittled state should maintain good safety margins in the predictions.

EFFECT OF HYDROGEN ON THE BENEFIT OF WARM PRESTRESSING
Report No: 88269/2/98 Page 1Copyright © TWI 1998
1. INTRODUCTION
The beneficial effect of warm prestressing (WPS) on subsequent fracture behaviourhas been extensively investigated. However, much of the investigations do notconsider the effect of in-service degradation such as hydrogen embrittlement. It isknown that hydrogen has the effect of reducing fracture resistance, but theinteraction of this effect with warm prestressing is not clear. The primary objectiveof this work is to determine the effect of hydrogen embrittlement on the benefit ofwarm prestressing.
Fracture toughness tests were carried out on specimens prepared from A533Bpressure vessel steel. Some of these were tested in the as-received condition, whileothers were tested after hydrogen charging or proof loading or both. The testsconducted without proof loading were used to establish the baseline toughness,which was then compared with the corresponding results after proof loading. Thegeneral trends of experimental results were established. Also, the measuredtoughness values were compared with those obtained from theoretical WPSpredictive models.
2. EXPERIMENTAL PROGRAMME
2.1. GENERAL
The test programme was carried out in two phases. In the first, a total of 25 Bx2Bsingle edge notch bend (SENB) specimens were tested. The specimens were 22mmx 44mm in cross-section, extracted parallel to the rolling direction and notchedthrough the plate thickness in the L-T orientation. They were divided into five setsof five specimens. Two sets were used as control sets and were tested without proofloading, one in the as-received condition, the other after hydrogen-charging. Thesewere aimed at establishing typical baseline toughness values in the absence of proofloading (with and without hydrogen). Of the remaining three sets, one was fracturedafter proof loading while two were fractured after both proof loading and charging.The two sets of specimens receiving both proof loading and hydrogen-charging hadthe sequence of loading and charging reversed to see if the sequence had asignificant effect.
The first 25 specimens (M02) were tested at -100°C. This temperature was selectedas a compromise temperature at which the effect of hydrogen and warm prestressing(WPS) were both expected to be significant. It is well known that the largest WPSbenefits are obtained on the lower shelf where cleavage behaviour dominates (e.g.,see Ref.1-3). On the other hand, the toughness degradation effect of hydrogen ismaximum at ambient and diminishes with decreasing or increasing temperatures(see Ref 4). However, on completion of the first phase of testing, a significantnumber of specimens did not fail by cleavage. Some specimens failed aftersignificant stable crack extension while others reached maximum load withoutfracture. In order to investigate the effect of hydrogen when the full benefit of WPSis applicable, it was decided to reduce the test temperature to -170°C in the secondphase of experiments to ensure lower shelf behaviour in all specimens. A total of 15

EFFECT OF HYDROGEN ON THE BENEFIT OF WARM PRESTRESSING
Page 2
22mm x 44mm SENB specimens (M03) were tested in the second phase ofexperiments.
2.2. MATERIALS
The material selected for the experiments was an A533B Class 1 steel. This materialhas been used extensively on previous TWI projects (e.g., Ref.1) and has been wellcharacterised. The chemical analysis of the steel is reproduced in Table 1. Themicrostructure is tempered bainite with ASTM grain size between 7 and 8. Previousmechanical tests also gave the average yield strength of 506MPa and a tensilestrength of 651MPa at room temperature. The yield strength at the final testtemperature was estimated as 639MPa and 858MPa at -100°C and -170°Crespectively. Pellini drop weight tests gave a nil-ductility transition temperature of-50°C.
Other data available from previous TWI prior overload projects on A533B materialinclude Charpy and fracture toughness transition curves for different specimen andnotch orientations. The effect of different levels of proof loading on fracturetoughness (in terms of K and CTOD) was also investigated in Ref.1. This wealth ofexisting data provided a good resource for broad comparison with the results of thepresent study.
2.3. SPECIMEN PREPARATION AND HYDROGEN CHARGING
2.3.1. Tests at -100°C
The fracture toughness test pieces (B=22mm x 2B=44mm SENB) were taken fromnominally 50mm thick parent plate (TWI log Ref.2A195) and notched through thethickness, in the L-T orientation. The specimens were fatigue pre-cracked from themachined notch in accordance with the procedures given in BS 7448:Part1:1991, toan initial crack depth ratio a/W=0.5. The specimens were given TWI identificationnumbers M02-1 to M02-25, that is, parent material, M02 specimens 1-25. Thespecimens were divided into five sets as follows (Set A = 1-5, Set B = 6 – 10, Set C= 11-15, Set D = 16-20 and Set E = 21-25)
Three sets (B,C,D) of five specimens needed hydrogen charging prior to finalfracture. Corrosive charging was adopted for these specimens. The solution usedwas 5%NaCl, 0.5% acetic acid in water saturated with H2S. The use of H2S isappropriate as it may be encountered in a range of service and it is known topromote hydrogen ingress into the steel. The specimens were immersed in thesolution at room temperature for 96 hours to ensure saturation with hydrogen. Afterthe charging period, the specimens were stored in solid carbon dioxide until finalfracture tests were carried out. The specimens were thus maintained at lowtemperature to prevent hydrogen loss prior to testing.
Specimen sets B and C were charged straight after machining and fatigueprecracking, while set D was proof loaded before charging. In all cases, the notchtip was sealed with silicon rubber to prevent exposure of the crack tip to the

EFFECT OF HYDROGEN ON THE BENEFIT OF WARM PRESTRESSING
Report No: 88269/2/98 Page 3Copyright © TWI 1998
solution. It was felt that direct exposure could lead to corrosion and possibly crackblunting. This could in turn cause higher fracture toughness measurements that werenot directly attributable to the pre-load.
2.3.2. Tests at -170°C
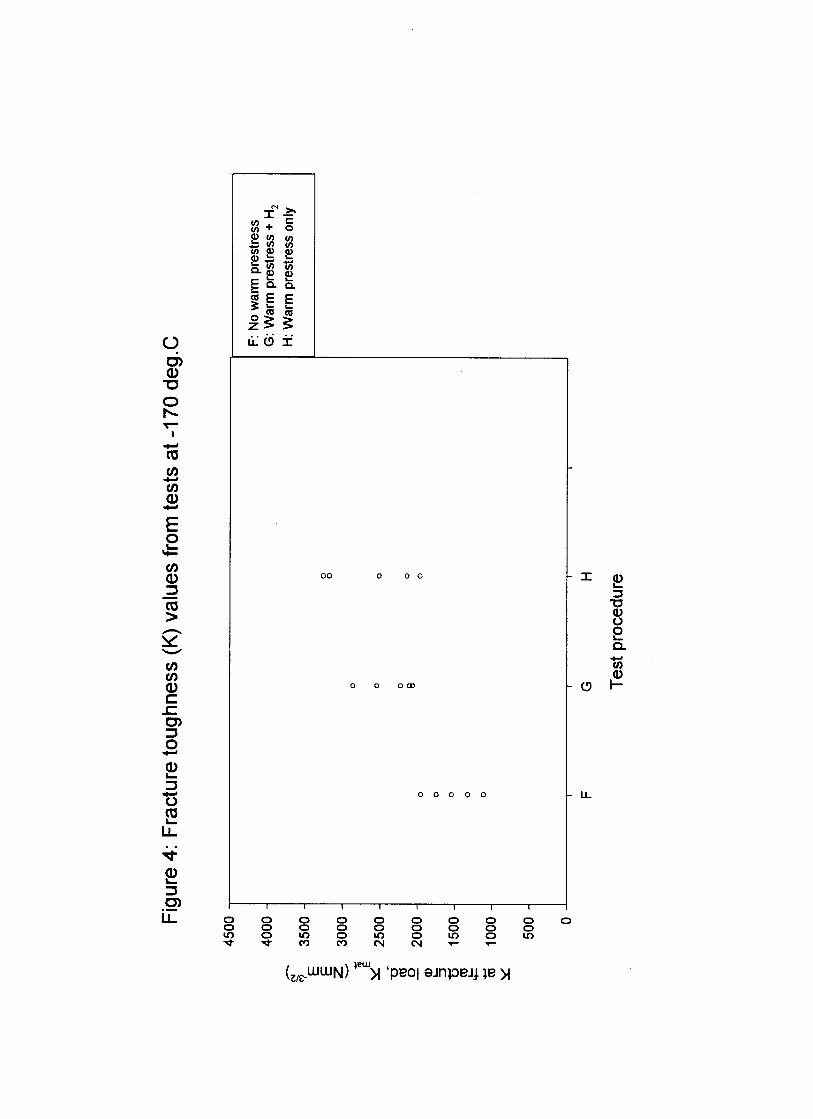
Under the second phase of experiments, a total of 15 22mm x 44mm SENBspecimens were tested. The specimens, given the TWI identification M03-1 to M03-15, were prepared largely as described above in Section 2.3.1 for the first phase.They were tested in 3 sets of five specimens. One set (F) in the as-receivedcondition, the second (set H) after proof loading and the final (set G) after proofloading and hydrogen charging.
2.4. SPECIMEN PRELOADING
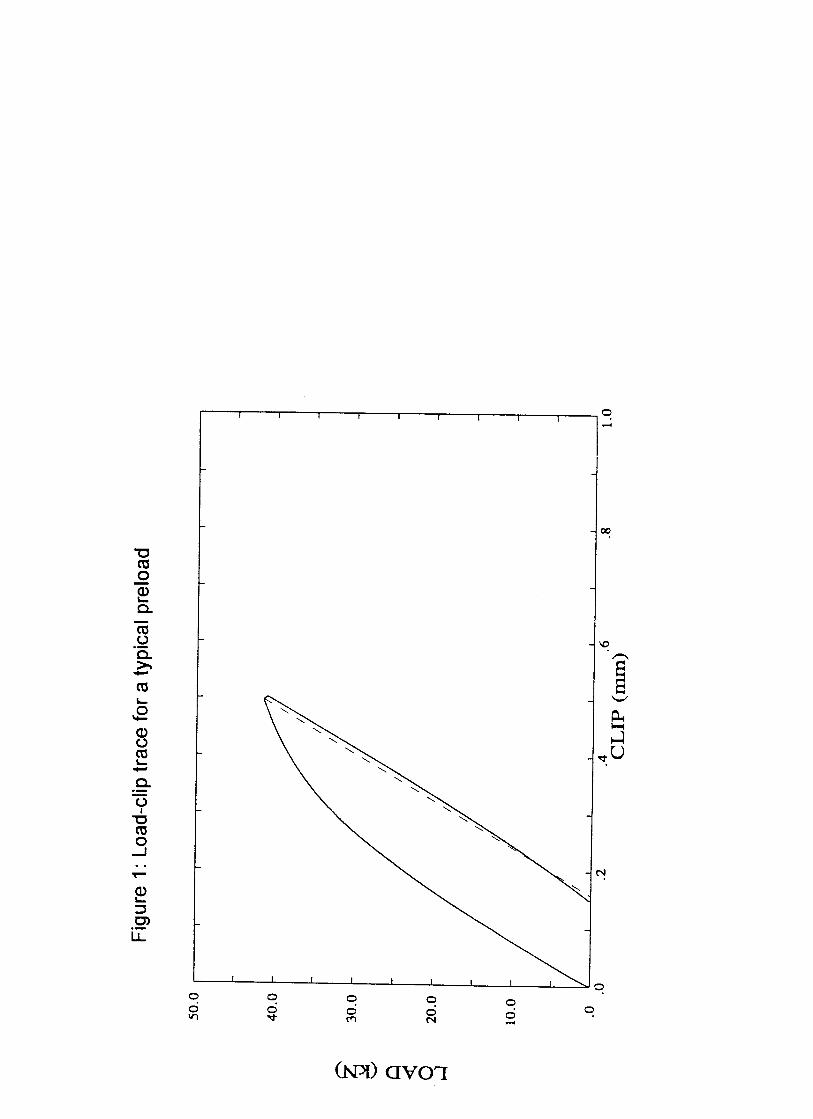
Apart from the control specimens, all specimens were preloaded at roomtemperature prior to final fracture. Each SENB specimen was instrumented with adouble clip gauge arrangement across the notch mouth. Testing was carried out in auniversal testing machine. The level of proof loading was carefully set to avoidexcessive plasticity ahead of the crack tip. For the first few specimens, the load-clipgauge trace was monitored during loading and stopped shortly after the trace beganto deviate from a linear-elastic regime (see Fig.1). This loading termination pointwas approximately achieved at a crack mouth opening displacement of about Vg =0.5mm in all specimens. This did not give a constant amount of pre-load (or K)because of the inevitable variation in actual crack depth (a/W) between specimens.
The pre-load K, CTOD and J were calculated at the maximum load applied duringthe proof loading using the equations given in BS 7448:1991. The variation in thelevel of pre-load K was approximately ±4% about an average value of 3011Nm-3/2.The specimens were fully unloaded after reaching the fixed displacement (Vg
=0.5mm) at room temperature. The loading and unloading was done at a fixeddisplacement rate of 0.50mm/min. The specimens were ultimately (some afterhydrogen charging) cooled to -100°C or -170°C and then fractured. The entiretesting cycle is commonly referred to as Load, Unload, Cool, Fracture (LUCF).
2.5. FRACTURE TOUGHNESS TESTING
As for the preloading, the double clip gauge arrangement was adopted for the finalfracture loading. The testing was broadly in line with BS 7448:1991. The unchargedspecimens were tested at a fixed displacement rate of 5.0mm/min while the chargedspecimens were tested at a displacement rate of 0.01mm/min. Based on previousexperience at TWI5, this slower strain rate was selected to ensure detection ofhydrogen embrittlement effects. Loading was steadily increased until fracture (withor without tearing) or the attainment of maximum load. Again, the fractureparameters K, CTOD and J were calculated at the fracture or maximum load.

EFFECT OF HYDROGEN ON THE BENEFIT OF WARM PRESTRESSING
Page 4
Details of the proof loading and final fracture testing are given in Appendix I. Theresults of the proof loading are identified by the letter P. For example P03 01 refersto the proof loading of specimen M03 01.
2.6. HYDROGEN ANALYSIS
In the first phase of experiments, two specimens were selected from each set (B, Cand D) that was charged prior to fracture testing. After testing, samples typically22mm x 44mm section by 10mm thick were carefully cut from the selected samplesfor hydrogen analysis. The samples were taken in the region immediately adjacentto the notch in order to get an indication of hydrogen levels in the crack tip regionduring the fracture test. The amount of diffusable hydrogen evolved over mercurywas measured. This procedure was repeated for all five charged specimens tested inthe second phase.
Details of the hydrogen charging and analysis are in Appendix II.
3. ANALYSIS OF TEST DATA
The fracture toughness parameters generated from the tests include K, CTOD and Jvalues both at proof loading and at fracture. These were used to produce scatterplots to see if any obvious trends could be observed. For the second phase ofexperiments at -170°C, the final fractures were by cleavage and the pre-conditionsfor applying theoretical WPS predictive models were met. The measured values forboth charged and uncharged specimens were therefore compared to theoreticalpredictions. This exercise was aimed at investigating if the level of conservatism inthe models was influenced by the presence of hydrogen.
The two theoretical models used in this study, both of which applies to the LUCFcycle, have been widely published (see Ref.1 and 2). The Smith’s model gives thefailure stress intensity factor Kf at temperature T2 after an applied preload stressintensity factor K1 at temperature T1 as:
σσ+
σ+σ
σ=C
1
2Y
1Y
2Y1Y
2Y
C
f
K
K1
K
K[1]
Where in the above equation, KC is the fracture toughness at T2 in the absence of aprestress; σY1 and σY2 are the yield strengths at T1 and T2, respectively. The secondmodel used is that by Chell and Haigh3 and takes the form:
87.0K
K20.0
K
K
C
1
C
f += [2]
The terms have the same meaning as in Eq.[1].

EFFECT OF HYDROGEN ON THE BENEFIT OF WARM PRESTRESSING
Report No: 88269/2/98 Page 5Copyright © TWI 1998
4. RESULTS AND DISCUSSION
4.1. HYDROGEN CONTENT
Hydrogen analysis was carried out soon after fracture testing except for fourspecimens that had to be stored for two weeks over the end of year holiday period.The amount of hydrogen measured in the specimens was in the range 1.08 to1.74ml/100g, except for those stored cold for two weeks prior to hydrogen analysis.It is clear that these specimens lost some hydrogen with measured levels in therange 0.14 to 0.73ml/100g. As all 15 charged specimens were charged in exactly thesame way, there is no reason to believe that these specimens had significantly lowerhydrogen content than the rest. Ignoring the samples that were in long term storage,the average hydrogen content from the samples was about 1.50ml/100g. Previousexperience5,6 has shown that the effect of hydrogen on fracture toughness, saturatesat a concentration of about 1.0ml/100g. Therefore, it would be expected that theresults obtained in this study would not be significantly altered by using higherlevels of hydrogen concentration.
4.2. BASE FRACTURE TOUGHNESS AND HYDROGEN EFFECT
The results of the final fracture tests are given in Table 2 and 3. The results are alsopresented in the scatter plots of Fig.2-5. For the tests at -100°C, it can be seen fromTable 2 that most of the specimens failed by cleavage (some after ductile tearing).However, three of the specimens reached maximum load after which the load beganto drop and were subsequently unloaded. However, at the lower temperature of-170°C, lower shelf behaviour is observed with cleavage failure in all specimens.
The baseline CTOD values measured in non-proof loaded and uncharged specimensbroadly agree with those reported for A533B material in a previous TWI project1.As would be expected, the values found here in 22mm thick specimens are slightlyhigher than those measured in 50mm thick specimens in Ref.1.
Figures 2 and 3 show that the baseline fracture toughness at -100°C is moderatelyreduced by hydrogen charging. From Table 2, the average measured base toughnesswithout hydrogen (set A) is calculated in terms of K as 3751Nmm-3/2 and CTOD as0.17mm. The corresponding values after hydrogen charging (set B) are K =3420Nmm-3/2 and CTOD = 0.11mm. This is an average reduction in baselinetoughness of 35% in CTOD and almost 9% in K as a result of hydrogen charging.This observation is in line with the findings of Humphries et al5 on the study ofhydrogen effects on A516 and A285 steels. In this reference, a major effect wasfound on CTOD with marginal reduction in K from tests carried out at ambienttemperature. It is however noted that, the huge scatter in the baseline CTOD valuesobserved in the present work may mean that the reduction of 35% is not typical.
The effect of warm prestress (WPS) on uncharged specimens is evident from Fig.2-5. From Table 2, the average increase in toughness at -100°C is 25% and 6% interms of CTOD and K respectively. For the tests at -170°C, an average increase of70% was observed in terms of K while the CTOD values after proof loading were

EFFECT OF HYDROGEN ON THE BENEFIT OF WARM PRESTRESSING
Page 6
on average almost three times the baseline value (see Table 3). As would beexpected, higher WPS benefits were observed at -170°C where all tests were clearlycleavage dominated. Also, these tests involved higher pre-load K levels (as ratio ofbase toughness) than those at -100°C.
4.3. COMBINED EFFECT OF WARM PRESTRESS AND HYDROGEN
The effect of warm prestressing together with hydrogen at -100°C is not very clear.The samples receiving both warm prestress and hydrogen charging (sets C and D)do not give significantly different results to those hydrogen charged without anyprestress (see Fig.2 and 3). It is also noted from Fig.2 and 3 that the sequence ofproof loading and charging does not have a significant effect. However, thecombined WPS and hydrogen effect is clearer for the tests at -170°C. Here, it isnoted that the fracture toughness of preloaded charged specimens were significantlyhigher than the baseline toughness (see Fig.4 and 5). The results suggest that the fullWPS benefit is almost achievable despite the presence of hydrogen. In fact, onaverage toughness values measured in pre-loaded charged specimens were as highas 90% of Kmat and 83% of CTOD values from specimens receiving proof loadingonly.
The analysis given in Table 4-6 considers the use of theoretical models to predictWPS benefit in the fracture toughness of both uncharged and charged specimens at-170°C. The models could not be applied to the test results at -100°C because thepre-load levels were outside the validity limits.
Table 4 compares the measured fracture toughness (K) values against the WPSpredictions for the uncharged specimens. This gives an average conservatism of25% for the Smith’s model and 35% for the Chell and Haigh model. For the case ofcharged specimens, the predictions given in Table 5 assumes that the baselinefracture toughness is the same as measured for uncharged specimens. In this case,the Smith’s model gives on average 13% conservative predictions while the Chelland Haigh model is about 22% conservative. In order to make some allowance forthe effect of hydrogen on the baseline toughness, the predictions were refined inTable 6 by taking this as 91% of measured uncharged value. This assumption wasnecessary because there was insufficient material to carry out relevant tests -170°C.The figure of 91% comes from the earlier tests conducted at -100°C. The resultsgiven in Table 6 show improved conservatism in the models at an average of 18%for the Smith model and 30% for the Chell and Haigh model.
In general, both models gave on average conservative predictions for bothuncharged and charged specimens. However, the predictions for unchargedspecimens were more conservative than those for charged specimens. Also, theresults suggest that the level of conservatism in the predictions for chargedspecimens is improved if allowance is made for the effect of hydrogen on thebaseline fracture toughness.
It is worth noting that no specific allowance was made for the effect of hydrogen(ageing) in the development of the WPS predictive models. However, it is
EFFECT OF HYDROGEN ON THE BENEFIT OF WARM PRESTRESSING
Report No: 88269/2/98 Page 7Copyright © TWI 1998
commonly assumed that the models are applicable provided the baseline toughnessadopted takes into account the effect of ageing/embrittlement (see Ref.7). Theresults of the present study are in line with this assumption.
This study was based entirely on tests conducted on parent metal. However, withregard to the effect of hydrogen on fracture toughness, Davey and Carne8 found a40% reduction in upper shelf (CTOD) toughness of specimens made from stovepipe welds. Therefore the effects seen in this study can be expected to be repeated inweld metals.
5. CONCLUSIONS
Fracture toughness tests were conducted on A533B steel specimens followingvarious treatments of hydrogen charging or proof testing or both. The results of thetests have been comprehensively analysed and the following conclusions are drawn:
• Hydrogen charging reduced the baseline fracture toughness of the material. TheCTOD was on average reduced by 35% while the reduction in K was smaller atabout 9%, for tests carried out at -100°C.
• Significant benefit of warm prestressing was observed in both uncharged andcharged specimens at -170°C. The results suggest that most of the WPS benefit(up to 90% of Kmat in these tests) is retained after hydrogen charging. However,the proof load levels used in the tests carried out at -100°C were too low to giveany significant residual benefit after hydrogen charging.
• The accuracy of WPS predictive models appears to be slightly affected byhydrogen charging. In general, the level of conservatism in the predictions wereless for charged specimens than for uncharged ones. However, the predictionsfor both uncharged and hydrogen-charged specimens were on averageconservative.
• The level of conservatism in WPS predictions for hydrogen charged specimensis improved if allowance is made for the effect of hydrogen on the baselinefracture toughness.
• Overall, the results suggest that existing theoretical models by Smith1,2 andChell and Haigh3 may be used to predict fracture toughness even after exposureto hydrogen. However, it should be recognised that the margins on thesepredictions may be slightly reduced compared to the cases without hydrogeneffects. Using reduced baseline toughness values and the appropriate yieldproperties for the hydrogen-embrittled state should maintain good safetymargins in the predictions.

EFFECT OF HYDROGEN ON THE BENEFIT OF WARM PRESTRESSING
Page 8
6. REFERENCES
1. Smith D J: ‘The significance of prior overload with regard to the risk ofsubsequent fracture in A533B steel’, Welding Institute Research Report No.339/1987.
2. Smith D J and Garwood S J: ‘The significance of prior overload on fractureresistance: a critical review’, Int. J. Pres. Ves. & Piping, 41, 1990 255-296
3. Chell G G and Haigh J R.: ‘The effect of warm prestressing on proof testedpressure vessels’, Int. J. Pres. Ves. & Piping, 23, 1986, 121-132.
4. Pargeter R J: ‘Hydrogen – a moving target ’, TWI Bulletin 440/1/93, Jan. 1993.
5. Humphries M J et al: ‘Toughness characteristics of hydrogen charged pressurevessel steels’, Int. Conf. Interaction of Steels with Hydrogen in Petroleum IndustryPressure Vessel Service, Paris, France, Mach. 1989.
6. Gittos M F: ‘Effect of hydrogen on the fracture toughness of welded steels usedfor pressure containment plant ’, TWI Report 5610/9/93, Oct. 1993.
7. Milne I, Ainsworth R A, Dowling A R and Stewart A T: ‘Assessment of theintegrity of structures containing defects’, CEGB document R/H/R6 – Revision 3,Appendix 13, May 1996
8. Davey T G and Carne M M P: ‘ The influence of hydrogen on the toughness ofstove pipe welds’, Welding of pipelines, Vol. II, Nov. 1986.

EFFECT OF HYDROGEN ON THE BENEFIT OF WARM PRESTRESSING
Report No: 88269/2/98 Page 9Copyright © TWI 1998
Table 1 Chemical analyses of A533B class 1 steel (% weight)
C S P Si Mn Ni Cr Mo V Cu Nb Ti Al B Sn Co CE*0.18 0.005 0.006 0.24 1.41 0.56 0.18 0.48 <0.002 0.12 <0.002 <0.002 0.018 <0.0003 0.01 0.01 0.59
*CE = C + Mn/6 + (Ni + Cu)/15 + (Cr + Mo + V)/5

EFFECT OF HYDROGEN ON THE BENEFIT OF WARM PRESTRESSING
Page 10 Report No: 88269/2/98Copyright © TWI 1998
Table 2 Summary of fracture toughness results at -100°CSpecimen (M02) Pre-load condition Fracture detail
Set No.Pre-load, max
(kN)K
(Nmm-3/2)CTOD(mm) Charging
Kmat
(Nmm-3/2)CTOD(mm) Type of result
A 01 0 0 0 None 3934 0.30 cA 02 0 0 0 None 3525 0.08 cA 03 0 0 0 None 3809 0.18 cA 04 0 0 0 None 3893 0.20 cA 05 0 0 0 None 3594 0.09 cB 06 0 0 0 Hydrogen 3194 0.06 cB 07 0 0 0 Hydrogen 3457 0.14 uB 08 0 0 0 Hydrogen 3467 0.13 mB 09 0 0 0 Hydrogen 3516 0.11 cB 10 0 0 0 Hydrogen 3466 0.11 cC 11 40.5 2884 0.083 bHydrogen 3372 0.08 uC 12 41.5 2977 0.083 bHydrogen 3367 0.18 uC 13 44.2 3105 0.087 bHydrogen 3542 0.07 cC 14 42.5 3080 0.083 bHydrogen 3575 0.11 uC 15 43.3 3025 0.086 bHydrogen 3512 0.10 uD 16 40.0 2916 0.079 aHydrogen 3377 0.11 mD 17 41.3 2934 0.082 aHydrogen 3491 0.09 mD 18 41.5 2966 0.082 aHydrogen 3532 0.07 cD 19 42.7 3029 0.084 aHydrogen 3461 0.11 cD 20 42.0 2949 0.084 aHydrogen 3378 0.05 cE 21 43.4 3040 0.085 None 3951 0.20 cE 22 44.5 3052 0.086 None 4091 0.37 uE 23 44.3 3082 0.085 None 3937 0.14 cE 24 43.2 3012 0.084 None 3899 0.17 cE 25 44.3 3065 0.084 None 4014 0.19 c
Notes: b = hydrogen charged before proof loading; a = hydrogen charged after proof loadingResult type: c = cleavage, u = fracture after tearing, m = maximum load

EFFECT OF HYDROGEN ON THE BENEFIT OF WARM PRESTRESSING
Report No: 88269/2/98 Page 11Copyright © TWI 1998
Table 3 Summary of fracture toughness results at -170°C
Specimen (M03) Pre-load condition Fracture detail
Set No.Pre-load, max
(kN)K
(Nmm-3/2)CTOD(mm) Charging
KC
(Nmm-3/2)CTOD(mm) Type of result
F 11 0 0 0 None 1322 0.005 cF 12 0 0 0 None 1540 0.006 cF 13 0 0 0 None 1957 0.011 cF 14 0 0 0 None 1746 0.008 cF 15 0 0 0 None 1110
Avg = 15350.003
Avg = 0.007c
G 06 44.9 3102 0.093 Hydrogen 2545 0.021 cG 07 45.1 2991 0.084 Hydrogen 2228 0.012 cG 08 45.1 2983 0.080 Hydrogen 2068 0.013 cG 09 45.0 2965 0.077 Hydrogen 2108 0.014 cG 10 45.0 3015 0.086 Hydrogen 2866
Avg = 23630.027
Avg = 0.017c
H 01 44.5 3041 0.086 None 3182 0.029 cH 02 44.9 2966 0.083 None 3263 0.030 cH 03 44.2 3054 0.097 None 2516 0.019 cH 04 44.3 3035 0.087 None 2142 0.013 cH 05 45.1 3017 0.090 None 1968
Avg = 26140.011
Avg = 0.020c
Notes: Result type: c = cleavage, u = fracture after tearing, m = maximum loadAvg. = average value

EFFECT OF HYDROGEN ON THE BENEFIT OF WARM PRESTRESSING
Page 12 Report No: 88269/2/98Copyright © TWI 1998
Table 4 Comparison of measured toughness against theoretical predictions for uncharged specimens
Specimen(M03) Smith Model Predictions
Chell and Haigh ModelPredictions
Set No.
Measuredtoughness,
Kmat
Preload K= K1
(kN)
*Assumedbase toughness,
KC
(Nmm-3/2)
Proofloadratio
K1/KC Failure Kf
Act./pred.(Kmat /Kf) Failure Kf
Act./pred.(Kmat /Kf)
H 01 3182 3041 1535 1.98 2094 1.52 1944 1.64H 02 3263 2966 1535 1.93 2066 1.58 1929 1.69H 03 2516 3054 1535 1.99 2099 1.20 1946 1.29H 04 2142 3035 1535 1.98 2092 1.02 1943 1.10H 05 1968 3017 1535 1.97 2085 0.94
Avg = 1.251939 1.02
Avg = 1.35
Note: * Kc taken as average of uncharged non-proof loaded toughness values (i.e., set F average)
Table 5 Measured toughness versus theoretical prediction for charged specimens (Baseline toughness takes no account of hydrogen)
Specimen(M03) Smith Model Predictions
Chell and Haigh ModelPredictions
Set No.
Measuredtoughness,
Kmat
Preload K= K1
(kN)
*Assumedbase toughness,
KC
(Nmm-3/2)
Proofloadratio
K1/KC Failure Kf
Act./pred.(Kmat /Kf) Failure Kf
Act./pred.(Kmat /Kf)
G 06 2545 3102 1535 2.02 2116 1.20 1956 1.30G 07 2228 2991 1535 1.95 2075 1.07 1934 1.15G 08 2068 2983 1535 1.94 2072 1.00 1932 1.07G 09 2108 2965 1535 1.93 2066 1.02 1929 1.09G 10 2866 3015 1535 1.96 2084 1.38
Avg = 1.131939 1.48
Avg = 1.22
Note: * Kc taken as average of uncharged non-proof loaded toughness values (i.e., set F average)

EFFECT OF HYDROGEN ON THE BENEFIT OF WARM PRESTRESSING
Report No: 88269/2/98 Page 13Copyright © TWI 1998
Table 6 Measured toughness versus theoretical prediction for charged specimens (baseline toughness allows for hydrogen effect)
Specimen(M02)
Measuredtoughness,
Kmat
Preload K= K1
(kN)
*Assumedbase toughness,
KC
(Nmm-3/2)
Proofloadratio
K1/KC Smith Model PredictionsChell and Haigh Model
Predictions
Set No. Failure KfAct./pred.(Kmat /Kf) Failure Kf
Act./pred.(Kmat /Kf)
G 06 2545 3102 1397 2.22 2030 1.25 1836 1.39G 07 2228 2991 1397 2.14 1988 1.12 1814 1.23G 08 2068 2983 1397 2.14 1985 1.04 1812 1.14G 09 2108 2965 1397 2.12 1979 1.07 1808 1.17G 10 2866 3015 1397 2.16 1997 1.44
Avg = 1.181818 1.58
Avg = 1.30
Note: * Kc taken as 91% of average uncharged baseline toughness value

EFFECT OF HYDROGEN ON THE BENEFIT OF WARM PRESTRESSING
Report No: 88269/2/98Copyright © TWI 1998
TWI ENDORSEMENT
This work has been carried out in accordance with TWI's QA Procedures.
Project Leader ................................................ Head of Department ......................................(or delegate)