effect of landslide factor combinations on the prediction
TRANSCRIPT
Meten et al. Geoenvironmental Disasters (2015) 2:9 DOI 10.1186/s40677-015-0016-7
METHODOLOGY Open Access
Effect of Landslide Factor Combinations on thePrediction Accuracy of Landslide SusceptibilityMaps in the Blue Nile Gorge of Central EthiopiaMatebie Meten*, Netra PrakashBhandary and Ryuichi Yatabe
Abstract
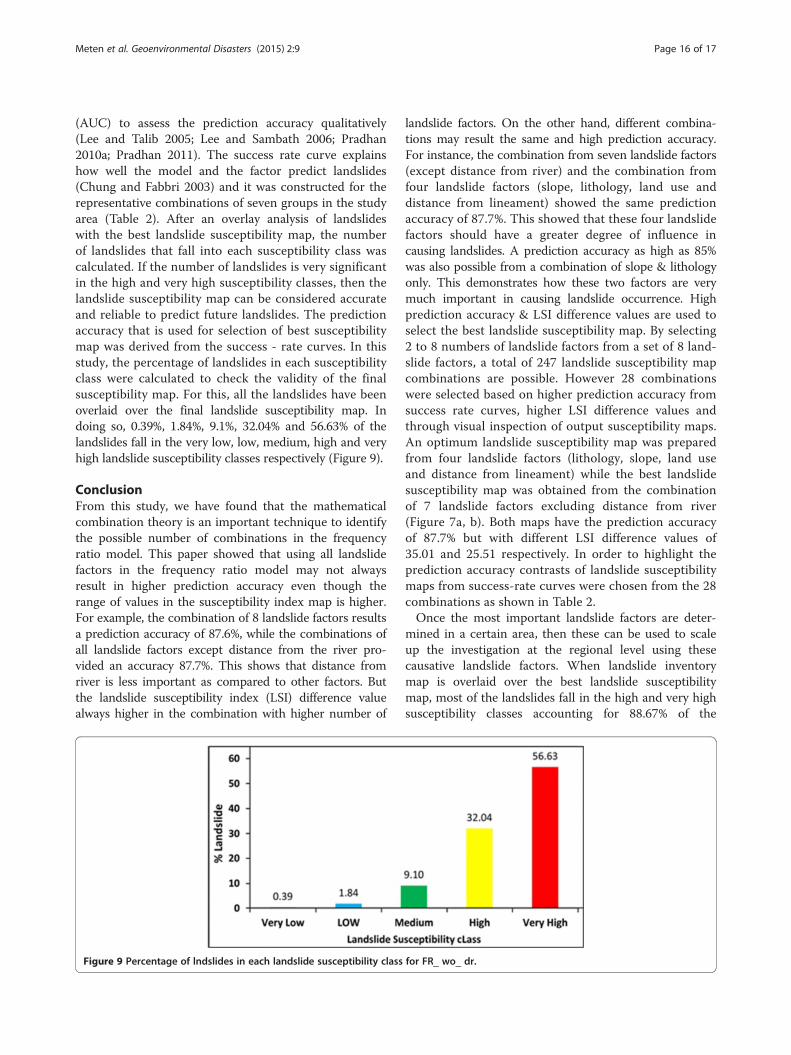
Database construction for landslide factors (slope, aspect, profile curvature, plan curvature, lithology, land use,distance from lineament & distance from river) and landslide inventory map is an important step in landslidesusceptibility modelling. Using the frequency ratio model, the weights for each factor classes were calculated andassigned in GIS so as to add these factors and produce landslide susceptibility index maps based on mathematicalcombination theory. However, before combining them, their independence among each other should beascertained. For this, the correlation matrix of logistic regression was applied and this showed that most of thecorrelations between factors were either absent or very insignificant suggesting that all landslide factors areindependent. From a set of eight landslide factors, a total of 247 landslide susceptibility map combinations can begenerated. However, for simplification, only 28 landslide susceptibility maps were chosen. Then the best landslidesusceptibility map was selected based on high prediction accuracy. But, when there is similarity in the predictionaccuracies of different combinations, the landslide susceptibility index difference values can be used as anotherselection criterion. Hence, the susceptibility map from a combination of all landslide factors except distance fromriver was found to be the best one. Among the 28 representative combinations, landslide susceptibility maps withthe same prediction accuracy of 87.7% have been found in spite of their dissimilarity in their difference values. Thecombination, with a limited number of landslide factors and the highest prediction accuracy of 87.7%, was foundfrom a combination of slope, lithology, land use and distance from lineament. In order to validate the predictionmodel, landslides were overlaid over the landslide susceptibility map and the number of landslides that fall intoeach susceptibility class was calculated. From this analysis 0.39%, 1.84%, 9.1%, 32.04% and 56.63% of the landslidesfall in the very low, low, medium, high and very high landslide susceptibility classes respectively. Since 88.67%of the landslides fall in the high and very high susceptibility classes, the landslide susceptibility map can beconsidered reliable to predict future landslides.
Keywords: Landslide susceptibility; GIS; Frequency ratio; Combination; Prediction accuracy; Ethiopia
BackgroundLandslide is the movement of a mass of rock, debris orearth (soil) down a slope and landslide susceptibility is aquantitative or qualitative assessment of landslide aboutits classification, volume (or area) and spatial distribution(IUGS 1997, Fell et al. 2008). Landslide susceptibilitymapping methods are classified into heuristic (Ruff andCzurda 2008), statistical (Lee et al. 2004; Pradhan et al.
* Correspondence: [email protected] Research Laboratory, Graduate School of Science andEngineering, Ehime University, 3 Bunkyo, Matsuyama 790-8577, Japan
© 2015 Meten et al.; licensee Springer. This is aAttribution License (http://creativecommons.orin any medium, provided the original work is p
2011), deterministic (Godt et al. 2008) and a combinationof statistical and deterministic (Terlien 1998) methods.Susceptibility, hazard and risk maps are important toolsfor engineers, earth scientists, planners and decisionmakers select appropriate sites for agriculture, construc-tion and other development activities (Ercanoglu andGokceoglu 2002). They also play an important role inefforts to mitigate or prevent the disaster in landslideprone areas by providing important information to theconcerned bodies. In heuristic methods, field observationand expert’s knowledge are used to identify landslides,
n Open Access article distributed under the terms of the Creative Commonsg/licenses/by/4.0), which permits unrestricted use, distribution, and reproductionroperly credited.
Meten et al. Geoenvironmental Disasters (2015) 2:9 Page 2 of 17
make a prior assumption about past and future landslidemovements on the site, assign weighted values for the clas-ses of index maps and overlay them to produce a landslidesusceptibility map. In deterministic method, data on slopegeometry, shear strength (cohesion and angle of internalfriction) and pore pressure are required (Regmi et al. 2010a).A significant limitation of deterministic models is the needfor geotechnical data (cohesion, internal angle of friction,depth to groundwater table, degree of saturation etc.) whichare difficult to obtain over large areas (Terlien et al. 1995).Data from Ayalew (1999), Temesgen et al. (2001),
Woldearegay (2008) and Ibrahim (Ibrahim J, 2011:Landslide assessment and hazard zonation in Mersa andWurgessa, North Wollo, Ethiopia, unpublished MasterThesis) showed that landslide in Ethiopia has resulted lossof human lives, properties and infrastructures particularlyin the last five decades. From 1960 to 2010 alone, about388 people were dead, 24 people were injured and a greatdeal of agricultural lands, houses and infrastructures wereaffected. Landslide problem in the Abay (Blue Nile) Gorgeis a serious challenge to the community residing in this areaand to the road infrastructure that connects Addis Ababato Bahir Dar. In 1960, a terrible landslide at Gembechivillage within Bechet valley was responsible for the loss of45 people (Ayalew 1999). On September 2, 1993 a landslideincidence occurred in the Blue Nile Gorge, which killed anox, damaged agricultural fields, destroyed crops and as aresult 700 households were stricken by food insecurity.Besides this the main road, which was 5 km south of Dejentown has been damaged with a displacement of 1.5 metersby the sliding mass (Tadesse T, Dessie T and Deresa K,1994: Landslide incidence in the Blue Nile Gorge of EastGojam, Ethiopia. Geological Survey of Ethiopia, 823 report,830-301-01, unpublished). The road damage is a commonphenomenon of the mid to end of each rainy season (i.e.June 1 to September 30) due to the gradual weakening ofthe soft and weathered rocks by heavy rain and ground-water percolation through big columnar joints of basalt tothe underlying limestone formation bearing mudstone andshale at its top and middle strata. For example, Asfaw(2010) reported a road damage near Goha Tsiyon town onSeptember 5, 2009. Such incidences happened due to theprogressive softening of weathered basalt and pyroclasticrocks by heavy rainfall, groundwater recharge through thecolumnar joints of basalt and by a gushing stream thatcrosses a road. The Goha Tsion-Dejen transect is animportant transport corridor connecting Addis Ababa withthe regions in the northwestern part of the country. How-ever, it is affected by a complex landslide problem almoston a yearly basis. To overcome this problem, few re-searchers in the field of Geotechnics, Geoscience and slopestability have been undertaking investigations in the BlueNile Gorge. Recently, GIS is becoming a powerful tool tostudy landslide susceptibility and hazard worldwide because
of its analysis potential and capability. A continuous and upto date landslide susceptibility map is vital to planners, en-gineers and decision makers in order to devise appropriatelandslide prevention and mitigation measures. In this re-gard, a statistical (probabilistic) model known as frequencyratio has been applied in the current study area. This modelwas chosen because it is easy to understand and simple toimplement. Data input, output and analysis processes arefast and a huge amount of data can be handled and runquickly (Lee and Pradhan 2007; Lee et al. 2007).Frequency ratio model avoids the lengthy procedures of
raster to point data conversion in GIS, weight calculation instatistical software and switching from statistical software toGIS for the preparation of landslide susceptibility map un-like logistic regression and artificail neural network models.Besides this, it utilizes all the available data contrary to theother two models, which may use a limited proportion ofthe data because of the low data processing capacity of thestatistical software. Using a frequency ratio model, Lee andTalib (2005) have found the prediction accuracy of 72.1% inPenang, Malaysia and Lee and Sambath (2006) have founda prediction accuracy of 86.97% in the Damrei Romel areaof Cambodia. Lee and Pradhan (2007) have shown thatthe frequency ratio resulted a better prediction accuracythan the logistic regression at Selangor area in Malaysia.Similarly, Pradhan (2010a) showed that the validation resultof the frequency ratio model in the Cameron catchment ofMalaysia is slightly better than logistic regression and fuzzylogic models with a prediction accuracy of 89.25%.Until now researchers, who were engaged in the this
model, were simply summing all the frequency ratioraster maps of landslide factors (Lee and Sambath 2006)or exclude one factor and sum all the remaining ones(Lee and Talib 2005). However, the previous works lackways of systematic combination, identifying the numberof possible combinations, providing more than oneselection criterion to select the best landslide suscepti-bility map and finding a combination with high predic-tion accuracy from a limited number of factors.The current study tries to prepare different landslide
susceptibility maps from eight landslide factors andlandslide inventory with different combinations usingfrequency ratio model and make a comparison on theprediction accuracies of these combinations in order toselect the best landslide susceptibility map. This willhelp to suggest a limited number of landslide factorsthat can produce a susceptibility map with the highestprediction accuracy similar to a combination using allor most of the landslide factors. The main objectives ofthis study are: (1) to apply the frequency ratio modelusing combination theory, (2) to identify the possiblenumbers of combinations, (3) to evaluate the effect ofdifferent combinations on the prediction accuracy oflandslide susceptibility maps and (4) to select the best
Meten et al. Geoenvironmental Disasters (2015) 2:9 Page 3 of 17
landslide susceptibility map among different alternatives.In light of this, the following questions will be addressedin the subsequent chapters of this paper. (1) How manycombinations are possible in the frequency ratio modelwith a certain number of landslide factors? (2) Whichcombination of landslide factors will give the best pre-diction accuracy? (3) How can we prioritize if the twolandslide susceptibility maps have the same predictionaccuracy? (4) How can we identify the best landslidesusceptibility map obtained from a limited number oflandslide factors?
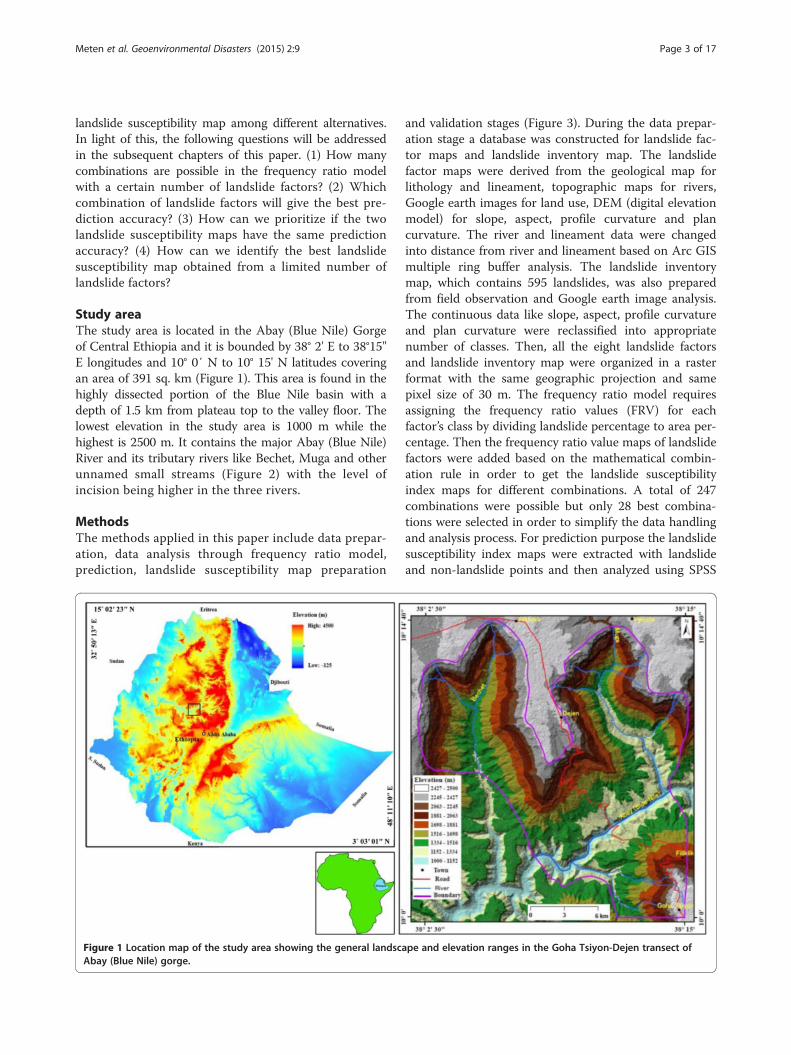
Study areaThe study area is located in the Abay (Blue Nile) Gorgeof Central Ethiopia and it is bounded by 38° 2' E to 38°15"E longitudes and 10° 0′ N to 10° 15' N latitudes coveringan area of 391 sq. km (Figure 1). This area is found in thehighly dissected portion of the Blue Nile basin with adepth of 1.5 km from plateau top to the valley floor. Thelowest elevation in the study area is 1000 m while thehighest is 2500 m. It contains the major Abay (Blue Nile)River and its tributary rivers like Bechet, Muga and otherunnamed small streams (Figure 2) with the level ofincision being higher in the three rivers.
MethodsThe methods applied in this paper include data prepar-ation, data analysis through frequency ratio model,prediction, landslide susceptibility map preparation
Figure 1 Location map of the study area showing the general landscaAbay (Blue Nile) gorge.
and validation stages (Figure 3). During the data prepar-ation stage a database was constructed for landslide fac-tor maps and landslide inventory map. The landslidefactor maps were derived from the geological map forlithology and lineament, topographic maps for rivers,Google earth images for land use, DEM (digital elevationmodel) for slope, aspect, profile curvature and plancurvature. The river and lineament data were changedinto distance from river and lineament based on Arc GISmultiple ring buffer analysis. The landslide inventorymap, which contains 595 landslides, was also preparedfrom field observation and Google earth image analysis.The continuous data like slope, aspect, profile curvatureand plan curvature were reclassified into appropriatenumber of classes. Then, all the eight landslide factorsand landslide inventory map were organized in a rasterformat with the same geographic projection and samepixel size of 30 m. The frequency ratio model requiresassigning the frequency ratio values (FRV) for eachfactor’s class by dividing landslide percentage to area per-centage. Then the frequency ratio value maps of landslidefactors were added based on the mathematical combin-ation rule in order to get the landslide susceptibilityindex maps for different combinations. A total of 247combinations were possible but only 28 best combina-tions were selected in order to simplify the data handlingand analysis process. For prediction purpose the landslidesusceptibility index maps were extracted with landslideand non-landslide points and then analyzed using SPSS
pe and elevation ranges in the Goha Tsiyon-Dejen transect of
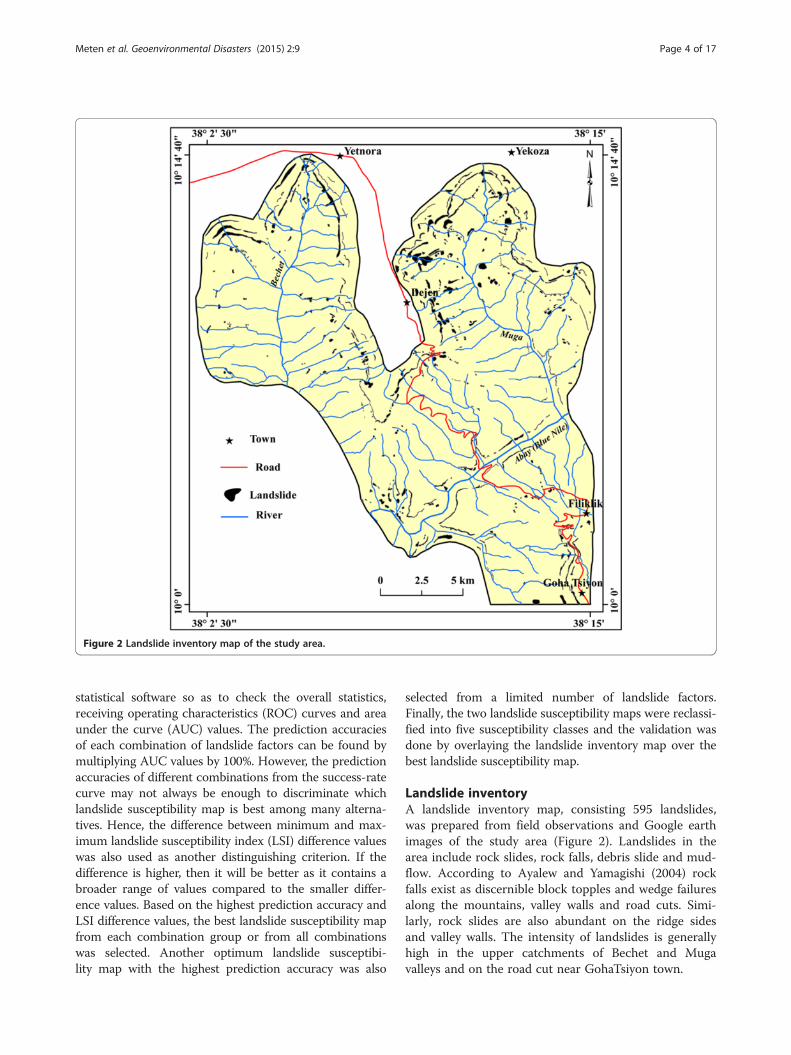
Figure 2 Landslide inventory map of the study area.
Meten et al. Geoenvironmental Disasters (2015) 2:9 Page 4 of 17
statistical software so as to check the overall statistics,receiving operating characteristics (ROC) curves and areaunder the curve (AUC) values. The prediction accuraciesof each combination of landslide factors can be found bymultiplying AUC values by 100%. However, the predictionaccuracies of different combinations from the success-ratecurve may not always be enough to discriminate whichlandslide susceptibility map is best among many alterna-tives. Hence, the difference between minimum and max-imum landslide susceptibility index (LSI) difference valueswas also used as another distinguishing criterion. If thedifference is higher, then it will be better as it contains abroader range of values compared to the smaller differ-ence values. Based on the highest prediction accuracy andLSI difference values, the best landslide susceptibility mapfrom each combination group or from all combinationswas selected. Another optimum landslide susceptibi-lity map with the highest prediction accuracy was also
selected from a limited number of landslide factors.Finally, the two landslide susceptibility maps were reclassi-fied into five susceptibility classes and the validation wasdone by overlaying the landslide inventory map over thebest landslide susceptibility map.
Landslide inventoryA landslide inventory map, consisting 595 landslides,was prepared from field observations and Google earthimages of the study area (Figure 2). Landslides in thearea include rock slides, rock falls, debris slide and mud-flow. According to Ayalew and Yamagishi (2004) rockfalls exist as discernible block topples and wedge failuresalong the mountains, valley walls and road cuts. Simi-larly, rock slides are also abundant on the ridge sidesand valley walls. The intensity of landslides is generallyhigh in the upper catchments of Bechet and Mugavalleys and on the road cut near GohaTsiyon town.
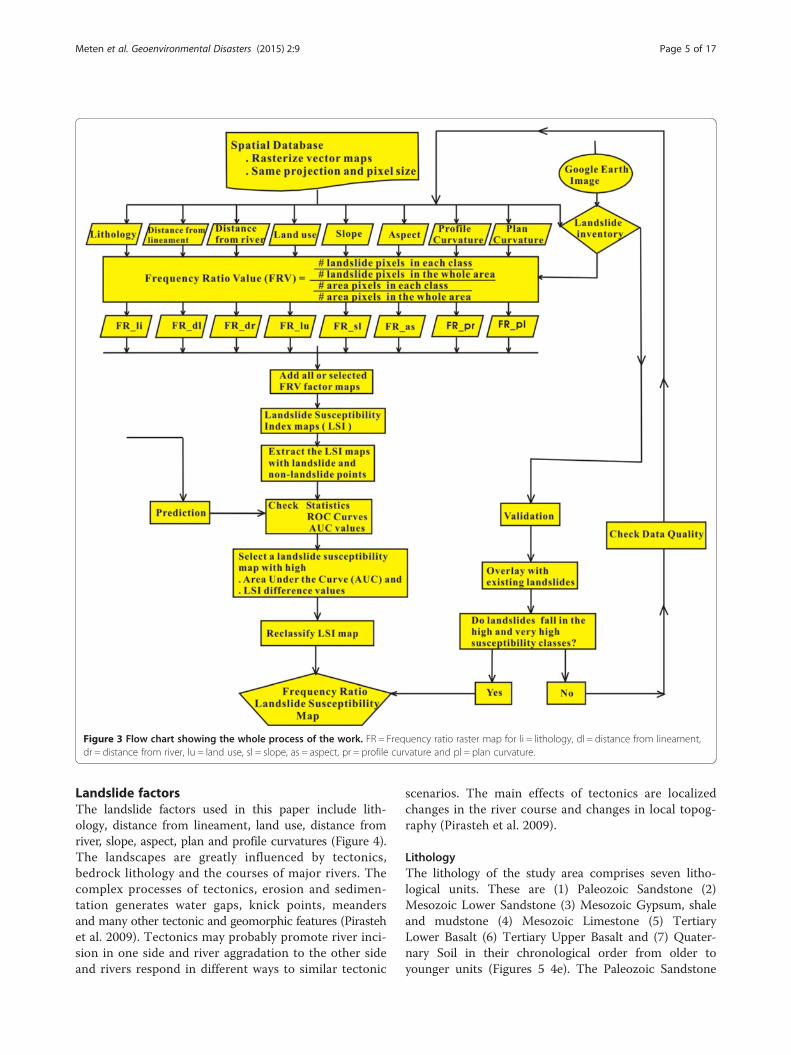
Figure 3 Flow chart showing the whole process of the work. FR = Frequency ratio raster map for li = lithology, dl = distance from lineament,dr = distance from river, lu = land use, sl = slope, as = aspect, pr = profile curvature and pl = plan curvature.
Meten et al. Geoenvironmental Disasters (2015) 2:9 Page 5 of 17
Landslide factorsThe landslide factors used in this paper include lith-ology, distance from lineament, land use, distance fromriver, slope, aspect, plan and profile curvatures (Figure 4).The landscapes are greatly influenced by tectonics,bedrock lithology and the courses of major rivers. Thecomplex processes of tectonics, erosion and sedimen-tation generates water gaps, knick points, meandersand many other tectonic and geomorphic features (Pirastehet al. 2009). Tectonics may probably promote river inci-sion in one side and river aggradation to the other sideand rivers respond in different ways to similar tectonic
scenarios. The main effects of tectonics are localizedchanges in the river course and changes in local topog-raphy (Pirasteh et al. 2009).
LithologyThe lithology of the study area comprises seven litho-logical units. These are (1) Paleozoic Sandstone (2)Mesozoic Lower Sandstone (3) Mesozoic Gypsum, shaleand mudstone (4) Mesozoic Limestone (5) TertiaryLower Basalt (6) Tertiary Upper Basalt and (7) Quater-nary Soil in their chronological order from older toyounger units (Figures 5 4e). The Paleozoic Sandstone
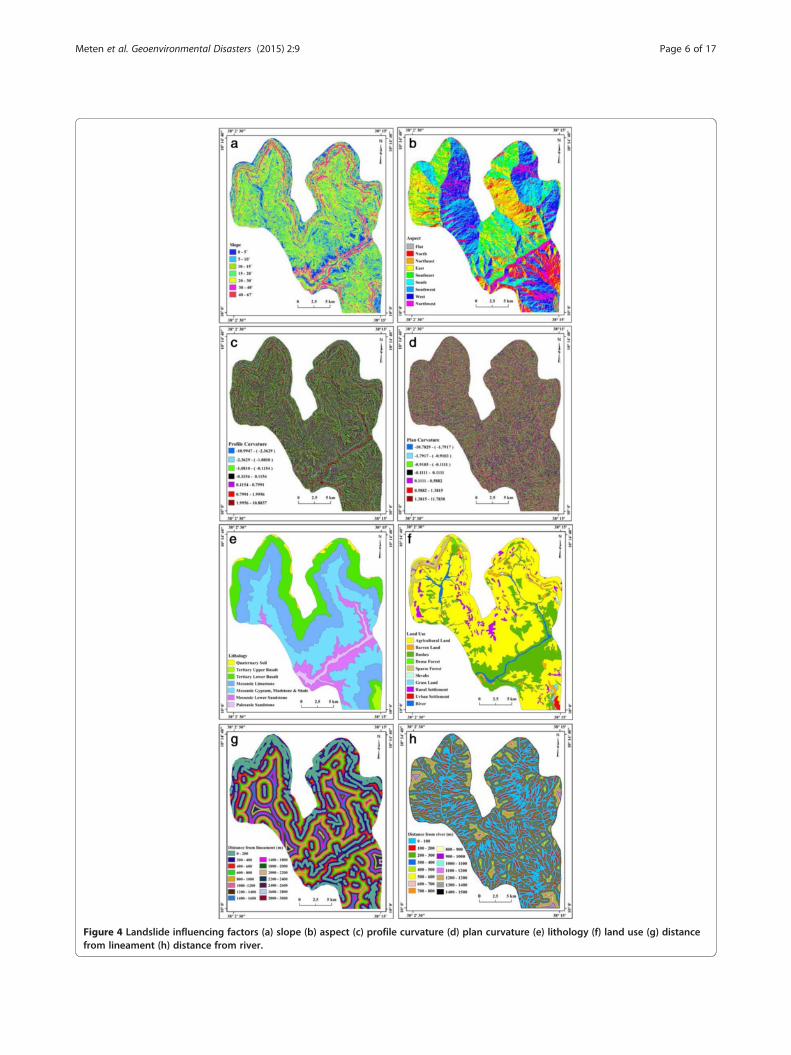
Figure 4 Landslide influencing factors (a) slope (b) aspect (c) profile curvature (d) plan curvature (e) lithology (f) land use (g) distancefrom lineament (h) distance from river.
Meten et al. Geoenvironmental Disasters (2015) 2:9 Page 6 of 17
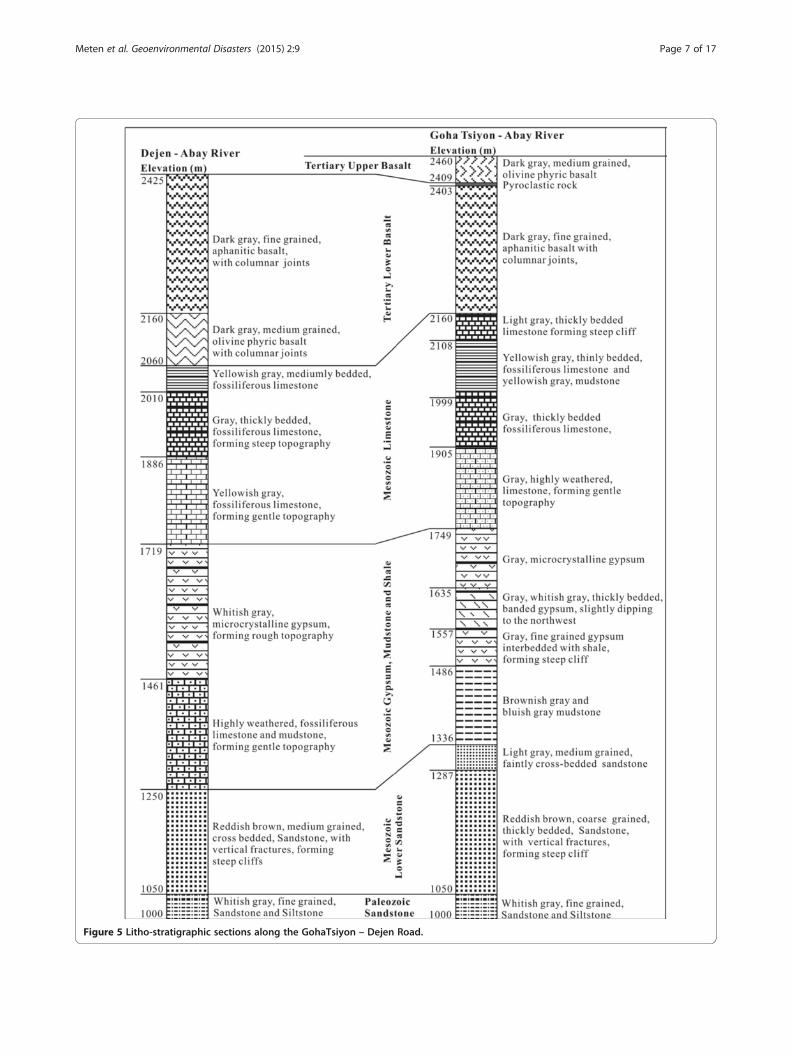
Figure 5 Litho-stratigraphic sections along the GohaTsiyon – Dejen Road.
Meten et al. Geoenvironmental Disasters (2015) 2:9 Page 7 of 17

Meten et al. Geoenvironmental Disasters (2015) 2:9 Page 8 of 17
consists of fine grained sandstone with whitish grayand brown colors occupying the river course of Abay(Blue Nile) attaining a maximum vertical thickness of50 m. It is highly weathered, slightly friable forming mod-erately sloping morphology. Mesozoic Lower Sandstone isreddish brown, light gray, medium to coarse grained,sometimes conglomeratic, medium to thickly beddedand crossbedded sandstone forming steep to moderatelysloping cliffs on the river banks of the Abay (Blue Nile)River overlying the Paleozoic Sandstone. This unit isfound in elevation range between 1050 m and 1336 mwith a vertical thickness of 286 m. Mesozoic Gypsum,Mudstone and Shale unit consists of the dominant gypsuminterbedded with minor mudstone and shale. This unitis exposed in the elevation range between 1336 m and1749 m in the GohaTsiyon – Abay River section with avertical thickness of 413 m. Gypsum is whitish gray, grayand sometimes banded, forming gentle morphology.Mudstone is yellowish gray, highly weathered and friable.Mesozoic Limestone is yellowish gray and light gray in
color, mostly fossiliferous, medium to thickly beddedand forms gentle to steep cliffs. The limestone forms abed thickness of 0.25 – 0.5 m and sometimes it mayreach up to 1 m. The Tertiary Lower Basalt forms a steepmorphology unconformably overlying the MesozoicLimestone. It is dark gray, fine to medium grained,aphanitic basalt, plagioclase phyric and olivine - plagioclasephyric basalts. The basalt in GohaTsiyon – Dejen Roadshows a spectacular columnar jointing and triggers acritical landslide problem. The Tertiary Upper Basalt isdark gray, fine to medium grained rock, consistingplagioclase phyric, olivine phyric and aphanitic basaltsoverlying thin beds of pyroclastic rocks. Lastly, in-situweathering of the Tertiary basalts has given rise to thedevelopment of Quaternarysoil on the Dejen plateau.
Land UseThe land use type in the area includes agricultural land,barren land, bushes, dense forest, sparse forest, shrubs,grassland, rural settlement, urban settlement and river(Figure 4f; Table 1). The reason why dense forest, sparseforest and shrubs are susceptible to land sliding can beattributed to the existing steep slope morphology andthe sallow rooted nature of different evergreen vegeta-tion types in the area. The presence of vegetation mayincrease the rate of infiltration. This in turn increasesthe accumulation of water, thereby decreasing the stabil-ity of the slope due to increased pore water pressure andunit weight of the sliding mass (Farrokhnia et al., 2010).This may be worsened if the vegetation types in the areahave a huge weight and are shallow rooted with theroots found above the slip surface of the landslide mass.It is obvious that the barren land comprising a degradedportion of the study area which is devoid of any
vegetation, particularly on the steep walled river banksof Muga and Bechet rivers, is more highly susceptible toland sliding than the other land use types.
Distance from lineamentLineaments, which are found along steep linear ridges inthe Abay (Blue Nile) gorge, have a strong influence inconditioning landslide incidences provided that the otherfavorable factors are also set in place. As can be seen inTable 1, the frequency ratio values for the distance fromlineament showed higher values in the distance range of 0to 200 m. The other distance classes revealed a lessnumber of landslides. The surface rupture intensity is alsoinfluenced by distance from lineament or fault and groundconditions. As the distance from the lineaments becomessmaller, the fracture of the rock masses and the degreeof weathering increases resulting in greater chances oflandslide occurrence (Farrokhnia et al. 2010).
Distance from riverRivers usually play a significant role in modifying thelandscape by incising the different rocks. In the studyarea, the Abay (Blue Nile), Bechet and Muga Riversand many other streams incised the Tertiary Volcanicrocks and Paleozoic and Mesozoic sedimentary rocksto a maximum depth of 1.5 km. The role played byrivers in creating a conducive environment for land-slide occurrence has great significance. The maximumnumber of landslides in the close proximity of rivers,as can be seen in Table 1, shows how rivers are con-tributing to landsliding. In the steep-walled river banksof Bechet and Muga, landslides are common, particu-larly in fractured Tertiary Lower Basalt and the under-lying Mesozoic Limestone units.
SlopeSlope is one of the most important topographic parame-ters influencing the occurrence of landslides in the studyarea. The landslide frequency is higher in the slopeclasses of 20 - 30°, 30 - 40° and 40 - 67° and the highestone is recorded in the slope class of 30 - 40° (Table 1).Generally speaking, as slope increases, the probabilityof landslide occurrence also increases.
AspectAspect (slope orientation) affects the exposure to sun-light, wind and precipitation thereby indirectly affectingother factors that contribute to landslides such as soilmoisture, vegetation cover and soil thickness (Clericiet al. 2006). The aspect of the area is classified into flat,north, northeast, east, southeast, south, southwest, westand northwest facing classes (Figure 4b). The number oflandslides is higher in the aspect classes of E, SE, S, SWand W but the frequency ratio values of SE, S and SW
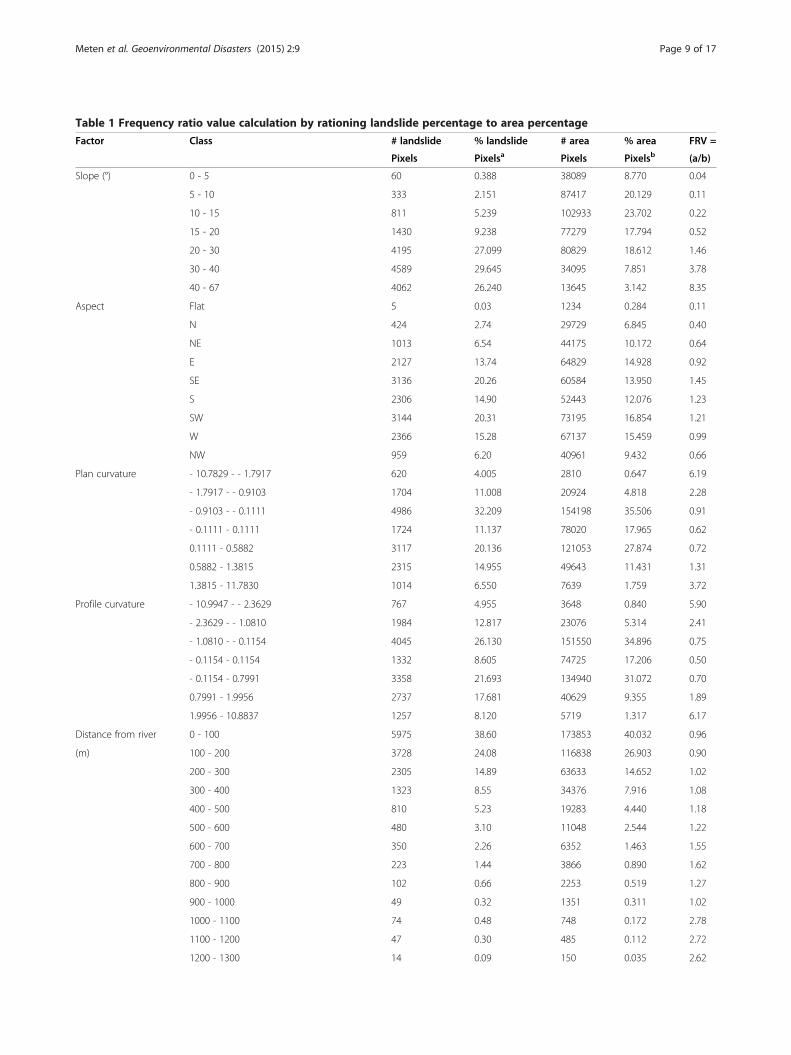
Table 1 Frequency ratio value calculation by rationing landslide percentage to area percentage
Factor Class # landslide % landslide # area % area FRV =
Pixels Pixelsa Pixels Pixelsb (a/b)
Slope (°) 0 - 5 60 0.388 38089 8.770 0.04
5 - 10 333 2.151 87417 20.129 0.11
10 - 15 811 5.239 102933 23.702 0.22
15 - 20 1430 9.238 77279 17.794 0.52
20 - 30 4195 27.099 80829 18.612 1.46
30 - 40 4589 29.645 34095 7.851 3.78
40 - 67 4062 26.240 13645 3.142 8.35
Aspect Flat 5 0.03 1234 0.284 0.11
N 424 2.74 29729 6.845 0.40
NE 1013 6.54 44175 10.172 0.64
E 2127 13.74 64829 14.928 0.92
SE 3136 20.26 60584 13.950 1.45
S 2306 14.90 52443 12.076 1.23
SW 3144 20.31 73195 16.854 1.21
W 2366 15.28 67137 15.459 0.99
NW 959 6.20 40961 9.432 0.66
Plan curvature - 10.7829 - - 1.7917 620 4.005 2810 0.647 6.19
- 1.7917 - - 0.9103 1704 11.008 20924 4.818 2.28
- 0.9103 - - 0.1111 4986 32.209 154198 35.506 0.91
- 0.1111 - 0.1111 1724 11.137 78020 17.965 0.62
0.1111 - 0.5882 3117 20.136 121053 27.874 0.72
0.5882 - 1.3815 2315 14.955 49643 11.431 1.31
1.3815 - 11.7830 1014 6.550 7639 1.759 3.72
Profile curvature - 10.9947 - - 2.3629 767 4.955 3648 0.840 5.90
- 2.3629 - - 1.0810 1984 12.817 23076 5.314 2.41
- 1.0810 - - 0.1154 4045 26.130 151550 34.896 0.75
- 0.1154 - 0.1154 1332 8.605 74725 17.206 0.50
- 0.1154 - 0.7991 3358 21.693 134940 31.072 0.70
0.7991 - 1.9956 2737 17.681 40629 9.355 1.89
1.9956 - 10.8837 1257 8.120 5719 1.317 6.17
Distance from river 0 - 100 5975 38.60 173853 40.032 0.96
(m) 100 - 200 3728 24.08 116838 26.903 0.90
200 - 300 2305 14.89 63633 14.652 1.02
300 - 400 1323 8.55 34376 7.916 1.08
400 - 500 810 5.23 19283 4.440 1.18
500 - 600 480 3.10 11048 2.544 1.22
600 - 700 350 2.26 6352 1.463 1.55
700 - 800 223 1.44 3866 0.890 1.62
800 - 900 102 0.66 2253 0.519 1.27
900 - 1000 49 0.32 1351 0.311 1.02
1000 - 1100 74 0.48 748 0.172 2.78
1100 - 1200 47 0.30 485 0.112 2.72
1200 - 1300 14 0.09 150 0.035 2.62
Meten et al. Geoenvironmental Disasters (2015) 2:9 Page 9 of 17
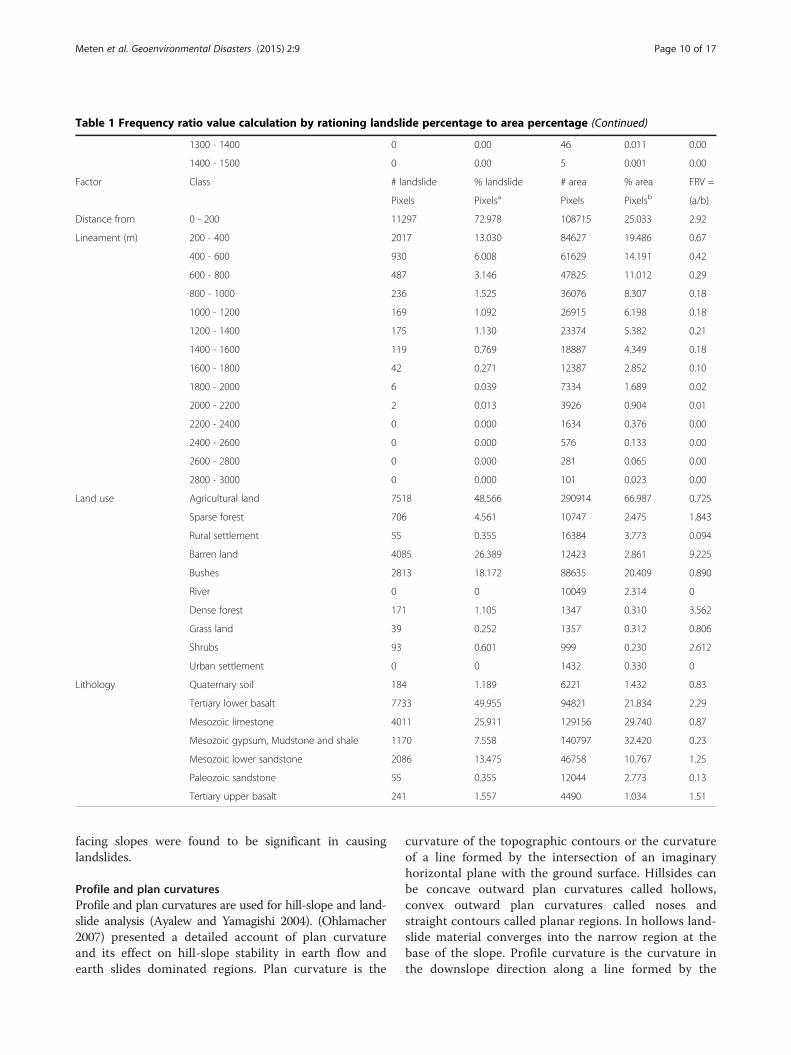
Table 1 Frequency ratio value calculation by rationing landslide percentage to area percentage (Continued)
1300 - 1400 0 0.00 46 0.011 0.00
1400 - 1500 0 0.00 5 0.001 0.00
Factor Class # landslide % landslide # area % area FRV =
Pixels Pixelsa Pixels Pixelsb (a/b)
Distance from 0 - 200 11297 72.978 108715 25.033 2.92
Lineament (m) 200 - 400 2017 13.030 84627 19.486 0.67
400 - 600 930 6.008 61629 14.191 0.42
600 - 800 487 3.146 47825 11.012 0.29
800 - 1000 236 1.525 36076 8.307 0.18
1000 - 1200 169 1.092 26915 6.198 0.18
1200 - 1400 175 1.130 23374 5.382 0.21
1400 - 1600 119 0.769 18887 4.349 0.18
1600 - 1800 42 0.271 12387 2.852 0.10
1800 - 2000 6 0.039 7334 1.689 0.02
2000 - 2200 2 0.013 3926 0.904 0.01
2200 - 2400 0 0.000 1634 0.376 0.00
2400 - 2600 0 0.000 576 0.133 0.00
2600 - 2800 0 0.000 281 0.065 0.00
2800 - 3000 0 0.000 101 0.023 0.00
Land use Agricultural land 7518 48.566 290914 66.987 0.725
Sparse forest 706 4.561 10747 2.475 1.843
Rural settlement 55 0.355 16384 3.773 0.094
Barren land 4085 26.389 12423 2.861 9.225
Bushes 2813 18.172 88635 20.409 0.890
River 0 0 10049 2.314 0
Dense forest 171 1.105 1347 0.310 3.562
Grass land 39 0.252 1357 0.312 0.806
Shrubs 93 0.601 999 0.230 2.612
Urban settlement 0 0 1432 0.330 0
Lithology Quaternary soil 184 1.189 6221 1.432 0.83
Tertiary lower basalt 7733 49.955 94821 21.834 2.29
Mesozoic limestone 4011 25.911 129156 29.740 0.87
Mesozoic gypsum, Mudstone and shale 1170 7.558 140797 32.420 0.23
Mesozoic lower sandstone 2086 13.475 46758 10.767 1.25
Paleozoic sandstone 55 0.355 12044 2.773 0.13
Tertiary upper basalt 241 1.557 4490 1.034 1.51
Meten et al. Geoenvironmental Disasters (2015) 2:9 Page 10 of 17
facing slopes were found to be significant in causinglandslides.
Profile and plan curvaturesProfile and plan curvatures are used for hill-slope and land-slide analysis (Ayalew and Yamagishi 2004). (Ohlamacher2007) presented a detailed account of plan curvatureand its effect on hill-slope stability in earth flow andearth slides dominated regions. Plan curvature is the
curvature of the topographic contours or the curvatureof a line formed by the intersection of an imaginaryhorizontal plane with the ground surface. Hillsides canbe concave outward plan curvatures called hollows,convex outward plan curvatures called noses andstraight contours called planar regions. In hollows land-slide material converges into the narrow region at thebase of the slope. Profile curvature is the curvature inthe downslope direction along a line formed by the
Meten et al. Geoenvironmental Disasters (2015) 2:9 Page 11 of 17
intersection of an imaginary vertical plane with theground surface (Ohlamacher 2007). Both profile andplan curvatures affect the susceptibility to landslides.Profile curvature affects the driving and resisting stresseswithin a landslide in the direction of motion. Plancurvature controls the convergence or divergence oflandslide material and water in the direction of land-slide motion (Carson and Kirkby 1972). The sign of thecurvature value is important for determining concavityor convexity of the curve. In both profile and plancurvature maps, concave and convex surfaces are repre-sented by the respective negative and positive values(Pradhan 2010a). Based on the plan curvature hill-slopescan be subdivided into hollows, noses and relatively planarregions. Hollows are regions in which the plan curvatureof the contours is concave in the downslope directionand where surface water would converge as it movesdownslope (Reneau and Dietrich 1987). Noses or covesare regions where the plan curvature of the contours isconvex in the downslope direction and the surfacewater will diverge (Hack and Goodlett 1960). Relativelyplanar regions have plan curvature values around zero.Hollows concentrate groundwater and the concentra-tion of groundwater probably leads to increased land-slide activity.
Triggering factorThe most important triggering factor for landslideoccurrence in the Blue Nile Gorge is heavy rainfall fromthe beginning of June to the end of September. Thisseason accounts for more than 75% of the annual rain-fall in the study area. Data from National Meteoro-logical Agency of Ethiopia showed that the minimum,average and maximum annual rainfalls of the study areaare 1100 mm, 1200 mm and 1400 mm respectively andsometimes the peak annual rainfall reaches up to1985 mm (Figure 6a). The peak monthly rainfall in fourstations showed its maxima during the months of Julyand August (Figure 6b). Landslides usually occur at thebeginning or mid of September after the soil and rocksare saturated and the pore water pressure becomeshigh. In every rainy season landslide events are happen-ing along the main national road between Goha Tsiyonand Dejen and also at steeply sloping ridges and steep-walled river banks.
TheoryFrequency ratio methodThe assumption of conditions that are similar to the pastis very important for landslide susceptibility mapping (Leeand Talib 2005). Probabilistic (statistical) approaches arebased on relationships between each landslide factor andthe distribution of past landslides (Lee and Talib 2005)and this relationship can be evaluated quantitatively using
the frequency ratio model. The eight landslide factors thatare used in this study include lithology, land use, distancefrom lineament, distance from river, slope, aspect, profileand plan curvatures were used to establish this relation-ship with landslides (Table 1).The number of landslide pixels in each class has been
evaluated and the frequency ratio for each factor class isfound by dividing the landslide ratio by the area ratio(Lee and Talib 2005). Frequency ratio shows the correlationbetween landslides and causative factors in a specific area.If this ratio is greater than 1, then the relationship betweena landslide and the factor’s class will be strong but if the ra-tio is less than 1, then the relationship will be weak and ifthe value is 1, it means an average correlation (Lee andSambath 2006; Pradhan 2010a). Once the frequency ratioof each landslide factor's class was found, the landslide sus-ceptibility index (LSI) can be calculated by summation ofeach factor’s frequency ratio values (Lee and Sambath2006). A higher LSI means a higher susceptibility to land-slide while a lower LSI indicates a lower susceptibility tolandslides (Bui et al. 2012).In the current study, landslide factors were converted
into raster maps with a pixel size of 30 m, the spatial re-lationship between the landslide location and each land-slide factor was analyzed and the ratings for each factor’sclass were assigned to each class in a specific factor.Then the frequency ratio ratings of factors in the formof raster maps were summed to form the landslide sus-ceptibility index (LSI) using equation (1).
LSI ¼Xni¼1
Fr ð1Þ
Where Fr is the raster map of each landslide factor inwhich the frequency ratio values (FRV) are assigned toit. The current study tries to analyze the effect of differ-ent combinations of landslide factors on the perform-ance of the frequency ratio model in order to get theminimum number of landslide factors which can pro-duce a susceptibility map with higher prediction accur-acy similar to combining many landslide factors usingthe mathematical combination theory.
Mathematical combination theoryIn mathematics, a combination is a way of selectingmembers from a grouping, such that the order of selec-tion does not matter unlike permutations. In smallercases it is possible to count the number of combinations.For example, given three fruits, say an apple, an orangeand a pear, there are three combinations of two that canbe drawn from this set: an apple and a pear; an appleand an orange; or a pear and an orange. More formally,a k-combination of a set S is a subset of k distinct ele-ments of S. If the set has n elements, the number of k-
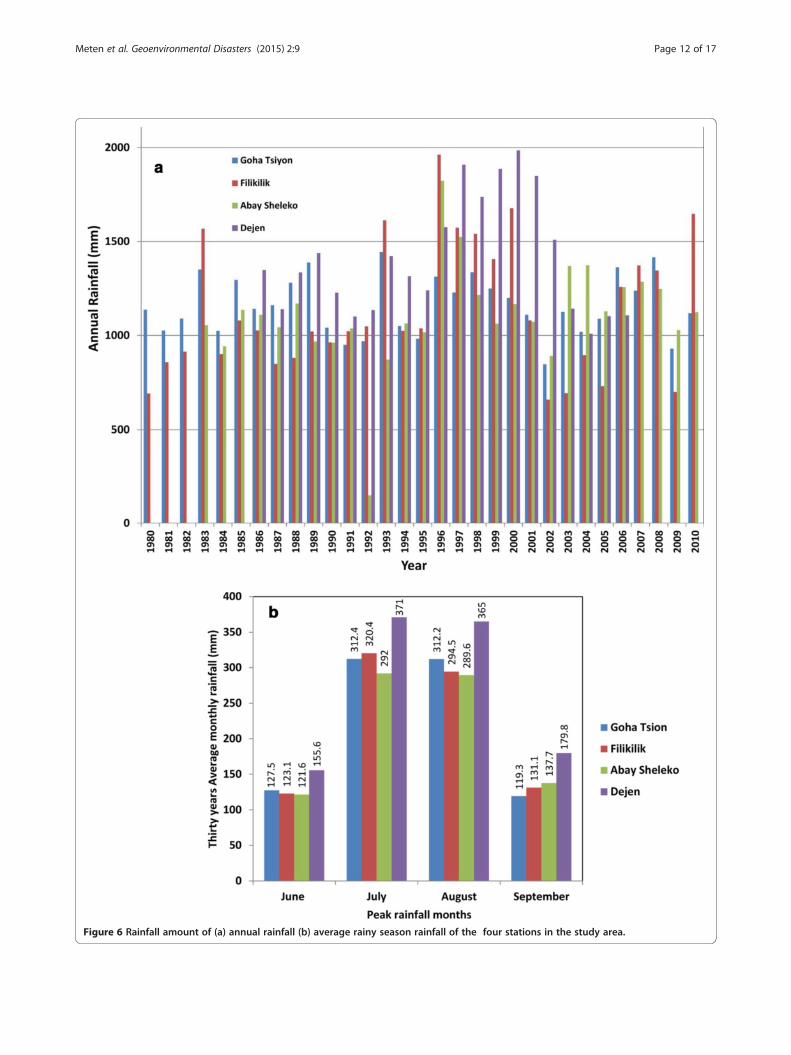
Figure 6 Rainfall amount of (a) annual rainfall (b) average rainy season rainfall of the four stations in the study area.
Meten et al. Geoenvironmental Disasters (2015) 2:9 Page 12 of 17
Meten et al. Geoenvironmental Disasters (2015) 2:9 Page 13 of 17
combinations is equal to the binomial coefficient (http://en.wikipedia.org/wiki/Combination) as follows.
nk
� �¼ n n−1ð Þ… n−k þ 1ð Þ
k k−1ð Þ…1; ð2Þ
This can be written using factorials as:
n!k! n−kð Þ! ð3Þ
Where k ≤ n, and which is zero when k > n.Combinations refer to the combination of n things
taken k at a time without repetition.In combination, the ordering of selected objects is im-
material. The current study applies the combination
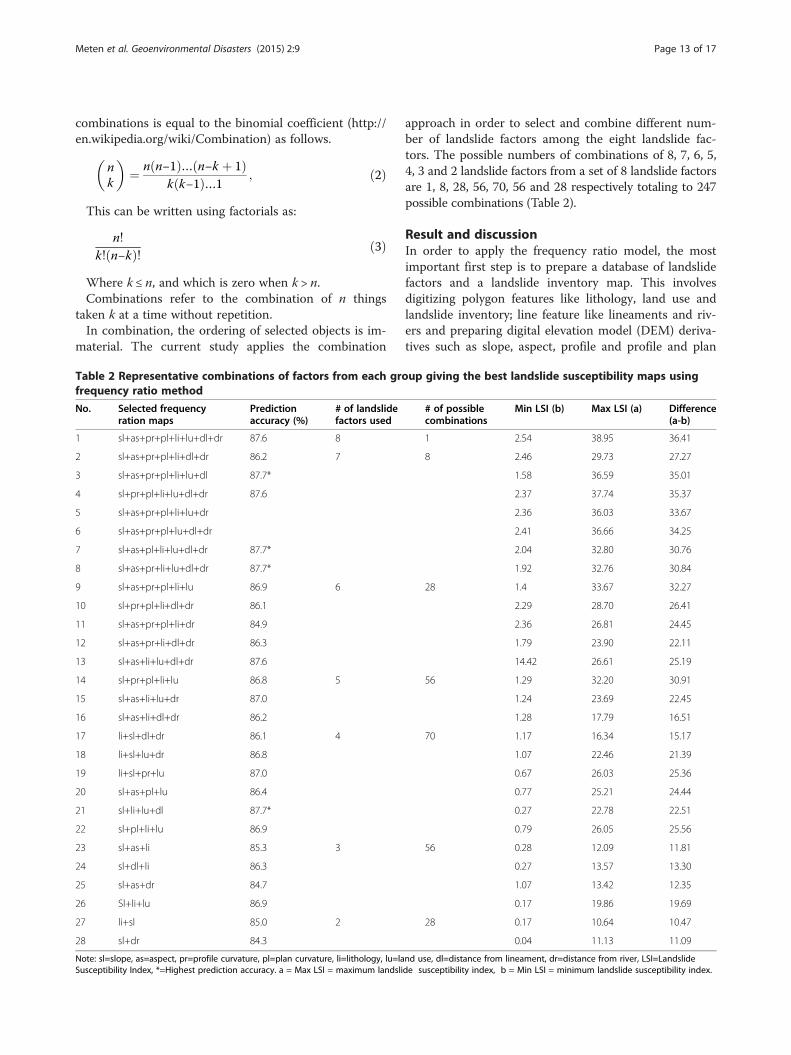
Table 2 Representative combinations of factors from each grofrequency ratio method
No. Selected frequencyration maps
Predictionaccuracy (%)
# of landslidefactors used
1 sl+as+pr+pl+li+lu+dl+dr 87.6 8
2 sl+as+pr+pl+li+dl+dr 86.2 7
3 sl+as+pr+pl+li+lu+dl 87.7*
4 sl+pr+pl+li+lu+dl+dr 87.6
5 sl+as+pr+pl+li+lu+dr
6 sl+as+pr+pl+lu+dl+dr
7 sl+as+pl+li+lu+dl+dr 87.7*
8 sl+as+pr+li+lu+dl+dr 87.7*
9 sl+as+pr+pl+li+lu 86.9 6
10 sl+pr+pl+li+dl+dr 86.1
11 sl+as+pr+pl+li+dr 84.9
12 sl+as+pr+li+dl+dr 86.3
13 sl+as+li+lu+dl+dr 87.6
14 sl+pr+pl+li+lu 86.8 5
15 sl+as+li+lu+dr 87.0
16 sl+as+li+dl+dr 86.2
17 li+sl+dl+dr 86.1 4
18 li+sl+lu+dr 86.8
19 li+sl+pr+lu 87.0
20 sl+as+pl+lu 86.4
21 sl+li+lu+dl 87.7*
22 sl+pl+li+lu 86.9
23 sl+as+li 85.3 3
24 sl+dl+li 86.3
25 sl+as+dr 84.7
26 Sl+li+lu 86.9
27 li+sl 85.0 2
28 sl+dr 84.3
Note: sl=slope, as=aspect, pr=profile curvature, pl=plan curvature, li=lithology, lu=laSusceptibility Index, *=Highest prediction accuracy. a = Max LSI = maximum landsli
approach in order to select and combine different num-ber of landslide factors among the eight landslide fac-tors. The possible numbers of combinations of 8, 7, 6, 5,4, 3 and 2 landslide factors from a set of 8 landslide factorsare 1, 8, 28, 56, 70, 56 and 28 respectively totaling to 247possible combinations (Table 2).
Result and discussionIn order to apply the frequency ratio model, the mostimportant first step is to prepare a database of landslidefactors and a landslide inventory map. This involvesdigitizing polygon features like lithology, land use andlandslide inventory; line feature like lineaments and riv-ers and preparing digital elevation model (DEM) deriva-tives such as slope, aspect, profile and profile and plan
up giving the best landslide susceptibility maps using
# of possiblecombinations
Min LSI (b) Max LSI (a) Difference(a-b)
1 2.54 38.95 36.41
8 2.46 29.73 27.27
1.58 36.59 35.01
2.37 37.74 35.37
2.36 36.03 33.67
2.41 36.66 34.25
2.04 32.80 30.76
1.92 32.76 30.84
28 1.4 33.67 32.27
2.29 28.70 26.41
2.36 26.81 24.45
1.79 23.90 22.11
14.42 26.61 25.19
56 1.29 32.20 30.91
1.24 23.69 22.45
1.28 17.79 16.51
70 1.17 16.34 15.17
1.07 22.46 21.39
0.67 26.03 25.36
0.77 25.21 24.44
0.27 22.78 22.51
0.79 26.05 25.56
56 0.28 12.09 11.81
0.27 13.57 13.30
1.07 13.42 12.35
0.17 19.86 19.69
28 0.17 10.64 10.47
0.04 11.13 11.09
nd use, dl=distance from lineament, dr=distance from river, LSI=Landslidede susceptibility index, b = Min LSI = minimum landslide susceptibility index.
Meten et al. Geoenvironmental Disasters (2015) 2:9 Page 14 of 17
curvatures in Arc GIS 10. The distance from lineamentand distance from rivers are obtained from multiple ringbuffering operation. Then all the data should be trans-formed into a raster format with the same geographicprojection and pixel size (30 m). The frequency ratiomodel was applied to obtain a weight for each class ina certain factor. From the frequency ratio analysis,slope classes ≥ 20° have shown a strong correlationwith landslides. In case of aspect, the southeast, southand southwest facing slopes showed a strong correl-ation with landslides. For profile and plan curvatures,the higher positive values and the lower negative valuesshowed a strong relationship with landslides. Distancefrom lineament and landslides showed a strong relation-ship. As the distance from lineament decreases, the fre-quency ratio values become higher. In a the distance classof 0–200 m, the highest landslide frequency is recorded.From land use classes, barren land, sparse forest andgrassland classes showed a strong relation with landslides.Among lithologic units in the area, Mesozoic LowerSandstone, Tertiary Lower Basalt and Tertiary UpperBasalt showed a strong relationship with landslides. Thefrequency ratio values were assigned to each factor clas-ses and all these raster maps of landslide factors wereadded to produce the landslide susceptibility indexmaps based on the mathematical combination theory.The frequency ratio model has some limitations des-
pite its easiness and simplicity to understand and imple-ment in a GIS environment. Higher frequency ratiovalues will be found if the area ratio (area percentage)is lower than the landslide ratio (landslide percentage)irrespective of higher number of landslides in a certainfactor class. After the frequency ratio raster maps of allthe landslide factors are prepared, the next step is to addthese raster maps based on the mathematical combin-ation theory. However, before combining the landslidefactors it is important to ascertain their independencefrom each other (Van Westen et al. 2003, Dahal et al.2008). For this purpose logistic regression was applied,although the pairwise comparison was preferred by
Table 3 Correlation matrix of landslide factors
Distance fromlineament
Land use Slope
Distance from lineament 1 −0.085 −0.249
Land use 1 −0.086
Slope 1
Lithology
Aspect
Plan curvature
Profile curvature
Distance from river
many researchers (Dahal et al. 2008, Regmi et al. 2010a).In this study, the raster maps of the frequency ratiovalues for the eight landslide factors were extracted withlandslide and non-landslide points. These are processed inSPSS statistical software in such a way that landslide rep-resents the presence (1) and non-landslide the absence (0)and each factor’s frequency ratio values were analyzed bybinary logistic regression in order to check the degree ofcorrelation among landslide factors. Based on this analysis,all the correlations between two different landslide factorsshowed either no or very insignificant correlation i.e. < 0.1(Table 3). This suggests that all the factors are independ-ent from each other and can be used for the combinationto prepare a landslide susceptibility map.From the set of eight landslide factor maps, 8, 7, 6, 5,
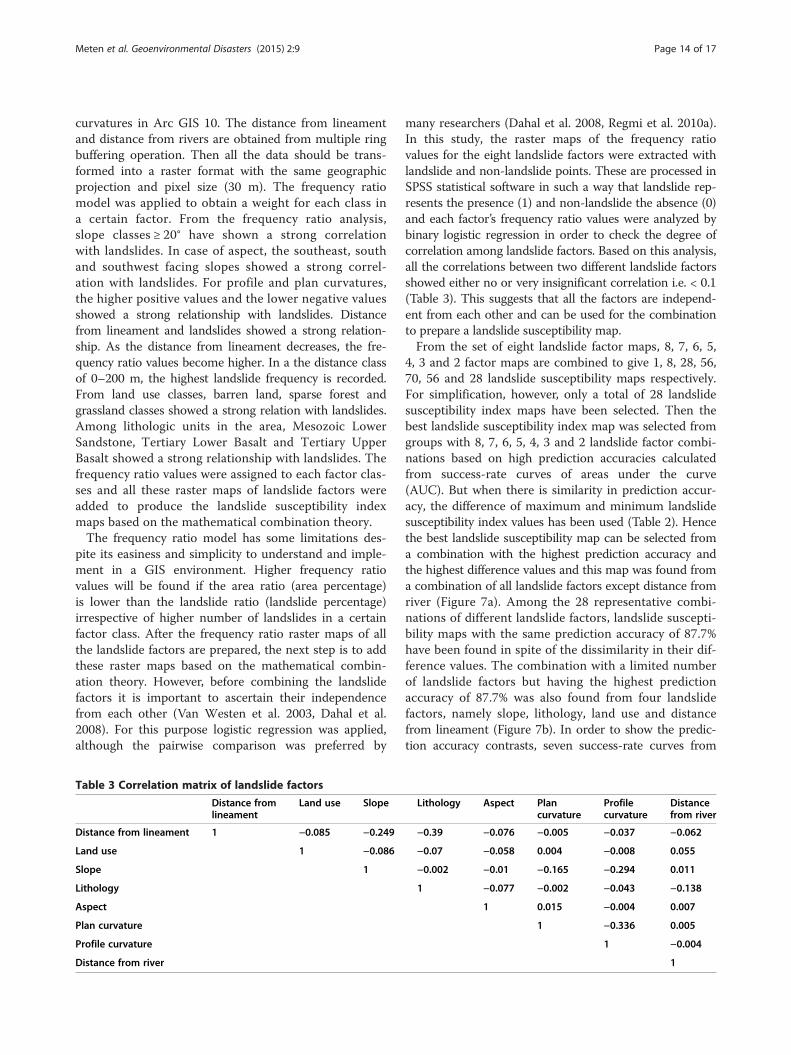
4, 3 and 2 factor maps are combined to give 1, 8, 28, 56,70, 56 and 28 landslide susceptibility maps respectively.For simplification, however, only a total of 28 landslidesusceptibility index maps have been selected. Then thebest landslide susceptibility index map was selected fromgroups with 8, 7, 6, 5, 4, 3 and 2 landslide factor combi-nations based on high prediction accuracies calculatedfrom success-rate curves of areas under the curve(AUC). But when there is similarity in prediction accur-acy, the difference of maximum and minimum landslidesusceptibility index values has been used (Table 2). Hencethe best landslide susceptibility map can be selected froma combination with the highest prediction accuracy andthe highest difference values and this map was found froma combination of all landslide factors except distance fromriver (Figure 7a). Among the 28 representative combi-nations of different landslide factors, landslide suscepti-bility maps with the same prediction accuracy of 87.7%have been found in spite of the dissimilarity in their dif-ference values. The combination with a limited numberof landslide factors but having the highest predictionaccuracy of 87.7% was also found from four landslidefactors, namely slope, lithology, land use and distancefrom lineament (Figure 7b). In order to show the predic-tion accuracy contrasts, seven success-rate curves from
Lithology Aspect Plancurvature
Profilecurvature
Distancefrom river
−0.39 −0.076 −0.005 −0.037 −0.062
−0.07 −0.058 0.004 −0.008 0.055
−0.002 −0.01 −0.165 −0.294 0.011
1 −0.077 −0.002 −0.043 −0.138
1 0.015 −0.004 0.007
1 −0.336 0.005
1 −0.004
1
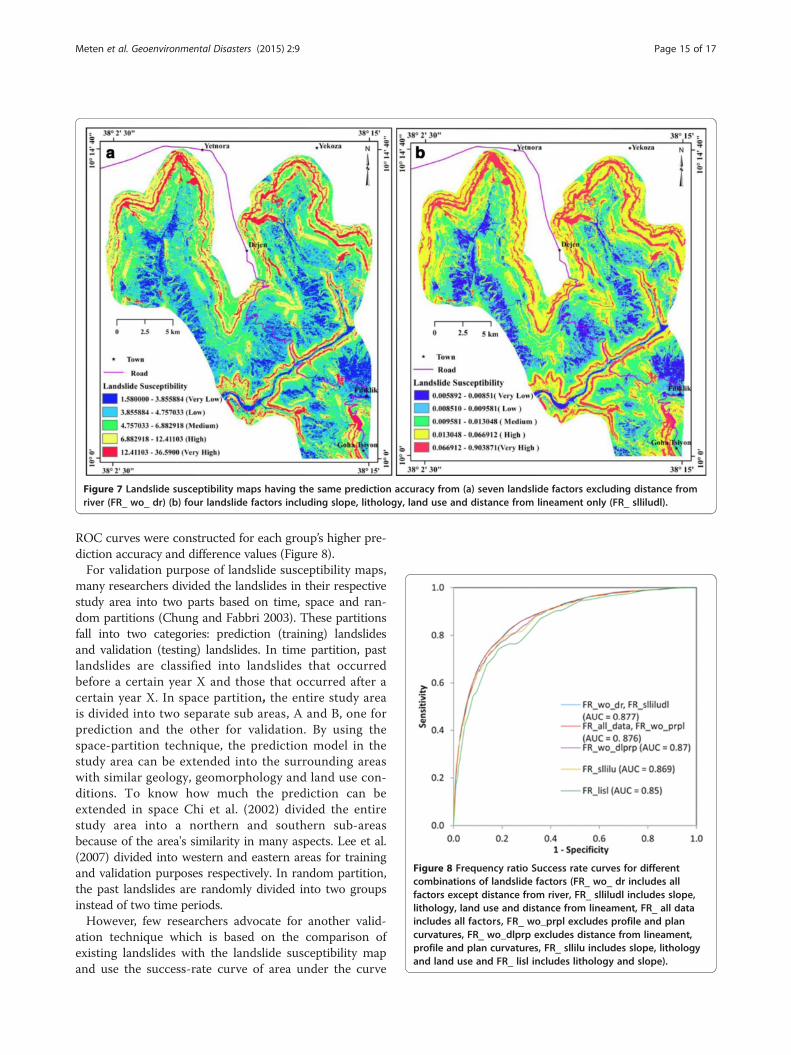
Figure 7 Landslide susceptibility maps having the same prediction accuracy from (a) seven landslide factors excluding distance fromriver (FR_ wo_ dr) (b) four landslide factors including slope, lithology, land use and distance from lineament only (FR_ slliludl).
Figure 8 Frequency ratio Success rate curves for differentcombinations of landslide factors (FR_ wo_ dr includes allfactors except distance from river, FR_ slliludl includes slope,lithology, land use and distance from lineament, FR_ all dataincludes all factors, FR_ wo_prpl excludes profile and plancurvatures, FR_ wo_dlprp excludes distance from lineament,profile and plan curvatures, FR_ sllilu includes slope, lithologyand land use and FR_ lisl includes lithology and slope).
Meten et al. Geoenvironmental Disasters (2015) 2:9 Page 15 of 17
ROC curves were constructed for each group’s higher pre-diction accuracy and difference values (Figure 8).For validation purpose of landslide susceptibility maps,
many researchers divided the landslides in their respectivestudy area into two parts based on time, space and ran-dom partitions (Chung and Fabbri 2003). These partitionsfall into two categories: prediction (training) landslidesand validation (testing) landslides. In time partition, pastlandslides are classified into landslides that occurredbefore a certain year X and those that occurred after acertain year X. In space partition, the entire study areais divided into two separate sub areas, A and B, one forprediction and the other for validation. By using thespace-partition technique, the prediction model in thestudy area can be extended into the surrounding areaswith similar geology, geomorphology and land use con-ditions. To know how much the prediction can beextended in space Chi et al. (2002) divided the entirestudy area into a northern and southern sub-areasbecause of the area's similarity in many aspects. Lee et al.(2007) divided into western and eastern areas for trainingand validation purposes respectively. In random partition,the past landslides are randomly divided into two groupsinstead of two time periods.However, few researchers advocate for another valid-
ation technique which is based on the comparison ofexisting landslides with the landslide susceptibility mapand use the success-rate curve of area under the curve
Meten et al. Geoenvironmental Disasters (2015) 2:9 Page 16 of 17
(AUC) to assess the prediction accuracy qualitatively(Lee and Talib 2005; Lee and Sambath 2006; Pradhan2010a; Pradhan 2011). The success rate curve explainshow well the model and the factor predict landslides(Chung and Fabbri 2003) and it was constructed for therepresentative combinations of seven groups in the studyarea (Table 2). After an overlay analysis of landslideswith the best landslide susceptibility map, the numberof landslides that fall into each susceptibility class wascalculated. If the number of landslides is very significantin the high and very high susceptibility classes, then thelandslide susceptibility map can be considered accurateand reliable to predict future landslides. The predictionaccuracy that is used for selection of best susceptibilitymap was derived from the success - rate curves. In thisstudy, the percentage of landslides in each susceptibilityclass were calculated to check the validity of the finalsusceptibility map. For this, all the landslides have beenoverlaid over the final landslide susceptibility map. Indoing so, 0.39%, 1.84%, 9.1%, 32.04% and 56.63% of thelandslides fall in the very low, low, medium, high and veryhigh landslide susceptibility classes respectively (Figure 9).
ConclusionFrom this study, we have found that the mathematicalcombination theory is an important technique to identifythe possible number of combinations in the frequencyratio model. This paper showed that using all landslidefactors in the frequency ratio model may not alwaysresult in higher prediction accuracy even though therange of values in the susceptibility index map is higher.For example, the combination of 8 landslide factors resultsa prediction accuracy of 87.6%, while the combinations ofall landslide factors except distance from the river pro-vided an accuracy 87.7%. This shows that distance fromriver is less important as compared to other factors. Butthe landslide susceptibility index (LSI) difference valuealways higher in the combination with higher number of
Figure 9 Percentage of lndslides in each landslide susceptibility class
landslide factors. On the other hand, different combina-tions may result the same and high prediction accuracy.For instance, the combination from seven landslide factors(except distance from river) and the combination fromfour landslide factors (slope, lithology, land use anddistance from lineament) showed the same predictionaccuracy of 87.7%. This showed that these four landslidefactors should have a greater degree of influence incausing landslides. A prediction accuracy as high as 85%was also possible from a combination of slope & lithologyonly. This demonstrates how these two factors are verymuch important in causing landslide occurrence. Highprediction accuracy & LSI difference values are used toselect the best landslide susceptibility map. By selecting2 to 8 numbers of landslide factors from a set of 8 land-slide factors, a total of 247 landslide susceptibility mapcombinations are possible. However 28 combinationswere selected based on higher prediction accuracy fromsuccess rate curves, higher LSI difference values andthrough visual inspection of output susceptibility maps.An optimum landslide susceptibility map was preparedfrom four landslide factors (lithology, slope, land useand distance from lineament) while the best landslidesusceptibility map was obtained from the combinationof 7 landslide factors excluding distance from river(Figure 7a, b). Both maps have the prediction accuracyof 87.7% but with different LSI difference values of35.01 and 25.51 respectively. In order to highlight theprediction accuracy contrasts of landslide susceptibilitymaps from success-rate curves were chosen from the 28combinations as shown in Table 2.Once the most important landslide factors are deter-
mined in a certain area, then these can be used to scaleup the investigation at the regional level using thesecausative landslide factors. When landslide inventorymap is overlaid over the best landslide susceptibilitymap, most of the landslides fall in the high and very highsusceptibility classes accounting for 88.67% of the
for FR_ wo_ dr.
Meten et al. Geoenvironmental Disasters (2015) 2:9 Page 17 of 17
landslides. Besides this the success-rate of this map isbeing 87.7%, proving that the landslide susceptibilitymap from the frequency ratio model in the study area isquite acceptable. After the best and optimal landslidesusceptibility maps (Figure 7 a, b) are selected thesemaps are divided into five categories and are expressedas probabilities in qualitative terms of very low, low,medium, high and very high susceptibility classes. Usingthis output, proper planning can be made to prevent,reduce or mitigate the possibility of future landslide di-sasters in this area. Creating awareness about the risk ofhigh and very high susceptible zones to the general pub-lic will help to save the lives and properties of thepeople. Susceptibility, hazard and risk maps are thebasis for decision making usually in the form of tech-nical countermeasures, regulatory measures or combi-nations of the two (Pradhan et al. 2011).
Competing interestsThe authors declare that we do not have any financial or non-financialcompeting interests with any individual or institution.
Authors’ contributionsMM as a first author, has mostly participated in the whole process includingfield work, data collection, database preparation,compiling the results fromhimself and from PB, taking comments from RY, address the comments andfinalize the draft for journal submission after a consensus is reached with RYand PB. PB has participated from the inception and design of this paper andhelped greatly in data preparation and analysis. RY has also involved in adetailed review of the manuscript before submission. Both authors havegiven the final approval of the version to be published.
AcknowledgementsThe first author would like to thank Japan’s Ministry of Education, Culture,Science and Technology (MEXT) for the scholarship grant to pursue the PhDstudy.
Received: 26 November 2014 Accepted: 10 February 2015
ReferencesAsfaw YE (2010) Landslide assessment in the Blue Nile Gorge. University Ghent,
Master Thesis, September, Central Ethiopia, 2010Ayalew L (1999) The effect of seasonal rainfall on landslides in the highlands of
Ethiopia. Bull Eng Geol Env 58:9–19, 7 Q Springer-VerlagAyalew L, Yamagishi H (2004) Slope failures in the Blue Nile basin, as seen from
landscape evolution perspective. Geomorphology 57(2004):95–116Bui DT, Pradhan B, Lofman O, Revhaug I, Dick OB (2012) Landslide Susceptibility
Assessment at Hoa Binh Province of Vietnam Using Frequency Ratio Model.2012 Asia Pacific Conference on Environmental Science and Technology.Advances in Biomedical Engineering 6:476
Carson MA, Kirkby MJ (1972) Hillslope Form and Process. Cambridge UniversityPress, London, 475 pp
Chi KH, Park NW, Chang CJ (2002) Fuzzylogic integration for landslide hazardmapping using spatial data from Boeun, Korea. Symposium on GeospatialTheory, processing and applications, Ottawa
Chung CJF, Fabbri AG (2003) Validation of Spatial Prediction Models for LandslideHazard Mapping. Nat Hazards 30(451–472):2003
Clerici A, Perego S, Tellini C, Vescovi P (2006) A GIS-based automated procedurefor landslide susceptibility mapping by the Conditional Analysis method: theBaganza valley case study (Italian Northern Apennines). Environ Geol50:941–961, doi:10.1007/s00254-006-0264-7
Dahal RK, Hasegawa S, Nonomura A, Yamanaka M, Dhakal S, Paudyal P (2008)Predictive modelling of rainfall-induced landslide hazard in the Lesser HimalayaofNepal based on weights-of-evidence. Geomorphology 102:496–510
Ercanoglu M, Gokceoglu C (2002) Assessment of landslide susceptibility for alandslide-prone area (north of Yenice, NW Turkey) by fuzzy approach. EnvironGeol 41:720–730, doi:10.1007/s00254-001-0454-2
Farrokhnia A, Pirasteh S, Pradhan B, Pourkermani M and Arian M (2010) A recentscenario of mass wasting and its impact on the transportation on Albrozmountains, Iran using geo-information technology. Arab J Geosci.doi:10.1007/s 12517-010-0238-7
Fell R, Corominas J, Bonnard C, Cascini L, Leroi E, Savage WZ (2008) Guidelinesfor landslide susceptibility, hazard and risk zoning for land use planning. EngGeol 102(2008):85–98
Godt JW, Baum RL, Savage WZ, Salciarini D, Schulz WH, Harp EL (2008) Transientdeterministic shallow landslide modeling, Requirements for susceptibility andhazard assessments in a GIS framework. Eng Geol 102:214–226
Hack JT, Goodlett JC (1960) Geomorphology and forest ecology of a mountainregion in the central Appalachians. United States Geological Survey,Professional Paper 347:66
IUGS (1997) Quantitative risk assessment for slopes and landslides- the state ofthe art. In: Cruden D, Fell R (eds) Landslide risk assessment. Balkema,Rotterdam, pp 3–12
Lee S, Pradhan B (2007) Landslide Hazard mapping at Selangor, Malaysia usingfrequency ratio and logistic regression model. Landslides 4:33–41,doi:10.1007/s10346-006-0047-y
Lee S, Sambath T (2006) Landslide susceptibility mapping in the Damrei Romelarea, Cambodia using frequency ratio and logistic regression models. EnvironGeol 50:847–855, doi:10.1007/s00254-006-0256-7
Lee S, Talib JA (2005) Probabilistic landslide susceptibility and factor effectanalysis. Environ Geol 47:982–990, doi:10.1007/s00254-005-1228-z
Lee S, Choi J, Woo I (2004) The effect of spatial resolution on the accuracy oflandslide susceptibility mapping: a case study in Boun, Korea.Geosci J 8(No. 1):51–60
Lee S, Ryu JH, Kim LS (2007) Landslide susceptibility analysis and its verification usinglikelihood ratio, logistic regression, and artificial neural network models: casestudy of Youngin, Korea. Landslides 4:327–338, doi:10.1007/s10346-007-0088-x
Ohlamacher GC (2007) Plan curvature and landslide probability in regionsdominated by earth flows and earth slides. Eng Geol 91(2007):117–134
Pirasteh S, Woodbridge K, Rizvis SMA (2009) Geo-information technology (GiT)and tectonic signatures: the River Karun and Dez, Zagros Orogen in south-westIran. Int J Remote Sens 30(No. 2):389–403
Pradhan B (2010a) Landslide susceptibility mapping of a catchment area usingfrequency ratio, fuzzy logic and multiple logistic regression approaches.J Indian Soc Remote Sens 38:301–320, Springer
Pradhan B (2011) Manifestations of an advanced fuzzy logic model coupled withGeo-information techniques to landlside susceptibility mapping and theircomparison. Environ Ecol Stat. 18-471-493 doi:10. 1007/s10651-010-0147-7.
Pradhan B, Mansor S, Pirasteh S, Buchroithner MF (2011) Landslide hazard andrisk analyses at a landslide prone catchment area using statistical basedgeospatial model. Int J Remote Sens 32(No. 14):4075–4087
Regmi NR, Giardino JR, Vitek JD (2010a) Modeling susceptibility to landslidesusing the weights of evidence approach: Western Colorado, USA.Geomorphology 115:172–187
Reneau SL, Dietrich WE (1987) The importance of hollows in debris flow studies;examples from Marin County, California. In: Costa, J.E., Wieczorek, G.F. (Eds.),Debris Flows/Avalanches: Process, Recognition, and Mitigation. GeologicalSociety of America, Boulder, Colorado. Rev Eng Geol VII:165–180
Ruff M, Czurda K (2008) Landslide susceptibility analysis with a heuristic approachin the Eastern Alps (Vorarlberg, Austria). Geomorphology 94(2008):314–324
Temesgen B, Mohammed U, Korme T (2001) Natural Hazard Assessment Using GISand Remote Sensing Methods, with Particular Reference to the Landslides inthe Wondogenet Area, Ethiopia, Pergamon. Phys Chem Earth 26(No. 9):665–e
Terlien MTJ (1998) The determination of statistical and deterministic hydrologicallandslide-triggering thresholds. Environ Geol 35(2–3):124–130
Terlien MTJ, Van Westen CJ, Van Asch TWJ (1995) Deterministic modelling in GISbased landslide hazard assessment. In: Carrara A, Guzzetti F (eds)Geographical Information System in Assessing Natural Hazard. KluwerAcademic Publishers, Dordrecht pp 57–77
Van Westen CJ, Rengers N, Soeters R (2003) Use of geomorphological informationinindirect landslide susceptibility assessment. Nat Hazards 30:399–419
Woldearegay K (2008) Characteristics of large-scale landslide triggered by heavyrainfall in Tarmaber area, Central Highlands of Ethiopia. Geophysical Research10: , EGU2008-A-04506,2008, SRef – ID:1607-7962/gra/EGU2008-A-04506 EGUGeneral Assembly 2008