effect of localization, length and orientation of chondrocytic primary
TRANSCRIPT
Journal of Theoretical Biology 285 (2011) 147–155
Contents lists available at ScienceDirect
Journal of Theoretical Biology
0022-51
doi:10.1
n Corr
E-m
christia
hannah
knrettin
georgem1 Pe
230-B S2 Pe
92121,3 Pe
Santa C
journal homepage: www.elsevier.com/locate/yjtbi
Effect of localization, length and orientation of chondrocytic primary ciliumon murine growth plate organization
Maria-Grazia Ascenzi a,n, Christian Blanco b,1, Ian Drayer b, Hannah Kim b, Ryan Wilson b,Kelsey N. Retting c,2, Karen M. Lyons c, George Mohler b,d,3
a Department of Orthopedic Surgery, University of California at Los Angeles, Rehabilitation Building 22-69, 1000 Veteran Avenue, Los Angeles, CA 90095, USAb Department of Mathematics, University of California at Los Angeles, Math Sciences Building 6363, 520 Portola Plaza, Los Angeles, CA 90095, USAc Department of Orthopedic Surgery, University of California at Los Angeles, 615 Charles E Young Drive South, Los Angeles, CA 90095, USAd Department of Mathematics and Computer Science, Santa Clara University, 500 El Camino Real, Santa Clara, CA 95053, USA
a r t i c l e i n f o
Article history:
Received 3 December 2010
Received in revised form
14 June 2011
Accepted 16 June 2011Available online 23 June 2011
Keywords:
Chondrocyte
Growth plate
Interactive particle system
Cilium
Self-organization
93/$ - see front matter & 2011 Elsevier Ltd. A
016/j.jtbi.2011.06.016
esponding author. Tel.: þ1 310 825 6341; fax
ail addresses: [email protected] (M
[email protected] (C. Blanco), dinoian@y
[email protected] (H. Kim), [email protected] (R
[email protected] (K.N. Retting), klyons@medn
[email protected] (G. Mohler).
rmanent address: Department of Mathemat
tephens Hall, Berkeley, CA 94720, USA.
rmanent address: Pfizer Inc., 9381 Judicial D
USA.
rmanent address: Department of Mathema
lara University, 500 El Camino Real, Santa Cla
a b s t r a c t
The research investigates the role of the immotile chondrocytic primary cilium in the growth plate. This
study was motivated by (i) the recent evidence of the mechano-sensorial function of the primary cilium in
kidney tubule epithelial cells and (ii) the distinct three-dimensional orientation patterns that the
chondrocytic primary cilium forms in articular cartilage in the presence or the absence of loading.
For our investigation, we used the Smad1/5CKO mutant mouse, whose disorganized growth plate is due to
the conditional deletion of Smad 1 and 5 proteins that also affect the so-called Indian Hedgehog pathway,
whose physical and functional topography has been shown to be partially controlled by the primary cilium.
Fluorescence and confocal microscopy on stained sections visualized ciliated chondrocytes. Morphometric
data regarding position, orientation and eccentricity of chondrocytes, and ciliary localization on cell
membrane, length and orientation, were collected and reconstructed from images. We established that
both localization and orientation of the cilium are definite, and differently so, in the Smad1/5CKO and control
mice. The orientation of the primary cilium, relative to the major axis of the chondrocyte, clusters at 801
with respect to the anterior–posterior direction for the Smad1/5CKO mice, showing loss of the additional
clustering present in the control mice at 101. We therefore hypothesized that the clustering at 101 contains
information of columnar organization. To test our hypothesis, we prepared a mathematical model of
relative positioning of the proliferative chondrocytic population based on ciliary orientation. Our model
belongs to the category of ‘‘interactive particle system models for self-organization with birth’’. The model
qualitatively reproduced the experimentally observed chondrocytic arrangements in growth plate of each
of the Smad1/5CKO and control mice. Our mathematically predicted cell division process will need to be
observed experimentally to advance the identification of ciliary function in the growth plate.
& 2011 Elsevier Ltd. All rights reserved.
1. Introduction
The biological function of the immotile primary cilium, virtuallyone per eukaryotic cell, has been hypothesized within the last
ll rights reserved.
: þ1 310 825 5290.
.-G. Ascenzi),
ahoo.com (I. Drayer),
. Wilson),
et.ucla.edu (K.M. Lyons),
ics, University of California,
rive Suite 200, San Diego, CA
tics and Computer Science,
ra, CA 95053, USA.
25 years as critical for mechano-transduction and fundamental todevelopment and physiology of essentially all organisms fromparamecia to humans (Poole et al., 1985; Rydholm et al., 2008;Christensen et al., 2008; Haycraft and Serra, 2008). Ciliary localiza-tion at the membrane of growth plate chondrocytes has been foundto be consistently proximal and distal on the chondrocytic mem-brane (Song et al., 2007). Ciliary incidence and length of articularchondrocytic primary cilium participate in the mechano-sensorymechanism (McGlashan et al., 2010), and ciliary orientation formsthree-dimensional (3D) patterns in the articular cartilage in relationto presence and absence of loading (Wilsman and Farnum, 1986).The role of ciliary localization, length and orientation in the 3Dbiological environment of the growth plate is unknown.
Under normal conditions, the growth plate is a highly organizedtissue responsible for bone growth (Hunziker, 1994). Chondrocytesform longitudinal columns divided transversely in adjacent zones

Fig. 2. Proximal femur’s growth plate of double knockout mouse Smad1/5CKO and
WT littermate: (a) Alcian blue-stained sections show lack of chondrocytic
columnar arrangements in Smad1/5CKO, present in WT mouse. Ectopic cartilage
is present in the enlarged perichondrium of the mutant (see also Fig. 4 of Retting
et al., 2009). (b) Fluorescent microscopy images show primary cilia (red) and
nuclei (blue) of chondrocytes that appear lighter than the surrounding ECM.
M.-G. Ascenzi et al. / Journal of Theoretical Biology 285 (2011) 147–155148
indicative of specific stages of chondrocytic development, namelyproliferative, pre-hypertrophic and hypertrophic, with cell size andshape differing among the growth plate zones (Dodds, 1930;Hunziker et al., 1987). Because alterations of the growth platepatterns due to abnormal biological processes are readily apparentthrough growth plate disorganization and because the primarycilium can be rendered visible by fluorescent tagging, we chose thegrowth plate as the appropriate environment to study the orientationof the primary cilium in animal models.
The growth plate’s organized structure reflects the normal func-tion resulting from an orchestrated interplay of signaling pathways.The Tg737orpk mouse shows fewer and smaller cilia in the chondro-cytes of the growth plate relative to a control littermate, which showsmore abundant cilia with defined orientations (McGlashan et al.,2007). Ciliogenesis is impaired by the lack of the IFT protein polaris
that normally localizes at the primary cilium and is required for Sonichedgehog signaling (Ingham and McMahon, 2001). Further, micehomozygous for mutations of Kif3, a component of the kinesin-IImotor protein complex required for ciliary assembly, exhibit a lack ofprimary cilium in growth plate chondrocytes, coupled with adisorganization of the growth plate that disrupts the normal prefer-ential orientation of chondrocytes (Haycraft et al., 2005, 2007).However, the function of the primary cilium in chondrocytes as wellas other cell types remains unclear (Poole et al., 1985; Haycraft et al.,2007; Wheatley et al., 1996; Praetorious and Spring, 2005; Olsen,2005; Blacque et al., 2006; Esteban et al., 2006; Fliegauf and Omran,2006). We have explored the existence of patterns of localization,length and orientation of the primary cilium in growth platechondrocytes (Fig. 1) of mice models in our quest to understandciliary function.
Because the primary cilium is closely related to the Golgi complexand the centrosome, with which it shares the elder centriole, andbecause the centriole and the centrosome control cell polarity (Follitet al., 2006; Goncalves et al., 2010; Feldman et al., 2007), we haveexperimentally investigated the distribution of localization ofaxonemal projection from the chondrocyte into the extra cellularmatrix (ECM), and the length and orientation of the primary cilium in3D in relation to chondrocytic eccentricity and orientation in thegrowth plate of mice models. We have chosen to investigate thedouble knockout mouse Smad 1/5 conditional with Col2-cre(Smad1fx/fx;Smad5fx/fx;Col2-Cre, henceforth referred to as Smad1/5CKO)(Retting et al., 2009) and its wild type (WT) control because of theSmad1/5CKO’s disorganized growth plate (Fig. 2) and altered Hedge-hog pathway, previously found to be mediated by primary cilia(Huangfu and Anderson, 2005). We have chosen the end of gestationfor the animals’ age because Smad1/5CKO dies at birth.
Fig. 1. The primary cilium of proliferative chondrocytes of wild type mouse at the
end of gestation by confocal microscopy: (a) the chondrocytic cilia are visible by
monoclonal anti-acetylated-a-tubulin (in red). For the yellow portion of (a), we
show in (b) the chondrocytic nucleus stained with DAPI (blue) and in (b, c) the
endogenous fluorescence is used to visualize the background (darker green).
Mathematical models of growth plate have focused on (1) elonga-tion of bone that the growth plate causes under the hypothesis thatelongation occurs as a mechano-sensory response with the epiphy-seal cartilage reacting to the local magnitude of stresses (Kummerand Lohscheidt, 1985) and (2) specific models of the process of celldivision internal to mother and daughter cells (McKenney andNickel, 1997; Novak and Tyson, 1993). Mathematical models of cellcycle have also viewed populations of cells as communicatingthrough networks (Sible and Tyson, 2007). In order to(i) understand the correlation between the various cellular andciliary parameters observed experimentally under normal andgenetically altered conditions; and (ii) explore the possibility of theexistence of a mechanism of cell division that involves the 3Dorientation of the cilium, we have prepared a computer simulationof a proliferative cell population based on our experimental observa-tion. Further, dynamic mathematical models are developed todescribe bone’s biological processes (Ayati et al., 2010).
The novelty of our mathematical model of cell division is theinclusion of the orientation of the primary cilium in 3D in the cellpopulation signaling that determines the position of the daughtercell with respect to the mother cell. Our mathematical modelapplies to both Smad1/5CKO and WT control. Cellular eccentricityand ciliary localization of projection, length and orientation, arethe input variables. The output is the arrangement of the ciliatedchondrocytes.
2. Methods
2.1. Experimental methods
The Smad1/5CKO mutant mouse was obtained as described byFeldman et al. (2007). Briefly, Smad1 (Huang et al., 2002) andSmad5 (Umans et al., 2003) floxed mice were crossed withCol2-Cre mice (Ovchinnikov et al., 2000) to generate Smad1fx/

M.-G. Ascenzi et al. / Journal of Theoretical Biology 285 (2011) 147–155 149
fx;Col2-Cre and Smad5fx/fx;Col2-Cre mice (referred to as Smad1CKO
and Smad5CKO, respectively; CKO, cartilage-specific knockout).Smad1fx/þ ;Smad5fx/þ ;Col2-Cre mice were intercrossed to gener-ate Smad1fx/fx;Smad5fx/fx mice (Smad1/5CKO).
Immunocytochemistry, fluorescence microscopy and confocalmicroscopy were combined to visualize ciliated chondrocytes inthe growth plate of mice ex vivo. Embryos were harvested at 16.5days of gestation (E16.5) from Smad1/5CKO mice and their WTcontrol littermates. Mice were fixed overnight in formalin, thendecalcified in formic acid overnight, and embedded in paraffin.Hind limbs were isolated from six male Smad1/5CKO mutants andfrom six male WT mice. 7 and 30 mm thick longitudinal sectionswere boiled for 15 min in citrate buffer (Ivkovic et al., 2003).Sections were blocked with 5% goat serum for 1 h and incubatedovernight at 4 1C with monoclonal anti-acetylated tubulin(Sigma) as the primary antibody. Sections were incubated withAlexaFluor-555-conjugated secondary antibody (Invitrogen) for1 hour at room temperature and counterstained with DAPI(Vectashield).
We employed a Leica TCS-SP scanning confocal microscope(Heidelberg, Germany) at UCLA’s Imaging Core Facility.To observe the 30 mm thick sections we used a 20� Planapo-chromat lens together with an argon ion gas laser set at Alexa488 nm to capture the endogenous green fluorescence of thebackground (Kim and Suh, 2007), a 561 nm diode pumped solidstate laser to excite the red fluorochromes of tagged cilia, and aSpectra-Physics Millenia X 532 nm diode pump laser and aTsunami picosecond titanium sapphire laser to produce thepulsed infrared beam required for excitation of DAPI-taggednuclei. The 2photon DAPI was set at 770 nm and exciting around385 nm. Because the plane of focus had a thickness of 2.53 mm at20� , we scanned every 1.26 mm, which equals half the amplitudeof the Gaussian curve (Pawley, 1995), to capture the tissuecontinuously without gaps or overlapping. Light detected byphotomultipliers was converted to pseudo-color for good visua-lization: background as dark green, primary cilia red and nuclei aslight blue (Fig. 1). Cilia appear as rods or dots projecting from themembrane of the chondrocyte contrasted by the darker back-ground. Images were collected through the thickness of thespecimens in terms of so-called z-stacks.
Data were collected on each deconvoluted image from theproliferative zone of the WT and from the region of the Smad1/
5CKO growth plate corresponding to the proliferative zone of theWT following published methods (Ascenzi et al., 2007; Donnellyet al., 2010). This choice was due to the impossibility to discernspecific zones within the disorganized growth plate of Smad1/
5CKO. Briefly, the 250 mm�250 mm tiff images of each of the z-stacks were analyzed at 120� magnification. Each of the tiffimages was imported into XaraX1 software. Consistently throughthe stack, an xy reference system was chosen on the plane of eachimage, with the x-axis along the medial–lateral direction and they-axis along the axis of the bone. Further, the specimen thicknessparalleled the z-axis pointing towards the posterior aspect. Eachimage was analyzed from top to bottom and from left to right. Thecells that appeared with their cilium were numbered by their firstappearance as the z-stack was examined from top to bottom. Oneach image, an ellipse was adapted to each optical section of eachvisible cell and the major and minor axes of each ellipse marked.A segment was then overlapped to each visible fluorescent detailthat was interpreted as a cilium. The first and last scan numberson which the cell appeared with or without its cilium wererecorded. On each image on which the cell appeared with itscilium, the x and y coordinates of the ellipse center were recorded,and the major axis length, the major axis angle and the minor axislength were measured. The area of each ellipse was computedfrom the axes’ lengths. Length and angle with respect to the x-axis
of the segments drawn on cilia were measured. The x and y
coordinates of the initial and final points of segment wererecorded. To assess orientation of major cell axis and ofprimary cilium in 3D, we used the azimuth angle y (or longitude)in the xy-plane measured from the x-axis and the zenith angle j(or co-latitude, angle out of the xy-plane) measured from thepositive z-axis.
We then used the ciliary yj-algorithm (Ascenzi et al., 2007) toconduct the 3D reconstruction in terms of the best-to-fit ellipsoidof each cell from the ellipses that fit the cell profiles on eachimage on which the cell appears. The 3D reconstruction of a givencilium was obtained by connecting the centroids of the first andlast segments on the z-stack that were overlapped to eachappearance of the cilium on the stack. The length of the ciliumin 3D was measured as the distance of the centroids of the firstand last segments. For each ciliated chondrocyte, we computed:cellular longitudinal position, cellular angles yce and jce of themajor axis of the ellipsoid that simulate the cell with respect tothe xyz system, cellular eccentricity as 1–(b/a)2 where a and b arethe maximum and minimum dimensions, respectively, alongperpendicular directions, the angles yci and jci that the ciliumforms with respect to the xyz system, and the angles yci,ce andjci,ce that the cilium forms with respect to the major axis of thecell. For each image obtained from fluorescence microscopy onthe 7 mm thick sections, data were collected following the methodapplied on a single image of the confocal z-stack.
During imaging of the growth plates for collection of z-stacks,proximal–distal orientation of the bone’s position in vivo wasmaintained, based on the characteristic morphological differencesof the epiphyseal and the metaphyseal bone. We did not differ-entiate between medial and lateral, and between anterior andposterior, aspects because of lack of morphological differences.Consequently, (i) the range of values for each of yci and yce withrespect to the bone’s reference reduces from 0–3601 to 0–1801;(ii) the range of values of the angle jci reduces from 0–1801 to0–901, and yci,ce ranges between 01 and 3601 and jci,ce reduces to0–901.
2.2. Statistical methods for experimental data analysis
We analyzed the data expressed as mean7standard deviationor as percentage per animal and per animal group, either Smad1/
5CKO or WT. We used one-way ANOVA to compare normallydistributed data or data whose normality could be achieved byusual transformations. Significant difference was set for p-valueo0.05 before considering the Bonferroni adjustment for multiplecomparisons. We used the Kolmogorov–Smirnov test to evaluatesignificant differences of distributions of theta cell between WTand Smad1/5CKO (Lehmann and Romano, 2005). We used non-parametric Chi squared analysis for data whose normality couldnot be achieved by transformations, i.e., axonemal length and theazimuth jci,ce. Because significant differences were not foundamong animals of the same group, data were presented by group,Smad1/5CKO and WT.
2.3. Mathematical modeling
We programmed MATLAB (Mathworks) to carry out oursimulation, which belongs to the category ‘‘interacting particlesystem for self-organization with birth’’ (Liggett, 1985).We modeled each 2D profile of ciliated chondrocytes on themedial–lateral–longitudinal plane with an ellipse. The positioningof the ellipses was produced by an algorithm that simulated theresult of cell division in the region defined as the proliferativezone of WT and corresponding region of the Smad1/5CKO. This is

M.-G. Ascenzi et al. / Journal of Theoretical Biology 285 (2011) 147–155150
a 3D algorithm because it depends on 3D experimental data. Weshow the results in 2-D. We assumed that
�
the primary cilium is required for growth plate organization(Song et al., 2007); � all proliferative cells within a growth plate divide at approxi-mately the same rate (Wilsman et al., 1996);
� cells divide along a plane perpendicular to the axis of themiotic spindle, which is directed transversely to the long axisof the bone (Dodds, 1930). After division, the daughter cellmoves (‘‘rotates’’) with respect to the mother cell to acquirethe stacked orientation in the normal animal (Song et al.,2007; Hunziker, 1994). Therefore, normal mother–daughtercell alignment (i.e., the orientation of the line that passesthrough the centers of mother and daughter cells) on themedial–lateral–longitudinal plane is modeled perpendicular toorientation of the cell on the medial–lateral–longitudinalplane;
� a daughter cell inherits mother’s orientation on the medial–lateral–longitudinal plane (Feldman et al., 2007);
� mother–daughter cell pairs tend to align in columns along thelongitudinal axis of the bone with normal cell signaling(Ascenzi et al., 2007);
� rotation of daughter cell after division with respect to themother cell depends on population cell-to-cell signaling(Christensen et al., 2008; Ahrens et al., 2009);
� cell population signaling for positioning of daughter celldepends on (i) the primary cilium angle jci,ce; and (ii) thedistance between signaling cell and daughter cell, with thecloser cells exerting the stronger signals, but all cells ofthe population participating in the signaling (Li and Dudley,2009; Satir and Christensen, 2008; Buxboim, 2010) and
� resistance of ECM to cell movement dominates inertia of cell tomove (Amini et al., 2010).
At the beginning of the process, the ellipses modeling thechondrocytes from the resting zone were distributed randomly(or spatially uniformly distributed (Daley and Vere-Jones, 2003)),not in columns, but rather in a square domain with localcoordinates that vary between 0 and 1. The experimentallycollected data were also normalized to such domain. Each divid-ing cell whose location was indicated by the vector m received asignal with strength sj from the jth cell whose location is providedby the position vector mj:
sj ¼ ktanhðZð45�jci,cej
ÞÞþ1
99n�nj992
ð1Þ
which corresponded to strong signal for jci,cej¼ 101 and weak
signal for jci,cej¼ 801. The non negative values of k and Z were
meant to be determined to match the experimental data. The totalsignal received by each dividing cell equaled the sum of thesignals defined by Eq. (1), emitted by each cell of the population,s¼
Pjsj. The polar angle determining both the mother and
daughter cell orientation, yce, is stochastically determined by
yce ¼utanhðsðu�90ÞÞþu, uA ½0,90�
ðu�180Þtanhðsð90�uÞÞþu, uA ð90,180�
(ð2Þ
where u uniformly ranges from 01 to 1801. The orientation of theline that connected the centers of the mother and daughter cellsequalled was modeled perpendicular to cellular orientation,ymd¼yce–90 within the medial–lateral–longitudinal plane. Thus,mother–daughter cell pairs tended to align in columns for highsignal. Cellular motion is modeled using Newton’s second lawthat describes the balance of cellular repulsive forces at shortdistances and resistance of the ECM to cell motion with the inertia
term neglected because we assumed that resistance of ECM to cellmotion dominates inertia, set to zero:
xniþriUi ¼ 0 ð3Þ
where x denotes the resistance coefficient of the ECM to cellmovement, ri denotes the gradient vector (defined in terms ofpartial derivatives) with respect to the location of the ith cell; andUi ¼
Pijf ðdijÞ where f(dij)¼e�dij for dijor and f(dij)¼0 for dijZr
denotes a truncated Morse potential, usually used in interactingparticle models to prevent particle collision at small distances.The parameter r represented the minimum distance among cellsand was meant to be determined by the experimental data. Inorder to update the positions of the cells after each cell division,Eq. (3) was solved to provide an equilibrium state of stable cellinteraction before another cell division occurred.
3. Results
We have investigated localization, axonemal length and orien-tation in 3D of the chondrocytic primary cilium in the disorga-nized growth plate of Smad1/5CKO mouse in comparison to the WTcontrol. The purpose was to detect morphological differences thatcould point to the biological role of primary cilium in the growthplate. Because the distinction among the morphological zones islost in the growth plate of the Smad1/5CKO (Feldman et al., 2007),the comparison between Smad1/5CKO and WT littermates wascarried out on the epiphyseal side of the growth plate thatcorresponds to the proliferative zone of the WT.
3.1. Experimental results
In general, some of the growth plate chondrocytes of theSmad1/5CKO maintain the characteristic localization, length andorientation in 3D of the chondrocytic primary cilium of the WTcontrol, while the remaining chondrocytes show definite differentcharacteristics.
Localization of projection of ciliary axoneme on the chondro-cytic membrane (Fig. 3) was investigated in relation to chondro-cytic size and shape. The chondrocytic profiles of the Smad1/5CKO
mouse were smaller than in the WT mouse (34.9713.5 vs.38.8713.6 mm2, n¼149, po0.01) and more numerous, as indi-cated by the larger area fraction (0.23 vs. 0.14, po0.01) (Fig. 2).The chondrocytic shape was assessed in terms of ‘‘roundness’’measured by eccentricity. Because a more pronounced roundnessis measured by a value of eccentricity closer to zero, thesignificantly lower values of chondrocytic eccentricity for theSmad1/5CKO in comparison to the WT (0.5670.20 vs. 0.7070.15for eccentricity, po0.01) indicated rounder shape in the Smad1/
5CKO than in the control. The chondocytes of Smad1/5CKO showed avariable orientation (measured by angle yce) with respect to themedial–lateral direction that differed significantly (p¼0.01) fromthe WT mouse, whose chondrocytic major axis essentially paral-lels the medial–lateral direction orientation with yce clustering at01 and 1801 (Fig. 4).
The localization of projection of the primary cilium into theECM is consistent with the chondrocytic orientation for bothSmad1/5CKO and WT. Ciliary projection occurred proximally ordistally for chondrocytes with normal medial–lateral polarity for92% of chondrocytes of Smad1/5CKO and 98% of chondrocytes ofWT (Fig. 4). Ciliary projection occurred medially or laterally in88% of the chondrocytes of the Smad1/5CKO when the major axisof the chondrocyte showed an orientation that differs fromthe medial–lateral polarity (88% vs. 98% for WT, po0.01).The location of ciliary emergence of the primary cilium fromthe cell membrane correlates with chondrocytic ‘‘roundness’’,

Fig. 4. Definite patterns of ciliary orientation in 3D. The distribution of values for
the azimuth angle of the primary cilium (see circumferential jci,ce) with respect to
its chondrocyte differs between the Smad1/5CKO and WT mice. One of the values of
clustering (jci,ce¼101) for WT is lost for the Smad1/5CKO. We hypothesize that the
clustering at 101 controls columnar arrangement in the WT, lost in the Smad1/5CKO.
The other angle yci,ce that together with jci,ce defines the orientation of the
primary cilium assumes random values (dots span radially the whole 0–3601
range) for both Smad1/5CKO and WT.
Fig. 3. Localization, length and orientation of primary cilium and orientation of
chondrocytes with respect to the medial–lateral axis. We offer examples (diagrams
not to scale) of ciliated cells to clarify distinct concepts and appearances in 2D and 3D.
The cilium appears shorter in (a) 2D than in (b) 3D. Such length may or may not be the
same as the cilia in (c—e) that we visualize in 2D only. In 2D, cilia (c) and (d) show
same orientation and different localization on the membrane; while (c) and (e) show
same localization and different orientation. (f) The Smad1/5CKO mutants show a wide
range of values (green), indicating that the major axis of the chondrocyte can form any
angle (between 01 and 1801) with the medio-lateral direction. In comparison, the
major axis of proliferative chondrocytes of the WT mice (blue) cluster at values 01 and
1801, indicating that for normal animals, the major axis of the chondrocyte in the
proliferative zone is somewhat parallel to the medial–lateral direction. (g) The white
lines through the cells denote cellular orientation in the medial–lateral–longitudinal
plane.
Table 1The length of the ciliary axoneme measured in 3D.
Length in mm Smad1/5CKO WT
n 48 36
min 1.1 1.1
max 5.2 5.1
mean 2.8 3.1
stdev 1.1 1.5
median 2.6 2.6
p40.46
Fig. 5. Mathematical modeling on the basis of experimental data. This diagram
illustrates the input and output variables of the equations that define the
simulation of cell organization after cell division, and the experimental data used
for ciliated chondrocyte representation.
M.-G. Ascenzi et al. / Journal of Theoretical Biology 285 (2011) 147–155 151
measured by eccentricity. Indeed, medial or lateral locationcorrelates to the ’’rounder’’ or less eccentric chondrocytes of theSmad1/5CKO; while proximal or distal location correlated to‘‘flatter’’ or more eccentric proliferative chondrocytes. Hence,ciliary location controls cell shape or responds to it in thegrowth plate.
Ciliary length and orientation did not correlate to each other.Indeed, the ciliary length does not differ significantly between theSmad1/5CKO mouse and its control in terms of means (2.871.1 vs.3.171.5 mm, p40.46) and ranges (Table 1). These data indicatedthat ciliary length and cell shape are independent from eachother. On the contrary, the ciliary orientation in 3D with respectto the major axis of the chondrocyte was described by a zenithangle jci,ce that clusters along either the anterior or the posteriordirection at approximately 801 for the Smad1/5CKO mouse anddifferently (po0.01) for the WT control with a dual clusteringalong either (i) anterior–posterior direction (approximately 101)or (ii) direction of growth (approximately 801) (Fig. 5). Theciliary azimuth angle yci,ce was randomly distributed for bothSmad1/5CKO and WT mice.
3.2. Mathematical results
Because we found that the 3D orientation of the primarycilium in the growth plate of the WT mouse clusters at twospecific angles, jci,ce¼101 and jci,ce¼801 with respect to the

M.-G. Ascenzi et al. / Journal of Theoretical Biology 285 (2011) 147–155152
anterior–posterior direction (z), while in the disorganized growthplate of the Smad1/5CKO mouse, it clustered only at jci,ce¼801(Fig. 5), we hypothesize that jci,ce¼101 contains the informationfor columnar organization.
Our mathematical simulations of organization in the growth platewere obtained by the combination of (i) the cell division modeldescribed by Eqs. (1)–(3) that uses the experimentally observeddistribution of ciliary angle, and that apply to both the Smad1/5CKO
and WT mouse and (ii) the experimentally observed distributions ofcell eccentricity and orientation, and ciliary location of emergenceand length (Fig. 6). The simulations of cell organization used, for boththe Smad1/5CKO and WT mice the values k¼0.01, Z¼10 and r¼0.06(Fig. 7). We started the simulations with 80 cells for the Smad1/5CKO
and 60 cells for the WT. We compared the simulated distributions ofcell centers with the experimentally observed distributions of cellcenters for each of the Smad1/5CKO and WT mice (Fig. 8). Cellulardistributions of Smad1/5CKO observed and simulated were disorga-nized, due to the lack of signaling in the simulation of theSmad1/5CKO. Cellular distributions of WT observed and simulatedwere characterized by longitudinal clustering of cells due to inter-cellular signaling in the simulation. We then investigated thealignment of the nearest neighboring cells of any given cell fromboth empirical and simulated cell distributions. In particular, weplotted the distribution of the cell-to-cell angle relative to thelongitudinal direction (Fig. 9a) between nearest neighbor cells.A delta distribution centered at ynn¼01 (i.e., the angle ynn¼01 hasprobability 1) corresponds to complete longitudinal alignment;whereas, a delta distribution at ynn¼901 (i.e., the angle ynn¼901has probability 1) corresponds to medial–lateral alignment. A uni-form distribution corresponds to complete disorder in cellularalignment (Fig. 9b). The Smad1/5CKO cells displayed approximatelyuniform alignment of nearest neighbors showing lack of preferentiallongitudinal orientation. Instead, the WT cells were strongly alignedin the longitudinal direction (Fig. 9c and d).
Fig. 7. Distribution patterns of cell centers. Both the distributions obtained from
the experimental data and from the results of the cell division simulation show a
difference in center distribution between Smad1/5CKO and WT: isotropy vs. long-
itudinal anisotropy.
4. Discussion
Our study probes the function of the primary cilium in thechondrocytic organization required for normal function in thegrowth plate. To such end, we investigated the three conceptuallydifferent characteristics that describe the primary cilium at the
Fig. 6. Dynamic simulations of cell positioning after division. We show three steps of
models for Smad1/5CKO and 60, 90 and 120 cell models for WT. The experimental data
micro-structural level: localization of projection from the chondro-cytic membrane, axonemal length, and orientation in 3D (Fig. 3). Ourcombination of new experimental data and novel mathematicaldynamic model indicates that ciliary orientation can direct a globalpositioning system of chondrocytes in the growth plate.
The Indian Hedgehog pathway, whose physical and functionaltopography has been previously shown to be partially controlled bythe primary cilium (Koyama et al., 2007), was disrupted in thegrowth plate of the Smad1/5CKO mouse at E16.5 stage of develop-ment. Both localization of projection and zenith angle of ciliaryaxoneme with respect to the chondrocytic orientation are specifieddifferently as between the Smad1/5CKO and the WT mouse. Because(1) specificity of both localization and orientation of axoneme arerequired for function of flagella and motile cilia (Mitchell et al., 2007),(2) the location of axonemal projection has previously been indicatedas linked to cellular orientation, plane of cell division and direction ofcell migration (Haycraft and Serra, 2008; Amini et al., 2010) and (3) aspecific orientation of the ciliary axoneme is linked to the direction ofcellular division (Goldstein et al., 2006; Park et al., 2006; Jonassen
the dynamic simulation, when cell division produces a total of 80, 120, 160 cell
were used to represent cell eccentricity, ciliary length and azimuth angle yci,ce.

Fig. 8. Measure of anisotropy of chondrocytic distributions: (a) We measured the
angle ynn between nearest neighbor cells relative to the longitudinal direction.
(b) A delta distribution at ynn¼01 corresponds to complete longitudinal alignment,
whereas at ynn¼901 corresponds to medial–lateral alignment. A uniform distribu-
tion corresponds to complete disorder in cellular alignment. (c) The Smad1/5CKO
cells displayed approximately uniform alignment of nearest neighbors, showing
lack of preferential longitudinal orientation. Instead, (d) the WT cells were
strongly aligned in the longitudinal direction.
Fig. 9. Our dynamic simulation applied to the Col2a-Cre;Kif3afl/fl mouse. By
assuming only the few cilia present in the Col2a-Cre;Kif3afl/fl mouse, our dynamic
model computes a weak cell-to-cell signal that impedes the ‘‘rotation’’ lacking in
such mouse growth plate where chondrocytes do not align in columns (compare
to Fig. 7c in Song et al., 2007).
M.-G. Ascenzi et al. / Journal of Theoretical Biology 285 (2011) 147–155 153
et al., 2008; Heydeck et al., 2009), we explored the hypothesis thatlocalization and orientation of the primary cilium participate inchondrocytic division and organization in the growth plate.
Because signal transduction in kidney tubule epithelial cells isinitiated by passive bending of immotile axoneme, and thegrowth plate is a mechanically sensing environment (Aminiet al., 2010), it is possible that signal transduction in growthplate chondrocytes is initiated by passive bending due tomechano-deformation of surrounding ECM of the chondrocyticcilium that also lacks the dynein arms to initiate movement(Koyama et al., 2007; Satir and Christensen, 2008). Our resultson definite ciliary localization, length and orientation are circum-stantially consistent with other investigators’ prediction that thecilium functions as a mechano-sensor (Satir and Christensen,2008). Indeed, each of localization, length and orientation affectsposition and exposure of cilium to the force acting on the growthplate and therefore the impact of the force on the cilium.
The localization of ciliary projection and chondrocyte shape differand correlate to each other, for each of the Smad1/5CKO and the WTmouse. Ciliary projection depends on the location of the centrioleand Golgi apparatus within the cell whose shape may reflect changesin inner chondrocytic organization. The axonemal length in 3D didnot differ between Smad1/5CKO and WT mouse at E16.5. It has beenpreviously noted that differences in length of motile cilia may reflectdifferences in signaling capabilities among cells (Marshall, 2002). Ifthis is indeed the case, we can hypothesize that ciliary length andorientation control signaling mechanisms independently because(1) ciliary orientation differs significantly between Smad1/5CKO andWT mouse and (2) our orientation-controlled mathematical modelfor cell-to-cell signaling shows a qualitative difference in orientation-controlled signaling capabilities.
The orientation of the primary cilium of the daughter cellinfluenced by a signal from the cell population, and not just themother cell or the neighboring cells, places the cilium at thecenter of the cellular network. We present the first mathematicalmodel of cell positioning, after cell division, for the chondrocyticpopulation that includes the ciliary orientation in cell-to-cellsignaling. Characteristics of primary cilium and cell division arebiologically linked. Because the engagement of the cilium withthe associated centriole needs to be interrupted, i.e., deciliationmust occur, for the centriole to accomplish its function duringmitosis, i.e., to organize the spindle during mitosis (M phase ofthe cell cycle) (Rieder et al., 1979), the cilium needs to be resorbedbefore the M phase commences. The presence of the primarycilium in the proliferative zone implies the occurrence of ciliaryformation during the G1 phase. The greater stubbiness of the longbones of the Smad1/5CKO relative to those of the WT controlsuggest a cell division that results in medial–lateral relativepositioning of cells in addition to the normal stacking direction.The appraisal of cell distribution (Fig. 9) shows a lack of prefer-ential longitudinal direction in favor of a directional isotropy inthe Smad1/5CKO mouse that is longitudinal and medial–lateral.
The lack of the rotation of chondrocytes after cell divisionnecessary to form longitudinal columns observed in theSmad1/5CKO, was also observed in the case of ciliary deletion (Songet al., 2007). By assuming only the few cilia present in the Col2a-Cre;
Kif3afl/fl mouse, our dynamic model computes a weak cell-to-cellsignal that impedes the ’’rotation’’ lacking in such mouse growthplate where chondrocytes do not align in columns (Fig. 9). Wetherefore hypothesize that a strong alignment of chondrocytes incolumns corresponds to a stronger cell-to-cell signal that occurswhen most cilia show a zenith angle jci,ce between 01 and 451.
Our mathematical model was based on the hypothesis thatcolumnar formation in the growth plate arises from cell to cellsignaling. The coefficients Z and k in Eq. (1) measure the effect ofthe input variables: Z signifies the effect of value clustering atjci,ce¼101 on the columnar organization in contrast to clusteringat jci,ce¼801 (Fig. 5) and k is the overall adjustment on the effectof both the zenith angle jci,ce and the distance between cells.
M.-G. Ascenzi et al. / Journal of Theoretical Biology 285 (2011) 147–155154
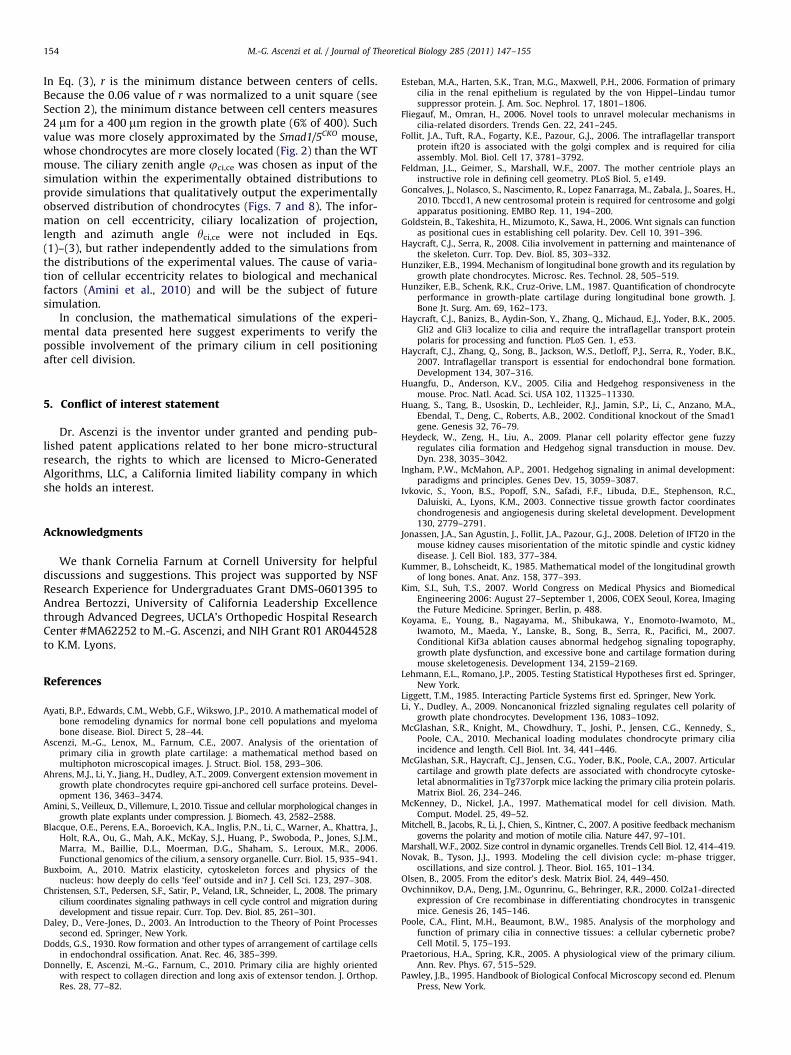
In Eq. (3), r is the minimum distance between centers of cells.Because the 0.06 value of r was normalized to a unit square (seeSection 2), the minimum distance between cell centers measures24 mm for a 400 mm region in the growth plate (6% of 400). Suchvalue was more closely approximated by the Smad1/5CKO mouse,whose chondrocytes are more closely located (Fig. 2) than the WTmouse. The ciliary zenith angle jci,ce was chosen as input of thesimulation within the experimentally obtained distributions toprovide simulations that qualitatively output the experimentallyobserved distribution of chondrocytes (Figs. 7 and 8). The infor-mation on cell eccentricity, ciliary localization of projection,length and azimuth angle yci,ce were not included in Eqs.(1)–(3), but rather independently added to the simulations fromthe distributions of the experimental values. The cause of varia-tion of cellular eccentricity relates to biological and mechanicalfactors (Amini et al., 2010) and will be the subject of futuresimulation.
In conclusion, the mathematical simulations of the experi-mental data presented here suggest experiments to verify thepossible involvement of the primary cilium in cell positioningafter cell division.
5. Conflict of interest statement
Dr. Ascenzi is the inventor under granted and pending pub-lished patent applications related to her bone micro-structuralresearch, the rights to which are licensed to Micro-GeneratedAlgorithms, LLC, a California limited liability company in whichshe holds an interest.
Acknowledgments
We thank Cornelia Farnum at Cornell University for helpfuldiscussions and suggestions. This project was supported by NSFResearch Experience for Undergraduates Grant DMS-0601395 toAndrea Bertozzi, University of California Leadership Excellencethrough Advanced Degrees, UCLA’s Orthopedic Hospital ResearchCenter #MA62252 to M.-G. Ascenzi, and NIH Grant R01 AR044528to K.M. Lyons.
References
Ayati, B.P., Edwards, C.M., Webb, G.F., Wikswo, J.P., 2010. A mathematical model ofbone remodeling dynamics for normal bone cell populations and myelomabone disease. Biol. Direct 5, 28–44.
Ascenzi, M.-G., Lenox, M., Farnum, C.E., 2007. Analysis of the orientation ofprimary cilia in growth plate cartilage: a mathematical method based onmultiphoton microscopical images. J. Struct. Biol. 158, 293–306.
Ahrens, M.J., Li, Y., Jiang, H., Dudley, A.T., 2009. Convergent extension movement ingrowth plate chondrocytes require gpi-anchored cell surface proteins. Devel-opment 136, 3463–3474.
Amini, S., Veilleux, D., Villemure, I., 2010. Tissue and cellular morphological changes ingrowth plate explants under compression. J. Biomech. 43, 2582–2588.
Blacque, O.E., Perens, E.A., Boroevich, K.A., Inglis, P.N., Li, C., Warner, A., Khattra, J.,Holt, R.A., Ou, G., Mah, A.K., McKay, S.J., Huang, P., Swoboda, P., Jones, S.J.M.,Marra, M., Baillie, D.L., Moerman, D.G., Shaham, S., Leroux, M.R., 2006.Functional genomics of the cilium, a sensory organelle. Curr. Biol. 15, 935–941.
Buxboim, A., 2010. Matrix elasticity, cytoskeleton forces and physics of thenucleus: how deeply do cells ‘feel’ outside and in? J. Cell Sci. 123, 297–308.
Christensen, S.T., Pedersen, S.F., Satir, P., Veland, I.R., Schneider, L., 2008. The primarycilium coordinates signaling pathways in cell cycle control and migration duringdevelopment and tissue repair. Curr. Top. Dev. Biol. 85, 261–301.
Daley, D., Vere-Jones, D., 2003. An Introduction to the Theory of Point Processessecond ed. Springer, New York.
Dodds, G.S., 1930. Row formation and other types of arrangement of cartilage cellsin endochondral ossification. Anat. Rec. 46, 385–399.
Donnelly, E, Ascenzi, M.-G., Farnum, C., 2010. Primary cilia are highly orientedwith respect to collagen direction and long axis of extensor tendon. J. Orthop.Res. 28, 77–82.
Esteban, M.A., Harten, S.K., Tran, M.G., Maxwell, P.H., 2006. Formation of primarycilia in the renal epithelium is regulated by the von Hippel–Lindau tumorsuppressor protein. J. Am. Soc. Nephrol. 17, 1801–1806.
Fliegauf, M., Omran, H., 2006. Novel tools to unravel molecular mechanisms incilia-related disorders. Trends Gen. 22, 241–245.
Follit, J.A., Tuft, R.A., Fogarty, K.E., Pazour, G.J., 2006. The intraflagellar transportprotein ift20 is associated with the golgi complex and is required for ciliaassembly. Mol. Biol. Cell 17, 3781–3792.
Feldman, J.L., Geimer, S., Marshall, W.F., 2007. The mother centriole plays aninstructive role in defining cell geometry. PLoS Biol. 5, e149.
Goncalves, J., Nolasco, S., Nascimento, R., Lopez Fanarraga, M., Zabala, J., Soares, H.,2010. Tbccd1, A new centrosomal protein is required for centrosome and golgiapparatus positioning. EMBO Rep. 11, 194–200.
Goldstein, B., Takeshita, H., Mizumoto, K., Sawa, H., 2006. Wnt signals can functionas positional cues in establishing cell polarity. Dev. Cell 10, 391–396.
Haycraft, C.J., Serra, R., 2008. Cilia involvement in patterning and maintenance ofthe skeleton. Curr. Top. Dev. Biol. 85, 303–332.
Hunziker, E.B., 1994. Mechanism of longitudinal bone growth and its regulation bygrowth plate chondrocytes. Microsc. Res. Technol. 28, 505–519.
Hunziker, E.B., Schenk, R.K., Cruz-Orive, L.M., 1987. Quantification of chondrocyteperformance in growth-plate cartilage during longitudinal bone growth. J.Bone Jt. Surg. Am. 69, 162–173.
Haycraft, C.J., Banizs, B., Aydin-Son, Y., Zhang, Q., Michaud, E.J., Yoder, B.K., 2005.Gli2 and Gli3 localize to cilia and require the intraflagellar transport proteinpolaris for processing and function. PLoS Gen. 1, e53.
Haycraft, C.J., Zhang, Q., Song, B., Jackson, W.S., Detloff, P.J., Serra, R., Yoder, B.K.,2007. Intraflagellar transport is essential for endochondral bone formation.Development 134, 307–316.
Huangfu, D., Anderson, K.V., 2005. Cilia and Hedgehog responsiveness in themouse. Proc. Natl. Acad. Sci. USA 102, 11325–11330.
Huang, S., Tang, B., Usoskin, D., Lechleider, R.J., Jamin, S.P., Li, C., Anzano, M.A.,Ebendal, T., Deng, C., Roberts, A.B., 2002. Conditional knockout of the Smad1gene. Genesis 32, 76–79.
Heydeck, W., Zeng, H., Liu, A., 2009. Planar cell polarity effector gene fuzzyregulates cilia formation and Hedgehog signal transduction in mouse. Dev.Dyn. 238, 3035–3042.
Ingham, P.W., McMahon, A.P., 2001. Hedgehog signaling in animal development:paradigms and principles. Genes Dev. 15, 3059–3087.
Ivkovic, S., Yoon, B.S., Popoff, S.N., Safadi, F.F., Libuda, D.E., Stephenson, R.C.,Daluiski, A., Lyons, K.M., 2003. Connective tissue growth factor coordinateschondrogenesis and angiogenesis during skeletal development. Development130, 2779–2791.
Jonassen, J.A., San Agustin, J., Follit, J.A., Pazour, G.J., 2008. Deletion of IFT20 in themouse kidney causes misorientation of the mitotic spindle and cystic kidneydisease. J. Cell Biol. 183, 377–384.
Kummer, B., Lohscheidt, K., 1985. Mathematical model of the longitudinal growthof long bones. Anat. Anz. 158, 377–393.
Kim, S.I., Suh, T.S., 2007. World Congress on Medical Physics and BiomedicalEngineering 2006: August 27–September 1, 2006, COEX Seoul, Korea, Imagingthe Future Medicine. Springer, Berlin, p. 488.
Koyama, E., Young, B., Nagayama, M., Shibukawa, Y., Enomoto-Iwamoto, M.,Iwamoto, M., Maeda, Y., Lanske, B., Song, B., Serra, R., Pacifici, M., 2007.Conditional Kif3a ablation causes abnormal hedgehog signaling topography,growth plate dysfunction, and excessive bone and cartilage formation duringmouse skeletogenesis. Development 134, 2159–2169.
Lehmann, E.L., Romano, J.P., 2005. Testing Statistical Hypotheses first ed. Springer,New York.
Liggett, T.M., 1985. Interacting Particle Systems first ed. Springer, New York.Li, Y., Dudley, A., 2009. Noncanonical frizzled signaling regulates cell polarity of
growth plate chondrocytes. Development 136, 1083–1092.McGlashan, S.R., Knight, M., Chowdhury, T., Joshi, P., Jensen, C.G., Kennedy, S.,
Poole, C.A., 2010. Mechanical loading modulates chondrocyte primary ciliaincidence and length. Cell Biol. Int. 34, 441–446.
McGlashan, S.R., Haycraft, C.J., Jensen, C.G., Yoder, B.K., Poole, C.A., 2007. Articularcartilage and growth plate defects are associated with chondrocyte cytoske-letal abnormalities in Tg737orpk mice lacking the primary cilia protein polaris.Matrix Biol. 26, 234–246.
McKenney, D., Nickel, J.A., 1997. Mathematical model for cell division. Math.Comput. Model. 25, 49–52.
Mitchell, B., Jacobs, R., Li, J., Chien, S., Kintner, C., 2007. A positive feedback mechanismgoverns the polarity and motion of motile cilia. Nature 447, 97–101.
Marshall, W.F., 2002. Size control in dynamic organelles. Trends Cell Biol. 12, 414–419.Novak, B., Tyson, J.J., 1993. Modeling the cell division cycle: m-phase trigger,
oscillations, and size control. J. Theor. Biol. 165, 101–134.Olsen, B., 2005. From the editor’s desk. Matrix Biol. 24, 449–450.Ovchinnikov, D.A., Deng, J.M., Ogunrinu, G., Behringer, R.R., 2000. Col2a1-directed
expression of Cre recombinase in differentiating chondrocytes in transgenicmice. Genesis 26, 145–146.
Poole, C.A., Flint, M.H., Beaumont, B.W., 1985. Analysis of the morphology andfunction of primary cilia in connective tissues: a cellular cybernetic probe?Cell Motil. 5, 175–193.
Praetorious, H.A., Spring, K.R., 2005. A physiological view of the primary cilium.Ann. Rev. Phys. 67, 515–529.
Pawley, J.B., 1995. Handbook of Biological Confocal Microscopy second ed. PlenumPress, New York.

M.-G. Ascenzi et al. / Journal of Theoretical Biology 285 (2011) 147–155 155
Park, T.J., Haigo, S.L., Wallingford, J.B., 2006. Ciliogenesis defects in embryoslacking inturned or fuzzy function are associated with failure of planar cellpolarity and Hedgehog signaling. Nat. Gen. 38, 303–311.
Rydholm, S., Frisk, T., Kowalewski, J.M., Andersson Svahn, H., Stemme, G., Brismar, H.,
2008. Microfluidic devices for studies of primary cilium mediated cellularresponse to dynamic flow conditions. Biomed. Microdev. 10, 555–560.
Retting, K.N., Song, B., Yoon, B.S., Lyons, K.M., 2009. BMP canonical Smad signaling
through Smad1 and Smad5 is required for endochondral bone formation.Development 136, 1093–1104.
Rieder, C.L., Jensen, C.G., Jensen, L.C., 1979. The resorption of primary cilia during
mitosis in a vertebrate (PtK1) cell line. J. Ultrastruct. Res. 68, 173–185.
Song, B., Haycraft, C.J., Seo, H., Yoder, B.K., Serra, R., 2007. Development of the post-natalgrowth plate requires intraflagellar transport proteins. Dev. Biol. 305, 202–216.
Sible, J.C., Tyson, J., 2007. Mathematical modeling as a tool for investigating cellcycle control networks. Methods 41, 238–247.
Satir, P., Christensen, S.T., 2008. Structure and function of mammalian cilia.Histochem. Cell Biol. 129, 687–693.
Umans, L., Vermeire, L., Francis, A., Chang, H., Huylebroeck, D., Zwijsen, A., 2003.Generation of a floxed allele of Smad5 for cre-mediated conditional knockoutin the mouse. Genesis 37, 5–11.
Wilsman, N.J., Farnum, C.E., 1986. Three dimensional orientation of chondrocyticcilia in adult articular cartilage. Proc. Orthop. Res. Soc., 486.
Wheatley, D.N., Wang, A.M., Strugnell, G.E., 1996. Expression of primary cilia inmammalian cells. Cell Biol. Int. 20, 73–81.
Wilsman, N.J., Farnum, C.E., Green, E.M., Lieferman, E.M., Clayton, M.K., 1996. Cellcycle analysis of proliferative zone chondrocytes in growth plates elongatingat different rates. J. Orthop. Res. 14, 562–572.