effect of merger on market price and product quality
TRANSCRIPT
Effect ofmerger onprice and
product quality
Somnath Das
Road Map
MergerProcess
Motivation
LiteratureReview
Contribution
Data
IdentificationStrategyDID Analysis
Merger Simulation
Demand
Supply
Counterfactual
Cost Analysis
ConclusionFuture Work
Effect of merger on market price andproduct quality:
American Airlines and US Airways
Somnath Das
Purdue University
August 18, 2017
Effect ofmerger onprice and
product quality
Somnath Das
Road Map
MergerProcess
Motivation
LiteratureReview
Contribution
Data
IdentificationStrategyDID Analysis
Merger Simulation
Demand
Supply
Counterfactual
Cost Analysis
ConclusionFuture Work
Road Map for the Presentation
• Summary
• Overview of the results• Merger Process• Literature Review• Data• Identification Strategy• Results• Conclusion

Effect ofmerger onprice and
product quality
Somnath Das
Road Map
MergerProcess
Motivation
LiteratureReview
Contribution
Data
IdentificationStrategyDID Analysis
Merger Simulation
Demand
Supply
Counterfactual
Cost Analysis
ConclusionFuture Work
Road Map for the Presentation
• Summary• Overview of the results
• Merger Process• Literature Review• Data• Identification Strategy• Results• Conclusion

Effect ofmerger onprice and
product quality
Somnath Das
Road Map
MergerProcess
Motivation
LiteratureReview
Contribution
Data
IdentificationStrategyDID Analysis
Merger Simulation
Demand
Supply
Counterfactual
Cost Analysis
ConclusionFuture Work
Road Map for the Presentation
• Summary• Overview of the results• Merger Process
• Literature Review• Data• Identification Strategy• Results• Conclusion
Effect ofmerger onprice and
product quality
Somnath Das
Road Map
MergerProcess
Motivation
LiteratureReview
Contribution
Data
IdentificationStrategyDID Analysis
Merger Simulation
Demand
Supply
Counterfactual
Cost Analysis
ConclusionFuture Work
Road Map for the Presentation
• Summary• Overview of the results• Merger Process• Literature Review
• Data• Identification Strategy• Results• Conclusion

Effect ofmerger onprice and
product quality
Somnath Das
Road Map
MergerProcess
Motivation
LiteratureReview
Contribution
Data
IdentificationStrategyDID Analysis
Merger Simulation
Demand
Supply
Counterfactual
Cost Analysis
ConclusionFuture Work
Road Map for the Presentation
• Summary• Overview of the results• Merger Process• Literature Review• Data
• Identification Strategy• Results• Conclusion
Effect ofmerger onprice and
product quality
Somnath Das
Road Map
MergerProcess
Motivation
LiteratureReview
Contribution
Data
IdentificationStrategyDID Analysis
Merger Simulation
Demand
Supply
Counterfactual
Cost Analysis
ConclusionFuture Work
Road Map for the Presentation
• Summary• Overview of the results• Merger Process• Literature Review• Data• Identification Strategy
• Results• Conclusion
Effect ofmerger onprice and
product quality
Somnath Das
Road Map
MergerProcess
Motivation
LiteratureReview
Contribution
Data
IdentificationStrategyDID Analysis
Merger Simulation
Demand
Supply
Counterfactual
Cost Analysis
ConclusionFuture Work
Road Map for the Presentation
• Summary• Overview of the results• Merger Process• Literature Review• Data• Identification Strategy• Results
• Conclusion

Effect ofmerger onprice and
product quality
Somnath Das
Road Map
MergerProcess
Motivation
LiteratureReview
Contribution
Data
IdentificationStrategyDID Analysis
Merger Simulation
Demand
Supply
Counterfactual
Cost Analysis
ConclusionFuture Work
Road Map for the Presentation
• Summary• Overview of the results• Merger Process• Literature Review• Data• Identification Strategy• Results• Conclusion

Effect ofmerger onprice and
product quality
Somnath Das
Road Map
MergerProcess
Motivation
LiteratureReview
Contribution
Data
IdentificationStrategyDID Analysis
Merger Simulation
Demand
Supply
Counterfactual
Cost Analysis
ConclusionFuture Work
Summary
Effect ofmerger onprice and
product quality
Somnath Das
Road Map
MergerProcess
Motivation
LiteratureReview
Contribution
Data
IdentificationStrategyDID Analysis
Merger Simulation
Demand
Supply
Counterfactual
Cost Analysis
ConclusionFuture Work
Summary
• Impact of the recent U.S. Air-American Airlines mergeron airfares and product quality (flight frequency).
• Difference in difference (DID) analysis, and mergersimulation.
• The decrease in price is higher in larger markets andless in smaller markets.
• No significant effect on flight frequency and delay.• Less number of canceled flights in the larger markets.

Effect ofmerger onprice and
product quality
Somnath Das
Road Map
MergerProcess
Motivation
LiteratureReview
Contribution
Data
IdentificationStrategyDID Analysis
Merger Simulation
Demand
Supply
Counterfactual
Cost Analysis
ConclusionFuture Work
Summary
• Impact of the recent U.S. Air-American Airlines mergeron airfares and product quality (flight frequency).
• Difference in difference (DID) analysis, and mergersimulation.
• The decrease in price is higher in larger markets andless in smaller markets.
• No significant effect on flight frequency and delay.
• Less number of canceled flights in the larger markets.

Effect ofmerger onprice and
product quality
Somnath Das
Road Map
MergerProcess
Motivation
LiteratureReview
Contribution
Data
IdentificationStrategyDID Analysis
Merger Simulation
Demand
Supply
Counterfactual
Cost Analysis
ConclusionFuture Work
Summary
• Impact of the recent U.S. Air-American Airlines mergeron airfares and product quality (flight frequency).
• Difference in difference (DID) analysis, and mergersimulation.
• The decrease in price is higher in larger markets andless in smaller markets.
• No significant effect on flight frequency and delay.• Less number of canceled flights in the larger markets.

Effect ofmerger onprice and
product quality
Somnath Das
Road Map
MergerProcess
Motivation
LiteratureReview
Contribution
Data
IdentificationStrategyDID Analysis
Merger Simulation
Demand
Supply
Counterfactual
Cost Analysis
ConclusionFuture Work
Overview of the Results

Effect ofmerger onprice and
product quality
Somnath Das
Road Map
MergerProcess
Motivation
LiteratureReview
Contribution
Data
IdentificationStrategyDID Analysis
Merger Simulation
Demand
Supply
Counterfactual
Cost Analysis
ConclusionFuture Work
Overview of the Results
• DID analysis
• Significant negative effects on the market price.• DID statistic is positive for smaller markets.• No significant effect on flight frequency.
• Merger Simulation
• Price increased by 3% due to the change in ownershipas a result of the merger⇒ positive level of costreduction.

Effect ofmerger onprice and
product quality
Somnath Das
Road Map
MergerProcess
Motivation
LiteratureReview
Contribution
Data
IdentificationStrategyDID Analysis
Merger Simulation
Demand
Supply
Counterfactual
Cost Analysis
ConclusionFuture Work
Overview of the Results
• DID analysis• Significant negative effects on the market price.
• DID statistic is positive for smaller markets.• No significant effect on flight frequency.
• Merger Simulation
• Price increased by 3% due to the change in ownershipas a result of the merger⇒ positive level of costreduction.

Effect ofmerger onprice and
product quality
Somnath Das
Road Map
MergerProcess
Motivation
LiteratureReview
Contribution
Data
IdentificationStrategyDID Analysis
Merger Simulation
Demand
Supply
Counterfactual
Cost Analysis
ConclusionFuture Work
Overview of the Results
• DID analysis• Significant negative effects on the market price.• DID statistic is positive for smaller markets.
• No significant effect on flight frequency.• Merger Simulation
• Price increased by 3% due to the change in ownershipas a result of the merger⇒ positive level of costreduction.

Effect ofmerger onprice and
product quality
Somnath Das
Road Map
MergerProcess
Motivation
LiteratureReview
Contribution
Data
IdentificationStrategyDID Analysis
Merger Simulation
Demand
Supply
Counterfactual
Cost Analysis
ConclusionFuture Work
Overview of the Results
• DID analysis• Significant negative effects on the market price.• DID statistic is positive for smaller markets.• No significant effect on flight frequency.
• Merger Simulation
• Price increased by 3% due to the change in ownershipas a result of the merger⇒ positive level of costreduction.

Effect ofmerger onprice and
product quality
Somnath Das
Road Map
MergerProcess
Motivation
LiteratureReview
Contribution
Data
IdentificationStrategyDID Analysis
Merger Simulation
Demand
Supply
Counterfactual
Cost Analysis
ConclusionFuture Work
Overview of the Results
• DID analysis• Significant negative effects on the market price.• DID statistic is positive for smaller markets.• No significant effect on flight frequency.
• Merger Simulation• Price increased by 3% due to the change in ownership
as a result of the merger⇒ positive level of costreduction.

Effect ofmerger onprice and
product quality
Somnath Das
Road Map
MergerProcess
Motivation
LiteratureReview
Contribution
Data
IdentificationStrategyDID Analysis
Merger Simulation
Demand
Supply
Counterfactual
Cost Analysis
ConclusionFuture Work
Merger Process

Effect ofmerger onprice and
product quality
Somnath Das
Road Map
MergerProcess
Motivation
LiteratureReview
Contribution
Data
IdentificationStrategyDID Analysis
Merger Simulation
Demand
Supply
Counterfactual
Cost Analysis
ConclusionFuture Work
The Merger Process
2012Q4

Effect ofmerger onprice and
product quality
Somnath Das
Road Map
MergerProcess
Motivation
LiteratureReview
Contribution
Data
IdentificationStrategyDID Analysis
Merger Simulation
Demand
Supply
Counterfactual
Cost Analysis
ConclusionFuture Work
The Merger Process
2012Q4
2013Q1
Merger Announced

Effect ofmerger onprice and
product quality
Somnath Das
Road Map
MergerProcess
Motivation
LiteratureReview
Contribution
Data
IdentificationStrategyDID Analysis
Merger Simulation
Demand
Supply
Counterfactual
Cost Analysis
ConclusionFuture Work
The Merger Process
2012Q4
2013Q1
Merger Announced
2013Q2
ShareholderApproval
2013Q3
Lawsuit by DOJ
2013Q4
Settlement
2015Q1
Integration
2015Q2
Single Operating Certificate
2015Q4
Reservation System Merged

Effect ofmerger onprice and
product quality
Somnath Das
Road Map
MergerProcess
Motivation
LiteratureReview
Contribution
Data
IdentificationStrategyDID Analysis
Merger Simulation
Demand
Supply
Counterfactual
Cost Analysis
ConclusionFuture Work
Competitive Corrections by DOJDivestitures and De-hubbing
• Divestitures at Airports in Boston, Chicago, Dallas, LosAngeles, Miami, New York and Near Washington, D.C.
• 104 air carrier slots at Reagan National• 34 slots at LaGuardia• 2 airport gates at each of Boston Logan, Chicago
OHare, Dallas Love Field, Los Angeles Internationaland Miami International.
• Opens door for low cost carriers to compete resulting inmore choices and more competitive airfares forconsumers.
• Maintain all the hub airports for at least 3 years afterthe merger is completed.

Effect ofmerger onprice and
product quality
Somnath Das
Road Map
MergerProcess
Motivation
LiteratureReview
Contribution
Data
IdentificationStrategyDID Analysis
Merger Simulation
Demand
Supply
Counterfactual
Cost Analysis
ConclusionFuture Work
Competitive Corrections by DOJDivestitures and De-hubbing
• Divestitures at Airports in Boston, Chicago, Dallas, LosAngeles, Miami, New York and Near Washington, D.C.
• 104 air carrier slots at Reagan National
• 34 slots at LaGuardia• 2 airport gates at each of Boston Logan, Chicago
OHare, Dallas Love Field, Los Angeles Internationaland Miami International.
• Opens door for low cost carriers to compete resulting inmore choices and more competitive airfares forconsumers.
• Maintain all the hub airports for at least 3 years afterthe merger is completed.

Effect ofmerger onprice and
product quality
Somnath Das
Road Map
MergerProcess
Motivation
LiteratureReview
Contribution
Data
IdentificationStrategyDID Analysis
Merger Simulation
Demand
Supply
Counterfactual
Cost Analysis
ConclusionFuture Work
Competitive Corrections by DOJDivestitures and De-hubbing
• Divestitures at Airports in Boston, Chicago, Dallas, LosAngeles, Miami, New York and Near Washington, D.C.
• 104 air carrier slots at Reagan National• 34 slots at LaGuardia
• 2 airport gates at each of Boston Logan, ChicagoOHare, Dallas Love Field, Los Angeles Internationaland Miami International.
• Opens door for low cost carriers to compete resulting inmore choices and more competitive airfares forconsumers.
• Maintain all the hub airports for at least 3 years afterthe merger is completed.

Effect ofmerger onprice and
product quality
Somnath Das
Road Map
MergerProcess
Motivation
LiteratureReview
Contribution
Data
IdentificationStrategyDID Analysis
Merger Simulation
Demand
Supply
Counterfactual
Cost Analysis
ConclusionFuture Work
Competitive Corrections by DOJDivestitures and De-hubbing
• Divestitures at Airports in Boston, Chicago, Dallas, LosAngeles, Miami, New York and Near Washington, D.C.
• 104 air carrier slots at Reagan National• 34 slots at LaGuardia• 2 airport gates at each of Boston Logan, Chicago
OHare, Dallas Love Field, Los Angeles Internationaland Miami International.
• Opens door for low cost carriers to compete resulting inmore choices and more competitive airfares forconsumers.
• Maintain all the hub airports for at least 3 years afterthe merger is completed.

Effect ofmerger onprice and
product quality
Somnath Das
Road Map
MergerProcess
Motivation
LiteratureReview
Contribution
Data
IdentificationStrategyDID Analysis
Merger Simulation
Demand
Supply
Counterfactual
Cost Analysis
ConclusionFuture Work
Competitive Corrections by DOJDivestitures and De-hubbing
• Divestitures at Airports in Boston, Chicago, Dallas, LosAngeles, Miami, New York and Near Washington, D.C.
• 104 air carrier slots at Reagan National• 34 slots at LaGuardia• 2 airport gates at each of Boston Logan, Chicago
OHare, Dallas Love Field, Los Angeles Internationaland Miami International.
• Opens door for low cost carriers to compete resulting inmore choices and more competitive airfares forconsumers.
• Maintain all the hub airports for at least 3 years afterthe merger is completed.

Effect ofmerger onprice and
product quality
Somnath Das
Road Map
MergerProcess
Motivation
LiteratureReview
Contribution
Data
IdentificationStrategyDID Analysis
Merger Simulation
Demand
Supply
Counterfactual
Cost Analysis
ConclusionFuture Work
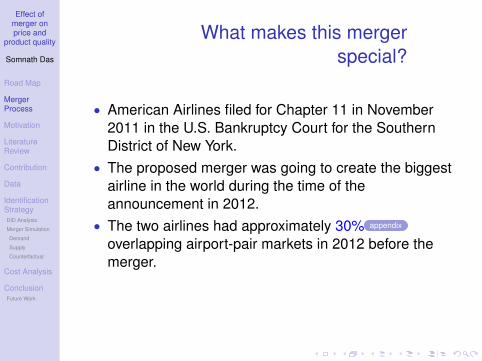
What makes this mergerspecial?
• American Airlines filed for Chapter 11 in November2011 in the U.S. Bankruptcy Court for the SouthernDistrict of New York.
• The proposed merger was going to create the biggestairline in the world during the time of theannouncement in 2012.
• The two airlines had approximately 30% appendix
overlapping airport-pair markets in 2012 before themerger.
• So it was natural for the DOJ to raise anti competitiveconcerns against this merger.

Effect ofmerger onprice and
product quality
Somnath Das
Road Map
MergerProcess
Motivation
LiteratureReview
Contribution
Data
IdentificationStrategyDID Analysis
Merger Simulation
Demand
Supply
Counterfactual
Cost Analysis
ConclusionFuture Work
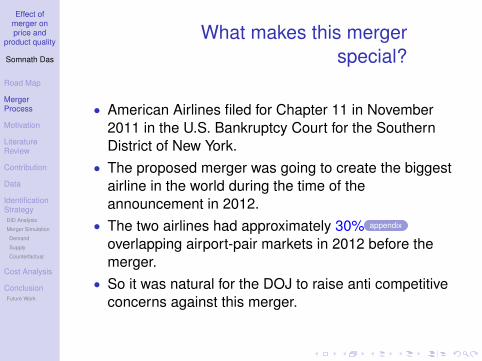
What makes this mergerspecial?
• American Airlines filed for Chapter 11 in November2011 in the U.S. Bankruptcy Court for the SouthernDistrict of New York.
• The proposed merger was going to create the biggestairline in the world during the time of theannouncement in 2012.
• The two airlines had approximately 30% appendix
overlapping airport-pair markets in 2012 before themerger.
• So it was natural for the DOJ to raise anti competitiveconcerns against this merger.
Effect ofmerger onprice and
product quality
Somnath Das
Road Map
MergerProcess
Motivation
LiteratureReview
Contribution
Data
IdentificationStrategyDID Analysis
Merger Simulation
Demand
Supply
Counterfactual
Cost Analysis
ConclusionFuture Work
What makes this mergerspecial?
• American Airlines filed for Chapter 11 in November2011 in the U.S. Bankruptcy Court for the SouthernDistrict of New York.
• The proposed merger was going to create the biggestairline in the world during the time of theannouncement in 2012.
• The two airlines had approximately 30% appendix
overlapping airport-pair markets in 2012 before themerger.
• So it was natural for the DOJ to raise anti competitiveconcerns against this merger.

Effect ofmerger onprice and
product quality
Somnath Das
Road Map
MergerProcess
Motivation
LiteratureReview
Contribution
Data
IdentificationStrategyDID Analysis
Merger Simulation
Demand
Supply
Counterfactual
Cost Analysis
ConclusionFuture Work
Research Question
• Is there an increase in price due to the merger?
• Is there a decrease in output (i.e. flight frequency) dueto the merger?

Effect ofmerger onprice and
product quality
Somnath Das
Road Map
MergerProcess
Motivation
LiteratureReview
Contribution
Data
IdentificationStrategyDID Analysis
Merger Simulation
Demand
Supply
Counterfactual
Cost Analysis
ConclusionFuture Work
Research Question
• Is there an increase in price due to the merger?• Is there a decrease in output (i.e. flight frequency) due
to the merger?

Effect ofmerger onprice and
product quality
Somnath Das
Road Map
MergerProcess
Motivation
LiteratureReview
Contribution
Data
IdentificationStrategyDID Analysis
Merger Simulation
Demand
Supply
Counterfactual
Cost Analysis
ConclusionFuture Work
Channels affecting price
• When there is a merger between two firms there aretwo opposite effects that works against the other.
• Cost saving (synergy): Synergy is the concept that theperformance of two companies combined will be greaterthan the sum of the performances of the separateindividual companies. It can occur due to costreduction, economies of scale, combined humanresources, and technology.
• Market power effect: Due to removal of a competitorand fewer number of firms in the market, a firm mightbe able to profitably raise the market price of a good orservice over marginal cost.
• Merger between American and US Airways gives aopportunity to analyze which of the above two effectsdominates the other.
Williamson

Effect ofmerger onprice and
product quality
Somnath Das
Road Map
MergerProcess
Motivation
LiteratureReview
Contribution
Data
IdentificationStrategyDID Analysis
Merger Simulation
Demand
Supply
Counterfactual
Cost Analysis
ConclusionFuture Work
Channels affecting quality
• Positive effect
• Better network• Combined resource pool• Internalizing congestion externality• Best practices
• Negative effect
• Difficulty in integration process (IT, labor).• Reduced threat of competition.
Effect ofmerger onprice and
product quality
Somnath Das
Road Map
MergerProcess
Motivation
LiteratureReview
Contribution
Data
IdentificationStrategyDID Analysis
Merger Simulation
Demand
Supply
Counterfactual
Cost Analysis
ConclusionFuture Work
Channels affecting quality
• Positive effect• Better network
• Combined resource pool• Internalizing congestion externality• Best practices
• Negative effect
• Difficulty in integration process (IT, labor).• Reduced threat of competition.

Effect ofmerger onprice and
product quality
Somnath Das
Road Map
MergerProcess
Motivation
LiteratureReview
Contribution
Data
IdentificationStrategyDID Analysis
Merger Simulation
Demand
Supply
Counterfactual
Cost Analysis
ConclusionFuture Work
Channels affecting quality
• Positive effect• Better network• Combined resource pool
• Internalizing congestion externality• Best practices
• Negative effect
• Difficulty in integration process (IT, labor).• Reduced threat of competition.

Effect ofmerger onprice and
product quality
Somnath Das
Road Map
MergerProcess
Motivation
LiteratureReview
Contribution
Data
IdentificationStrategyDID Analysis
Merger Simulation
Demand
Supply
Counterfactual
Cost Analysis
ConclusionFuture Work
Channels affecting quality
• Positive effect• Better network• Combined resource pool• Internalizing congestion externality
• Best practices• Negative effect
• Difficulty in integration process (IT, labor).• Reduced threat of competition.

Effect ofmerger onprice and
product quality
Somnath Das
Road Map
MergerProcess
Motivation
LiteratureReview
Contribution
Data
IdentificationStrategyDID Analysis
Merger Simulation
Demand
Supply
Counterfactual
Cost Analysis
ConclusionFuture Work
Channels affecting quality
• Positive effect• Better network• Combined resource pool• Internalizing congestion externality• Best practices
• Negative effect
• Difficulty in integration process (IT, labor).• Reduced threat of competition.

Effect ofmerger onprice and
product quality
Somnath Das
Road Map
MergerProcess
Motivation
LiteratureReview
Contribution
Data
IdentificationStrategyDID Analysis
Merger Simulation
Demand
Supply
Counterfactual
Cost Analysis
ConclusionFuture Work
Channels affecting quality
• Positive effect• Better network• Combined resource pool• Internalizing congestion externality• Best practices
• Negative effect• Difficulty in integration process (IT, labor).
• Reduced threat of competition.

Effect ofmerger onprice and
product quality
Somnath Das
Road Map
MergerProcess
Motivation
LiteratureReview
Contribution
Data
IdentificationStrategyDID Analysis
Merger Simulation
Demand
Supply
Counterfactual
Cost Analysis
ConclusionFuture Work
Channels affecting quality
• Positive effect• Better network• Combined resource pool• Internalizing congestion externality• Best practices
• Negative effect• Difficulty in integration process (IT, labor).• Reduced threat of competition.

Effect ofmerger onprice and
product quality
Somnath Das
Road Map
MergerProcess
Motivation
LiteratureReview
Contribution
Data
IdentificationStrategyDID Analysis
Merger Simulation
Demand
Supply
Counterfactual
Cost Analysis
ConclusionFuture Work
Literature Review

Effect ofmerger onprice and
product quality
Somnath Das
Road Map
MergerProcess
Motivation
LiteratureReview
Contribution
Data
IdentificationStrategyDID Analysis
Merger Simulation
Demand
Supply
Counterfactual
Cost Analysis
ConclusionFuture Work
Literature Review
• Trade off between efficiency gain and market power
• Theoretical: Williamson (1968), Farrell and Shapiro(1990).
• Airline: Carlton et al (1980), Kim and Singal (1993), Luo(2014).
Effect ofmerger onprice and
product quality
Somnath Das
Road Map
MergerProcess
Motivation
LiteratureReview
Contribution
Data
IdentificationStrategyDID Analysis
Merger Simulation
Demand
Supply
Counterfactual
Cost Analysis
ConclusionFuture Work
Literature Review
• Trade off between efficiency gain and market power• Theoretical: Williamson (1968), Farrell and Shapiro
(1990).
• Airline: Carlton et al (1980), Kim and Singal (1993), Luo(2014).

Effect ofmerger onprice and
product quality
Somnath Das
Road Map
MergerProcess
Motivation
LiteratureReview
Contribution
Data
IdentificationStrategyDID Analysis
Merger Simulation
Demand
Supply
Counterfactual
Cost Analysis
ConclusionFuture Work
Literature Review
• Trade off between efficiency gain and market power• Theoretical: Williamson (1968), Farrell and Shapiro
(1990).• Airline: Carlton et al (1980), Kim and Singal (1993), Luo
(2014).

Effect ofmerger onprice and
product quality
Somnath Das
Road Map
MergerProcess
Motivation
LiteratureReview
Contribution
Data
IdentificationStrategyDID Analysis
Merger Simulation
Demand
Supply
Counterfactual
Cost Analysis
ConclusionFuture Work
Literature Review (Cont.)
• Airport dominance and market power due to merger
• Borenstein (1989), Borenstein (1990).• Evans and Kessides (1993), Abramowitz and Brown
(1993).• Merger simulation
• Peters (2006).
• Conduct parameter
• Ciliberto and Williams (2014).

Effect ofmerger onprice and
product quality
Somnath Das
Road Map
MergerProcess
Motivation
LiteratureReview
Contribution
Data
IdentificationStrategyDID Analysis
Merger Simulation
Demand
Supply
Counterfactual
Cost Analysis
ConclusionFuture Work
Literature Review (Cont.)
• Airport dominance and market power due to merger• Borenstein (1989), Borenstein (1990).
• Evans and Kessides (1993), Abramowitz and Brown(1993).
• Merger simulation
• Peters (2006).
• Conduct parameter
• Ciliberto and Williams (2014).

Effect ofmerger onprice and
product quality
Somnath Das
Road Map
MergerProcess
Motivation
LiteratureReview
Contribution
Data
IdentificationStrategyDID Analysis
Merger Simulation
Demand
Supply
Counterfactual
Cost Analysis
ConclusionFuture Work
Literature Review (Cont.)
• Airport dominance and market power due to merger• Borenstein (1989), Borenstein (1990).• Evans and Kessides (1993), Abramowitz and Brown
(1993).
• Merger simulation
• Peters (2006).
• Conduct parameter
• Ciliberto and Williams (2014).

Effect ofmerger onprice and
product quality
Somnath Das
Road Map
MergerProcess
Motivation
LiteratureReview
Contribution
Data
IdentificationStrategyDID Analysis
Merger Simulation
Demand
Supply
Counterfactual
Cost Analysis
ConclusionFuture Work
Literature Review (Cont.)
• Airport dominance and market power due to merger• Borenstein (1989), Borenstein (1990).• Evans and Kessides (1993), Abramowitz and Brown
(1993).• Merger simulation
• Peters (2006).• Conduct parameter
• Ciliberto and Williams (2014).

Effect ofmerger onprice and
product quality
Somnath Das
Road Map
MergerProcess
Motivation
LiteratureReview
Contribution
Data
IdentificationStrategyDID Analysis
Merger Simulation
Demand
Supply
Counterfactual
Cost Analysis
ConclusionFuture Work
Literature Review (Cont.)
• Airport dominance and market power due to merger• Borenstein (1989), Borenstein (1990).• Evans and Kessides (1993), Abramowitz and Brown
(1993).• Merger simulation
• Peters (2006).• Conduct parameter
• Ciliberto and Williams (2014).
Effect ofmerger onprice and
product quality
Somnath Das
Road Map
MergerProcess
Motivation
LiteratureReview
Contribution
Data
IdentificationStrategyDID Analysis
Merger Simulation
Demand
Supply
Counterfactual
Cost Analysis
ConclusionFuture Work
Contribution to the existingliterature
• Addition to the retrospective study of mergers.
• Using structural model and therefore able to providecounter factual analysis.
• One of the important policy question is whether theobserved post merger price is due to lack of pre mergercompetition? (few studies on conduct)
• This paper attempts to quantify conduct parameter.
• Attempt to disentangle the cost efficiency and conductparameter by providing an estimate of marginal cost.

Effect ofmerger onprice and
product quality
Somnath Das
Road Map
MergerProcess
Motivation
LiteratureReview
Contribution
Data
IdentificationStrategyDID Analysis
Merger Simulation
Demand
Supply
Counterfactual
Cost Analysis
ConclusionFuture Work
Contribution to the existingliterature
• Addition to the retrospective study of mergers.• Using structural model and therefore able to provide
counter factual analysis.
• One of the important policy question is whether theobserved post merger price is due to lack of pre mergercompetition? (few studies on conduct)
• This paper attempts to quantify conduct parameter.
• Attempt to disentangle the cost efficiency and conductparameter by providing an estimate of marginal cost.

Effect ofmerger onprice and
product quality
Somnath Das
Road Map
MergerProcess
Motivation
LiteratureReview
Contribution
Data
IdentificationStrategyDID Analysis
Merger Simulation
Demand
Supply
Counterfactual
Cost Analysis
ConclusionFuture Work
Contribution to the existingliterature
• Addition to the retrospective study of mergers.• Using structural model and therefore able to provide
counter factual analysis.• One of the important policy question is whether the
observed post merger price is due to lack of pre mergercompetition? (few studies on conduct)
• This paper attempts to quantify conduct parameter.
• Attempt to disentangle the cost efficiency and conductparameter by providing an estimate of marginal cost.

Effect ofmerger onprice and
product quality
Somnath Das
Road Map
MergerProcess
Motivation
LiteratureReview
Contribution
Data
IdentificationStrategyDID Analysis
Merger Simulation
Demand
Supply
Counterfactual
Cost Analysis
ConclusionFuture Work
Data

Effect ofmerger onprice and
product quality
Somnath Das
Road Map
MergerProcess
Motivation
LiteratureReview
Contribution
Data
IdentificationStrategyDID Analysis
Merger Simulation
Demand
Supply
Counterfactual
Cost Analysis
ConclusionFuture Work
Data Source
• Main source of data for this project is DB1B databaseof Department of Transportation.
• The database is a 10% quarterly sample of airlineorigin and destination survey.
• T100 Domestic Segments database of Department ofTransportation is used for flight frequency. appendix
• On time performance database of DOT.• 2010 Q2 to 2012 Q2 as pre-merger.• 2016 Q1 to 2016 Q4 for post-merger.

Effect ofmerger onprice and
product quality
Somnath Das
Road Map
MergerProcess
Motivation
LiteratureReview
Contribution
Data
IdentificationStrategyDID Analysis
Merger Simulation
Demand
Supply
Counterfactual
Cost Analysis
ConclusionFuture Work
Identification and Results

Effect ofmerger onprice and
product quality
Somnath Das
Road Map
MergerProcess
Motivation
LiteratureReview
Contribution
Data
IdentificationStrategyDID Analysis
Merger Simulation
Demand
Supply
Counterfactual
Cost Analysis
ConclusionFuture Work
Identification
• DID analysis
• Merger Simulation

Effect ofmerger onprice and
product quality
Somnath Das
Road Map
MergerProcess
Motivation
LiteratureReview
Contribution
Data
IdentificationStrategyDID Analysis
Merger Simulation
Demand
Supply
Counterfactual
Cost Analysis
ConclusionFuture Work
Identification
• DID analysis• Merger Simulation

Effect ofmerger onprice and
product quality
Somnath Das
Road Map
MergerProcess
Motivation
LiteratureReview
Contribution
Data
IdentificationStrategyDID Analysis
Merger Simulation
Demand
Supply
Counterfactual
Cost Analysis
ConclusionFuture Work
DID Analysis
Pjmt = γm + λt + δ ∗ Dmt + εjmt
δ =1M
M∑m=1
(¯Pm1 − ¯Pm2
)− 1
N
N∑n=1
(Pn1 − Pn2
)Pmt =
J∑j=1
Pjmtwj ∀t = 1,2
Pnt =J∑
j=1
Pjntwj ∀t = 1,2

Effect ofmerger onprice and
product quality
Somnath Das
Road Map
MergerProcess
Motivation
LiteratureReview
Contribution
Data
IdentificationStrategyDID Analysis
Merger Simulation
Demand
Supply
Counterfactual
Cost Analysis
ConclusionFuture Work
Pre-Trend Analysis
300
350
400
450
500A
vera
ge P
rice
2010Q2 2011Q2 2012Q2 2013Q2 2014Q2 2015Q2 2016Q2Year-Quarter
Treatment ControlSource: Transtats, DOT
Checking Parallel TrendPre-Trend Analysis

Effect ofmerger onprice and
product quality
Somnath Das
Road Map
MergerProcess
Motivation
LiteratureReview
Contribution
Data
IdentificationStrategyDID Analysis
Merger Simulation
Demand
Supply
Counterfactual
Cost Analysis
ConclusionFuture Work
DID Analysis Result (Price)
• Treatment: markets where both AA and US werepresent before the merger, only US was present, andonly AA was present . I treated other markets ascontrol.
• The result shows that the difference between theaverage decrease in price between the treatment andcontrol airport pair markets is negative andstatistically significant overall.
• In smaller markets the difference is positive i.e. thedecrease in price in control is higher than the decreasein price in treatment group.

Effect ofmerger onprice and
product quality
Somnath Das
Road Map
MergerProcess
Motivation
LiteratureReview
Contribution
Data
IdentificationStrategyDID Analysis
Merger Simulation
Demand
Supply
Counterfactual
Cost Analysis
ConclusionFuture Work
DID Analysis Result (Price)
Table: Effect of Merger on Price
(1) (2) (3) (4) (5)Price Price Price Price Price<5K <10K&>5K <25K&>10K >25K All
time 2.948 -4.842 -1.955 -0.335 -6.787***(1.26) (-1.57) (-0.67) (-0.06) (-3.37)
treated 38.84*** 57.95*** 66.36*** 67.99*** 45.60***(21.17) (21.67) (24.90) (16.55) (25.35)
did 21.46*** 8.736* -15.20*** -23.75*** -9.044***(6.50) (1.88) (-3.31) (-3.27) (-2.75)
cons 372.7*** 340.3*** 304.5*** 274.1*** 322.8***(294.08) (184.43) (182.37) (94.25) (302.44)
N 19628 8609 7356 2663 38256adj. R2 0.048 0.084 0.106 0.102 0.047
Divestiture

Effect ofmerger onprice and
product quality
Somnath Das
Road Map
MergerProcess
Motivation
LiteratureReview
Contribution
Data
IdentificationStrategyDID Analysis
Merger Simulation
Demand
Supply
Counterfactual
Cost Analysis
ConclusionFuture Work
DID Analysis Result(Frequency)
Table: Effect of Merger on Frequency of Flights
(1) (2) (3) (4) (5)Freq Freq Freq Freq Freq<5K <10K&>5K <25K&>10K >25K All
time -31.72*** -25.90*** -51.07*** -11.44 -35.51***(-6.49) (-3.11) (-4.18) (-0.33) (-5.29)
treated 56.79*** 52.66*** -35.82*** 285.0*** 113.8***(13.69) (9.32) (-4.48) (13.69) (23.03)
did -6.093 2.129 14.90 -57.29 -9.230(-0.82) (0.20) (0.96) (-1.28) (-0.95)
cons 224.1*** 393.2*** 744.2*** 1155.9*** 484.8***(82.74) (91.29) (119.72) (74.64) (143.92)
N 18954 14888 15269 5952 55063adj. R2 0.016 0.009 0.003 0.027 0.013t statistics in parentheses* p < 0.10, ** p < 0.05, *** p < 0.01

Effect ofmerger onprice and
product quality
Somnath Das
Road Map
MergerProcess
Motivation
LiteratureReview
Contribution
Data
IdentificationStrategyDID Analysis
Merger Simulation
Demand
Supply
Counterfactual
Cost Analysis
ConclusionFuture Work
DID Analysis Result (Seats)
Table: Effect of Merger on Number of Seats
(1) (2) (3) (4) (5)Freq Freq Freq Freq Freq<5K <10K&>5K <25K&>10K >25K All
time -802.1 696.8 297.4 5221.5 139.0(-1.29) (0.61) (0.16) (1.02) (0.14)
treated 1138.3*** 2765.7*** -5218.1*** 32955.6*** 12373.2***(2.73) (3.93) (-4.79) (11.41) (17.99)
did 210.4 424.0 459.9 -3782.4 -754.8(0.26) (0.29) (0.20) (-0.60) (-0.54)
cons 22126.7*** 47378.7*** 98192.2*** 166892.0*** 61015.1***(70.56) (86.36) (114.03) (73.07) (127.72)
N 18954 14888 15269 5952 55063adj. R2 0.001 0.001 0.002 0.021 0.007t statistics in parentheses* p < 0.10, ** p < 0.05, *** p < 0.01
Effect ofmerger onprice and
product quality
Somnath Das
Road Map
MergerProcess
Motivation
LiteratureReview
Contribution
Data
IdentificationStrategyDID Analysis
Merger Simulation
Demand
Supply
Counterfactual
Cost Analysis
ConclusionFuture Work
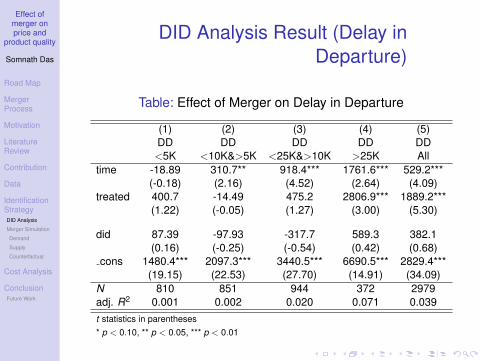
DID Analysis Result (Delay inDeparture)
Table: Effect of Merger on Delay in Departure
(1) (2) (3) (4) (5)DD DD DD DD DD<5K <10K&>5K <25K&>10K >25K All
time -18.89 310.7** 918.4*** 1761.6*** 529.2***(-0.18) (2.16) (4.52) (2.64) (4.09)
treated 400.7 -14.49 475.2 2806.9*** 1889.2***(1.22) (-0.05) (1.27) (3.00) (5.30)
did 87.39 -97.93 -317.7 589.3 382.1(0.16) (-0.25) (-0.54) (0.42) (0.68)
cons 1480.4*** 2097.3*** 3440.5*** 6690.5*** 2829.4***(19.15) (22.53) (27.70) (14.91) (34.09)
N 810 851 944 372 2979adj. R2 0.001 0.002 0.020 0.071 0.039t statistics in parentheses* p < 0.10, ** p < 0.05, *** p < 0.01

Effect ofmerger onprice and
product quality
Somnath Das
Road Map
MergerProcess
Motivation
LiteratureReview
Contribution
Data
IdentificationStrategyDID Analysis
Merger Simulation
Demand
Supply
Counterfactual
Cost Analysis
ConclusionFuture Work
DID Analysis Result (Delay inArrival)
Table: Effect of Merger on Delay in Arrival
(1) (2) (3) (4) (5)DA DA DA DA DA<5K <10K&>5K <25K&>10K >25K All
time -46.99 317.7** 995.8*** 2067.0*** 575.9***(-0.42) (2.09) (4.63) (2.61) (3.94)
treated 536.0 102.5 893.0** 3344.1*** 2376.4***(1.41) (0.35) (2.19) (3.31) (6.02)
did 160.5 -118.1 -384.6 47.49 279.6(0.26) (-0.27) (-0.61) (0.03) (0.46)
cons 1644.7*** 2294.0*** 3776.6*** 7688.3*** 3146.2***(19.56) (23.01) (28.45) (14.63) (33.58)
N 810 851 944 372 2979adj. R2 0.004 0.002 0.025 0.064 0.044t statistics in parentheses* p < 0.10, ** p < 0.05, *** p < 0.01

Effect ofmerger onprice and
product quality
Somnath Das
Road Map
MergerProcess
Motivation
LiteratureReview
Contribution
Data
IdentificationStrategyDID Analysis
Merger Simulation
Demand
Supply
Counterfactual
Cost Analysis
ConclusionFuture Work
DID Analysis Result (CanceledFlights)
Table: Effect of Merger on Canceled Flights
(1) (2) (3) (4) (5)NoC NoC NoC NoC NoC<5K <10K&>5K <25K&>10K >25K All
time -0.771*** -0.349*** -0.664*** -0.543 -0.607***(-7.22) (-2.95) (-2.90) (-0.46) (-3.81)
treated 0.822 0.693* 1.282*** 6.299*** 3.192***(1.49) (1.84) (3.04) (3.00) (4.99)
did -0.184 -0.763* -1.144** -6.370*** -2.285***(-0.26) (-1.81) (-2.23) (-2.69) (-3.32)
cons 1.133*** 1.102*** 2.189*** 5.614*** 1.934***(11.41) (11.09) (12.61) (7.74) (17.62)
N 810 851 944 372 2979adj. R2 0.070 0.020 0.023 0.040 0.037t statistics in parentheses* p < 0.10, ** p < 0.05, *** p < 0.01

Effect ofmerger onprice and
product quality
Somnath Das
Road Map
MergerProcess
Motivation
LiteratureReview
Contribution
Data
IdentificationStrategyDID Analysis
Merger Simulation
Demand
Supply
Counterfactual
Cost Analysis
ConclusionFuture Work
Merger Simulation

Effect ofmerger onprice and
product quality
Somnath Das
Road Map
MergerProcess
Motivation
LiteratureReview
Contribution
Data
IdentificationStrategyDID Analysis
Merger Simulation
Demand
Supply
Counterfactual
Cost Analysis
ConclusionFuture Work
Merger Simulation
• Estimating demand from nested logit model.
• Backing out marginal cost from a Nash-Bertrand game.• Simulating the post merger price assuming that
marginal cost is unchanged with a new ownershipmatrix.
• Doing counterfactual analysis with different level of costreduction and conduct parameter.
conduct

Effect ofmerger onprice and
product quality
Somnath Das
Road Map
MergerProcess
Motivation
LiteratureReview
Contribution
Data
IdentificationStrategyDID Analysis
Merger Simulation
Demand
Supply
Counterfactual
Cost Analysis
ConclusionFuture Work
Merger Simulation
• Estimating demand from nested logit model.• Backing out marginal cost from a Nash-Bertrand game.
• Simulating the post merger price assuming thatmarginal cost is unchanged with a new ownershipmatrix.
• Doing counterfactual analysis with different level of costreduction and conduct parameter.
conduct

Effect ofmerger onprice and
product quality
Somnath Das
Road Map
MergerProcess
Motivation
LiteratureReview
Contribution
Data
IdentificationStrategyDID Analysis
Merger Simulation
Demand
Supply
Counterfactual
Cost Analysis
ConclusionFuture Work
Merger Simulation
• Estimating demand from nested logit model.• Backing out marginal cost from a Nash-Bertrand game.• Simulating the post merger price assuming that
marginal cost is unchanged with a new ownershipmatrix.
• Doing counterfactual analysis with different level of costreduction and conduct parameter.
conduct

Effect ofmerger onprice and
product quality
Somnath Das
Road Map
MergerProcess
Motivation
LiteratureReview
Contribution
Data
IdentificationStrategyDID Analysis
Merger Simulation
Demand
Supply
Counterfactual
Cost Analysis
ConclusionFuture Work
Merger Simulation
• Estimating demand from nested logit model.• Backing out marginal cost from a Nash-Bertrand game.• Simulating the post merger price assuming that
marginal cost is unchanged with a new ownershipmatrix.
• Doing counterfactual analysis with different level of costreduction and conduct parameter.
conduct

Effect ofmerger onprice and
product quality
Somnath Das
Road Map
MergerProcess
Motivation
LiteratureReview
Contribution
Data
IdentificationStrategyDID Analysis
Merger Simulation
Demand
Supply
Counterfactual
Cost Analysis
ConclusionFuture Work
Demand• A consumer maximizes her utility function while
choosing among different products. appendix
Maxj∈(0,...,Jm)
Uijm = xjmβ − αln(pjm) + ξjm + vit (λ) + λεijm
ln(sj)− ln(s0) = xjβ − αln(pj) + ξj + (1− λ)ln(sj|g)(1)
• Instruments• Cost side: A fourth order polynomial in distance• Demand side: Hub status of the connecting airport• Product characteristics of competitors: Average
inconvenience, connections, no of other products bycompetitor etc.
• Market: HHI• Connection is defined as number of stops between the
origin and destination.• Inconvenience is defined as distance over market
distance.derivation

Effect ofmerger onprice and
product quality
Somnath Das
Road Map
MergerProcess
Motivation
LiteratureReview
Contribution
Data
IdentificationStrategyDID Analysis
Merger Simulation
Demand
Supply
Counterfactual
Cost Analysis
ConclusionFuture Work
Demand Estimation Results
Table: Demand Estimation
log of fare -2.920***(0.0898)
log of within group share 0.655***(0.00813)
connections -0.209***(0.00699)
inconvenience -0.386***(0.0411)
market distance 0.0437***(0.00128)
N 61902adj. R2 0.784Standard errors in parentheses* p < 0.10, ** p < 0.05, *** p < 0.01
BLP

Effect ofmerger onprice and
product quality
Somnath Das
Road Map
MergerProcess
Motivation
LiteratureReview
Contribution
Data
IdentificationStrategyDID Analysis
Merger Simulation
Demand
Supply
Counterfactual
Cost Analysis
ConclusionFuture Work
Demand Estimation Results
Table: Demand Estimation
origin hub 0.896***(0.0341)
origin hub*market distance 0.00179**(0.000866)
destination hub 0.413***(0.0276)
destination hub*market distance 0.00296***(0.000853)
constant 14.95***(0.481)
N 61902adj. R2 0.784Standard errors in parentheses* p < 0.10, ** p < 0.05, *** p < 0.01

Effect ofmerger onprice and
product quality
Somnath Das
Road Map
MergerProcess
Motivation
LiteratureReview
Contribution
Data
IdentificationStrategyDID Analysis
Merger Simulation
Demand
Supply
Counterfactual
Cost Analysis
ConclusionFuture Work
Estimated Elasticity
Table: Elasticity Matrix of ORD-PHX Market, 2012 Q2
Carrier Passengers Fare Connections Elasticity
American 610 454.49 One -8.3 2.5 1.3 .2 .03 1.7American 18310 423.75 Non stop 0.1 -5.7 1.4 .2 .03 1.9United 9520 422.63 Non stop 0.1 2.7 -7.0 .2 .03 1.8United 950 510.43 One 0.1 2.3 1.2 -8.3 .03 1.5US Airways 160 595.37 One 0.1 1.9 1.0 .12 -8.4 1.3US Airways 13570 388.21 Non stop .1 2.9 1.5 .18 .04 -6.5
Note that elasticity of the non-stop flights is lower thanone-connection flights for all the airlines.

Effect ofmerger onprice and
product quality
Somnath Das
Road Map
MergerProcess
Motivation
LiteratureReview
Contribution
Data
IdentificationStrategyDID Analysis
Merger Simulation
Demand
Supply
Counterfactual
Cost Analysis
ConclusionFuture Work
Supply• Following Berry and Jia (2010), I assume that firms
play a static Bertrand-Nash price setting game. I usethe first order conditions and the estimated demandparameters to back out the marginal cost of eachproduct as in Berry et al. (1995). derivation
Following this notation, I can write the first order conditionas follows,
s(p)− Ωpre(p)(p −mc) = 0where Ωpre is the matrix that indicates ownership relationships.
(2)mc = p − (Ωpre)−1sobserved (3)
I simulate the post-merger price by appropriatelychanging the ownership matrix
mc = p′ −
(Ωpost (p′)
)−1
s(p′) (4)

Effect ofmerger onprice and
product quality
Somnath Das
Road Map
MergerProcess
Motivation
LiteratureReview
Contribution
Data
IdentificationStrategyDID Analysis
Merger Simulation
Demand
Supply
Counterfactual
Cost Analysis
ConclusionFuture Work
Counterfactual Analysis

Effect ofmerger onprice and
product quality
Somnath Das
Road Map
MergerProcess
Motivation
LiteratureReview
Contribution
Data
IdentificationStrategyDID Analysis
Merger Simulation
Demand
Supply
Counterfactual
Cost Analysis
ConclusionFuture Work
Number of Overlapping Markets
Table: No of Overlapping Markets: 2012 Q2
DL US AA UA AS B6 F9 G4 NK SY VX WNDL 1194 446 302 369 32 112 109 7 56 27 18 720US 446 754 195 333 19 59 57 0 26 9 23 372AA 302 195 598 355 31 42 26 1 40 5 30 245UA 369 333 355 873 59 57 130 9 37 4 46 426AS 32 19 31 59 126 11 7 7 5 1 21 71B6 112 59 42 57 11 162 0 0 13 0 13 64F9 109 57 26 130 7 0 219 2 9 5 0 149G4 7 0 1 9 7 0 2 23 2 0 0 0NK 56 26 40 37 5 13 9 2 82 1 4 29SY 27 9 5 4 1 0 5 0 1 27 0 15VX 18 23 30 46 21 13 0 0 4 0 49 25WN 720 372 245 426 71 64 149 0 29 15 25 1151

Effect ofmerger onprice and
product quality
Somnath Das
Road Map
MergerProcess
Motivation
LiteratureReview
Contribution
Data
IdentificationStrategyDID Analysis
Merger Simulation
Demand
Supply
Counterfactual
Cost Analysis
ConclusionFuture Work
Number of Overlapping Markets
Table: No of Overlapping Markets: 2016 Q2
DL US AA UA AS B6 F9 G4 NK SY VX WNDL 1348 0 821 385 120 152 170 1 159 32 29 791US 0 0 0 0 0 0 0 0 0 0 0 0AA 821 0 1201 453 50 114 147 0 155 19 33 599UA 385 0 453 746 57 50 156 1 131 12 44 346AS 120 0 50 57 188 8 13 1 14 4 10 121B6 152 0 114 50 8 224 3 0 34 0 16 82F9 170 0 147 156 13 3 263 1 45 6 13 148G4 1 0 0 1 1 0 1 3 0 0 0 1NK 159 0 155 131 14 34 45 0 253 14 7 124SY 32 0 19 12 4 0 6 0 14 32 0 16VX 29 0 33 44 10 16 13 0 7 0 64 30WN 791 0 599 346 121 82 148 1 124 16 30 1153

Effect ofmerger onprice and
product quality
Somnath Das
Road Map
MergerProcess
Motivation
LiteratureReview
Contribution
Data
IdentificationStrategyDID Analysis
Merger Simulation
Demand
Supply
Counterfactual
Cost Analysis
ConclusionFuture Work
Estimated Conduct Pairwise
Table: Estimated Conduct: 2012 Q2
DL US AA UA AS B6 F9 G4 NK SY VX WNDL 1.00 0.60 0.32 0.44 0.05 0.09 0.09 0.04 0.06 0.05 0.05 0.93US 0.60 1.00 0.17 0.37 0.05 0.06 0.06 0.04 0.05 0.04 0.05 0.45AA 0.32 0.17 1.00 0.42 0.05 0.06 0.05 0.04 0.05 0.04 0.05 0.23UA 0.44 0.37 0.42 1.00 0.06 0.06 0.11 0.04 0.05 0.04 0.06 0.56AS 0.05 0.05 0.05 0.06 1.00 0.04 0.04 0.04 0.04 0.04 0.05 0.07B6 0.09 0.06 0.06 0.06 0.04 1.00 0.04 0.04 0.04 0.04 0.04 0.06F9 0.09 0.06 0.05 0.11 0.04 0.04 1.00 0.04 0.04 0.04 0.04 0.12G4 0.04 0.04 0.04 0.04 0.04 0.04 0.04 1.00 0.04 0.04 0.04 0.04NK 0.06 0.05 0.05 0.05 0.04 0.04 0.04 0.04 1.00 0.04 0.04 0.05SY 0.05 0.04 0.04 0.04 0.04 0.04 0.04 0.04 0.04 1.00 0.04 0.04VX 0.05 0.05 0.05 0.06 0.05 0.04 0.04 0.04 0.04 0.04 1.00 0.05WN 0.93 0.45 0.23 0.56 0.07 0.06 0.12 0.04 0.05 0.04 0.05 1.00

Effect ofmerger onprice and
product quality
Somnath Das
Road Map
MergerProcess
Motivation
LiteratureReview
Contribution
Data
IdentificationStrategyDID Analysis
Merger Simulation
Demand
Supply
Counterfactual
Cost Analysis
ConclusionFuture Work
Estimated Conduct Pairwise
Table: Estimated Conduct: 2016 Q2
DL US AA UA AS B6 F9 G4 NK SY VX WNDL 1.00 0.04 0.97 0.48 0.10 0.12 0.14 0.04 0.13 0.05 0.05 0.96US 0.04 1.00 0.04 0.04 0.04 0.04 0.04 0.04 0.04 0.04 0.04 0.04AA 0.97 0.04 1.00 0.61 0.06 0.09 0.12 0.04 0.13 0.05 0.05 0.83UA 0.48 0.04 0.61 1.00 0.06 0.06 0.13 0.04 0.11 0.04 0.06 0.40AS 0.10 0.04 0.06 0.06 1.00 0.04 0.04 0.04 0.04 0.04 0.04 0.10B6 0.12 0.04 0.09 0.06 0.04 1.00 0.04 0.04 0.05 0.04 0.05 0.07F9 0.14 0.04 0.12 0.13 0.04 0.04 1.00 0.04 0.06 0.04 0.04 0.12G4 0.04 0.04 0.04 0.04 0.04 0.04 0.04 1.00 0.04 0.04 0.04 0.04NK 0.13 0.04 0.13 0.11 0.04 0.05 0.06 0.04 1.00 0.04 0.04 0.10SY 0.05 0.04 0.05 0.04 0.04 0.04 0.04 0.04 0.04 1.00 0.04 0.05VX 0.05 0.04 0.05 0.06 0.04 0.05 0.04 0.04 0.04 0.04 1.00 0.05WN 0.96 0.04 0.83 0.40 0.10 0.07 0.12 0.04 0.10 0.05 0.05 1.00

Effect ofmerger onprice and
product quality
Somnath Das
Road Map
MergerProcess
Motivation
LiteratureReview
Contribution
Data
IdentificationStrategyDID Analysis
Merger Simulation
Demand
Supply
Counterfactual
Cost Analysis
ConclusionFuture Work
Counterfactual Analysis
Table: With Nash-Bertrand in Pre-merger and Post-merger Period
Cost Saving IndustryMerger 0% 2.5% 5% 7.5% 10% 12.5%0% 2.5 -0.5 -2.5 -5.0 -7.5 -9.92.5% 1.5 -0.8 -3.6 -5.9 -8.5 -10.95% 0.6 -1.4 -4.4 -6.5 -9 -11.57.5% -0.4 -2.6 -4.8 -7.3 -9.7 -12.210% -1.1 -3.5 -5.6 -7.9 -10.5 -12.712.5% -1.9 -4.2 -6.6 -8.7 -11.2 -13.6

Effect ofmerger onprice and
product quality
Somnath Das
Road Map
MergerProcess
Motivation
LiteratureReview
Contribution
Data
IdentificationStrategyDID Analysis
Merger Simulation
Demand
Supply
Counterfactual
Cost Analysis
ConclusionFuture Work
Counterfactual Analysis
Table: With Tacit Collusion in Pre-merger and Post-merger Period
Cost Saving IndustryMerger 0% 2.5% 5% 7.5% 10% 12.5%0% 2.9 -0.2 -2.4 -4.8 -7.2 -9.72.5% 1.5 -0.7 -3.3 -5.8 -8.2 -10.75% 0.5 -1.3 -3.9 -6.3 -8.7 -11.27.5% -0.1 -2.5 -4.7 -7.1 -9.5 -11.910% -1.0 -3.4 -5.4 -7.6 -10.4 -12.512.5% -1.8 -3.9 -6.5 -8.6 -11.1 -13.4

Effect ofmerger onprice and
product quality
Somnath Das
Road Map
MergerProcess
Motivation
LiteratureReview
Contribution
Data
IdentificationStrategyDID Analysis
Merger Simulation
Demand
Supply
Counterfactual
Cost Analysis
ConclusionFuture Work
Counterfactual Analysis
Table: With Tacit Collusion1only in Pre-merger Period
Cost Saving IndustryMerger 0% 2.5% 5% 7.5% 10% 12.5%0% 1.8 -0.8 -3.3 -5.6 -8.2 -10.52.5% 1.1 -1.2 -3.9 -6.7 -8.7 -11.15% 0.3 -2.2 -4.9 -7.1 -9.4 -11.97.5% -0.6 -2.9 -5.2 -7.6 -10.1 -12.710% -1.5 -3.8 -6.1 -8.6 -10.9 -13.112.5% -2.1 -4.8 -6.7 -9.4 -11.2 -14.1
1using pairwise conduct parameter estimated from multi-marketcontact
Effect ofmerger onprice and
product quality
Somnath Das
Road Map
MergerProcess
Motivation
LiteratureReview
Contribution
Data
IdentificationStrategyDID Analysis
Merger Simulation
Demand
Supply
Counterfactual
Cost Analysis
ConclusionFuture Work
Counterfactual Analysis
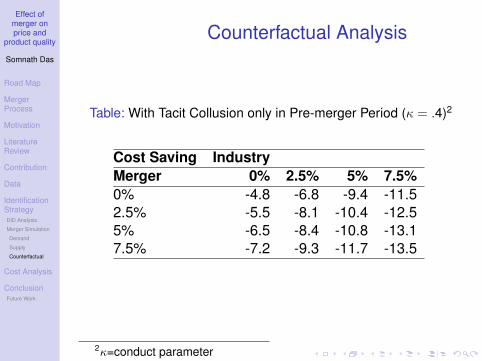
Table: With Tacit Collusion only in Pre-merger Period (κ = .4)2
Cost Saving IndustryMerger 0% 2.5% 5% 7.5%0% -4.8 -6.8 -9.4 -11.52.5% -5.5 -8.1 -10.4 -12.55% -6.5 -8.4 -10.8 -13.17.5% -7.2 -9.3 -11.7 -13.5
2κ=conduct parameter

Effect ofmerger onprice and
product quality
Somnath Das
Road Map
MergerProcess
Motivation
LiteratureReview
Contribution
Data
IdentificationStrategyDID Analysis
Merger Simulation
Demand
Supply
Counterfactual
Cost Analysis
ConclusionFuture Work
Conclusion

Effect ofmerger onprice and
product quality
Somnath Das
Road Map
MergerProcess
Motivation
LiteratureReview
Contribution
Data
IdentificationStrategyDID Analysis
Merger Simulation
Demand
Supply
Counterfactual
Cost Analysis
ConclusionFuture Work
Conclusion:• Difference in differences analysis analysis shows that
there is a negative significant impact of the merger onthe price.
• Smaller markets have not benefited in terms of lowerprice.
• Merger has no significant effect on the frequency offlights, number of seats, and delay.
• Merger has significant effect in reduction of the numberof canceled flights in larger markets.
• Merger simulation shows that change in the marketstructure without any cost reduction leads to 3%increase in price.
• A combination of 10% cost reduction industry wide anddue to merger is able to predict the post-merger pricequite accurately.

Effect ofmerger onprice and
product quality
Somnath Das
Road Map
MergerProcess
Motivation
LiteratureReview
Contribution
Data
IdentificationStrategyDID Analysis
Merger Simulation
Demand
Supply
Counterfactual
Cost Analysis
ConclusionFuture Work
Thank You

Effect ofmerger onprice and
product quality
Somnath Das
Route Network: AmericanAirlines
Back to main .
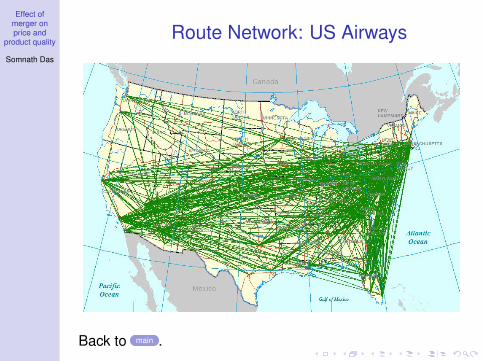
Effect ofmerger onprice and
product quality
Somnath Das
Route Network: US Airways
Back to main .

Effect ofmerger onprice and
product quality
Somnath Das
Route Network: Overlap AA andUS
Back to main .

Effect ofmerger onprice and
product quality
Somnath Das
Definition of Merger Dummy
merger =
1 AApre and US both used to provide service
before the merger and only AApost isproviding service after the merger
0 otherwise
d ln fare =Change in the log of fare between the postand the pre merger period
d ln freq =Change in the log of frequency between the postand the pre merger period
pre hhi =Herfindahl index in the pre merger periodnlcc pre =Number of low cost airlines in the pre merger period
Back to main .

Effect ofmerger onprice and
product quality
Somnath Das
Pre-merger Data Summary
Table: Summary statistics pre-merger Period
Variable Obs Mean Std. Dev. Min Max P25 P50 P75price 73142 395.14 107.82 84.09 1340.4 317.88 382.04 455.81connections 73142 .97 .84 0 2 0 1 2inconvenience 73142 1.07 .1 1 2.05 1 1.03 1.09mkt dist 73142 2571.07 1218.51 694.6 5442.58 1623.02 2238.12 3469.27hub origin 73142 .19 .32 0 1 0 0 .5hub destination 73142 .19 .31 0 1 0 0 .5distance 73142 2720.97 1264.37 692 6566.83 1724 2391.73 3650nop other carriers 73142 2.86 2.37 0 17 1 2 4conn other carriers 73142 3.04 2.92 0 20 0 2 5tot inconv oc 73142 3.05 2.51 0 17.56 1.02 2.38 4.31no other carriers 73142 1.75 1.27 0 7 1 2 2avg con oc 61902 1.05 .65 0 2 .5 1 1.5avg inconv oc 61902 1.07 .08 1 1.99 1.02 1.05 1.09HHI 73142 .59 .23 .17 1 .42 .54 .73hub connections 73142 .31 .34 0 1 0 .21 .5
Back to main .

Effect ofmerger onprice and
product quality
Somnath Das
Post-merger Data Summary
Table: Summary statistics post-merger Period
Variable Obs Mean Std. Dev. Min Max P25 P50 P75price 40848 380.71 121.05 65.31 1108.16 300.29 377.48 456.79connections 40848 .88 .84 0 2 0 1 2inconvenience 40848 1.07 .11 1 2.17 1 1.03 1.09mkt dist 40848 2428.66 1234.41 502.27 5442.58 1457.02 2132.19 3334.04hub origin 40848 .19 .32 0 1 0 0 .5hub destination 40848 .19 .31 0 1 0 0 .5distance 40848 2578.28 1284.5 502 7092 1599.1 2289.41 3488nop other carriers 40848 2.79 2.43 0 15 1 2 4conn other carriers 40848 2.73 2.77 0 15 0 2 4tot inconv oc 40848 2.98 2.58 0 15.82 1 2.28 4.32no other carriers 40848 1.7 1.3 0 6 1 2 3avg con oc 33344 .98 .65 0 2 .5 1 1.4avg inconv oc 33344 1.07 .08 1 2.05 1.02 1.05 1.09HHI 40848 .59 .24 .18 1 .41 .53 .74hub connections 40848 .28 .32 0 1 0 .13 .5
Back to main .

Effect ofmerger onprice and
product quality
Somnath Das
Example of Different Products
Table: Example of Different Products
YR QTR ORG CON DEST CAR PROD MKT2016 1 IND DFW AUS AA 1 12016 1 IND NS AUS AA 2 12016 1 IND DEN AUS UA 3 12016 1 IND NS AUS UA 4 12016 2 IND DFW AUS AA 1 22016 2 IND NS AUS AA 2 22016 2 IND DEN AUS UA 3 22016 2 IND NS AUS UA 4 2Source:DB1B
Back to main .

Effect ofmerger onprice and
product quality
Somnath Das
Derivation Steps
δj = xjβ + ξj − αln(pj)
sj|g =exp(
δjλ )∑J
k=1 exp( δkλ )
sg =Dλ
1 + Dλ
s0 = 1− sg =1
1 + Dλ
D =J∑
k=1
exp(δk
λ)
sj = sj|g ∗ sg =exp(
δjλ )Dλ−1
1 + Dλ
Back to main .

Effect ofmerger onprice and
product quality
Somnath Das
Derivation Steps
sj
s0=
sg ∗ sj|g
s0=
(Dλ
Dλ + 1
)(Dλ + 1
1
)(exp(
δjλ )
D
)
= Dλ−1exp(δj
λ)
= Dλ−1
(exp(
δj
λ)
)1−λ(exp(
δj
λ)
)λ
=(sj|g)1−λ
(exp(
δj
λ)
)λBack to main .

Effect ofmerger onprice and
product quality
Somnath Das
BLP Estimation
Back to main .

Effect ofmerger onprice and
product quality
Somnath Das
Why not using BLP?
• Estimated elasticities using BLP low• For identifying the parameters in BLP it requires rich
data of consumer characteristics and importantlyvariation in that data across markets.
• BLP more appropriate when consumer choosingdifferent products with similar prices but with differentobserved characteristics (e.g, cereal). For airline travelmost important characteristics connections and optionof outside good are captured in the nested logit model.
• Other unobserved characteristics such as morningflights etc will be reflected in price.
Back to main .

Effect ofmerger onprice and
product quality
Somnath Das
Derivation Steps
πf =∑j∈Ff
(pj −mcj)sj(x , ξ,p, θd )M − Cf
∂πf
∂pj= sj(p) +
∑r∈Ff
(pr −mcr )∂sr (p)
∂pj
Ojr =
1 , if ∃f : j , r ⊂ Ff0 , otherwise
Ωprejr (p) = Ojr Ejr =
−∂sr (p)
∂pj, if ∃f : j , r ⊂ Ff
0 ,otherwise
∂sr (p)
∂pj=
sjsr |g
(αpj
)(1− sg − 1
λ) , if r 6= j
sj
(αpj
)(1λ(1− sj|g) + sj|g(1− sg)
), if r = j
Back to main .

Effect ofmerger onprice and
product quality
Somnath Das
DID Analysis Result (Price)Treatment (4→3) Control (3→3)
Table: Effect of Merger on Price
(1) (2) (3) (4) (5)Price Price Price Price Price<5K <10K&>5K <25K&>10K >25K All
time 5.578 -16.70 -11.08 -39.51 -16.17*(0.50) (-0.94) (-0.70) (-1.09) (-1.69)
treated 41.21 57.64** 112.0*** 5.756 44.31**(1.56) (1.98) (3.15) (0.19) (2.11)
did -22.10 42.78 -18.47 -12.38 -18.15(-0.62) (0.90) (-0.33) (-0.31) (-0.52)
cons 442.0*** 421.3*** 352.0*** 345.8*** 401.3***(56.73) (33.15) (30.79) (11.49) (60.31)
N 124 125 140 39 430adj. R2 -0.013 0.013 0.052 -0.024 0.009t statistics in parentheses* p < 0.10, ** p < 0.05, *** p < 0.01
Back to main .

Effect ofmerger onprice and
product quality
Somnath Das
DID Analysis Result (Price)Treatment (4→3) Control (3→3)
Connecting Routes
Table: Effect of Merger on Price
(1) (2) (3) (4) (5)Price Price Price Price Price<5K <10K&>5K <25K&>10K >25K All
time 8.761 -16.22 -13.26 -43.13 -14.66(0.78) (-0.91) (-0.79) (-1.11) (-1.53)
treated 44.39* 52.69* 105.2*** -15.26 38.73*(1.68) (1.81) (2.94) (-0.48) (1.85)
did -25.28 42.30 -16.29 -8.760 -19.66(-0.70) (0.89) (-0.29) (-0.21) (-0.57)
cons 438.8*** 426.2*** 358.8*** 366.9*** 406.9***(57.09) (33.73) (29.68) (11.83) (61.91)
N 122 117 127 32 400adj. R2 -0.009 0.010 0.048 -0.014 0.007t statistics in parentheses* p < 0.10, ** p < 0.05, *** p < 0.01
Back to main .

Effect ofmerger onprice and
product quality
Somnath Das
Conduct
πf = πown + (κ) ∗ πothers
πf =∑j∈Ff
(pj −mcj)sj(x , ξ,p, θd )M
+(κ)∑
j 6∈Ff
(pj −mcj)sj(x , ξ,p, θd )M − Cf
Ωprejr (p) =
(Ojr + κOc
jr) Ejr
Ocjr =
0 , if ∃f : j , r ⊂ Ff1 , otherwise
κ = f (mmctkh) =
exp(φ1 + φ2mmctkh)
1 + exp(φ1 + φ2mmctkh)
Back to main .

Effect ofmerger onprice and
product quality
Somnath Das
Conduct (contd.)
πA = (pa −mca)saM + κ(pb −mcb)sbM − (Ca + κCb)
πB = (pb −mcb)sbM + κ(pa −mca)saM − (Cb + κCa)
∂πA
∂pa= saM + (pa −mca)M
∂sa
∂pa+ κ(pb −mcb)M
∂sb
∂pa= 0
∂πB
∂pb= sbM + (pb −mcb)M
∂sb
∂pb+ κ(pa −mca)M
∂sa
∂pb= 0
(sasb
)+
(1 κκ 1
). ∗
(∂sa∂pa
∂sb∂pa
∂sa∂pb
∂sb∂pb
)(pa −mcapb −mcb
)= 0
Back to main .

Effect ofmerger onprice and
product quality
Somnath Das
DID Analysis Result (Price)Overlap (T) Other(C)
Only-AA(C) Only-US(C)
Table: Effect of Merger on Price
(1) (2) (3) (4) (5)Price Price Price Price Price<5K <10K&>5K <25K&>10K >25K All
time 13.20*** 0.106 -4.327* -8.987* -5.427***(7.27) (0.04) (-1.77) (-1.90) (-3.06)
treated 66.54*** 76.44*** 105.2*** 67.92*** 61.94***(23.90) (22.70) (28.09) (14.51) (23.18)
did 4.395 5.304 -34.15*** -26.49*** -30.82***(0.82) (0.84) (-5.32) (-3.33) (-6.40)
cons 382.6*** 356.1*** 319.9*** 298.6*** 334.8***(385.79) (240.18) (230.03) (107.54) (347.97)
N 19628 8609 7356 2663 38256adj. R2 0.027 0.058 0.146 0.107 0.047
Back to main .
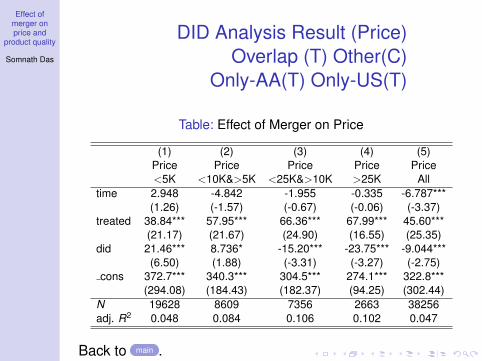
Effect ofmerger onprice and
product quality
Somnath Das
DID Analysis Result (Price)Overlap (T) Other(C)
Only-AA(T) Only-US(T)
Table: Effect of Merger on Price
(1) (2) (3) (4) (5)Price Price Price Price Price<5K <10K&>5K <25K&>10K >25K All
time 2.948 -4.842 -1.955 -0.335 -6.787***(1.26) (-1.57) (-0.67) (-0.06) (-3.37)
treated 38.84*** 57.95*** 66.36*** 67.99*** 45.60***(21.17) (21.67) (24.90) (16.55) (25.35)
did 21.46*** 8.736* -15.20*** -23.75*** -9.044***(6.50) (1.88) (-3.31) (-3.27) (-2.75)
cons 372.7*** 340.3*** 304.5*** 274.1*** 322.8***(294.08) (184.43) (182.37) (94.25) (302.44)
N 19628 8609 7356 2663 38256adj. R2 0.048 0.084 0.106 0.102 0.047
Back to main .

Effect ofmerger onprice and
product quality
Somnath Das
DID Analysis Result (Price)Overlap (T) Other(C)
Table: Effect of Merger on Price
(1) (2) (3) (4) (5)Price Price Price Price Price<5K <10K&>5K <25K&>10K >25K All
time 6.488** -2.360 1.875 -1.008 -3.034(2.53) (-0.70) (0.68) (-0.22) (-1.57)
treated 66.94*** 120.8*** 152.3*** 155.4*** 116.5***(7.52) (13.82) (20.85) (15.86) (21.30)
did 13.57 0.407 -78.21*** -88.68*** -58.44***(1.29) (0.03) (-7.47) (-6.89) (-7.69)
cons 360.4*** 329.2*** 287.5*** 255.7*** 311.8***(263.96) (165.14) (184.31) (100.62) (296.60)
N 10542 4060 3023 676 18301adj. R2 0.023 0.070 0.277 0.498 0.099
Back to main .

Effect ofmerger onprice and
product quality
Somnath Das
DID Analysis Result (Price)Overlap (T) Other(C)
Only-AA(T)
Table: Effect of Merger on Price
(1) (2) (3) (4) (5)Price Price Price Price Price<5K <10K&>5K <25K&>10K >25K All
time 7.030*** -1.010 0.318 -3.635 -5.748***(2.89) (-0.31) (0.12) (-0.92) (-3.13)
treated 52.48*** 67.45*** 93.61*** 100.7*** 64.94***(24.93) (22.01) (28.13) (21.17) (28.16)
did 16.47*** 3.786 -32.88*** -35.75*** -21.35***(4.31) (0.66) (-6.01) (-4.48) (-5.06)
cons 365.1*** 333.4*** 292.6*** 261.3*** 316.3***(280.19) (175.06) (187.91) (101.37) (309.86)
N 15070 5984 4717 1618 27389adj. R2 0.063 0.098 0.214 0.227 0.090
Back to main .

Effect ofmerger onprice and
product quality
Somnath Das
DID Analysis Result (Price)Overlap (T) Other(C)
Only-US(T)
Table: Effect of Merger on Price
(1) (2) (3) (4) (5)Price Price Price Price Price<5K <10K&>5K <25K&>10K >25K All
time 2.715 -5.086 -1.342 5.402 -4.388**(1.10) (-1.61) (-0.48) (0.93) (-2.14)
treated 35.00*** 61.07*** 70.55*** 61.94*** 44.37***(13.81) (17.58) (21.60) (13.45) (19.94)
did 26.33*** 14.13** -12.95** -22.47*** -5.685(6.14) (2.41) (-2.35) (-2.79) (-1.50)
cons 368.2*** 335.0*** 296.5*** 264.4*** 316.4***(276.46) (177.07) (178.98) (101.56) (296.29)
N 14779 6516 5448 1647 28390adj. R2 0.033 0.083 0.122 0.114 0.044
Back to main .

Effect ofmerger onprice and
product quality
Somnath Das
DID Analysis Result (Price)Other(C) Only-AA(T)
Table: Effect of Merger on Price
(1) (2) (3) (4) (5)Price Price Price Price Price<5K <10K&>5K <25K&>10K >25K All
time 7.189*** -1.774 0.0817 -4.060 -6.140***(2.95) (-0.54) (0.03) (-1.13) (-3.37)
treated 46.39*** 52.62*** 64.99*** 81.71*** 51.00***(20.42) (14.48) (16.90) (9.67) (15.93)
did 18.87*** 8.211 -9.555 -22.50 -1.388(4.62) (1.24) (-1.42) (-1.52) (-0.23)
cons 364.8*** 333.2*** 292.0*** 260.0*** 315.9***(279.51) (174.09) (188.24) (106.92) (310.24)
N 14345 5324 3957 988 24614adj. R2 0.048 0.053 0.115 0.176 0.054
Back to main .

Effect ofmerger onprice and
product quality
Somnath Das
DID Analysis Result (Price)Other(C) Only-US(T)
Table: Effect of Merger on Price
(1) (2) (3) (4) (5)Price Price Price Price Price<5K <10K&>5K <25K&>10K >25K All
time 2.743 -5.247* -1.423 -2.189 -5.578***(1.11) (-1.66) (-0.51) (-0.54) (-2.99)
treated 29.54*** 48.76*** 38.64*** 37.52*** 24.92***(11.14) (13.03) (11.48) (8.68) (11.29)
did 26.94*** 19.44*** -0.0137 1.655 10.98***(6.09) (3.09) (-0.00) (0.23) (2.82)
cons 368.0*** 334.7*** 295.9*** 262.2*** 315.8***(276.08) (176.85) (180.36) (110.91) (301.22)
N 14440 6156 4734 1277 26607adj. R2 0.026 0.056 0.047 0.093 0.020
Back to main .

Effect ofmerger onprice and
product quality
Somnath Das
DID Analysis Result (Price)Other(C) Only-AA(T)
Only-US(T)
Table: Effect of Merger on Price
(1) (2) (3) (4) (5)Price Price Price Price Price<5K <10K&>5K <25K&>10K >25K All
time 3.542 -5.658* -2.455 -5.368 -7.943***(1.51) (-1.83) (-0.85) (-1.25) (-4.26)
treated 32.77*** 46.13*** 41.08*** 48.78*** 31.34***(16.91) (15.56) (14.62) (9.65) (15.45)
did 22.17*** 11.07** -2.754 -6.083 4.576(6.41) (2.18) (-0.55) (-0.71) (1.23)
cons 371.9*** 339.6*** 302.8*** 271.3*** 321.6***(292.94) (183.48) (183.29) (98.28) (305.18)
N 18517 7632 6114 1799 34062adj. R2 0.036 0.054 0.052 0.078 0.027
Back to main .

Effect ofmerger onprice and
product quality
Somnath Das
DID Analysis Result (Price)Treatment (2→1) Control (1→1)
Table: Effect of Merger on Price
(1) (2) (3) (4) (5)Price Price Price Price Price<5K <10K&>5K <25K&>10K >25K All
time -6.759 -7.347 -10.45 20.04*** -7.867(-0.80) (-0.70) (-1.11) (4.35) (-1.23)
treated 97.08*** 150.5*** 200.5*** 0 124.2***(3.04) (13.89) (25.27) (.) (5.78)
did 28.97 -126.9* -49.34*** 0 -13.81(0.73) (-1.79) (-5.23) (.) (-0.36)
cons 405.2*** 348.9*** 291.4*** 257.9*** 376.2***(66.60) (45.32) (36.72) (113.65) (80.75)
N 741 303 145 11 1200adj. R2 0.012 0.011 0.110 0.545 0.016t statistics in parentheses* p < 0.10, ** p < 0.05, *** p < 0.01
appendix

Effect ofmerger onprice and
product quality
Somnath Das
DID Analysis Result (Price)Treatment (2→1) Control (1→1)
Connecting Routes
Table: Effect of Merger on Price
(1) (2) (3) (4) (5)Price Price Price Price Price<5K <10K&>5K <25K&>10K >25K All
time -3.083 -5.398 -53.80*** 27.06* -11.88(-0.29) (-0.49) (-3.84) (2.97) (-1.50)
treated 123.9*** 140.0*** 154.2*** 0 129.2***(4.15) (12.08) (12.75) (.) (6.69)
did -12.12 -128.9* -5.986 0 -30.66(-0.32) (-1.80) (-0.43) (.) (-0.83)
cons 415.8*** 359.4*** 337.8*** 258.4*** 392.2***(57.26) (41.34) (27.94) (53.44) (70.97)
N 419 187 71 5 682adj. R2 0.020 0.023 0.308 0.599 0.027t statistics in parentheses* p < 0.10, ** p < 0.05, *** p < 0.01
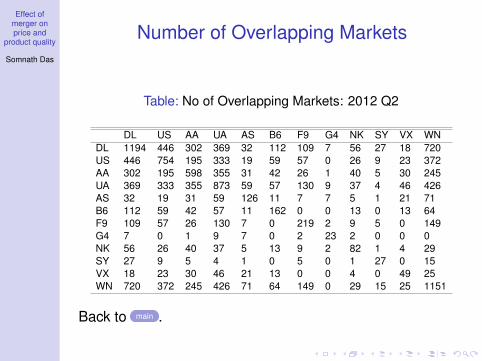
Effect ofmerger onprice and
product quality
Somnath Das
Number of Overlapping Markets
Table: No of Overlapping Markets: 2012 Q2
DL US AA UA AS B6 F9 G4 NK SY VX WNDL 1194 446 302 369 32 112 109 7 56 27 18 720US 446 754 195 333 19 59 57 0 26 9 23 372AA 302 195 598 355 31 42 26 1 40 5 30 245UA 369 333 355 873 59 57 130 9 37 4 46 426AS 32 19 31 59 126 11 7 7 5 1 21 71B6 112 59 42 57 11 162 0 0 13 0 13 64F9 109 57 26 130 7 0 219 2 9 5 0 149G4 7 0 1 9 7 0 2 23 2 0 0 0NK 56 26 40 37 5 13 9 2 82 1 4 29SY 27 9 5 4 1 0 5 0 1 27 0 15VX 18 23 30 46 21 13 0 0 4 0 49 25WN 720 372 245 426 71 64 149 0 29 15 25 1151
Back to main .

Effect ofmerger onprice and
product quality
Somnath Das
DID Analysis Result (Price)Excluding Divestiture
Table: Effect of Merger on Price
(1) (2) (3) (4) (5)Price Price Price Price Price<5K <10K&>5K <25K&>10K >25K All
time 2.917 -4.849 -1.911 -0.264 -6.497***(1.25) (-1.58) (-0.65) (-0.05) (-3.23)
treated 38.87*** 57.85*** 66.41*** 69.37*** 47.61***(21.19) (21.54) (24.78) (16.29) (26.15)
did 21.45*** 8.815* -15.24*** -23.90*** -9.227***(6.49) (1.89) (-3.32) (-3.30) (-2.83)
divest -24.11*** 8.465 -2.187 -10.60** -33.20***(-3.48) (1.01) (-0.33) (-2.22) (-8.73)
cons 372.7*** 340.3*** 304.5*** 274.1*** 322.9***(293.82) (184.42) (182.36) (94.24) (302.42)
N 19628 8609 7356 2663 38256adj. R2 0.048 0.084 0.106 0.103 0.051
Back to main .

Effect ofmerger onprice and
product quality
Somnath Das
Trade-off between Cost savingand Market Power
Back to main .