effect of mindfulness meditation and home-based resistance exercise on weight loss...
TRANSCRIPT

i
EFFECT OF MINDFULNESS MEDITATION AND HOME-BASED
RESISTANCE EXERCISE ON WEIGHT LOSS, WEIGHT LOSS
BEHAVIORS, AND PSYCHOSOCIAL CORRELATES IN
OVERWEIGHT ADULTS
by
Kelliann Kathleen Davis
B.S. Pennsylvania State University, 1999
M.Ed., University of Georgia, 2002
Submitted to the Graduate Faculty of
The Department of Health and Physical Activity in partial fulfillment
of the requirements for the degree of
Doctor of Philosophy
University of Pittsburgh
2008

ii
UNIVERSITY OF PITTSBURGH
SCHOOL OF EDUCATION
This dissertation was presented
by
Kelliann K. Davis
It was defended on
July 25, 2008
and approved by
Elizabeth Nagle, PhD., Assistant Professor, Department of Health and Physical Activity
Kristie Abt, PhD., Assistant Professor, Department of Health and Physical Activity
Louis Pingel,PhD, Associate Dean, Department of Psychology in Education
Dissertation Advisor: John M. Jakicic, PhD., Associate Professor/Department Chairperson,
Department of Health and Physical Activity

iii
Copyright © by Kelliann Davis
2008

iv
[EFFECT OF MINDFULNESS MEDITATION AND HOME-BASED RESISTANCE
EXERCISE ON WEIGHT LOSS, WEIGHT LOSS BEHAVIORS, AND PSYCHOSOCIAL
CORRELATES IN OVERWEIGHT ADULTS.
Kelliann K. Davis
University of Pittsburgh, 2008
Behavioral weight loss programs typically result in short-term weight loss of
approximately 7-10%. However, it is important to continue to develop innovative weight loss
treatments for the overweight and obese to improve upon this weight loss and related outcomes.
PURPOSE: To examine the effect of mindfulness meditation and home-based resistance
exercise on weight loss, weight loss behaviors, and various psychosocial correlates in overweight
adults across a 6-month behavioral weight loss intervention. METHODS: Seventy-one subjects
(BMI = 32.9+3.7 kg/m2; age = 45.1+8.3 years) participated in a 6-month behavioral weight loss
intervention. Subjects were randomly assigned to one of three treatment groups: standard
behavioral weight loss program (SBWL, n=24), SBWL plus resistance exercise (RT, n=23), or
SBWL plus mindfulness training (MD, n=24). All participants were instructed to decrease
energy intake to 1200-1500 kcal/d and dietary fat intake to 20-30% of total energy intake,
increase physical activity to 300 min/wk, and attend weekly group meetings. SBWL+RT
consisted of the addition a resistance training component using resistance tubing and exercise
balls. SBWL+MD consisted of mindfulness training using meditation, yoga, and mindful eating
techniques. Body weight, process measures of weight loss (physical activity, energy intake,
eating behavior inventory), and psychosocial correlates of weight loss (eating and physical
activity self-efficacy, outcome expectations (benefits) and barriers to exercise, dietary restraint

v
and disinhibition, and body image) were measured at 0, 3, and 6 months. RESULTS: Weight
significantly decreased in all groups at 6 months (p<0.05), but did not differ between groups
(SBWL= -6.1±2.4 kg; SBWL+RT= -8.8±1.9 kg, SBWL+MD= -8.0±0.2 kg). Physical activity
significantly increased in all groups at 3 months (average increase = 833+439 kcal/wk) (p<0.05),
but did not differ between groups. Adoption of weight loss eating behaviors increased in all
groups (p<0.05) with no significant difference between groups. Physical activity and eating self-
efficacy, dietary restraint, and most subscales of body image increased over the 6-month
intervention, while dietary disinhibition, perceived hunger, and overall exercise barriers
decreased significantly over time, with no difference between the groups. Significant decreases
in body weight were correlated with improvements in physical activity and weight loss eating
behaviors (p<.05), but not with decreases in energy intake. Significant correlates of physical
activity included perceived barriers to physical activity (negative), physical activity self-efficacy
(positive), and some subscales of body image (positive). Significant correlates of weight loss
eating behaviors included body image (positive), eating self-efficacy (positive), dietary restraint
(positive), dietary disinhibition (negative), and perceived hunger (negative). CONCLUSIONS:
The behavioral weight loss intervention resulted in significant weight loss and improvements in
physical activity and eating behaviors. However, the addition of resistance exercise or
mindfulness training did not improve these short-term outcomes. It remains important that
alternative behavioral approaches be examined over a longer duration to improve weight-related
outcomes in overweight adults.

TABLE OF CONTENTS
CHAPTER 1 INTRODUCTION………………………………………………………………….............. 1 1.1 Treatment of Overweight and Obesity……………………………………………. 2 1.2 Clinical Rationale…………………………………………………………………… 4 1.3 Theoretical Rationale………………………………………………………………. 5 1.4 Specific Aims………………………………………………………………………... 8 1.5 Research Hypotheses………………………………………………………………. 9 1.6 Significance…………………………………………………………………………. 10 CHAPTER 2 REVIEW OF LITERATURE……………………………………………………………… 2.1 Introduction………………………………………………………………………….
12 12
2.2 Obesity: Definition & Prevalence………………………………………………….. 13 2.3 Causes and Contributing Factors to Overweight and Obesity…………………... 13 2.4 Consequences of Overweight and Obesity………………………………………… 14 2.5 Obesity Treatment………………………………………………………………….. 16 2.6 Standard Behavioral Weight Loss Interventions…………………………………. 17 2.6.1 Short-Term Results of Treatment…………………………………………. 19 2.6.2 Long-Term Results of Treatment………………………………………….. 20 2.7 Alternative Treatment for Overweight and Obesity……………………………... 2.7.1 Mindfulness Meditation…………………………………………………….
21 21
2.7.2 Description of Mindfulness Meditation Training………………………… 22 2.7.3 Health Benefits of Mindfulness Meditation Training……………………. 22 2.7.4 Mindfulness Meditation and Weight Loss………………………………… 2.7.5 Resistance Training…………………………………………………………
23 25
2.8 Psychosocial Factors………………………………………………………………... 28 2.9 Conclusion…………………………………………………………………………... 31 CHAPTER 3 METHODS…………………………………………………………………………………..3.1 Introduction………………………………………………………………………….
32 32
3.2 Subjects……………………………………………………………………………… 32 3.3 Study Eligibility Requirements……………………………………………………. 33 3.4 Recruitment and Screening Procedures……………………………...................... 34 3.5 Experimental Design……………………………………………………………….. 35 3.6 Standard Behavioral Weight Loss Intervention………………………………….. 3.6.1 Dietary Intervention………………………………………………………...
36
3.6.2 Exercise Intervention…………..…………………………………………... 37 39
3.7 Mindfulness Meditation Intervention…………………………………………….. 41 3.8 Resistance Exercise Intervention………………………………………………….. 43 3.9 Assessment Procedures…………………………………………………………….. 45 3.9.1 Height, Weight, and Body Mass Index……………………………………. 3.9.2 Body Composition…………………………………………………………...
45
3.9.3 Anthropometric Measurements……………………………………………. 46 45

3.9.4 Cardiorespiratory Fitness…………………………………………………..
3.9.5 Dietary Intake………………………………………………………………. 46
3.9.6 Physical Activity…………………………………………………………….. 48
3.9.7 Eating Behaviors……………………………………………………………. 48
3.9.7 Muscular Strength………………………………………………………….. 48
3.9.8 Physical Function…………………………………………………………… 49 50
3.9.9 Correlates of Weight Loss and Behavior Change Questionnaires………. 50 3.10 Statistical Analyses………………………………………………………………….. 52 3.11 Power Analyses……………………………………………………………………… 53 CHAPTER 4 RESULTS…………………………………………………………………………………… 55 4.1 Subject Characteristics…………………………………………………………….. 55
56 4.2 Retention Rates…………………………………………………………………….. 4.3 Adherence Measures………………………………………………………………. 57 4.4 Change in Body Weight, BMI, and Body Composition …………………………. 59 4.5 Process Measures………………………… ……………………………………….. 61 4.5.1 Physical Activity………………… ………….……………………………... 61 4.5.2 Energy Intake…………..……… …….…..………………………………... 62 4.5.3 Eating Behavior Inventory……… ………………………………………… 64 4.6 Change in Muscular Strength………… ………………………………………….. 64 4.7 Change in Mindfulness…………………………………………………………….. 64 4.8 Psychosocial Variables.…………………………………………………………….. 66 4.8.1 Physical Activity Self-Efficacy and Eating Self-Efficacy………………… 4.8.2 Eating Inventory…..………………………………………………………...
66
4.8.3 Body Image…………………………………………………………………. 67 68
4.8.4 Exercise Beliefs (Outcome Expectations and Perceived Barriers) 69 4.9 Correlates of Body Weight Change….……………………………………………. 4.9.1 Physical Activity……………………………………………………………..
71
4.9.2 Energy Intake……………………………………………………………….. 71
4.9.3 Eating Behaviors……………………………………………………………. 72 72
4.9.4 Physical Activity Self-Efficacy and Eating Self-Efficacy………………… 4.9.5 Body Image………………………………………………………………….
73 73
4.9.6 Outcome Expectations and Perceived Barriers…………………………... 74 4.9.7 Eating Inventory 78 4.10 Correlations between Process Measures and Psychosocial Variables...………… 79 4.10.1 Psychosocial Correlates of Physical Activity……………………………… 79 4.10.2 Psychosocial Correlates of Energy Intake………………………………… 80 4.10.3 Psychosocial Correlates of Eating Behaviors……………………………... 80 4.11 Summary of Findings………………………………………………………………. 82

CHAPTER 5 DISCUSSION 5.1 Introduction…………………………………………………………………………. 83
83 5.2 Summary of Major Findings and Discussion……………………………………... 5.3 Effect of the Intervention on Participant Attrition………………………….……. 83 5.4 Effect of the Intervention on Weight Loss…………………………........................ 86 5.5 Effect of the Intervention on Process Measures of Weight Loss…..…………….. 5.5.1 Physical Activity………………………………………………...…………...
86
5.5.2 Energy Intake…………..………………………………………….………... 86
5.5.3 Eating Behaviors……………………………………….…………………… 87 88
5.7 Effect of the Intervention on Psychosocial Variables...………………………….. 89 5.8 Effect of the Intervention on Correlates of Weight Loss and Process Measures. 90 5.9 Limitation and Recommendations for Future Research…………………..…….. 92 5.10 Conclusion …..……………………………………………………………………… 94 APPENDIX A………………………………………………………………………………. 96
97 APPENDIX B………………………………………………………………………………. APPENDIX C………………………………………………………………………………. 98 APPENDIX D………………………………………………………………………………. 99 APPENDIX E………………………………………………………………………………. 100 APPENDIX F………………………………………………………………………………. 101 APPENDIX G………………………………………………………………………………. 102 APPENDIX H………………………………………………………………………………. 103 APPENDIX I……………………………………………………………………………….. 104 APPENDIX J……………………………………………………………………………….. 105 BIBLIOGRAPHY………………………………………………………………….............. 106

ix
LIST OF TABLES
Table1. Study Eligibility Requirements.........................................................................................33
Table 2. Standard Behavioral Lesson Topics ................................................................................37
Table 3. Recommended Daily Caloric and Fat Intake by Body Weight .......................................38
Table 4. Progressive Aerobic Exercise Prescription......................................................................39
Table 5. Treatment components for SBWL, SBWL + RT, and SBWL + MD groups..................41
Table 6. Mindfulness Meditation Lesson Topics...........................................................................42
Table 7. Baseline Characteristics of Subjects (Total, Completers, and Non-Completers) ............56
Table 8. Baseline Characteristics of Completers, Non-Completers across the Intervention
Groups............................................................................................................................................59
Table 9. Differences in Main Outcome Measures for Completers Across the 6-Month Standard
Behavioral Intervention by Group .................................................................................................60
Table 10. Differences in Absolute & Relative Muscular Strength (Chest and Leg) and in a
Measure of Mindfulness for Completers Across the 6-Month Behavioral Intervention by
Group .............................................................................................................................................65
Table 11. Differences in Self-Efficacy (Physical Activity and Eating) for Completers Across the
6-Month Standard Behavioral Intervention by Group...................................................................67
Table 12. Differences in Dietary Restraint, Dietary Disinhibition, and Perceived Hunger for
Completers Across the 6-Month Standard Behavioral Intervention by Group..............................68
Table 13. Differences in Body Image for Completers Across the 6-Month Standard Behavioral
Intervention by Group....................................................................................................................70
Table 14. Differences in Outcome Expectations (Benefits) and Perceived Barriers for Physical
Activity for Completers Across the 6-Month Behavioral Intervention by Group.........................71
Table 15. Correlations Between 3-and 6-Month Weight Change and Process Measures .............72

Table 16. Correlations Between 3-and 6-Month Weight Change and Self-Efficacy (Physical
Activity &Eating)...........................................................................................................................75
Table 17.Correlations Between 3-and 6-Month Weight Change and Body Image .......................76
Table 18.Correlations Between 3-and 6-Month Weight Change and Expected Outcomes and
Barriers for Physical Activity ........................................................................................................77
Table 19.Correlations Between 3-and 6-Month Weight Change and Eating Behaviors ...............78
x
xi
LIST OF FIGURES
Figure 1. Proposed theoretical construct for how mindfulness meditation training may impact
eating and physical activity behaviors and weight loss ...................................................................7
Figure 2. Proposed theoretical construct for how resistance exercise may impact eating and
physical activity behaviors and weight loss.....................................................................................7
Figure 3. Study Enrollment and Randomization............................................................................35
Figure 4. Study Timeline ...............................................................................................................36
Figure 5. Study Enrollment and Retention ....................................................................................57
Figure 6. Energy Intake (kcal/day) and Diet Composition (%) from Baseline to 6-Months for the
Three Intervention Groups.............................................................................................................63

INTRODUCTION
The epidemic of overweight and obesity in the United States and worldwide continues
to be a serious public health concern, and has proven to be a multi-faceted crisis with
considerable economic, social, psychological, and medical consequences. The prevalence of
overweight (body mass index (BMI) > 25kg/m2) and obesity (BMI > 30kg/m2) in the United
States is currently 65% and 32%, respectively.87 These estimates represent more than a
doubling in the rates of obesity since 1980.88 Consequently, obesity-related co-morbidities,
including cardiovascular disease, dyslipidemia, type II diabetes, hypertension, sleep apnea,
some forms of cancer, and various musculoskeletal problems, have also increased.88, 94, 95
These obesity-related morbidities increase the health care costs attributed to obesity. A
staggering 5.7 to 9.1% of the annual national health care costs (~$92.6 to $117 billion dollars)
is attributed directly (e.g., medical care, hospital time, physician services, medications) to
obesity,139 while an additional 64 billion dollars are spent on the indirect costs (e.g., decreased
productivity, increased absenteeism, lost work output) of obesity.39, 139 Americans are also
spending billions on obesity treatment. Not only do overweight and obese adults have health
care costs that are 37% higher than normal weight adults,107 there also exists a more than $40
billion-per-year diet industry which serves nearly 55 million Americans who attempt to lose
weight each year.39 Although not included in these estimates, the psychological costs for these
individuals must also be considered, including decreased self-esteem, increased rates of
clinical depression, increased severity of binge-eating disorders, and discrimination.42, 129
Clearly the continued treatment of overweight and obesity remains critical in that even a
modest reduction of 5-10% of initial body weight improves these health outcomes 30, 69 and
allays the economic burden of obesity.
1

Treatment of Overweight and Obesity
The current treatment for overweight and obesity varies according to the intensity of
treatment, cost, type of intervention employed, strategies used, and involvement of health-care
providers, which can range from self programs to pharmacotherapy and obesity surgery.
Regardless of the treatment selected, however, most include some form of lifestyle
modification that incorporates diet, exercise, and behavior change.125, 126 In fact, the Clinical
Guidelines for the Identification, Evaluation, and Treatment of Overweight and Obesity
published by The National Heart, Lung, and Blood Institute (NHLBI) suggests that behavioral
weight control interventions which combine caloric restriction, physical activity, and behavior
therapy are the most effective for weight loss and weight loss maintenance.1
Diet modification is naturally the foundation of most standard behavioral weight loss
programs. Participants are typically instructed to consume a conventional high carbohydrate,
low-fat (less than 30% of calories from fat) diet with a reduction in energy intake of
approximately 500 to 1000kcal/day.14, 31 A caloric deficit of this magnitude should produce a
weight loss of about 1-2 pounds per week. In addition, engaging in increasing levels of
physical activity has been shown to improve weight loss beyond that produced by diet alone,1,
58 and is likely to be even more essential in the prevention of weight regain following the
program.62, 136 Current guidelines suggest that at least 60 minutes of moderate-intensity
physical activity per day is needed to maximize weight loss. 58, 59 Lastly, these types of
interventions also employ a variety of behavioral therapies, including self-monitoring,
problem solving, stimulus control, relapse prevention, goal setting, social support, and
cognitive restructuring.76 These principles and techniques are taught in order to assist
participants in modifying their eating and physical activity behaviors to an extent that the
2

fundamental goal of weight loss is achieved.
This type of comprehensive approach which combines diet, exercise, and behavior
therapy, has been shown to produce an average weight loss of approximately 10.7kg, or 11%
of initial body weight at the end of treatment.126 Although this degree of weight loss would
be considered a “success” by current standards,64, 137 it has been shown that patients treated
with behavioral lifestyle modification generally regain 30% to 35% of their lost weight in the
year after treatment, and will have regained the majority if not all of the lost weight by five
years. 6, 62, 93
Many studies have also demonstrated that there is a large discrepancy in participants
who are successful and nonsuccessful during a standard behavioral program. It is not only
common for approximately 20% of subjects to drop out of a study before it ends,127 but
among those who do complete the study, there is a large amount of variability in actual weight
loss. For example, results from a 16-week lifestyle weight loss program with a 1 year follow-
up showed that even after accounting for the 30% of subjects who were considered
noncompleters, there remained a large variability in individual weight change (range of 37.2
kg) among those that completed the study.120 In addition, unpublished data from our research
center shows that approximately 70% of individuals lose at least 7% of their baseline body
weight during the initial 6 months of an intervention, indicating that at least 30% of
individuals do not reach a clinically significant weight loss. Thus it remains imperative that
research continues to examine alternative techniques and related psychosocial factors that
encourage adoption of the behaviors that lead to weight loss among those who may not be
responsive to current interventions.
3

Clinical Rationale
It is well accepted that when a participant alters their eating and physical activity
behaviors by decreasing the amount of calories consumed and increasing the amount of
calories expended, weight loss will occur. Research has also shown that by training
participants in theory-based behavior change strategies that encourage desired eating and
physical activity modifications, weight loss can improve.135 However, given the large
variability in success of these behavioral interventions in both the short- and long-term,
identifying strategies and predictors which explain why some participants achieve a clinically
significant weight loss and other do not remains essential.
Results from previous behavioral treatment programs have shown that there are many
factors which contribute to weight loss success among participants. One underlying feature of
most standard behavioral weight loss programs is that participants are typically required to
attend individual or group meetings weekly or bi-weekly, at least in the initial stages of
treatment. This not only facilitates the delivery of the behavioral lessons, but also allows for
group and therapist support throughout treatment. Frequent therapist contact has been shown
to improve weight loss outcomes initially. For example, Jeffrey et al. found that in a standard
6-week behavioral weight loss program, the frequency of therapist-contact (3 times per week
vs. 1 time per week) did increase weight loss.61 In addition to frequent contact, Teixeira et al.
reported that dieting history, dietary intake, outcome evaluations, exercise self-efficacy, and
quality of life, may all be useful pretreatment predictors of success and/or attrition in
behavioral weight loss programs for overweight or obese women.120
When examining physical activity participation, the most consistent correlates have
been exercise self-efficacy, perceived barriers, use of behavioral strategies, and enjoyment. 44,
77, 119 Likewise, when specifically examining eating behaviors, research has shown that
4

increased dietary restraint, decreased dietary disinhibition, body image, and eating self-
efficacy are all positive correlates of eating behaviors that lead to weight loss.119, 121, 137
Therefore these have been recommended as potential targets for behavioral weight loss
treatments, and thus are examined in this study.
Theoretical Rationale
Alternative behavioral and physical activity approaches to weight loss and their
potential effect on related psychosocial parameters continues to be an area of research that
demands attention. Therefore, a standard behavioral weight loss intervention was
supplemented in this study with one of two additional intervention strategies: mindfulness
meditation training or resistance exercise. A theoretical construct was developed to illustrate
the rationale behind why these alternative treatment approaches may differentially affect
weight loss and/or physical activity. (See Figures 1 and 2.)
Mindfulness involves bringing ones’ attention to the internal and external experiences
occurring in the present moment in a nonjudgmental way, and is typically developed through
regular meditation training.12 This concept was applied directly to eating and physical activity
behaviors in this investigation, in which participants were taught techniques of mindfulness
meditation such as breathing exercises, yoga, progressive relaxation, and focused
visualization. Frequently employed was a hunger meditation, in which participants were asked
to bring awareness to their experience of food, hunger, feeling full, thoughts about food and
eating, and emotions. Figure 1 illustrates our proposed theory of how this type of focused
meditation training may impact outcomes. We have theorized that this type of alternative
training will impact self-regulation of eating and exercise behaviors through improvement in
eating self-efficacy, the increased therapist contact time, decreased barriers, decreased dietary
disinhibition, and increased dietary restraint. These variables have previously been shown to
5

impact eating and physical activity behaviors, and thus improve weight loss.
Although increasing physical activity has long been a major component of standard
behavioral weight loss programs, resistance exercise has often been overlooked as a potential
means to improve overall physical activity and weight loss in overweight and obese adults.
Reduced physical function and health-related quality of life is a major barrier to being
physically active in the overweight and obese population, and should therefore be targeted in
our interventions. It has been shown that resistance exercise using resistance tubing and
exercise balls improves strength and physical functioning in the elderly83, and so we proposed
to examine this type of training in overweight and obese individuals. Figure 2 illustrates our
proposed theory of how this type of resistance exercise training may impact outcomes. We
have theorized that this type of alternative training will impact eating and exercise behaviors
through improvement in physical activity self-efficacy, increased therapist contact time,
increased physical strength, function, physical capacity, and improved body image. These
variables have also previously been shown to impact eating and physical activity behaviors,
and thus improve weight loss.
Development of innovative, alternative approaches to a standard behavioral weight
loss program is critical to effectively combat the obesity epidemic. It is not currently known
how the addition of a mindfulness meditation component or a home-based resistance exercise
component using elastic tubing will impact weight loss, physical activity, and related factors.
Therefore this study aimed to examine the potential impact of these strategies on psychosocial
parameters, eating and physical activity behaviors, and weight loss.
6
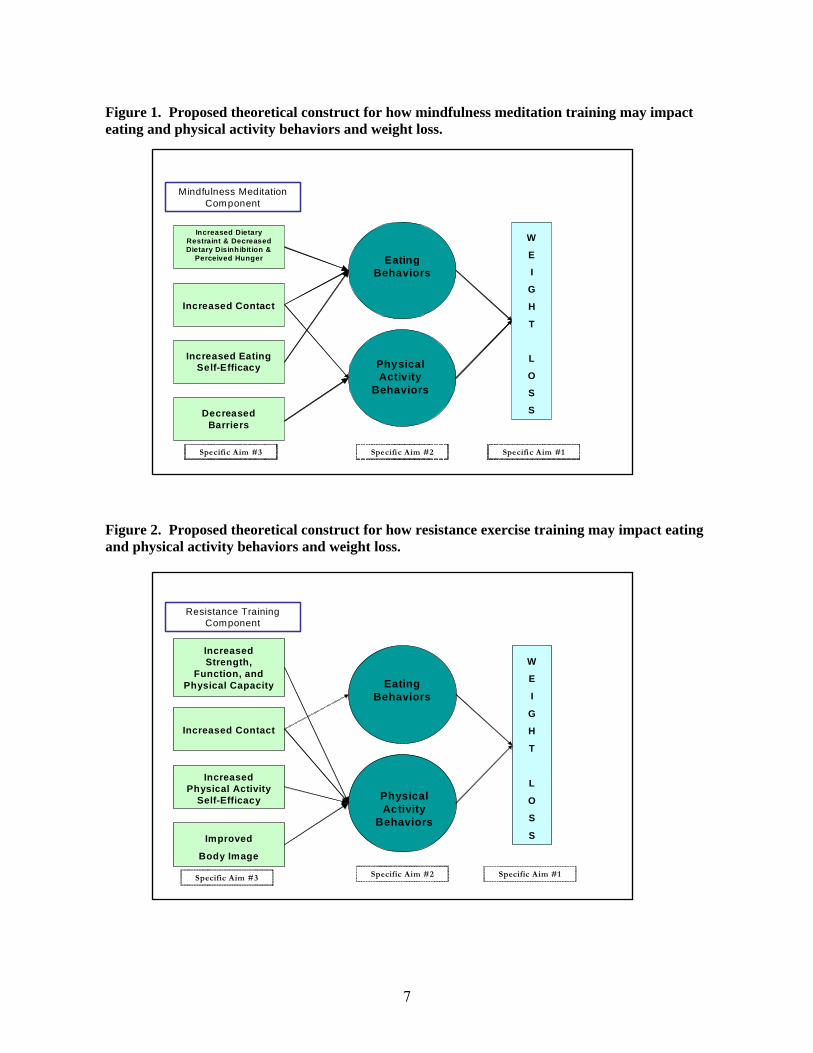
Figure 1. Proposed theoretical construct for how mindfulness meditation training may impact eating and physical activity behaviors and weight loss.
Increased Contact
Increased Eating Self-Efficacy
Increased Dietary Restraint & Decreased Dietary Disinh ibit ion &
Perceived Hunger Eating Behaviors
Physical Activity
Behaviors
W
E
I
G
H
T
L
O
S
S
Mindfulness Meditation Component
Decreased Barriers
Specific Aim #1Specific Aim #3 Specific Aim #2
Figure 2. Proposed theoretical construct for how resistance exercise training may impact eating and physical activity behaviors and weight loss.
Change in appetite
Increased Contact
Increased Physical Activity
Self-Efficacy
Increased Strength,
Function, and Physical Capacity Eating
Behaviors
Physical Activity
Behaviors
W
E
I
G
H
T
L
O
S
S
Resistance Training Component
Improved
Body Image
Specific Aim #1Specific Aim #3 Specific Aim #2
7

Specific Aims
The specific aims of this study (refer to Figures 1 and 2) included:
1. To examine changes in body weight between three intervention groups: standard
behavioral weight loss (SBWL), standard behavioral weight loss plus resistance
exercise training (SBWL + RT), and standard behavioral weight loss plus
mindfulness meditation training (SBWL + MD), during a 24-week behavioral
weight loss intervention.
2. To examine changes in process measures of eating and physical activity behaviors
between three intervention groups: standard behavioral weight loss (SBWL),
standard behavioral weight loss plus resistance exercise training (SBWL + RT),
and standard behavioral weight loss plus mindfulness meditation training (SBWL
+ MD), during a 24-week behavioral weight loss intervention.
3. To examine changes in various psychosocial correlates of weight loss and physical
activity, such as eating and physical activity self-efficacy, outcome expectations
(benefits) and barriers to exercise, dietary restraint and disinhibition, and body
image between three intervention groups: standard behavioral weight loss
(SBWL), standard behavioral weight loss plus resistance exercise training (SBWL
+ RT), and standard behavioral weight loss plus mindfulness meditation training
(SBWL + MD), during a 24-week behavioral weight loss intervention.
The secondary specific aims of this study included:
4. To examine if various psychosocial factors (eating and physical activity self-
efficacy, outcome expectations (benefits) and barriers to exercise, dietary restraint
and disinhibition, and body image) are associated with body weight and physical
8

activity across the three intervention groups: SBWL, SBWL + RT, and SBWL +
MD, during a 24-week behavioral weight loss intervention.
5. To examine if process measures of eating and physical activity behaviors are
associated with weight loss across the intervention groups: SBWL, SBWL + RT,
and SBWL + MD, during a 24-week behavioral weight loss intervention.
6. To examine if various psychosocial factors (eating and physical activity self-
efficacy, outcome expectations (benefits) and barriers to exercise, dietary restraint
and disinhibition, and body image) are associated with process measures of eating
and physical activity behaviors across the three intervention groups: SBWL,
SBWL + RT, and SBWL + MD, during a 24-week behavioral weight loss
intervention.
Research Hypotheses:
The study proposed the following hypotheses:
1. There will be a greater weight loss in the SBWL + RT group and in the SBWL + MD
group when compared to the SBWL group.
2. There will be a greater improvement in process measures of eating and physical
activity behaviors in the SBWL + RT group and in the SBWL + MD group, when
compared to the SBWL group.
3. There will be an improvement in eating self-efficacy, dietary restraint and
disinhibition, outcome expectations (benefits) and perceived barriers in the SBWL +
MD group, when compared to the SBWL group or the SBWL + RT. In addition, there
will be a greater improvement in physical activity self-efficacy and body image in the
SBWL + RT group when compared to the SBWL group or the SBWL + MD group.
9

4. The psychosocial factors of eating and physical activity self-efficacy, outcome
expectations (benefits) and barriers to exercise, dietary restraint and disinhibition, and
body image will be significantly associated with body weight in three intervention
groups: SBWL, SBWL + RT, and SBWL + MD.
5. The process measures of eating and physical activity behaviors will be significantly
positively associated with weight loss across the intervention groups: SBWL, SBWL +
RT, and SBWL + MD.
6. The psychosocial factors of eating and physical activity self-efficacy, outcome
expectations (benefits) and barriers to exercise, dietary restraint and disinhibition, and
body image will be significantly associated with the process measures eating and
physical activity behaviors in the intervention groups: SBWL, SBWL + RT, and
SBWL + MD.
Significance
Behavioral weight loss interventions have been shown to effectively treat overweight
and obesity, producing an average loss of 10.7kg (11% of initial weight), 126 with maximal
weight loss usually occurring around 6 months62. In the year following behavioral weight loss
treatments, weight regain averages approximately 30% to 50% of lost weight,74 indicating that
the successful maintenance of long-term weight loss following treatment remains a significant
challenge. Yet, despite the ineffectiveness of our current interventions long-term, the
continued treatment of obesity is warranted in that even a modest weight loss of 5-10% of
initial body weight results in beneficial health effects, and possibly decreased morbidity and
mortality from cardiovascular disease, diabetes, musculoskeletal problems, and some forms of
cancer1, 69. Thus it is important to continue to develop innovative and cost-effective
interventions that address the challenges of weight loss both in the short- and long-term.
10

This study examined a distinct and unique approach to the management of the obesity
epidemic through the use of alternative behavioral and physical activity methods that may
influence eating and physical activity behaviors that lead to weight loss. In addition, these
alternative methods may theoretically influence psychosocial variables that have the potential
to produce desired outcomes. If it is shown that the addition of these alternative methods to a
standard behavioral weight loss program leads to improved psychosocial parameters, eating
and physical activity behaviors, and ultimately greater weight loss, then researchers and
clinicians could use this information to tailor future behavioral weight loss interventions.
Ultimately this could lead to the application of targeted, cost-effective, and successful
treatments for the overweight and obese and potentially alleviate this public health burden.
11

REVIEW OF THE LITERATURE
Introduction
Obesity is a chronic disease with the prevalence reaching epidemic proportions,
affecting both adults and children in the United States and around the world. The vast social,
economic, and public health consequences demand that serious attention be given to the
development and implementation of strategies to address obesity. In the 2001 Surgeon-
General issued a call to action to prevent an increase in overweight and obesity, which
recommended that a key strategy to address the problem is to increase research examining the
behavioral and biological causes of obesity.33 Although considerable progress had been made
in trying to understand obesity and its’ causes and consequences, much remains unknown.
Therefore without a complete knowledge of the genetic and cultural influences on body
weight, the vast majority of obesity treatment continues to center on current behaviors that
can be changed through the use of behavioral modification techniques.14, 76
Treatments available for overweight and obese individuals include a combination of
behavioral, dietary, and exercise therapies, pharmacotherapy, and weight loss surgery.
Currently, the best non-surgical treatments available produce an average weight loss of
approximately 10% of initial body weight, which although is considered clinically significant,
is likely not enough to stop the upward trend.76 In addition, unpublished findings from our
laboratory have shown that approximately 30% of individuals do not achieve at least 7%
weight loss within the initial 6 months of these standard behavioral treatments. Therefore
innovative and alternative approaches to a standard behavioral weight loss program must
continually be developed and studied to effectively combat the obesity epidemic. It is not
currently known how the addition of a mindfulness meditation component or a home-based
resistance exercise component will impact weight loss, physical activity, and related factors.
12
Therefore this study explored alternative approaches to the management of the obesity
epidemic through the addition of a mindfulness meditation and resistance exercise component
to a standard behavioral program, and examined the potential impact of these strategies on
psychosocial parameters, eating and physical activity behaviors, and weight loss.
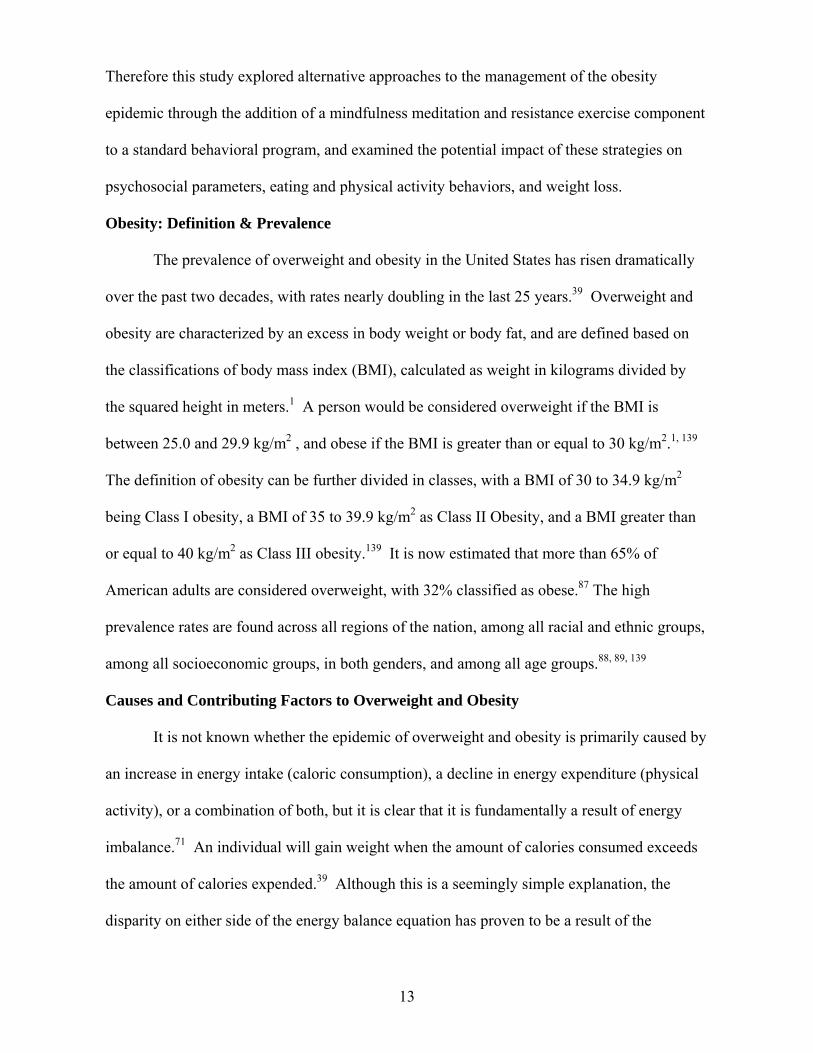
Obesity: Definition & Prevalence
The prevalence of overweight and obesity in the United States has risen dramatically
over the past two decades, with rates nearly doubling in the last 25 years.39 Overweight and
obesity are characterized by an excess in body weight or body fat, and are defined based on
the classifications of body mass index (BMI), calculated as weight in kilograms divided by
the squared height in meters.1 A person would be considered overweight if the BMI is
between 25.0 and 29.9 kg/m2 , and obese if the BMI is greater than or equal to 30 kg/m2.1, 139
The definition of obesity can be further divided in classes, with a BMI of 30 to 34.9 kg/m2
being Class I obesity, a BMI of 35 to 39.9 kg/m2 as Class II Obesity, and a BMI greater than
or equal to 40 kg/m2 as Class III obesity.139 It is now estimated that more than 65% of
American adults are considered overweight, with 32% classified as obese.87 The high
prevalence rates are found across all regions of the nation, among all racial and ethnic groups,
among all socioeconomic groups, in both genders, and among all age groups.88, 89, 139
Causes and Contributing Factors to Overweight and Obesity
It is not known whether the epidemic of overweight and obesity is primarily caused by
an increase in energy intake (caloric consumption), a decline in energy expenditure (physical
activity), or a combination of both, but it is clear that it is fundamentally a result of energy
imbalance.71 An individual will gain weight when the amount of calories consumed exceeds
the amount of calories expended.39 Although this is a seemingly simple explanation, the
disparity on either side of the energy balance equation has proven to be a result of the
13

complex interaction of biologic, genetic, cultural, social, and environmental factors.139
Increased energy intake is the result of eating and drinking behaviors, which are
influenced by hunger, satiety, and thoughts.139 Decreased energy expenditure is the result of
physical activity and exercise behaviors that are less than ideal. These behaviors, however,
are influenced by genetic, physiological, cultural, social, and environmental factors and so
must be considered in context. Although more than 20 genes have been discovered which may
be linked to body fat storage139, and there are some genetic components to the ability to store
fat in the presence of food excess or lose fat in the presence of starvation, it is unlikely that
genetics and biology completely explain this epidemic.78, 88 Rather this may be a result of a
gene-environment interaction, in which genetically predisposed individuals may respond to
the overwhelming presence of energy-dense foods and an increase in energy-saving devices
that encourage sedentary behaviors.88, 139 There also appears to be a disconnect between
thoughts and behavior in that although more than 60% of adults who are overweight and
obese report using physical activities to lose weight, only 20% of them are meeting the
physical activity guidelines.139 Clearly the dose of physical activity required to compensate
for these eating behaviors is not being met, and thus is not enough to promote energy balance.
Consequences of Overweight and Obesity
The negative effects of obesity extend into many aspects of our society, with far-
reaching medical, economic, and psychosocial consequences. Medically, it has been well-
reported that a higher body weight, or higher BMI, is associated with an increased morbidity
and mortality of numerous conditions, such as diabetes mellitus, cardiovascular disease,
hypertension, sleep apnea, dyslipidemia, stroke, musculoskeletal disorders, and certain types
of cancers.1, 33, 88 Central adiposity, or the amount of abdominal fat, is of particular concern
because it has been shown to be an independent risk factor for morbidity associated with
14

overweight and obesity. 1 Although the exact number of deaths directly attributable to obesity
is difficult to determine, the current estimates range from 110,000 to 300,000 annually in the
United States.41, 89, 139
The economic impact of overweight and obesity is equally overwhelming. Obesity
imposes costs on an individual level by limiting personal opportunities39, 107 and by incurring
annual medical expenditures that are 36% higher than normal-weight individuals.39 These
expenditures extend into the workplace, where employers who offer health insurance absorb
many of these additional costs, along with the indirect costs of increased absenteeism, reduced
productivity, and lost work output.39, 107 Ultimately these individual and workplace costs
translate into government costs. Treatment of obesity-related diseases is estimated to account
for $92.6 to $117 billion dollars, which is approximately 5.7% to 9.1% of the total US health
care expenditures.139 Medicare (~$17 billion) and Medicaid (~$21.3 billion) pay for more
than half of these costs through public funds107, costing the average taxpayer approximately
$175 per year to finance obesity-related expenses among recipients of these government
programs.39 Lastly, an estimated $36.5 billion of these costs is paid for by private
insurance.139
Although potential psychosocial consequences involve a complex interaction of
gender, personality, level of education, socioeconomic status, poverty, cultural beliefs, and
family environment, it is important to examine how these issues adversely affect quality of
life in the overweight and obese.139 Numerous reports show that these individuals experience
significant impairments in quality of life as a result of their obesity40, 67, with greater
impairments associated with greater degrees of obesity.63, 70 In addition, the stigma of being
overweight or obese may contribute to higher rates of anxiety, depression115, low self-esteem,
and increased rates of binge-eating disorder (BED).24, 67, 71, 139
15

Obesity has proven to be an extremely complex condition of which prevention and
treatment are challenging, yet crucial. The deleterious medical and psychosocial effects
experienced by overweight or obese individuals extend beyond the personal level into vast
economic, social, and public health consequences. Thus to combat the epidemic in the long-
term, a multi-faceted approach may be necessary.
Obesity Treatment
The National Institutes of Health have recommended that obese individuals should
aim to lose approximately 10% of their initial body weight, and large clinical intervention
trials have aimed to lose at least 7% of initial body weight.2, 131 A goal of 7 to 10% was
chosen because a reduction of initial body at these levels has been shown to elicit health
benefits,1, 3, 96 and there are a few different treatment options available to help individuals
accomplish this goal. Bariatric surgery, pharmacotherapy, and lifestyle modification
approaches which include diet, physical activity, and behavior therapy components are the
most current treatments available.100, 106 A recent review of the efficacy of these treatments
for promoting sustained reductions in body weight (>2 years) reported that both lifestyle and
drug interventions consistently produced a weight loss of approximately 7 pounds sustained
across a 2 year period, which was associated with improvements in diabetes, blood pressure,
and other cardiovascular risk factors.100 Surgical approaches showed larger initial weight
losses (50 to 80 pounds) that were sustained for two years. However, upon consideration of
the more significant short-term side-effects and questions about the sustainability of this loss
beyond the 2 year point, the authors of the review conclude it is still unclear whether the
benefits of surgery outweigh the potential risks.100
Regardless of which treatment is selected by an individual, it is recommended that an
approach (or combination of approaches) that includes lifestyle or behavior modification
16

should be used to promote long-term weight loss and sustainable health benefits in this
population.14, 76, 100, 106, 126, 135 In addition, this approach has been shown to be efficacious and
cost-effective. An economic evaluation concluded that an approach which included diet,
exercise, and behavior modification was effective for weight loss and cost-effective when
compared to other weight loss approaches.106
Standard Behavioral Weight Loss Interventions
The evidence-based Clinical Guidelines for the Identification, Evaluation, and
Treatment of Overweight and Obesity published by The National Heart, Lung, and Blood
Institute (NHLBI) suggests that behavioral weight control interventions which combine
caloric restriction, physical activity, and behavior therapy are the most effective for weight
loss and weight loss maintenance.1 These types of standard behavioral weight loss
interventions are typically conducted on a weekly basis across an initial period of 16 to 26
weeks126, 127 and treatment is usually provided in 30 to 60 minutes of group and/or individual
sessions lead by registered dieticians, exercise specialists, behavioral psychologists, or other
healthcare specialists.126, 135 These group sessions allow for the delivery of the behavioral
therapy lessons, and also for group and therapist support throughout treatment. This type of
frequent therapist contact and group therapy has been shown to improve initial weight loss
outcomes.103, 126 These group sessions typically occur and include assessment of body
weight, followed by the delivery and discussion of a behavioral lesson, which include topics
such as self-monitoring, problem solving, nutrition, physical activity, stimulus control, relapse
prevention, goal setting, social support, and cognitive restructuring.14, 76, 127 The primary goal
of this type of approach is to assist participants in restructuring their lifestyle and environment
to reduce behaviors thought to contribute to obesity, and to closely monitor those behaviors.14
To achieve the recommended weight loss of 1 to 2 pounds of weight loss per week,
17

participants are typically given specific calorie, fat gram, and physical activity goals that are
to be self-monitored throughout the intervention. A conventional high carbohydrate, low-fat
(less than 30% of calories from fat) diet is usually encouraged, with a reduction in energy
intake of approximately 500 to 1000 kcal/day.14, 31 Other diet modifications such as very low
calorie diets (VLCD), meal replacements, portion-control, low glycemic index, and low-carb,
high-fat diets have been used as well, either alone or in combination with the standard
recommendation.126 32, 53, 124
Most studies of short-term interventions show that the most significant weight loss
occurs when a combination of diet and exercise is used, yet the weight loss is only a little
higher than diet alone.1, 27, 54, 58, 60 A meta-analysis by Miller et al.85 reported that in
comparison of 493 studies, diet alone (-10.7kg) and diet plus exercise (-11kg) were superior
to exercise alone (-2.9kg) in reducing weight, with no significant differences between the diet
and diet plus exercise group.85 However most evidence suggests that physical activity does
play a significant role in energy expenditure and long-term weight control,57, 59, 62, 136 and thus
is a vital part of any behavioral weight loss program. The 2005 Dietary Guidelines for
Americans and the current American College of Sports Medicine/American Heart Association
Recommendations both suggest that to promote and maintain health, adults aged 18 to 65
years need moderate-intensity aerobic physical activity for at least 30 minutes per day on five
days each week.31, 50 However, in order to achieve weight loss or prevent weight regain, more
is likely needed.50 Current guidelines suggest that at least 60 minutes of moderate-intensity
physical activity per day is needed to maximize weight loss. 31, 58, 59, 109 Therefore to achieve
the optimal dose of physical activity for weight control, Jakicic and Otto59 recommend that
current standard behavioral weight loss programs should aim to prescribe physical activity
beyond what is needed to achieve health benefits, which is closer to 200-300min/wk or the
18
equivalent of > 2000kcal/wk across the intervention period and beyond.59, 109, 136
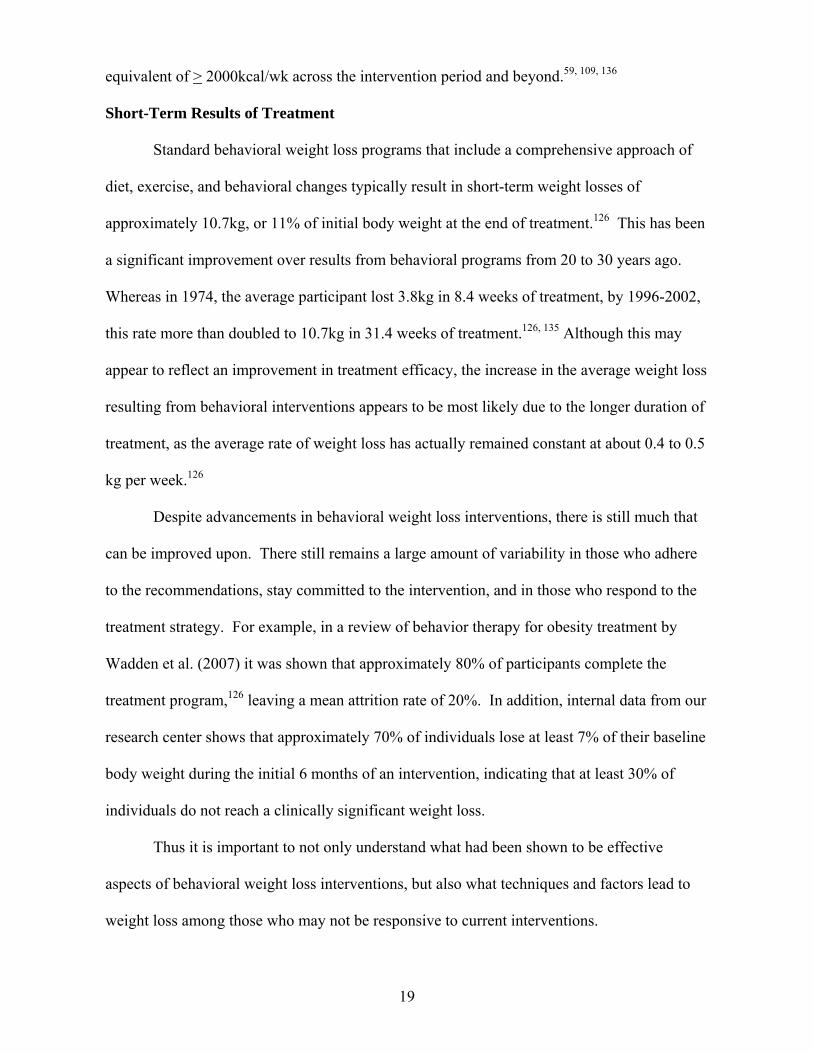
Short-Term Results of Treatment
Standard behavioral weight loss programs that include a comprehensive approach of
diet, exercise, and behavioral changes typically result in short-term weight losses of
approximately 10.7kg, or 11% of initial body weight at the end of treatment.126 This has been
a significant improvement over results from behavioral programs from 20 to 30 years ago.
Whereas in 1974, the average participant lost 3.8kg in 8.4 weeks of treatment, by 1996-2002,
this rate more than doubled to 10.7kg in 31.4 weeks of treatment.126, 135 Although this may
appear to reflect an improvement in treatment efficacy, the increase in the average weight loss
resulting from behavioral interventions appears to be most likely due to the longer duration of
treatment, as the average rate of weight loss has actually remained constant at about 0.4 to 0.5
kg per week.126
Despite advancements in behavioral weight loss interventions, there is still much that
can be improved upon. There still remains a large amount of variability in those who adhere
to the recommendations, stay committed to the intervention, and in those who respond to the
treatment strategy. For example, in a review of behavior therapy for obesity treatment by
Wadden et al. (2007) it was shown that approximately 80% of participants complete the
treatment program,126 leaving a mean attrition rate of 20%. In addition, internal data from our
research center shows that approximately 70% of individuals lose at least 7% of their baseline
body weight during the initial 6 months of an intervention, indicating that at least 30% of
individuals do not reach a clinically significant weight loss.
Thus it is important to not only understand what had been shown to be effective
aspects of behavioral weight loss interventions, but also what techniques and factors lead to
weight loss among those who may not be responsive to current interventions.
19

Long-Term Results of Treatment
The average weight loss of approximately 10-11% of initial weight that is seen in most
standard behavioral programs would be considered a “success” by current standards.64, 137
However, it has been shown that patients treated with behavioral lifestyle modification
generally regain 30% to 35% of their lost weight in the year after treatment, and will have
regained the majority if not all of the lost weight by five years. 6, 62, 93 Regardless of method
used to lose weight in the short-term, long-term weight loss and maintenance remains a
significant challenge.62
However, there is some evidence that extended treatment involving prolonged
therapist contact and proactive approaches that encourage continued use of learned behavioral
strategies can be successful for up to 5 years time. The efficacy of this type of long-term
lifestyle intervention was shown by the success of the Diabetes Prevention Program (DPP),
which was a multi-center randomized clinical trial in over 3000 overweight and obese
individuals with impaired glucose tolerance.2 This trial included a no treatment (placebo)
group, a medication group in which participants were prescribed metformin, and a lifestyle
group in which intensive behavioral methods were taught. Although the initial treatment
phase was 16 to 24 weeks and involved weekly or bi-weekly meetings, there was ongoing
contact at least every 2 months for the remainder of the study. The promising result was that
participants in the lifestyle group lost significantly more weight at all assessment periods
when compared to the other two treatment groups. The average weight loss in this group at 6
months was a modest but clinically significant 7% of baseline weight, which was maintained
at 12 months, but then was slowly regained for a mean weight loss of 4% at the end of
treatment. Although modest, these results were considered very successful when compared to
the metformin group, who lost 2.5% within the first year, and then regained weight during the
20

subsequent 2 years. However, the main and most significant finding of the DPP was that the
lifestyle intervention reduced the risk of diabetes by 58%, and was twice as effective as the
medication group. In addition, self-reported physical activity was 224 minutes at 6 months
and 227 minutes at the end of the study.2, 76, 101, 126, 135 In addition, a recent randomized
controlled trial by Wing et al.138 reported that an 18-month intervention of daily self-weighing
and face-to-face counseling sessions in a group of individuals who had lost weight reduced
the amount of weight regain by 50% when compared to the control group.138
Therefore the success of long-term interventions is likely attributed to the continued
therapist contact, high levels of physical activity, and continued self-monitoring. However,
it is important to continue to develop innovative weight loss treatments in both the short- and
long-term for the overweight and obese to improve upon this weight loss and related
outcomes. Even in highly successful trials such as the Diabetes Prevention Program, weight
regain still occurred in the long-term, suggesting that more needs to be done. There is also a
growing need to expand the current definition of success to include other health related
quality of life outcomes (i.e., physical functioning, pain) in addition to the traditional risk
factor and outcome evaluation.
Alternative Treatments for Overweight and Obesity
Mindfulness Meditation
Recent findings from a random-digit-dialed survey of United States adults in 2002
found that approximately 3.3% of people surveyed had used some form of complementary or
alternative medicine for weight control in the previous 12 months, with the most widely
reported therapies being yoga (57.4%) and mediation (8.2%).112 Despite the use of these
therapies for weight control by some, little is really known about the efficacy of using these
21

types of treatments for weight loss or as part of an overall behavioral weight loss
intervention.5, 98
Description of Mindfulness Meditation Training
Examination of and interest in mindfulness meditation training techniques and the
potential health benefits has grown tremendously since the introduction of a Mindfulness-
Based Stress Reduction (MBSR) clinical program, developed to help chronic pain patients
more than 25 years ago by John Kabat-Zinn.65 The primary goal of this program and others
like it is to provide participants training in meditation techniques to cultivate the quality of
“mindfulness.”15 Mindfulness involves bringing ones’ attention to the internal and external
experiences occurring in the present moment in a nonjudgmental way, without getting caught
up in the thoughts or emotional reactions to these experiences.12, 15 It aims to teach people to
approach stressful situations “mindfully” so they may respond in an appropriate and
thoughtful way instead of automatically reacting to it as they may have previously.15, 65
Mindfulness can be cultivated using a variety of techniques, all which have some form
of meditative component. In addition to formal mindfulness meditation (a sitting or lying
meditation period), there are mindful movement techniques (incorporating yoga or ‘mindful
walking’), and brief periods of being mindful or meditative throughout the day. The
techniques also include the aim of being mindful while doing daily activities, such as being
aware and present in the moment even when doing habitual tasks such as eating or getting a
shower.4
Health Benefits of Mindfulness Meditation
A number of studies have shown beneficial effects of mindfulness on physical health
and psychological well-being.20, 25, 36, 66, 84, 113 A meta-analysis by Grossman et al.48 examined
approximately 20 studies that covered a wide variety of clinical populations (pain, cancer,
22

heart disease, depression, and anxiety, and stressed nonclinical groups) and found overall
effect sizes of approximately 0.5 (p<.0001), suggesting that mindfulness-based techniques,
and specifically MBSR, may help a broad range of individuals with their myriad of health
problems.48 For example, one randomized trial examining the use of mindfulness and
acceptance techniques to improve diabetes self-management compared to an education
control group, found that after 3 months those that used the mindfulness-based therapies were
more likely to use coping strategies to deal with their diabetes, reported better diabetes self-
care, and had better glycated hemoglobin levels.47 Another randomized controlled trial
examining 10-year risk of coronary heart disease (CHD) compared usual care (UC) to the use
of a personalized health plan (PHP) that included mindfulness meditation training and
relaxation techniques.36 Research results showed that the PHP group had a reduced risk of
CHD (7.8%) over the 10-month intervention, possibly due to the increased days of exercise
per week and greater weight loss in the PHP group compared to the UC group, although these
differences were not statistically significant.36
Mindfulness Meditation and Weight Loss
In relation to weight loss, one of the most important effects of a mindfulness
intervention may be on the regulation of health behaviors, such as eating behaviors. Of these
poor eating behaviors, binge eating is one that is particularly harmful because it may lead to
weight gain and obesity.140 For example, binge eating, defined as a repeated, uncontrolled
consumption of a large amount of food, may represent a failure to self-regulate eating
behaviors.140 Poor eating behaviors may also encompass “emotional eating” or eating in
response to one’s emotions rather than hunger cues.82 Emotional eating is a commonly
described occurrence by participants of weight loss programs, and may result from either a
lack of ability or awareness to distinguish between emotional distress and hunger, or from the
23

use of food as a way to reduce emotional distress.82, 97 It has been theorized that mindfulness
meditation may be effective for producing changes relative to binge eating and other negative
eating behaviors such as emotional eating through changes in self-regulation, values
clarification, cognitive-behavioral flexibility, and exposure.111 Additional plausible
mechanisms by which mindfulness meditation training may influence eating behaviors have
been suggested and include the following: 1) it provides an alternative means for relief from
distress, 2) provides a sense of perceived control28 3) provides a heightened ability to resist
impulsive urges,80 and 4) provides a “deconditioning” of habits.20, 28, 111 In one of the few
studies examining mindfulness mediation techniques and eating behaviors, Kristeller and
colleagues conducted a pilot study on the effects of MBSR on 18 women diagnosed with
Binge Eating Disorder (BED) and found a statistically significant reduction in mean
frequency of binge episodes from a mean of 4 per week to 1.6 per week. The authors suggest
that the self-observation skills developed through MBSR training might lead to improved
recognition of satiety cues in binge eaters, as well as an increased ability to resist urges when
they appear.73
Mindfulness training has been shown to be useful as part of clinical interventions that
utilize cognitive-behavioral therapy, and may improve behaviors that relate to a variety of
physical and mental health problems.12 A review of studies utilizing mindfulness training as a
clinical intervention also suggests that not only will many participants who enroll in
mindfulness-based programs complete them in spite of the time and homework requirements,
they will also continue to practice the skills long after treatment completion.11 In addition, a
study which examined the effects of mindfulness on the intention-behavior relationship
demonstrated that individuals acting mindfully and not habitually are more likely to act on
their intentions than are individuals acting habitually and not mindfully,20, 28 which may prove
24

useful in lifestyle modification for obesity treatment.
To date, the systematic evaluation of mindfulness meditation training to specifically
treat overweight and obese individuals as part of a behavioral weight loss intervention has yet
to be done. In addition, the influence of this type of alternative intervention strategy on self-
regulation of eating and exercise behaviors through improvement in specific measures such as
eating self-efficacy, decreased barriers, decreased dietary disinhibition, and increased dietary
restraint has yet to be examined. These variables have previously been shown to impact eating
and physical activity behaviors, and thus improve weight loss. Therefore, given the increasing
popularity of mindfulness training and its’ potential impact on self-regulatory and eating
behaviors, it is critically important to continue to study this innovative strategy.
Resistance Training
Although increasing physical activity has long been a major component of standard
behavioral weight loss programs, the addition of exercise to food restriction only produces an
overall average increase in weight loss of about 1.5 kg.85 However, exercise has been shown
to be a crucial element in long-term weight maintenance, and therefore should be a part of a
comprehensive behavioral weight loss program.137 The majority of interventions have
focused on endurance exercise for weight loss, and resistance exercise has often been
overlooked as a potential means to improve overall physical activity and weight loss in
overweight and obese adults. A recent review of physical activity and weight loss in 17
randomized controlled trials identified 7 that included a resistance-training arm.
Unfortunately, this type of exercise training also did not lead to any improvements in weight
loss compared to the control, at least in the short-term.27 Data on the long-term effects of
resistance training on weight loss are limited as well. A 48-week study examining exercise as
a treatment for obesity compared diet alone, diet plus aerobic training, diet plus strength
25

training, or diet combined with both aerobic and strength training in 128 obese women
enrolled in a standard behavioral weight loss program.128 The women in the study had a mean
weight loss of 16.5 + 6.8 kg at Week 24, but no significant differences were found among any
of the conditions at any time in body weight or body composition. And although resistance
exercise has been theorized to help preserve resting energy expenditure (REE) to a greater
extent than aerobic exercise, the women who received aerobic training had smaller reductions
in REE than the strength training group at Week 24.128 In another randomized controlled trial
that compared walking to resistance training across a 6 month weight maintenance program
and a 23-month follow-up, following a 20-month energy restriction, found that although
exercise training did not improve short or long-term weight maintenance compared to the
control, resistance training did attenuate the regain of body fat mass during weight
maintenance, although this effect disappeared at the 23-month follow-up.18
Despite the lack of strong evidence that resistance training improves weight loss35, the
addition of resistance training has other clear advantages. Fat-free mass normally decreases
following diet-induced weight loss by approximately > 7kg, which typically results in
concurrent decrease in resting energy expenditure (REE).45 Yet it has been shown that
resistance training is a potent stimulus for increasing fat-free mass (FFM), and may help to
preserve FFM while maximizing fat loss during a period of weight loss.35, 55, 58, 72, 99, 122 For
example, Sweeny et al.118 found that following a 3-month diet and exercise intervention,
obese patients had a smaller decline in fat-free mass following a combined endurance and
resistance training program when compared to endurance training alone.118 A recent review of
12 studies that combined resistance exercise and diet (with or without endurance training) by
Hansen et al.49 concluded that resistance training does not modulate fat-mass loss, but it does
prevent the decline in fat-free mass and resting metabolic rate (or REE) secondary to dietary
26

restriction. Donnelly et al.34 also reported that even during a period of severe energy
restriction that induced weight loss and a decline in FFM, weight training was able to elicit
muscle fiber hypertrophy and a significant increase in overall strength (~37% from baseline)
when compared to the sedentary controls.
Reduced physical function and health-related quality of life is also a major barrier to
being physically active in the overweight and obese population49, and the preservation of
FFM may potentially lead to increased strength, physical functioning, and improvement in the
ability to carry out activities of daily living.35, 59, 99 It has already been shown that resistance
exercise using resistance tubing and exercise balls improves strength and physical functioning
in the elderly population,56, 83, 99 but examination of this type of training in overweight and
obese individuals has yet to be studied extensively. For example, a recent study examining
the effects of 12-week home-based resistance training program using body weight and rubber
tubing as a load in elderly adults demonstrated that in the absence of weight loss, this type of
training induced a significantly greater decrease in waist circumference, visceral and thigh fat
thickness, and increase in thigh muscle thickness when compared to the control group.122 In
addition to these beneficial effects, home-based exercise programs have been shown to be
superior to clinic-based interventions in promoting adherence,68 as was also demonstrated by
the fact that there were no dropouts in the previously mentioned study.122 Thus, although data
are lacking for the overweight and obese population, a combination of home-based resistance
training utilizing resistance tubing and exercise balls may provide an effective and practical
way to incorporate resistance exercise into a behavioral weight loss intervention.
In addition to the potential physical benefits of resistance exercise training for the
overweight and obese population, a potential psychosocial advantage that has been shown to
improve with this type of training is body image, physical self-concept, and physical activity
27

self-efficacy.8, 81, 102, 134 A recent meta-analysis based on 35 studies examining the effect of
physical activity on body concerns found an overall effect of .45, which suggests that exercise
does have a positive effect on body image. It was also noted that, overall, anaerobic exercise
such as weight training, generated a stronger effect on body concerns (d=.64) than aerobic
exercises such as jogging (d=.40). 102 A general limitation of these studies, however, is that
the majority of participants were young adults, usually university students, of normal body
weight. Therefore, although resistance training and effects on body image have been studied
in both sedentary men and women, 7, 8, 81, 123 it has yet to be studied in the overweight and
obese population.
Certain variables such as physical activity self-efficacy, increased therapist contact
time, increased physical strength, function, physical capacity, and improved body image have
previously been shown to impact eating and physical activity behaviors, and thus improve
weight loss. However, the extent to which a home-based resistance exercise program will
affect these variables in the overweight and obese population has yet to be determined and
thus requires further examination.
Psychosocial Factors
The large variability in success among participants of behavioral weight loss programs
continues in spite of advancement in research and evolvement of treatment. Obesity has
proved to be a multi-faceted condition which requires equally diverse treatment options,
which specifically target individual psychological, biological, and environmental
differences.121 There has been some attempt at predicting who will be successful at weight
loss at the beginning of a program, or at explaining retrospectively behavioral and
psychological correlates associated with successful or unsuccessful weight loss following a
28

program.23 However, a 2005 review by Teixeira et al.121 reported that only 20-35% of the
variance in subsequent weight loss following a treatment program has been predicted from
baseline variables.121 An adequate explanation as to why some people adopt and maintain
attitudes and behaviors necessary for weight loss and weight maintenance has yet to be
determined, and clearly remains a research priority.
Psychosocial and behavioral variables have been identified that appear to contribute to
weight loss success among participants of behavioral weight loss programs. These variables
are frequently grouped as a part of choice health behavior models, such as the Theory of
Planned Behavior (TPB), the Transtheoretical Model (TTM), the Social-Cognitive Theory
(SCT), and Self-Determination Theory (SDT) in an attempt to explain or predict behavior.92
For example, in addition to frequent therapist contact, Teixeira et al. reported that dieting
history, dietary intake, outcome evaluations, exercise self-efficacy, and quality of life, may all
be useful pretreatment predictors of success and/or attrition in behavioral weight loss
programs for overweight or obese women in the long-term (12-month follow-up).120
However, other variables appeared to be important when examining short-term weight loss in
the same study. Following the 4-month lifestyle weight reduction program, in which
participants lost 6.2 + 4.6% of initial body weight, changes in variables such as eating
restraint, disinhibition, and hunger, exercise, self-efficacy, and body shape concerns, were
associated with weight change at 4-months (p<0.05).119 Another study examining
psychosocial variables in a short-term weight loss intervention found that weight change was
significantly predicted by various health behavior change theories (SCT, TTM, TPB, SDT),
particularly those that included self-efficacy as part of the model.92
Other psychosocial variables related specifically to physical activity and eating
behaviors that likely lead to and/or predict individual weight loss success should also be
29

explored. Past research suggests that the most consistent correlates of physical activity
participation have been exercise self-efficacy, perceived barriers, use of behavioral strategies,
and enjoyment. 13, 44, 77, 119 For example, following a 6-month behavioral weight loss
intervention, 165 overweight or obese women with > 10% weight loss reported higher levels
of physical activity self-efficacy and fewer barriers to physical activity compared to those
with less weight loss (p<0.05). In addition, these same psychosocial variables were related to
higher levels of physical activity.44
Likewise, research has shown that increased dietary restraint, decreased dietary
disinhibition, body image, and eating self-efficacy are all positive correlates of eating
behaviors that lead to weight loss.119, 121, 137 In particular, the eating behavior termed
“disinhibition” has been shown to be strongly associated with weight gain over time and
obesity in adult life.51, 52 In addition, a short-term (12-week) intervention study in overweight
young adults found that as eating self-efficacy improved, eating habits improved and thus
weight loss was greater.104 Long-term studies show similar results, as seen in the PREFER
study.132 Results from this 18-month behavioral weight loss trial also demonstrate that eating
self-efficacy does appear to be significantly associated with weight loss (p=0.02), even after
controlling for dietary adherence.132
If behavioral weight loss interventions are to become progressively more effective,
they will need to specifically target true causal mechanisms of behavior and lifestyle
modification. For example, evidence currently suggests that the knowledge of the health
benefits of weight loss (and related physical activity and eating behaviors) do not appear to
change over time for participants in these types of interventions, and do not appear to be
associated with better outcomes.13, 77 Therefore to spend time educating participants about the
health benefits would likely not be the best use of time and resources. If, however, it was
30

known specifically which psychosocial and behavioral factors largely affect weight loss and
related behaviors, and the time course by which changes in these variables occur,
interventions could be designed to target these defined factors at precisely the right time. The
implications of this knowledge would likely be the development of cost-effective and
increasingly successful behavioral treatment programs to help alleviate some of this public
health burden.
Conclusion
Obesity is recognized as one of the most significant public health burdens with
increasing prevalence rates and inadequate progress in the development of viable treatment
options that maintain weight loss long-term. Therefore development of innovative, alternative
approaches to a standard behavioral weight loss program and understanding the interaction of
individual psychosocial factors is critical to effectively combat this epidemic. Although
previous research findings and plausible mechanisms have been reviewed here, it is not
currently known how the addition of a mindfulness meditation component or a home-based
resistance exercise component using elastic tubing to a standard behavioral weight loss
program will impact weight loss, physical activity, and related factors. Therefore this study
aimed to examine the potential impact of these strategies on psychosocial parameters, eating
and physical activity behaviors, and weight loss.
31

METHODS
Current estimates show that more than 65% of American adults are considered
overweight (body mass index (BMI) > 25 kg/m2), with 32% classified as obese (BMI > 30
kg/m2),87 indicating serious attention must be given to this public health crisis as it is linked to
many serious negative health outcomes.94 Standard behavioral weight loss programs that
include diet, exercise, and behavioral changes typically result in short-term weight losses of
approximately 8-11% of initial body weight.126 However, it is important to continue to
develop innovative weight loss treatments for the overweight and obese to improve upon this
weight loss and related outcomes.
This study examined alternative approaches to the management of the obesity
epidemic through the addition of mindfulness meditation and resistance exercise component
to a standard behavioral program. These additional methods may influence eating and
physical activity behaviors that lead to improved weight loss.
Subjects
The subjects in the current investigation were seventy-two (72) sedentary, overweight
and obese adult men and women who were recruited to participate in a behavioral weight loss
study at the University of Pittsburgh Physical Activity and Weight Management Research
Center. In order to be considered eligible for this study, participants were to be 18 to 55 years
of age, with a BMI ranging from of 25 to 39.9 kg/m2. Inclusion and exclusion criteria for
participation in this study are listed in Table 1.
32
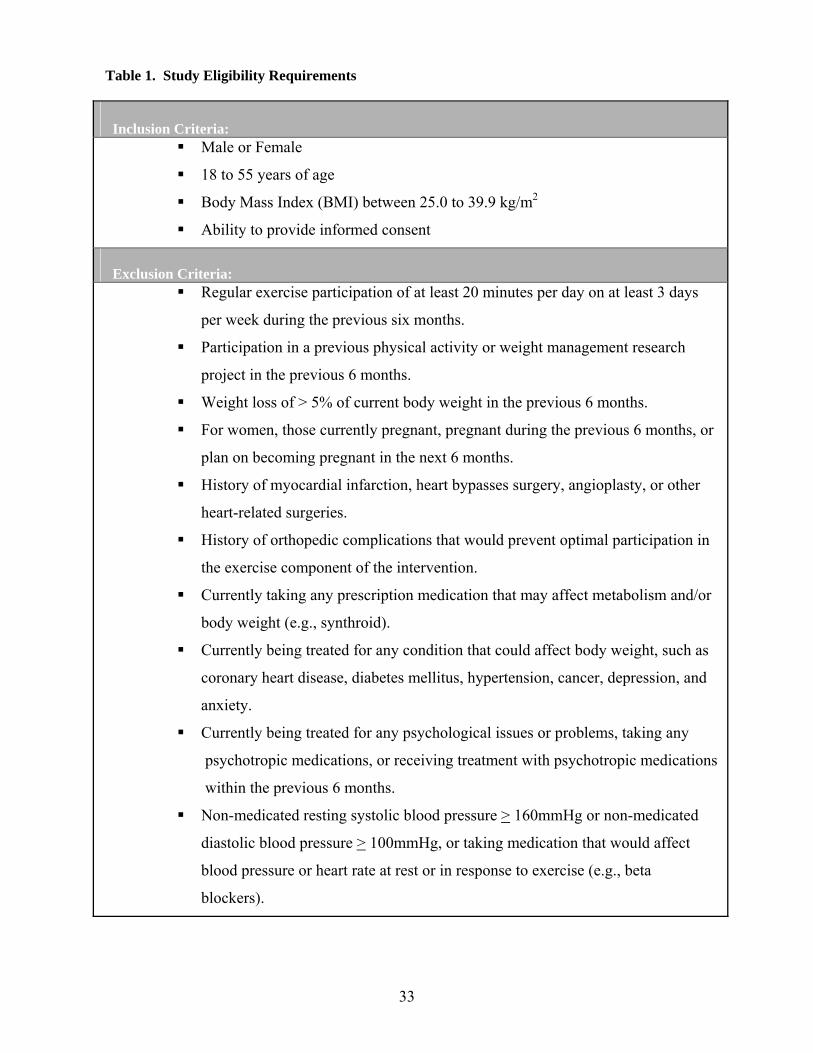
Table 1. Study Eligibility Requirements
Inclusion Criteria:
Male or Female
18 to 55 years of age
Body Mass Index (BMI) between 25.0 to 39.9 kg/m2
Ability to provide informed consent
Exclusion Criteria:
Regular exercise participation of at least 20 minutes per day on at least 3 days
per week during the previous six months.
Participation in a previous physical activity or weight management research
project in the previous 6 months.
Weight loss of > 5% of current body weight in the previous 6 months.
For women, those currently pregnant, pregnant during the previous 6 months, or
plan on becoming pregnant in the next 6 months.
History of myocardial infarction, heart bypasses surgery, angioplasty, or other
heart-related surgeries.
History of orthopedic complications that would prevent optimal participation in
the exercise component of the intervention.
Currently taking any prescription medication that may affect metabolism and/or
body weight (e.g., synthroid).
Currently being treated for any condition that could affect body weight, such as
coronary heart disease, diabetes mellitus, hypertension, cancer, depression, and
anxiety.
Currently being treated for any psychological issues or problems, taking any
psychotropic medications, or receiving treatment with psychotropic medications
within the previous 6 months.
Non-medicated resting systolic blood pressure > 160mmHg or non-medicated
diastolic blood pressure > 100mmHg, or taking medication that would affect
blood pressure or heart rate at rest or in response to exercise (e.g., beta
blockers).
33

Recruitment and Screening Procedures
Subjects for this study were recruited through various media outlets, such as local
newspaper advertisements, newsletters, television and radio advertisements, and other
techniques approved by the Institutional Review Board at the University of Pittsburgh.
Interested individuals were instructed to call the University of Pittsburgh Physical Activity
and Weight Management Research Center via the telephone number provided in the
advertisements. Individuals participated in a brief phone screen interview to assess initial
eligibility and were provided a brief explanation of the study and its’ potential risks and
benefits. This interview was conducted by staff and graduate students at the University of
Pittsburgh Physical Activity and Weight Management Research Center.
If determined eligible, individuals were sent a letter inviting them to attend a sixty
minute orientation session of 20-30 individuals at a time at which a detailed description of the
study was provided and questions concerning the study were answered. Prior to completing
baseline assessments, eligible individuals were asked to provide a written informed consent
document and complete a physical activity readiness questionnaire (PAR-Q) and a detailed
medical history. All subjects were required to provide written clearance from their primary
care physician prior to participation in this study. The cost of obtaining this physician
clearance was the responsibility of the subject.
Eligible subjects participated in a series of baseline assessments that included
measures of height, weight, body composition, cardiorespiratory fitness, muscular strength,
physical function, health-related quality of life, physical activity, eating behaviors, and
questionnaires to assess potential psychosocial correlates of weight loss. Assessment
procedures will be described in detail below. Eligible participants who completed baseline
assessments were then randomized to one of three groups (see Figure 1 below). All
34

procedures were reviewed and approved by the Institutional Review Board (IRB) at the
University of Pittsburgh prior to the initiation of the study.
Figure 3. Study enrollment and randomization.
Advertisement through television and
newspaper ads
Telephone screening for initial eligibility
Standard Behavioral Weight Loss Program
(SBWL)
Randomization to one of three groups
Orientation for those initially eligible.
Initial Screening Procedures
Baseline Assessments
Standard Behavioral Weight Loss Program +
Resistance Training
(SBWL + RT)
Standard Behavioral Weight Loss Program + Mindfulness Meditation
(SBWL + MD)
Experimental Design
This investigation was a 24-week clinical behavioral weight loss intervention
conducted at the University of Pittsburgh Physical Activity and Weight Management
Research Center. Eligible participants who completed baseline assessments were randomized
(as shown above in Figure 1) to one of the following treatment conditions: 1) Standard
behavioral weight loss program (SBWL) 2) Standard behavioral weight loss program plus
resistance exercise training (SBWL + RT), and 3) Standard behavioral weight loss plus
35

mindfulness meditation training (SBWL + MD). Assessments were performed at 0, 12, and 24
weeks of participation. A summary of the study timeline is illustrated in Figure 2 below.
Figure 4. Study timeline.
Month 1 Month 2 Month 3 Month 4 Month 5 Month 6 Month 7 Month 8 Month 9 Month 10 Month 11 Month 12
Baseline Assessments Week 12 Assessments Week 24 Assessments
24-Week Weight Loss Intervention
Data Entry, Data Cleaning, Data Analysis
Subject recruitment, staff training, development of materials.
Weight Loss Interventions:
Standard Behavioral Weight Loss Intervention (SBWL)
All subjects, regardless of group assignment, participated in a comprehensive 24-week
behavioral weight loss intervention that included diet, exercise, and behavior modifications.
To facilitate the intervention, subjects attended group meetings weekly for 6 months at the
University of Pittsburgh’s Physical Activity and Weight Management Research Center.
Group meetings were approximately 30 minutes in length and consisted of structured didactic
behavioral lessons and facilitated group discussions led by a qualified nutritionist, exercise
physiologist, or health educator with experience conducting weight loss intervention groups.
The behavioral lesson topics were based primarily on social cognitive theory and included
strategies for adopting and maintaining positive eating and exercise behaviors. All topics of
the 24-week standard behavioral intervention are listed in Table 2. Weekly recipes and
supplemental written materials, many which included worksheets and home activities, were
also provided to subjects.
36
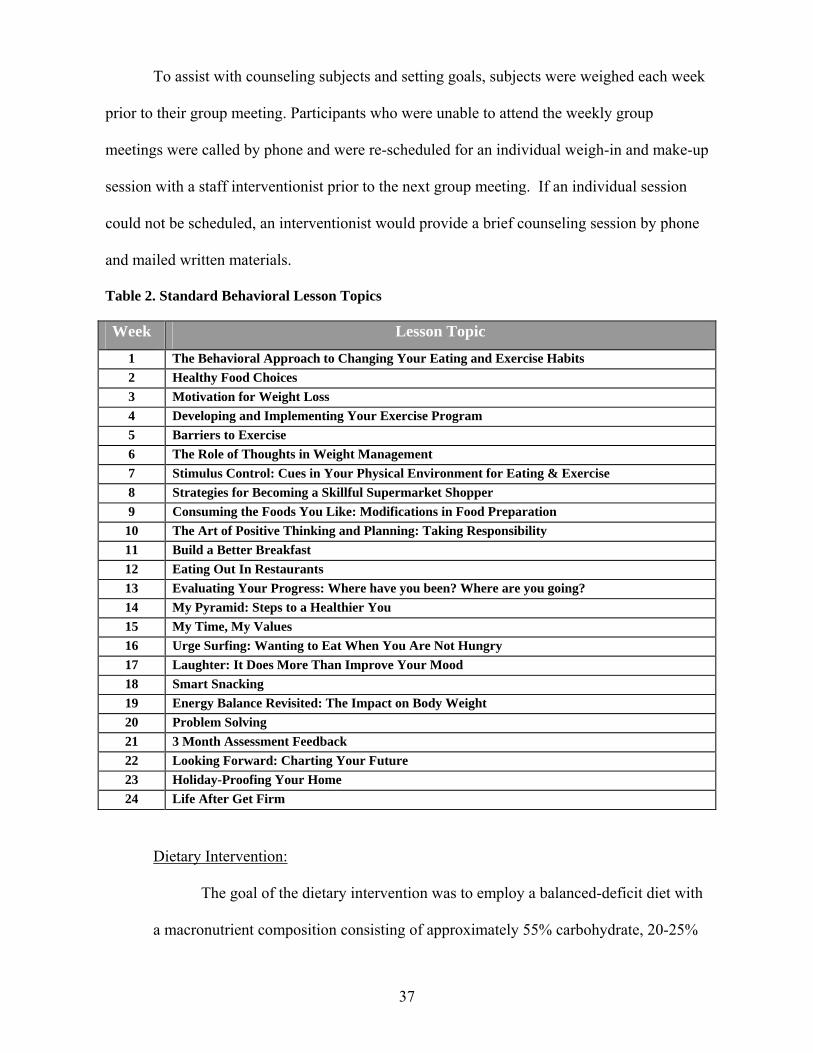
To assist with counseling subjects and setting goals, subjects were weighed each week
prior to their group meeting. Participants who were unable to attend the weekly group
meetings were called by phone and were re-scheduled for an individual weigh-in and make-up
session with a staff interventionist prior to the next group meeting. If an individual session
could not be scheduled, an interventionist would provide a brief counseling session by phone
and mailed written materials.
Table 2. Standard Behavioral Lesson Topics
Week Lesson Topic
1 The Behavioral Approach to Changing Your Eating and Exercise Habits 2 Healthy Food Choices 3 Motivation for Weight Loss 4 Developing and Implementing Your Exercise Program 5 Barriers to Exercise 6 The Role of Thoughts in Weight Management 7 Stimulus Control: Cues in Your Physical Environment for Eating & Exercise 8 Strategies for Becoming a Skillful Supermarket Shopper 9 Consuming the Foods You Like: Modifications in Food Preparation
10 The Art of Positive Thinking and Planning: Taking Responsibility 11 Build a Better Breakfast 12 Eating Out In Restaurants 13 Evaluating Your Progress: Where have you been? Where are you going? 14 My Pyramid: Steps to a Healthier You 15 My Time, My Values 16 Urge Surfing: Wanting to Eat When You Are Not Hungry 17 Laughter: It Does More Than Improve Your Mood 18 Smart Snacking 19 Energy Balance Revisited: The Impact on Body Weight 20 Problem Solving 21 3 Month Assessment Feedback 22 Looking Forward: Charting Your Future 23 Holiday-Proofing Your Home 24 Life After Get Firm
Dietary Intervention:
The goal of the dietary intervention was to employ a balanced-deficit diet with
a macronutrient composition consisting of approximately 55% carbohydrate, 20-25%
37

fat, and 10-25% protein. Subjects were therefore instructed to reduce total energy
intake to approximately 1200-1800 calories per day depending on initial body weight
(see Table 3) and total fat intake to no more than 20% of total caloric intake. These
dietary recommendations are consistent with those typically used in behavioral weight
loss programs,2, 124 and with the 2005 Dietary Guidelines for Americans.64
Table 3. Recommended Daily Caloric and Fat Intake by Body Weight
Body Weight Prescribed Energy Intake Fat Intake < 200 pounds 1200 kcal/day 26 grams
201 to 250 pounds 1500 kcal/day 33 grams> 250 pounds 1800 kcal/day 40 grams
Subjects were provided sample meal plans, menus, and recipes developed by
registered dieticians in order to assist them with making appropriate food selections.
In addition, a copy of The Calorie King® Calorie, Fat, and Carbohydrate Counter
book (2007 Edition) was given to each participant as an additional reference.
Dietary recommendations were based on eating a diet composed of a wide variety of
food groups, weighing and measuring foods to control portion sizes, limiting the
amount of meals eaten out, and self-monitoring daily intake. Additional lessons were
taught on the Food Guide Pyramid, label reading, and healthful eating.
To facilitate this, subjects were asked to record their eating behaviors
(including all calorie and fat content of food) in a weekly food diary that would be
reviewed weekly by the designated interventionist. Diaries were reviewed to
determine if subjects were adherent to the guidelines, accomplishing set goals, and
eating appropriately. If a participant demonstrated eating behaviors that were not
consistent with the study recommendations, they were counseled by a staff dietician.
38

Exercise Intervention:
Subjects were instructed to gradually increase their exercise over the course of
the intervention. The exercise prescribed was primarily aerobic in nature, with
walking being the standard mode recommended. Exercise was initiated at 100
minutes of exercise per week (20 minutes per day, 5 days per week) and progressively
increased by 10 minutes per day at 4-week intervals to 300 minutes per week (60
minutes per day, 5 days per week) by the end of the 6 months. The exercise was to be
of moderate intensity (60 to 70% of age-predicated maximal heart rate), which is
equivalent to brisk walking for most individuals. This intensity corresponds to a
subjective rating of perceived exertion of approximately 11 to 13 on the Borg
Perceived Exertion Scale of 6 to 20,46 and subjects were taught how to monitor their
exercise intensity using this scale. Table 4 illustrates the progressive exercise
prescription.
Table 4. Progressive Aerobic Exercise Prescription
Weeks
Prescribed Exercise Duration
Minutes/Week Minutes/Day Days/Week
Intensity
(RPE*)
1-4 100 min/wk 20 min/d 5 d/wk 11-135-8 150 min/wk 30 min/d 5 d/wk 11-139-12 200 min/wk 40 min/d 5 d/wk 11-1313-16 250 min/wk 50 min/d 5 d/wk 11-1317-24 300 min/wk 60 min/d 5 d/wk 11-13
*RPE –Rating of Perceived Exertion
Subjects were instructed to record their exercise behaviors (including the time,
type, duration, and RPE) in a weekly diary that would be reviewed weekly by the
designated interventionist. If a participant demonstrated exercise behaviors that were
39

not consistent with study recommendations they were counseled by a staff exercise
physiologist.
In addition, subjects were instructed to participate in a thirty minute supervised
exercise session either before or after their group behavioral session at the University
of Pittsburgh’s Physical Activity and Weight Management Research Center where
treadmills and stationary bicycles were available for use. If a participant was unable
to attend in the supervised exercise session, the session was able to be made up later in
the week at the center. An eight week “Step Campaign” was also initiated for all
groups in week 9 of the intervention, in which participants were given pedometers and
tracking cards to record the number of steps done daily. A goal of 10,000 steps per
day or 60,000 steps per week was chosen as the target for participants. To provide
motivation for participation, a weekly raffle was conducted and prizes (e.g., gift cards)
were awarded to those who achieved the step goals for the week.
Table 5 below illustrates the standard diet, exercise, and behavior components
common to all three of the randomized groups, plus the additional treatment
components received by the SBWL + RT and SBWL + MD groups. These additional
components are described in detail below following Table 5.
40

Table 5. Treatment components for SBWL, SBWL + RT, and SBWL + MD groups
STANDARD
RESISTANCE TRAINING
MINDFULNESS/ MEDITATION
Standard Treatment Contact
• 30 minute weekly meetings (Weeks 1-24)
Additional Treatment Contact
• 30 minute Resistance Training instruction & practice.
• 30 minute mindfulness/meditation instruction & practice
Diet Component
Mindfulness Meditation Intervention (SBWL + MD)
Subjects randomized to the mindfulness meditation group received the same 24-week
standard weight loss intervention as described above, which included the same diet, exercise,
and group behavioral lessons. They also received an additional 15 to 30 minute treatment
component which was mindfulness meditation training as described below.
• 1200-1800 calories a day • Fat intake at 20-30% of total
intake • Record diet in a food diary
Exercise Component
• Progress to 300 min/wk
• Supervised Exercise weekly for 30 minutes.
• Record exercise in diary
• Exercise Campaigns
• Resistance training at home 4 X/wk
Additional Component
• Mindfulness/Meditation Practice at home
• Yoga at home
41

Subjects in the SBWL + MD group attended an additional 15 to 30 minute group
session immediately following the standard behavioral group session each week of the
intervention. Mindfulness involves bringing ones’ attention to the internal and external
experiences occurring in the present moment in a nonjudgmental way, and is typically
developed through regular meditation training.12 These sessions were taught by a graduate
student with expertise in mindfulness mediation practice and techniques, and were geared
specifically toward improving eating and physical activity behaviors. The lessons taught
included topics such as breathing exercises, visualization, focused eating and walking
meditations, progressive relaxation, yoga, and personal awareness. Table 6 outlines the
mindfulness meditation topics for each week during the intervention.
Table 6. Mindfulness Meditation Lesson Topics
Week Lesson Topic
1 Introduction to Group Assignment and Plan 2 Introduction to Mindfulness & Steps to Mindful Eating/Raisin Meditation 3 Sitting Medication – Mastering the Mindful Meal & Mindful Eating 4 Body Scan Meditation – Stress and the “Monkey Mind” 5 Conscious Eating & Hunger Meditation 6 Yoga Standing Meditation (CD) 7 Awareness of Satiety/Fullness Meditation & Hunger/Taste Meditation 8 Review Mediation Progress- Recommitment 9 Mindful Lying Yoga Session (CD)
10 Lake Meditation and Eating Triggers 11 Mindful Yoga for Weight Management I – Yoga DVD 12 Managing Emotional Eating – Taste, Portions, and Emotions 13 Health-e-Weight: Understanding Your Inner Voice/Negative Thinking 14 Mindful Yoga for Weight Management II – Yoga DVD 15 The Principles of Mindful Eating Review and Mindfulness Scales 16 Principles of Mindful Exercise 17 Mindful Yoga for Weight Management III – Yoga DVD 18 Seven Mindfulness Qualities 19 Meditation on Forgiveness 20 Practicing Walking Meditations 21 Mindful Walking Meditation- 2 mile walk 22 Inner Wisdom Meditation 23 What is Normal Eating? Mindful Relapse Prevention 24 Integrating Mindfulness Into Everyday Life
42
Subjects discussed and performed the components if mindfulness mediation during
each in-person session, and were then instructed to practice these techniques and incorporate
them into their daily lives the remaining days of the week. In order to facilitate the use of
mindfulness meditation in their every day lives, subjects were provided either handouts
recounting the weekly lesson/meditation, or a CD/DVD that guided them through the various
breathing and yoga exercises taught during the in-person session. Subjects were also
instructed to monitor and record their daily participation in mindfulness meditation techniques
in their exercise diary, and a Mindfulness Mediation participation recall questionnaire was
collected at the beginning of each weekly group session. This questionnaire asked if they
participated in mindfulness meditation and yoga each week, and if so, how approximately
how much time was spent in these activities.
Resistance Exercise Intervention (SBWL + RT)
Subjects randomized to the resistance exercise group received the same 24-week
standard weight loss intervention as described above, which included the same diet, exercise,
and group behavioral lessons. They also received an additional 15 to 30 minute treatment
component which was resistance exercise training as described below.
Subjects in the SBWL + RT group attended an additional 15 to 30 minute group
session immediately following the standard behavioral group session each week of the
intervention. Subjects in this group were provided with rubber exercise resistance tubing,
exercise resistance balls, and laminated exercise cards complete with color pictures and
written descriptions of each resistance training exercise that was to be completed. In addition,
they were provided with exercise logs to record the days completed, duration, sets, reps, RPE,
and color tubing used during their resistance exercise when at home. The resistance tubing
was available in four different resistance levels ranging from easy to difficult. Intervention
43

staff that led the resistance training group session initially provided bands to each individual
participant in order to ensure safety and that the appropriate level tubing was provided. This
was determined by encouraging subjects to use the elastic tubing that forced the specific
muscle group being worked to be at a rating of perceived exertion (RPE) between 6 and 8 on
the OMNI 1-10 scale upon completion of the recommended sets and repetitions (typically 3
sets of 10 repetitions).
Each week the intervention staff led the subjects in an in-person resistance training
session in which all exercises were taught and then monitored for proper execution. They
were then instructed to engage in the resistance training routine taught in the group session an
additional 4 days per week, totaling 5 days per week of resistance training exercises.
Exercises were changed and/or altered approximately every 4 weeks throughout the
intervention in order to ensure a safe and effective progression of exercises. In addition, a
resistance training “Lift-a-Ton” campaign was implemented at week 16 to enhance participant
motivation and adherence to the resistance training exercises. Subjects were instructed to log
the amount of repetitions and sets done at home and these numbers were converted into
weight in pounds. The goal was to lift a “ton” by the end of the campaign and prizes were
awarded to those achieving predetermined levels.
Subjects were instructed to monitor and record their resistance exercise in their
exercise diaries and on the logs provided. The diaries were reviewed by the interventionists
each week and feedback was provided when necessary to ensure achievement of goals, proper
use of tubing and progression when necessary, and participation. Subjects were instructed to
progress to the next resistance level in the elastic tubing when reporting an RPE of less than 6
for the active muscle involved on 2 separate occasions when the prescribed amount of sets
44

and repetitions were completed. The goal of this progression was to minimize the risk of
injury while allowing for continued strength development.
Assessment Procedures
Assessments were conducted at the University of Pittsburgh Physical Activity and
Weight Management Research Center weekdays between the hours of 7:00AM and 11:00AM.
Each assessment took approximately one and a half hours to complete, and subjects were each
paid a stipend of $25.00 upon completion of the baseline, 3, and 6 month assessment. In
addition, a packet of questionnaires were given to participants upon scheduling to complete at
home. The following measurements were taken at baseline, 12 weeks, and 24 weeks of the
intervention.
Height, Weight, and Body Mass Index:
Height was assessed to the nearest 0.1cm at the baseline visit using a wall-
mounted stadiometer (Perspective Enterprises, Portage, MI) with subjects removing
their shoes for this measurement. Weight was measured at 0, 12, and 24 weeks on a
balance beam scale recorded to the nearest 0.25kg (Healthometer Inc., Bridgeview, IL)
with subjects in a lightweight hospital gown. BMI was then computed using these
measurements of height and weight (kg/m2).
Body Composition:
Body composition, or an estimate of the total amount of fat mass and lean
mass, was analyzed using bioelectrical impedance analysis (BIA) at 0, 12, and 24
weeks. Resistance and reactance were measured using a tetrapolar impedance
analyzer (Quantum II Bioelectrical Body Composition Analyzer, Clinton Township,
MI) while subjects were supine with arms and legs abducted. Following cleaning of
the skin surface with alcohol, disposable electrodes were placed on the following four
45

sites: 1). Midpoint of the right styloid processes of the ulna and radius, 2). Distal end
of the second and third metacarpals, 3). Between the lateral malleolus and the medial
malleolus, and 4). The distal end of the first and second metatarsals. Fat and lean
mass will be estimated from regression equations predicting lean mass as measured
with DEXA validated by Segal and colleagues.110
Anthropometric Measurements:
Waist and hip circumferences were obtained with a Gulick measuring tape
recorded to the nearest 0.1 centimeter. Waist circumference was measured in the
horizontal plan directly over the umbilicus. A sternum/umbilicus measurement was
also recorded as 2/3 the distance between the xyphoid process and the umbilicus in the
horizontal plane. Hip circumference was measured at the largest part of the hips above
the gluteal fold. The waist measurement will be divided by the hip measurement to
obtain the waist-to-hip ratio (WHR).
Cardiorespiratory Fitness:
In order to determine functional capacity and aerobic fitness, subjects
performed a submaximal graded exercise test on a treadmill using a modified Bruce
protocol. All exercise testing was conducted by an American College of Sports
Medicine certified Exercise Specialist. Prior to each test, the metabolic cart, mass
flow sensor, and mouthpieces were sterilized. The metabolic cart was calibrated
according to the procedures recommended by the manufacturer.
The exercise test was done according the following protocol: The treadmill
began at a speed of 3.0mph and was kept constant throughout the test. The
grade began at 0% and increased 2.5% every 3 minutes until 85% of age-predicated
max was reached, or until any ACSM test termination criteria are met. During the
46

test, subjects were breathing through a mass flow sensor with expired gas volumes and
concentrations being measured continuously using the SensorMedics V-max
Metabolic Cart. In addition, heart rate and a 12-lead EKG (GE Medical) were
monitored continuously, with measures recorded at one-minute intervals and at test
termination. Blood pressure was taken in the final minute of each 3 minute stage and
at test termination, and ratings of perceived exertion (RPE) were assessed during the
last fifteen seconds of each stage and at test termination. Test-termination was at 85%
of subjects’ age-predicted maximal heart rate unless otherwise noted (see above).
Following the test termination, subjects will undergo a 5 minute recovery
period, in which 3 minutes are active and 2 are passive in the seated position. Heart
rate, EKG, and blood pressure will continue to be monitored throughout recovery, at
minute 3 and minute 5. If heart rate and blood pressure are not at pre-exercise levels
after 5 minutes, the subject may be monitored an additional 5 minutes to insure that
they are. Results of each exercise test will be reviewed by a physician certified in
EKG interpretation to insure there are no contraindications to exercise training. Due
to the fact that the subject’s in this study are considered low-to-moderate risk, are
performing a submaximal test (vs. a maximal test), and receive physician clearance
before the test, a physician is not required to be present during the test based on the
ACSM risk stratification criteria and testing recommendations. In addition, all staff are
certified in CPR and AED use, and safety equipment is immediately available for use
in the testing room.
47

Dietary Intake:
Macronutrient composition of the diet was measured at 0, 12, and 24 weeks
using the Block Food Frequency Questionnaire (FFQ) (Block-98 Dietary Data
Systems, Berkeley, CA).117 This questionnaire has been used in past studies and has
been shown to be sensitive to change in energy intake and eating behaviors resulting
from a behavioral intervention.16 It provides data for energy intake and macronutrient
composition by asking subjects about routinely eaten food items and usual portion
sizes.
Physical Activity:
Physical activity was assessed using the Paffenbarger Physical Activity
Questionnaire90, 91 (Exercise Habits) at weeks 0, 12, and 24. This self-report
questionnaire assessed exercise and physical activity patterns among all groups. The
Exercise Habits questionnaire reports the average number of flights of stairs climbed
and the number of city blocks walked each day for each of the past seven days. These
values were converted into kilocalorie scores as defined by Paffenbarger and
colleagues. In addition, this questionnaire reported the time spent in sports,
recreational, or fitness activities over the previous week. This questionnaire has
shown to be not only easy to administer, but sensitive to change, and has a high
correlation to the 7-day Physical Activity Recall (0.88). 90, 91
Eating Behaviors:
Adoption of weight loss eating behaviors was assessed using the Eating
Behavior Inventory (EBI) at weeks 0, 12, and 24. This 26-item self-report
questionnaire assesses behaviors that have been theoretically implicated in weight
loss, such self-monitoring of food intake and of weight, refusing offers to food, eating
48

at only one place, eating in response to emotions, etc; The EBI has been shown to be
consistently sensitive to behavioral weight management interventions.86
Muscular Strength:
Upper and lower body muscular strength was determined at 0, 12, and 24
weeks using a plate-loaded universal strength-training machine (Pacific Fitness
“Zuma”) located at the University of Pittsburgh’s Physical Activity and Weight
Management Research Center. Lower body strength was assessed using the
quadriceps extension, and upper body strength was assessed using the vertical chest
press. A one repetition maximum (1-RM) protocol obtained through the American
College of Sports Medicine (ACSM) was used to determine the maximal amount of
weight (lbs.) a subject was able to lift just one time. The 1-RM test was determined to
be a reliable measure for untrained middle-aged adults (ICC > 0.99).75
The subject first performed an initial warm-up of 5-10 repetitions at 40-60% of
their perceived maximum and were asked to rate their exertion level using the OMNI
perceived exertion scale for resistance exercise.105 After a brief one minute rest period,
subjects then performed a second warm-up of 5-10 repetitions at 60-80% of their
perceived maximum. Once again, subjects were asked to rate their exertion level
using the OMNI perceived exertion scale (RPE) for resistance exercise.105 One or two
plates (15 pounds each) were added; the number chosen using a pre-determined
protocol dependent on the subject’s rating of exertion during the warm-up trial. A 1-
RM lift was attempted, and if the subject was successful, a rating of perceived exertion
was obtained and another weight plate was added. A rest period of 30 seconds to 1
minute was taken in between each trial. These procedures were repeated until a lift
49
could not successfully be completed. The final weight lifted (# of plates), and RPE
using the OMNI scale were recorded.
Physical Function:
Physical function was determined by using a modified version of the Physical
Performance Test (PPT) that has been previously used to study disability specifically
caused by obesity in women.9, 10 This physical function assessment was done at 0, 12,
and 24 weeks and included 5 standardized, timed tests that took approximately 10
minutes to administer. Prior to testing, the Borg (6-20) rating of perceived exertion
scale (RPE), the perceived difficulty scale (1-4), and the pain scale (0-10) were
introduced and explained to each subject. The following timed tests were included:
1) The time required to complete a 50 foot walk while carrying 2 shopping bags
weighing approximately 10 pounds each, 2) the time required to sit down and get out
of a chair 5 consecutive times, 3) the length of time the participant could balance on
their left leg for up to 60 seconds, 4) The length of time the participant could balance
on their right leg for up to 60 seconds, and 5). The length of time it took to step up and
down two times on a step that was approximately 20 inches high. Following the
completion of the first two tasks listed above, the participants’ rating of perceived
exertion (RPE) and rating of pain were recorded. Following the completion of the
final three tasks listed above, the participants’ rating of perceived difficulty and rating
of pain were recorded.
Correlates of Weight Loss and Behavior Change (Questionnaires):
In addition to the primary outcome measures, we are also were interested in
various psychosocial parameters associated with weight loss. Questionnaires that
assess possible psychosocial correlates of eating and physical activity behaviors, and
50

ultimately body weight, were sent home with participants for each assessment at 0, 12,
and 24 weeks of participation. It has been estimated that these questionnaires take
approximately 60-90 minutes to complete and included the following:
1). Self-Efficacy for Physical Activity and Weight Loss: Self-efficacy is a central
construct of behavior change theory, specifically Social Cognitive Theory, and has
been shown to be related to success in weight loss and physical activity. Self-efficacy
for exercise was assessed using the questionnaire by Marcus et al.,79 which has been
shown to have a high test-retest reliability of 0.90 over a 2-week time period. The five-
item scale used in this questionnaire rates the participant’ confidence regarding the
ability to be physically active in various situations (0= not at all confident to
5=extremely confident). Self-efficacy for weight loss was assessed using the 20-item
Weight Efficacy Lifestyle Questionnaire (WEL) developed by Clark et al.29 that
consists of five situational factors: Negative Emotions, Availability, Social Pressure,
Physical Discomfort, and Positive Activities.
2). Eating Inventory (EI): Eating (cognitive) restraint, eating disinhibition, and
perceived hunger were assessed with this 51-item eating inventory116 developed to
assess behaviors conducive to weight management. Cognitive dietary restraint, defined
as conscious attempts to monitor and regulate food intake, is assessed from 21 items.
Eating disinhibition, defined as dysregulation of eating in response to cognitive or
emotional cues, is assessed from 16 items. Hunger, or perceptions of hunger, is
assessed from 14 items on this questionnaire. Changes in EI scores over time in
obesity treatments have been shown to have a significant relationship with weight
loss.43
51

3). Exercise Beliefs (Barriers and Expected Outcomes): The Exercise Beliefs
Questionnaire developed and validated by Steinhardt and Dishman114 was used to
assess outcome expectations (psychologic, body image, and health) and perceived
barriers (time, effort, and obstacles) for physical activity. Participants rated their
agreement with statements related to benefits and barriers on a 5-point Likert scale
ranging from (1) strongly disagree to (5) strongly agree. Internal consistency
coefficients for this measure range from .47 to .78, with test-retest reliability stability
correlations ranging from .66 to .89.
4). Body Image: Body Image was measured using the Multidimensional Body-
Self Relations Questionnaire (MBSRQ) which provided a validated multidimensional,
attitudinal assessment of body image and weight-related variables.21 Participants rated
their agreement with statements related to three domains: physical appearance,
physical fitness, and health on a 5-point Likert scale ranging from (1) definitely
disagree to (5) definitely agree. Within each of these domains are items comprising
two subscales: 1) evaluation – extent of liking, attainment, and satisfaction and 2)
orientation – investment, attention, or degree of cognitive importance related to
maintaining or improving factors related to the domain.21
5). Mindfulness: Mindfulness was measured using the Mindfulness Attention
Awareness Scale (MAAS) which is a 15-item questionnaire measured on a 6-point
Likert scale ranging from 1 (almost always) to 6 (almost never) to assess present
moment attention and awareness by Brown and Ryan (2003).20
Statistical Analyses
Statistical analyses were conducted using SPSS for Windows (SPSS, Inc., Chicago,
IL). Statistical significance was accepted at the p<0.05 level of confidence. The data was
52

double-entered and verified by different staff members in order to compare discrepancies and
ensure accuracy. Initially, analyses were performed to examine normality and appropriate
transformations were used for data that was not normally distributed. The specific analyses
that were performed are:
1. Descriptive analyses were performed on subject characteristics (age, body
weight, BMI) energy intake, energy expenditure, physical activity, retention
rates, and specific adherence measures, such as group attendance.
2. To examine specific aims 1 through 3, change from baseline to six months in
body weight, physical activity, eating and physical activity behaviors, and
psychosocial variables were assessed using two-factor (group X time) repeated
measures analysis of variance (ANOVA) to determine if there are significant
group main effects, time main effects, or group X time interaction effects
based on the randomized group assignment for this study. The time main effect
was based on assessment data collected at 0, 3, and 6 months. The group main
effect was based on the randomized group intervention.
3. To examine specific aims 4 through 6, correlation coefficients were computed
to determine the relationship between weight loss, physical activity, and eating
and physical activity behaviors, and psychosocial variables at both baseline, 3,
and 6 months using Pearson Product Moment correlations. If the data were
skewed, Spearman Rank Order correlations were computed.
Power Analyses
The primary aim of this study was to examine if either SBWL+RT or SBWL+MM
would improve weight loss compared to SBWL. However, there is limited data in the
literature to provide an estimate of the effect of either SBWL+RT or SBWL+MM on weight
53

loss compared to SBWL. Therefore, this study served as a pilot study and will provide data
that will be useful for estimating sample sizes for these groups in a larger study should these
data demonstrate a reasonable effect. Thus, this investigation provided the initial data to
allow for variance estimates to power a larger clinical trial. Assuming that the variance
estimates from other weight loss studies are representative of what we would observe in this
study (standard deviation= 4.8 kg in a recent study conducted in our laboratory), we would
need to observe that either SBWL+MM or SBWL+RT would improve weight loss by 2.4 kg
compared to the SBWL to achieve an effect size of 0.50 in this study, by 2.9 kg to achieve an
effect size of 0.60, and 3.4 kg to achieve an effect size of 0.70. This study randomized
approximately 25 subjects per group, which would provide sufficient sample to detect an
effect size of 0.65 with a type I error rate of 0.05 at 70% power. This is a reasonable sample
size to obtain variance estimates on the effectiveness of these interventions (SBWL+MM and
SBWL+RT) compared to SBWL that can be use determine appropriate sample sizes for a
future full-scale clinical study of these intervention strategies.
54

RESULTS
The purpose of this study was to examine the effect of the addition of a mindfulness
meditation and home-based resistance exercise component on psychosocial parameters, eating
and physical activity behaviors, and weight loss in overweight and obese adults across a 6-
month standard behavioral weight loss intervention. The study was a pretest-midtest-posttest
design with assessments performed at 0, 3, and 6 months of participation. The results from
this study are presented in the following sections.
Subject Characteristics
The subjects in the current investigation were seventy-one (71) sedentary, overweight
and obese adult men (N=8) and women (N=63) who participated in a behavioral weight loss
study at the University of Pittsburgh Physical Activity and Weight Management Research
Center. All of the participants were between 18 to 55 years of age, with a BMI ranging from
25 to 39.9 kg/m2 at the start of the study, with a mean age of 45.1+8.3 years, mean BMI of
32.9+3.7kg/m2, and a mean body weight of 93.0+12.0 kg. Descriptive statistics (mean +
standard deviation) for all subjects in this study are shown in Table 7. A one-way analysis of
variance (ANOVA) revealed no significant baseline differences between randomized groups
for all variables (age, weight, body mass index, lean body mass, gender, ethnicity, energy
intake, percent dietary fat, percent dietary carbohydrate, percent dietary protein, and physical
activity). Data by group are shown in Table 8.
55

Table 7. Baseline Characteristics of Subjects (Total, Completers, and Non-Completers)
Characteristics
Total Completers Non-Completers (N=71) (N=51) (N=20) (mean + s.d.) (mean + s.d.) (mean + s.d.)
Age (years) Weight (kg) Body Mass Index (kg/m2) Lean Body Mass (kg) Gender % Males % Females Ethnicity % African-American % Caucasian % Other Energy Intake (kcal/day) Percent Dietary Fat Intake (%) Percent Carbohydrate Intake (%) Percent Protein Intake (%) Physical Activity (kcal/wk)
45.1 + 8.3 93.0 + 12.9 32.9 + 3.7 54.6 + 6.8 11.3% (N=8) 88.7% (N=63) 25.4% (N=18) 73.2% (N=52) 1.4% (N=1) 2118.9 + 976.3 40.5 + 6.8 45.2 + 7.1 15.1 + 2.9 776.0 + 648.6
45.0 + 8.7 92.7 + 13.0 32.7 + 3.8 54.6 + 6.6 11.8% (N=6) 88.2% (N=45) 23.5% (N=12) 76.5% (N=39) ------- 2158.4 + 977.7 40.1 + 6.4 45.4 + 6.7 15.4 + 2.6 802.2 + 670.9
45.5 + 7.4 93.9 + 12.9 33.3 + 3.3 54.8 + 7.3 10% (N=2) 90% (N=18) 30% (N=6) 65% (N=13) 5% (N=1) 2018.1 + 990.5 41.5 + 7.9 44.8 + 8.1 14.4 + 3.4 709.2 + 598.9
s.d. = standard deviation
Note: No statistically significant difference between baseline characteristics of completers and non-completers.
Retention Rates
Seventy-one subjects were randomized to one of three intervention groups. Retention
of participants who provided assessments at both baseline and at 6 months (N=51) was 72%
and these individuals are referred to as “completers”. Participants who failed to complete the
6-month assessment (N=20, 28%) are referred to as “non-completers.” A one-way ANOVA
revealed no significant differences between completers and non-completers across
intervention groups (see Table 8). Figure 3 illustrates the study enrollment and retention
across the three intervention groups, and the explanation for dropout. Reasons for withdrawal
included work schedule changes, personal/family problems, dissatisfaction with the program,
and health limitations. The retention rates for the three individual groups were 66% for the
56

SBWL group, 65% for the SBWP + RT group, and 83% for the SBWL + MD group, and chi
square analyses revealed these were not significantly different (p=.43). Baseline
characteristics of completers versus non-completers across the three intervention groups
(SBWL, SBWL + RT, and SBWL + MD) are presented in Table 8.
Figure 5. Study Enrollment and Retention
24 Assigned to Standard Behavioral Weight Loss Group
(SBWP)
22 Completed 3M Assessment 2 Unknown
71 Underwent Randomization
100 Invited to Orientation
29 Did not Attend, declined participation, or ineligible
23 Assigned to SBWP + Resistance Training Group
(SBWP + RT)
16 Completed 6M Assessment 1 Withdrawal 4 Unknown 1 Surgery
24 Assigned to SBWP + Mindfulness Meditation Group
(SBWP + MD)
16 Completed 3M Assessment 2 Withdrawals 1 Relocation 4 Unknown
20 Completed 3M Assessment 2 Withdrawals 1 Relocation 1 Unknown
15 Completed 6M Assessment 1 Unknown
20 Completed 6M Assessment 1 Withdrawal
Adherence Measures
Attendance and diary completion percentages were calculated as the total number of
sessions attended or diaries completed divided by the total number of possible group sessions
or diaries over the 6-month period. Attendance at the weekly group sessions was
63.7+30.2%. Comparison of the three groups reveal no significant differences in attendance to
the intervention sessions (p=.34), with group attendance at 62.3+26.7% (13.7+5.9 sessions)
57

for the SBWL group, 57.9+36.3% (12.7+ 8.0 sessions) for the SBWL + RT group, and
70.1+27.7% (16.8+6.6 sessions) for the SBWL + MD group. Percentage of food diaries
turned in was 52.4+31.7%. Comparison of the three groups reveal no significant differences
in percentage of food diaries turned in (p=.47), with 51.6+29.9% for the SBWL group,
47.1+36.7% for the SBWL + RT group, and 58.5+28.5% for the SBWL + MD group. In
addition, the SBWL + RT group was to attend an additional 15-30 minute resistance training
group session each week, with a possible total of 21 sessions over the 6-month intervention.
Attendance for these resistance training sessions was 49.1+35.7% (10.3+7.5 sessions).
SBWL + RT was also prescribed an additional 4 days per week of resistance training at home,
and examination of self-reported dairy information revealed that subjects reported
participating in 40.3+33.9% of prescribed days of resistance training exercise. The SBWL +
MD group was to attend an additional 15-30 minute mindfulness meditation training group
session each week, with a possible total of 23 sessions over the 6-month intervention.
Attendance for these mindfulness sessions was 62.3+31.4% (14.3+7.2 sessions). The SBWL
+ MD group was also prescribed home-based mindfulness meditation practice, and
examination of self-reported mindfulness recall information revealed that subjects reported
participating in approximately 5.29+2.9 practices per week. .
58

Table 8. Baseline Characteristics of Completers, and Non-Completers Across the Intervention Groups
Characteristics
SBWL SBWL + RT SBWL + MD Completers vs. Non-Completers Completers vs. Non-Completers Completers vs. Non-Completers (mean + standard deviation) (mean + standard deviation) (mean + standard deviation)
Age (years) Weight (kg) Body Mass Index (kg/m2) Lean Body Mass (kg) Gender % Males % Females Energy Intake (kcal/day) Percent Dietary Fat Intake (%) Percent Carbohydrate Intake (%) Percent Protein Intake (%) Physical Activity (kcal/wk)
(N=16) 43.4+9.8 92.9+11.0 32.8+3.5 55.2+7.1 18.8% (N=3) 81.3% (N=13) 2231.1+1170.6 40.7+6.0 44.5+4.6 15.7+2.7 702.4+620.1
(N=8) 47.6+7.1 93.7+14.2 33.5+3.6 54.5+8.4 12.5% (N=1) 87.5% (N=7) 2303.2+952.3 45.4+7.9 40.8+9.6 14.5+4.5 607.8+608.9
(N=15) 46.2+9.1 98.2+13.8 34.4+3.5 56.1+7.4 13.3% (N=2) 86.7% (N=13) 1909.6+959.5 40.1+7.1 45.3+6.9 15.8+2.4 957.7+652.1
(N=8) 42.4+8.4 90.5+12.3 32.3+3.8 53.2+4.6 0% (N=0) 100% (N=8) 1616.9+836.5 37.9+6.9 47.9+6.9
Change in Body Weight, BMI, and Body Composition
A two-factor repeated measures (group X time) ANOVA was performed to compare
changes in body weight, body mass index, and body composition between the three groups
(see Table 9). Results revealed a significant decrease in body weight from 0 to 6 months for
the completers in the SBWL group (-6.1+2.4 kg), the SBWL + RT group (-8.8+1.9 kg), and
the SBWL + MD group (-8.0+0.2 kg) (p<.001), with no significant difference between the
groups (p=.41). Likewise, body mass index (BMI) significantly decreased over time for all
three groups (p<.001), with no significant difference between groups (p=.47). Changes in
body composition were examined by both lean body mass (LBM) and body fat percent (%).
14.4+2.3 783.7+613.1
(N=20) 45.5+7.7
88.4+12.8
31.5+3.9
52.9+5.5
5% (N=1) 95% (N=19)
2286.8+827.5
39.7+6.5
46.1+8.1
14.8+2.8
765.6+734.0
(N=4) 47.5+4.2 101.0+11.7 34.9+.76 58.5+10.0 25% (N=1) 75% (N=3) 2250.2+1321.9 40.9+7.7 46.4+4.5 14.3+3.7 763.0+695.4
s.d. = standard deviation Note: No statistically significant difference between baseline characteristics of completers and non-completers across the intervention groups
59

Table 9. Differences in Main Outcome Measures for Completers Across the 6-month Behavioral Intervention by Group
Results revealed that all three groups showed similar changes in both lean body mass
and body fat % with weight loss. Lean body mass (p<.001) and body fat % (p<.001)
significantly decreased from 0 to 6 months for all three groups, with no significant difference
between groups for either measure (p=.56 and p=.39, respectively). Data for all main outcome
Assessments p-Values
Week Week Week
Outcome Measure
Intervention Group 0 12 24
Group Time Group X
Effect Effect Time Interaction
Body Weight (kg) Body Mass Index (kg/m2) Lean Body Mass (kg) Body Fat (%) Physical Activity (kcal/wk) Energy Intake (kcal/day) Percent Fat Intake (%) Percent Carbohydrate Intake (%) Percent Protein Intake (%) Eating Behavior Inventory
SBWL (n=16) SBWL + RT (n=14) SBWL + MD (n=19) SBWL (n=16) SBWL + RT (n=14) SBWL + MD (n=19) SBWL (n=14) SBWL + RT (n=14) SBWL + MD (n=18) SBWL (n=14) SBWL + RT (n=14) SBWL + MD (n=18) SBWL (n=16) SBWL + RT (n=14) SBWL + MD (n=19) SBWL (n=13) SBWL + RT (n=12) SBWL + MD (n=19) SBWL (n=13) SBWL + RT (n=12) SBWL + MD (n=19) SBWL (n=13) SBWL + RT (n=12) SBWL + MD (n=19) SBWL (n=13) SBWL + RT (n=12) SBWL + MD (n=19) SBWL (n=16) SBWL + RT (n=13) SBWL + MD (n=18)
92.9+10.9 99.0+13.8 88.3+13.1 32.8+3.5 34.6+3.5 31.5+4.0 53.7+5.9 56.5+7.5 53.3+5.6 40.7+6.4 42.5+6.9 39.9+4.6 702+620 930+667 767+754 1956.1+910 1664.1+732 2357.1+786 39.8+6.3 40.4+7.9 40.5+5.8 45.1+4.7 44.8+7.7 45.2+7.1 15.8+2.9 16.1+2.6 14.9+2.8 68.0+8.9 70.4+10.1 67.8+7.3
87.9+11.9 92.3+14.4 82.5+12.5 30.9+3.6 32.2+4.1 29.4+4.0 53.2+6.3 55.6+7.6 52.2+5.7 37.9+6.6 39.0+8.6 37.0+5.6 1612+962 1897+741 1822+885 1329.1+471 1298.0+464 1356.6+490 32.3+5.1 30.5+8.2 30.7+4.4 53.0+3.9 53.1+6.9 50.4+6.3 16.1+2.2 17.7+2.5 18.6+3.0 79.0+9.9 85.5+12.7 86.6+7.9
86.8+13.3 90.3+15.7 80.3+12.9 30.6+4.0 31.5+4.4 29.4+3.9 52.7+6.4 55.3+7.5 51.9+5.7 37.5+6.1 37.8+9.2 35.1+6.4 1169+1361 2029+1173 1700+825 1171.6+488 1362.6+690 1346.3+399 34.1+8.0 30.5+6.9 31.1+4.4 51.1+7.5 53.9+5.8 51.4+6.9 15.5+2.3 17.5+2.9 17.0+3.0 80.9+12.4 88.2+12.4 88.3+7.9
.091 .097 .328 .582 .227 .389 .671 .697 .305 .146
<.001 <.001 <.001 <.001 <.001 <.001 <.001 <.001 <.001 <.001
.411 .474 .562 .388 .373 .013 .543 .515 .011 .120
60

measures were also analyzed with an intent-to-treat (ITT) analysis, whereby the baseline data
is carried forward for missing post-evaluation data at 3- and 6 months. Results from these
analyses can be seen in Appendix A and reveal no differences in the pattern of results shown
in Table 9 for completers for body weight, BMI, or body composition.
Process Measures
Physical Activity
Physical activity energy expenditure (kcal/wk) increased significantly from baseline to
6 months (p<.001) for the SBWL group (mean difference = 467+741 kcal/wk), SBWL + RT
group (mean difference =1099+506 kcal/wk), and SBWL + MD group (mean difference =
933+71 kcal/wk), with no significant difference between the groups (p=.37) (see Table 9).
However, the intent-to-treat analysis revealed a different result in that a significant group x
time interaction (p=.02) was found for physical activity energy expenditure (see Appendix A).
This analysis revealed that physical activity energy expenditure increased for all three
treatment groups (SBWL, SBWL +RT, SBWL+MD) from 0 to 3 months, but then decreased
from 3- to 6 months for both the SBWL (1913+982 to 982+1181 kcal/wk, respectively) and
the SBWL +MD (1712+930 to 1507+862 kcal/wk, respectively) groups only. However, the
SBWL +RT group continued to increase from 3- to 6 months (1516+831 to 1566+1138
kcal/wk, respectively). Thus, the pattern of physical activity energy expenditure over the
course of the intervention was different between the groups. Despite the decrease in physical
activity from 3- to 6 months in these groups, physical activity energy expenditure still
remained significantly higher than baseline as revealed by the significant time main effect
(p<.001).
61

Energy Intake
Results from a repeated measures two-way (group X time) ANOVA revealed a
significant decrease in energy intake from 0 to 6 months for the completers in the SBWL
group (-784+422 kcal/day), the SBWL + RT group (-302+42 kcal/day), and the SBWL + MD
group (-1011+387 kcal/day) (p<.001), with a significant group x time interaction (p=.01).
This interaction reveals that the pattern in energy intake in the three intervention groups
differed over time, in that all three groups decreased energy intake from baseline to 3 months,
but from 3 months to 6 months the SBWL+RT group increased slightly (1298+464 to
1362+690, respectively) while the SBWL (1329+471 to 1172+488, respectively) and SBWL
+ MD (1357+490 to 1346+399, respectively) groups continued to decrease (see Figure 6).
Percentage of fat significantly decreased from baseline to 6 months (p<.001) in the SBWL
group (39.8+6.3% vs. 34.1+8.0%), the SBWL + RT group (40.4+7.9% vs.30.5+6.9%), and
the SBWL+MD group (40.5+5.8% vs. 31.1+4.4%). Percentage of carbohydrate significantly
increased from baseline to 6 months (p<.001) in the SBWL group (45.1+4.7% vs.
51.1+7.5%), the SBWL + RT group (44.8+7.7% vs.53.9+5.8%), and the SBWL+MD group
(45.2+7.1% vs. 51.4+6.9%). A non-significant group x time interaction showed the pattern of
percentage of fat (p=.54) and percentage of carbohydrate intake (p=.52) over time for the
groups was similar. There was a significant group x time interaction for the percentage of
protein (p=.01) consumed over the course of the intervention. (see Table 9). Figure 6
illustrates the pattern in energy intake for the three intervention groups, as well as the
composition of the dietary intake (percentage of fat, percentage of carbohydrate, and
percentage of protein) from baseline to 6 months. The intent-to-treat analysis revealed similar
results for all aspects of energy intake.
62

Figure 6. Energy Intake (kcal/day) and Diet Composition (%) from Baseline to 6 months for the Three Intervention Groups
Energy Intake (kcal/day)
0
500
1000
1500
2000
2500
0 Months 3 Months 6 Months
Kcal
s
SBWL
SBWL+RT
SBWL+MD
Group Effect (p=.39), Time effect (p<.001), Group X Time interaction (p=.01)
Group Effect (p=.70), Time effect (p<.001) Group Effect (p=.67), Time effect (p<.001)
Carbohydrate Intake
40
45
50
55
0 Months 3 Months 6 Months
%
Fat Intake
25
30
35
40
45
0 Months 3 Months 6 Months
%
Group X Time interaction (p=.52) Group X Time interaction (p=.54)
Protein Intake
10
15
20
0 Months 3 Months 6 Months
%
Group Effect (p=.31), Time effect (p<.001) Group X Time interaction (p=.01)
63

Eating Behavior Inventory
Adoption of weight loss eating behaviors was assessed using the Eating Behavior
Inventory (EBI), where higher scores indicate greater adoption of weight loss eating
behaviors. Results revealed a significant time main effect (P<.001), with EBI scores
increasing from baseline to 6 months (see Table 9), with no significant differences
between the groups (p=.12). The intent-to-treat analysis revealed similar results, with a
greater trend (p=.08) toward the SBWL + MD group having higher EBI scores when
compared to the SBWL group.
Change in Muscular Strength
Muscular strength was measured using the leg extension and chest press exercises.
Results from a two-way repeated measures ANOVA show that there were no significant
changes in strength over time for the leg extension (p=.33), nor were there any differences
between the groups (p=.32). Chest strength did significantly improve over time (p<.05), but
there were no significant differences between the groups (p=.25). See Table 10.
Change in Mindfulness
Mindfulness was assessed using the Mindfulness Attention Awareness Scale (MAAS).
Results from a two-way repeated measures ANOVA revealed that mindfulness did
significantly improve over time (p<.001), but did not differ between the groups (p=.49). See
Table 10.
64

Table 10. Differences in Absolute & Relative Muscular Strength (Leg and Chest) and in a Measure of Mindfulness for Completers Across the 6-Month Behavioral Intervention by Group
Assessments p-Values
Week Week Week 0 12 24
Group Time Group X
Variable Intervention Group Effect Effect Time Interaction
Absolute Muscular Strength Chest Press (kg) Leg Extension (kg) Relative Muscular Strength (kg/kg body weight) Chest Press (kg) Leg Extension (kg)
SBWL (n=11) SBWL + RT (n=12) SBWL + MD (n=16) SBWL (n=10) SBWL + RT (n=11) SBWL + MD (n=17) SBWL (n=11) SBWL + RT (n=12) SBWL + MD (n=16) SBWL (n=10) SBWL + RT (n=11) SBWL + MD (n=17)
29.5+13.0 33.2+12.4 26.0+6.8 31.1+6.5 36.3+12.6 29.4+5.0 .32+6.5 .33+12.6 .30+5.0 .35+.08 .35+.11 .33+.06
29.3+13.9 31.0+12.2 24.3+6.5 31.9+8.9 35.2+11.9 30.4+5.1 .34+.17 .33+.13 .30+.10 .37+.11 .37+.11 .37+.07
30.9+14.1 33.1+11.2 27.0+7.2 31.0+8.4 35.6+12.1 34.2+6.9 .36+.16 .36+.12 .34+.07 .36+.11 .38+1.0 .43+.10
.248
.323 .729 .905
.002 .337 <.001 <.001
.675 .075 .667 .005
Mindfulness Scale MAAS
SBWL (n=14) SBWL + RT (n=13) SBWL + MD (n=19)
59.6+10.7 58.9+13.9 58.5+11.2
63.9+11.4 65.7+12.6 60.1+11.7
64.5+11.2 68.3+15.1 60.8+10.4
.486
<.001
.332
65
Psychosocial Variables
Two-factor repeated measures (group X time) ANOVAs were performed to compare
changes in psychosocial variables (physical activity and eating self-efficacy, body image,
eating inventory, and expected benefits and barriers) between the three intervention groups
(see Tables 11-14).
Physical Activity Self-Efficacy and Eating Self-Efficacy
Data from these questionnaires were divided into subscales representing self-efficacy
for physical activity or eating in various situations. Analyses revealed no difference in the
pattern of change in these variables between intervention groups across the 6-month period, as
well as no significant group differences. Self-efficacy for physical activity when tired
significantly improved from baseline to 6 months (p<.05 for time main effect). A significant
time main effect (P<.05) was also found for self-efficacy for physical activity when on
vacation, where all three groups increased from baseline to 3 months, and then decreased
from the 3-month to the 6-month time period. There was no significant interaction effect
(p=.85). Eating self-efficacy when experiencing negative emotions, when food is available,
when under social pressure, and during positive activities all significantly improved from
baseline to 6 months (p<.001 for time main effect) (See Table 11.)
66

Table 11. Differences in Self-Efficacy (Physical Activity and Eating) for Completers Across the 6-Month Behavioral Intervention by Group
Assessments p-Values
Psychosocial Variable
Intervention Group
Week Week Week 0 12 24
Group Time Group X Effect Effect Time Interaction
Physical Activity Self-Efficacy Tired Bad Mood Low on Time On Vacation Bad Weather Eating Self-Efficacy Negative Emotions Availability Social Pressure
Eating Inventory
Data from the 51-item Eating Inventory (EI) questionnaire were divided into three
subscales of eating behavior: dietary restraint, dietary disinhibition, and perceived hunger.
Dietary restraint significantly increased from baseline to 6 months (p<.001) for all three
Physical Discomfort Positive Activities
SBWL (n=13) SBWL + RT (n=13) SBWL + MD (n=18) SBWL (n=13) SBWL + RT (n=13) SBWP + MD (n=18) SBWL (n=13) SBWL + RT (n=13) SBWL + MD (n=18) SBWL (n=13) SBWL + RT (n=13) SBWL + MD (n=18) SBWL (n =13) SBWL + RT (n=13) SBWL + MD (n=13) SBWL (n=13) SBWL + RT (n=13) SBWL + MD (n=19) SBWL (n=13) SBWL + RT (n=13) SBWL + MD (n=19) SBWL (n=13) SBWL + RT (n=13) SBWL + MD (n=19) SBWL (n=13) SBWL + RT (n=13) SBWL + MD (n=19) SBWL (n=13) SBWL + RT (n=13) SBWL + MD (n=19)
2.54+.88 2.31+1.0 2.56+1.1 3.46+1.4 3.08+1.2 3.50+1.1 2.69+1.0 2.69+.86 2.44+1.0 3.38+1.3 3.31+.95 3.39+1.1 3.23+1.2 2.77+1.2 3.17+1.4 20.4+10.5 16.8+11.8 17.6+10.3 17.1+8.5 15.2+10.7 15.2+9.4 21.1+6.9 19.0+10.4 20.0+10.5 26.7+7.5 24.5+8.8 25.6+9.3 23.8+6.9 22.9+9.7 24.8+9.3
2.92+.86 2.92+1.3 2.72+1.1 3.15+1.2 3.54+1.1 3.50+.71 2.77+1.0 2.85+1.1 2.56+.98 3.62+1.2 3.85+1.1 3.78+.73 3.38+.77 3.31+1.4 3.00+1.2 23.2+10.7 22.7+9.4 23.1+7.9 20.9+8.9 23.6+7.9 19.9+7.2 25.1+9.6 27.2+7.4 23.3+8.1 28.2+9.0 26.3+8.2 28.5+5.5 27.7+6.7 28.5+5.5 28.4+5.8
2.62+1.2 3.00+1.2 2.94+1.1 3.00+1.3 3.38+1.3 3.56+.86 2.69+1.3 2.62+1.3 2.78+1.1 3.23+1.4 3.31+1.4 3.56+.92 3.31+1.0 3.08+1.4 3.17+1.3 22.5+11.3 23.1+9.8 25.7+6.1 20.0+9.3 21.8+8.9 21.0+7.8 24.7+9.7 25.9+7.8 25.0+6.7 26.8+9.6 27.8+8.4 29.2+4.4 26.5+7.0 27.6+7.1 29.2+4.3
.10 .66 .88 .89 .81 .911 .869 .893 .806 .733
.021 .855 .813 .023 .546 <.001 <.001 <.001 .073 <.001
.433 .234 .832 .852 .513 .281 .392 .402 .649 .879
67

groups. Dietary disinhibition and perceived hunger significantly decreased from baseline to 6
months (p<.001) for all three groups. Examination of these three constructs revealed no
differences in the pattern of change in these variables between intervention groups across the
6-month period, as well as no significant group differences. (See Table 12.)
Table 12. Differences in Dietary Restraint, Dietary Disinhibition, and Perceived Hunger for Completers Across the 6-Month Behavioral Intervention by Group
Body Image
Data from the 69-item MBSRQ were divided into three domains of body image and
weight-related variables: physical appearance, physical fitness, and health. They were then
further divided in subscales of evaluation and orientation. Additional special multi-item
subscales of Body-Areas Satisfaction Scale, Overweight Preoccupation Scale, and Self-
Classified Weight Scale were also analyzed. Results from all subscales are presented in Table
13 and reveal no significant group differences. There were significant (time effect)
improvements in most of the subscales of body image including appearance evaluation
Assessments p-Values
Psychosocial Variable
Intervention Group
Week Week Week 0 12 24
Group Time Group X Effect Effect Time Interaction
Eating Inventory Eating Cogntive Restraint Eating Disinhibition Perceived Hunger
SBWL (n=14) SBWL + RT (n=13) SBWL + MD (n=19) SBWL (n=14) SBWL + RT (n=13) SBWL + MD (n=19) SBWL (n=14) SBWL + RT (n=13) SBWL + MD (n=19)
10.6+4.3 8.8+4.6 9.8+3.6 11.0+3.6 8.4+2.8 9.9+4.3 7.6+3.6 5.9+3.3 7.6+3.0
16.1+3.2 15.5+4.8 17.2+2.1 9.1+4.4 6.3+3.8 7.8+3.5 6.4+4.6 4.3+3.5 5.1+2.5
15.9+4.5 16.2+3.9 17.9+1.8 8.6+4.4 5.6+2.9 6.7+3.1 5.7+3.6 3.9+3.1 3.8+2.2
.344 .102 .204
<.001 <.001 <.001
.360 .951 .422
68

(p<.001), fitness orientation (p<.001), health evaluation (p<.001), health orientation (p<.001),
illness orientation (p<.05), body-areas satisfaction (p<.001), and overweight preoccupation
(p<.001). A significant interaction effect was seen only with the health evaluation subscale
(p=.03). There was also a significant decrease in self-classified weight over time (p<.001).
The only two subscales of body image which did not show a significant effect was appearance
orientation (p=.12) and fitness evaluation (p=.37).
Exercise Beliefs (Outcome Expectations and Barriers)
Data from the exercise beliefs questionnaire were divided into an overall outcome
expectations (benefits) score, with subscales of psychological, body image, and health
benefits, and overall perceived barriers score, with subscales of time, effort, and obstacle
barriers (see Table 14). Analyses revealed a significant decrease in the expected barriers for
physical activity (p<.05 for time main effect) in all groups across the 6-month intervention
period, with no significant difference between the groups in overall (p=.91), time (p=.86),
effort (p=.77), or obstacle (p=.53) barriers. There was a significant group x time interaction
effect for the time barrier (p=.04).
Analyses of the overall outcome expectations (benefits) revealed a significant group x
time effect (p=.04), with post-hoc analyses revealing that the outcome expectations increased
for both the SBWL + MD and SBWL + RT groups, and were significantly greater than the
SBWL group. Two of the benefits subscales, psychological (P=.03) and body image (p=.02),
also reveal significant group differences. Post-hoc analyses of the body image scale show that
there were significant group difference between the SBWL group and the SBWL+MD
groups, in that the SBWL + MD group has much higher expectations that body image will
improve with exercise when compared to the standard group. (See Table 14.)
69

Table 13. Differences in Body Image for Completers Across the 6-Month Behavioral Intervention by Group
Assessments p-Values
Psychosocial Variable
Intervention Group
Week Week Week 0 12 24
Group Time Group X Effect Effect Time Interaction
Body Image
Appearance Evaluation Appearance Orientation Fitness Evaluation Fitness Orientation Health Evaluation Health Orientation Illness Orientation Body-Areas Satisfaction Self- Classified Weight Overweight Preoccupation
SBWL (n=14) SBWL + RT (n=13) SBWL + MD (n=19) SBWL (n=14) SBWL + RT (n=13) SBWL + MD (n=19) SBWL (n=14) SBWL + RT (n=13) SBWL + MD (n=19) SBWL (n=14) SBWL + RT (n=13) SBWL + MD (n=19) SBWL (n =14) SBWL + RT (n=13) SBWL + MD (n=19) SBWL (n =14) SBWL + RT (n=13) SBWL + MD (n=19) SBWL (n =14) SBWL + RT (n=13) SBWL + MD (n=19) SBWL (n =14) SBWL + RT (n=13) SBWL + MD (n=19) SBWL (n =24) SBWL + RT (n=23) SBWL + MD (n=24) SBWL (n =14) SBWL + RT (n=13) SBWL + MD (n=19)
2.13+.82 2.27+.80 2.38+.68 3.30+.69 3.32+.63 3.47+.45 3.45+1.1 3.54+.79 3.33+.63 3.03+.63 3.09+.48 2.99+.44 3.30+.57 3.56+.58 3.46+.47 3.33+.58 3.13+.54 3.14+.62 3.07+.93 3.06+.67 2.94+.68 2.45+.69 2.63+.72 2.69+.48 4.44+.50 4.13+.81 4.25+.44 3.25+.90 2.42+.76 3.10+.70
2.58+1.0 2.68+.92 2.93+.80 3.33+.77 3.37+.64 3.51+.47 3.55+.94 3.79+.93 3.33+.98 3.37+.73 3.47+.57 3.41+.53 3.74+.48 3.65+.58 4.03+.51 3.69+.66 3.80+.51 3.70+.52 3.27+.80 3.32+.75 3.15+.74 2.72+.87 2.82+.92 3.03+.57 3.92+1.6 2.97+2.1 3.31+1.6 3.68+.88 3.37+1.1 3.50+.74
2.97+1.2 3.02+1.0 3.20+.61 3.46+.90 3.46+.68 3.55+.44 3.55+1.0 3.61+1.0 3.39+.66 3.30+.79 3.72+.62 3.47+.56 3.68+.78 4.00+.67 3.88+.46 3.72+.55 3.88+.63 3.77+.44 3.36+.60 3.22+.82 3.21+.63 2.88+.94 3.08+.81 3.20+.60 2.46+2.0 2.17+2.0 2.93+1.6 3.86+.88 3.33+.95 3.59+.68
.606 .741 .573 .630 .448 .926 .836 .484 .234
<.001
.147
.122 .368 <.001 <.001 <.001 .004 <.001 <.001 <.001
.911 .972 .728 .274 .027 .381 .874 .917 .308 .230
70

Table 14. Differences in Outcome Expectations (Benefits) and Perceieved Barriers for Physical Activity for Completers Across the 6-Month Behavioral Intervention by Group
Assessments p-Values
Psychosocial Variable
Intervention Group
Week Week Week 0 12 24
Group Time Group X Effect Effect Time Interaction
Exercise Beliefs Outcome Expectations
Correlates of Body Weight Change
Bivariate associations between the process measures of weight loss (physical activity,
energy intake, and eating behaviors) and actual body weight change at 3 months and 6 months
were examined and results are presented in Table 15. Body weight change was calculated as
the 3-month and 6-month body weight minus the baseline body weight, and therefore a
negative number for body weight change indicates weight loss.
Physical Activity and Body Weight Change. A significant relationship (p<.05) between
both baseline measures of physical activity (r = -.27) and 3-month measures of physical
(Benefits) Psychological Body Image Health Perceived Barriers Time Effort Obstacles
SBWL (n=14) SBWL + RT (n=13) SBWL + MD (n=19) SBWL (n=14) SBWL + RT (n=13) SBWL + MD (n=19) SBWL (n=14) SBWL + RT (n=13) SBWL + MD (n=19) SBWL (n=14) SBWL + RT (n=13) SBWL + MD (n=19) SBWL (n=14) SBWL + RT (n=13) SBWL + MD (n=19) SBWL (n=14) SBWL + RT (n=13) SBWL + MD (n=19) SBWL (n =14) SBWL + RT (n=13) SBWL + MD (n=19) SBWL (n =14) SBWL + RT (n=13) SBWL + MD (n=19)
4.0+.81 4.3+.57 4.4+.43 3.2+1.3 3.9+.75 3.7+.84 4.5+.66 4.5+.59 4.9+.19 4.6+.58 4.6+.48 4.8+.41 2.9+.58 2.9+.61 2.9+.63 3.1+1.0 3.2+.79 3.2+.99 3.2+1.0 3.0+.91 3.2+.84 2.2+.56 2.4+.73 2.2+.66
4.2+.60 4.4+.57 4.4+.39 3.6+1.1 4.2+.86 3.7+.84 4.6+.49 4.6+.70 4.8+.31 4.6+.57 4.7+.74 4.8+.37 2.3+.79 2.6+.95 2.8+.72 2.6+1.1 3.2+1.3 3.5+.96 2.5+1.3 2.5+1.3 2.9+.86 1.8+.63 2.2+.87 2.0+.89
3.9+.68 4.7+.38 4.6+.38 3.4+1.1 4.4+.71 4.1+.67 4.2+.94 4.8+.34 4.9+.26 4.6+.62 4.9+.28 4.9+.25 2.8+.84 2.7+.69 2.6+.64 3.8+1.1 3.6+1.1 3.2+1.1 2.7+1.1 2.6+.71 2.6+.71 2.2+1.1 2.2+.71 2.1+.72
.031 .034 .019 .157 .911 .860 .774 .530
.071 .032 .654 .489 .013
.035 .513 .013 .624 .120
.059 <.001 .166
.035 .385 .793
71

activity (r= -.28) and 3-month weight change were found. Similarly, weight change at 6
months was significantly correlated (p<.01) with 3-month (r= -.37) and 6-month physical
activity (r= -.37) measures.
Energy Intake and Body Weight Change. The change in energy intake from baseline to 3-
months (r= .28) showed a significant relationship (p<.05) to the 3-month weight change. No
significant relationships were seen between 6-month energy intake and 6-month weight
change.
Eating Behaviors and Body Weight Change. Weight loss eating behaviors measured by the
Eating Behavior Inventory at 3 months (r= -.34) and the change in eating behaviors from
baseline to 3 months (r= -.45) were both significantly correlated with 3-month weight change
(p<.05). In addition, weight loss eating behaviors at both 3 months (r= -.29), 6 months (r= -
.41), and the change scores from baseline to 3 months (r= -.30) and baseline to 6 months (r= -
.39) were significantly correlated (p<.05) with weight loss at the 6-month time period.
Table 15.Correlations Between 3-and 6-Month Weight Change and Process Measures
Correlation
Process Measures
3-Month 6-Month
Weight Change Weight Change Physical Activity (kcal) Baseline 3-Month 6-Month Change (0-3 months) Change (0-6 months) Energy Intake (kcal/day) Baseline 3-Month 6-Month Change (0-3 months) Change (0-6 months) Eating Behavior Inventory Baseline 3-Month 6-Month Change (0-3 months) Change (0-6 months)
-.273* -.271 -.284* -.365** ----- -.369** -.105 -.146 ----- -.230 -.168 -.084 .021 .018 ----- .053 .279* .148 ----- .167 .086 -.035 -.336* -.288* ----- -.413** -.449** -.303* ----- -.392**
*p< 0.05, **p<0.01
72

Psychosocial Correlates of Body Weight Change
Physical Activity and Eating Self-Efficacy. Correlations between 3-month and 6-
month weight change and physical activity and eating self-efficacy are presented in Table 16.
Body weight change was calculated as the 3-month and 6-month body weight minus the
baseline body weight, and therefore a negative number for body weight change indicates
weight loss.
At the 3-month time period, self-efficacy for physical activity when tired (r = -.36), in
a bad mood (r= -.31), low on time (r= -.30), and on vacation (r= -.37) were significantly
correlated with 3-month weight change. Eating self-efficacy did not correlate with 3-month
weight change. At the 6-month time period, self-efficacy for physical activity when tired (r=
-.35) and in a bad mood (r= -.30) with both significantly correlated (p<.05) with 6-month
weight change. However, unlike 3 months, all subscales of eating self-efficacy at 6 months,
(negative emotions (r= -.36), availability (r= -.45), social pressure (r= -.35), physical
discomfort (r= -.34), and positive activities (r= -.50)) were significantly correlated (p<.05)
with 6-month weight change.
Body Image. Correlations between 3-month and 6-month weight change and body
image are presented in Table 17. The two subscales of body image which did not
significantly improve during the intervention (appearance orientation and fitness evaluation),
also did not significantly correlate with change in body weight at either 3 months or 6 months.
Analyses revealed that it was the change in body image subscales from 0 to 3 months
(appearance evaluation (r = -.29), fitness orientation (r= -.34), health orientation (r= -.41),
body areas satisfaction (r= -.31), and overweight preoccupation (r= -.35)) that significantly
correlated (p<.05) with the 3-month weight change This same pattern was observed at 6
73

months, in which it was the change in the body image subscales from 0 to 6 months
(appearance evaluation (r = -.41), fitness orientation (r= -.58), health orientation (r= -.47),
body areas satisfaction (r= -.44), and overweight preoccupation (r= -.47)) that significantly
correlated (P<.01) with 6-month weight change.
Outcome Expectations and Perceived Barriers. Correlations between 3-month and
6-month weight change and outcome expectations (benefits) and perceived barriers for
physical activity are presented in Table 18. There were significant relationships (p<.05)
between baseline scores for overall benefits (r= -.28), psychological benefits (r= -.26), overall
barriers (r= -.27), and effort barriers (r= -.26) and weight loss at 3 months, however these
baseline relationships disappeared when compared to 6-month weight change. The weight
change at 6 months was inversely associated (p<.05) with the change in overall barriers (r=
.35), time barriers (r= .33), and effort barriers (r= .37) from baseline to 6 months.
74

Table 16.Correlations Between 3-and 6-Month Weight Change and Self-Efficacy (Physical Activity & Eating)
Correlation
Psychosocial Variable
3-Month 6-Month
Weight Change Weight Change Physical Activity Self-Efficacy: Tired Baseline 3-Month 6-Month Change (0-3 months) Change (0-6 months) Bad Mood Baseline 3-Month 6-Month Change (0-3 months) Change (0-6 months) Low on Time Baseline 3-Month 6-Month Change (0-3 months) Change (0-6 months) On Vacation
-.246 -.078 -.360** -.282 ---- -.347* -.163 -.214 ---- -.334* -.203 -.071 -.310* -.275 ---- -.296* -.092 -.173 ---- -.210 -.241 -.041 -.300* -.287* ---- -.190 -.117 -.240 ---- -.146 -.074 -.070 -.372* -.362*
Baseline 3-Month 6-Month ---- -.207
-.301* -.308* Change (0-3 months) Change (0-6 months) ---- -.184
-.082 -.042
Bad Weather Baseline 3-Month -.107 -.073 6-Month Change (0-3 months) Change (0-6 months) Eating Self-Efficacy: Negative Emotions Baseline 3-Month 6-Month Change (0-3 months) Change (0-6 months) Availability Baseline 3-Month 6-Month Change (0-3 months) Change (0-6 months) Social Pressure Baseline 3-Month 6-Month Change (0-3 months) Change (0-6 months) Physical Discomfort Baseline 3-Month 6-Month Change (0-3 months) Change (0-6 months) Positive Activities Baseline 3-Month 6-Month Change (0-3 months) Change (0-6 months)
---- -.197 -.052 -.060 ---- -.232 -.220 -.145 -.129 -.081 ---- -.362* .142 .063 ---- -.241 -.090 -.022 -.241 -.224 ---- -.453** -.159 -.236 ---- -.440** -.084 -.094 -.222 -.200 ---- -.354* -.127 -.120 ---- -.156 -.183 -.163 -.177 -.086 ---- -.342* .016 .081 ---- -.156 -.205 -.169 -.229 -.143 ---- -.503** .024 .056 ---- -.168
*p< 0.05, **p<0.01
75

Table 17.Correlations Between 3-and 6-Month Weight Change and Body Image
Correlation
Psychosocial Variable
3-Month 6-Month
Weight Change Weight Change Body Image Appearance Evaluation Baseline 3-Month 6-Month Change (0-3 months) Change (0-6 months) Appearance Orientation Baseline 3-Month 6-Month Change (0-3 months) Change (0-6 months) Fitness Evaluation
.189 .142 -.004 .037 ----- -.145 -.285* -.156 ----- -.414** .016 -.093 -.078 -.174 ----- -.265 -.163 -.133
----- -.266 .177 .276 .025 .132
Baseline 3-Month 6-Month ----- .097
-.217 -.219 Change (0-3 months) Change (0-6 months) ----- -.285
.165 .280*
Fitness Orientation Baseline 3-Month -.122 -.097 6-Month Change (0-3 months) Change (0-6 months) Health Evaluation Baseline 3-Month 6-Month Change (0-3 months) Change (0-6 months) Health Orientation Baseline 3-Month 6-Month Change (0-3 months) Change (0-6 months) Illness Orientation Baseline 3-Month 6-Month Change (0-3 months) Change (0-6 months) Body Areas Satisfaction Baseline 3-Month 6-Month Change (0-3 months) Change (0-6 months) Self-Classified Weight Baseline 3-Month 6-Month Change (0-3 months) Change (0-6 months) Overweight Preoccupation Baseline 3-Month 6-Month Change (0-3 months) Change (0-6 months)
----- -.221 -.342** -.460** ----- -.580** -.026 -.128 .003 -.067 ----- -.243 .018 .067 ----- -.188 .218 .136 -.152 -.203 ----- -.365 -.406** -.392** ----- -.474** .129 .056 .023 .059 ----- .068 -.147 -.064 ----- .047 .161 .094 -.055 -.047 ----- -.218 -.308* -.200 ----- -.442** -.035 .002 -.132 -.056 ----- .221 -.097 -.052 ----- .185 .162 .175 -.146 -.096 ----- -.268 -.351** -.314* ----- -.465**
*p< 0.05, **p<0.01
76

Table 18.Correlations Between 3-and 6-Month Weight Change and Expected Outcomes and Barriers for Physical Activity
Correlation
Psychosocial Variable
3-Month 6-Month
Weight Change Weight Change Exercise Beliefs Outcome Expectations (Benefits) Baseline
3-Month 6-Month Change (0-3 months) Change (0-6 months)
Psychological Baseline 3-Month 6-Month Change (0-3 months) Change (0-6 months) Body Image Baseline 3-Month 6-Month Change (0-3 months) Change (0-6 months) Health Baseline 3-Month 6-Month Change (0-3 months) Change (0-6 months) Perceived Barriers Baseline 3-Month 6-Month Change (0-3 months) Change (0-6 months) Time Baseline 3-Month 6-Month Change (0-3 months) Change (0-6 months) Effort Baseline 3-Month 6-Month Change (0-3 months) Change (0-6 months) Obstacles Baseline 3-Month 6-Month Change (0-3 months) Change (0-6 months)
-.276* -.218 -.181 -.124 ----- -.247 .171 .135 ----- -.032 -.259* -.207 -.217 -.099 ----- -.120 .085 .151 ----- .106 -.151 -.150 -.139 -.157 ----- .299 .014 -.030 -.285 -.192 -.297 -.186 .066 -.014 ----- -.284 .296* .122 ----- -.082 -.265* -.272 -.005 -.005 ----- .156 .220 .243 ----- .354* -.073 -.235 .110 .087 ----- .219 .189 .285* ----- .330* -.263* -.222 .036 .054 ----- .148 .287* .316* ----- .369* -.202 -.126 -.208 -.219 ----- -.005 -.029 -.056 ----- .108
*p< 0.05, **p<0.01
77
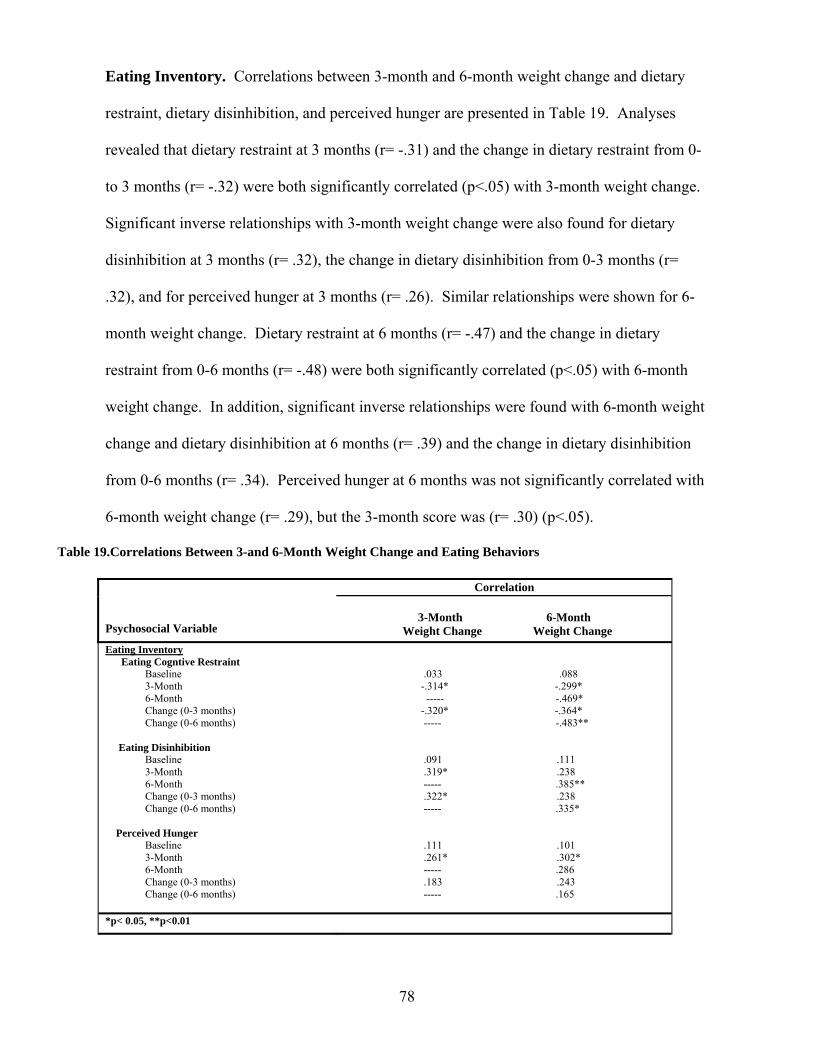
Eating Inventory. Correlations between 3-month and 6-month weight change and dietary
restraint, dietary disinhibition, and perceived hunger are presented in Table 19. Analyses
revealed that dietary restraint at 3 months (r= -.31) and the change in dietary restraint from 0-
to 3 months (r= -.32) were both significantly correlated (p<.05) with 3-month weight change.
Significant inverse relationships with 3-month weight change were also found for dietary
disinhibition at 3 months (r= .32), the change in dietary disinhibition from 0-3 months (r=
.32), and for perceived hunger at 3 months (r= .26). Similar relationships were shown for 6-
month weight change. Dietary restraint at 6 months (r= -.47) and the change in dietary
restraint from 0-6 months (r= -.48) were both significantly correlated (p<.05) with 6-month
weight change. In addition, significant inverse relationships were found with 6-month weight
change and dietary disinhibition at 6 months (r= .39) and the change in dietary disinhibition
from 0-6 months (r= .34). Perceived hunger at 6 months was not significantly correlated with
6-month weight change (r= .29), but the 3-month score was (r= .30) (p<.05).
Table 19.Correlations Between 3-and 6-Month Weight Change and Eating Behaviors
Correlation
3-Month 6-Month Psychosocial Variable Weight Change Weight Change
Eating Inventory Eating Cogntive Restraint
Baseline .033 .088 3-Month -.314* -.299* 6-Month ----- -.469* Change (0-3 months) -.320* -.364* Change (0-6 months) ----- -.483**
Eating Disinhibition Baseline .091 .111 3-Month .319* .238 6-Month ----- .385** Change (0-3 months) .322* .238 Change (0-6 months) ----- .335*
Perceived Hunger Baseline .111 .101 3-Month .261* .302* 6-Month ----- .286 Change (0-3 months) .183 .243 Change (0-6 months) ----- .165 *p< 0.05, **p<0.01
78

Correlations between Process Measures and Psychosocial Variables
Correlational analyses were performed to determine the relationships between the
process measures of weight loss (physical activity, energy intake, and eating behaviors) and
the psychosocial variables (body image, eating inventory, exercise benefits and barriers, and
physical activity and eating self-efficacy). All absolute and change variable were compared,
and results can be seen in Appendices B – J (Tables 20-28).
Psychosocial Correlates of Physical Activity
Baseline measures of the psychosocial variables did not have any significant
relationships to physical activity at 3 months, but three body image subscales at
baseline (fitness orientation (r= .31), health evaluation (r=.33), and self-classified
weight (r= -.29)) did have a significant relationship with physical activity at 6 months
(p<.05).
Data from the 3-month and 6-month measures of the psychosocial variables
reveal that at 3 months, physical activity was only significantly correlated with the
3-month body image subscale of fitness orientation (r=.28), 3-month effort barriers
(r= -.34), and 3-month self-efficacy for physical activity when tired (r= .31) and on
vacation (r= .27) (see Appendix B). At 6 months, however, the majority of the
psychosocial variables measured showed highly significant relationships with 6-
month physical activity. (see Appendix C). The only psychosocial variables (and
subscales) that did not have a significant relationship with 6-month physical
activity were body image subscales (appearance orientation, fitness evaluation,
illness orientation, self-classified weight, and overweight preoccupation), the
expected outcome of psychological benefits, and self-efficacy for physical activity
when on vacation. Significant positive correlations were seen for body image
79

subscales (appearance evaluation, fitness orientation, health evaluation, health
orientation, body-areas satisfaction), dietary restraint, overall benefits, body image
benefits, and health benefits of physical activity. Physical activity self-efficacy
when tired, in a bad mood, low on time, and in bad weather, and self-efficacy for
eating while having negative emotions, when food is available, when under social
pressure, in physical discomfort, and during positive activities were also
significantly positively correlated with 6-month physical activity (p<.05).
Psychosocial Correlates of Energy Intake
At baseline, the only psychosocial variable significantly (p<.05) associated
with energy intake at 3 months was perceived hunger (r= .29). At the 3-month time
period, two subscales of body image (fitness evaluation (r= -.28) and health
orientation (r= -.27)) had a significant inverse relationship (p<.05) to 3-month
energy intake. Dietary restraint (r= -.31), dietary disinhibition (r= .30), and self-
efficacy for eating while having negative emotions (r= -.30), when in physical
discomfort (r= -.27), and during positive activities (r= -.43) at 3 months were also
significantly correlated with 3-month energy intake (p<.05). (See Appendix D).
These relationships were not significant at 6 months. Dietary restraint (r= -.15) was
significantly and inversely correlated with energy intake at 6 months.
(See Appendix E).
Psychosocial Correlates of Eating Behaviors
Baseline measures of the psychosocial variables revealed significant
relationships (p<.05) between dietary restraint (r= .28) and self-efficacy for eating
during positive activities (r= .27) and 3-month weight-loss eating behaviors.
80
Weight-loss eating behaviors at 6 months were significantly correlated with
baseline appearance orientation (r= .40).
Significant correlations (p<.05) between three body image subscales at 3-
months (fitness evaluation (r= .28), fitness orientation (r= .40), health orientation
(r=.39), and 3-month weight loss eating behaviors emerged. In addition, dietary
restraint was positively associated with 3-month eating behaviors (r= .32) (p<.05),
while dietary disinhibition (r= -.40) and perceived hunger (r= -.44) were negatively
associated (p<.05) with 3-month weight loss eating behaviors. (See Appendix F).
At 6 months, the majority of measured psychosocial variables were
significantly correlated with 6-month weight loss eating behaviors. The significant
positive correlations (p<.05) were seen for body image subscales (appearance
evaluation, appearance orientation, fitness evaluation, fitness orientation, health
evaluation, health orientation, body-areas satisfaction), dietary restraint, and body
image benefits. Dietary disinhibition and perceived hunger were significantly
correlated (p<.05) with 6-month eating behaviors. (See Appendix G).
81

Summary of Findings
The 6-month behavioral weight loss intervention, regardless of group assignment,
resulted in significant decreases in body weight (range of weight loss = 6.1 to 8.8 kg), body
mass index, body composition (LBM and % body fat), and energy intake. Likewise, physical
activity (range of physical activity increase = 467 to 1099 kcal/wk) and weight loss eating
behaviors also significantly increased across the 6-month intervention, regardless of group
assignment. Other measures such as muscular strength of the chest and qualities of
mindfulness also improved significantly, with no significant differences between the groups.
When examining psychosocial measures, most of the subscales of physical activity
and eating self-efficacy improved over the 6-month intervention. As expected, dietary
restraint increased, while dietary disinhibition and perceived hunger decreased significantly
over time, with no difference in the groups. In addition, most of the subscales of body image
improved over time, with no difference between the groups. There were mixed results with
outcome expectations and perceived barriers for physical activity. There was a significant
interaction effect for overall outcome expectations, where they increased over time for the
SBWL + RT and SBWL + MD groups, but not for the SBWL group. The overall perceived
barriers did change significantly over time, but there was no difference between the groups.
The significant decreases in body weight were correlated with improvements in
physical activity and weight loss eating behaviors, but not with decreases in energy intake.
Significant correlates of physical activity included perceived barriers to physical activity
(negative), physical activity self-efficacy (positive), and some subscales of body image
(positive). Significant correlates of weight loss eating behaviors included body image
(positive), eating self-efficacy (positive), dietary restraint (positive), dietary disinhibition
(negative), and perceived hunger (negative).
82
DISCUSSION
Introduction
As the prevalence of overweight and obesity continues to increase,87 there is an
increasing need to develop effective intervention strategies. Considering the current standard
behavioral weight loss interventions currently produce a weight loss of approximately 10.7kg
or 11% of initial body weight,126 and there is large variability in treatment success, there is
still considerable room for advances in the treatment of this population . Innovative,
alternative, and effective intervention protocols may need to be developed and implemented if
progress is going to continue to be made. In addition, identifying the behaviors that are
critical for successful weight loss, and the corresponding psychosocial variables that may
partially explain or predict the adoption of these behaviors, should clearly be a primary
research objective. If the key behavior changes and related psychosocial variables are
identified, future interventions could be tailored to focus on these variables and theoretically
produce greater weight loss. Therefore, the purpose of the current investigation was to
examine the effect of the addition of alternative techniques including mindfulness meditation
and home-based resistance exercise on weight loss, eating and physical activity behaviors,
and psychosocial variables in overweight and obese adults.
Summary of Major Findings and Discussion
Effect of the Intervention on Participant Attrition
The attrition rate of this study was 28%, with 51 of the initial 71 randomized subjects
completing the 6-month intervention. Past research has suggested that, on average,
approximately 20% of subjects who begin treatment in a behavioral weight loss intervention
83

do not complete it.126 Therefore the attrition rate seen in this study is higher than is what is
typically observed. In addition, a summary of studies in which the length of treatment
(approximately 22.2 weeks) was most similar to this study (24 weeks) reported an average
attrition rate of 18.5%,126 which again is much smaller than the attrition seen here.
When examining data by intervention group, attrition was 34% for the SBWL group,
35% for the SBWL + RT group, and 17% for the SBWL + MD group. Although there was no
statistically significant differences in these attrition rates, it appears that the SBWL group in
this study had a much higher attrition rate than what is normally seen in a standard
intervention, while the SBWL + MD group had an attrition rate more closely related to what
is typically observed. Due to this higher than usual attrition rate in the SBWL group, it is
difficult to determine whether the attrition of the other two groups (SBWL + RT and SBWL +
MD) was because of the addition of the alternative techniques or simply representative of the
standard intervention.
Upon closer examination of the attrition rates in studies that include resistance
exercise as part of the intervention, completion rates range from 0 to 37%.27 One study which
specifically examined four exercise interventions in obese women across 48-weeks, two of
which included resistance training on Cybex and Universal gym equipment, found that 18%
of the subjects discontinued treatment prematurely.130 In the same study, attendance at the
group treatment sessions declined significantly from weeks 9 to 24, and averaged
86.2%+14.4% of possible visits.130 The attendance at the resistance training sessions in this
study was much lower at 49.1+35.7%. It is unclear why adherence to the resistance exercise
intervention was lower in this study, but it is important to note that the addition of this
alternative technique did not contribute to improved adherence, or to improved outcomes,
such as weight loss, physical activity, or strength. One possible explanation is that is the mode
84

of resistance training in this study (resistance tubing and resistance balls) may not have been
acceptable to the subjects. Or perhaps it did not produce substantial strength gains or results
that may naturally promote adherence.
When examining the attrition rates of previous intervention studies using mindfulness
mediation techniques, completion rates range from 60 to 97%, with a mean of 85+8.9%.11
One study in particular was a randomized trial of two mind-body interventions for weight loss
maintenance. Results from this study showed that 71% and 90% of randomized subjects to
the mind-body techniques completed 24-week follow-up, compared to 77.4% in the control
group.37 Another study across 5-months found that participants in a mind-body intervention
to improve cardiovascular risk had a 92% retention, compared to 99% in the usual care
intervention.36 These average attrition rates of approximately 15% are comparable to the 17%
attrition rate of the current SBWL + MD group. And although only a few mindfulness studies
reported the extent to which subjects completed their home-practice assignments, the average
number of practices per week reported was 3.25,11 which is less than the reported 5.29
practices per week in the current study. A possible reason for this slight difference may be in
the way in which “practice” at home was defined in each study. Overall, the additional
mindfulness mediation intervention did not appear to hinder adherence or retention to the
current investigation, and it may have even helped to improve it, given the attrition rates of
the SBWL and SBWL + RT groups were much higher than what is typically seen. It is
possible that this type of intervention may have helped to promote group cohesion and a
personal sense of importance of attendance to the group sessions as there was an additional
15-30 minutes of group time dedicated to sharing of personal experiences and emotions,
group meditative experiences, and discussion around emotional aspects of weight loss
behaviors.
85

Effect of the Intervention on Weight Loss
The 6-month intervention resulted in significant (p<.05) weight loss for all three
intervention groups (SBWL = -6.1 kg, SBWL + RT = -8.8 kg, SBWL+MD = -8.0 kg). This
represents an overall weight loss of 8% (-7.6 kg) of initial body weight. These weight losses
were slightly less than expected, given that the average weight loss in a standard behavioral
intervention as reported by Wadden et al. is approximately 0.4 kg per week, or 9.6 kg across
24-weeks.126 Not only is the weight loss averaged across the three groups lower (2.0 kg less),
but the SBWL group specifically is much lower (3.5 kg lower) than standard groups in other
studies.
Past research in which resistance training as been a part of the intervention has shown
that this type of training does not add any additional weight loss benefits when compared to a
control group,27 which is in agreement with the current findings. However, while there was
not a significant difference between the SBWL+RT group and the SBWL and SBWL+MD
groups, the resistance training group did have a 2.7 kg improvement in weight loss above the
SBWL group. This may require additional investigations to determine the possible impact of
resistance exercise on weight loss. To date, there have not been any randomized clinical trials
examining the addition of mindfulness training to a standard behavioral weight loss program,
and therefore comparison of weight loss is unqualified. However, in the current study,
analyses revealed that there were no significant differences between the three groups,
indicating that although the intervention was effective in producing weight loss, the additional
techniques of resistance exercise and mindfulness did not improve on this.
86

Effect of the Intervention on Processes Measures of Weight Loss
Physical Activity
The results from this study showed that self-reported physical activity (kcal/wk) was
significantly higher at 6 months than at baseline, with an overall average increase in physical
activity energy expenditure of 833+439 kcal/wk. The comparison of the three intervention
groups revealed no significant group differences, although the SBWL + RT group had the
largest increase in physical activity (mean difference = 1099+506 kcal/wk) from baseline to 6
months amongst the three groups, which is to be expected given the exercise prescription
included an additional 30 minutes each week of group exercise and 4 days/wk of prescribed
resistance exercise at home. Therefore, the behavioral intervention did result in an overall
increase in physical activity when compared to baseline, but neither the resistance training nor
the mindfulness training improved this outcome when compared to the standard group. The
lack of a significant difference in physical activity energy expenditure between groups is
possibly due to lack of adherence to the resistance training protocol in the SBWL +RT group,
and because the primary focus in the SBWL + MD group was on eating behaviors and not
physical activity per se.
As shown in Appendices B and C (Tables 20 and 21), significant positive correlates of
increased physical activity participation in this study were physical activity self-efficacy,
subscales of body image, and outcome expectations. As has been previously shown, barriers
to physical activity were the most consistent negative correlate of physical activity
participation. Therefore continued focus on improving physical activity participation in
weight loss interventions, should place considerable attention on increasing physical activity
self-efficacy by providing mastery experiences, and reducing barriers to being physically
active through strategies such as problem-solving, planning, and environmental restructuring.
87

Energy Intake
Energy intake (kcal/day) significantly decreased over the course of the 6-month
intervention for all three groups, decreasing from an average of 1992+809 kcal/d at baseline
to an average of 1293+526 kcal/d at 6 months. Therefore, the intervention did result in
significant decreases in energy intake over time. However, the pattern of energy intake was
different from 3 months to 6 months in that both the SBWL and SBWL + MD groups
continued to decrease their energy intake, while the SBWL + RT group increased their energy
intake from 3- to 6 months. This difference could possibly be due to compensation for the
slight increase in physical activity energy expenditure reported above for the SBWL + RT
group, although a review of the research has shown that only 19% of intervention studies
reported an increase in energy intake after exercise.17 Additional research to understand the
influence of resistance training on energy intake may be warranted.
As shown in Appendices C and E (Tables 22 and 23), a consistent negative correlate
to energy intake at both 3- and 6 months was dietary restraint, which is defined as conscious
attempts to monitor and regulate food intake. There was some relationship seen at 3 months
for eating self-efficacy as well, but this relationship was not present at 6 months. These
results confirm previous findings that some form of self-monitoring of food intake is crucial
to energy intake19, 126, and must continue to be an essential element to any behavioral weight
loss program.
Eating Behaviors
Results from the eating behavior inventory (EBI), which examines the role of specific
eating and weight loss behaviors in weight loss, revealed that these behaviors increased over
the 6-month intervention as expected. However, there was no significant difference between
the groups. It was theorized that the SBWL + RT and the SBWL + MD would have a greater
88

improvement in weight loss eating behaviors when compared to the SBWL group, and
although this was not the case, the intent-to-treat analysis revealed that a trend (p=.08) began
to emerge in which the SBWL + MD group had higher EBI scores when compared to the
SBWL group. Given that a large portion of the mindfulness training was centered on hunger
awareness, eating mindfully, and learning to listen to the body’s cues before, during, and after
eating, it is not surprising that this trend emerged. Considering the amount of time it may take
to fully incorporate mindful eating as part of one’s lifestyle, perhaps a study of longer
duration would reveal significant differences in weight-loss eating behaviors in a group that
receives this type of training.
As shown in Appendices F and G (Tables 24 and 250, significant correlates of
improved weight loss eating behaviors in this study were higher levels of eating self-efficacy,
higher dietary restraint, and improvements in some of the subscales of body image. As
previously shown, higher levels of dietary disinhibition and perceived hunger were the most
consistent negative correlates of weight loss eating behaviors.22, 52, 119
Effect of the Intervention on Psychosocial Variables
As seen in Tables 11-14, the behavioral intervention resulted in significant
improvements in many of the psychosocial variables measured in this study including
physical activity self-efficacy when tired and on vacation, eating self-efficacy, dietary
restraint, dietary disinhibition, perceived hunger, and most subscales of body image. These
results are in agreement with other studies that have also reported improvements in physical
activity self-efficacy, eating self-efficacy, dietary restraint and disinhibition, perceived
hunger, and body image over the course of an intervention.44, 104, 119, 120, 132 The addition of the
89
alternative methods of resistance training or mindfulness training did not have any additional
effect on these variables.
Results from this study also showed that over the course of the behavioral
intervention, there was a significant decrease in the overall barriers and the effort barriers to
physical activity, with no difference between the three groups. Other studies have also shown
that exercise barriers decrease over the course of an intervention.44, 119 However, except for
the psychological benefits, the outcome expectations did not significantly improve over time.
This was also observed by Gallagher et al. in which psychological benefits increased over the
course of the intervention.44
This study also revealed differences between the three groups, in that the overall
outcome expectations for physical activity increased over the course of the intervention for
both the SBWL+RT and SBWL+MD groups, but increased at 3 months and then decreased at
6 months for the SBWL group. In addition, the SBWL +MD group had higher expectations
that body image would improve with exercise when compared to the SBWL group. This is
interesting in that past studies of the treatment of binge eating disorder using mindfulness-
based stress reduction found that most subjects reported an increased sense of self-concept
and self-awareness following treatment.73 A similar effect may be seen here in that
mindfulness training improves self-concept and self-awareness as the subjects relate to
exercise behaviors, and therefore expectations that body image will improve is also greater.
Effect of the Intervention on Correlates of Weight Loss and Process Measures
The correlates of body weight change over the course of the intervention are shown in
Tables 15-19. The primary process measures associated with body weight change at 3 months
was baseline and 3-month physical activity, the change in energy intake from baseline to 3
90

months, and the improvement in eating behaviors at 3 months. The weight loss at 6 months
was also correlated with the process measures of physical activity and eating behaviors, but
here it was the 3-month and 6-month physical activity and the 3-month and 6-month eating
behaviors that significantly correlated. There was no relationship between energy intake at 6
months and 6-month weight loss, which may have been due to the measure of energy intake,
the Block Food Frequency Questionnaire. These relationships affirm past studies which show
that an increase in physical activity and an improvement in eating behaviors are associated
with the greatest weight losses.
The study also found various psychosocial variables to be related to weight loss across
the intervention. At 3 months, weight loss was related to physical activity self-efficacy (when
tired, in a bad mood, low on time, on vacation), but not eating self-efficacy. At 6 months
physical activity self-efficacy when tired and in a bad mood were still related to 6-month
weight change, but the other subscales were not. It was also interesting to note that all
subscales of 6-month eating self-efficacy were now correlated with weight change, even when
these relationships were not seen at 3 months suggesting that eating self-efficacy becomes
more critical at the 6-month time period. And although a review of psychosocial predictors of
weight control by Teixeira et al.121 suggested that it is more the changes in both eating and
exercise self-efficacy that are most consistently associated with weight loss, this was not the
case in this study.
As shown in Table 17, it was the change in body image subscales of appearance
orientation, fitness orientation, health orientation, body areas satisfaction, and overweight
preoccupation from 0-to 3 months and from 0-to 6 months that correlated with weight loss at
3 months and 6 months, respectively. It is interesting to note that it was the change in body
image subscales that showed a relationship to weight loss rather than the absolute body image
91

scores. When comparing these absolute body image scores of the overweight sample in this
study to those of the general population, even with the positive changes in body image over
the course of the intervention, the 6-month scores (except for the health subscales) are still
somewhat less than that of the general population.26
The results revealed that it was the overall outcome expectations and psychological
benefits of exercise, and the overall and effort barriers to exercise at baseline that were related
to weight loss at 3 months. However, at 6 months it was primarily the decrease in barriers
(overall, time, and effort) from baseline to 6 months that was associated with weight loss,
which is in agreement with other studies44, 119 and show that it is primarily the barriers to
exercise rather than the benefits that need to be addressed in a behavioral intervention.
Previous studies have shown that weight loss eating behaviors such as high levels of
dietary restraint and low levels of disinhibition are associated with weight loss.38, 119 Results
from the current investigation support these findings, in that 3-month weight change was
associated with greater dietary restraint, and lower disinhibition and hunger at 3 months.
Weight loss at 6 months was also associated with greater dietary restraint at both 3- and 6
months, as well as the change from baseline to both 3-and 6 months. In addition, decreases in
eating disinhibition at 6-month was also related to weight loss at 6 months. The strongest
relationship with weight loss was dietary restraint in particular, as has been shown
consistently in other investigations.43, 119
Limitations and Recommendations for Future Research
There were several limitations to this study which may have contributed to the
observed outcomes. Therefore the current findings need to be considered in context with
these limitations, and future investigations should take into account the following suggestions:
92

1. Although the sample size at the start of the study was sufficient to
provide 70% power to the investigation, the small sample size by the end
of the study may be one factor in the failure to detect significant group
differences, and/or significant relationships between weight loss,
physical activity and eating behaviors, and psychosocial variables.
Therefore future interventions which examine resistance training and/or
mindfulness should be conducted with larger sample sizes.
2. This study was 6 months in duration, and therefore may not have been
significantly long enough see the differential effects of the resistance
training or mindfulness training components of the study. It is unclear
whether a study longer in duration would have an effect on the measured
outcomes, yet some trends shown here suggest that future investigations
longer in duration may be needed to elicit differences.
3. The standard group in this study had a much higher attrition rate (34%)
than what is typically seen in most standard behavioral interventions
(20%). In addition, the weight loss was lower than expected for a
standard behavioral intervention group. This may have made accurate
comparison between groups difficult.
4. The resistance exercise group (SBWL +RT) in the current study a high
attrition rate (35%) as well as a low adherence rate, in which subjects
self-reported participating in only 40.3% of the prescribed resistance
exercise sessions. It is unclear why adherence was so low, but may have
been due to the likeability of the resistance tubing and resistance balls,
the volume of exercise was overwhelming, or the training did not
93

provide adequate stimulus to produce results. For example, sufficient
overload is required for strength gains to occur, and it is possible that
either the resistance tubing cannot produce this type of intensity in this
population or that the RPE scale used by the subjects to subjectively rate
their exertion did not accurately represent the true intensity. Future
investigations should consider the use of a more potent, yet still portable,
strength stimulus such as free weights, and provide adequate training to
produce results which may provide further motivation to continue
training protocols.
5. There was a lack of any significant relationships between energy intake
and weight loss, which may reflect the method used to assess energy
intake.108 Future investigations may consider other options for
measurement of energy intake such as the 24-hr dietary recall, or use
other reference methods to verify results such as resting metabolic and
physical activity or doubly labelled water.133
6. Physical activity energy expenditure was assessed using the
Paffenbarger Exercise Habits questionnaire, which although has been
shown to be consistent with results from the 7-day physical activity
recall, may not have provided the most accurate assessment of physical
activity. Future investigation should consider objective measures of
physical activity, such as a portable electronic armband device or
accelerometers.
94
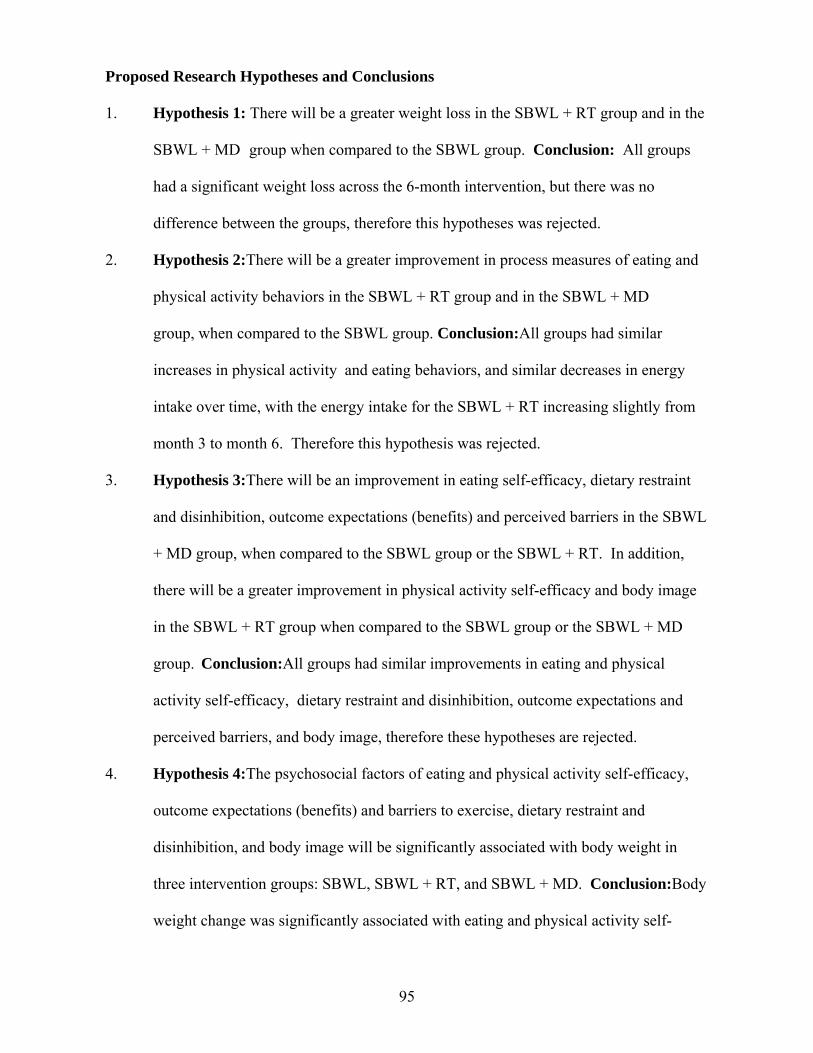
Proposed Research Hypotheses and Conclusions
1. Hypothesis 1: There will be a greater weight loss in the SBWL + RT group and in the
SBWL + MD group when compared to the SBWL group. Conclusion: All groups
had a significant weight loss across the 6-month intervention, but there was no
difference between the groups, therefore this hypotheses was rejected.
2. Hypothesis 2:There will be a greater improvement in process measures of eating and
physical activity behaviors in the SBWL + RT group and in the SBWL + MD
group, when compared to the SBWL group. Conclusion:All groups had similar
increases in physical activity and eating behaviors, and similar decreases in energy
intake over time, with the energy intake for the SBWL + RT increasing slightly from
month 3 to month 6. Therefore this hypothesis was rejected.
3. Hypothesis 3:There will be an improvement in eating self-efficacy, dietary restraint
and disinhibition, outcome expectations (benefits) and perceived barriers in the SBWL
+ MD group, when compared to the SBWL group or the SBWL + RT. In addition,
there will be a greater improvement in physical activity self-efficacy and body image
in the SBWL + RT group when compared to the SBWL group or the SBWL + MD
group. Conclusion:All groups had similar improvements in eating and physical
activity self-efficacy, dietary restraint and disinhibition, outcome expectations and
perceived barriers, and body image, therefore these hypotheses are rejected.
4. Hypothesis 4:The psychosocial factors of eating and physical activity self-efficacy,
outcome expectations (benefits) and barriers to exercise, dietary restraint and
disinhibition, and body image will be significantly associated with body weight in
three intervention groups: SBWL, SBWL + RT, and SBWL + MD. Conclusion:Body
weight change was significantly associated with eating and physical activity self-
95

efficacy, perceived barriers to exercise, dietary restraint and disinhibition, and body
image, but not with outcome expectations. Therefore this hypothesis was accepted for
the psychosocial factors listed above, but was rejected for outcome expectations.
5. Hypothesis 5:The process measures of eating and physical activity behaviors will be
significantly positively associated with weight loss across the intervention groups:
SBWL, SBWL + RT, and SBWL + MD. Conclusion:Both physical activity and
eating behaviors were significantly positively associated with weight loss, but energy
intake was not. Therefore the hypothesis is accepted for two of the process measures
examined, and rejected for the process measure of energy intake.
6. Hypothesis 6:The psychosocial factors of eating and physical activity self-efficacy,
outcome expectations (benefits) and barriers to exercise, dietary restraint and
disinhibition, and body image will be significantly associated with the process
measures eating and physical activity behaviors in the intervention groups: SBWL,
SBWL + RT, and SBWL + MD. Conclusion:The psychosocial factors of eating and
physical activity self-efficacy, outcome expectations (benefits) and barriers to
exercise, dietary restraint and disinhibition, and body image were significantly
associated with the process measures eating and physical activity behaviors and
therefore this hypothesis is accepted.
Conclusion
In conclusion, although the intervention was successful in producing favorable
changes in body weight, physical activity, and weight loss eating behaviors, the present study
did not demonstrate that the addition of alternative techniques of home-based resistance
exercise or mindfulness meditation to a standard behavioral weight loss intervention produced
greater weight losses, greater improvements in physical activity, or greater improvements in
96

weight loss eating behaviors. In addition, the intervention did have an impact on psychosocial
factors that seem to influence physical activity and eating behaviors, which have been shown
to ultimately influence weight loss.
The study did show that overall, the process measures of weight loss (physical
activity, energy intake, and eating behaviors) and the psychosocial variables (self-efficacy,
outcome expectations and barriers, body image, and dietary restraint, dietary disinhibition,
and hunger) were positively affected by the standard behavioral intervention. Weight loss
was most strongly associated with improvements in physical activity and eating behaviors,
and there were many correlates of weight loss and those behaviors that seem to enhance
success. If the aim is to improve weight loss success, there needs to be improvement in
physical activity energy expenditure and in weight-loss eating behaviors. This study suggests
that to improve physical activity, interventions should focus on decreasing barriers to physical
activity, improving self-efficacy for physical activity, and improving body image. It also
suggests that to improve eating behaviors, interventions should focus on increasing eating
self-efficacy and dietary restraint, and decreasing disinhibition tendencies, which would likely
improve overall body image. Ultimately, if interventions continue to focus on teaching
individuals how to adopt these behaviors, and instill confidence in their ability to maintain
them, weight loss outcomes may be improved.
97

APPENDIX A
Differences in Main Outcome Measures (Intent-to-Treat) Across the 6-month Behavioral Intervention by Group
Assessments p-Values
Outcome Measure
Intervention Group
Week Week Week 0 12 24
Group Time Group X Effect Effect Time Interaction
Body Weight (kg) Body Mass Index (kg/m2) Lean Body Mass (kg) Body Fat (%) Physical Activity (kcal) Energy Intake (kcal/day) Percent Fat Intake (%) Percent Carbohydrate Intake (%) Percent Protein Intake (%) Eating Behavior Inventory
SBWL (n=24) SBWL + RT (n=23) SBWL + MD (n=24) SBWL (n=24) SBWL + RT (n=23) SBWL + MD (n=24) SBWL (n=24) SBWL + RT (n=23) SBWL + MD (n=24) SBWL (n=24) SBWL + RT (n=23) SBWL + MD (n=24) SBWL (n=24) SBWL + RT (n=23) SBWL + MD (n=24) SBWL (n=24) SBWL + RT (n=23) SBWL + MD (n=24) SBWL (n=24) SBWL + RT (n=23) SBWL + MD (n=24) SBWL (n=24) SBWL + RT (n=23) SBWL + MD (n=24) SBWL (n=24) SBWL + RT (n=23) SBWL + MD (n=24) SBWL (n=24) SBWL + RT (n=23) SBWL + MD (n=24)
93.2+11.9 95.5+13.5 90.5+12.9 33.0+3.5 33.6+3.6 32.1+3.8 54.9+7.4 55.1+6.6 53.8+6.5 40.8+6.5 41.8+6.0 40.1+4.9 670+605 897+630 765+713 2255.1+1082 1807.8+910 2280.7+891 42.3+6.9 39.3+6.9 39.9+6.5 43.2+6.7 46.1+6.9 46.2+7.6 15.3+3.4 15.3+2.4 14.7+2.9 66.9+9.9 71.2+9.3 69.9+9.0
88.1+12.1 91.2+12.9 85.9+13.8 31.2+3.5 32.1+3.7 30.4+4.0 54.2+7.4 54.6+6.5 52.9+6.7 38.2+6.9 39.6+7.1 37.8+5.9 1913+1364 1516+831 1712+930 1722.2+1049 1479.3+813 1508.8+752 35.0+6.8 33.8+8.2 32.1+6.3 49.9+7.1 50.8+7.0 50.4+6.7 16.2+3.1 16.0+2.8 17.6+3.6 78.8+13.0 80.5+12.4 84.2+9.5
89.1+13.7 89.7+14.3 83.7+14.5 31.6+4.1 31.6+4.1 29.6+4.2 54.3+7.6 54.4+6.4 52.8+6.7 38.7+6.9 38.9+7.7 36.5+6.7 982+1181 1566+1138 1507+862 1767.6+968 1671.2+937 1480.5+695 39.1+9.2 33.9+7.4 32.5+6.2 46.7+9.2 51.1+6.5 51.1+7.2 15.2+3.1 16.3+3.0 16.4+3.2 75.5+14.3 81.2+13.4 86.1+10.6
.359 .259 .717 .566 .752
<.001 .112 <.001 .120 <.001 .553 <.001 .197 <.001 .024
.561 <.001 .007 .071 <.001 .122 .220
<.001 .303
.714
<.001 .013
.075 <.001 .101
98
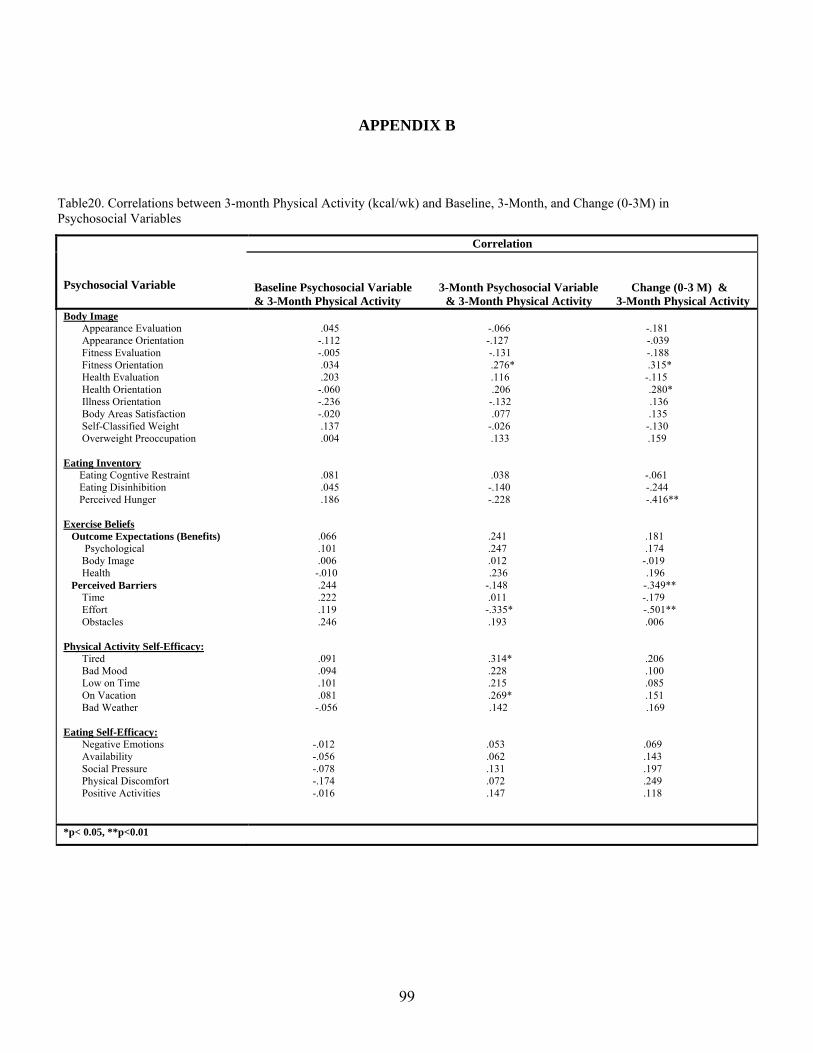
APPENDIX B
Table20. Correlations between 3-month Physical Activity (kcal/wk) and Baseline, 3-Month, and Change (0-3M) in Psychosocial Variables
Correlation
Psychosocial Variable Baseline Psychosocial Variable 3-Month Psychosocial Variable Change (0-3 M) &
& 3-Month Physical Activity & 3-Month Physical Activity 3-Month Physical Activity Body Image
Appearance Evaluation .045 -.066 -.181 Appearance Orientation -.112 -.127 -.039 Fitness Evaluation -.005 -.131 -.188 Fitness Orientation .034 .276* .315* Health Evaluation .203 .116 -.115 Health Orientation -.060 .206 .280* Illness Orientation -.236 -.132 .136 Body Areas Satisfaction -.020 .077 .135 Self-Classified Weight .137 -.026 -.130 Overweight Preoccupation .004 .133 .159
Eating Inventory Eating Cogntive Restraint .081 .038 -.061 Eating Disinhibition .045 -.140 -.244 Perceived Hunger .186 -.228 -.416**
Exercise Beliefs .066 .241 .181 Outcome Expectations (Benefits)
Psychological .101 .247 .174 Body Image .006 .012 -.019 Health -.010 .236 .196
.244 -.148 -.349** Perceived Barriers Time .222 .011 -.179 Effort .119 -.335* -.501** Obstacles .246 .193 .006
Physical Activity Self-Efficacy: Tired .091 .314* .206 Bad Mood .094 .228 .100 Low on Time .101 .215 .085 On Vacation .081 .269* .151 Bad Weather -.056 .142 .169
Eating Self-Efficacy: Negative Emotions -.012 .053 .069 Availability -.056 .062 .143 Social Pressure -.078 .131 .197 Physical Discomfort -.174 .072 .249 Positive Activities -.016 .147 .118
*p< 0.05, **p<0.01
99

APPENDIX C
Table 21. Correlations between 6-month Physical Activity (kcal/wk) and Baseline, 6-Month, and Change (0-6M) in Psychosocial Variables
Correlation
Psychosocial Variable Baseline Psychosocial Variable 6-Month Psychosocial Variable Change (0-6 M) &
& 6-Month Physical Activity & 6-Month Physical Activity 6-Month Physical Activity Body Image
Appearance Evaluation .085 .317* .410** Appearance Orientation .032 .205 .237 Fitness Evaluation .007 .181 .261 Fitness Orientation .306* .567** .430** Health Evaluation .330* .489** .360* Health Orientation .223 .562** .263 Illness Orientation -.030 .112 .110 Body Areas Satisfaction .221 .488** .483** Self-Classified Weight -.294* .058 .186 Overweight Preoccupation -.065 .094 .141
Eating Inventory Eating Cogntive Restraint -.116 .330* .381** Eating Disinhibition -.095 -.400** -.344* Perceived Hunger .055 -.429** -.418**
Exercise Beliefs .171 .353* .219 Outcome Expectations (Benefits)
Psychological .175 .243 .040 Body Image .131 .322* .234 Health .083 .368* .265
-.012 -.548** -.458** Perceived Barriers Time .058 -.315* -.307* Effort -.184 -.546** -.343* Obstacles .238 .374** -.434**
Physical Activity Self-Efficacy: Tired .246 .462** .231 Bad Mood .171 .459** .273 Low on Time .133 .378** .175 On Vacation .272 .252 .045 Bad Weather .100 .332* .279
Eating Self-Efficacy: Negative Emotions .080 .489** .344* Availability .063 .409** .315* Social Pressure -.041 .366* .339* Physical Discomfort -.021 .357* .418** Positive Activities .022 .398** .343*
*p< 0.05, **p<0.01
100

APPENDIX D
Table 22. Correlations between 3-Month Energy Intake (kcal/wk) and Baseline, 3-Month, and Change (0-3M) in Psychosocial Variables
Correlation
Baseline Psychosocial Variable 3-Month Psychosocial Variable Change (0-3 M) and Psychosocial Variable And 3-Month Energy Intake and 3-Month Energy Intake 3-Month Energy Intake
Body Image Appearance Evaluation -.081 -.119 -.101 Appearance Orientation -.119 -.088 .048 Fitness Evaluation -.150 -.281* -.213 Fitness Orientation -.064 -.254 -.265* Health Evaluation -.210 -.156 .064 Health Orientation .075 -.270* -.372** Illness Orientation .079 -.019 -.134 Body Areas Satisfaction .052 -.064 -.168 Self-Classified Weight .175 .103 -.082 Overweight Preoccupation .158 -.138 -.336*
Eating Inventory Eating Cogntive Restraint -.035 -.311* -.232 Eating Disinhibition .175 .300* .192 Perceived Hunger .291* .249 -.013
Exercise Beliefs -.154 -.096 .101 Outcome Expectations (Benefits)
Psychological -.047 -.075 -.031 Body Image -.261 -.042 .282* Health -.250 -.116 .101
.061 .173 .135 Perceived Barriers Time .038 .105 .080 Effort .011 .139 .151 Obstacles .116 .156 .057
Physical Activity Self-Efficacy: Tired -.049 -.175 -.120 Bad Mood -.054 -.145 -.075 Low on Time .054 - .091 -.135 On Vacation .046 .081 .032 Bad Weather .047 .081 .043
Eating Self-Efficacy: Negative Emotions -.098 -.302* -.227 Availability .037 -.262 -.344** Social Pressure .122 .162 -.280* Physical Discomfort -.099 -.271* -.161 Positive Activities -.002 -.431** -.351**
*p< 0.05, **p<0.01
101

APPENDIX E
Table 23. Correlations between 6-Month Energy Intake (kcal/wk) and Baseline, 6-Month, and Change (0-6M) in Psychosocial Variables
Correlation
Baseline Psychosocial Variable 6-Month Psychosocial Variable Change (0-6 M) and Psychosocial Variable And 6-Month Energy Intake and 6-Month Energy Intake 6-Month Energy Intake
Body Image Appearance Evaluation .157 .122 -.011 Appearance Orientation -.111 -.043 .083 Fitness Evaluation .079 .001 -.115 Fitness Orientation .224 .001 -.200 Health Evaluation -.024 .045 .088 Health Orientation -.078 -.043 .038 Illness Orientation -.079 -.080 .008 Body Areas Satisfaction .090 .086 .022 Self-Classified Weight .006 -.091 -.071 Overweight Preoccupation .031 -.061 -.091
Eating Inventory Eating Cogntive Restraint -.151 -.145** -.191 Eating Disinhibition .087 .136 .055 Perceived Hunger .240 .270 .010
Exercise Beliefs -.024 -.074 -.065 Outcome Expectations (Benefits)
Psychological .101 -.040 -.170 Body Image -.185 -.002 .161 Health -.197 -.233 -.025
.255 -.042 -.225 Perceived Barriers Time .322* -.050 -258 Effort .085 -.005 -.085 Obstacles .257 -.060 -.220
Physical Activity Self-Efficacy: Tired -.083 -.045 .032 Bad Mood -.085 .013 .117 Low on Time .005 .068 .065 On Vacation -.067 .131 .222 Bad Weather -.078 .132 .264
Eating Self-Efficacy: Negative Emotions -.019 -.045 .027 Availability -.034 .003 .057 Social Pressure -.022 -.017 -.039 Physical Discomfort -.059 .042 .044 Positive Activities -.112 -.050 -.015
*p< 0.05, **p<0.01
102

APPENDIX F
Table 24. Correlations between 3-Month Eating Behavior Inventory and Baseline, 3-Month, and Change (0-3M) in Psychosocial Variables
Correlation
Baseline Psychosocial Variable 3-Month Psychosocial Variable Change (0–3 M) Psychosocial Variable And 3-Month EBI and 3-Month EBI and 3-Month EBI
Body Image Appearance Evaluation .083 .223 .267* Appearance Orientation .034 .188 .264* Fitness Evaluation .115 .280* .245 Fitness Orientation .156 .397** .341* Health Evaluation .195 .074 -.112 Health Orientation .125 .389** .293* Illness Orientation .159 .089 -.089 Body Areas Satisfaction .053 .230 .313* Self-Classified Weight -.208 -.078 .085 Overweight Preoccupation -.127 .019 .157
Eating Inventory Eating Cogntive Restraint .277* .321* .038 Eating Disinhibition -.255 -.404** -228 Perceived Hunger -.308 -.441** -.194
Exercise Beliefs .206 .176 -.060 Outcome Expectations (Benefits)
Psychological .151 .174 .023 Body Image .229 .063 -.198 Health .194 .125 -.038
-.171 -.229 -.398** Perceived Barriers Time -.060 -.205 -.189 Effort .135 -.223 -.391** Obstacles .299* -.054 -.283*
Physical Activity Self-Efficacy: Tired .263 .361** .124 Bad Mood .264* .345** .048 Low on Time .246 .320* .106 On Vacation .239 .354** .103 Bad Weather .039 .039 .031
Eating Self-Efficacy: Negative Emotions .218 .275* .043 Availability .251 .303* .016 Social Pressure .161 .226 .055 Physical Discomfort .198 .310* .111 Positive Activities .269* .511** .144
*p< 0.05, **p<0.01
103

APPENDIX G
Table 25. Correlations between 6-Month Eating Behavior Inventory and Baseline, 6-Month, and Change (0-6M) in Psychosocial Variables
Correlation
Baseline Psychosocial Variable 6-Month Psychosocial Variable Change (0–6 M) Psychosocial Variable And 6-Month EBI and 6-Month EBI and 6-Month EBI
Body Image Appearance Evaluation .071 .310* .428** Appearance Orientation .400** .590** .368* Fitness Evaluation .143 .313* .333* Fitness Orientation .182 .465** .445** Health Evaluation .151 .459** .440** Health Orientation .218 .636** .362* Illness Orientation .146 .194 .008 Body Areas Satisfaction .000 .314* .389** Self-Classified Weight .074 -.057 -.060 Overweight Preoccupation .049 .219 .167
Eating Inventory Eating Cogntive Restraint .255 .551** .232 Eating Disinhibition -.125 -.497** -.453** Perceived Hunger -.132 - .451** -.299*
Exercise Beliefs .282* .247 -.037 Outcome Expectations (Benefits)
Psychological .226 .045 -.217 Body Image .231 .344* .189 Health .312* .441** .135
.175 -.216 -.326* Perceived Barriers Time .103 -.141 -.183 Effort .079 -.146 -.223 Obstacles .253 -.233 -.372**
Physical Activity Self-Efficacy: Tired .028 .345* .335* Bad Mood .166 .430** .229 Low on Time .080 .263 .109 On Vacation .096 .071 .064 Bad Weather .175 .338* .176
Eating Self-Efficacy: Negative Emotions .121 .491** .351* Availability .013 .488** .451** Social Pressure -.030 .483** .446* Physical Discomfort .091 .441** .371* Positive Activities .159 .648** .391**
*p< 0.05, **p<0.01
104

APPENDIX H
Table 26. Correlations Between 3-and 6-Month Change in Physical Activity and Body Image
Correlation
3-Month Change in 6-Month Change in Psychosocial Variable Physical Activity Physical Activity
Body Image Appearance Evaluation
Baseline -.007 .052 3-Month -.103 .093 6-Month ----- .234 Change (0-3 months) -.194 .081 Change (0-6 months) ----- .305*
Appearance Orientation Baseline -.087 .062 3-Month -.158 -.030 6-Month ----- .208 Change (0-3 months) -.127 -.131 Change (0-6 months) ----- .212
Fitness Evaluation Baseline -.157 -.195 3-Month -.287* -.182 6-Month ----- -.029 Change (0-3 months) -.203 -.004 Change (0-6 months) ----- .229
Fitness Orientation Baseline -.143 .127 3-Month .032 -.267 6-Month ----- .362* Change (0-3 months) -.007 .210 Change (0-6 months) ----- .337*
Health Evaluation Baseline .092 .250 3-Month -.029 .154 6-Month ----- .359* Change (0-3 months) -.140 -.095 Change (0-6 months) ----- .258
Health Orientation Baseline -.117 .163 3-Month -.063 .300* 6-Month ----- .356* Change (0-3 months) -.052 .142 Change (0-6 months) ----- .142
Illness Orientation Baseline -.231 -.048 3-Month -.145 .041 6-Month ----- .036 Change (0-3 months) .111 .116 Change (0-6 months) ----- .069
Body Areas Satisfaction Baseline -.037 .116 3-Month -.208 .239 6-Month ----- .412** Change (0-3 months) .073 .254 Change (0-6 months) ----- .495**
Self-Classified Weight Baseline .229 -.196 3-Month .915 .045 6-Month ----- .033 Change (0-3 months) -.189 .153 Change (0-6 months) ----- .120
Overweight Preoccupation Baseline .038 -.021 3-Month .084 -.028 6-Month ----- -.037 Change (0-3 months) .061 -.023 Change (0-6 months) ----- -.031
*p< 0.05, **p<0.01
105

APPENDIX I
Table 27. Correlations Between 3-and 6-Month Change in Physical Activity and Outcome Expectations and Barriers for Physical Activity
Correlation
3-Month Change in 6-Month Change in Psychosocial Variable Physical Activity Physical Activity
Exercise Beliefs Outcome Expectations (Benefits)
Baseline -.034 .069 3-Month .115 .110 6-Month ----- -.298* Change (0-3 months) .176 .046 Change (0-6 months) ----- .281
Psychological Baseline -.003 .061 3-Month .128 .107 6-Month ----- .209 Change (0-3 months) .170 .060 Change (0-6 months) ----- .147
Body Image
Baseline -.055 .091 3-Month -.016 .004 6-Month ----- .260 Change (0-3 months) .033 -.107 Change (0-6 months) ----- .192
Health
Baseline -.075 .013 3-Month .113 .124 6-Month ----- .317* Change (0-3 months) .147 .105 Change (0-6 months) ----- .264
Perceived Barriers Baseline .350** .161 3-Month .098 -.139 6-Month ----- -.430** Change (0-3 months) -.173 -.285* Change (0-6 months) ----- -.487**
Time Baseline .260* .148 3-Month .117 .000 6-Month ----- -.331* Change (0-3 months) -.100 -.134 Change (0-6 months) ----- -.377**
Effort
Baseline .254 .006 3-Month -.074 -.265 6-Month ----- -.391** Change (0-3 months) -.317* -.362* Change (0-6 months) ----- -.377**
Obstacles Baseline .262* .297* 3-Month .333* .097 6-Month ----- -.269 Change (0-3 months) .120 -.128 Change (0-6 months) ----- -.395**
*p< 0.05, **p<0.01
106

APPENDIX J
Table 28. Correlations Between 3-and 6-Month Change in Physical Activity and Physical Activity Self-Efficacy
Correlation
3-Month Change in 6-Month Change in Psychosocial Variable Physical Activity Physical Activity
Physical Activity Self-Efficacy: Tired
Baseline -.066 .109 3-Month .056 .191 6-Month ----- 345* Change (0-3 months) .196 .061 Change (0-6 months) ----- .238
Bad Mood Baseline -.023 .074 3-Month .015 .332* 6-Month ----- .339* Change (0-3 months) .135 .278 Change (0-6 months) ----- .263
Low on Time Baseline -.001 .022 3-Month .035 .230 6-Month ----- .361* Change (0-3 months) .169 .183 Change (0-6 months) ----- .246
On Vacation Baseline .008 .203 3-Month .133 .239 6-Month ----- .230 Change (0-3 months) .075 .005 Change (0-6 months) ----- .065
Bad Weather Baseline -.157 .016 3-Month .012 .239 6-Month ----- .295* Change (0-3 months) .038 .203* Change (0-6 months) ----- -.308
*p< 0.05, **p<0.01
107

BIBLIOGRAPHY
1. Clinical Guidelines on the Identification, Evaluation, and Treatment of Overweight and Obesity in Adults--The Evidence Report. National Institutes of Health. Obes Res. 6 Suppl 2:51S-209S, 1998.
2. The Diabetes Prevention Program (DPP): description of lifestyle intervention. Diabetes Care. 25:2165-2171, 2002.
3. Summary: weighing the options--criteria for evaluating weight-management programs. Committee to Develop Criteria for Evaluating the Outcomes of Approaches to Prevent and Treat Obesity Food and Nutrition Board, Institute of Medicine, National Academy of Sciences. J Am Diet Assoc. 95:96-105, 1995.
4. Allen, N. B., R. Chambers, and W. Knight. Mindfulness-based psychotherapies: a review of conceptual foundations, empirical evidence and practical considerations. Aust N Z J Psychiatry. 40:285-294, 2006.
5. Allison, D. B., K. R. Fontaine, S. Heshka, J. L. Mentore, and S. B. Heymsfield. Alternative treatments for weight loss: a critical review. Crit Rev Food Sci Nutr. 41:1-28; discussion 39-40, 2001.
6. Anderson, J. W., E. C. Konz, R. C. Frederich, and C. L. Wood. Long-term weight-loss maintenance: a meta-analysis of US studies. Am J Clin Nutr. 74:579-584, 2001.
7. Anderson, M. L., C. Foster, M. R. McGuigan, E. Seebach, and J. P. Porcari. Training vs. body image: does training improve subjective appearance ratings? J Strength Cond Res. 18:255-259, 2004.
8. Annesi, J. J. and W. L. Westcott. Relations of physical self-concept and muscular strength with resistance Exercise-induced Feeling State scores in older women. Percept Mot Skills. 104:183-190, 2007.
9. Apovian, C. M., C. M. Frey, J. Z. Rogers, E. A. McDermott, and G. L. Jensen. Body mass index and physical function in obese older women. J Am Geriatr Soc. 44:1487-1488, 1996.
10. Apovian, C. M., C. M. Frey, G. C. Wood, J. Z. Rogers, C. D. Still, and G. L. Jensen. Body mass index and physical function in older women. Obes Res. 10:740-747, 2002.
11. Baer, R. A. Mindfulness Training as a Clinical Intervention: A Conceptual and Empirical Review. Clinical Psychology: Science and Practice 10:125-143, 2003.
12. Baer, R. A., G. T. Smith, J. Hopkins, J. Krietemeyer, and L. Toney. Using self-report assessment methods to explore facets of mindfulness. Assessment. 13:27-45, 2006.
13. Bauman, A. E., J. F. Sallis, D. A. Dzewaltowski, and N. Owen. Toward a better understanding of the influences on physical activity: the role of determinants, correlates, causal variables, mediators, moderators, and confounders. Am J Prev Med. 23:5-14, 2002.
14. Berkel, L. A., W. S. Poston, R. S. Reeves, and J. P. Foreyt. Behavioral interventions for obesity. J Am Diet Assoc. 105:S35-43, 2005.
15. Bishop, S. R. What do we really know about mindfulness-based stress reduction? Psychosom Med. 64:71-83, 2002.
16. Block, G., M. Woods, A. Potosky, and C. Clifford. Validation of a self-administered diet history questionnaire using multiple diet records. J Clin Epidemiol. 43:1327-1335, 1990.
17. Blundell, J. E. and N. A. King. Physical activity and regulation of food intake: current evidence. Med Sci Sports Exerc. 31:S573-583, 1999.
108

18. Borg, P., K. Kukkonen-Harjula, M. Fogelholm, and M. Pasanen. Effects of walking or resistance training on weight loss maintenance in obese, middle-aged men: a randomized trial. Int J Obes Relat Metab Disord. 26:676-683, 2002.
19. Boutelle, K. N. and D. S. Kirschenbaum. Further support for consistent self-monitoring as a vital component of successful weight control. Obes Res. 6:219-224, 1998.
20. Brown, K. W. and R. M. Ryan. The benefits of being present: mindfulness and its role in psychological well-being. J Pers Soc Psychol. 84:822-848, 2003.
21. Brown, T. A., T. F. Cash, and P. J. Mikulka. Attitudinal body-image assessment: factor analysis of the Body-Self Relations Questionnaire. J Pers Assess. 55:135-144, 1990.
22. Bryant, E. J., N. A. King, and J. E. Blundell. Disinhibition: its effects on appetite and weight regulation. Obes Rev, 2007.
23. Byrne, S. M. Psychological aspects of weight maintenance and relapse in obesity. J Psychosom Res. 53:1029-1036, 2002.
24. Cargill, B. R., M. M. Clark, V. Pera, R. S. Niaura, and D. B. Abrams. Binge eating, body image, depression, and self-efficacy in an obese clinical population. Obes Res. 7:379-386, 1999.
25. Carlson, L. E., M. Speca, P. Faris, and K. D. Patel. One year pre-post intervention follow-up of psychological, immune, endocrine and blood pressure outcomes of mindfulness-based stress reduction (MBSR) in breast and prostate cancer outpatients. Brain Behav Immun. 21:1038-1049, 2007.
26. Cash, T. F. and K. Grasso. The norms and stability of new measures of the multidimensional body image construct. Body Image. 2:199-203, 2005.
27. Catenacci, V. A. and H. R. Wyatt. The role of physical activity in producing and maintaining weight loss. Nat Clin Pract Endocrinol Metab. 3:518-529, 2007.
28. Chatzisarantis, N. L. and M. S. Hagger. Mindfulness and the intention-behavior relationship within the theory of planned behavior. Pers Soc Psychol Bull. 33:663-676, 2007.
29. Clark, M. M., D. B. Abrams, R. S. Niaura, C. A. Eaton, and J. S. Rossi. Self-efficacy in weight management. J Consult Clin Psychol. 59:739-744, 1991.
30. Cooper, Z. and C. G. Fairburn. A new cognitive behavioural approach to the treatment of obesity. Behav Res Ther. 39:499-511, 2001.
31. Cummings, S., E. S. Parham, and G. W. Strain. Position of the American Dietetic Association: weight management. J Am Diet Assoc. 102:1145-1155, 2002.
32. Dansinger, M. L., A. Tatsioni, J. B. Wong, M. Chung, and E. M. Balk. Meta-analysis: the effect of dietary counseling for weight loss. Ann Intern Med. 147:41-50, 2007.
33. Deitel, M. The Surgeon-General's call to action to prevent an increase in overweight and obesity. Released Dec. 13, 2001. Obes Surg. 12:3-4, 2002.
34. Donnelly, J. E., T. Sharp, J. Houmard, M. G. Carlson, J. O. Hill, J. E. Whatley, and R. G. Israel. Muscle hypertrophy with large-scale weight loss and resistance training. Am J Clin Nutr. 58:561-565, 1993.
35. Donnelly, J. E., B. Smith, D. J. Jacobsen, E. Kirk, K. Dubose, M. Hyder, B. Bailey, and R. Washburn. The role of exercise for weight loss and maintenance. Best Pract Res Clin Gastroenterol. 18:1009-1029, 2004.
36. Edelman, D., E. Z. Oddone, R. S. Liebowitz, W. S. Yancy, Jr., M. K. Olsen, A. S. Jeffreys, S. D. Moon, A. C. Harris, L. L. Smith, R. E. Quillian-Wolever, and T. W.
109

Gaudet. A multidimensional integrative medicine intervention to improve cardiovascular risk. J Gen Intern Med. 21:728-734, 2006.
37. Elder, C., C. Ritenbaugh, S. Mist, M. Aickin, J. Schneider, H. Zwickey, and P. Elmer. Randomized trial of two mind-body interventions for weight-loss maintenance. J Altern Complement Med. 13:67-78, 2007.
38. Elfhag, K. and S. Rossner. Who succeeds in maintaining weight loss? A conceptual review of factors associated with weight loss maintenance and weight regain. Obes Rev. 6:67-85, 2005.
39. Finkelstein, E. A., C. J. Ruhm, and K. M. Kosa. Economic causes and consequences of obesity. Annu Rev Public Health. 26:239-257, 2005.
40. Fjeldstad, C., A. S. Fjeldstad, L. S. Acree, K. J. Nickel, and A. W. Gardner. The influence of obesity on falls and quality of life. Dyn Med. 7:4, 2008.
41. Flegal, K. M., B. I. Graubard, D. F. Williamson, and M. H. Gail. Excess deaths associated with underweight, overweight, and obesity. Jama. 293:1861-1867, 2005.
42. Foster, G. D., D. B. Sarwer, and T. A. Wadden. Psychological effects of weight cycling in obese persons: a review and research agenda. Obes Res. 5:474-488, 1997.
43. Foster, G. D., T. A. Wadden, R. M. Swain, A. J. Stunkard, P. Platte, and R. A. Vogt. The Eating Inventory in obese women: clinical correlates and relationship to weight loss. Int J Obes Relat Metab Disord. 22:778-785, 1998.
44. Gallagher, K. I., J. M. Jakicic, M. A. Napolitano, and B. H. Marcus. Psychosocial factors related to physical activity and weight loss in overweight women. Med Sci Sports Exerc. 38:971-980, 2006.
45. Garrow, J. S. and C. D. Summerbell. Meta-analysis: effect of exercise, with or without dieting, on the body composition of overweight subjects. Eur J Clin Nutr. 49:1-10, 1995.
46. Goss, F., R. Robertson, S. DaSilva, R. Suminski, J. Kang, and K. Metz. Ratings of perceived exertion and energy expenditure during light to moderate activity. Percept Mot Skills. 96:739-747, 2003.
47. Gregg, J. A., G. M. Callaghan, S. C. Hayes, and J. L. Glenn-Lawson. Improving diabetes self-management through acceptance, mindfulness, and values: a randomized controlled trial. J Consult Clin Psychol. 75:336-343, 2007.
48. Grossman, P., L. Niemann, S. Schmidt, and H. Walach. Mindfulness-based stress reduction and health benefits. A meta-analysis. J Psychosom Res. 57:35-43, 2004.
49. Hansen, D., P. Dendale, J. Berger, L. J. van Loon, and R. Meeusen. The effects of exercise training on fat-mass loss in obese patients during energy intake restriction. Sports Med. 37:31-46, 2007.
50. Haskell, W. L., I. M. Lee, R. R. Pate, K. E. Powell, S. N. Blair, B. A. Franklin, C. A. Macera, G. W. Heath, P. D. Thompson, and A. Bauman. Physical activity and public health: updated recommendation for adults from the American College of Sports Medicine and the American Heart Association. Circulation. 116:1081-1093, 2007.
51. Hays, N. P., G. P. Bathalon, M. A. McCrory, R. Roubenoff, R. Lipman, and S. B. Roberts. Eating behavior correlates of adult weight gain and obesity in healthy women aged 55-65 y. Am J Clin Nutr. 75:476-483, 2002.
52. Hays, N. P. and S. B. Roberts. Aspects of eating behaviors "disinhibition" and "restraint" are related to weight gain and BMI in women. Obesity (Silver Spring). 16:52-58, 2008.
110

53. Heymsfield, S. B., C. A. van Mierlo, H. C. van der Knaap, M. Heo, and H. I. Frier. Weight management using a meal replacement strategy: meta and pooling analysis from six studies. Int J Obes Relat Metab Disord. 27:537-549, 2003.
54. Hill, J. O. and H. R. Wyatt. Role of physical activity in preventing and treating obesity. J Appl Physiol. 99:765-770, 2005.
55. Hunter, G. R., N. M. Byrne, B. Sirikul, J. R. Fernandez, P. A. Zuckerman, B. E. Darnell, and B. A. Gower. Resistance Training Conserves Fat-free Mass and Resting Energy Expenditure Following Weight Loss. Obesity (Silver Spring), 2008.
56. Hunter, G. R., J. P. McCarthy, and M. M. Bamman. Effects of resistance training on older adults. Sports Med. 34:329-348, 2004.
57. Jakicic, J. M. The role of physical activity in prevention and treatment of body weight gain in adults. J Nutr. 132:3826S-3829S, 2002.
58. Jakicic, J. M., K. Clark, E. Coleman, J. E. Donnelly, J. Foreyt, E. Melanson, J. Volek, and S. L. Volpe. American College of Sports Medicine position stand. Appropriate intervention strategies for weight loss and prevention of weight regain for adults. Med Sci Sports Exerc. 33:2145-2156, 2001.
59. Jakicic, J. M. and A. D. Otto. Physical activity considerations for the treatment and prevention of obesity. Am J Clin Nutr. 82:226S-229S, 2005.
60. Jakicic, J. M. and A. D. Otto. Treatment and prevention of obesity: what is the role of exercise? Nutr Rev. 64:S57-61, 2006.
61. Jeffery, R. W., W. M. Bjornson-Benson, B. S. Rosenthal, R. A. Lindquist, C. L. Kurth, and S. L. Johnson. Correlates of weight loss and its maintenance over two years of follow-up among middle-aged men. Prev Med. 13:155-168, 1984.
62. Jeffery, R. W., A. Drewnowski, L. H. Epstein, A. J. Stunkard, G. T. Wilson, R. R. Wing, and D. R. Hill. Long-term maintenance of weight loss: current status. Health Psychol. 19:5-16, 2000.
63. Jia, H. and E. I. Lubetkin. The impact of obesity on health-related quality-of-life in the general adult US population. J Public Health (Oxf). 27:156-164, 2005.
64. Johnson, R. K. and E. Kennedy. The 2000 Dietary Guidelines for Americans: what are the changes and why were they made? The Dietary Guidelines Advisory Committee. J Am Diet Assoc. 100:769-774, 2000.
65. Kabat-Zinn, J. An outpatient program in behavioral medicine for chronic pain patients based on the practice of mindfulness meditation: theoretical considerations and preliminary results. Gen Hosp Psychiatry. 4:33-47, 1982.
66. Kabat-Zinn, J., L. Lipworth, and R. Burney. The clinical use of mindfulness meditation for the self-regulation of chronic pain. J Behav Med. 8:163-190, 1985.
67. Kim, J. Y., D. J. Oh, T. Y. Yoon, J. M. Choi, and B. K. Choe. The impacts of obesity on psychological well-being: a cross-sectional study about depressive mood and quality of life. J Prev Med Pub Health. 40:191-195, 2007.
68. King, A. C., W. L. Haskell, C. B. Taylor, H. C. Kraemer, and R. F. DeBusk. Group- vs home-based exercise training in healthy older men and women. A community-based clinical trial. Jama. 266:1535-1542, 1991.
69. Knowler, W. C., E. Barrett-Connor, S. E. Fowler, R. F. Hamman, J. M. Lachin, E. A. Walker, and D. M. Nathan. Reduction in the incidence of type 2 diabetes with lifestyle intervention or metformin. N Engl J Med. 346:393-403, 2002.
70. Kolotkin, R. L., K. Meter, and G. R. Williams. Quality of life and obesity. Obes Rev. 2:219-229, 2001.
111

71. Kottke, T. E., L. A. Wu, and R. S. Hoffman. Economic and psychological implications of the obesity epidemic. Mayo Clin Proc. 78:92-94, 2003.
72. Kraemer, W. J., J. S. Volek, K. L. Clark, S. E. Gordon, T. Incledon, S. M. Puhl, N. T. Triplett-McBride, J. M. McBride, M. Putukian, and W. J. Sebastianelli. Physiological adaptations to a weight-loss dietary regimen and exercise programs in women. J Appl Physiol. 83:270-279, 1997.
73. Kristeller, J. L., & Hallett, B. Effects of a meditation-based intervention in the treatment of binge eating. Journal of Health Psychology. 4:357-363, 1999.
74. Leermakers, E. A., M. G. Perri, C. L. Shigaki, and P. R. Fuller. Effects of exercise-focused versus weight-focused maintenance programs on the management of obesity. Addict Behav. 24:219-227, 1999.
75. Levinger, I., C. Goodman, D. L. Hare, G. Jerums, D. Toia, and S. Selig. The reliability of the 1RM strength test for untrained middle-aged individuals. J Sci Med Sport, 2007.
76. Levy, R. L., E. A. Finch, M. D. Crowell, N. J. Talley, and R. W. Jeffery. Behavioral intervention for the treatment of obesity: strategies and effectiveness data. Am J Gastroenterol. 102:2314-2321, 2007.
77. Lewis, B. A., B. H. Marcus, R. R. Pate, and A. L. Dunn. Psychosocial mediators of physical activity behavior among adults and children. Am J Prev Med. 23:26-35, 2002.
78. Maes, H. H., M. C. Neale, and L. J. Eaves. Genetic and environmental factors in relative body weight and human adiposity. Behav Genet. 27:325-351, 1997.
79. Marcus, B. H., V. C. Selby, R. S. Niaura, and J. S. Rossi. Self-efficacy and the stages of exercise behavior change. Res Q Exerc Sport. 63:60-66, 1992.
80. Marlatt, G. A. Mindfulness and metaphor in relapse prevention: an interview with G. Alan Marlatt. Interview by Deborah K. Shattuck. J Am Diet Assoc. 94:846-848, 1994.
81. Martin Ginis, K. A., J. J. Eng, K. P. Arbour, J. W. Hartman, and S. M. Phillips. Mind over muscle? Sex differences in the relationship between body image change and subjective and objective physical changes following a 12-week strength-training program. Body Image. 2:363-372, 2005.
82. Masheb, R. M. and C. M. Grilo. Emotional overeating and its associations with eating disorder psychopathology among overweight patients with binge eating disorder. Int J Eat Disord. 39:141-146, 2006.
83. Mikesky, A. E., R. Topp, J. K. Wigglesworth, D. M. Harsha, and J. E. Edwards. Efficacy of a home-based training program for older adults using elastic tubing. Eur J Appl Physiol Occup Physiol. 69:316-320, 1994.
84. Miller, J. J., K. Fletcher, and J. Kabat-Zinn. Three-year follow-up and clinical implications of a mindfulness meditation-based stress reduction intervention in the treatment of anxiety disorders. Gen Hosp Psychiatry. 17:192-200, 1995.
85. Miller, W. C., D. M. Koceja, and E. J. Hamilton. A meta-analysis of the past 25 years of weight loss research using diet, exercise or diet plus exercise intervention. Int J Obes Relat Metab Disord. 21:941-947, 1997.
86. O'Neil, P. M. and S. Rieder. Utility and validity of the eating behavior inventory in clinical obesity research: a review of the literature. Obes Rev. 6:209-216, 2005.
87. Ogden, C. L., M. D. Carroll, L. R. Curtin, M. A. McDowell, C. J. Tabak, and K. M. Flegal. Prevalence of overweight and obesity in the United States, 1999-2004. Jama. 295:1549-1555, 2006.
88. Ogden, C. L., S. Z. Yanovski, M. D. Carroll, and K. M. Flegal. The epidemiology of obesity. Gastroenterology. 132:2087-2102, 2007.
112

89. Olshansky, S. J., D. J. Passaro, R. C. Hershow, J. Layden, B. A. Carnes, J. Brody, L. Hayflick, R. N. Butler, D. B. Allison, and D. S. Ludwig. A potential decline in life expectancy in the United States in the 21st century. N Engl J Med. 352:1138-1145, 2005.
90. Paffenbarger, R. S., Jr., S. N. Blair, I. M. Lee, and R. T. Hyde. Measurement of physical activity to assess health effects in free-living populations. Med Sci Sports Exerc. 25:60-70, 1993.
91. Paffenbarger, R. S., Jr., R. T. Hyde, A. L. Wing, and C. C. Hsieh. Physical activity, all-cause mortality, and longevity of college alumni. N Engl J Med. 314:605-613, 1986.
92. Palmeira, A. L., P. J. Teixeira, T. L. Branco, S. S. Martins, C. S. Minderico, J. T. Barata, S. O. Serpa, and L. B. Sardinha. Predicting short-term weight loss using four leading health behavior change theories. Int J Behav Nutr Phys Act. 4:14, 2007.
93. Phelan, S., J. O. Hill, W. Lang, J. R. Dibello, and R. R. Wing. Recovery from relapse among successful weight maintainers. Am J Clin Nutr. 78:1079-1084, 2003.
94. Pi-Sunyer, F. X. The obesity epidemic: pathophysiology and consequences of obesity. Obes Res. 10 Suppl 2:97S-104S, 2002.
95. Pi-Sunyer, F. X. A review of long-term studies evaluating the efficacy of weight loss in ameliorating disorders associated with obesity. Clin Ther. 18:1006-1035; discussion 1005, 1996.
96. Pi-Sunyer, X., G. Blackburn, F. L. Brancati, G. A. Bray, R. Bright, J. M. Clark, J. M. Curtis, M. A. Espeland, J. P. Foreyt, K. Graves, S. M. Haffner, B. Harrison, J. O. Hill, E. S. Horton, J. Jakicic, R. W. Jeffery, K. C. Johnson, S. Kahn, D. E. Kelley, A. E. Kitabchi, W. C. Knowler, C. E. Lewis, B. J. Maschak-Carey, B. Montgomery, D. M. Nathan, J. Patricio, A. Peters, J. B. Redmon, R. S. Reeves, D. H. Ryan, M. Safford, B. Van Dorsten, T. A. Wadden, L. Wagenknecht, J. Wesche-Thobaben, R. R. Wing, and S. Z. Yanovski. Reduction in weight and cardiovascular disease risk factors in individuals with type 2 diabetes: one-year results of the look AHEAD trial. Diabetes Care. 30:1374-1383, 2007.
97. Pinaquy, S., H. Chabrol, C. Simon, J. P. Louvet, and P. Barbe. Emotional eating, alexithymia, and binge-eating disorder in obese women. Obes Res. 11:195-201, 2003.
98. Pittler, M. H. and E. Ernst. Complementary therapies for reducing body weight: a systematic review. Int J Obes (Lond). 29:1030-1038, 2005.
99. Pollock, M. L., B. A. Franklin, G. J. Balady, B. L. Chaitman, J. L. Fleg, B. Fletcher, M. Limacher, I. L. Pina, R. A. Stein, M. Williams, and T. Bazzarre. AHA Science Advisory. Resistance exercise in individuals with and without cardiovascular disease: benefits, rationale, safety, and prescription: An advisory from the Committee on Exercise, Rehabilitation, and Prevention, Council on Clinical Cardiology, American Heart Association; Position paper endorsed by the American College of Sports Medicine. Circulation. 101:828-833, 2000.
100. Powell, L. H., J. E. Calvin, 3rd, and J. E. Calvin, Jr. Effective obesity treatments. Am Psychol. 62:234-246, 2007.
101. Ratner, R. E. An update on the Diabetes Prevention Program. Endocr Pract. 12 Suppl 1:20-24, 2006.
102. Reel, J. J., C. Greenleaf, W. K. Baker, S. Aragon, D. Bishop, C. Cachaper, P. Handwerk, J. Locicero, L. Rathburn, W. K. Reid, and J. Hattie. Relations of body concerns and exercise behavior: a meta-analysis. Psychol Rep. 101:927-942, 2007.
113

103. Renjilian, D. A., M. G. Perri, A. M. Nezu, W. F. McKelvey, R. L. Shermer, and S. D. Anton. Individual versus group therapy for obesity: effects of matching participants to their treatment preferences. J Consult Clin Psychol. 69:717-721, 2001.
104. Roach, J. B., M. K. Yadrick, J. T. Johnson, L. J. Boudreaux, W. A. Forsythe, 3rd, and W. Billon. Using self-efficacy to predict weight loss among young adults. J Am Diet Assoc. 103:1357-1359, 2003.
105. Robertson, R. J., F. L. Goss, J. Rutkowski, B. Lenz, C. Dixon, J. Timmer, K. Frazee, J. Dube, and J. Andreacci. Concurrent validation of the OMNI perceived exertion scale for resistance exercise. Med Sci Sports Exerc. 35:333-341, 2003.
106. Roux, L., K. M. Kuntz, C. Donaldson, and S. J. Goldie. Economic evaluation of weight loss interventions in overweight and obese women. Obesity (Silver Spring). 14:1093-1106, 2006.
107. Runge, C. F. Economic consequences of the obese. Diabetes. 56:2668-2672, 2007. 108. Schoeller, D. A. How accurate is self-reported dietary energy intake? Nutr Rev.
48:373-379, 1990. 109. Schoeller, D. A., K. Shay, and R. F. Kushner. How much physical activity is needed to
minimize weight gain in previously obese women? Am J Clin Nutr. 66:551-556, 1997. 110. Segal, K. R., B. Gutin, E. Presta, J. Wang, and T. B. Van Itallie. Estimation of human
body composition by electrical impedance methods: a comparative study. J Appl Physiol. 58:1565-1571, 1985.
111. Shapiro, S. L., L. E. Carlson, J. A. Astin, and B. Freedman. Mechanisms of mindfulness. J Clin Psychol. 62:373-386, 2006.
112. Sharpe, P. A., H. M. Blanck, J. E. Williams, B. E. Ainsworth, and J. M. Conway. Use of complementary and alternative medicine for weight control in the United States. J Altern Complement Med. 13:217-222, 2007.
113. Singh, N. N., G. E. Lancioni, A. N. Singh, A. S. Winton, J. Singh, K. M. McAleavey, and A. D. Adkins. A Mindfulness-Based Health Wellness Program for an Adolescent With Prader-Willi Syndrome. Behav Modif. 32:167-181, 2008.
114. Steinhardt, M. A. and R. K. Dishman. Reliability and validity of expected outcomes and barriers for habitual physical activity. J Occup Med. 31:536-546, 1989.
115. Strine, T. W., A. H. Mokdad, S. R. Dube, L. S. Balluz, O. Gonzalez, J. T. Berry, R. Manderscheid, and K. Kroenke. The association of depression and anxiety with obesity and unhealthy behaviors among community-dwelling US adults. Gen Hosp Psychiatry. 30:127-137, 2008.
116. Stunkard, A. J. and S. Messick. The three-factor eating questionnaire to measure dietary restraint, disinhibition and hunger. J Psychosom Res. 29:71-83, 1985.
117. Subar, A. F., F. E. Thompson, V. Kipnis, D. Midthune, P. Hurwitz, S. McNutt, A. McIntosh, and S. Rosenfeld. Comparative validation of the Block, Willett, and National Cancer Institute food frequency questionnaires : the Eating at America's Table Study. Am J Epidemiol. 154:1089-1099, 2001.
118. Sweeney, M. E., J. O. Hill, P. A. Heller, R. Baney, and M. DiGirolamo. Severe vs moderate energy restriction with and without exercise in the treatment of obesity: efficiency of weight loss. Am J Clin Nutr. 57:127-134, 1993.
119. Teixeira, P. J., S. B. Going, L. B. Houtkooper, E. C. Cussler, L. L. Metcalfe, R. M. Blew, L. B. Sardinha, and T. G. Lohman. Exercise motivation, eating, and body image variables as predictors of weight control. Med Sci Sports Exerc. 38:179-188, 2006.
120. Teixeira, P. J., S. B. Going, L. B. Houtkooper, E. C. Cussler, L. L. Metcalfe, R. M. Blew, L. B. Sardinha, and T. G. Lohman. Pretreatment predictors of attrition and
114

successful weight management in women. Int J Obes Relat Metab Disord. 28:1124-1133, 2004.
121. Teixeira, P. J., S. B. Going, L. B. Sardinha, and T. G. Lohman. A review of psychosocial pre-treatment predictors of weight control. Obes Rev. 6:43-65, 2005.
122. Tsuzuku, S., T. Kajioka, H. Endo, R. D. Abbott, J. D. Curb, and K. Yano. Favorable effects of non-instrumental resistance training on fat distribution and metabolic profiles in healthy elderly people. Eur J Appl Physiol. 99:549-555, 2007.
123. Tucker, L. A. and R. Mortell. Comparison of the effects of walking and weight training programs on body image in middle-aged women: an experimental study. Am J Health Promot. 8:34-42, 1993.
124. Wadden, T. A. Treatment of obesity by moderate and severe caloric restriction. Results of clinical research trials. Ann Intern Med. 119:688-693, 1993.
125. Wadden, T. A., M. L. Butryn, and K. J. Byrne. Efficacy of lifestyle modification for long-term weight control. Obes Res. 12 Suppl:151S-162S, 2004.
126. Wadden, T. A., M. L. Butryn, and C. Wilson. Lifestyle modification for the management of obesity. Gastroenterology. 132:2226-2238, 2007.
127. Wadden, T. A., C. E. Crerand, and J. Brock. Behavioral treatment of obesity. Psychiatr Clin North Am. 28:151-170, ix, 2005.
128. Wadden, T. A. and D. L. Frey. A multicenter evaluation of a proprietary weight loss program for the treatment of marked obesity: a five-year follow-up. Int J Eat Disord. 22:203-212, 1997.
129. Wadden, T. A. and A. J. Stunkard. Social and psychological consequences of obesity. Ann Intern Med. 103:1062-1067, 1985.
130. Wadden, T. A., R. A. Vogt, R. E. Andersen, S. J. Bartlett, G. D. Foster, R. H. Kuehnel, J. Wilk, R. Weinstock, P. Buckenmeyer, R. I. Berkowitz, and S. N. Steen. Exercise in the treatment of obesity: effects of four interventions on body composition, resting energy expenditure, appetite, and mood. J Consult Clin Psychol. 65:269-277, 1997.
131. Wadden, T. A., D. S. West, L. Delahanty, J. Jakicic, J. Rejeski, D. Williamson, R. I. Berkowitz, D. E. Kelley, C. Tomchee, J. O. Hill, and S. Kumanyika. The Look AHEAD study: a description of the lifestyle intervention and the evidence supporting it. Obesity (Silver Spring). 14:737-752, 2006.
132. Warziski, M. T., S. M. Sereika, M. A. Styn, E. Music, and L. E. Burke. Changes in self-efficacy and dietary adherence: the impact on weight loss in the PREFER study. J Behav Med, 2007.
133. Westerterp, K. R. and A. H. Goris. Validity of the assessment of dietary intake: problems of misreporting. Curr Opin Clin Nutr Metab Care. 5:489-493, 2002.
134. Williams, P. A. and T. F. Cash. Effects of a circuit weight training program on the body images of college students. Int J Eat Disord. 30:75-82, 2001.
135. Wing, R. R. Behavioral interventions for obesity: recognizing our progress and future challenges. Obes Res. 11 Suppl:3S-6S, 2003.
136. Wing, R. R. Physical activity in the treatment of the adulthood overweight and obesity: current evidence and research issues. Med Sci Sports Exerc. 31:S547-552, 1999.
137. Wing, R. R. and S. Phelan. Long-term weight loss maintenance. Am J Clin Nutr. 82:222S-225S, 2005.
138. Wing, R. R., D. F. Tate, A. A. Gorin, H. A. Raynor, and J. L. Fava. A self-regulation program for maintenance of weight loss. N Engl J Med. 355:1563-1571, 2006.
115

139. Wyatt, S. B., K. P. Winters, and P. M. Dubbert. Overweight and obesity: prevalence, consequences, and causes of a growing public health problem. Am J Med Sci. 331:166-174, 2006.
140. Yanovski, S. Z. Binge eating disorder and obesity in 2003: could treating an eating disorder have a positive effect on the obesity epidemic? Int J Eat Disord. 34 Suppl:S117-120, 2003.
116