effect of mineral admixtures and aggregate natures on the ... · pdf filej. mater. environ....
TRANSCRIPT
J. Mater. Environ. Sci. 7 (7) (2016) 2617-2628 Biskri et al.
ISSN : 2028-2508
CODEN: JMESC
2617
Effect of mineral admixtures and aggregate natures on the behavior of high
performance concrete
Y. Biskri 1, *
, D. Achoura1, N. Chelghoum
1, R. Jauberthie
2
1Laboratoire de Matériaux, Géomatériaux et Environnement, Université de Badji Mokhtar Annaba, B.P. 12, Annaba
23000, Algeria. 2 Laboratoire GCGM, INSA de Rennes, Rennes, France.
Received 23Sep 2015, Revised 06 May 2016, Accepted 10 May 2016
*Corresponding author. E-mail: [email protected]; Tel: (+213659472337)
Abstract
This paper presents the results of an experimental investigation carried out to evaluate the effectiveness of
various types of coarse aggregates and mineral admixtures on properties of high performance concrete (HPC).
For this purpose, three different coarse aggregate types (crystalline, pure and marl limestone) were used to
produce HPC containing ground granulated blast-furnace slag (GGBFS) or silica fume mineral admixtures. The
water to binder ratio is maintained at 0.27 for all mixtures. The different mixtures were tested for mechanical
strength at different ages, while durability measurements such capillary absorption was also carried out.The
experimental results showed that the production of HPC using limestone aggregate is therefore possible. The use
of the Algerian blast furnace slag showed to be a good solution in terms of the material performance and it may
offer a new approach to the valorization of this material in civil engineering construction. The GGBFS fillers
contribute to improve the compactness of concretes and provide a relatively slow chemical activity. The
microstructure analysis confirms all these findings.
Key words: High performance concrete, Blast furnace slag, silica fume, Mechanical behavior, aggregate’s nature.
1. Introduction
High performance concretes (HPC) are a new material largely used in the present time in civil engineering
structures [1]. These concretes are obtained by the combination of mineral admixtures and Superplasticizer
which increase the compressive strength more than 60 MPa and also improve workability and durability [2,
3].Different types of mineral admixture are available (silica fume, fly ash, blast furnace slag. . .). The use of
GGBFS in the manufacture of HPC is a new step forward in sustainable building construction. It offers the
benefits of economical, technical and ecological considerations [4, 5]. GGBFS is interesting for its strength
performance and its competitive price [6].In literature review, GGBFS was used as chemical addition in HPC
with a proportion of 10 to 20% weight of binder[1]. The proportion may vary depending on climate and
environmental conditions. Also, silica fume (SF) is generally used together with a superplasticizer to control the
workability [7, 8]. It enhances the early ages as well as the long-term properties of concrete .Taking in account
cost and benefits; the optimum amount of silica fume is often 10% of binder mass [9].
In HPC formulations, aggregates by their high mass and volume fraction play a major role in the macroscopic
behavior [10]. Strength, mineralogy, morphology and particle size distribution are the parameters involved in
the choice of aggregates to obtain concrete with good characteristics [11]. The aggregate’s nature influences the
quality of the interfacial transition zone (ITZ). Limestone aggregates which are reactive have the strongest
bonds with the cement paste due to the chemical reactions that occur over time and increase the adhesion forces
[10, 12].

J. Mater. Environ. Sci. 7 (7) (2016) 2617-2628 Biskri et al.
ISSN : 2028-2508
CODEN: JMESC
2618
The aim was two folds: the first is economic concerned the recovery of granulated blast furnace slag from EL
HADJAR by total replacement of silica fume in order to recommend an economical and sustainable solution to
use the GGBFS in the formulation of HPC. The second is technique concerned a physico-mechanico and
microstructural characterization in order to develop a HPC equivalent using local materials
2. Materials and experimental work
2.1. Binders
The binders include the Algerian Portland cements CEM II 42.5/A according to Algerian standard NA 442 [13]
and two mineral admixtures. These were commercial silica fume (SF) according to NF EN 13263-1 [14] and the
Algerian blast furnace slag (GGBFS). The glass content of Algerian slags is greater than 93% and therefore has
a relatively slow hydraulic activity [6]. Table 1 describes the various properties of cement and mineral
admixtures.
Table 1: Properties of cement and mineral admixtures.
2.2. Aggregates
Four different size fractions as 0/2 mm fine siliceous sand(SS), 1.25/5 mm crystalline limestone crushed sand
(CLS), pure limestone crushed sand (PLS) and marl limestone crushed sand (MLS), 5/12, 5 mm and 12, 5/20
mm crystalline limestone gravel (CL), pure limestone gravel (PL) and marl limestone gravel (ML) of aggregates
were used. Fig.1 shows the morphology of aggregates used and the fig .2 shows the particle size analysis of this
aggregates.
The Chemical composition and physical properties of aggregates are shown in Tables 2 and 3. Physical
properties were determined at University Civil Engineering laboratory and conducted according the European
standard EN 12 620 [15]and the Los Angeles fragmentation coefficient LA determined according to standard
NF-EN-1097-2 [16].
Chemical composition (%)
Component (%) Cement Silica fume Blast furnace slag
Silicon dioxide (SiO2) 21.91 99.01 34.41
Aluminum oxide (Al2O3) 5.19 0.03 8.17
Ferric oxide (Fe2O3) 2.94 0.05 4.15
Calcium oxide (CaO) 60.41 0.02 40.69
Magnesium oxide (MgO) 1.60 0.01 4.56
Sodium oxide (Na2O) 0.16 0.04 0.10
Potassium oxide (K2O) - 0.15 0.89
Sulfur trioxide (SO3) 2.19 0.001 0.36
Cl- 0.02 0.009 0.01
Loss on ignition 3.83 - -
Physical properties
Fineness (cm2/g) 3480 5000 3800
Bulk density (g/cm3) 1.020 0.5 1.22
Absolute density (g/cm3) 3.10 2.24 2.91
Mechanical properties
Pozzolanic activity index 7 day - 1.05 0.88
Pozzolanic activity index 28 day - 1.14 1.13

J. Mater. Environ. Sci. 7 (7) (2016) 2617-2628 Biskri et al.
ISSN : 2028-2508
CODEN: JMESC
2619
Figure 2: Particle size analysis of aggregates.
Table 2:Chemical composition of aggregates.
0
10
20
30
40
50
60
70
80
90
100
0
0.0
8
0.1
25
0.2
0.3
15
0.6
3
1.2
5 2
2.5
3.1
5 5 8
10
12.5 16
20
25
Ta
mis
at
(%)
size sieve (mm)
Siliceouse sand Crushed sand
Gravel 5/12.5 Gravel 12.5/20
Figure 1: Morphology of aggregates used:A) Crystalline limestone, B) Pure limestone, and C) Marly limestone.
Chemical composition (%) PL CL ML SS
Silicon dioxide (SiO2) 0.40 0.30 3.2 93.88
Aluminum oxide (Al2O3) 0.11 0.44 1.3 2.13
Ferric oxide (Fe2O3) 0.06 0.29 0.30 1.60
Calcium oxide (CaO) 55.91 53 49.6 0.43
Magnesium oxide (MgO) 0.18 1.6 1.4 0.12
Sodium oxide (Na2O) 0.05 0.1 0.2 0.24
Potassium oxide (K2O) - 0.3 0.3 0.38
Sulfur trioxide (SO3) 0.04 - - 0.39
Tio2 - - - 0.13
P2o5 - - - 0.03
Loss on ignition 42.3 42.9 42.2 0.67
A B C
J. Mater. Environ. Sci. 7 (7) (2016) 2617-2628 Biskri et al.
ISSN : 2028-2508
CODEN: JMESC
2620
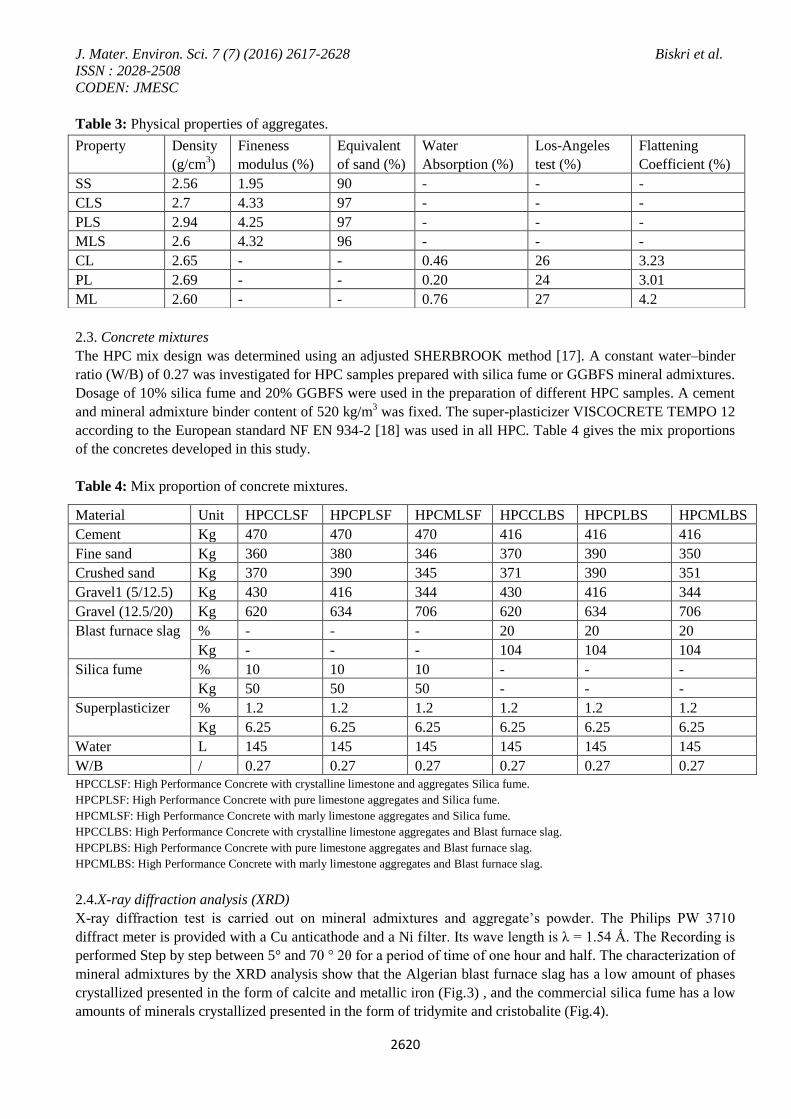
Table 3: Physical properties of aggregates.
2.3. Concrete mixtures
The HPC mix design was determined using an adjusted SHERBROOK method [17]. A constant water–binder
ratio (W/B) of 0.27 was investigated for HPC samples prepared with silica fume or GGBFS mineral admixtures.
Dosage of 10% silica fume and 20% GGBFS were used in the preparation of different HPC samples. A cement
and mineral admixture binder content of 520 kg/m3 was fixed. The super-plasticizer VISCOCRETE TEMPO 12
according to the European standard NF EN 934-2 [18] was used in all HPC. Table 4 gives the mix proportions
of the concretes developed in this study.
Table 4: Mix proportion of concrete mixtures.
HPCCLSF: High Performance Concrete with crystalline limestone and aggregates Silica fume.
HPCPLSF: High Performance Concrete with pure limestone aggregates and Silica fume.
HPCMLSF: High Performance Concrete with marly limestone aggregates and Silica fume.
HPCCLBS: High Performance Concrete with crystalline limestone aggregates and Blast furnace slag.
HPCPLBS: High Performance Concrete with pure limestone aggregates and Blast furnace slag.
HPCMLBS: High Performance Concrete with marly limestone aggregates and Blast furnace slag.
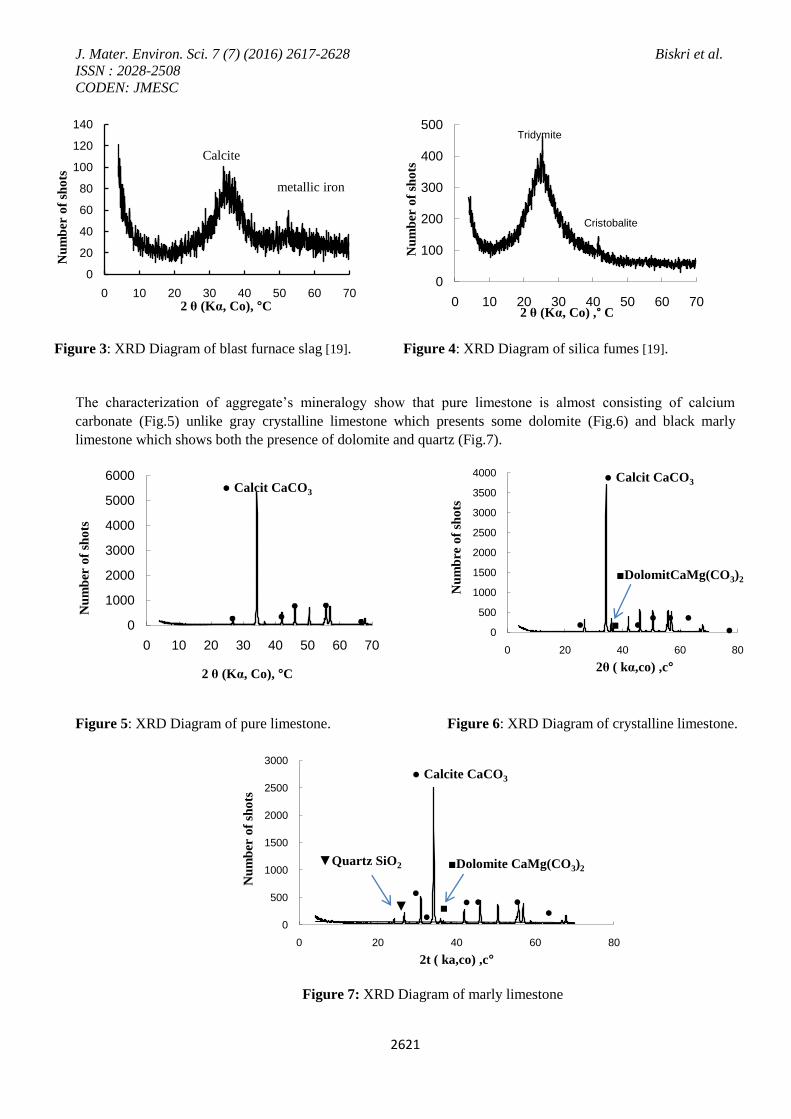
2.4.X-ray diffraction analysis (XRD)
X-ray diffraction test is carried out on mineral admixtures and aggregate’s powder. The Philips PW 3710
diffract meter is provided with a Cu anticathode and a Ni filter. Its wave length is λ = 1.54 Å. The Recording is
performed Step by step between 5° and 70 ° 2θ for a period of time of one hour and half. The characterization of
mineral admixtures by the XRD analysis show that the Algerian blast furnace slag has a low amount of phases
crystallized presented in the form of calcite and metallic iron (Fig.3) , and the commercial silica fume has a low
amounts of minerals crystallized presented in the form of tridymite and cristobalite (Fig.4).
Property Density
(g/cm3)
Fineness
modulus (%)
Equivalent
of sand (%)
Water
Absorption (%)
Los-Angeles
test (%)
Flattening
Coefficient (%)
SS 2.56 1.95 90 - - -
CLS 2.7 4.33 97 - - -
PLS 2.94 4.25 97 - - -
MLS 2.6 4.32 96 - - -
CL 2.65 - - 0.46 26 3.23
PL 2.69 - - 0.20 24 3.01
ML 2.60 - - 0.76 27 4.2
Material Unit HPCCLSF HPCPLSF HPCMLSF HPCCLBS HPCPLBS HPCMLBS
Cement Kg 470 470 470 416 416 416
Fine sand Kg 360 380 346 370 390 350
Crushed sand Kg 370 390 345 371 390 351
Gravel1 (5/12.5) Kg 430 416 344 430 416 344
Gravel (12.5/20) Kg 620 634 706 620 634 706
Blast furnace slag % - - - 20 20 20
Kg - - - 104 104 104
Silica fume % 10 10 10 - - -
Kg 50 50 50 - - -
Superplasticizer % 1.2 1.2 1.2 1.2 1.2 1.2
Kg 6.25 6.25 6.25 6.25 6.25 6.25
Water L 145 145 145 145 145 145
W/B / 0.27 0.27 0.27 0.27 0.27 0.27
J. Mater. Environ. Sci. 7 (7) (2016) 2617-2628 Biskri et al.
ISSN : 2028-2508
CODEN: JMESC
2621
Figure 3: XRD Diagram of blast furnace slag [19]. Figure 4: XRD Diagram of silica fumes [19].
The characterization of aggregate’s mineralogy show that pure limestone is almost consisting of calcium
carbonate (Fig.5) unlike gray crystalline limestone which presents some dolomite (Fig.6) and black marly
limestone which shows both the presence of dolomite and quartz (Fig.7).
Figure 5: XRD Diagram of pure limestone. Figure 6: XRD Diagram of crystalline limestone.
Figure 7: XRD Diagram of marly limestone
0
20
40
60
80
100
120
140
0 10 20 30 40 50 60 70
Nu
mb
er o
f sh
ots
2 θ (Kα, Co), °C
Calcite
metallic iron
0
100
200
300
400
500
0 10 20 30 40 50 60 70
Nu
mb
er o
f sh
ots
2 θ (Kα, Co) ,° C
Tridymite
Cristobalite
0
1000
2000
3000
4000
5000
6000
0 10 20 30 40 50 60 70
Nu
mb
er o
f sh
ots
2 θ (Kα, Co), °C
● Calcit CaCO3
0
500
1000
1500
2000
2500
3000
3500
4000
0 20 40 60 80
Nu
mb
re o
f sh
ots
2θ ( kα,co) ,c°
●
● Calcit CaCO3
●● ● ●
●■
■DolomitCaMg(CO3)2
0
500
1000
1500
2000
2500
3000
0 20 40 60 80
Nu
mb
er o
f sh
ots
2t ( ka,co) ,c°
● Calcite CaCO3
▼●
▼Quartz SiO2
●■ ● ● ●
●
■Dolomite CaMg(CO3)2
J. Mater. Environ. Sci. 7 (7) (2016) 2617-2628 Biskri et al.
ISSN : 2028-2508
CODEN: JMESC
2622
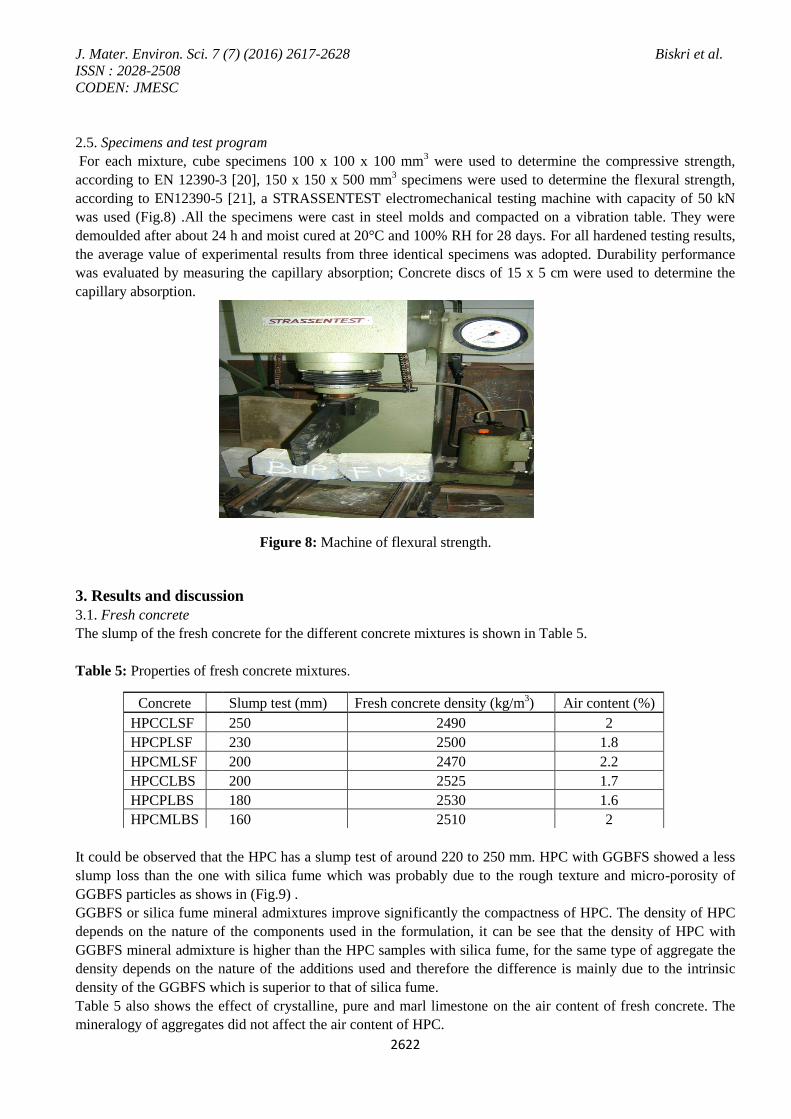
2.5. Specimens and test program
For each mixture, cube specimens 100 x 100 x 100 mm3 were used to determine the compressive strength,
according to EN 12390-3 [20], 150 x 150 x 500 mm3 specimens were used to determine the flexural strength,
according to EN12390-5 [21], a STRASSENTEST electromechanical testing machine with capacity of 50 kN
was used (Fig.8) .All the specimens were cast in steel molds and compacted on a vibration table. They were
demoulded after about 24 h and moist cured at 20°C and 100% RH for 28 days. For all hardened testing results,
the average value of experimental results from three identical specimens was adopted. Durability performance
was evaluated by measuring the capillary absorption; Concrete discs of 15 x 5 cm were used to determine the
capillary absorption.
Figure 8: Machine of flexural strength.
3. Results and discussion
3.1. Fresh concrete
The slump of the fresh concrete for the different concrete mixtures is shown in Table 5.
Table 5: Properties of fresh concrete mixtures.
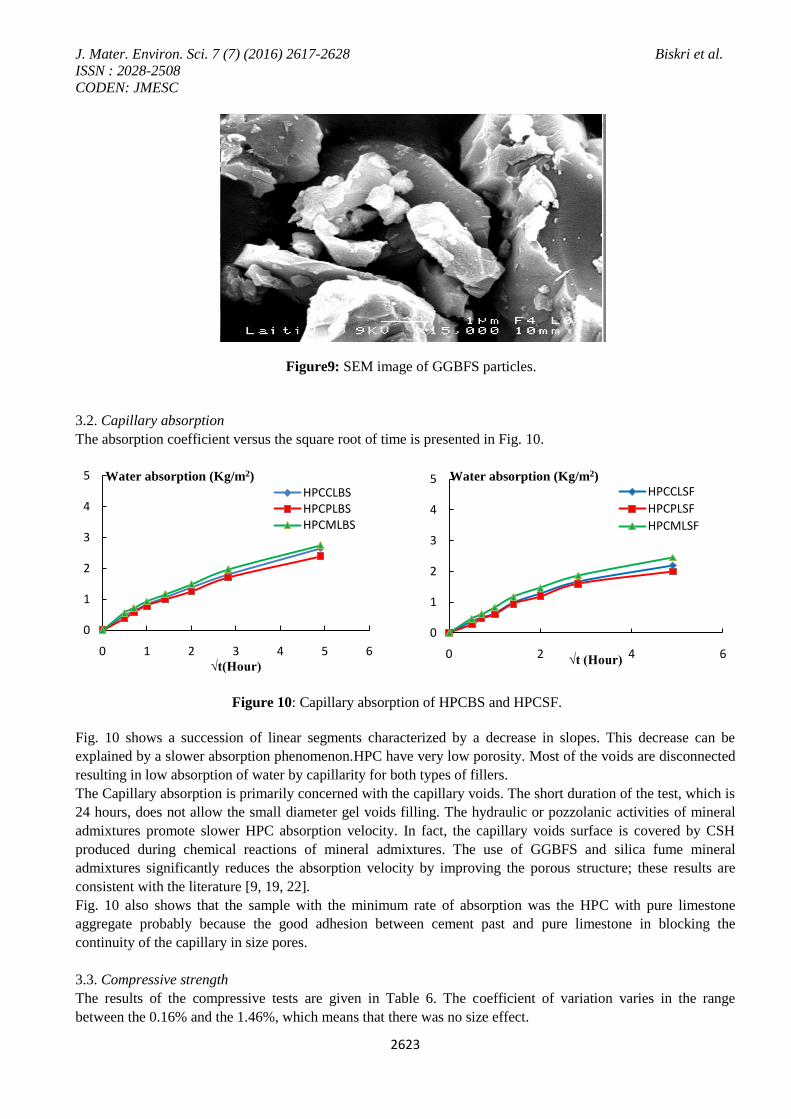
It could be observed that the HPC has a slump test of around 220 to 250 mm. HPC with GGBFS showed a less
slump loss than the one with silica fume which was probably due to the rough texture and micro-porosity of
GGBFS particles as shows in (Fig.9) .
GGBFS or silica fume mineral admixtures improve significantly the compactness of HPC. The density of HPC
depends on the nature of the components used in the formulation, it can be see that the density of HPC with
GGBFS mineral admixture is higher than the HPC samples with silica fume, for the same type of aggregate the
density depends on the nature of the additions used and therefore the difference is mainly due to the intrinsic
density of the GGBFS which is superior to that of silica fume.
Table 5 also shows the effect of crystalline, pure and marl limestone on the air content of fresh concrete. The
mineralogy of aggregates did not affect the air content of HPC.
Concrete Slump test (mm) Fresh concrete density (kg/m3) Air content (%)
HPCCLSF 250 2490 2
HPCPLSF 230 2500 1.8
HPCMLSF 200 2470 2.2
HPCCLBS 200 2525 1.7
HPCPLBS 180 2530 1.6
HPCMLBS 160 2510 2
J. Mater. Environ. Sci. 7 (7) (2016) 2617-2628 Biskri et al.
ISSN : 2028-2508
CODEN: JMESC
2623
Figure9: SEM image of GGBFS particles.
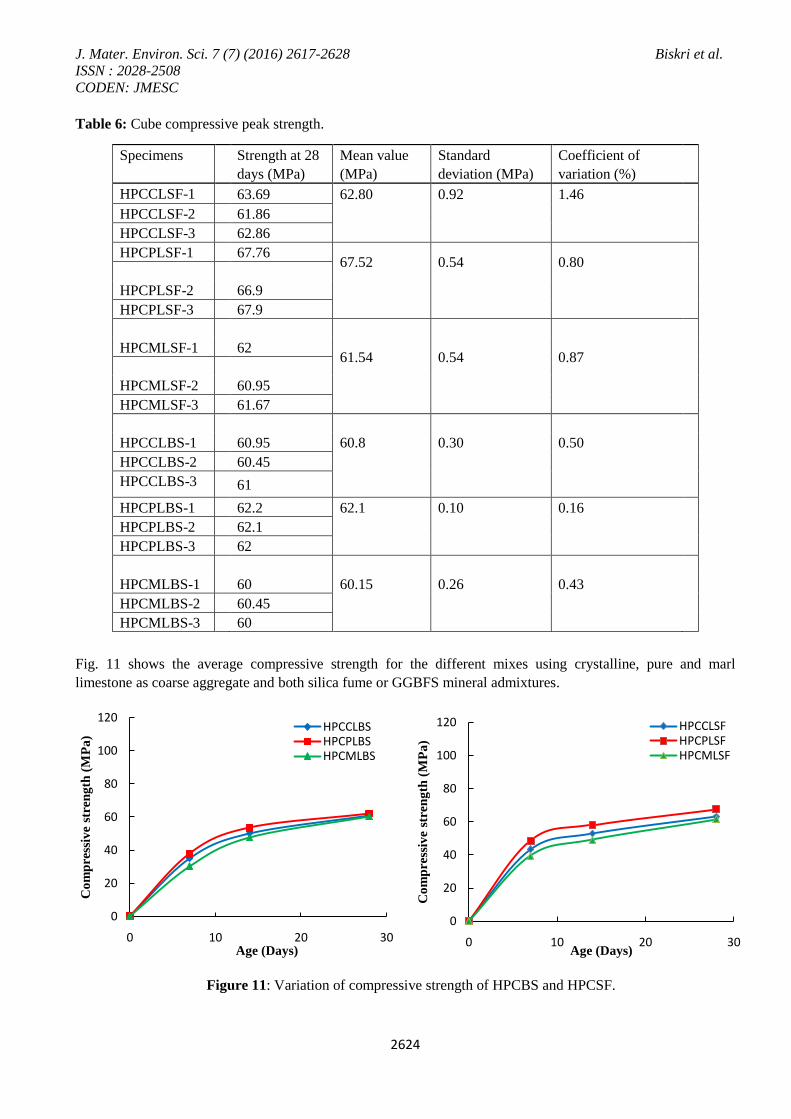
3.2. Capillary absorption
The absorption coefficient versus the square root of time is presented in Fig. 10.
Figure 10: Capillary absorption of HPCBS and HPCSF.
Fig. 10 shows a succession of linear segments characterized by a decrease in slopes. This decrease can be
explained by a slower absorption phenomenon.HPC have very low porosity. Most of the voids are disconnected
resulting in low absorption of water by capillarity for both types of fillers.
The Capillary absorption is primarily concerned with the capillary voids. The short duration of the test, which is
24 hours, does not allow the small diameter gel voids filling. The hydraulic or pozzolanic activities of mineral
admixtures promote slower HPC absorption velocity. In fact, the capillary voids surface is covered by CSH
produced during chemical reactions of mineral admixtures. The use of GGBFS and silica fume mineral
admixtures significantly reduces the absorption velocity by improving the porous structure; these results are
consistent with the literature [9, 19, 22].
Fig. 10 also shows that the sample with the minimum rate of absorption was the HPC with pure limestone
aggregate probably because the good adhesion between cement past and pure limestone in blocking the
continuity of the capillary in size pores.
3.3. Compressive strength
The results of the compressive tests are given in Table 6. The coefficient of variation varies in the range
between the 0.16% and the 1.46%, which means that there was no size effect.
0
1
2
3
4
5
0 1 2 3 4 5 6√t(Hour)
Water absorption (Kg/m2)
HPCCLBSHPCPLBSHPCMLBS
0
1
2
3
4
5
0 2 4 6√t (Hour)
Water absorption (Kg/m2)
HPCCLSF
HPCPLSF
HPCMLSF
J. Mater. Environ. Sci. 7 (7) (2016) 2617-2628 Biskri et al.
ISSN : 2028-2508
CODEN: JMESC
2624
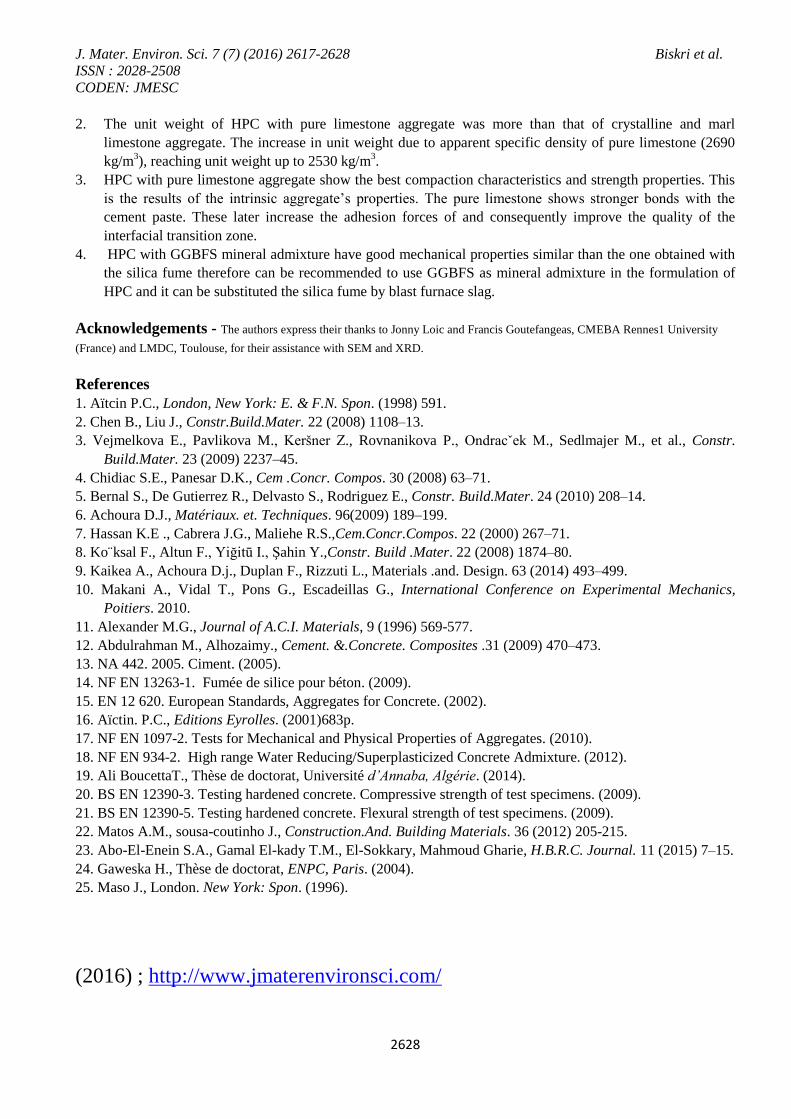
Table 6: Cube compressive peak strength.
Fig. 11 shows the average compressive strength for the different mixes using crystalline, pure and marl
limestone as coarse aggregate and both silica fume or GGBFS mineral admixtures.
Figure 11: Variation of compressive strength of HPCBS and HPCSF.
0
20
40
60
80
100
120
0 10 20 30
Co
mp
ress
ive
stre
ng
th (
MP
a)
Age (Days)
HPCCLBSHPCPLBSHPCMLBS
0
20
40
60
80
100
120
0 10 20 30
Co
mp
ress
ive
stre
ng
th (
MP
a)
Age (Days)
HPCCLSFHPCPLSFHPCMLSF
Specimens Strength at 28
days (MPa)
Mean value
(MPa)
Standard
deviation (MPa)
Coefficient of
variation (%)
HPCCLSF-1 63.69 62.80 0.92 1.46
HPCCLSF-2 61.86
HPCCLSF-3 62.86
HPCPLSF-1 67.76 67.52 0.54 0.80
HPCPLSF-2 66.9
HPCPLSF-3 67.9
HPCMLSF-1 62 61.54 0.54 0.87
HPCMLSF-2 60.95
HPCMLSF-3 61.67
HPCCLBS-1 60.95 60.8 0.30 0.50
HPCCLBS-2 60.45
HPCCLBS-3 61
HPCPLBS-1 62.2 62.1 0.10 0.16
HPCPLBS-2 62.1
HPCPLBS-3 62
HPCMLBS-1 60 60.15 0.26 0.43
HPCMLBS-2 60.45
HPCMLBS-3 60

J. Mater. Environ. Sci. 7 (7) (2016) 2617-2628 Biskri et al.
ISSN : 2028-2508
CODEN: JMESC
2625
It can be see that the compressive strength for all HPC mixes increases with the curing time due to the cement
hydration and accumulation of hydration products closing up some of available pore spaces in concrete matrix
resulting in improving the mechanical performance.
The rate of strength development in HPC depends on the pozzolanic and hydraulic activity of mineral
admixtures as well as the physical and mechanical properties of the aggregates.
The compressive strength varied from 62.80MPa, 67.52MPa and61.54MPa for HPC with crystalline limestone,
pure limestone and marly limestone aggregate respectively and silica fume, to 60.80MPa, 62.10MPa and
60.15MPa for HPC with the same aggregate and GGBFS. The increase in the compressive strength could be
attributed firstly, to the pozzolanic and hydraulic effect of mineral admixtures; the compressive strength of HPC
with silica fume is higher than that with GGBFS, due to the high fineness and high silica content of silica fume
compared to GGBFS, at normal temperature, the pozzolanic reaction of GGBFS is a slow process also the
difference in the hydration process of the two mineral admixtures. The hydration in the presence of silica fume
can be divided into two phases: the first one is characterized by a rapid hydration and dissolution accompanied
by a consumption of silica fume particles and an increase of mechanical strength. The second phase is
characterized by a small change of hydration but in the same time the system becomes denser as a result of the
hydration products rearrangement and the change of large pores into fine pores due to the pozzolanic reaction,
which has an important role in the strength increase.
In contrast, the vitrified blast furnace slag is rapidly soluble in alkaline water and therefore needs the addition of
an activating agent to develop satisfactory kinetic hydration (in this case is the cement).
The hydration is relatively a slow process occurring as repetition of dissolution-concentration–precipitation
cycles during years until a maximum hydration of slag grains is reached.
GGBFS particles are smoother than the ones of clinker, hydrates found some difficulties to develop on these
particles and consequently, the development of mechanical strength of cement-slag HPC is slow compared to
cement-silica fume HPC. These confirmed the results obtained by [23].
Secondly, to the strong adhesion between the textures of pure limestone and cement paste that lead to improve
the transition zone in concrete. Pure limestone has a higher density and low porosity, and also these aggregates
with very rough compact morphology as illustrated by the SEM-image in fig11B.As a result, the aggregate’s
liaison in the matrix is improved which can enhance the mechanical behavior. For HPC, the mechanical strength
of the cementitious matrix is greater than that of aggregates, thus the mechanical strength of HPC depends of the
resistance of the aggregates.
The study of MEKANI, Gaweska and Manso [10, 24, 25] confirmed that the mineralogy of pure limestone
aggregate is constituted mainly of carbonates which results in excellent mechanical behavior of aggregates with
low porosity. In addition, the calcite of CSH germination in epitaxial occurs more easily in contact with calcite
crystals of limestone aggregate. This phenomenon would result in a strong bond between the calcite and the
CSH at the interface and therefore a very resistant ITZ.
3.4. Flexural behavior
Three point bending tests were performed on the prismatic specimens. The mean values for HPC with silica
fume are slightly higher than the HPC with GGBFS (Table 7).
It can be see that the best strengths are obtained with HPC prepared with pure limestone aggregates and silica
fume. The type of mineral admixtures have a very slightly influence on the flexural behavior, also the quality of
the aggregate-cement matrix adhesion, which depends on the mineralogical, mechanical and morphological
properties of aggregates.
The behavior of the HPC specimens with GGBFS and SF mineral admixture was almost linear-elastic up to the
peak load, followed by a sudden decease in strength and a complete separation of specimens into two parts.

J. Mater. Environ. Sci. 7 (7) (2016) 2617-2628 Biskri et al.
ISSN : 2028-2508
CODEN: JMESC
2626
Table 7: Three point bending tests: peak loads.
Fig. 12 shows the average load–deflection curves for both SF and GGBFS mineral admixtures.
Figure 12: Load–deflection curves of HPCBS and HPCSF.
4. Microstructure by SEM
The microstructure analysis of HPC prepared with crystalline, pure and Marly limestone aggregates cured in tap
water for 28 days are shown in Fig. 13(A), (B), (C) respectively.
Fig 13A shows a good bond between the matrix and crystalline limestone aggregate with the presence of some
anhydrate slag particles, the CSH are well structured as foam. Fig.13B shows the microstructure of HPC with
pure limestone and silica fume. the interfacial transition zone (ITZ) between the particles of coarse aggregate
0
5
10
15
20
25
30
0 0.1 0.2 0.3 0.4 0.5
Lo
ad
(K
N)
Deflexion (mm)
HPCMLBSHPCPLBSHPCCLBS
0
5
10
15
20
25
30
0 0.1 0.2 0.3 0.4 0.5
Lo
ad
(K
N)
Deflexion (mm)
HPCPLFSHPCCLFSHPCMLFS
Specimens Peak loads
(kN)
Mean value
(kN)
Standard
deviation (kN)
Coefficient of
variation (%)
Modulus of rupture
(MPa)
HPCCLSF-1 21 19.5 1.29 6.58
4 .34
HPCCLSF-2 19
HPCCLSF-3 18.6
HPCPLSF-1 25.2 24.0
1.11
4.60
5.34
HPCPLSF-2 23
HPCPLSF-3 23.9
HPCMLSF-1 19 18.0
1.00
5.56 4.00
HPCMLSF-2 17
HPCMLSF-3 18
HPCCLBS-1 21 19.0 1.70 8.95 4.23
HPCCLBS-2 18.1
HPCCLBS-3 18
HPCPLBS-1 23.8 21.5 2.02 9.41 4.78
HPCPLBS-2 20.7
HPCPLBS-3 20
HPCMLBS-1 18.7 17.5 1.01 5.77 3.90
HPCMLBS-2 16.9
HPCMLBS-3 17

J. Mater. Environ. Sci. 7 (7) (2016) 2617-2628 Biskri et al.
ISSN : 2028-2508
CODEN: JMESC
2627
and the cement matrix, the aggregates, the compactness of the cementitious matrix which presents a minimum
of voids and aggregates matrix bonding can be seen.
Fig.13C shows the microstructure of HPC with Marly limestone and silica fume, it can be seen the interfacial
transition zone (ITZ) between the particles of coarse aggregate and the cement matrix, and the presence of some
porosity.
The microstructure of HPC shows a dense and compact microstructure, this later can be attributed to: the filler
effect and pozzolanic activity, a filling of ITZ and the microcracks formed on the HPC surface, the optimized
size distribution and finally a low E/B ratio.
Figure 12:SEM images of HPC with A) crystalline limestone, B) pure limestone and C) Marly limestone.
Conclusions
The study presented in this paper is a contribution to a better understanding on the effects of aggregate’s nature
and mineral admixtures on the HPC behavior. Marl, crystalline and pure limestone aggregates and silica fume or
GGBFS were investigated. The following conclusions are drawn based on the results of different tests and
analysis:
1. The physical properties of pure limestone aggregate(water absorption, loss- angels test) were superior to
those of crystalline and marl limestone aggregates. However, the bulk specific gravity of the pure limestone
aggregate was more than that of the latter aggregates.
Aggregate
Slag
CSH
A
Matrix
Aggregate Porosity
Aggregate
Aggregate
Aggregate
Matrix
B
J. Mater. Environ. Sci. 7 (7) (2016) 2617-2628 Biskri et al.
ISSN : 2028-2508
CODEN: JMESC
2628
2. The unit weight of HPC with pure limestone aggregate was more than that of crystalline and marl
limestone aggregate. The increase in unit weight due to apparent specific density of pure limestone (2690
kg/m3), reaching unit weight up to 2530 kg/m
3.
3. HPC with pure limestone aggregate show the best compaction characteristics and strength properties. This
is the results of the intrinsic aggregate’s properties. The pure limestone shows stronger bonds with the
cement paste. These later increase the adhesion forces of and consequently improve the quality of the
interfacial transition zone.
4. HPC with GGBFS mineral admixture have good mechanical properties similar than the one obtained with
the silica fume therefore can be recommended to use GGBFS as mineral admixture in the formulation of
HPC and it can be substituted the silica fume by blast furnace slag.
Acknowledgements - The authors express their thanks to Jonny Loic and Francis Goutefangeas, CMEBA Rennes1 University
(France) and LMDC, Toulouse, for their assistance with SEM and XRD.
References
1. Aïtcin P.C., London, New York: E. & F.N. Spon. (1998) 591.
2. Chen B., Liu J., Constr.Build.Mater. 22 (2008) 1108–13.
3. Vejmelkova E., Pavlikova M., Keršner Z., Rovnanikova P., Ondracˇek M., Sedlmajer M., et al., Constr.
Build.Mater. 23 (2009) 2237–45.
4. Chidiac S.E., Panesar D.K., Cem .Concr. Compos. 30 (2008) 63–71.
5. Bernal S., De Gutierrez R., Delvasto S., Rodriguez E., Constr. Build.Mater. 24 (2010) 208–14.
6. Achoura D.J., Matériaux. et. Techniques. 96(2009) 189–199.
7. Hassan K.E ., Cabrera J.G., Maliehe R.S.,Cem.Concr.Compos. 22 (2000) 267–71.
8. Ko¨ksal F., Altun F., Yiğitū I., Şahin Y.,Constr. Build .Mater. 22 (2008) 1874–80.
9. Kaikea A., Achoura D.j., Duplan F., Rizzuti L., Materials .and. Design. 63 (2014) 493–499.
10. Makani A., Vidal T., Pons G., Escadeillas G., International Conference on Experimental Mechanics,
Poitiers. 2010.
11. Alexander M.G., Journal of A.C.I. Materials, 9 (1996) 569-577.
12. Abdulrahman M., Alhozaimy., Cement. &.Concrete. Composites .31 (2009) 470–473.
13. NA 442. 2005. Ciment. (2005).
14. NF EN 13263-1. Fumée de silice pour béton. (2009).
15. EN 12 620. European Standards, Aggregates for Concrete. (2002).
16. Aïctin. P.C., Editions Eyrolles. (2001)683p.
17. NF EN 1097-2. Tests for Mechanical and Physical Properties of Aggregates. (2010).
18. NF EN 934-2. High range Water Reducing/Superplasticized Concrete Admixture. (2012).
19. Ali BoucettaT., Thèse de doctorat, Université d’Annaba, Algérie. (2014).
20. BS EN 12390-3. Testing hardened concrete. Compressive strength of test specimens. (2009).
21. BS EN 12390-5. Testing hardened concrete. Flexural strength of test specimens. (2009).
22. Matos A.M., sousa-coutinho J., Construction.And. Building Materials. 36 (2012) 205-215.
23. Abo-El-Enein S.A., Gamal El-kady T.M., El-Sokkary, Mahmoud Gharie, H.B.R.C. Journal. 11 (2015) 7–15.
24. Gaweska H., Thèse de doctorat, ENPC, Paris. (2004).
25. Maso J., London. New York: Spon. (1996).
(2016) ; http://www.jmaterenvironsci.com/